 Alessandro Rovetta
- 1Mensana srls, Research and Disclosure Division, Brescia, Italy
- 2Redeev srl, Technologic and Scientific Research, Naples, Italy
Italy has been one of the first nations in the world to be heavily affected by COVID-19. A wide range of containment measures has been adopted from February to December 2020 to mitigate the pandemic. In this regard, the present research sets out to evaluate two aspects: (i) the impact of lockdowns on the concentrations of particulate matter (PM) 10 and 2.5 in the Lombardy region, and (ii) how anti-COVID-19 restrictions influenced Italian citizens' consumption habits. To do this, the average daily concentrations of PM10 and PM2.5 during 2020 in all the provinces of Lombardy were compared with those of the previous years through Welch's t-test. The same procedure was adopted to estimate the change in Google relative search volumes of home delivery services and smart working on a national scale. Two mean values were considered statistically confident when t < 1.5, suspiciously non-confident when 1.5 ≤ t < 1.9, and non-confident when t ≥ 1.9. Seasonalities and trends were assessed both graphically and with Augmented Dickey-Fuller, Phillips-Perron, and Kwiatkowski-Phillips-Schmidt-Shin tests. Finally, Pearson and Spearman correlations between changes in citizens' behavior and specific key events related to COVID-19 have been dealt with. The P-value threshold was indicatively set at 0.05. Microsoft Excel 2020 and Google Sheets were used as data analysis software. This paper showed: (i) the limited or insufficient effectiveness of lockdowns in reducing PM10 and PM2.5 concentrations in Lombardy, and (ii) a significant change in the consumption habits of Italian citizens, thus leading to both positive and negative results in terms of sustainability. Therefore, it is high time that both Italian and international environmental protection authorities thoroughly investigated the role of non-mobility-related sources of particulate emissions to impose effective rules on home delivery services. Moreover, further research is required for the understanding of anthropogenic, environmental, and atmospheric phenomena that influence the concentrations of PM10 and PM2.5.
Introduction
Background
In late December 2019, a novel coronavirus began to circulate in the Chinese city of Wuhan, causing numerous deaths and raising the alert of local and international health authorities (Wang et al., 2020a; Zhu et al., 2020). This new virus was cataloged by the World Health Organization with the names of 2019-nCoV (2019 novel Coronavirus) and SARS-CoV-2 (Severe Acute Respiratory Syndrome Coronavirus 2), and its related disease—transmitted from human-to-human—was called COVID-19 (Coronavirus Disease 2019) (Li et al., 2020). During the whole of 2020, COVID-19 has raged around the world, radically changing habits and feelings of global citizens of all ages and status, thus causing deep economic and health crises in all the pandemic-stricken countries [Figueroa and Aguilera, 2020; Francisco et al., 2020; World Health Organization (WHO), 2020]. Among these, Italy is one of the most affected: to date (December 5, 2020), it is the sixth nation for the number of deaths from COVID-19, with 1.7 million official cases and 59,000 official deceased (Worldometer, 2020). To deal with the spread of the infection, Prime Minister Giuseppe Conte, in agreement with the Ministry of Health and the Department of Civil Protection, has ordered several containment measures: on February 25, in the municipality of Codogno in Lombardy, more than 50,000 people were quarantined (Lowen, 2020). The quarantine area continued to expand until, on March 8, the whole Lombardy and 14 other Northern Italy provinces underwent a total lockdown (BBC News, 2020). The national lockdown was announced 2 days later and lasted until May 18 [Ministero della Salute (Italian Ministry of Health), 2020]. Finally, the second wave of COVID-19 made the Italian Government opt for another national lockdown on November 4, 2020 [Gazzetta Ufficiale della Repubblica Italiana (Italian Republic), 2020].
Lockdown Effects on Air Quality
Despite the numerous drawbacks caused by the limitations imposed on the Italian population (Rossi et al., 2020), lots of media, websites, and environmental protection agencies highlighted a large number of beneficial effects of the lockdown status on air quality, thus leading a vast international scientific literature to address the indirect effects of COVID-19 on pollution (Bourzac, 2020; FASDA Fund, 2020). However, scholars have come to radically different conclusions on such an issue. Indeed, some authors claimed that lockdowns had a positive impact on the environment, while others argued the contrary. For example, Gautam spotted a noticeable reduction in the emissions of particulate matter and other pollutants, such as NO2, NH3, SO2, CO, and O3, proposing strategic semi-lockdown periods for air quality management in India (Gautam et al., 2020). On the other hand, Wang et al. found that large emissions reduction in transportation and a slight reduction in industrial production would not help avoid severe air pollution in China (Wang et al., 2020b). Furthermore, results were dependent on the type of pollutant examined. Compared to 2019, 50 of the 61 analyzed world cities have shown nitrogen dioxide reductions between 20 and 50% throughout 2020, with Milan recording the largest decrease (60%) (NASA, 2020). Nevertheless, as will be shown in this study, this event was not followed by an equal drop in particulate matter concentrations. Such discrepancies suggest that any pollution-control program must also consider local atmospheric, environmental, and anthropogenic factors. Hence, this atypical situation raises an important research question, namely: are lockdowns a sustainable and effective strategy to improve air quality and fight air pollution? (Gautam and Hens, 2020) The objective of this paper is to find an answer for the Italian case, quantifying the variation in the concentration of particulate matter (PM) in the Lombardy region due to lockdown. Lombardy was considered for analyzing the changes in PM10 and PM2.5 as it was the most affected region by both COVID-19 and particulate matter. This choice is further motivated by the deep epidemiological link between pollution and SARS-CoV-2 spread and mortality (Gupta et al., 2020; Rovetta and Castaldo, 2020a; Wu et al., 2020; Zoran et al., 2020).
Lockdown Effects on Environmental Sustainability
In addition to air pollution monitoring, a fundamental aspect of environmental sustainability is plastic management. Specifically, despite constituting one of the global ecological challenges today (Lebreton and Andrady, 2019), plastic is still widely used by companies for product packaging (Kedzierski et al., 2020). The situation became even more severe thanks to the advent of home delivery and takeaway services (Ncube et al., 2020). In this context, Patrício Silva et al. found that the COVID-19 pandemic is contributing to worldwide plastic pollution and precautionary measures challenged environmental sustainability (Patrício Silva et al., 2021). Therefore, the second aim of this research is to evaluate the sustainability of the behaviors adopted by Italian citizens in response to restrictions on personal freedom, containment measures, and lockdowns imposed by the government. In particular, this paper quantifies the increase in the national demand for home food delivery services, food shopping delivery services, general shopping delivery services, smart working, and distant learning. Since a previous study showed that the threat of contagion was perceived similarly in all regions (Rovetta and Castaldo, 2020b), the whole Italian nation has been considered for the analysis.
Methods
Data Collection
Google Trends1 has been used to explore Italian citizens' web interest in home food delivery services, food shopping services, shopping services, and smart working software and online learning platforms, during and after the first COVID-19 restrictions and containment measures. Google Trends is a web tool which provides normalized values, called “relative search volumes (RSV),” ranging from 0 (very low relative interest) to 100 (very high relative interest). All the search parameters and queries are shown in Table 1. The terms were collected following emerging searches suggested by Google Trends. Data on PM10 and 2.5 daily averages were collected from all the measuring stations of every province of Lombardy. To do that, the Regional Agency for Environmental Protection [Regional Agency for Environmental Protection (ARPA), 2020a] official website2 was used. Data on COVID-19 cases and deaths were collected from the Department of Civil Protection official website3. Meteorological data were collected from the website “Il Meteo.it”4.
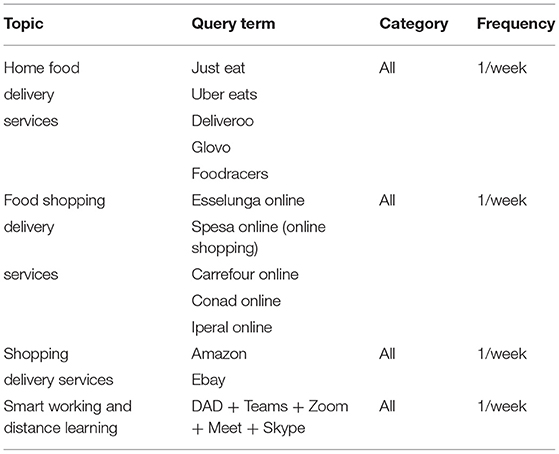
Table 1. Google Trends queries and search parameters.
Statistical Analysis
This paper quantifies the impact of COVID-19 restrictions and containment measures on the web queries RSVs and average concentrations of PM10 and 2.5 through the percentage increases Δ% = (x1 − x0)/x0 · 100 and their related t-test t = (x1 − x0)/σ. Two mean values were considered confident only when t < 1.5 and not confident only when t ≥ 1.9; in the intermediate 1.5 ≤ t < 1.9 range, non-confidence was interpreted as suspicious. All statistical errors σ were calculated with the standard propagation formula (Taylor, 1997). Each mean value x̄ was reported together with its own standard error of the mean (SEM) according to the following modality: x̄ ± SEM (Taylor, 1997). Data normality was verified both with the z-tests k/σk < 2 and s/σs < 2 for kurtosis k and skewness s and graphically (Tabachnick and Fidell, 1996). For doubtful cases (2 < z < 1.5), the Shapiro-Wilk test with α = 0.05 was used. When the number of measures n was >30, the central limit theorem has been exploited to validate the t-test when dealing with not normally distributed data (Kwak and Kim, 2017). The stationarity of data series was verified in four different ways: (i) graphically, (ii) through the Augmented Dickey-Fuller (ADF) test (Mushtaq, 2011), (iii) through the Phillips–Perron (PP) test (Philips and Perron, 1988), and (iv) through the Kwiatkowski-Phillips-Schmidt-Schin (KPSS) test (Kipiński et al., 2011). In all these cases, α = 0.05 was chosen. Real Statistics Resource Pack and XLSTAT have been implemented in Microsoft Excel 2020 to perform the above analysis (Zaiontz, 2016; XLSTAT, 2021)5,6
Software
Real Statistics Resource Pack
This Excel add-on pack allows the user to perform the ADF test in an automated way. To estimate the optimal lag length, three different criteria were used: Akaike information criterion (AIC), Bayesian Information Criteria (BIC), and Schwert criterion (Fukuda, 2007; Rutkowska and Ptak, 2017). The truncation lag parameter was always chosen following the standard Schwert rule. After a first graphical evaluation, the “drift” and “trend” options were tested.
XLSTAT
This Excel add-on pack allows the user to perform ADF, PP, and KPSS tests in an automated way. The method used was the surface regression (MacKinnon, 1996). The ADF k-parameter was calculated automatically. The PP Lag parameter has been set to “long.” The KPSS Newey-West method has been set to “long” (Newey and West, 1987).
Stationarity Analysis Procedure
Each dataset tested for stationarity was previously tested for the presence of outliers using the Grubbs method (Grubbs, 1950). Since all the analyzed datasets showed pronounced positive asymmetries, this test underestimated the presence of outliers; furthermore, the z-score threshold was set at 2.5. In doing so, only extreme cases were signaled. In order not to significantly affect the datasets, each outlier i ∈ N has been replaced with the average between the value i−h and the value i+h, with h ∈ N specifically chosen to reach the first non-outlier. Secondly, the concordance between the ADF (AIC + BIC + Schwert + XLSTAT), PP, and KPSS tests was evaluated. When all tests gave concordant results, only the P-value which resulted furthest from the threshold was reported (wP i.e., “worst P”). Since these tests require numerous assumptions that are not always easy to respect, in addition to a graphic control, the Mann-Kendall slope (KMs) was used to highlight eventual trends (Hirsch and Slack, 1984): in particular, this was applied to the moving average (the q parameter has been reported in the results).
Assumptions on Particulate Matter
Weather conditions are an extremely incisive factor in detecting particulate matter; however, at present, finding a model capable of fully explaining the impact of weather on PM is quite challenging. Indeed, Avdakovic's study of correlations showed peaks of PM10 concentrations in precise ranges of temperatures, relative humidity, air pressure, and wind speed, but it did not provide an analysis of such causal relations (Avdakovic et al., 2016). Furthermore, temperature and pressure in specific time-lapses in Sarajevo seem to have conditioned the presence of PM10 in the air, especially if compared to data on wind speed and relative humidity. Liu et al. showed how precipitation in Qinhuangdao had greater scavenging effects on PM10 than PM2.5, taking into account the duration, intensity, and concentrations of particulates (Liu et al., 2020). Moreover, wind direction and speed also played a decisive and non-obvious role in the detection of PM10 and PM2.5. Finally, according to other recent sources, further differences seem to be intrinsically linked to the local characteristics of the considered area (Tecer et al., 2008; Olszowski, 2016; Cameletti, 2020; Zhou et al., 2020). Therefore, as this research is not aimed to model the relationship between particulate matter concentrations and climatic conditions, this paper will mainly analyze the sustainability of the lockdown in order to understand whether this measure is a sufficient strategy to reach acceptable levels of air pollution or other more incisive factors should be considered. Nevertheless, in the Results section, the comparison between the climatic factors of the various periods has been analyzed and reported for two reasons: (i) highlighting any extreme regimes that can alter the analysis too drastically, and (ii) allowing future interpretations of the data based on weather conditions.
PM10 and PM2.5
Times beyond the threshold (TBT) have been defined as the sum of all occasions in which, considering all measuring stations, the concentrations of PM10 and PM2.5 exceeded both the legal and environmental limits, i.e., 50 μg/m3 (max 35 days) and 25 μg/m3, respectively [World Health Organization, 2005; Regional Agency for Environmental Protection (ARPA), 2020b]7,8 Similarly, days beyond the threshold (DBT) have been defined as those days in which the concentrations of PM10 and PM2.5 exceeded the above-reported limits. In the second case, in order to exclude the stations where the pollution was historically less pronounced, only the worst stations of each province were included [Regional Agency for Environmental Protection (ARPA), 2019]9 Average PM10 and PM2.5 concentrations, TBT, and DBT during 2020, 2019, and 2018 were examined, searching for significant discrepancies and focusing on the first lockdown (period 1: from March 9 to May 18, 2020) through t-test. This type of crude comparison between close periods—none of them being longer than 1 year—has similarly been used in previous literature to measure the reduction in pollution emissions due to lockdowns (Regional Agency for Environmental Protection (ARPA), 2019; Kumar et al., 2020; Le Quéré et al., 2020; NASA, 2020). In particular, this can be useful to understand if total or partial lockdowns can be resolutive or the weather factor is preponderant. Meteorological data—such as minimum, maximum, and average temperatures, % relative humidity, and maximum wind speed—were analyzed according to the same criteria and considering the same timespans. Furthermore, t-tests between the average concentrations of PM10, average concentrations of PM2.5, and average TBT, during the first lockdown and the same period in the timespan 2016–2019 (considered as a unique dataset) were calculated. The stationarity of the above-listed series was assessed by the ADF, PP, KPSS, and MK tests as described in previous sections. Finally, the number of inhabitants and surface area of each province were also reported in the Results section, so as to exemplify the coverage of territory of the measuring stations and the demographic importance of all provinces. These data were taken from the official websites of the National Institute of Statistics (ISTAT)10 and AdminStat11.
Google Trends
We compared the weekly web query trends of 2020 with those of 2019, 2018 and the time-lapse 2016–2019, searching for significant discrepancies and focusing on pre-lockdown and the first lockdown period (from 20 February to 18 May 2020). The stationarity of the data series was assessed by the ADF, PP, KPSS, and MK tests as described in previous sections. When data series were not long-term stationary, the relative web interest difference between the periods January 1–February 19 and February 20–May 18 was evaluated from year to year. In doing so, it was possible to highlight any anomalies of the RSVs through the historical comparison. Two mean values were considered confident only when t < 1.5 and not confident only when t ≥ 1.9. In the intermediate 1.5 ≤ t < 1.9 range, non-confidence was interpreted as suspicious. Pearson and Spearman correlations were searched between RSVs and COVID-19 total cases and deaths. The possible causal nature of these relationships was tested by researching the same correlations between the 2019 RSVs and the COVID-19 total cases and deaths during 2020. In order to highlight any hidden correlations, Pearson and Spearman coefficients were used together (Rovetta, 2020). The chosen P-value significance threshold was α = 0.05; however, all correlations with .05 < P < 0.1 were classified as suspicious (Amrhein et al., 2017).
Results
Effect of COVID-19 Restrictions on Particulate Matter Concentrations
Preliminary Evaluations and Results
Weather conditions. Substantial weather changes were identified in Lombardy between 2018, 2019, and 2020. In particular, significant or suspected decreases in the maximum wind speed occurred in 100% of cases during period 1 (Δav% = −18.0 ± 3.3). Whereas, in certain cases winds can lead to an increase in PM10 due to the transport of desert material or other debris, generally their decrease implies an increase in the concentrations of this particulate. On the contrary, between 2018 and 2020 there was a drastic and generalized decrease in relative humidity (8/9, av% = −18.2±4.2), a factor mainly associated with a decrease in particulate concentrations (Supplementary Table 1). Therefore, the results on the concentrations of particulate matter must be interpreted in the light of the above.
Lombardy Region Summary
PM10 and PM2.5 summary. Comparison 9 March−18 May 2019 and 2020. Significant or suspected increases: 58.5% (62/106). Significant or suspected reductions: 1.9% (2/106). No significant or suspected effects: 39.6% (42/106). PM10 worst stations. Significant or suspected increases: 41.7% (5/12). Significant or suspected reductions: 8.3% (1/12). No significant or suspected effects: 50% (6/12). PM2.5 worst stations. Significant or suspected increases: 33.3% (4/12). No significant or suspected effects: 66.7% (8/12). Comparison between the period 9 March−18 May 2018 and 2020. Significant or suspected increases: 6.6% (7/106). Significant or suspected reductions: 16.0% (17/106). No significant or suspected effects: 77.4% (82/106). PM10 and PM2.5 worst stations. Significant or suspected reductions: 8.3% (1/12). No significant or suspected effects: 91.7% (11/12). A summary for the individual provinces is reported in Tables 2–4. The details of the analysis are provided in Supplementary File 1.
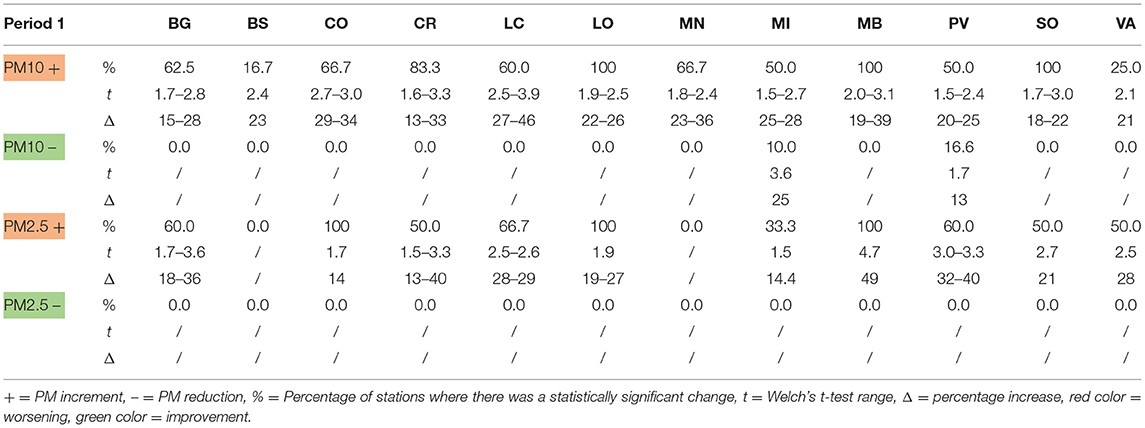
Table 2. Comparison between the average concentrations of PM10 and PM2.5 in period 1 (9 March−18 May 2019 and 2020).
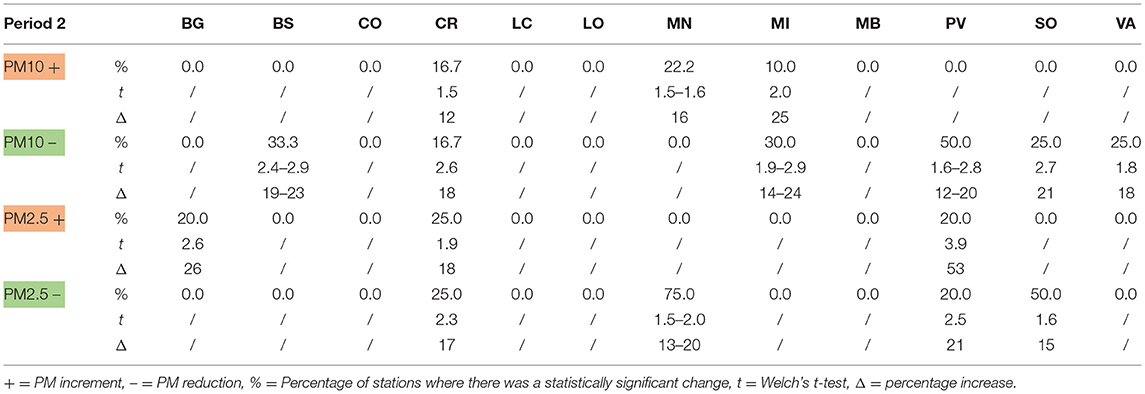
Table 3. Comparison between the average concentrations of PM10 and PM2.5 in period 2 (9 March−18 May 2018 and 2020).
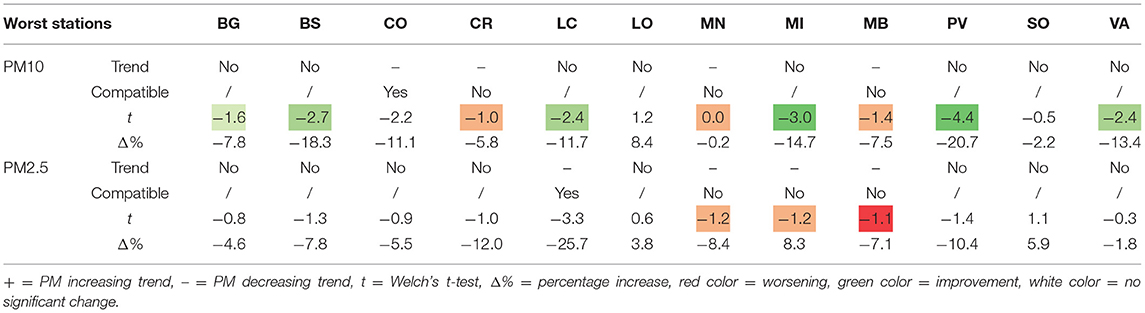
Table 4. Comparison between the average concentrations of PM10 and PM2.5 in the periods 9 March–18 May 2016–2019 and 2020.
Worst stations. Comparison 9 March−18 May 2016–2019, 2020. PM10. Significant or suspected increases: 25.0% (3/12). Significant or suspected reductions: 50% (6/12). No significant or suspected changes: 25.0% (3/12). PM2.5. Significant or suspected increases: 25.0% (3/12). Significant or suspected decreases: 0.0% (0/12). No significant or suspected changes: 75.0% (9/12).
TBT summary. Comparison 9 March−18 May 2019 and 2020. PM10. Increases: 100% (12/12). Total TBT: 103, 230 (Δ% = +123.3). PM2.5. Increases: 91.7% (11/12). No difference: 8.3% (1/12). Total TBT: 267, 375 (Δ% = +40.4). Comparison 9 March−18 May 2018 and 2020, PM10. Increases: 83.3% (10/12). No difference: 8.3% (1/12). Reductions: 8.3% (1/12). Total TBT: 149, 230 (Δ% = +54.4). PM2.5. Increases: 41.7% (5/12). No difference: 8.3% (1/12). Reductions: 50% (6/12). Total TBT: 365, 375 (Δ% = + 2.7).
DBT summary. Comparison 9 March−18 May 2019 and 2020. PM10. Increases: 66.7% (8/12). No difference: 25.0% (3/12). Decreases: 8.3% (1/12). Total DBT: 38, 54 (Δ% = +42.1). PM2.5. Increases: 58.3% (7/12). No differences: 25.0% (3/12). Reductions: 16.7% (2/12). Total DBT: 114, 151 (Δ% = +32.5). Comparison 9 March−18 May 2018 and 2020. PM10. Increases: 25.0% (3/12). No difference: 16.7% (2/12). Reductions: 58.3% (7/12). Total DBT: 59, 54 (Δ% = −8.5). PM2.5. Increases: 33.3% (4/12). Reductions: 66.6% (8/12). Total DBT: 166, 151 (Δ% = −9.0).
Consumer Behavior
Home Food Delivery Services
- Just Eat (20 February−18 May) comparison 2018–2019, 2020. Markedly stationary (6/6, ∀P < 0.001, Δ% = 30.6, t = 4.8). Comparison 2016–2019, 2020: 3 major level shifts (overall not stationary). Trends signs year per year (−,−,−,−,+). Most compromising inner trend (1 January−18 May, 2018): Δ% = −9.6, t = −1.5. Most significant inner trend (1 January−18 May, 2020). Δ% = +14.9, t = 2.6 (significant).
- Deliveroo (20 February−18 May) comparison 2018–2019, 2020. Non-stationary (0/6, ∀P > 0.10). Comparison 2016–2019, 2020: 5 major level shifts (overall not stationary). Trends signs year per year: (+,+,−,−,+). Most compromising inner trend (1 January−18 May, 2016): Δ% = +5.0, t = 2.4. Most significant inner trend (1 January−18 May, 2020): Δ% = +65.9, t = 6.4 (highly significant).
- Glovo (20 February−18 May) comparison 2018–2019, 2020. Non-stationary (0/6, ∀P > 0.10. Comparison 2016–2019, 2020: 4 major level shifts (overall not stationary). Trends signs year per year: (+,+,+,−,+). Most compromising inner trend (1 January−18 May, 2018): Δ% = +36.3, t = 2.1. Most significant inner trend (1 January−18 May, 2020): Δ% = +56.6, t = 4.9 (significant).
- Uber Eat (20 February−18 May) comparison 2018–2019, 2020. Non-stationary (0/6, ADF bP = 0.44). Comparison 2016–2019, 2020: 3 major level shifts (overall not stationary). Trend signs year per year: (+,+,+,+,+). Most compromising inner trend (1 January−18 May, 2019): Δ% = +40.6, t = 1.7. Most significant inner trend (1 January−18 May, 2020). Δ% = +60.5, t = 2.6 (compatible with a growing trend).
- Foodracers (20 February−18 May) comparison 2018–2019, 2020. Stationary (6/6, ADF wP = 0.044), Δ% = 208.0, t = 9.1. Comparison 2016–2019, 2020: 3 major level shifts (overall not stationary). Trend signs year per year: (+,+,−,−,+). Most compromising inner trend (1 January–18 May, 2016): Δ% = +116.7, t = 1.7. Most significant inner trend (1 January–18 May, 2020). Δ% = +237.5, t = 4.3 (significant).
All the trends are shown in Figure 1. Significant correlations were observed between RSVs and COVID-19 total cases and total deaths (r1 = 0.78, P < 0.001; r2 = 0.72, P < 0.001); nevertheless, such correlations were also identified between the same web queries during 2019 and COVID-19 total cases and deaths.
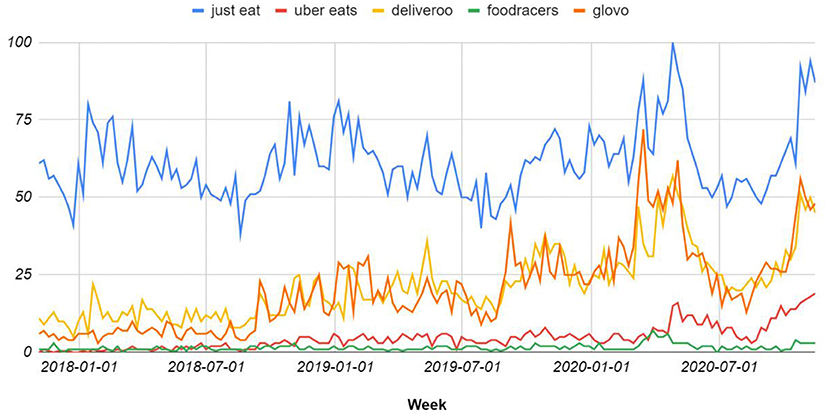
Figure 1. Italian citizens' web interest in home food delivery services from November 2017 to November 2020.
Online Food Shopping Services and Online Supermarkets
Compared to the same trend during 2018 and 2019, the web interest of Italian citizens in food shopping services and online supermarkets underwent a dramatic increase during the first lockdown (Figure 2). This is so evident that any test for stationarity and seasonality of the periods prior to 2020 has been considered superfluous.
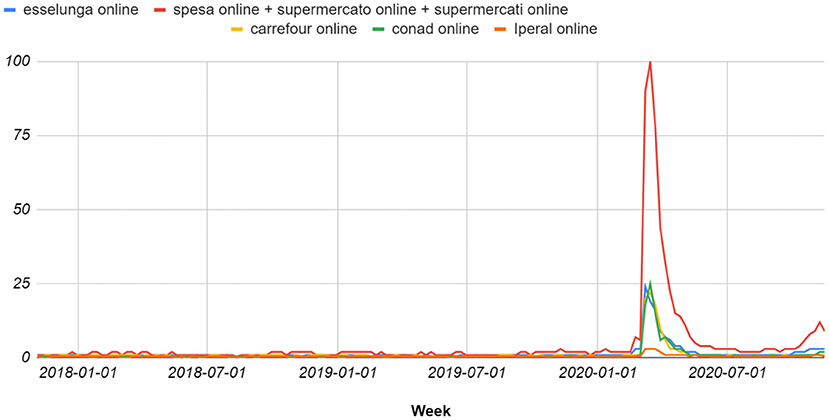
Figure 2. Italian citizens' web interest in supermarket delivery services from November 2017 to November 2020.
- Esselunga online, comparison (20 February−18 May) 2018–2019, 2020. Δ1% = +861.9 ± 293.8, t1 = 3.4.
- spesa online + supermercato online + supermercati online (online food shopping), comparison (20 February−18 May) 2018–2019, 2020. Δ2% = +2593.8 ± 725.9, t2 = 3.4.
- Carrefour online, comparison (20 February−18 May) 2018–2019, 2020. Δ3% = +1100.0 ± 324.6, t3 = 2.9.
- Conad online, comparison (20 February−18 May) 2018–2019, 2020. Δ4% = +1358.3 ± 450.4, t4 = 2.9.
- Iperal online, Δ5% = +184.6 ± 65.4, t5 = 3.4.
The interest in these queries remained relatively high during the rest of 2020 compared to those of the previous years, going up again with the arrival of the second period of restrictions (Figure 2). Significant hidden correlations were observed between RSVs and COVID-19 total cases and deaths (R1 = 0.49, P < 0.035; R2 = 0.46, P = 0.049); nevertheless, such correlations were also identified between the same web queries during 2019 and COVID-19 total cases and deaths.
Online Shopping
The web interest of Italian citizens in home delivery services showed seasonality during 2018 and 2019 (Figure 3).
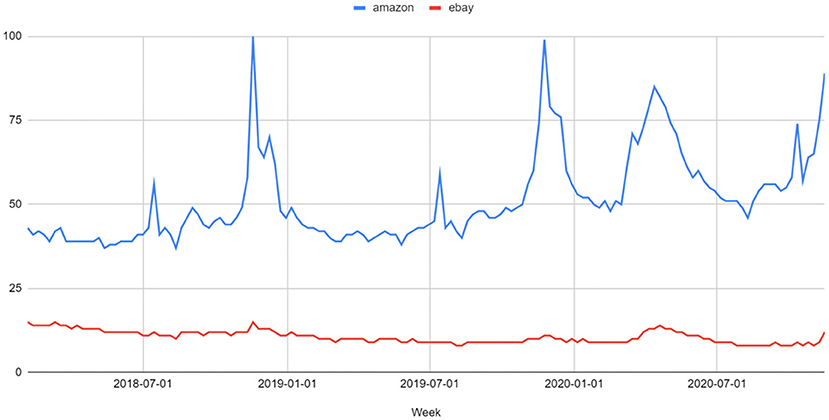
Figure 3. Italian citizens' web interest in shopping delivery services from November 2017 to November 2020.
Amazon, comparison (20 February−18 May) 2018–2019, 2020. Markedly stationary (6/6, ∀P < 0.001), Δ% = 67.7, t = 8.6). Comparison 2016–2019, 2020: 1 major level shifts (overall not stationary). Trends signs year per year: (−,−,−,−,+). Most compromising inner trend (1 January−18 May, 2018): Δ% = −6.3, t = −2.2. Most significant inner trend (1 January−18 May, 2020). Δ% = +37.2, t = 6.3 (highly significant).
eBay, comparison (20 February−18 May) 2018–2019, 2020. Non-stationary (0/6, ∀P > 0.10), marked stationary decreasing trend (MKs = −0.046, P < 0.0001). Comparison 2016–2019, 2020: Non-stationary (0/6, ∀P> 0.10), marked decreasing trend (MKs = −0.43, P < 0.0001). Inner trend inversion (1 January−18 May, 2020). Δ% = +25.0, t = 4.3 (highly significant).
Only low and non-significant correlations were identified between such queries and COVID-19 total cases and deaths (R, r < 0.3, P > 0.23).
Smart Working and Distance Learning
The web interest of Italian citizens in smart working and distance learning platforms such as Google Classroom, Teams, Zoom, Google Meet and Skype, underwent a drastic surge during and after the first lockdown (Δ% = + 1190.8 ± 133.3, t = 8.8 during period 1). Such an increase is so evident that any test for stationarity and seasonality of the periods prior to 2020 has been considered superfluous. Among all regions, Calabria is the one that has shown the highest interest in these technologies with an RSV = 100. The other regions had an RSV in the interval [35, 50], i.e., they showed a more similar interest (SD 4.3).
Discussion
Principal Findings: Particulate Matter
This study shows how the average concentrations of PM10 and PM2.5 during the first lockdown have significantly increased compared to 2019, despite the massive blockage in the circulation of motor vehicles. In particular, a greater quantity of fine dust was detected in 59% of the measuring stations against 40% of not-relevant fluctuations. Among the most affected provinces there is Lodi, from which the COVID-19 infection arose. Although this scenario is partially compatible with the widespread decrease in winds in the region (Supplementary Table 1), these results prove that other factors not related to vehicles heavily affect air quality in Lombardy. The comparison between 2018 and 2020 data further strengthens this evidence: regardless of a marked reduction in relative humidity, the particulate matter concentrations remained similar in over 77% of measuring stations. The analysis of the worst stations from 2018 to 2020 revealed that the human contribution in the most polluted areas is even more limited, as the variations in the concentrations of particulate matter in this subsample were lower than those of the whole sample. As for TBT and DBT, the first lockdown did not show positive effects on PM compared to the same period during 2019 but seems to have caused some changes if compared to 2018 (the detail by province is reported in Supplementary File 1). However, even in this last case, traffic restrictions did not sufficiently improve air quality. Finally, data analysis of the historically most polluted areas of each province from 2016 to 2020 highlighted the presence of numerous decreasing trends interrupted precisely during 2020 spring. This phenomenon mainly concerned PM2.5, for which countertrends or stationary situations were observed in all stations. Conversely, the large number of significant reductions in PM10 concentrations suggests that: (i) within the PM10 time series, there were level shifts not detected by ADF, PP, and KPSS tests, and (ii) traffic influences PM10 concentrations the most.
Principal Findings: Consumer Behavior
This survey highlights that the lockdown significantly increased web interest in principal home food delivery services in Italy. In particular, anomalous positive level shifts occurred in all the time series from February 20 to May 18, 2020. After that, the RSV had a marked negative trend during the summer and then grown back while approaching the second lockdown. The situation regarding online food shopping services instead presented some differences: first, comparing the queries with the major RSVs, the increase in web interest during the first lockdown was 174 times greater in online food shopping than in home food delivery; second, all queries assumed a more rapid negative trend with the arrival of summer, and the RSV grew moderately during the autumn but without reaching the peaks of the previous spring. Nonetheless, the impact of COVID-19 was more significant for food shopping than for food delivery services: specifically, food delivery-related queries were numerous even in the 4 past years, while the RSV of food shopping-related queries was less than one before the first lockdown (i.e., almost negligible) and greater than four after the first lockdown. Thus, this suggests that: (i) the pandemic has pushed users to benefit from services never adopted in the past, and (ii) a fraction of them considered its use advantageous regardless of quarantine. The trend of the queries “Amazon” and “eBay” was compatible with that of food delivery services. However, the actual effect of increased demand in these services must be weighed on the absolute number of queries rather than the relative change: indeed, the peak of the “Amazon” RSV exceeds 8 and 80 times that relating to online-supermarket and home food delivery services, respectively. Besides, the “Amazon” query was among the most searched for in 2020, reaching values compatible with those of the “coronavirus + covid” query. Therefore, the most significant impact on the web market was recorded by Amazon. These findings confirm that Google Trends is an effective infoveillance tool for this type of scientific survey since the growing web interest in delivery services has been met by a real increase in the orders placed by Italian users (Agenzia Giornalistica Italiana, 2020). Finally, the forced use of smart working platforms has led to an increase in web interest toward these technologies that persisted beyond the lockdown.
Comparison With Previous Literature
Several studies have been conducted on the impact of the lockdown on Lombardy's air quality (Cameletti, 2020; Collivignarelli et al., 2020; Piccoli et al., 2020; Putaud et al., 2020). However, not all results are fully concordant: in fact, while Putaud et al. claim that they have not observed any significant changes in PM10 concentrations in Milan, Collivignarelli et al. argue that the lockdown had a positive effect on them, as well as on PM2.5 and other air pollutants. In this context, Cameletti highlights how a reduction in particulate matter emissions does not necessarily imply a reduction in its concentrations, thus putting forward how complex is the analysis of these types of phenomena. This notion could help explain the discrepancy found between previous authors and between the various reports from environmental protection agencies and universities. Another point to be taken into account is that these differences could also be explained by the different approaches adopted in the aforementioned studies, since some have used predictive models inherent exclusively to 2020 while others have compared the concentrations of pollution in the current year with those of previous years. This paper falls into the second category, as it investigates the differences in average concentrations of PM10 and PM2.5 between specific periods during 2016–2019, 2018, 2019, and 2020. Piccoli et al. showed that, as Milan registered similar temperatures during February and March in both 2019 and 2020, such data are suitable for a comparative analysis. This supports the assumption of the absence of unusual weather regimes. However, an evident reduction in wind speed- which certainly contributed to the increase in concentrations of particulate matter across the Lombardy region—was highlighted in this paper. Moreover, non-uniform and significant variations in temperature and relative humidity may have further biased the estimate of particulate matter emissions in an unpredictable manner. Actually, in this case, the climatic comparison between 2018 and 2020 showed a strong reduction in relative humidity but no decrease in fine particles was found, contrary to the claim of a direct correlation between humidity and particles levels. Consequently, the most important finding of this paper is that even a total lockdown strategy would be insufficient to reduce the concentrations of PM10 and especially PM2.5 in a sustainable way. Similar results were found by Donzelli et al. in Tuscany (Donzelli et al., 2020). This again calls into question the role of motor vehicles in the production of this type of air pollution. Abu-Allaban et al. showed that the fractional contributions of motor vehicles to ambient PM in urban areas in the USA were in the ranges 20–76 and 35–92% for PM2.5 and PM10, respectively (Abu-Allaban et al., 2007). The Italian National Research Council (CNR) measured a reduction in road traffic of 48–60% in Italian cities which was not followed by an equal reduction in particulates, thus confirming the great variance of the above ranges (Consiglio Nazionale delle Ricerche, 2020). Therefore, this research suggests that industries, private routinary activities, and environmental factors, could play a key role in the reduction of air pollution in Lombardy. Indeed, although other papers assign a non-marginal role for motor vehicles in the production of particulate matter (Kheirbek et al., 2016; Ryou et al., 2018), a recent study by Chang et al. identified other preponderant human factors, such as “wood heaters,” “industry,” “power stations,” and “non-road diesel and marine,” corresponding to 81% of PM2.5 human-deriving emissions in the New South Wales Greater Metropolitan Region. Furthermore, the natural and human-made sources were found to contribute to the population-weighted annual average PM2.5 emissions 60 and 40%, respectively (Chang et al., 2019). Alongside this, the demand for online delivery and shopping services has dramatically increased both during and after the lockdown waves. All these e-commerce services- including Amazon- can have a very negative environmental impact, especially when providing fast delivery times: indeed, not only the emissions of the transport vehicles but also the plastic packaging widely used by the companies do contribute to environmental pollution (Supply Chain Solutions Center, 2019; CNN Business, 2020). In this regard, Amazon claims to be planning a sustainable delivery strategy (Amazon, 2020): considering the current condition, it is high time the company was faithful to its words. Furthermore, it would be advisable that states and organizations all over the world impose more stringent and effective criteria for monitoring the individuals' environmental impact, as far as their administrative policies are concerned. Finally, smart working and distance learning could really be valid alternatives in terms of environmental impact as they do not involve traveling or excessive use of materials such as textbooks, notepads, notebooks, chalks, markers, etc. Conversely, this leads to an increase in household consumption of electricity and heat, especially during the winter. Nonetheless, it should be taken into account that such consumptions are inevitable even when people work in their own work structures/offices and private houses in Italy do not often have the same energy class systems (Salvalai et al., 2015; Malinauskaite et al., 2019). Moreover, there are many challenges to be faced before taking this path (The Planet Mark Eden Project, 2016; Hodder, 2020; Sarti et al., 2020) and the effectiveness of online lessons is still a hotly-debated topic among parents, teachers and psychologists (Abbasi et al., 2020; Abuhammad, 2020; Daniel, 2020; Mukhtar et al., 2020). What is certain is that the population has had to forcibly learn to use some of the most modern technologies and techniques of file sharing, databases, and online communication software and tools; thus, in the future, allowing extensive smart working sessions and online learning solutions in everyday life will be easier and less impacting at an emotional-psychological level, once the right compromise between the psychosocial health safeguard and environmental protection will be reached. Finally, the correlations found between COVID-19 cases and deaths, and web searches related to home delivery services in 2019 and 2020, could suggest how the virus has spread easier in regions with more frequent trade relations.
Strengths
As far as the author knows, this is the first study that compares PM10 and PM2.5 concentrations in the periods 2016–2019, 2018, 2019, and 2020 in Lombardy including data from all the measuring stations of all its provinces, also quantifying their meteorological differences. The direct comparison of average quantities between specific periods that has been used in this paper—supported by appropriate tests for the detection of trends, seasonalities, and outliers- offers a fast and statistically effective method to highlight anomalies and countertrends both in the historical comparison of series and the analysis of real-time surveillance. Furthermore, this study demonstrates a substantial reliability of Google Trends in estimating the demand for e-commerce and home delivery services of Italian web users, as well as a very limited capacity of lockdowns in the reduction of PM10 and PM2.5 concentrations in the most populated Italian region.
Limitations
Some limitations must be considered: (i) the search for statistical correlations cannot provide details on any possible causal nature of the investigated phenomena; (ii) the web interest of Google users does not necessarily provide a true-to-life representation of the general interests of all Italian citizens; (iii) in some provinces, the number of measuring stations could be insufficient to represent in detail the overall trend of PM10 and PM2.5 concentrations; (iv) there is the absence of substantial differences in climatic factors (e.g., winds and relative humidity) among the assumptions of this research methodology. In conclusion, although a preliminary semi-quantitative assessment was carried out, the severity of these biases is not fully quantifiable.
Conclusions
This study shows that even a forced total lockdown strategy, capable of reducing road traffic in Italian cities by 48–60%, was insufficient to reduce the concentrations of PM10 and especially PM2.5 in the Lombardy region. Environmental factors, industries, and individual routinary activities, can therefore have non-marginal or even preponderant roles in the production of this type of pollution. At the same time, COVID-19 has shown that citizens and the government still are not ready to manage policies that support smart working or distance learning. Furthermore, considering the increase in demand for home delivery services and online shopping during and after the lockdowns, government authorities must pay greater attention to the environmental effects of such businesses. For these reasons, Italian government agencies are advised to: (i) improve their own particulate matter monitoring system, with particular attention to PM2.5, in order to better understand the contribution of the various sources in this type of pollution, and (ii) support and subsidize the use of locally-sourced products in order to reduce pollution due to packaging. Finally, this paper demonstrates the urgent need for new models and approaches capable of accurately and univocally estimating the impact of climatic factors on particulate matter.
Data Availability Statement
The original contributions presented in the study are included in the article/Supplementary Material, further inquiries can be directed to the corresponding author/s.
Author Contributions
AR was responsible for conception or design of the work, data collection, data analysis and interpretation, drafting the article, critical revision of the article, and final approval of the version to be published.
Conflict of Interest
AR was employed by company Redeev srl and Mensana srls.
Supplementary Material
The Supplementary Material for this article can be found online at: https://www.frontiersin.org/articles/10.3389/frsus.2021.649715/full#supplementary-material
Abbreviations
ADF, Augmented Dickey-Fuller test; AIC, Akaike information criterion; ARPA, Italian Regional Agency for Environmental Protection; BIC, Bayesian information criterion; COVID-19, coronavirus disease 2019; KPSS, Kwiatkowski, Phillips, Schmidt and Shin test; PM, particulate matter; RSV, Google Trends relative search volume; PP, Phillips–Perron test; SARS-CoV-2, Severe acute respiratory syndrome coronavirus 2; WHO, World Health Organization.
Footnotes
1. ^Available online at: https://trends.google.com/trends/ (accessed December, 2020).
2. ^Available online at: https://www.arpalombardia.it/Pages/Aria/Richiesta-Dati.aspx.
3. ^Available online at: https://github.com/pcm-dpc/COVID-19 (accessed December, 2020).
4. ^Available online at: https://www.ilmeteo.it/portale/archivio-meteo/Lombardia (accessed November, 2020).
5. ^Available online at: https://www.real-statistics.com/time-series-analysis/autoregressive-processes/augmented-dickey-fuller-test/.
6. ^Available online at: https://help.xlstat.com/s/article/unit-root-dickey-fuller-and-stationarity-tests-on-time-series?language=en_US.
7. ^Available online at: https://www.arpalombardia.it/Pages/Aria/Inquinanti/PM10-PM2,5.aspx?firstlevel=Inquinanti.
8. ^Available online at: https://www.euro.who.int/__data/assets/pdf_file/0008/147851/E87950.pdf.
9. ^Available online at: https://www.arpalombardia.it/PublishingImages/Pages/Forms/AllItems/analisi%20anno%202019%20rev%2020191231_completo.pdf.
10. ^Available online at: http://dati.istat.it/Index.aspx?DataSetCode=DCIS_POPRES1 (accessed December, 2020).
11. ^Available online at: https://ugeo.urbistat.com/AdminStat/it/it/classifiche/popolazione/province/italia/380/1 (accessed December, 2020).
References
Abbasi, S., Ayoob, T., Malik, A., and Memon, S. I. (2020). Perceptions of students regarding E-learning during Covid-19 at a private medical college. Pak. J. Med. Sci. 36, 57–61. doi: 10.12669/pjms.36.COVID19-S4.2766
Abu-Allaban, M., Gillies, J. A., Gertler, A. W., Clayton, R., and Proffitt, D. (2007). Motor vehicle contributions to ambient PM10 and PM2.5 at selected urban areas in the USA. Environ. Monit. Assess. 132, 155–163. doi: 10.1007/s10661-006-9511-3
Abuhammad, S. (2020). Barriers to distance learning during the COVID-19 outbreak: a qualitative review from parents' perspective. Heliyon 6:e05482. doi: 10.1016/j.heliyon.2020.e05482
Agenzia Giornalistica Italiana (2020). Come Lavora Amazon Durante L'emergenza Coronavirus (Italian Website). Available online at: https://www.agi.it/economia/news/2020-04-22/fase-2-coronavirus-amazon-spedizioni-8411103/ (accessed December 11, 2020).
Amazon (2020). Shipment Zero. Available online at: https://sustainability.aboutamazon.com/environment/sustainable-operations (accessed December 28, 2020).
Amrhein, V., Korner-Nievergelt, F., and Roth, T. (2017). The earth is flat (p > 0.05): significance thresholds and the crisis of unreplicable research. PeerJ 5:e3544. doi: 10.7717/peerj.3544
Avdakovic, S., Dedovic, M. M., Dautbasic, N., and Dizdarevic, J. (2016). “The influence of wind speed, humidity, temperature and air pressure on pollutants concentrations of PM10 — Sarajevo case study using wavelet coherence approach,” in XI International Symposium on Telecommunications (BIHTEL). pp. 1–6.
BBC News (2020). Coronavirus: Northern Italy Quarantines 16 Million People. Available online at: https://www.bbc.com/news/world-middle-east-51787238
Bourzac, K. (2020). COVID-19 lockdowns had strange effects on air pollution across the globe. Chemical and Engineering News, 37. Available online at: https://cen.acs.org/environment/atmospheric-chemistry/COVID-19-lockdowns-had-strange-effects-on-air-pollution-across-the-globe/98/i37 (accessed January 19, 2021).
Cameletti, M. (2020). The effect of corona virus lockdown on air pollution: evidence from the city of Brescia in Lombardia Region (Italy). Atmos. Environ. 239:117794. doi: 10.1016/j.atmosenv.2020.117794
Chang, L. T. C., Scorgie, Y., Duc, H. N., Monk, K., Fuchs, D., and Trieu, T. (2019). Major source contributions to ambient PM2.5 and exposures within the new south wales greater metropolitan region. Atmosphere 10:138. doi: 10.3390/atmos10030138
CNN Business (2020). America's Addiction to Absurdly Fast Shipping Has a Hidden Cost. Available online at: https://edition.cnn.com/2019/07/15/business/fast-shipping-environmental-impact/index.html (accessed December 11, 2020).
Collivignarelli, M. C., Abbà, A., Bertanza, G., Pedrazzani, R., Ricciardi, P., and Miino, M. C. (2020). Lockdown for CoViD-2019 in Milan: what are the effects on air quality? Sci. Total Environ. 732:139280. doi: 10.1016/j.scitotenv.2020.139280
Consiglio Nazionale delle Ricerche (2020). L'inquinamento in Italia Durante il Lockdown (Italian Website). Available online at: https://www.cnr.it/it/comunicato-stampa/9702/l-inquinamento-in-italia-durante-il-lockdown (accessed December 10, 2020).
Daniel, J. (2020). Education and the COVID-19 pandemic. Prospects 20, 1–6. doi: 10.1007/s11125-020-09464-3
Donzelli, G., Cioni, L., Cancellieri, M., Morales, A. L., and Morales Suárez-Varela, M. (2020). The effect of the Covid-19 lockdown on air quality in three Italian medium-sized cities. Atmosphere 11:1118. doi: 10.3390/atmos11101118
FASDA Fund (2020). Gli Effetti Della Quarantena Sull'ambiente (Italian Website). Available online at: https://www.fasda.it/effetti-quarantena-ambiente/ (accessed December 5, 2020).
Figueroa, C. A., and Aguilera, A. (2020). The need for a mental health technology revolution in the COVID-19 pandemic. Front. Psychiatry 11:523. doi: 10.3389/fpsyt.2020.00523
Francisco, R., Pedro, M., Delvecchio, E., Espada, J. P., Morales, A., Mazzeschi, C., et al. (2020). Psychological symptoms and behavioral changes in children and adolescents during the early phase of COVID-19 quarantine in three European countries. Front. Psychiatry 11:570164. doi: 10.3389/fpsyt.2020.570164
Fukuda, K. (2007). Practical unit-root analysis using information criteria: simulation evidence. J. Mod. Appl. Stat. Methods 6, 258–264. doi: 10.22237/jmasm/1177993380
Gautam, A. S., Dilwaliya, N., Srivastava, A., Kumar, S., Bauddh, K., Siingh, D., et al. (2020). Temporary reduction in air pollution due to anthropogenic activity switch-of during COVID-19 lockdown in northern parts of India. Environ. Dev. Sustain. 20, 8092–8131. doi: 10.1007/s10668-020-00994-6
Gautam, S., and Hens, L. (2020). COVID-19: impact by and on the environment, health and economy. Environ. Dev. Sustain. 22:4953–4954. doi: 10.1007/s10668-020-00818-7
Gazzetta Ufficiale della Repubblica Italiana (Italian Republic) (2020). Ministerial Decree November 3, 2020 (20A06109). Available online at: https://www.gazzettaufficiale.it/eli/id/2020/11/04/20A06109/sg
Grubbs, F. E. (1950). Sample criteria for testing outlying observations. Ann. Math. Stat. 21, 27–58. doi: 10.1214/aoms/1177729885
Gupta, A., Bherwani, H., Gautam, S., Anjum, S., Musugu, K., Kumar, N., et al. (2020). Air pollution aggravating COVID 19 lethality? Exploration in Asian cities using statistical models. Environ. Dev. Sustain. 23:1–10. doi: 10.1007/s10668-020-00878-9
Hirsch, R. M., and Slack, J. R. (1984). A nonparametric trend test for seasonal data with serial dependence. Water Resour. Res. 20, 727–732. doi: 10.1029/WR020i006p00727
Hodder, A. (2020). New technology, work and employment in the era of COVID-19: reflecting on legacies of research. New Technol. Work Employ. 35, 262–275. doi: 10.1111/ntwe.12173
Kedzierski, M., Frère, D., Le Maguer, G., and Bruzaud, S. (2020). Why is there plastic packaging in the natural environment? Understanding the roots of our individual plastic waste management behaviours. Sci. Total Environ. 740:139985. doi: 10.1016/j.scitotenv.2020.139985
Kheirbek, I., Haney, J., Douglas, S., and Matte, T. (2016). The contribution of motor vehicle emissions to ambient fine particulate matter public health impacts in New York City: a health burden assessment. Environ. Health 15:89. doi: 10.1186/s12940-016-0172-6
Kipiński, L., König, R., Sieluzycki, C., and Kordecki, W. (2011). Application of modern tests for stationarity to single-trial MEG data: transferring powerful statistical tools from econometrics to neuroscience. Biol. Cybern. 105, 183–195. doi: 10.1007/s00422-011-0456-4
Kumar, P., Hama, S., Omidvarborna, H., Sharma, A., Sahani, J., Abhijith, K. V., et al. (2020). Temporary reduction in fine particulate matter due to ‘anthropogenic emissions switch-off' during COVID-19 lockdown in Indian cities. Sustain Cities Soc. 62:102382. doi: 10.1016/j.scs.2020.102382
Kwak, S. G., and Kim, J. H. (2017). Central limit theorem: the cornerstone of modern statistics. Korean J. Anesthesiol. 70, 144–156. doi: 10.4097/kjae.2017.70.2.144
Le Quéré, C., Jackson, R. B., Jones, M. W., Smith, A. J. P., Abernethy, S., Andrew, R. M., et al. (2020). Temporary reduction in daily global CO2 emissions during the COVID-19 forced confinement. Nat. Clim. Chang. 10, 647–653. doi: 10.1038/s41558-020-0797-x
Lebreton, L., and Andrady, A. (2019). Future scenarios of global plastic waste generation and disposal. Palgrave Commun. 5:6. doi: 10.1057/s41599-018-0212-7
Li, H., Liu, S. M., Yu, S. L., and Tang, C. K. (2020). Coronavirus disease 2019 (COVID-19): current status and future perspectives. Int. J. Antimicrob. Agents 55:105951. doi: 10.1016/j.ijantimicag.2020.105951
Liu, Z., Shen, L., Yan, C., Du, J., and Li, Y. (2020). Analysis of the influence of precipitation and wind on PM2.5 and PM10 in the atmosphere. Adv. Meteorol. 2020:5039613. doi: 10.1155/2020/5039613
Lowen, M. (2020). Coronavirus: quarantine raises virus fears in northern Italy. BBC News. Available online at: https://www.bbc.com/news/world-europe-51628084 (accessed January 19, 2021)
MacKinnon, J. G. (1996). Numerical distribution functions for unit root and cointegration tests. J. Appl. Econometr. 11, 601–618.
Malinauskaite, J., Jouhara, H., Ahmad, L., Milani, M., Montorsi, L., and Venturelli, M. (2019). Energy efficiency in industry: EU and national policies in Italy and the UK. Energy 172, 255–269. doi: 10.1016/j.energy.2019.01.130
Ministero della Salute (Italian Ministry of Health) (2020). Ministerial Decree May 17, 2020 (20A02717). Available online at: https://www.trovanorme.salute.gov.it/norme/dettaglioAtto?id=74088
Mukhtar, K., Javed, K., Arooj, M., and Sethi, A. (2020). Advantages, limitations and recommendations for online learning during COVID-19 pandemic era. Pak. J. Med. Sci. 36, 27–31. doi: 10.12669/pjms.36.COVID19-S4.2785
Mushtaq, R. (2011). Augmented Dickey fuller test. SSRN Electron J. doi: 10.2139/ssrn.1911068. [Epub ahead of print].
NASA (2020). NASA Model Reveals How Much COVID-related Pollution Levels Deviated From the Norm. Available online at: https://www.nasa.gov/feature/goddard/2020/nasa-model-reveals-how-much-covid-related-pollution-levels-deviated-from-the-norm (accessed January 19, 2021).
Ncube, L. K., Ude, A. U., Ogunmuyiwa, E. N., Zulkifli, R., and Beas, I. N. (2020). Environmental impact of food packaging materials: a review of contemporary development from conventional plastics to polylactic acid based materials. Materials 13:4994. doi: 10.3390/ma13214994
Newey, W. K., and West, K. D. (1987). A simple, positive semi-definite, heteroskedasticity and autocorrelation consistent covariance matrix. Econometrica 55, 703–708. doi: 10.2307/1913610
Olszowski, T. (2016). Changes in PM10 concentration due to large-scale rainfall. Arab. J. Geosci. 9:160. doi: 10.1007/s12517-015-2163-2
Patrício Silva, A. L., Prata, J. C., Walker, T. R., Duarte, A. C., Ouyang, W., Barcelò, D., et al. (2021). Increased plastic pollution due to COVID-19 pandemic: challenges and recommendations. Chem. Eng. J. 405:126683. doi: 10.1016/j.cej.2020.126683
Philips, P. C. B., and Perron, P. (1988). Testing for a unit root in time series regression. Biometrika 75, 335–346. doi: 10.1093/biomet/75.2.335
Piccoli, A., Agresti, V., Balzarini, A., Bedogni, M., Bonanno, R., Collino, E., et al. (2020). Modeling the e?ect of COVID-19 lockdown on mobility and NO2 concentration in the Lombardy region. Atmosphere 11:1319. doi: 10.3390/atmos11121319
Putaud, J.-P., Pozzoli, L., Pisoni, E., Martins Dos Santos, S., Lagler, F., Lanzani, G., et al. (2020). Impacts of the COVID-19 lockdown on air pollution at regional and urban background sites in northern Italy, Atmos. Chem. Phys. Discuss. 21, 7597–7609. doi: 10.5194/acp-2020-755-supplement
Regional Agency for Environmental Protection (ARPA) (2019). Qualità Dell'aria - un Primo Bilancio del 2019 (Italian Website). Available online at: https://www.arpalombardia.it/PublishingImages/Pages/Forms/AllItems/analisi%20anno%202019%20rev%2020191231_completo.pdf (accessed January 20, 2021).
Regional Agency for Environmental Protection (ARPA) (2020a). Available online at: https://www.arpalombardia.it/Pages/Aria/Richiesta-Dati.aspx (accessed November 20, 2020).
Regional Agency for Environmental Protection (ARPA) (2020b). Inquinanti PM10 e PM2,5 (Italian Website). Available online at: https://www.arpalombardia.it/Pages/Aria/Inquinanti/PM10-PM2,5.aspx?firstlevel=Inquinanti (accessed January 20, 2021).
Rossi, R., Socci, V., Talevi, D., Mensi, S., Niolu, C., Pacitti, F., et al. (2020). COVID-19 pandemic and lockdown measures impact on mental health among the general population in Italy. Front. Psychiatry 11:790. doi: 10.3389/fpsyt.2020.00790
Rovetta, A. (2020). Raiders of the lost correlation: a guide on using Pearson and Spearman coefficients to detect hidden correlations in medical sciences. Cureus 12:e11794. doi: 10.7759/cureus.11794
Rovetta, A., and Castaldo, L. (2020a). Relationships between demographic, geographic, and environmental statistics and the spread of novel coronavirus disease (COVID-19) in Italy. Cureus 12:e11397. doi: 10.7759/cureus.11397
Rovetta, A., and Castaldo, L. (2020b). The impact of COVID-19 on Italian web users: a quantitative analysis of regional hygiene interest and emotional response. Cureus 12:e10719. doi: 10.7759/cureus.10719
Rutkowska, A., and Ptak, M. (2017). On certain stationarity tests for hydrologic series. Stud. Geotech. Mech. 34, 51–63. doi: 10.1515/sgem-2017-0022
Ryou, H., Heo, J., and Kim, S. Y. (2018). Source apportionment of PM10 and PM2.5 air pollution, and possible impacts of study characteristics in South Korea. Environ. Pollut. 240, 963–972. doi: 10.1016/j.envpol.2018.03.066
Salvalai, G., Masera, G., and Sesana, M. M. (2015). Italian local codes for energy efficiency of buildings: theoretical definition and experimental application to a residential case study. Renew. Sustain. Energy Rev. 42, 1245–1259. doi: 10.1016/j.rser.2014.10.038
Sarti, D., De Salvatore, M., Gazzola, S., Pantaleoni, C., and Granocchio, E. (2020). So far so close: an insight into smart working and telehealth reorganization of a Language and Learning Disorders Service in Milan during COVID-19 pandemic. Neurol. Sci. 41, 1659–1662. doi: 10.1007/s10072-020-04481-8
Supply Chain Solutions Center (2019). Packaging Waste 101: The Problem. Available online at: https://supplychain.edf.org/resources/sustainability-101-packaging-waste-the-problem/ (accessed December 11, 2020).
Tabachnick, B. G., and Fidell, L. S. (1996). Using Multivariate Statistics, 3rd Edn. New York, NY: HarperCollins. ISBN-13:978-0673994141
Taylor, J. R. (1997). An Introduction to Error Analysis: The Study of Uncertainties in Physical Measurements. Melville, NY: Univ Science Books. ISBN-13:978-0935702422
Tecer, L. H., Suren, P., Alagha, O., Karaca, F., and Tuncel, G. (2008). Effect of meteorological parameters on fine and coarse particulate matter mass concentration in a coal-mining area in Zonguldak, Turkey. J. Air Waste Manag. Assoc. 58, 543–552. doi: 10.3155/1047-3289.58.4.543
The Planet Mark Eden Project (2016). Smartworking and Sustainability. Available online at: https://www.theplanetmark.com/smartworking-and-sustainability/ (accessed December 11, 2020).
Wang, C., Horby, P. W., Hayden, F. G., and Gao, G. F. (2020a). A novel coronavirus outbreak of global healthconcern. Lancet 395, 470–473. doi: 10.1016/S0140-6736(20)30185-9
Wang, P., Chen, K., Zhu, S., Wang, P., and Zhang, H. (2020b). Severe air pollution events not avoided by reduced anthropogenic activities during COVID-19 outbreak. Resour. Conserv. Recycl. 158:104814. doi: 10.1016/j.resconrec.2020.104814
World Health Organization (2005). Air Quality Guidelines Global Update 2005 – Meeting Report. 18-20 October 2005, Bonn. Available online at: https://www.euro.who.int/__data/assets/pdf_file/0008/147851/E87950.pdf
World Health Organization (2020). Impact of COVID-19 on People's Livelihoods, Their Health and Our Food Systems. Available online at: https://www.who.int/news/item/13-10-2020-impact-of-covid-19-on-people's-livelihoods-their-health-and-our-food-systems (accessed December 5, 2020).
Worldometer (2020). COVID-19 Coronavirus Pandemic. Available online at: https://www.worldometers.info/coronavirus/ (accessed December 5, 2020).
Wu, X., Nethery, R. C., Sabath, M. B., Braun, D., and Dominici, F. (2020). Air pollution and COVID-19 mortality in the United States: strengths and limitations of an ecological regression analysis. Sci. Adv. 6:eabd4049. doi: 10.1126/sciadv.abd4049
XLSTAT (2021). Unit Root (Dickey-Fuller) and Stationarity Tests on Time Series. Available online at: https://help.xlstat.com/s/article/unit-root-dickey-fuller-and-stationarity-tests-on-time-series?language=en_US (accessed January 19, 2021).
Zaiontz, C. (2016). Real Statistics Using Excel - Augmented Dickey-Fuller Test. Available online at: https://www.real-statistics.com/time-series-analysis/autoregressive-processes/augmented-dickey-fuller-test/ (accessed January 19, 2021).
Zhou, Y., Yue, Y., Bai, Y., and Zhang, L. (2020). Effects of rainfall on PM2.5 and PM10 in the middle reaches of the Yangtze river. Adv. Meteorol. 2020:2398146. doi: 10.1155/2020/2398146
Zhu, H., Wei, L., and Niu, P. (2020). The novel coronavirus outbreak in Wuhan, China. Glob. Health Res Policy 5:6. doi: 10.1186/s41256-020-00135-6
Keywords: consumption, COVID-19, Italy, lockdown, PM10, PM2.5, sustainability, Google Trends
Citation: Rovetta A (2021) The Impact of COVID-19 Lockdowns on Particulate Matter Emissions in Lombardy and Italian Citizens' Consumption Habits. Front. Sustain. 2:649715. doi: 10.3389/frsus.2021.649715
Received: 05 January 2021; Accepted: 17 May 2021;
Published: 14 June 2021.
Edited by:
Luis Velazquez, Universidad de Sonora, MexicoReviewed by:
Sneha Gautam, Karunya Institute of Technology and Sciences, IndiaAwais Shakoor, Universitat de Lleida, Spain
Carolina Belenguer-Sapiña, University of Valencia, Spain
Copyright © 2021 Rovetta. This is an open-access article distributed under the terms of the Creative Commons Attribution License (CC BY). The use, distribution or reproduction in other forums is permitted, provided the original author(s) and the copyright owner(s) are credited and that the original publication in this journal is cited, in accordance with accepted academic practice. No use, distribution or reproduction is permitted which does not comply with these terms.
*Correspondence: Alessandro Rovetta, cm92ZXR0YS5tcmVzZWFyY2hAZ21haWwuY29t; orcid.org/0000-0002-4634-279X