 Sven Johann Bohr1,2*
 Fei Wang3*
 Michael Metze4Josipa Lisičar Vukušić1
 Andreas Sapalidis5Mathias Ulbricht2
 Britta Nestler3,6
 Stéphan Barbe1*
- 1Faculty of Applied Natural Sciences, Technische Hochschule (TH) Köln—Cologne University of Applied Sciences, Leverkusen, Germany
- 2Department of Technical Chemistry II, University of Duisburg-Essen, Essen, Germany
- 3Institute of Applied Materials-Computational Materials Science (IAM-CMS), Karlsruhe Institute of Technology (KIT), Karlsruhe, Germany
- 4Sartorius-Stedim Biotech GmbH, Göttingen, Germany
- 5Institute of Nanoscience and Nanotechnology, National Centre for Scientific Research Demokritos, Agia Paraskevi, Greece
- 6Institute of Digital Materials Science, Karlsruhe University of Applied Sciences, Karlsruhe, Germany
Porous polymer membranes substantially contribute to an acceleration of sustainability transformation based on the energy efficient separation of liquid and gaseous mixtures. This rapid shift toward sustainable industrial processes leads to an increased demand for specifically tailored membranes. In order to predict membrane performance factors like permeability, selectivity and durability, the membrane formation process by film casting and phase inversion needs to be understood further. In recent years, computational models of the membrane formation process have been studied intensely. Their high spatial and temporal resolution allows a detailed quantitative description of phase inversion phenomena. New experimental techniques complement this development, as they provide quantitative data, e.g., on compositional changes of the polymer solution during membrane formation as well as the kinetic progression of the phase separation process. This state-of-the-art review compiles computational and experimental approaches that characterize the phase inversion process. We discuss how this methodological pluralism is necessary for improving the tailoring of membrane parameters, but that it is unlikely to be the way to the ultimate goal of a complete description of the evolution of the membrane structure from the initial demixing to the final solidification. Alternatively, we formulate an approach that includes a database of standardized and harmonized membrane performance data based on previously publicized data, as well as the application of artificial neural networks as a new powerful tool to link membrane production parameters to membrane performance.
1. Introduction
The increasing demand for innovative high performance porous polymer membranes (hereafter referred to as membranes) surges with the demand for sustainable industrial development. Today, membrane technology has already outcompeted conventional thermal separation processes in a number of industrial sectors, e.g., water desalination. In other applications, such as energy generation, pharmaceutical production, and general separation tasks in the manufacture of chemicals and electronics, membrane processes play an essential role. In membrane technology lies a huge potential for the further optimization of a wide range of chemical and biochemical process operations (Drioli et al., 2011, 2012).
Membranes essentially build very thin interfaces allowing selective mass and heat transfer between different phases. Its wide range of applicability is based on the choice of membrane material and its arrangement in space. Therefore, an intimate knowledge of the membrane formation process from start to finish is important for the realization of the potential of membrane technology. In case of porous polymer membranes, this process consists of (1) the preparation of a polymer solution, (2) casting/ shaping into a liquid film or capillary, (3) the initial phase separation, (4) coarsening and structure evolution, (5) solidification of the final morphology, (6) post treatments such as drying, conditioning, winding and storing.
Steps 3–5 describe the emergence of the membrane structure. This phase inversion process is realizable with one of the techniques described in Figure 1. The dry phase inversion methods are thermally induced phase separation (TIPS), evaporation induced phase separation (EIPS) and non-solvent vapor induced phase separation (VIPS). Wet phase inversion is called liquid non-solvent induced phase separation (NIPS). The phase inversion process always follows the same physical principles of heat and matter transfer. It consists of multiple non-equilibrium processes that make the prediction of membrane parameters such as porosity and permeability a challenge still to be met. That is why even today, more than a century after the preparation of the first porous polymer membrane (Bechhold, 1907), membrane research is still for the most part an empirical science and lacks a comprehensive theory.
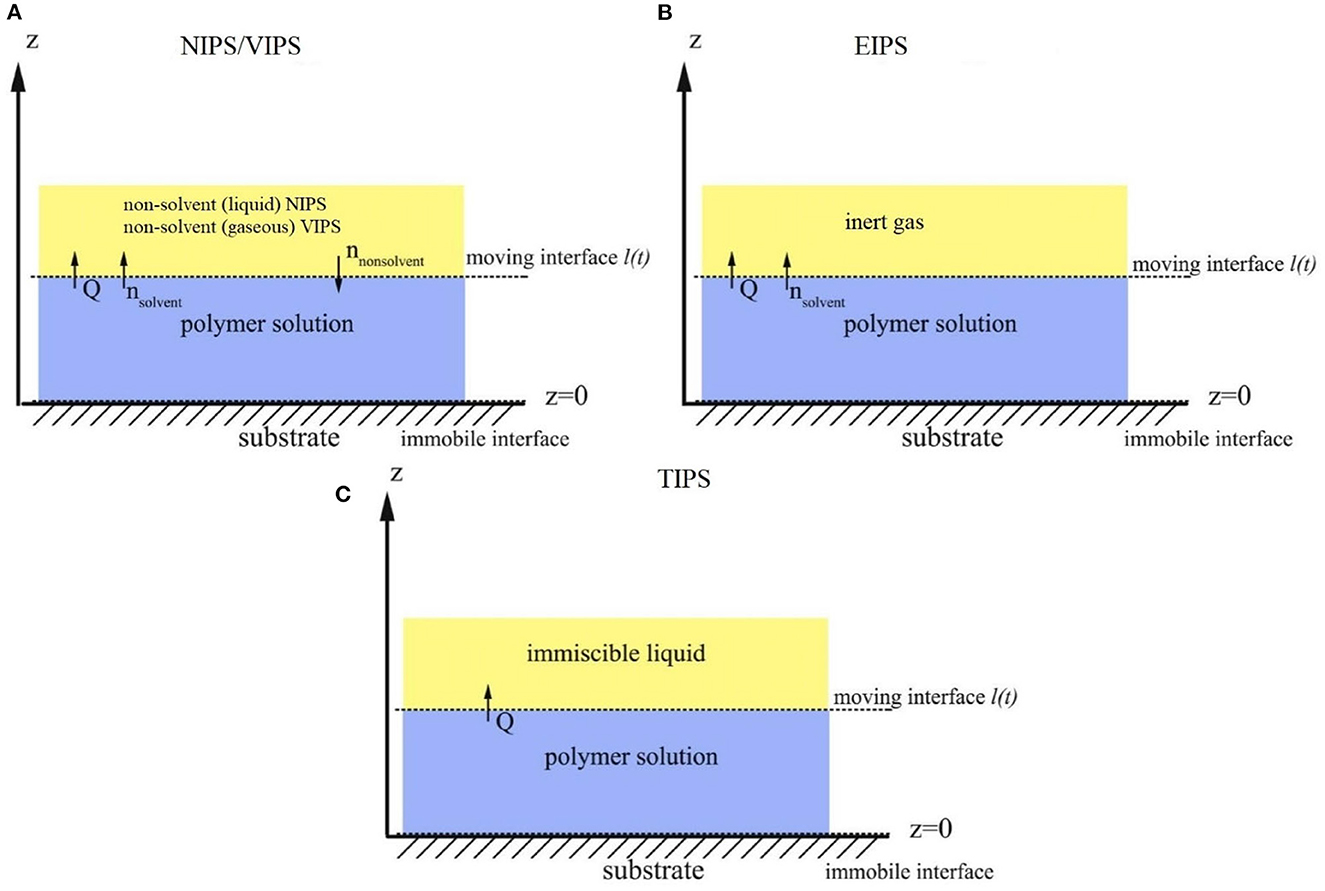
Figure 1. Schematic diagrams of a cross-section of a cast film on a substrate and the relevant physical processes and phenomena during phase inversion. z = 0 represents the dope/support interface and l(t) represents the upper interface. Its location on the z-axis is a function of time due to excess volume of mixing effects as well as solvent and non-solvent diffusion across the interface. (A) NIPS/VIPS is considered an open system. The contact of a cast film with a liquid or gaseous phase of miscible non-solvent results in mass transfer of solvent and non-solvent across the interface as well as heat transfer due to enthalpy of vaporization, or if a temperature gradient between the phases exists. (B) EIPS is also an open system, where the cast film is in contact with an inert gas such as nitrogen, which leads to matter transport out of the film by evaporation, again coupled with heat transfer due to enthalpy of vaporization, or if a temperature gradient between the phases exists. (C) TIPS is a closed system as only heat transfer occurs due to a temperature gradient between cast film and the immiscible liquid phase. Adapted from Tang et al. (2021a) with permission.
The membrane formation process can be characterized by experimental and computational approaches. In order to predict structural and mechanical properties of membranes, the membrane formation process needs to be visualized from start to finish. This can only be achieved by superimposing various investigative approaches in an attempt to depict the reality of the membrane formation process in its entirety. Ultimately, membrane properties could be predicted by knowledge of the system composition and the process parameters alone.
Although some the experimental approaches were established decades ago, no comprehensive review of methods for the investigation of membrane formation kinetics exists to the best of our knowledge. In comparison, several recent review articles, a book chapter and a perspective article highlight the relevance of modeling various aspects of the formation process of porous polymer membranes at different length and time scales. Some focus on the thermodynamics and kinetics of phase inversion and the resulting morphologies (Müller and Abetz, 2021; Tang et al., 2021a; Wang et al., 2022). Others review the modeling of membrane performance with respect to pore structure and pore size distribution (Mondal et al., 2019), or evaluate future trends in membrane materials and manufacturing techniques to widen the applicability of membrane technology (Nunes et al., 2020). In view of this asymmetric coverage of approaches of membrane formation characterization, the authors of this review put the focus on experimental methods in order to complement the emphasis on modeling approaches apparent in the recent literature.
This review describes and evaluates various numerical and experimental methods and for the first time highlights their potential for mutual benefit and possible synergetic effects. The spatial and temporal resolution of the compiled methods will be compared, as well as their possible application during the steps 3–5 of the membrane formation process. In a final analysis, we will discuss the possibility of interlocking computational and experimental approaches in a way that quantitative, experimental data feeds numerical models in order to validate them, and in turn use numerical models to help tailor membrane properties. While the scope here is on porous polymer membranes, analogous activities are taking place in the field of thin film composite membranes via interfacial polymerisation.
2. Methods
2.1. Experimental methods for membrane formation characterization
A brief description of the membrane formation process will help to categorize the different experimental methods. Membrane formation by phase inversion usually starts with a homogenous, thermodynamically stable polymer solution. A new equilibrium point is set inside the miscibility gap of the system by a change in temperature (TIPS) or by bringing the cast polymer solution into contact either with a liquid phase containing a non-solvent (NIPS, VIPS) or with an inert gaseous phase into which the solvent evaporates (EIPS). The thermodynamic state of the system moves toward the new equilibrium point. The system destabilizes progressively until the binodal is crossed (see Figure 2A). At that point, the system becomes metastable and phase separation into a polymer-rich and a polymer-lean phase eventually occurs. If the system crosses the spinodal, the system becomes unstable; polymer-rich and polymer-lean phases separate immediately. Both phases undergo coarsening and the polymer-rich phase eventually solidifies, locking in the intermingled two-phase structure.
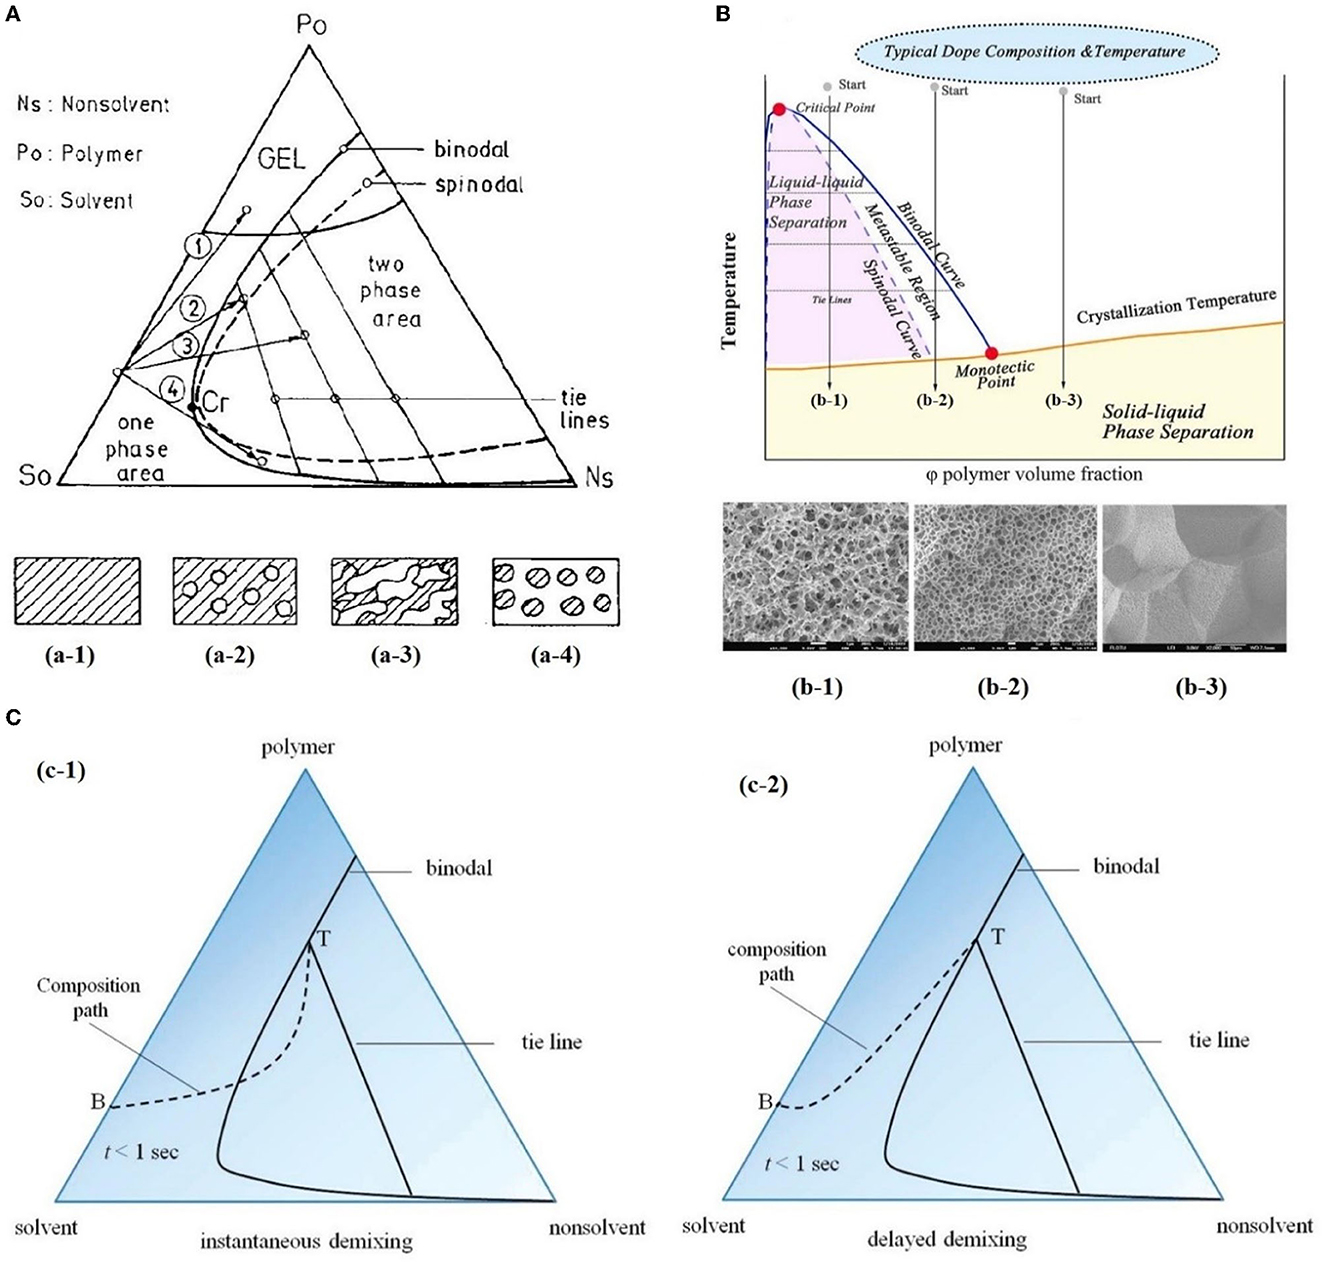
Figure 2. (A) A ternary phase diagram for polymer, solvent and non-solvent with different composition paths that represent possible phase separation mechanisms. (a-1) Solidification, (a-2) nucleation and growth of the polymer-lean phase, (a-3) spinodal decomposition, (a-4) nucleation and growth of the polymer-rich phase. Reproduced from Stropnik et al. (1996) with permission; (B) A temperature-composition phase diagram for a binary solution consisting of polymer and solvent. Thermal quenching of different compositions, and therefore through different regions of the phase diagram, lead to different phase separation mechanisms and subsequently to different membrane morphologies. (b-1) Liquid-liquid phase separation by spinodal decomposition leads to a bi-continuous open-pore structure. (b-2) Liquid-liquid phase separation by nucleation and growth of the polymer-lean phase leads to cellular morphology. (b-3) Solid-liquid phase separation by nucleation and growth of a solid phase leads to semi-crystalline pore structure, whose appearance is governed by the size and connectedness of the solid particles. Adapted from Tang et al. (2021b) with permission; (C) The dashed line shows the composition profile of the film immediately after immersion in the coagulation bath (t < 1 s). T and B represent the compositions at the top and on the bottom of the cast film, respectively. Depending on whether the binodal is crossed immediately or not, two types of demixing can be distinguished resulting in distinct membrane morphologies. (c-1) A fast exchange of solvent and non-solvent initiates instantaneous demixing, resulting in a finger-like structure, prone to macrovoids. (c-2) A slow exchange of solvent and non-solvent initiates delayed demixing, resulting in a sponge-like morphology. Adapted from Guillen et al. (2011) with permission.
A specific membrane structure is obtained by conserving a specific non-equilibrium state reached by a specific composition path in a specific time. The basic principles to describe the system and the process are thermodynamics and kinetics, respectively. Therefore, the experimental methods will be divided into thermodynamic and kinetic approaches. The thermodynamic studies focus on the description of the possible states of the polymer liquid mixture, such as phase stability and appearance dependent on composition. The kinetics of membrane formation can be described by two mechanisms, namely diffusion processes and demixing processes. Hence, the kinetic studies are divided further into approaches that either quantitatively measure the change of composition of the polymer solution, or that qualitatively describe the demixing process from a phenomenological point of view. The experimental methods will be discussed regarding their applicability to the membrane manufacturing techniques TIPS, NIPS, VIPS, and EIPS, as well as their aptitude to describe the membrane formation process qualitatively and quantitatively. Section 3.1.4 contains a tabular summary of the experimental methods discussed in the following section.
2.1.1. Thermodynamic characterization of the polymer solution
2.1.1.1. Phase diagram
A phase diagram projects all possible thermodynamic states of the investigated system into a Cartesian coordinate system. A phase diagram can be binary, ternary, quaternary, or of even higher orders, depending on the number of system components. Figures 2A, B show a ternary phase diagram and a binary phase diagram, respectively, for a polymer solution.
2.1.1.2. Cloud point determination methods
Correlations between the thermodynamic state of the polymer liquid system and membrane structure can be investigated by experimental determination of phase diagram elements such as binodal, spinodal, gelation-, crystallization-, vitrification-, and tie-lines.
A standard method to characterize a polymer solution thermodynamically is cloud point determination. At the cloud point, the solution turns from clear to turbid. In a phase diagram, the cloud point curve forms the border between solution compositions or temperatures that are thermodynamically stable, and compositions or temperatures that are thermodynamically metastable. Cloud points are measured by titration with a non-solvent and by cooling. The titration method goes back to Schulz (1937) and requires a ternary system consisting of polymer, solvent and non-solvent. Either pure non-solvent (Arahman et al., 2016; Wang et al., 2016; Liu G. et al., 2019; Nivedita et al., 2020) or a mixture of solvent and non-solvent (Yin et al., 2015; Brami et al., 2017; Mazinani et al., 2017; Zhang et al., 2018) is added to a polymer solution at a constant temperature. A mixture of solvent and non-solvent impedes premature coagulation of the polymer at the point of contact with the polymer solution (Reuvers, 1987). Turbidity is detected either visually or by light transmission measurement (Matsuyama et al., 2002b; Schaper, 2002; Zuo, 2006; Rahman et al., 2008; Madaeni and Bakhtiari, 2012; Metze, 2014; Wenning et al., 2018). A second cloud point may be measured by back-titration with solvent after the onset of turbidity. This procedure can be repeated to increase throughput (Mazinani et al., 2017; Yam-Cervantes et al., 2019). If the addition of non-solvent is continued after the onset of turbidity, the solution eventually separates into a polymer-rich and a polymer-lean phase. At this point, the spinodal is crossed (Nivedita et al., 2020). Small angle neutron scattering (SANS) may also be employed to detect phase separation (Metze et al., 2017).
The cooling method goes back to Powers (1942) and can be applied to binary and ternary systems. A sample in a sealed glass vial is put in a thermostatic shaking bath. The bath is heated until the sample turns clear. Subsequently, the bath is cooled with a constant cooling rate. At a certain temperature, the solution becomes thermodynamically unstable and demixing occurs (Klein and Schiedermaier, 1970; van Emmerik and Smolders, 1972; Mulder, 1996; Cheng et al., 1999b). Another technique for cloud point determination by cooling employs two microscope cover slips and a spacer of ~100 μm thickness with a center opening. The sample is placed in the opening and is sealed in by the cover slips. The sample is heated on a hot stage and cooled at various constant cooling rates. The onset of turbidity is determined either visually (Matsuyama et al., 2000a, 2002a) or by light transmission measurement (Wijmans et al., 1985; Reuvers et al., 1986). The spinodal curve is determined by quenching the sample to different temperatures below the cloud point. If isolated droplets form gradually, the temperature is considered to be in the metastable region between binodal and spinodal. If an interconnected structure forms immediately, the temperature is thought to be in the unstable region beneath the spinodal (Matsuyama et al., 2002b). The cooling technique also gives information on the demixing mechanism. Liquid-liquid demixing is a very fast process and is independent of the cooling rate, whereas the cooling rate is an important parameter of gelation/vitrification/crystallization. Both phase separation mechanisms can be distinguished by measuring the cloud point curve at different cooling rates. If the cooling curve remains the same among different cooling rates, liquid-liquid demixing occurs; otherwise gelation, vitrification or crystallization is suggested (Mulder, 1996).
The abovementioned methods for cloud point determination have certain limitations. They do not give any information on the equilibrium phase compositions that exist inside the miscibility gap, namely the orientation of the tie-lines. Furthermore, the cloud point curve coincides with the binodal only in case of a monodisperse polymer system. Otherwise, the onset of turbidity indicates the precipitation of the heaviest polymer fraction. In addition, polymer concentrations beyond the critical point are tedious to assess, because of increasing viscosity. This retards the adjustment of the thermodynamic equilibrium and instead of the true cloud point, a premature coagulation is observed. In case of a ternary system, a linearized cloud point curve correlation can be applied, to extrapolate the course of the cloud point curve to higher polymer concentrations. The correlation is only valid under the assumptions that the polymer is strongly incompatible with the non-solvent and that the phase separation mechanism is liquid-liquid demixing. However, the extrapolation loses accuracy with increasing polymer concentration (Lau et al., 1991; Boom et al., 1993; Law and Mukhopadhyay, 1997; Liu L. Q. et al., 2013; Dong et al., 2014; Liu Y. et al., 2019). These limitations may be overcome with the methods proposed by Kahrs et al. (2019) and Barth and Wolf (2000). They provide experimental data on the course of the cloud-point curve and on the orientation of the tie-lines, even at high polymer concentrations. The methods can be applied to ternary systems consisting of polymer, solvent, and non-solvent. Figure 3 describes the procedure by Kahrs, exemplary.
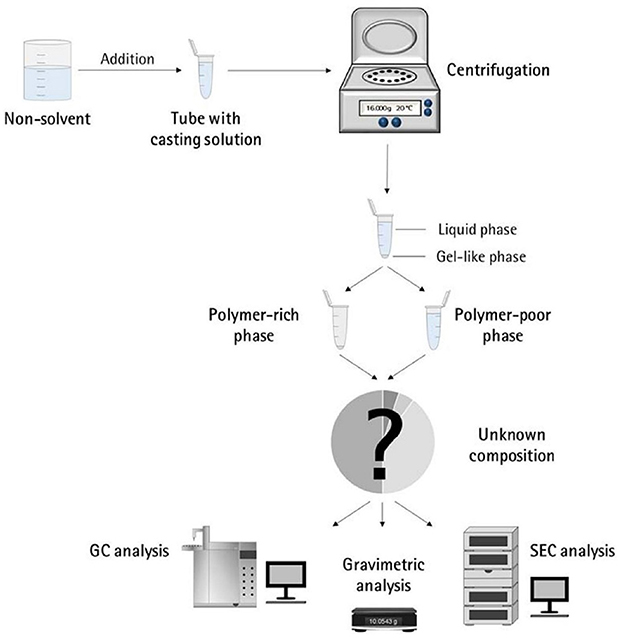
Figure 3. Determination of the cloud-point curve and the tie-lines at high polymer concentrations: Samples with different ratios of polymer solution and non-solvent are prepared. The amount of non-solvent has to be sufficient to initiate phase separation. The samples are homogenized and centrifuged for 24 h in a tempered centrifuge. The polymer-rich phase aggregates at the bottom and the polymer-lean phase floats on top. The polymer content of the respective phase is determined either gravimetrically via evaporation and drying or by size exclusion chromatography (SEC). SEC additionally shows the molecular weight distribution of the polymer. The solvent and non-solvent contents are determined by gas chromatography. Reproduced from Kahrs et al. (2019) with permission.
2.1.1.3. Rheological characterization of polymer solutions
The rheological characterization of a polymer solution gives information on the solutions flow properties at a given temperature. Polymer solutions with the same amount of the same polymer show different viscosities for different solvents, depending on the solvent quality. Decreasing solvent quality increases the miscibility gap and the viscosity of the polymer solution (Hoernschemeyer, 1974; Kahrs et al., 2020). Furthermore, poorer solvents amplify the effects of additives such as PEG and PVP (Kahrs and Schwellenbach, 2020). Besides the thermodynamic properties of a given polymer/solvent/non-solvent system, the kinetics of the phase separation process also have an influence on the membrane structure and properties. The diffusion rates of solvent and non-solvent are determined by the gradient of chemical potential across the film/bath interface. The diffusion rates are limited by the viscous hindrance of the polymer solution (Lee H. J. et al., 2004; Li et al., 2008; Guillen et al., 2013). The appearance of macrovoids seems to be governed by the rate of non-solvent inflow and polymer chain entanglement (Lin et al., 2002; Ren et al., 2010; Wang and Ma, 2012; Hung et al., 2016). Cloud point experiments may show a decreasing thermodynamic stability with increasing polymer concentration, suggesting a faster phase separation. However, coincidentally the viscosity of the polymer solution increases. This in turn leads to a decrease of the diffusion rate during phase inversion, resulting in a slower phase separation (Lee H. J. et al., 2004). It depends on the specifics of the polymer/solvent/non-solvent system whether the thermodynamic instability or the viscosity hindrance controls the phase separation (Zhang et al., 2010; Sadrzadeh and Bhattacharjee, 2013; Venault et al., 2016). The phenomenological model, , predicts porosity and membrane thickness. The first derivative of the Gibbs free energy of mixing, P, performs as the thermodynamic driving force of non-solvent diffusion, while the zero shear viscosity of the polymer solution, η0, behaves as a resistive force. The former may be calculated by the compressible solution model of Mayes (Ruzette and Mayes, 2001; Gonzalez-Leon and Mayes, 2003), while the latter may be measured experimentally (Bazarjani et al., 2009; Ghasemi and Mohammadi, 2013).
A polymer solution that undergoes phase separation decomposes into two thermodynamically stable solution that coexist next to each other. The rheological properties of the phases differ significantly. The polymer-rich phase has a comparatively high viscosity due to high polymer content. This may lead to chain entanglement as well as inter- and intramolecular hydrogen bridges, which form a network-like superstructure that surrounds the macromolecules like a fog (Peng et al., 2009; Mezger, 2014). Thus, the polymer-rich phase also shows elastic properties. In contrast, the polymer-lean phase is mostly made up of small solvent and non-solvent molecules and exhibits low viscosity and no elasticity. Due to the distinct flow properties of the two phases, the mixture is called dynamically asymmetric. Tanaka's model of viscoelastic phase separation describes how a porous membrane structure arises from this asymmetry. The gel-like polymer-rich phase exhibits a long relaxation time and cannot catch up with the phase separation itself. A network-like or sponge-like structure of polymer-rich phase emerges. Its volume shrinks with time due to out-diffusion of solvent. The shape of the polymer-rich domains is determined by elastic forces and not by interfacial tension (Tanaka, 1996, 1997, 2000). Increased viscoelasticity promotes the preservation of the nascent lacy structure with interconnected pores (Tsai et al., 2010; Mousavi and Zadhoush, 2017). The structure evolution eventually comes to a halt due to solidification of the polymer-rich phase.
2.1.2. Process kinetics of phase inversion characterized by visualizing the demixing process
The experimental methods discussed in this section phenomenologically describe the membrane formation with a microscope to yield qualitative and quantitative information on the phase inversion process.
2.1.2.1. Optical methods
2.1.2.1.1. Optical microscopy
Optical methods visualize the membrane forming process unmediated. They use light of the entire visible spectrum to gather data. Qualitative aspects of the membrane forming process, such as the formation of droplets, the appearance of the emerging membrane structure, or the movement of the coagulation front can be seen. These phenomenological observations yield quantitative parameters like droplet growth rate and apparent diffusion coefficient. The experimental setup and the sample preparation for the optical microscopy (OM) technique are as follows. A sample of the polymer solution is placed on or between microscope slides, which are in turn placed on a heating stage in the optical path of a microscope. The observation is carried out under isothermal conditions, or with a constant cooling rate. To increase the contrast, the sample is dyed, e.g., with Rhodamine B or phenolphthalein. The dying of the sample is avoided by using a phase contrast microscope (Lee H. J. et al., 2004).
During TIPS, OM determines the initial phase separation mechanism, namely nucleation and growth or spinodal decomposition. In case of initial spinodal decomposition, the interconnected structure often coalesces into droplets that over time grow and decrease in number. A quench path below the critical point exhibits the growth of polymer-rich droplets in a polymer-lean matrix. Here, the droplet growth rate increases with decreasing quench temperature and decreasing polymer concentration. In comparison, a quench path above the critical point leads to the growth of polymer-lean droplets in a polymer-rich matrix. This quench path shows the same growth rate dependence on quench temperature, but the opposite dependence on polymer concentration (Smolders et al., 1971; McGuire et al., 1995). A respective binary phase diagram is shown in Figure 2B. OM is capable of distinguishing between liquid-liquid demixing and solid-liquid demixing during TIPS (Yoo and Kim, 2008; Yang et al., 2013; Ishigami et al., 2014). OM also shows the impact of polymer molecular weight on droplet growth rate and membrane morphology. With a high molecular weight polymer, the droplets grow to a constant diameter before the polymer-rich phase solidifies. This leads to a membrane structure with small, interconnected pores. For a low molecular weight polymer, the growth period is shorter, but the growth rate is higher, which leads to bigger droplets overall. This is attributed to the lower viscosity of the polymer-rich phase. The membrane structure in this case is of large cellular pores. The addition of a low molecular mass co-polymer decreases the droplet size with increasing amount, resulting in smaller pores (Matsuyama et al., 2002a; Yave et al., 2005).
If OM is applied to NIPS, the movement of the coagulation front with time and the qualitative distinction between sponge-like and finger-like structure growth is observed (Matz, 1972). The movement follows Fick's first or second law of diffusion, depending on the investigated polymer system and on the properties of the non-solvent. The diffusivity decreases with increasingly softer non-solvents. That leads to a denser membrane with smaller pores and thicker skin, whereas high diffusivity promotes the growth of finger-like structures and high porosity membranes (Wang et al., 1998; Fan et al., 2002).
Another description of the coagulation front suggests three distinct linear correlations for its movement. They correspond to three consecutive gelation steps. First, the formation of a skin layer, second the formation of a transition layer and third the formation of a sub layer. These layers can be distinguished in the cross-section of the final membrane. It was found that low molecular weight polymer additives increase the gelation rate with increasing concentration, whereas a non-ionic surfactant does so only up to a certain concentration, at which the effect reverses (Qin et al., 2006a,b; Zhao et al., 2011; Fang et al., 2015). OM observations suggest that macrovoids emerge because of convective inflow of non-solvent into the polymer solution. The formation of a skin layer or a highly viscous gel layer at the air-side interface hinders macrovoid formation only if the hindrance exceeds the convective inflow on non-solvent (Guillen et al., 2013).
A humidity-controlled glove box allows the investigation of VIPS processes with OM. This setup showed an increase in pore size with an increase of relative humidity and a decrease in polymer concentration, due to coarsening of the polymer lean-phase by coalescence (Chae Park et al., 1999). It also demonstrated the occurrence of spinodal decomposition at the early stage of the membrane formation and the subsequent formation of a liquid surface layer on top of the air-side interface (Lee H. J. et al., 2004; Menut et al., 2008). A hydrophilic co-polymer increases non-solvent diffusivity. OM analysis suggests this is due to the enhanced hydrophilicity of the polymer solution, rather than the decrease of polymer solution viscosity (Venault et al., 2016).
With OM, phase separation phenomena, such as the rate of structure formation and its appearance are directly observable. Thereby, instantaneous and delayed demixing are distinguished and whether the membrane morphology is going to be sponge-like or finger-like may be predicted up to a certain point. The effects of additives, solvents and non-solvents, as well as the effects of variations of process parameters on the kinetic progression of the phase inversion process can also be investigated. However, OM gives only limited information on the behavior of the non-solvent and no information on the behavior of the solvent. A further limitation is the sample preparation. The sample is placed in the gap between two microscope slides. The ratio of air-side interface area to the polymer solution thickness is much smaller than during industrial scale or lab-scale membrane preparation.
2.1.2.1.2. Confocal laser scanning microscopy
Another optical method uses confocal laser scanning microscopy (CLSM) to study in-situ and in real time the mechanism and the kinetics of structure formation during EIPS. A closed measurement cell with inlet and outlet facilitates the controlled evaporation of the solvent from the cast polymer film by perfusion of a defined gas flow (Metze et al., n.d.). Figure 4 shows the results of model cases for demixing by spinodal decomposition and by nucleation and growth.
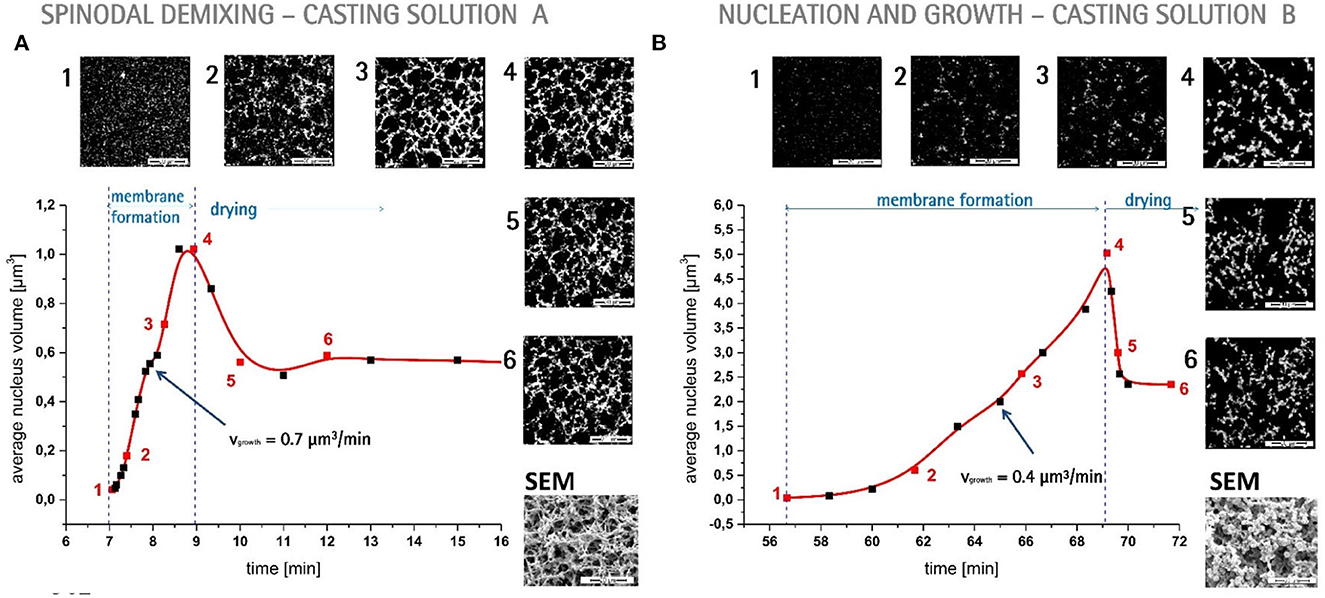
Figure 4. (A) The composition path crosses the binodal near the critical point, inducing spinodal decomposition. Membrane formation starts after 7 min and is finished after 2 min. (B) The initial composition of the casting solution contains less polymer. The composition path crosses the binodal below the critical point inducing nucleation and growth of polymer-rich particles in a polymer-lean matrix. Membrane formation starts after 1 h and lasts for 10 min. (A, B) bottom right: SEM images of the final membrane structures. Adapted from Metze et al. (n.d.) with permission.
2.1.2.1.3. Optical coherence tomography
Optical coherence tomography (OCT) is an emerging technique for non-invasive 3D imaging of scattering matter, similar to CLSM. OCT exploits low coherence interference of visual light for its depth resolution. It gathers intensity data at various depths simultaneously and thereby achieves a higher scan rate than CLSM. It is used for the direct observation of fouling, scaling and wetting phenomena of membranes (Liu et al., 2020, 2021; Shao et al., 2022). OCT applied to the NIPS process enables the measurement of the movement of the coagulation front as a function of time, similar to OM (Tu et al., 2021). The main advantage of OCT over OM is the ability of in-situ measurement of non-solvent indiffusion with an experimental environment similar to common membrane preparation techniques.
2.1.2.2. Light scattering methods
2.1.2.2.1. Light transmission method
Light scattering methods are transmission measurements that utilize light sources either of the entire visible spectrum or of a certain wavelength. After passing the sample, the remaining light is gathered by a photo detector that emits an electric current proportional to the transmitted light intensity. The light transmission (LT) technique was established by Reuvers (1987) in order to differentiate between instantaneous and delayed liquid-liquid demixing and to correlate the results with the emergence of finger-like and sponge-like membrane morphologies, respectively. Both demixing mechanisms are shown in Figures 2C c-1, c-2, respectively. LT tracks the progression of the membrane formation process by measuring the increasing turbidity of the polymer solution. The turbidity is due to the difference of refractive indices of the demixed phases. Figure 5 shows the experimental setup.
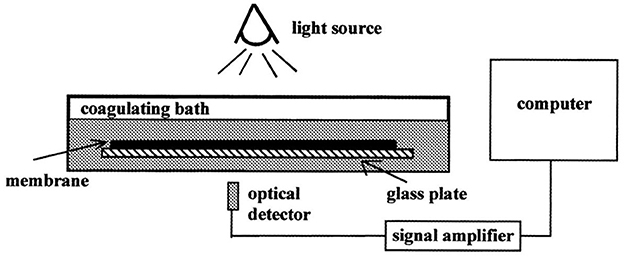
Figure 5. The LT experimental setup consists of a light source that shines a collimated light beam through a cast film that has been applied to a transparent support into a photo sensor. The light intensity is recorded as a function of time. The setup is complemented by a coagulation bath, a hot stage or a glove box with controlled airflow and humidity, depending on the investigated phase separation process. Reproduced from Machado et al. (1999) with permission.
By analyzing the plot of light intensity as a function of time, derived from a LT experiment, two parameters β and Imin can be defined. β = −dI/dt reflects the rate of solidification of the membrane. Large β corresponds to a fast fixation of a looser membrane structure, whereas small β signifies slow gelation and a denser membrane structure. Imin = I/I0 = const is defined as the light transition intensity when β = 0. It reflects the density of the membrane and a denser membrane has a higher Imin value. On a side note, large macrovoids also increase the Imin value. With these parameters, Reuvers' theory of instantaneous and delayed demixing and their implications on membrane structure is complemented with a semi-quantitative analytical method (Hao and Wang, 2003).
In case of a volatile solvent, the membrane formation during TIPS is initiated by a change of temperature or a change of concentration due to solvent evaporation, since both factors change the thermodynamic stability of the polymer solution. A comparison of LT studies of a closed and an open system differentiate the effects of said factors on the membrane morphology. IN this case, the system boundaries are the confines of the polymer solution. A closed system eliminates evaporation as a means of membrane formation mechanism so only the change in temperature has an effect. An open system under isothermal conditions allows the investigation of the role evaporation plays during the phase inversion process. With this approach, phase separation mechanisms such as liquid-liquid demixing and solid-liquid demixing, as well as various solidification mechanisms such as gelation and vitrification or crystallization can be investigated, and a wide range of membrane morphologies is obtained (Luo et al., 2003).
During NIPS, LT experiments show the effects of changes of composition on precipitation kinetics. An increasing solvent content in the non-solvent bath shows a decreasing precipitation rate associated with a dense, sponge-like morphology, whereas a decrease of polymer content in the polymer solution leads to an increasing precipitation rate associated with a finger-like structure and the possibility of macrovoid formation (Madaeni and Bakhtiari, 2012). In another case, the increase of the solvent ratio in the coagulation bath led to the observation of an oscillatory behavior of precipitation kinetics and macrovoid formation. A qualitative model was proposed that considered three distinct layers in the cast film, each with different mass transfer resistances controlling the precipitation rates of the respective layer and thereby the morphology (Machado et al., 1999).
Non-solvents may be distinguished by their ability to promote phase separation. In a given polymer/solvent system a hard non-solvent presents a large miscibility gap and generally promotes instantaneous demixing, which is associated with fast liquid-liquid phase separation and at least initial spinodal decomposition. By employing increasingly softer non-solvents, the miscibility gap shrinks and LT experiments illustrate a change from instantaneous to delayed demixing, which is associated with a change of morphology from finger-like to sponge-like, as well as the suppression of macrovoid formation (Fan et al., 2002). A combination of a crystalline polymer and a soft non-solvent shows delayed demixing that is associated with slow nucleation and growth and solid-liquid demixing (Cheng et al., 2001; Zuo, 2006).
The quality of a solvent correlates with the viscosity of the polymer solution. A good solvent yields a low viscosity polymer solution and vice versa, given that all other system parameters remain constant. If a good and a bad solvent for a given polymer/non-solvent system show similar precipitation rates but lead to different membrane structures, this can be attributed to differences in the respective phase diagrams and associated thermodynamic properties. A bad solvent shows a wide miscibility gap and a gelation point close to the binodal. This leads to a high viscosity, low mobility polymer-rich phase after the initial demixing. That hinders the further progression of the phase separation process. Thus, the growth of the polymer-lean phase stops early and an isotropic dense membrane structure remains. A good solvent on the other hand shows a comparatively narrow miscibility gap and a gelation point further away from the binodal, which leads to an increased time between onset of turbidity and fixation of membrane morphology by crossing of the gelation point (Kim et al., 2001).
Additives, such as water-soluble polymers and nanomaterials both show an enhanced descending rate β during LT experiments with increasing content. Both additives reduce the thermodynamic stability of the system and increase its viscosity. In this case, the decrease in thermodynamic stability outweighs the rheologic hindrance, which leads to a faster phase inversion (Zhao et al., 2011). The addition of a low molecular weight alcohol as a non-solvent additive (NSA) to a polymer solution leads to the opposite effect. Here, the reduced thermodynamic stability of the system outweighs the increase of polymer solution viscosity, resulting in a decreasing precipitation rate with increasing NSA content (Li et al., 2008).
During VIPS, LT experiments indicate that an increase of polymer chain length accelerates the demixing process by switching from a slower nucleation and growth mechanism to a faster spinodal decomposition process. Compared to NIPS, the phase inversion is about ten times slower (Zeman and Fraser, 1993, 1994; Li et al., 2008).
In summary, LT experiments can distinguish between instantaneous and delayed demixing. In case of a semi-/crystalline polymer, it distinguishes liquid-liquid from solid-liquid demixing. The demixing mechanism influences the membrane morphology. As a rule of thumb, the faster the demixing the more porous the membrane becomes. In combination with thermodynamic data of the investigated system, LT reveals if the phase separation process is controlled thermodynamically or kinetically. Furthermore, it shows the influence of additives on precipitation kinetics. A limitation of the technique is its purely qualitative description of the phase inversion process. This limitation is overcome by analyzing the LT plot and introducing semi-quantitative parameters.
2.1.2.2.2. Small angle light scattering method
The small angle light scattering (SALS) technique is similar to the LT approach. Additionally, SALS determines the dependence of the scattered light intensity I from the scattering angle θ or the corresponding wavenumber q. Figure 6 shows a schematic representation of a SALS experimental setup. By analyzing the plot of I against θ or q, the initial phase separation mechanism can be determined.
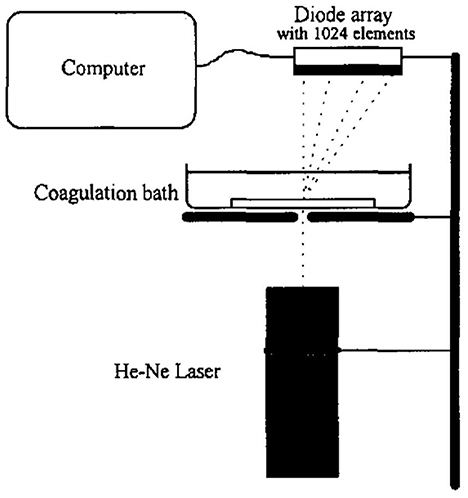
Figure 6. The SALS experimental setup consists of a collimated monochromatic light source, e.g., a He-Ne laser, a transparent casting support and a photo sensor array. The laser beam is applied perpendicular to the cast film and shines through it. The detector gathers the scattered light intensity as a function of the scattering angle and time. Reproduced from Nunes and Inoue (1996) with permission.
A monotonic decrease of the scattered light intensity is associated with a nucleation and growth mechanism. At a fixed angle or wavenumber, an increase of scattered light intensity with time is fitted to the following power law, where K is the growth constant, t is time, and τ is the time at which phase separation sets in.
If a plot of logI vs. logt gives a straight line, the slope supplies a value for n. A slope close to 3 indicates heterogeneous nucleation, whereas a slope close to 4 indicates homogenous nucleation. Other values for n are inconclusive. According to linear Cahn theory, a maximum in the I against θ or q plot is associated with a spinodal decomposition mechanism. The angle or wavenumber of maximum scattered light intensity, can be directly correlated to the interphase periodic distance D of the bi-continuous structure observed during spinodal decomposition by the relationship.
Another requirement for spinodal decomposition, according to linear Cahn theory, is an initial exponential growth of the scattered light intensity with time at a fixed angle. The slope of the plot of ln I vs. time gives R(q), the amplitude growth rate of fluctuations with wavenumber q. R(q) depends on the thermodynamics as well as on the mobility of the system. Still, according to linear Cahn theory, if the relationship of vs. q2 is linear, then extrapolation to q = 0 gives an estimation of the apparent diffusion coefficient Dapp. Dapp depends both on thermodynamic and kinetic aspects of the system during phase separation (Inoue and Ougizawa, 1989; Nunes and Inoue, 1996).
SALS furthermore is a method capable of monitoring the morphological evolution of nascent membranes during later stages of the phase inversion process. Even if liquid-liquid demixing is initiated by spinodal decomposition, phase coarsening via coalescence or Ostwald ripening during later stages of phase separation may lead to a dispersed phase/matrix structure. This results in a final membrane morphology that lacks the high pore interconnectivity usually associated with spinodal decomposition (van Aartsen and Smolders, 1970). In case of ongoing spinodal decomposition during late stage coarsening, the position of the intensity maximum obeys the growth law.
where α is the growth exponent. A combination with Equation (2) implies that the cessation of domain growth affects the time progression of the scattering maximum. That enables the monitoring of the time and temperature dependence of the size scale of the bi-continuous structure and the arrest of growth due to solidification (Graham et al., 1997). Thus, the kinetics of liquid-liquid phase separation and crystallization can be quantified; insofar that thermal quenching above the crystallization temperature shows increasing domain growth with increasing quench depth and decreasing polymer concentration. Quenching below the crystallization temperature shows only brief coarsening before structure growth stops (Graham and McHugh, 1998).
SALS also supplies direct experimental evidence of the initial phase separation mechanism dependent on the polymer concentration. In case of a cellulose acetate/acetone/water system during NIPS, casting solutions with 11–17 wt.% cellulose acetate show initial spinodal decomposition, whereas nucleation and growth is found for casting solutions with cellulose acetate concentrations < 6 and > 25 wt.%. However, a comparison of the final membrane morphologies suggests a transition from the initial bi-continuous structure to a discontinuous morphology with spherical domains, before the system solidifies (Nunes and Inoue, 1996; Zoppi et al., 1999).
Furthermore, SALS supplies experimental evidence to theoretical ternary phase diagrams, by identifying the initial phase separation mechanism. The magnitude of Dapp and K reflects the phase separation rate during spinodal decomposition and nucleation and growth, respectively, and allows a qualitative assessment of the relative quench depth at which the phase separation takes place inside the miscibility gap (Barth et al., 2000; Schuhmacher et al., 2001).
To sum up, SALS reliably distinguishes spinodal decomposition from nucleation and growth. However, this observation only applies to the skin of the polymer film. Deeper layers of the film reach the thermodynamic conditions for demixing eventually, but enter the miscibility gap at different points. Therefore, different mechanisms of phase separation take place in different layers of the film. In addition, the initial membrane morphology evolves, depending on the mobility of the polymer-rich phase. The kinetics of annealing processes are described by coarsening and Ostwald ripening. As with LT, the SALS approach yields semi-quantitative kinetic parameters that describe the kinetic progression of the phase inversion. Both techniques cannot quantify any change of composition associated with this kinetic progression.
2.1.2.3. Cryo-SEM
Scanning electron microscopy (SEM) is a standard method to examine a membrane's final morphology. The method can also be used to investigate the structure evolution during phase separation. Snapshots of the nascent membrane's cross-section are made, by taking samples at different times after the initiation of phase separation. The samples are quenched in ice water, liquid ethane or liquid nitrogen. Due to the temperature gradient during sample preparation a shrinkage and possible deformation of the membrane structure is to be expected (Tsai and Torkelson, 1990; Zeman and Fraser, 1994; Graham et al., 1997; Graham and McHugh, 1998; Prakash et al., 2006; Kuo et al., 2008; Nakao et al., 2021).
2.1.3. Process kinetics of phase inversion characterized by measuring the change of composition
As mentioned in Section 2.1, moving the equilibrium state of the system out of the homogenous region initiates the membrane formation process by phase separation, as soon as the binodal is crossed. The phase separation process eventually comes to a halt due to an increase in viscosity of the polymer-rich phase, freezing the evolving structure in time and space. The composition path describes this progression. The composition path describes the change of composition of a particular plane inside the cast film with time (Su et al., 2017). The investigation of the timely progression of the composition path leads to correlations between the composition of the polymer solution and the process parameters on the one hand and the membrane morphology on the other hand.
2.1.3.1. Gravimetric method
During EIPS, the rate of composition change can be measured gravimetrically if the system consists of a polymer and a volatile solvent only, or additional components are considered non-volatile (Zeman and Fraser, 1994; Zhao et al., 2011; Sun et al., 2013). In order to describe the evaporation rate quantitatively the empirical equation.
was proposed by Hung and Feng. W is the weight of the cast film and the subscripts 0, t and ∞ signify the weight before, during and after the EIPS process, respectively. b and m are empirical parameters characterizing the solvent evaporation rate. Rearranging Equation (4) suggests a linear relationship.
between the left side of Equation (5) and logt with a slope of m and an intercept of logb. Both the values of m and b tend to increase with an increase of evaporation temperature and/or a decrease of film thickness (Huang and Feng, 1995).
During VIPS, a normalized volatile molecules ratio Ns in gram of volatile molecules (i.e. solvent and non-solvent) per gram of polymer may be introduced. Ns shows distinct behaviors with time, depending on the relative humidity. Under dry conditions, a monotonic decrease of Ns signifies an expected EIPS characteristic of the system. In a humid atmosphere an initial increase of Ns followed by a decrease confirms emergence of a liquid layer of volatile components on top of the cast polymer solution (Menut et al., 2002; Caquineau et al., 2003; Tsai et al., 2006; Sun et al., 2013). A limitation of this technique is its lack of spatial resolution, as no concentration gradients along the cross-section of the cast film can be resolved. Furthermore, a coagulation path cannot be determined, because different volatile species cannot the distinguished since only the nett change of mass is detected.
2.1.3.2. Spectroscopic methods
2.1.3.2.1. Fourier transform infrared microscopy
It is a challenging endeavor to determine local compositions inside the film experimentally, because the change of composition occurs very fast (often < 1 s) and the film is rather thin (often < 200 μm) (Mulder, 1996). Light scattering techniques such as infrared spectroscopy and Raman spectroscopy characterize the composition path, even under those conditions. As mentioned in Section 2.1.2.1, researchers developed the OM technique to observe the movement of the coagulation front and the formation of the membrane during NIPS (Matz, 1972). With this technique, the inflow of non-solvent can be measured qualitatively. The outflow of solvent cannot be observed. These limitations are overcome by Fourier transform infrared microscopy (FTIRM). FTIRM is a transmission sampling method with a focus area of 20 × 300 μm. This size is necessary to get enough energy intensity for analysis (Sammon et al., 2002). Figure 7 shows the sample preparation and measuring procedure.
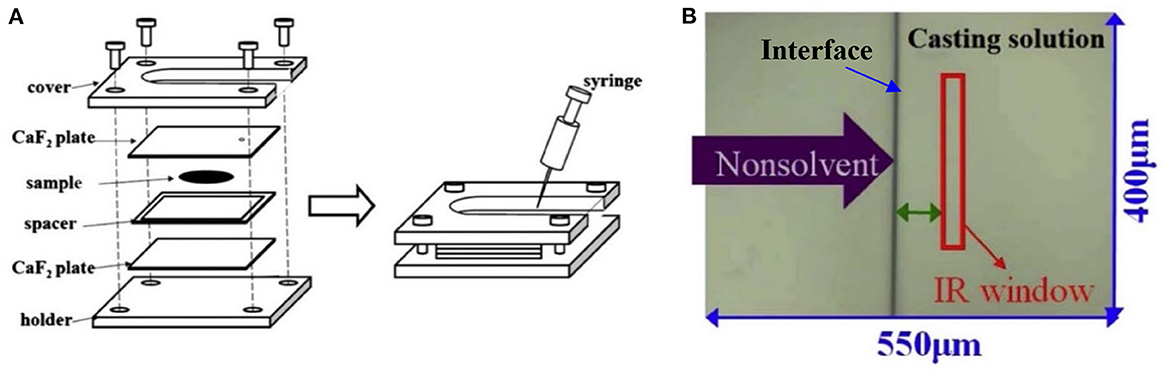
Figure 7. (A) Schematic representation of an FTIRM measurement cell. The sample is put in the gap between two CaF2 plates that are separated by a spacer of 15 μm thickness to ensure transmission of the probing radiation. Reproduced from Kuo et al. (2008) with permission. (B) Sight from above through the measurement cell with the non-solvent approaching from the left side, the casting solution on the right side, the vertical phase interface in the middle and the focus area in red. Reproduced from Su et al. (2017) with permission. The method may also be applied during VIPS by introducing humid air instead of a liquid non-solvent into the gap (Tsai et al., 2010).
During NIPS and VIPS, FTIRM measures the time dependent change of composition of any dope component, such as polymer, co-polymer, additive, solvent, co-solvent and non-solvent simultaneously. The focus area may be on either side of the air-side interface, or any plane within the polymer solution. The temporal resolution is 1.1 s. The method complements the phenomenological observations made with OM, e.g. movement of the coagulation front, with information on the composition of the film and its change with time. Lin et al. (2002) showed that the gelation of the film prior to immersion into the non-solvent bath significantly lowers the penetration rate of the non-solvent from seconds to almost 20 min, thus suppressing the formation of macrovoids. The addition of a co-solvent decreases the exchange rate of solvent and non-solvent by forming a barrier that inhibits the indiffusion of non-solvent. A higher outflow rate of the co-solvent compared to the solvent leads to skin formation, due to an increase of polymer concentration at the air-side interface. This decreases the exchange rate of solvent and non-solvent even further und suppresses the formation of macrovoids (Tsai et al., 2002). In contrast, Kuo et al. (2008) showed how a decrease of polymer concentration near the air-side interface due to a solvent/non-solvent exchange ratio < 1 leads to the emergence of a bi-continuous structure that evolves into a nodular structure during late stage coarsening. Furthermore, the time the composition of the cast film remains in the metastable region between binodal and spinodal has an influence on the membrane structure. A short stay in the metastable region promotes spinodal decomposition, whereas if the stay in the metastable region is long enough to initiate nucleation, the structure changes from bi-continuous to cellular (Su et al., 2017).
This observation also applies to VIPS, as a shorter stay of the composition path in the metastable region is linked to a higher probability of spinodal decomposition (Su et al., 2009). The investigation of the composition path in addition to the analysis of the composition of the polymer-rich and polymer-lean phase determines whether phase separation occurs within the metastable region or by crossing the spinodal (Tsai et al., 2010). Furthermore, FTIRM documented an emerging liquid surface layer during VIPS. A mechanism that describes the implications of said liquid layer on the morphology of the membrane was proposed my Menut et al. (2008).
The FTIRM technique has certain limitations, such as the rapid saturation of the coagulation bath or vapor cloud due to the small volume of the liquid cell (Karimi and Kish, 2009). Consequently, the common boundary condition of constant concentration inside the coagulation bath or vapor cloud does not hold. Due to FTIRM being a transmission sampling method, the interface between coagulation medium and polymer solution is very thin (~15 μm). The experimental setup therefore does not adequately represent the interface conditions of an industrial scale, or even a lab scale membrane production environment. Finally, the boundary effect of the casting support is not considered during FTIRM (Tsai et al., 2010).
2.1.3.2.2. Attenuated total reflectance-fourier transform infrared spectroscopy
The aforementioned limitations of FTIRM are overcome by attenuated total reflectance-fourier transform infrared spectroscopy (ATR-FTIR) spectroscopy. ATR-FTIR is a contact sampling method with limited penetration depth. Figure 8 shows the experimental setup.
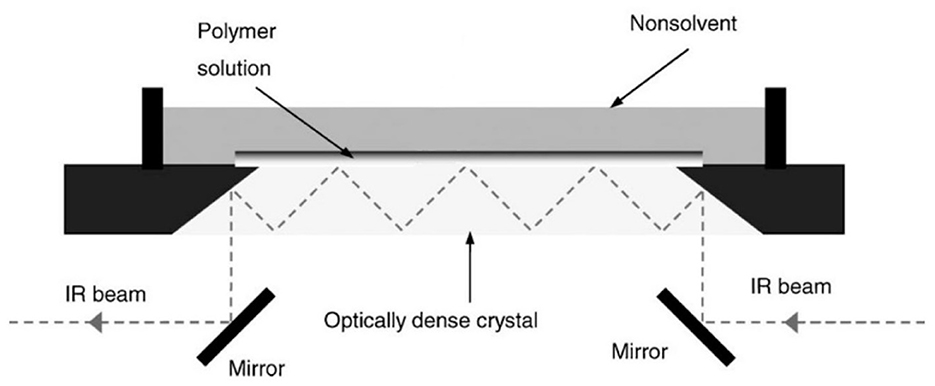
Figure 8. Schematic representation of the cross-section of the ATR-FTIR measurement cell with bottomless liquid cell for the investigation of NIPS. For EIPS, the liquid cell is not needed. The polymer solution is applied directly onto the ATR prism. Adapted from Karimi and Kish (2009) with permission.
The ATR crystal material has a high refractive index that reduces the effective wavelength of the infrared light by retardation. This improves the spatial resolution compared to FTIRM (Sammon et al., 2002). The penetration depth of the probing radiation is limited by its wavelength and the refractive indices of the ATR crystal and the polymer solution, resulting in an effective penetration depth of < 5 μm. The change of the refractive index of the polymer solution due to diffusional processes during the phase separation process also needs to be considered. The temporal resolution is 0.2 s. With a fixed penetration depth of the IR radiation, the film composition at different distances from the air-side interface is measured by applying the polymer solution with varying thickness.
During TIPS, ATR-FTIR enables the measurement of concentration gradients along the cross-section of cast film, thus overcoming the main limitation of the gravimetric method discussed in Section 2.1.3.1 (Zeman and Fraser, 1994).
During NIPS, the composition path of specific horizontal planes inside the cast film is determined by measuring the change of the ratio of solvent and non-solvent content. A ratio >1 implies a higher solvent outflow than non-solvent inflow. This is associated with a sponge-like membrane morphology, whereas a ratio < 1 is associated with a finger-like structure (Karimi and Kish, 2009). The diffusivity of various non-solvents investigated with ATR-FTIR ranks in the following order: water > methanol > ethanol > n-propanol > n-butanol. Decreasing diffusivity is associated with a suppression of macrovoids and a change from defect-free to defective skins (Fan et al., 2002). After the membrane formation process is complete, residual substances, e.g. solvent, remain in the membrane, with increasing concentration toward the support-side interface. These may cause redissolution and redemixing of the polymer during the drying step, if the membrane is not rinsed properly. With ATR-FTIR, the presence and the concentration of residual substances is detectable (Tsai et al., 2009).
2.1.3.2.3. Micro-Raman spectroscopy
Another spectroscopic technique to analyse the chemical composition of a polymer solution is micro-Raman spectroscopy (MRS). A possible experimental setup combines a laser as a light source with a CLSM as sample carrier. Such a CLSM setup has a focalization cylinder of 1 mm in diameter and 6 mm in depth (Menut et al., 2008). MRS is a promising technique to investigate diffusion processes close to the air-side interface by quantifying the composition on the side of the coagulation bath and on the side of the polymer solution. During NIPS, the exchange rate of solvent and non-solvent through the air-side interface can be correlated with the extend of skin formation and show how this in turn influences the membrane morphology (Kim et al., 2000). During VIPS, the measurement of the change of composition at the air-side interface with time shows how dry and humid air affect the membrane morphology (Menut et al., 2008).
Compared to FTIRM, MRS has an increased spatial resolution but a reduced sensitivity. For instance, it cannot detect low quantities of water. Because of a similar experimental setup as FTIRM, MRS also suffers from the same limitation, mentioned in Section 3.1.3.2.1 (Andersen and Muggli, 1981; Menut et al., 2008; Nakao et al., 2021).
2.1.4. Overview of experimental methods
In an attempt to condense the information presented in the foregoing sections further, Table 1 summarizes the experimental methods. Each method is analyzed with regard to what kind of information it can retrieve and how its spatiotemporal resolution is.
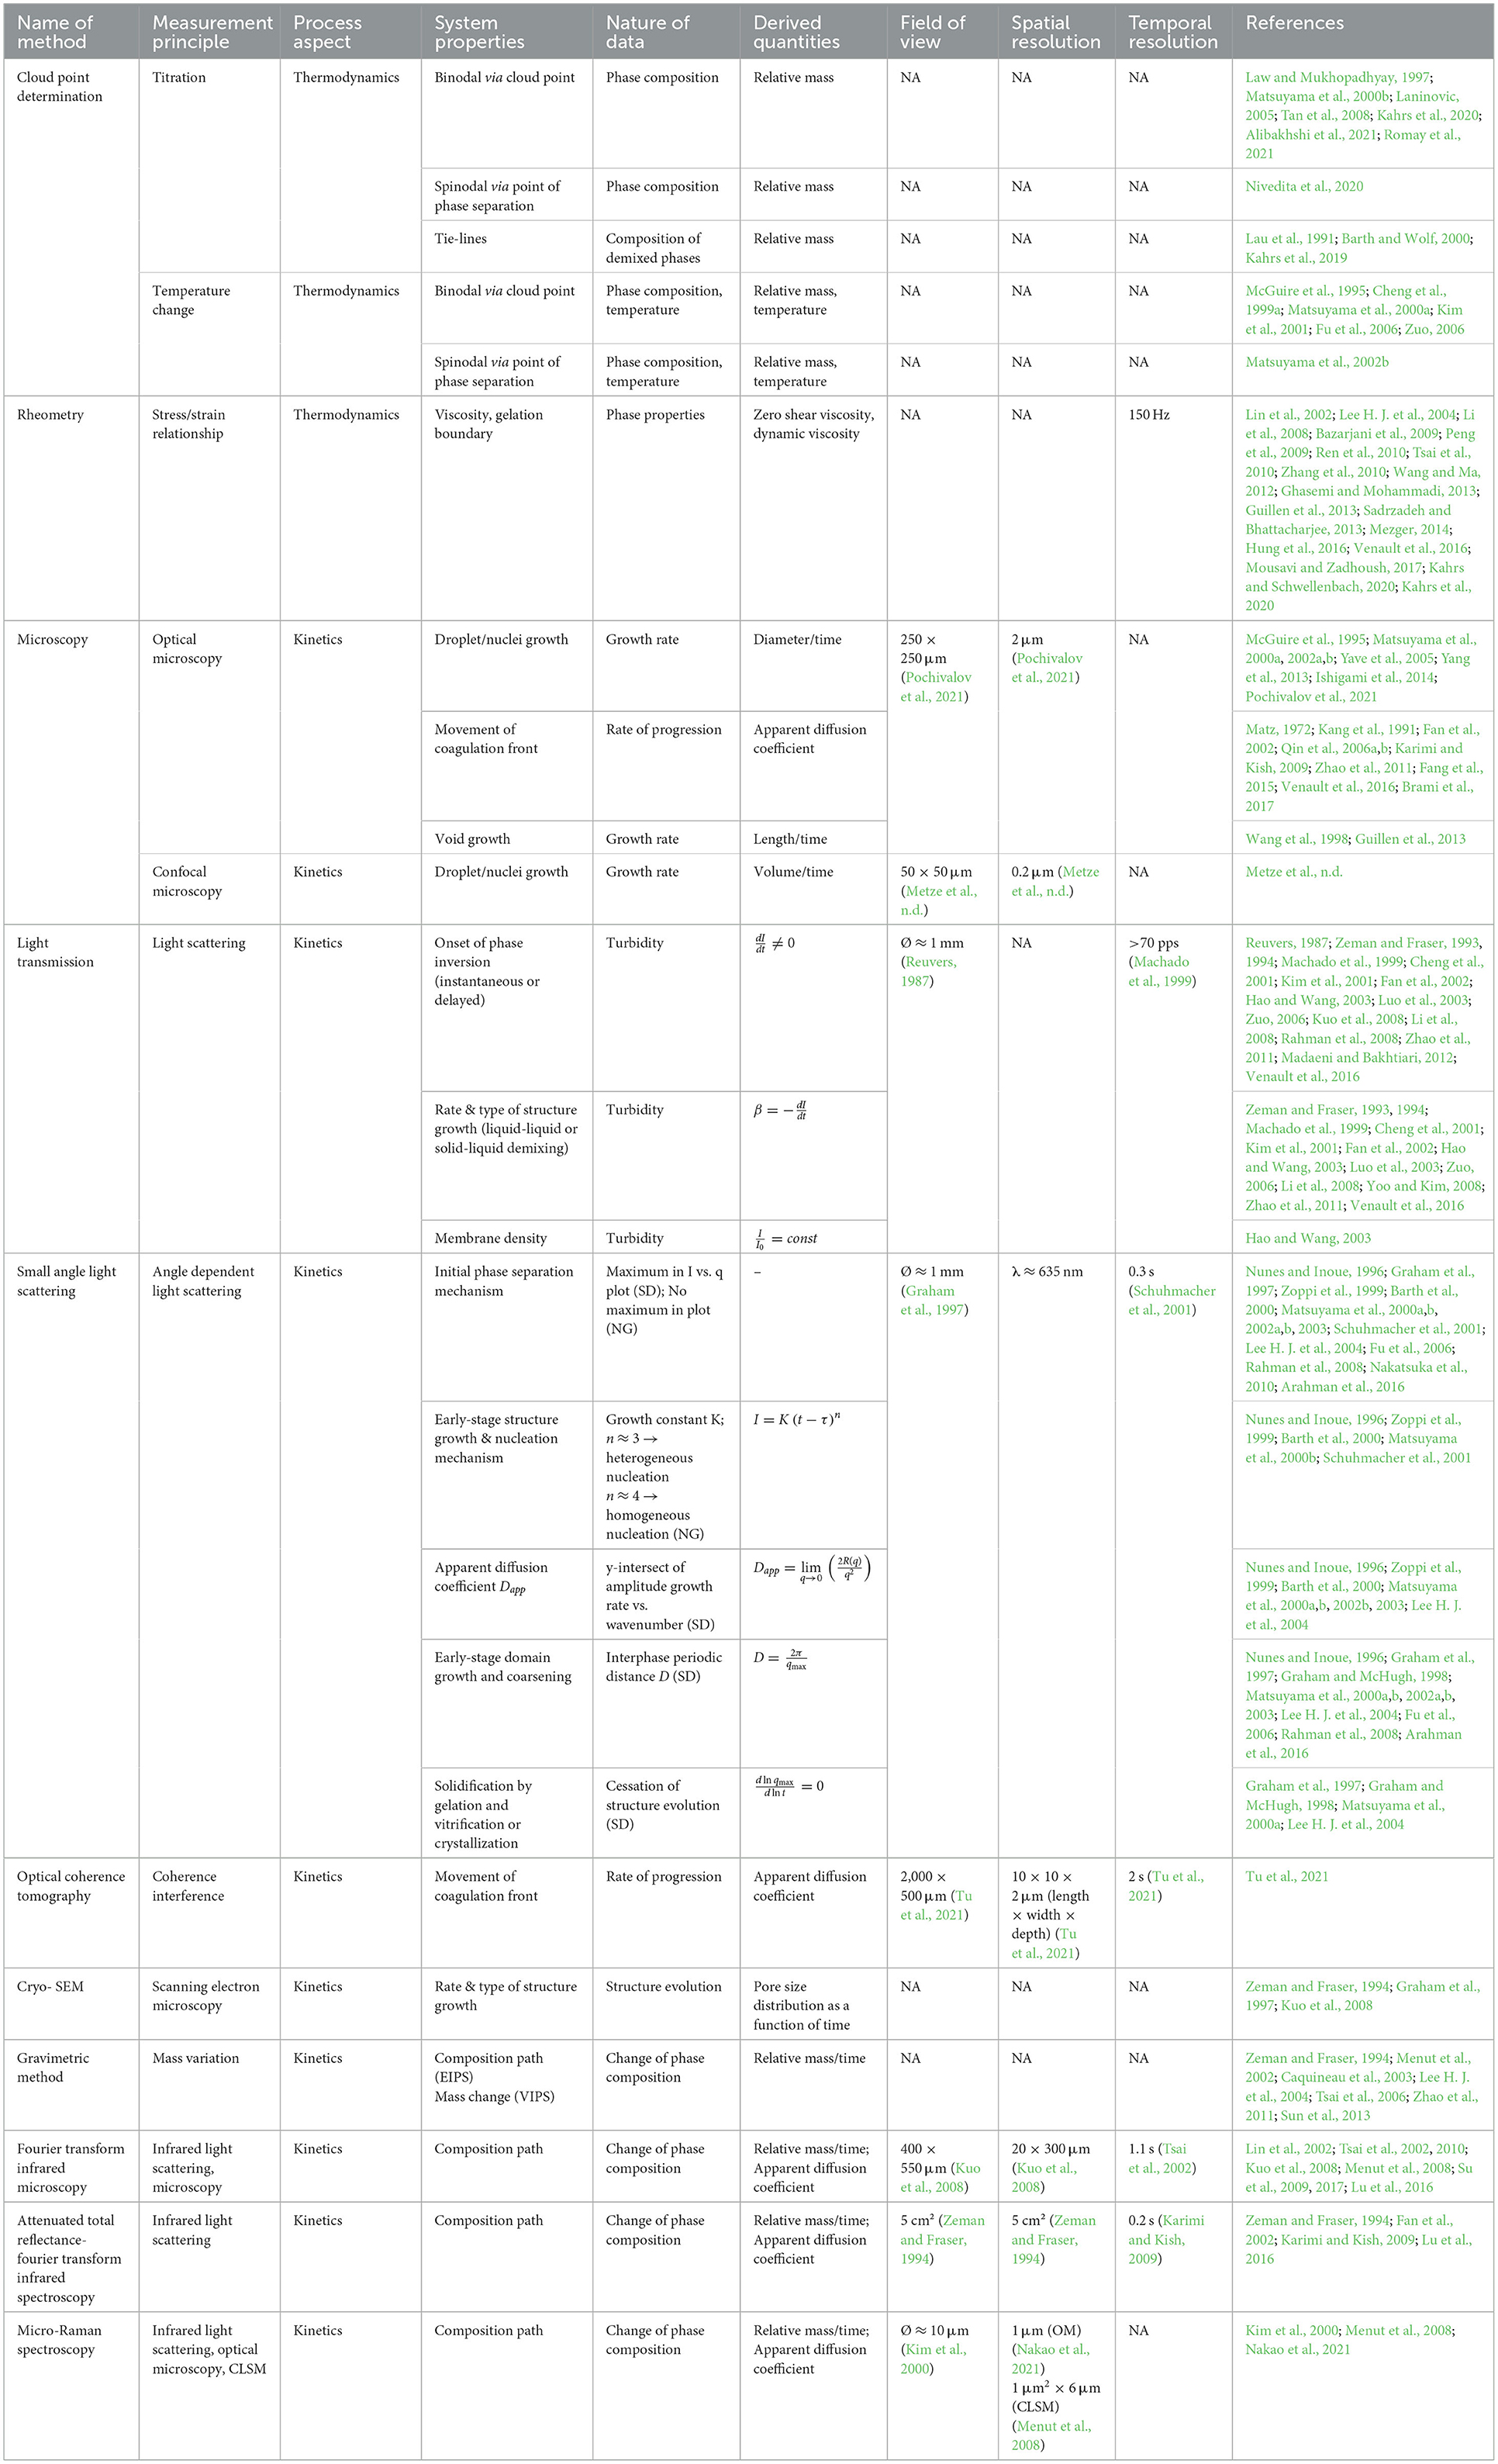
Table 1. Summary of experimental methods for the characterization of membrane formation processes.
2.2. Computational methods for membrane formation characterization
In the following section, a general overview of the computational methods for membrane formation characterization will be given. The approaches are categorized according to their spatiotemporal resolution ranging from macroscopic to microscopic. Subsequently, the mesoscopic phase-field method will be elucidated further, since its ability to resolve the microstructure evolution of membrane formation in the μm scale for up to several seconds makes it especially valuable approach.
Macroscopic transport models are continuum models that describe mass and heat transfer and associated changes in phase composition during phase separation processes, going back to the 1970's (Anderson and Ullman, 1973). Depending on the investigated phase separation process, various combinations of mass and heat transfer need to be considered by the model, as depicted in Figure 1. A model for TIPS usually only considers heat transfer (Matsuyama et al., 1999; Li et al., 2006). EIPS and NIPS (McHugh and Yilmaz, 1985; Yilmaz and McHugh, 1986, 1988; Tsay and McHugh, 1990; Lee et al., 2010; Khansary et al., 2017) usually only involve mass transfer under isothermal conditions, whereas VIPS (Tsay and McHugh, 1991; Shojaie et al., 1994a,b; Tan et al., 1995; Khare et al., 2005; Bouyer et al., 2010; Bouyer and Pochat-Bohatier, 2013) couples heat and mass transfer, due to latent heat effects during condensation and/or evaporation. Figure 9 shows a state-of-the-art calculation of a ternary phase diagram with numerically calculated paths, initially representing the average film composition and after demixing the relative compositions of the polymer-rich and polymer-poor phase.
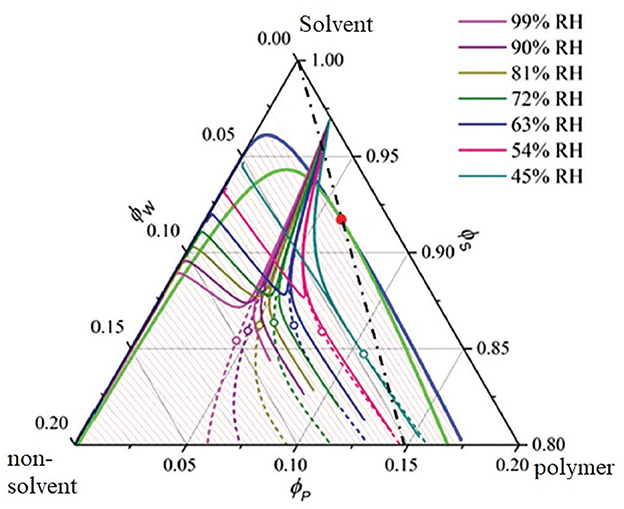
Figure 9. A ternary phase diagram of a PVDF/cyclohexanone/water system undergoing VIPS. The colored lines emerging from a single point on the solvent axis indicate the numerically simulated composition trajectories associated with different relative humidity. Demixing occurs at the points where the solid and the dashed lines split and the open symbols (∘) indicate the phase separation. Adapted from Dehsari et al. (2017) with permission.
Initially, computational modeling of membrane formation was a means to understand the underlying processes in their mechanistic details and to predict the effects of parameter variation and not for a priori predictions of membrane properties with substance data & boundary conditions (i.e., process parameters) alone.
2.2.1. Scope of microscopic and mesoscopic computational approaches
In contrast to the top-down approach of macroscopic transfer models, microscopic molecular or particle based computational approaches such as molecular dynamics (MD) (Bhattacharya et al., 1998; Lee, 1999; Gee et al., 2006; Luo and Jiang, 2010; Zausch et al., 2010; Liu et al., 2011; Singh et al., 2014), dissipative particle dynamics (DPD) (He Y.-D. et al., 2011; Tang et al., 2016; Wang et al., 2017; Lin et al., 2018; Jiang et al., 2020) and Monte Carlo (MC) (Torrie and Valleau, 1977; Hayward et al., 1987; Yaldram and Binder, 1991; Huang and Feigenson, 1993; Glotzer et al., 1994; Lomakin et al., 1996), as well as mesoscopic approaches including self-consistent field (SCF) model (Glotzer, 1994; Müller and Binder, 1998; Drolet and Fredrickson, 1999; Reister et al., 2001; Ceniceros and Fredrickson, 2004; Sides and Fredrickson, 2004; Wang et al., 2004, 2008; Zhang et al., 2011; Sandhu et al., 2013) and phase-field (PF) models (Badalassi et al., 2003; Wang et al., 2012, 2019, 2020; Kouijzer et al., 2013; Tree et al., 2017; Ronsin et al., 2020), use a bottom-up approach.
MD simulations are usually on the atomistic scale and the calculation is based on Newton's second law of motion by properly formulating the potentials for polymer solutions, such as Weeks-Chandler-Andersen (WCA) potential (Heyes, 2007; Ahmed and Sadus, 2009; Zhou et al., 2020), Lennard-Jones (LJ) potential (Koura and Matsumoto, 1991; Bouanich, 1992; Smit, 1992; Semiromi and Azimian, 2011; Geada et al., 2018), and finite extensible non-linear elastic (FENE) potential (Hyon and Liu, 2010; Barrett and Süli, 2011; Morthomas et al., 2017).
DPD also employs Newton's second law. The concept of a particle representing a cluster of monomers is adopted in this method and the corresponding simulations predict microstructural evolution of membranes on the mesoscopic scale (Hu et al., 2017) (see Figure 10A). In contrast to the conventional all-atom MD simulation, coarse grain MD (Saiz et al., 2002; Loison et al., 2004; Wohlert et al., 2006; Bond et al., 2007; Brocos et al., 2012; Hakobyan and Heuer, 2013; Periole, 2017; Crespo et al., 2020) has been developed to compute membrane structures at scales larger than atomistic length (see Figures 10B–D). The concept of coarse grain MD is similar to DPD, where a rigid-body nanoparticle is used to represent several beads of polymer monomers.
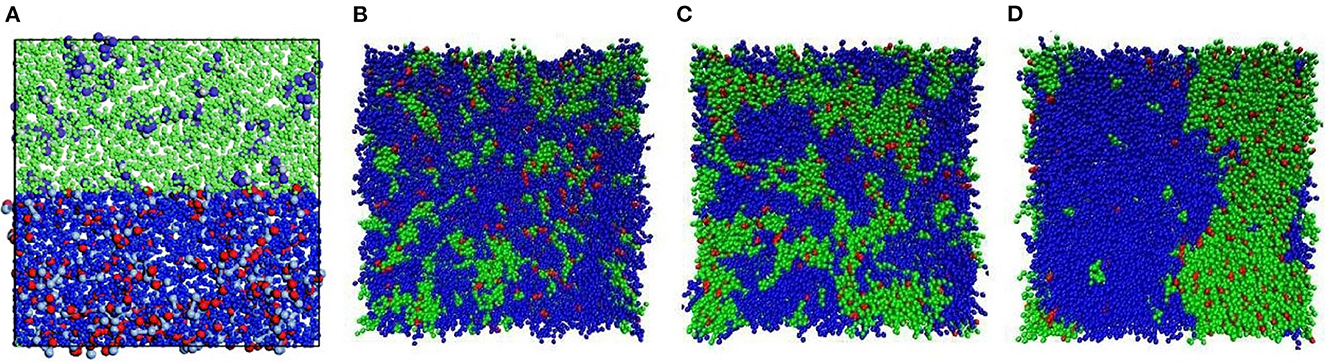
Figure 10. (A) DPD simulation for a membrane structure consisting of hexane (green), water (blue), TMC (violet), and BDSA (red). Adapted from Hu et al. (2017) with permission. (B–D) Coarse grain MD simulations for a membrane bilayer consisting of DPPC (green), DUPC (blue), and CHOL (red) at the time 0, 100 ns, and 12 s, respectively. Reproduced from Hakobyan and Heuer (2013) with permission.
In contrast to the use of deterministic equations to simulate the membrane structure in MD and DPD, the random sampling method MC has sometimes been used to simulate the deterministic behavior of microstructural evolution of membranes. Depending on the sampling object, one monomer or a bead consisting of several monomers, there are atomistic and mesoscopic MC approaches (Dodd and Theodorou, 1994; Pant and Theodorou, 1995; Groot, 2000; Yamamoto and Hyodo, 2003; Deserno, 2009; Groves et al., 2010; Pandey and Doxastakis, 2012).
The last two methods, SCF and PF models are a kind of mean-field theory within the context of thermodynamics. Herein, a local polymer composition field φ = (φ1, φ2, ⋯ ,φK) is introduced to formulate the free energy functional F(φ) of the system. The notation φi represents the composition of the i-species in the polymer solution and K denotes the total number of species. An often-used assumption in the mean-field theory is a Gaussian chain for the polymer beads (Flory, 1942, 1953; Sariban and Binder, 1987; Shull and Kramer, 1990). The membrane structure is obtained by minimizing the free energy functional. In contrast to atomistic methods, the benefit of the mean-field methods is to simulate the microstructural formation of membranes at comparatively large time scales, where the effect of hydrodynamics comes into play. A summary of the computational methods for modeling the formation of polymer membranes is tabulated in Section 2.2.3. In the following, we will particularly review the application of the phase-field method to simulate the formation of membrane structures.
There are two types of phase-field approaches in literature for the study of membrane structure evolution. The first one is the Allen-Cahn-type phase-field model (Allen and Cahn, 1972, 1979) formulated for non-conserved order parameters. This model is rarely used to investigate the formation of membrane structures (De Masi, 1994; Capuzzo Dolcetta et al., 2002; Shen and Yang, 2010; Lee and Lee, 2014).
The second one is the Cahn-Hilliard-type phase-field model elaborating conserved field variables, which is the most common one for the study of membrane structures (Cahn and Hilliard, 1958; Pego, 1989; Lowengrub and Truskinovsky, 1998; Dai and Promislow, 2013; Zheng et al., 2015; Avalos et al., 2016; Cabral and Higgins, 2018; Hopp-Hirschler et al., 2019). This approach is usually coupled with the Flory-Huggins (FH) model, which is a mean-field method to formulate the free energy density of polymer solutions. The advantages and disadvantages of the FH model for polymer solutions have been discussed in Donnelly et al. (2015), Jamali et al. (2015), Nguyen et al. (2017), and Loo et al. (2019). The FH free energy density is expressed as
where kb is the Boltzmann constant and T represents the temperature. The parameter Ni stands for the degree of polymerization, and χij and χijk are the so-called Flory parameters. For a binary system, when the Flory parameter χij is proportional to T and 1/T, the T-φ phase diagram of the polymer solution has an upper and lower critical point, respectively (Teraoka, 2002; Dudowicz et al., 2015). For membrane formation systems containing more than two components, higher order interaction parameters, like χijk, need to be considered to construct the multicomponent and multiphase phase diagram. Based on the T-φ phase diagram, the microstructure of a membrane is formed either via classic nucleation and growth or via spinodal decomposition, depending on the initial composition and temperature. Phase separation induced membrane structure development usually leads to a porous microstructure. Depending on different physical mechanisms for the phase separation in polymer solutions, phase-field studies on the formation of membrane structure are reviewed in the next sections.
2.2.2. Modeling microstructure evolution with phase-field approach
The spatiotemporal scale of mesoscopic phase-field models is sufficient to depict the microstructure evolution of a membrane, which can be formed via TIPS (Lee K.-W. D. et al., 2004; Tegze et al., 2005; Saylor et al., 2007; Zhang et al., 2008; Asai et al., 2009; Li et al., 2012; Mino et al., 2015; Hou et al., 2016; Zhu et al., 2016; Cervellere et al., 2019), EIPS (Dayal and Kyu, 2006; Buxton and Clarke, 2007; Wodo and Ganapathysubramanian, 2014; Zoumpouli and Yiantsios, 2016; Cummings et al., 2018; Negi et al., 2018; Rabani et al., 2021; Tang and Müller, 2021), NIPS/VIPS (Wodo and Ganapathysubramanian, 2012; Sun et al., 2017; Hopp-Hirschler and Nieken, 2018; Tree et al., 2018, 2019; Garcia et al., 2020; Padilha Júnior et al., 2020; Cervellere et al., 2021; Fang et al., 2021; Zhang et al., 2021), and polymerization induced phase separation (PIPS) (Kim and Palffy-Muhoray, 1993; Chan and Rey, 1997; Oh and Rey, 2000, 2001; Lee et al., 2003; Higuchi et al., 2013; Ghaffari et al., 2019, 2021; Dong et al., 2021).
Figure 11A shows the microstructure formation of PVDF/DPC solutions due to TIPS from phase-field modeling. The inset in Figure 11A illustrates the free energy density as a function of the polymer composition constructed from the FH model at different temperatures. The simulation results indicate that the microstructure of membranes is significantly affected by the initial composition and temperature. With varying the polymer content and temperature, there are three typical microstructures: polymer-rich droplet, bi-continuous structure, and polymer-lean droplet. Thus, a quench of the polymer solution from a high to a low temperature can lead to various membrane structures. This feature motivates us to produce anisotropic membrane structures by imposing a temperature gradient, as depicted in Figures 11B, C. In this consideration, a low temperature T = 298 K is fixed at the right boundary and the temperature inhomogeneously decreases with time inside the simulation domain according to the 1D solution of the heat diffusion equation. Because of the non-uniform temperature in the horizontal dimension and the decrease of the temperature with time, membrane structure with a spatial gradient in the pore size is obtained. TIPS via phase-field simulations has also been studied in Rogers (1989), Graham et al. (1997), Barton and McHugh (1999), and Goyal et al. (2021).

Figure 11. Membrane microstructure formed via thermally quenched phase separation (A–C) and non-solvent induced phase separation (D). (A) A T-φp phase diagram of PVDF/DPC solutions. Different phase separation microstructures are indicated in the phase diagram with respect to the initial polymer composition and the temperature. The inset illustrates the bulk free energy density at different temperatures. (B, C) Anisotropic membrane structure due to time-dependent temperature gradient at the time 0.358 and 0.894 s, respectively. (A–C) adapted from Cervellere et al. (2019) with permission. (D) Membrane microstructure via non-solvent induced phase separation in PES/NMP/water system. The pore size increases with rising NMP content in the non-solvent bath. Reproduced from Cervellere et al. (2021) with permission.
Furthermore, a polymer solution for the fabrication of membranes can contain more than two components, for example, polymer, solvent and non-solvent. When the polymer solution is in contact with a surrounding vapor phase, evaporation takes place at the liquid-vapor interface due to temperature gradient, composition/humidity gradient, or pressure gradient, referring to a T-φ-p phase diagram, where p is the pressure. Because of evaporation, the composition of the polymer in the liquid mixture varies because of the reduction of the solvent content. When the system crosses the spinodal, a membrane structure evolves via phase separation. Phase-field simulation for the membrane structure arising from EIPS has been carried out in Buxton and Clarke (2007), Zoumpouli and Yiantsios (2016), Cummings et al. (2018), Negi et al. (2018), Ronsin et al. (2020), and Rabani et al. (2021). In order to model the evaporation process, the Cahn-Hilliard-type phase-field model sometimes is coupled with the Allen-Cahn model (Ronsin et al., 2020; Rabani et al., 2021). It is noted that in literature, most studies focus on incompressible vapor phase (Buxton and Clarke, 2007; Zoumpouli and Yiantsios, 2016; Cummings et al., 2018) and the phase-field modeling of compressible vapor phase has not yet been fully explored.
Another mechanism for the membrane structure formation is NIPS/VIPS, which is quite similar to EIPS. When the polymer solution is in contact with a liquid or gaseous non-solvent phase, diffusion takes place at the interface due to the composition gradient of the non-solvent species. This mass transfer process changes the polymer composition in the polymer liquid mixture. Once the polymer composition lies inside the spinodal region, phase separation occurs. This phase separation process is shown in Figure 9. Apparently, this phase separation process is affected by the initial composition of the non-solvent species. Figure 11D illustrates an exemplary study of NIPS for a PES/NMP/water system. Here, PES is the polymer, NMP is the solvent, and water is the non-solvent. The polymer composition is fixed at 0.2. With an increase of the composition of NMP in the non-solvent bath from 0 to 0.4, the phase separation becomes more evident, and the pore size increases.
The membrane structure can also be obtained by PIPS, where the degree of polymerization evolves with time Np(t). At the initial stage Np = 1, the polymer monomer is homogenously mixed with the solvent. With time, the monomers react with each other, forming a polymer chain with an averaged number of monomers, Np > 1. By applying a lattice model, e.g., the FH theory, the entropy of the system changes due to the polymerization, which leads to a variation in the free energy density. The modified free energy gives rise to a miscibility gap in the phase diagram. The phase separation occurs once the liquid mixture is inside the spinodal region for a sufficiently large degree of polymerization. Phase-field modeling about polymerization induced membrane structure can be found in Kim and Palffy-Muhoray (1993), Chan and Rey (1997), Oh and Rey (2000, 2001), Lee et al. (2003), Higuchi et al. (2013), Ghaffari et al. (2019, 2021), and Dong et al. (2021).
The fabrication of membranes is usually conducted on a solid substrate. In this case, the interaction between the polymer solution and the solid wall has to be considered. This consideration leads to a wall potential energy γ(φs), where φs is the surface composition of the polymer species on the substrate, differing from the bulk composition. We refer to Cahn (1977), Gennes (1985), and Wang and Nestler (2021) for the calculation of the surface composition. The minimization of free energy functional at the boundary leads to a natural boundary equation at the solid substrate.
where n is the normal vector of the substrate. It is noted that the potential energy γ(φs) may include short- and long-range interactions (Giacomin, 1996; Giacomin and Lebowitz, 1997, 1998; Choksi et al., 2011; Liu et al., 2015; Mukherjee et al., 2016). The long-range interaction may be more relevant for polymer solutions. This additional constraint results in a membrane structure near the support with different pores than those in the bulk. An exemplary result for the wall effect on the non-uniform membrane structure is depicted in Figure 12. The wettability of the substrate has a significant influence on the formation of the membrane structure and is the subject of further modeling investigations. Other phase-field simulations about the influence of the wall on the membrane structure can be found in Puri and Binder (2002), Seol et al. (2003), Das et al. (2005, 2020), Henderson and Clarke (2005), Yan and Xie (2006), Yan et al. (2008), Michels and Moons (2013), Coveney and Clarke (2014), Tabatabaieyazdi et al. (2016), Schaefer et al. (2017), Shimizu and Tanaka (2017), Cummings et al. (2018), and Ghosh et al. (2020).

Figure 12. The wall effect on polymer-droplet size during the phase separation of a modeling binary polymer solution based on the FH free energy density. The bottom row from the left to right shows the time evolution of the microstructure at the plane of the substrate and the top row illustrates the corresponding phase separation microstructure at a parallel plane on top of the substrate. Reproduced from Goyal et al. (2021) with permission.
Fluid dynamics has been coupled with the phase-field equations to simulate the microstructure formation of membrane (Lowengrub and Truskinovsky, 1998; Jacqmin, 1999; Badalassi et al., 2003; Tegze et al., 2005; Zhang et al., 2008; Li et al., 2012; Wodo and Ganapathysubramanian, 2014; Hou et al., 2016; Zoumpouli and Yiantsios, 2016; Tree et al., 2018, 2019; Hopp-Hirschler et al., 2019; Wang et al., 2020). Most studies assume Newtonian flow for the polymer solution. This assumption might be reasonable at the initial/middle stages of phase separation, wherein the polymer solution is fully in the liquid state and the entanglement of the polymer chains is not relevant. However, at the late stage of phase separation, there is a gelation process of the phase separation structure (Tanaka et al., 1979; Hong and Wang, 2013; Wang et al., 2020; Dong et al., 2021), similar to a solidification process. The gelation of the polymer-rich phase takes place once a particular threshold for the polymer composition is reached in the polymer-rich droplet. The gelation process is characterized by a decrease in mobility and an increase in viscosity. For the gelation process, the viscoelastic stress due to the entanglement of the polymer chains plays an important role. Figure 13 shows the phase separation microstructure for three different cases: (I) Diffusion, (II) diffusion with viscous effect, and (III) diffusion with viscoelastic stress. In the cases I and II, the final structures contain only spherical polymer-rich droplets. If the simulation time is sufficiently long, the Ostwald ripening shall lead to a single droplet in the whole system. The viscous effect can certainly delay the Ostwald ripening process, but it cannot prevent it. The final microstructure consisting of spherical polymer-rich droplets differs from a realistic membrane structure. In order to prevent Ostwald ripening, a viscoelastic stress based on the so-called conformation tensor has been introduced considering the entanglement of Gaussian polymer chains. Because of the balance between the surface tension force and the viscoelastic force, a network structure is achieved, which is closer to a realistic membrane structure.

Figure 13. Phase-field modeling of the microstructural evolution of phase separation in a PVDF/DMF/water system for three different considerations: (I) Only with diffusion. (II) Diffusion with viscous effect. (III) Diffusion with viscoelastic effect. Reproduced from Yoshimoto and Taniguchi (2021) with permission.
2.2.3. Overview of computational methods
In an attempt to condense the information presented in the foregoing sections further, Table 2 summarizes the computational methods. Each method is analyzed with regard to its spatiotemporal resolution, its individual strengths, weaknesses and its recent advances.

Table 2. Summary of computational methods for modeling of membrane formation processes.
3. Discussion
3.1. Our understanding of membrane formation was substantially improved but it is not yet sufficient to accelerate the development of tailor-made porous polymeric membranes
We reviewed a selection of computational and experimental approaches for the investigation of non-equilibrium processes involved in the formation of porous polymer membranes. Sections 2.1.4 and 2.2.3 comprise of tabular summaries of the experimental and computational methods, respectively, allowing a direct comparison of the methods and further insight into their areas of applicability.
Although the application of such membranes in industrial processes is widespread and common these days, the description of the process kinetics of structure formation is far from complete.
A multicomponent polymer/solvent system for membrane formation brought into contact with a solid support, a gas phase and/or a non-solvent bath is subject to the complex interactions of numerous physical phenomena such as wettability of the support, solvent evaporation, non-solvent absorption, solvent/non-solvent diffusion, phase separation, hydrodynamic flow, viscoelasticity, gelation, vitrification, and crystallization. The dynamic interplay of these phenomena is described by an array of system properties and process parameters that in sum determine the final membrane morphology. It follows that membrane appearance and properties can be tailored by competent adjustment of these properties and parameters. The necessary parameters may be accessible through simulations and experiments.
Computational approaches suitable for the simulation of polymer membrane formation on significantly large time and length scales are continuum models, highly coarse-grained particle simulations and phase field models (Tang et al., 2021a). These methods yield T-ϕ phase diagram with binodal, spinodal, tie lines, and they correlate compositions inside the miscibility gap with the microstructural appearance of the phase-separated system. They are also able to incorporate boundary effects of the air-side as well as of the belt-side. Coupled with fluid dynamics they show a realistic coarsening during late-stage phase separation if the viscoelasticity of the polymer-rich phase is considered. A present limitation of the models is erroneous initial conditions and oversimplified assumptions, e.g., homogeneous system composition and temperature, to reduce computing cost. Furthermore, the solidification process via gelation and vitrification or crystallization needs further investigation (Müller and Abetz, 2021).
The experimental approaches considered in this review are mostly optical in-situ characterization methods. Cloud point determination characterizes the thermodynamics of the investigated system and yields T-ϕ phase diagram with binodal, spinodal, and tie lines. Optical and confocal microscopy show the growth kinetics of droplets and nuclei. Light transmission distinguishes instantaneous from delayed demixing as well as liquid-liquid demixing from solid-liquid demixing. SALS identifies the initial phase separation mechanism that takes place at the air-side interface. It also quantifies the structure and domain growth during the early stages of nucleation and growth and spinodal decomposition. If spinodal decomposition prevails during late stage phase separation, SALS also identifies the cessation of domain growth due to solidification. Cryo-SEM readily shows the rate and type of structure growth during all stages of phase separation. The gravimetric method determines the composition path during EIPS. The spectroscopic methods FTIRM, ATR-FTIR, and MRS extend the mapping of the coagulation path to NIPS, VIPS and TIPS processes by a spatiotemporal precise analysis of the cast film composition.
None of the aforementioned computational or experimental methods describes the evolution of the membrane structure from the initial demixing to the final solidification in its entirety. No approach can do it all because of the complexity of the involved multiphysics, such as thermodynamics and kinetics, diffusion and fluid dynamics, as well as the respective multiple time and space scales. However, by comparing the type of quantitative data generated by computational and experimental approaches, a substantial overlap is evident. Therefore, we propose a recursive cycle of experimental and computational efforts. Well-defined model experiments show the influence of certain system and process parameters. This helps to validate and improve the computational models. A combination of models is able to show how the spatiotemporal evolution of phase separation and structure formation unfolds. The result is a multi-scale description that ranges from the appearance of the entire membrane down to the properties of individual polymer chains. The ability of computational models to manipulate individual parameters not experimentally accessible helps with the determination of mechanisms of phase separation and shows the properties of these parameters outside their systemic framework. These theoretical insights and predictions in turn help guide the experimental efforts by offering targeted measures for membrane optimization. Thus, the cycle could be completed in its effort to improve our understanding of how the dynamically arrested non-equilibrium state, which a membrane is, comes about but there is still a long road ahead.
3.2. Seeking inspiration from recent progress achieved in the field of non-porous membranes
Despite decades of intensive research and the impressive improvement of our understanding of membrane formation, the development of porous polymeric membranes still relies on an iterative experimental approach that usually combines Design of Experiments (DoE) and a large number of experimental trials. Persistent difficulties to connect experimental and numerical methods and to establish synergies may shake both trust and faith in our current approach. At this point, it seems legitimate to question the appropriateness of the current methodology. We believe that the development of new membrane materials rests on a methodological pluralism and requires inter- and transdisciplinary collaboration. In this regard, we suggest seeking inspiration from related fields of technology. An excellent example is the substantial progress recently achieved in the field of non-porous membranes by means of the AI driven analysis of existing datasets from half a century of membrane research.
Focusing on the development of high performance reverse osmosis membranes (RO), Ritt et al. discuss the necessity to rethink the conventional guidance of scientists by means of periodically published permeability-selectivity trade-off curves. In this context, publications may be regarded as “snapshots of the status quo in membrane science.” Aiming at generating a broader and growing picture of the RO membrane landscape, the authors present the Open Membrane Database (OMD), which contains the physical and performance data obtained from the characterization of more than 600 water purification and desalination membranes. The corresponding data originated from peer-reviewed journals, patents and commercial products (Ritt et al., 2022). One of the key aspects of this work is the attempt to standardize and harmonize membrane related data by identifying adequate selection criteria and applying a standardized calculation method for membrane performance characteristics. The OMD may be used to feed and train AI algorithms enhancing the clarification of synthesis–structure–performance relationships in desalination technologies. In Rall et al. (2019), published an intriguing contribution entitled “Rational design of ion separation membranes” and related to the manufacture of layer-by-layer (lbl) nanofiltration membranes by step-wise assembly of polyelectrolytes as building blocks. Based on empirical data collected from the characterization of 63 modules, the authors developed an artificial neural network model with an integrated transport model (hybrid model) as a powerful tool to link the performance of lbl-nanofiltration membranes with the corresponding polyelectrolyte structure and properties. Transferring these methods to the development of tailor-made porous polymer membranes is conceivable and may emerge as a solution to bridge the gap and create synergies between membrane development and our understanding of membrane formation.
Author contributions
The original draft of sections introduction, experimental methods for membrane formation characterization, and discussion were written by SJB. The original draft of section computational methods for membrane formation characterization was written by FW. The manuscript was reviewed and edited by SJB, FW, MM, JLV, AS, MU, BN, and SB. Conceptualization by SJB and SB. Supervision by SB. All authors contributed to the article and approved the submitted version.
Funding
This research has received funding by the European Union's Horizon 2020 research and innovation program under grant agreement No. 958454—intelWATT Project.
Acknowledgments
FW are grateful to the VirtMat project VirtMat P09: Wetting Phenomena' of the Helmholtz association.
Conflict of interest
MM is employed by Sartorius-Stedim Biotech GmbH.
The remaining authors declare that the research was conducted in the absence of any commercial or financial relationships that could be construed as a potential conflict of interest.
Publisher's note
All claims expressed in this article are solely those of the authors and do not necessarily represent those of their affiliated organizations, or those of the publisher, the editors and the reviewers. Any product that may be evaluated in this article, or claim that may be made by its manufacturer, is not guaranteed or endorsed by the publisher.
References
Ahmed, A., and Sadus, R. J. (2009). Phase diagram of the weeks-chandler-andersen potential from very low to high temperatures and pressures. Phys. Rev. E Stat. Nonlin. Soft Matter Phys. 80 (6 Pt. 1), 61101. doi: 10.1103/PhysRevE.80.061101
Alibakhshi, S., Youssefi, M., Hosseini, S. S., and Zadhoush, A. (2021). Significance of thermodynamics and rheological characteristics of dope solutions on the morphological evolution of polyethersulfone ultrafiltration membranes. Polym. Eng. Sci. 61, 742–753. doi: 10.1002/pen.25613
Allen, S. M., and Cahn, J. W. (1972). Ground state structures in ordered binary alloys with second neighbor interactions. Acta Metallurgica 20, 423–433. doi: 10.1016/0001-6160(72)90037-5
Allen, S. M., and Cahn, J. W. (1979). A microscopic theory for antiphase boundary motion and its application to antiphase domain coarsening. Acta Metallurgica 27, 1085–1095. doi: 10.1016/0001-6160(79)90196-2
An, Y., Singh, S., Bejagam, K. K., and Deshmukh, S. A. (2019). Development of an accurate coarse-grained model of poly (acrylic acid) in explicit solvents. Macromolecules 52, 4875–4887. doi: 10.1021/acs.macromol.9b00615
Andersen, M. E., and Muggli, R. Z. (1981). Microscopical techniques in the use of the molecular optics laser examiner Raman microprobe. Anal. Chem. 53, 1772–1777. doi: 10.1021/ac00235a013
Anderson, J. E., and Ullman, R. (1973). Mathematical analysis of factors influencing the skin thickness of asymmetric reverse osmosis membranes. J. Appl. Phys. 44, 4303–4311. doi: 10.1063/1.1661955
Arahman, N., Maimun, T., and Mukramah, S. (2016). “The study of membrane formation via phase inversion method by cloud point and light scattering experiment,” in International Conference on Engineering, Science and Nanotechnology 2016 (ICESNANO 2016) (Solo: AIP Conference Proceedings), 30018.
Asai, S., Majumdar, S., Gupta, A., Kargupta, K., and Ganguly, S. (2009). Dynamics and pattern formation in thermally induced phase separation of polymer–solvent system. Comput. Mater. Sci. 47, 193–205. doi: 10.1016/j.commatsci.2009.07.008
Avalos, E., Higuchi, T., Teramoto, T., Yabu, H., and Nishiura, Y. (2016). Frustrated phases under three-dimensional confinement simulated by a set of coupled Cahn-Hilliard equations. Soft Matter 12, 5905–5914. doi: 10.1039/C6SM00429F
Badalassi, V. E., Ceniceros, H. D., and Banerjee, S. (2003). Computation of multiphase systems with phase field models. J. Comput. Phys. 190, 371–397. doi: 10.1016/S0021-9991(03)00280-8
Barrett, J. W., and Süli, E. (2011). Existence and equilibration of global weak solutions to kinetic models for dilute polymers I: finitely extensible nonlinear bead-spring chains. Math. Models Methods Appl. Sci. 21, 1211–1289. doi: 10.1142/S0218202511005313
Barth, C., Gonçalves, M. C., Nunes Pires, A. T., Roeder, J., and Wolf, B. A. (2000). Asymmetric polysulfone and polyethersulfone membranes: effects of thermodynamic conditions during formation on their performance. J. Memb. Sci. 169, 287–299. doi: 10.1016/S0376-7388(99)00344-0
Barth, C., and Wolf, B. A. (2000). Quick and reliable routes to phase diagrams for polyethersulfone and polysulfone membrane formation. Macromol. Chem. Phys. 201, 365–374. doi: 10.1002/(SICI)1521-3935(20000201)201:3<365::AID-MACP365>3.0.CO;2-5
Barton, B. F., and McHugh, A. J. (1999). Kinetics of thermally induced phase separation in ternary polymer solutions. I. Modeling of phase separation dynamics. J. Polym. Sci. B Polym. Phys. 37, 1449–1460. doi: 10.1002/(SICI)1099-0488(19990701)37:13<1449::AID-POLB11>3.0.CO;2-T
Bazarjani, M. S., Mohammadi, N., and Ghasemi, S. M. (2009). Ranking the key parameters of immersion precipitation process and modeling the resultant membrane structural evolution. J. Appl. Polym. Sci. 113, 1529–1538. doi: 10.1002/app.30023
Bechhold, H. (1907). Kolloidstudien mit der Filtrationsmethode. Z. Phys. Chem. 60U, 257–318. doi: 10.1515/zpch-1907-6013
Bejagam, K. K., An, Y., Singh, S., and Deshmukh, S. A. (2018). Machine-learning enabled new insights into the coil-to-globule transition of thermosensitive polymers using a coarse-grained model. J. Phys. Chem. Lett. 9, 6480–6488. doi: 10.1021/acs.jpclett.8b02956
Bhattacharya, A., Mahanti, S. D., and Chakrabarti, A. (1998). Networklike pattern formation in phase separating polymer solutions: a molecular dynamics study. Phys. Rev. Lett. 80, 333–336. doi: 10.1103/PhysRevLett.80.333
Bond, P. J., Holyoake, J., Ivetac, A., Khalid, S., and Sansom, M. S. P. (2007). Coarse-grained molecular dynamics simulations of membrane proteins and peptides. J. Struct. Biol. 157, 593–605. doi: 10.1016/j.jsb.2006.10.004
Boom, R. M., van den Boomgaard, T., van den Berg, J. W. A., and Smolders, C. A. (1993). Linearized cloudpoint curve correlation for ternary systems consisting of one polymer, one solvent and one non-solvent. Polymer 34, 2348–2356. doi: 10.1016/0032-3861(93)90819-V
Bouanich, J.-P. (1992). Site-site Lennard-Jones potential parameters for N2, O2, H2, CO and CO2. J. Quant. Spectrosc. Radiat. Transf. 47, 243–250. doi: 10.1016/0022-4073(92)90142-Q
Bouyer, D., and Pochat-Bohatier, C. (2013). Validation of mass-transfer model for VIPS process using in situ measurements performed by near-infrared spectroscopy. AIChE J. 59, 671–686. doi: 10.1002/aic.13839
Bouyer, D., Vachoud, L., Chakrabandhu, Y., and Pochat-Bohatier, C. (2010). Influence of mass transfer on gelation time using VIPS-gelation process for chitin dissolved in LiCl/NMP solvent-Modelling and experimental study. Chem. Eng. J. 157, 605–619. doi: 10.1016/j.cej.2010.01.037
Brami, M. V., Oren, Y., Linder, C., and Bernstein, R. (2017). Nanofiltration properties of asymmetric membranes prepared by phase inversion of sulfonated nitro-polyphenylsulfone. Polymer 111, 137–147. doi: 10.1016/j.polymer.2017.01.048
Brocos, P., Mendoza-Espinosa, P., Castillo, R., Mas-Oliva, J., and Piñeiro, Á. (2012). Multiscale molecular dynamics simulations of micelles: coarse-grain for self-assembly and atomic resolution for finer details. Soft Matter 8, 9005. doi: 10.1039/c2sm25877c
Buxton, G. A., and Clarke, N. (2007). Ordering polymer blend morphologies via solvent evaporation. Europhys. Lett. 78, 56006. doi: 10.1209/0295-5075/78/56006
Cabral, J. T., and Higgins, J. S. (2018). Spinodal nanostructures in polymer blends: on the validity of the Cahn-Hilliard length scale prediction. Prog. Polym. Sci. 81, 1–21. doi: 10.1016/j.progpolymsci.2018.03.003
Cahn, J. W., and Hilliard, J. E. (1958). Free energy of a nonuniform system. I. Interfacial free energy. J. Chem. Phys. 28, 258–267. doi: 10.1063/1.1744102
Capuzzo Dolcetta, I., Finzi Vita, S., and March, R. (2002). Area-preserving curve-shortening flows: from phase separation to image processing. Interfaces Free Bound. 4, 325–343. doi: 10.4171/IFB/64
Caquineau, H., Menut, P., Deratani, A., and Dupuy, C. (2003). Influence of the relative humidity on film formation by vapor induced phase separation. Polym. Eng. Sci. 43, 798–808. doi: 10.1002/pen.10066
Ceniceros, H. D., and Fredrickson, G. H. (2004). Numerical solution of polymer self-consistent field theory. Multiscale Model. Simul. 2, 452–474. doi: 10.1137/030601338
Cervellere, M. R., Qian, X., Ford, D. M., Carbrello, C., Giglia, S., and Millett, P. C. (2021). Phase-field modeling of non-solvent induced phase separation (NIPS) for PES/NMP/Water with comparison to experiments. J. Memb. Sci. 619, 118779. doi: 10.1016/j.memsci.2020.118779
Cervellere, M. R., Tang, Y. H., Qian, X., Ford, D. M., and Millett, P. C. (2019). Mesoscopic simulations of thermally-induced phase separation in PVDF/DPC solutions. J. Memb. Sci. 577, 266–273. doi: 10.1016/j.memsci.2019.02.014
Chae Park, H., Po Kim, Y., Yong Kim, H., and Soo Kang, Y. (1999). Membrane formation by water vapor induced phase inversion. J. Memb. Sci. 156, 169–178. doi: 10.1016/S0376-7388(98)00359-7
Chan, P. K., and Rey, A. D. (1997). Polymerization-induced phase separation. 2. Morphological analysis. Macromolecules 30, 2135–2143. doi: 10.1021/ma961078w
Cheng, L.-P., Young, T.-H., Chuang, W.-Y., Chen, L.-Y., and Chen, L.-W. (2001). The formation mechanism of membranes prepared from the nonsolvent–solvent–crystalline polymer systems. Polymer 42, 443–451. doi: 10.1016/S0032-3861(00)00381-5
Cheng, L.-P., Young, T.-H., Fang, L., and Gau, J.-J. (1999b). Formation of particulate microporous poly(vinylidene fluoride) membranes by isothermal immersion precipitation from the 1-octanol/dimethylformamide/poly(vinylidene fluoride) system. Polymer 40, 2395–2403. doi: 10.1016/S0032-3861(98)00462-5
Cheng, L. P., Lin, D. J., Shih, C. H., Dwan, A. H., and Gryte, C. C. (1999a). PVDF membrane formation by diffusion-induced phase separation-morphology prediction based on phase behavior and mass transfer modeling. J. Polym. Sci. B Polym. Phys. 37, 2079–2092. doi: 10.1002/(SICI)1099-0488(19990815)37:16<2079::AID-POLB11>3.0.CO;2-Q
Choksi, R., Maras, M., and Williams, J. F. (2011). 2D Phase diagram for minimizers of a Cahn–Hilliard functional with long-range interactions. SIAM J. Appl. Dyn. Syst. 10, 1344–1362. doi: 10.1137/100784497
Coveney, S., and Clarke, N. (2014). Pattern formation in polymer blend thin films: surface roughening couples to phase separation. Phys. Rev. Lett. 113, 218301. doi: 10.1103/PhysRevLett.113.218301
Crespo, E. A., Schaeffer, N., Coutinho, J. A. P., and Perez-Sanchez, G. (2020). Improved coarse-grain model to unravel the phase behavior of 1-alkyl-3-methylimidazolium-based ionic liquids through molecular dynamics simulations. J. Colloid Interface Sci. 574, 324–336. doi: 10.1016/j.jcis.2020.04.063
Cummings, J., Lowengrub, J. S., Sumpter, B. G., Wise, S. M., and Kumar, R. (2018). Modeling solvent evaporation during thin film formation in phase separating polymer mixtures. Soft Matter 14, 1833–1846. doi: 10.1039/C7SM02560B
Dai, S., and Promislow, K. (2013). Geometric evolution of bilayers under the functionalized Cahn–Hilliard equation. Proc. R. Soc. A. 469, 20120505. doi: 10.1098/rspa.2012.0505
Das, P., Jaiswal, P. K., and Puri, S. (2020). Surface-directed spinodal decomposition on chemically patterned substrates. Phys. Rev. E 102, 12803. doi: 10.1103/PhysRevE.102.012803
Das, S. K., Puri, S., Horbach, J., and Binder, K. (2005). Kinetics of phase separation in thin films: simulations for the diffusive case. Phys. Rev. E Stat. Nonlin. Soft Matter Phys. 72 (6 Pt. 1), 61603. doi: 10.1103/PhysRevE.72.061603
Dayal, P., and Kyu, T. (2006). Porous fiber formation in polymer-solvent system undergoing solvent evaporation. J. Appl. Phys. 100, 43512. doi: 10.1063/1.2259812
De Masi A, Orlandi, E, Presutti, E, and Triolo, L.. (1994). Stability of the interface in a model of phase separation. Proc. R. Soc. Edinb. Sect. A Math. 124, 1013–1022. doi: 10.1017/S0308210500022472
Dehsari, H. S., Michels, J. J., and Asadi, K. (2017). Processing of ferroelectric polymers for microelectronics: from morphological analysis to functional devices. J. Mater. Chem. C 5, 10490–10497. doi: 10.1039/C7TC01495C
Deserno, M. (2009). Mesoscopic membrane physics: concepts, simulations, and selected applications. Macromol. Rapid Commun. 30, 752–771. doi: 10.1002/marc.200900090
Dodd, L. R., and Theodorou, D. N. (1994). “Atomistic Monte Carlo simulation and continuum mean field theory of the structure,” in Atomistic Modeling of Physical Properties, eds L. Monnerie, and U. W. Suter (Berlin: Advances in Polymer Science), 249–281. doi: 10.1007/BFb0080201
Dong, J., Yin, C. Q., Lu, H. X., Zhang, Z. X., and Zhang, Q. (2014). Morphology control of polyimide fibers by phase separation under different coagulation bath conditions. MSF 789, 142–147. doi: 10.4028/www.scientific.net/MSF.789.142
Dong, Z., Cui, H., Zhang, H., Wang, F., Zhan, X., and Mayer, F. (2021). 3D printing of inherently nanoporous polymers via polymerization-induced phase separation. Nat. Commun. 12, 247. doi: 10.1038/s41467-020-20498-1
Donnelly, C., Tian, Y., Potter, C., Jones, D. S., and Andrews, G. P. (2015). Probing the effects of experimental conditions on the character of drug-polymer phase diagrams constructed using Flory-Huggins theory. Pharm. Res. 32, 167–179. doi: 10.1007/s11095-014-1453-9
Drioli, E., Brunetti, A., Di Profio, G., and Barbieri, G. (2012). Process intensification strategies and membrane engineering. Green Chem. 14, 1561. doi: 10.1039/c2gc16668b
Drioli, E., Stankiewicz, A. I., and Macedonio, F. (2011). Membrane engineering in process intensification—an overview. J. Memb. Sci. 380, 1–8. doi: 10.1016/j.memsci.2011.06.043
Drolet, F., and Fredrickson, G. H. (1999). Combinatorial screening of complex block copolymer assembly with self-consistent field theory. Phys. Rev. Lett. 83, 4317–4320. doi: 10.1103/PhysRevLett.83.4317
Dudowicz, J., Freed, K. F., and Douglas, J. F. (2015). Communication: cosolvency and cononsolvency explained in terms of a Flory-Huggins type theory. J. Chem. Phys. 143, 131101. doi: 10.1063/1.4932061
Fan, S.-C., Wang, Y.-C., Li, C.-L., Lee, K.-R., Liaw, D.-J., Huang, H.-P., et al. (2002). Effect of coagulation media on membrane formation and vapor permeation performance of novel aromatic polyamide membrane. J. Memb. Sci. 204, 67–79. doi: 10.1016/S0376-7388(02)00017-0
Fang, P., Yang, C., Shao, R., Zhou, L., and Liu, K. (2021). Ternary phase-field simulations of the skin-sublayer structures in poly(vinylidene fluoride) microporous membranes prepared by a nonsolvent-induced phase separation. ACS omega 6, 7444–7453. doi: 10.1021/acsomega.0c05982
Fang, X., Li, J., Li, X., Sun, X., Shen, J., Han, W., et al. (2015). Polyethyleneimine, an effective additive for polyethersulfone ultrafiltration membrane with enhanced permeability and selectivity. J. Memb. Sci. 476, 216–223. doi: 10.1016/j.memsci.2014.11.021
Flory, P. J. (1942). Thermodynamics of High Polymer Solutions. J. Chem. Phys. 10, 51–61. doi: 10.1063/1.1723621
Fu, X., Matsuyama, H., Teramoto, M., and Nagai, H. (2006). Preparation of polymer blend hollow fiber membrane via thermally induced phase separation. Sep. Purif. Technol. 52, 363–371. doi: 10.1016/j.seppur.2006.05.018
Garcia, J. U., Iwama, T., Chan, E. Y., Tree, D. R., Delaney, K. T., and Fredrickson, G. H. (2020). Mechanisms of asymmetric membrane formation in nonsolvent-induced phase separation. ACS Macro Lett. 9, 1617–1624. doi: 10.1021/acsmacrolett.0c00609
Geada, I. L., Ramezani-Dakhel, H., Jamil, T., Sulpizi, M., and Heinz, H. (2018). Insight into induced charges at metal surfaces and biointerfaces using a polarizable Lennard-Jones potential. Nat. Commun. 9, 716. doi: 10.1038/s41467-018-03137-8
Gee, R. H., Lacevic, N., and Fried, L. E. (2006). Atomistic simulations of spinodal phase separation preceding polymer crystallization. Nat. Mater. 5, 39–43. doi: 10.1038/nmat1543
Gennes, P. G. (1985). Wetting: statics and dynamics. Rev. Mod. Phys. 57, 827–863. doi: 10.1103/RevModPhys.57.827
Ghaffari, S., Chan, P. K., and Mehrvar, M. (2019). Computer simulation of anisotropic polymeric materials using polymerization-induced phase separation under combined temperature and concentration gradients. Polymers 11, 1076. doi: 10.3390/polym11061076
Ghaffari, S., Chan, P. K., and Mehrvar, M. (2021). Long-range surface-directed polymerization-induced phase separation: a computational study. Polymers 13, 256. doi: 10.3390/polym13020256
Ghasemi, S. M., and Mohammadi, N. (2013). The prediction of polymeric membrane characteristics prepared via nonsolvent induced phase separation by the apparent coagulation time. Polymer 54, 4675–4685. doi: 10.1016/j.polymer.2013.06.046
Ghosh, S., Mukherjee, A., Arroyave, R., and Douglas, J. F. (2020). Impact of particle arrays on phase separation composition patterns. J. Chem. Phys. 152, 224902. doi: 10.1063/5.0007859
Giacomin, G., and Lebowitz, J. L. (1997). Phase segregation dynamics in particle systems with long range interactions. I. Macroscopic limits. J. Stat. Phys. 87, 37–61. doi: 10.1007/BF02181479
Giacomin, G., and Lebowitz, J. L. (1998). Phase segregation dynamics in particle systems with long range interactions II: interface motion. SIAM J. Appl. Math. 58, 1707–1729. doi: 10.1137/S0036139996313046
Giacomin, L. (1996). Exact macroscopic description of phase segregation in model alloys with long range interactions. Phys. Rev. Lett. 76, 1094–1097. doi: 10.1103/PhysRevLett.76.1094
Glotzer, C. (1994). Self-consistent solution of phase separation with competing interactions. Phys. Rev. E Stat. Phys. Plasmas Fluids Relat. Interdiscip. Topics 50, 4241–4244. doi: 10.1103/PhysRevE.50.4241
Glotzer, S. C, Stauffer, D., and Jan, N. (1994). Monte Carlo simulations of phase separation in chemically reactive binary mixtures. Phys. Rev. Lett. 72, 4109–4112. doi: 10.1103/PhysRevLett.72.4109
Gonzalez-Leon, J. A., and Mayes, A. M. (2003). Phase behavior prediction of ternary polymer mixtures. Macromolecules 36, 2508–2515. doi: 10.1021/ma0209803
Goyal, A., van der Schoot, P., and Toschi, F. (2021). Impact of the prequench state of binary fluid mixtures on surface-directed spinodal decomposition. Phys. Rev. E 103, 42801. doi: 10.1103/PhysRevE.103.042801
Graham, P. D., and McHugh, A. J. (1998). Kinetics of thermally induced phase separation in a crystallizable polymer solution. Macromolecules 31, 2565–2568. doi: 10.1021/ma971056p
Graham, P. D., Pervan, A. J., and McHugh, A. J. (1997). The dynamics of thermal-induced phase separation in PMMA solutions. Macromolecules 30, 1651–1655. doi: 10.1021/ma961720m
Groot, R. D. (2000). Mesoscopic simulation of polymer–surfactant aggregation. Langmuir 16, 7493–7502. doi: 10.1021/la000010d
Groves, C., Kimber, R. G. E., and Walker, A. B. (2010). Simulation of loss mechanisms in organic solar cells: a description of the mesoscopic Monte Carlo technique and an evaluation of the first reaction method. J. Chem. Phys. 133, 144110. doi: 10.1063/1.3483603
Guillen, G. R., Pan, Y., Li, M., and Hoek, E. M. V. (2011). Preparation and characterization of membranes formed by nonsolvent induced phase separation: a review. Ind. Eng. Chem. Res. 50, 3798–3817. doi: 10.1021/ie101928r
Guillen, G. R., Ramon, G. Z., Kavehpour, H. P., Kaner, R. B., and Hoek, E. M. V. (2013). Direct microscopic observation of membrane formation by nonsolvent induced phase separation. J. Memb. Sci. 431, 212–220. doi: 10.1016/j.memsci.2012.12.031
Hakobyan, D., and Heuer, A. (2013). Phase separation in a lipid/cholesterol system: comparison of coarse-grained and united-atom simulations. J. Phys. Chem. B 117, 3841–3851. doi: 10.1021/jp312245y
Hanks, P. L., and Lloyd, D. R. (2007). Deterministic model for matrix solidification in liquid–liquid thermally induced phase separation. J. Memb. Sci. 306, 125–133. doi: 10.1016/j.memsci.2007.08.037
Hao, J. H., and Wang, S. (2003). Studies on membrane formation mechanism by the light transmission technique. I. J. Appl. Polym. Sci. 87, 174–181. doi: 10.1002/app.11244
Hayward, S., Heermann, D. W., and Binder, K. (1987). Dynamic percolation transition induced by phase separation: a Monte Carlo analysis. J. Stat. Phys. 49, 1053–1081. doi: 10.1007/BF01017560
He, X., Chen, C., Jiang, Z., and Su, Y. (2011). Computer simulation of formation of polymeric ultrafiltration membrane via immersion precipitation. J. Memb. Sci. 371, 108–116. doi: 10.1016/j.memsci.2011.01.016
He, Y.-D., Tang, Y. H., and Wang, X. L. (2011). Dissipative particle dynamics simulation on the membrane formation of polymer–diluent system via thermally induced phase separation. J. Memb. Sci. 368, 78–85. doi: 10.1016/j.memsci.2010.11.010
Henderson, I. C., and Clarke, N. (2005). On modelling surface directed spinodal decomposition. Macromol. Theory Simul. 14, 435–443. doi: 10.1002/mats.200500027
Heyes, D. M. (2007). System size dependence of the transport coefficients and stokes–einstein relationship of hard sphere and Weeks–Chandler–Andersen fluids. J. Phys. Condens. Matter 19, 376106. doi: 10.1088/0953-8984/19/37/376106
Higuchi, T., Yano, Y., Aita, T., Takami, S., and Adschiri, T. (2013). Phase-field simulation of polymerization-induced phase separation: I. Effect of reaction rate and coexisting polymer. J. Chem. Eng. Japan 46, 709–715. doi: 10.1252/jcej.13we011
Hoernschemeyer, D. (1974). The influence of solvent type on the viscosity of concentrated polymer solutions. J. Appl. Polym. Sci. 18, 61–75. doi: 10.1002/app.1974.070180105
Hong, W., and Wang, X. (2013). A phase-field model for systems with coupled large deformation and mass transport. J. Mech. Phys. Solids 61, 1281–1294. doi: 10.1016/j.jmps.2013.03.001
Hopp-Hirschler, M., and Nieken, U. (2018). Modeling of pore formation in phase inversion processes: model and numerical results. J. Memb. Sci. 564, 820–831. doi: 10.1016/j.memsci.2018.07.085
Hopp-Hirschler, M., Safdari Shadloo, M., and Nieken, U. (2019). Viscous fingering phenomena in the early stage of polymer membrane formation. J. Fluid Mech. 864, 97–140. doi: 10.1017/jfm.2019.4
Hou, Y., Sun, W., Das, P., Song, X., Wang, L., Ge, Z., et al. (2016). Coupled Navier–stokes phase-field model to evaluate the microscopic phase separation in asphalt binder under thermal loading. J. Mater. Civ. Eng. 28, 1581. doi: 10.1061/(ASCE)MT.1943-5533.0001581
Hu, J., Liu, Y., Cao, X., Zhang, P., Zheng, J., and Li, M. (2017). A comprehensive physico-chemical study on the molecular structure effects of sulfonated polyamide thin-film composites. Mol. Syst. Des. Eng. 2, 57–66. doi: 10.1039/C6ME00078A
Huang, J., and Feigenson, G. W. (1993). Monte Carlo simulation of lipid mixtures: finding phase separation. Biophys. J. 65, 1788–1794. doi: 10.1016/S0006-3495(93)81234-7
Huang, R. Y. M., and Feng, X. (1995). Studies on solvent evaporation and polymer precipitation pertinent to the formation of asymmetric polyetherimide membranes. J. Appl. Polym. Sci. 57, 613–621. doi: 10.1002/app.1995.070570511
Hung, W.-L., Wang, D.-M., Lai, J.-Y., and Chou, S.-C. (2016). On the initiation of macrovoids in polymeric membranes—effect of polymer chain entanglement. J. Memb. Sci. 505, 70–81. doi: 10.1016/j.memsci.2016.01.021
Hyon, Y., and Liu, C. (2010). Energetic variational approach in complex fluids: maximum dissipation principle. Discret. Contin. Dynam. Syst. A 26, 1291–1304. doi: 10.3934/dcds.2010.26.1291
Inoue, T., and Ougizawa, T. (1989). Characterization of phase behavior in polymer blends by light scattering. J. Macromol. Sci. Part A Chem. 26, 147–173. doi: 10.1080/00222338908053847
Ishigami, T., Nii, Y., Ohmukai, Y., Rajabzadeh, S., and Matsuyama, H. (2014). Solidification behavior of polymer solution during membrane preparation by thermally induced phase separation. Membranes 4, 113–122. doi: 10.3390/membranes4010113
Jacqmin, D. (1999). Calculation of two-phase navier–stokes flows using phase-field modeling. J. Comput. Phys. 155, 96–127. doi: 10.1006/jcph.1999.6332
Jamali, S., Boromand, A., Khani, S., Wagner, J., Yamanoi, M., and Maia, J. (2015). Generalized mapping of multi-body dissipative particle dynamics onto fluid compressibility and the Flory-Huggins theory. J. Chem. Phys. 142, 164902. doi: 10.1063/1.4919303
Jiang, H., Chen, T., Chen, Z., Huo, J., Zhang, L., and Zhou, J. (2020). Computer simulations on double hydrophobic PS-b-PMMA porous membrane by non-solvent induced phase separation. Fluid Phase Equilib. 523, 112784. doi: 10.1016/j.fluid.2020.112784
Joshi, S. Y., and Deshmukh, S. A. (2021). A review of advancements in coarse-grained molecular dynamics simulations. Mole. Simulat. 47, 786–803. doi: 10.1080/08927022.2020.1828583
Kahrs, C., Gühlstorf, T., and Schwellenbach, J. (2020). Influences of different preparation variables on polymeric membrane formation via nonsolvent induced phase separation. J. Appl. Polym. Sci. 137, 48852. doi: 10.1002/app.48852
Kahrs, C., Metze, M., Fricke, C., and Schwellenbach, J. (2019). Thermodynamic analysis of polymer solutions for the production of polymeric membranes. J. Mol. Liq. 291, 111351. doi: 10.1016/j.molliq.2019.111351
Kahrs, C., and Schwellenbach, J. (2020). Membrane formation via non-solvent induced phase separation using sustainable solvents: a comparative study. Polymer. 186, 122071. doi: 10.1016/j.polymer.2019.122071
Kang, Y. S., Hyo, J. K., and Un, Y. K. (1991). Asymmetric membrane formation via immersion precipitation method. I. Kinetic effect. J. Memb. Sci. 60, 219–232. doi: 10.1016/S0376-7388(00)81536-7
Karimi, M., and Kish, M. H. (2009). Poly(methyl methacrylate) membrane: dynamic measurement of concentrations during water-induced phase separation. Macromol. Symp. 279, 210–220. doi: 10.1002/masy.200950531
Khansary, M. A., Marjani, A., and Shirazian, S. (2017). On the search of rigorous thermo-kinetic model for wet phase inversion technique. J. Membrane Sci. 538, 18–33. doi: 10.1016/j.memsci.2017.05.050
Khare, V., Greenberg, A. R., and Krantz, W. B. (2005). Vapor-induced phase separation - effect of the humid air exposure step on membrane morphology: Part I. Insights from mathematical modeling. J. Membrane Sci. 258, 140–156. doi: 10.1016/j.memsci.2005.03.015
Kim, C., and Palffy-Muhoray, K. (1993). Polymerization-induced phase separation in a liquid-crystal-polymer mixture. Phys. Rev. Lett. 71, 2232–2235. doi: 10.1103/PhysRevLett.71.2232
Kim, H. J., Fouda, A. E., and Jonasson, K. (2000). In situ study on kinetic behavior during asymmetric membrane formation via phase inversion process using Raman spectroscopy. J. Appl. Polym. Sci. 75, 135–141. doi: 10.1002/(SICI)1097-4628(20000103)75:1<135::AID-APP15>3.0.CO;2-9
Kim, J. H., Min, B. R., Won, J., Park, H. C., and Kang, Y. S. (2001). Phase behavior and mechanism of membrane formation for polyimide/DMSO/water system. J. Memb. Sci. 187, 47–55. doi: 10.1016/S0376-7388(00)00648-7
Klein, J., and Schiedermaier, E. (1970). Die Temperaturabhängigkeit des fällungsverhaltens in systemen polymer/lösungsmittel/fällungsmittel. Kolloid Z. Z. Polymere 236, 118–125. doi: 10.1007/BF02086624
Kouijzer, S., Michels, J. J., van den Berg, M., Gevaerts, V. S., Turbiez, M., Wienk, M. M., et al. (2013). Predicting morphologies of solution processed polymer:fullerene blends. J. Am. Chem. Soc. 135, 12057–12067. doi: 10.1021/ja405493j
Koura, K., and Matsumoto, H. (1991). Variable soft sphere molecular model for inverse-power-law or Lennard-Jones potential. Phys. Fluids A Fluid Dynam. 3, 2459–2465. doi: 10.1063/1.858184
Kuo, C.-Y., Su, S.-L., Tsai, H.-A., Su, Y.-S., Wang, D.-M., and Lai, J.-Y. (2008). Formation and evolution of a bicontinuous structure of PMMA membrane during wet immersion process. J. Memb. Sci. 315, 187–194. doi: 10.1016/j.memsci.2008.02.034
Laninovic, V. (2005). Relationship between type of nonsolvent additive and properties of polyethersulfone membranes. Desalination 186, 39–46. doi: 10.1016/j.desal.2005.01.017
Lau, W. W. Y., Guiver, M. D., and Matsuura, T. (1991). Phase separation in carboxylated polysulfone/solvent/water systems. J. Appl. Polym. Sci. 42, 3215–3221. doi: 10.1002/app.1991.070421214
Law, S. J., and Mukhopadhyay, S. K. (1997). The construction of a phase diagram for a ternary system used for the wet spinning of acrylic fibers based on a linearized cloudpoint curve correlation. J. Appl. Polym. Sci. 65, 2131–2139. doi: 10.1002/(SICI)1097-4628(19970912)65:11<2131::AID-APP9>3.0.CO;2-I
Lee, H., Krantz, W. B., and Hwang, S.-T. (2010). A model for wet-casting polymeric membranes incorporating nonequilibrium interfacial dynamics, vitrification and convection. J. Membrane Sci. 354, 74–85. doi: 10.1016/j.memsci.2010.02.066
Lee, H. G., and Lee, J.-Y. (2014). A semi-analytical Fourier spectral method for the Allen–Cahn equation. Comput. Math. Applic. 68, 174–184. doi: 10.1016/j.camwa.2014.05.015
Lee, H. J., Jung, B., Kang, Y. S., and Lee, H. (2004). Phase separation of polymer casting solution by nonsolvent vapor. J. Memb. Sci. 245, 103–112. doi: 10.1016/j.memsci.2004.08.006
Lee, J. C. (1999). Polymerization-induced phase separation. Phys. Rev. E Stat. Phys. Plasmas Fluids Relat. Interdiscipl. Topics 60 (2 Pt. B), 1930–1935. doi: 10.1103/PhysRevE.60.1930
Lee, K.-W. D., Chan, P. K., and Feng, X. (2003). A computational study of the polymerization-induced phase separation phenomenon in polymer solutions under a temperature gradient. Macromol. Theory Simul. 12, 413–424. doi: 10.1002/mats.200350003
Lee, K.-W. D., Chan, P. K., and Feng, X. (2004). Morphology development and characterization of the phase-separated structure resulting from the thermal-induced phase separation phenomenon in polymer solutions under a temperature gradient. Chem. Eng. Sci. 59, 1491–1504. doi: 10.1016/j.ces.2003.12.025
Li, D., Krantz, W. B., Greenberg, A. R., and Sani, R. L. (2006). Membrane formation via thermally induced phase separation (TIPS): Model development and validation. J. Membrane Sci. 279, 50–60. doi: 10.1016/j.memsci.2005.11.036
Li, J.-F., Xu, Z.-L., and Yang, H. (2008). Microporous polyethersulfone membranes prepared under the combined precipitation conditions with non-solvent additives. Polym. Adv. Technol. 19, 251–257. doi: 10.1002/pat.982
Li, Y. C., Shi, R. P., Wang, C. P., Liu, X. J., and Wang, Y. (2012). Phase-field simulation of thermally induced spinodal decomposition in polymer blends. Modelling Simul. Mater. Sci. Eng. 20, 75002. doi: 10.1088/0965-0393/20/7/075002
Lin, H. H., Tang, Y. H., Matsuyama, H., and Wang, X. L. (2018). Dissipative particle dynamics simulation on the membrane formation of polymer–solvent system via nonsolvent induced phase separation. J. Memb. Sci. 548, 288–297. doi: 10.1016/j.memsci.2017.11.019
Lin, K.-Y., Wang, D.-M., and Lai, J.-Y. (2002). Nonsolvent-Induced gelation and its effect on membrane morphology. Macromolecules 35, 6697–6706. doi: 10.1021/ma020073y
Liu, G., Tsen, W.-C., Jang, S.-C., Hu, F., Zhong, F., and Liu, H. (2019). Mechanically robust and highly methanol-resistant sulfonated poly(ether ether ketone)/poly(vinylidene fluoride) nanofiber composite membranes for direct methanol fuel cells. J. Memb. Sci. 591, 117321. doi: 10.1016/j.memsci.2019.117321
Liu, H., Sengul, T., Wang, S., and Zhang, P. (2015). Dynamic transitions and pattern formations for a Cahn–Hilliard model with long-range repulsive interactions. Commun. Math. Sci. 13, 1289–1315. doi: 10.4310/CMS.2015.v13.n5.a10
Liu, J., Gao, Y., Cao, D., Zhang, L., and Guo, Z. (2011). Nanoparticle dispersion and aggregation in polymer nanocomposites: insights from molecular dynamics simulation. Langmuir 27, 7926–7933. doi: 10.1021/la201073m
Liu, J., Li, Z., Wang, Y., Liu, X., Tu, G., and Li, W. (2021). Analyzing scaling behavior of calcium sulfate in membrane distillation via optical coherence tomography. Water Res. 191, 116809. doi: 10.1016/j.watres.2021.116809
Liu, L. Q., Xiang, H. B., Huang, Z., Chen, L., Yu, J. R., Zhu, L. J., et al. (2013). Calculation of the phase diagram of a btda-tdi/mdi co-polyimide/ N-methyl-2-pyrrolidinone/water system in the phase separation process. Textile Res. J. 83, 553–565. doi: 10.1177/0040517512456762
Liu, S., Jiang, Z., and He, X. (2013). Computer simulation of the formation of anti-fouling polymeric ultrafiltration membranes with the addition of amphiphilic block copolymers. J. Memb. Sci. 442, 97–106. doi: 10.1016/j.memsci.2013.04.025
Liu, X., Chen, G., Tu, G., Li, Z., Deng, B., and Li, W. (2020). Membrane fouling by clay suspensions during NF-like forward osmosis: characterization via optical coherence tomography. J. Memb. Sci. 602, 117965. doi: 10.1016/j.memsci.2020.117965
Liu, Y., Nie, Y., Pan, F., Le Zhou, J., Xiaoyan, K., Zhaoqing, Z., et al. (2019). Study on ionic liquid/cellulose/coagulator phase diagram and its application in green spinning process. J. Mol. Liq. 289, 111127. doi: 10.1016/j.molliq.2019.111127
Loison, C., Mareschal, M., and Schmid, F. (2004). Pores in bilayer membranes of amphiphilic molecules: coarse-grained molecular dynamics simulations compared with simple mesoscopic models. J. Chem. Phys. 121, 1890–1900. doi: 10.1063/1.1752884
Lomakin, A., Asherie, N., and Benedek, G. B. (1996). Monte Carlo study of phase separation in aqueous protein solutions. J. Chem. Phys. 104, 1646–1656. doi: 10.1063/1.470751
Loo, W. S., Sethi, G. K., Teran, A. A., Galluzzo, M. D., Maslyn, J. A., and Oh, H. J. (2019). Composition dependence of the flory–huggins interaction parameters of block copolymer electrolytes and the isotaksis point. Macromolecules 52, 5590–5601. doi: 10.1021/acs.macromol.9b00884
Lowengrub, J., and Truskinovsky, L. (1998). Quasi–incompressible Cahn–Hilliard fluids and topological transitions. Proc. R. Soc. Lond. A 454, 2617–2654. doi: 10.1098/rspa.1998.0273
Lu, S.-C., Khan, A. L., and Vankelecom, I. F. J. (2016). Polysulfone-ionic liquid based membranes for CO2/N2 separation with tunable porous surface features. J. Memb. Sci. 518, 10–20. doi: 10.1016/j.memsci.2016.06.031
Luo, R.-L., Young, T.-H., and Sun, Y.-M. (2003). Structure formation and characterization of EVAL membranes with cosolvent of isopropanol and water. Polymer 44, 157–166. doi: 10.1016/S0032-3861(02)00712-7
Luo, Z., and Jiang, J. (2010). Molecular dynamics and dissipative particle dynamics simulations for the miscibility of poly(ethylene oxide)/poly(vinyl chloride) blends. Polymer 51, 291–299. doi: 10.1016/j.polymer.2009.11.024
Machado, P. S. T., Habert, A. C., and Borges, C. P. (1999). Membrane formation mechanism based on precipitation kinetics and membrane morphology: flat and hollow fiber polysulfone membranes. J. Memb. Sci. 155, 171–183. doi: 10.1016/S0376-7388(98)00266-X
Madaeni, S. S., and Bakhtiari, L. (2012). Thermodynamic-based predictions of membrane morphology in water/dimethylsulfoxide/polyethersulfone systems. Polymer 53, 4481–4488. doi: 10.1016/j.polymer.2012.07.005
Matsuyama, H., Berghmans, S., and Lloyd, D. R. (1999). Formation of anisotropic membranes via thermally induced phase separation. Polymer 40, 2289–2301. doi: 10.1016/S0032-3861(98)00040-8
Matsuyama, H., Kudari, S., Kiyofuji, H., and Kitamura, Y. (2000a). Kinetic studies of thermally induced phase separation in polymer-diluent system. J. Appl. Polym. Sci. 76, 1028–1036. doi: 10.1002/(SICI)1097-4628(20000516)76:7<1028::AID-APP6>3.0.CO;2-Z
Matsuyama, H., Maki, T., Teramoto, M., and Asano, K. (2002a). Effect of polypropylene molecular weight on porous membrane formation by thermally induced phase separation. J. Memb. Sci. 204, 323–328. doi: 10.1016/S0376-7388(02)00056-X
Matsuyama, H., Nakagawa, K., Maki, T., and Teramoto, M. (2003). Studies on phase separation rate in porous polyimide membrane formation by immersion precipitation. J. Appl. Polym. Sci. 90, 292–296. doi: 10.1002/app.12783
Matsuyama, H., Nishiguchi, M., and Kitamura, Y. (2000b). Phase separation mechanism during membrane formation by dry-cast process. J. Appl. Polym. Sci. 77, 776–783. doi: 10.1002/(SICI)1097-4628(20000725)77:4<776::AID-APP9>3.0.CO;2-Q
Matsuyama, H., Okafuji, H., Maki, T., Teramoto, M., and Tsujioka, N. (2002b). Membrane formation via thermally induced phase separation in polypropylene/polybutene/diluent system. J. Appl. Polym. Sci. 84, 1701–1708. doi: 10.1002/app.10550
Matz, R. (1972). The structure of cellulose acetate membranes 1. The development of porous structures in anisotropic membranes. Desalination 10, 1–15. doi: 10.1016/S0011-9164(00)80243-X
Mazinani, S., Darvishmanesh, S., Ehsanzadeh, A., and van der Bruggen, B. (2017). Phase separation analysis of extem/solvent/non-solvent systems and relation with membrane morphology. J. Memb. Sci. 526, 301–314. doi: 10.1016/j.memsci.2016.12.031
McGuire, K. S., Laxminarayan, A., and Lloyd, D. R. (1995). Kinetics of droplet growth in liquid—liquid phase separation of polymer—diluent systems: experimental results. Polymer 36, 4951–4960. doi: 10.1016/0032-3861(96)81620-X
McHugh, A. J., and Yilmaz, L. (1985). The diffusion equations for polymer membrane formation in ternary systems. J. Polym. Sci. Polym. Phys. Ed. 23, 1271–1274. doi: 10.1002/pol.1985.180230619
Menut, P., Pochat-Bohatier, C., Deratani, A., Dupuy, C., and Guilbert, S. (2002). Structure formation of poly (ether-imide) films using non-solvent vapor induced phase separation: relationship between mass transfer and relative humidity. Desalination 145, 11–16. doi: 10.1016/S0011-9164(02)00323-5
Menut, P., Su, Y.-S., Chinpa, W., Pochat-Bohatier, C., Deratani, A., and Wang, D.-M. (2008). A top surface liquid layer during membrane formation using vapor-induced phase separation (VIPS)—Evidence and mechanism of formation. J. Memb. Sci. 310, 278–288. doi: 10.1016/j.memsci.2007.11.016
Metze, M. (2014). Untersuchungen zur Bildung von porösen Membranen aus Cellulosederivaten nach dem Verdunstungsverfahren. (Dissertation), Gottfried Wilhelm Leibniz Universität Hannover, Hannover(Germany).
Metze, M., Barbe, S., Reiche, A., Kesting, A., and Schweins, R. (2017). A neutron-transparent flow-through cell (NTFT-Cell) for the SANS investigation of microstructure evolution during industrial evaporative casting. JNR 19, 177–185. doi: 10.3233/JNR-170054
Metze M. Kentsch A. Reiche A. (n.d.). Study of Kinetics Mechanism of Membrane Formation With Confocal Laser Scanning Microscopy. [Poster]. Euromembrane.
Mezger, T. G. (2014). The Rheology Handbook, 4th Edn. Hannover: Vincentz Network European Coatings TECH FILES.
Michels, J. J., and Moons, E. (2013). Simulation of surface-directed phase separation in a solution-processed polymer/PCBM blend. Macromolecules 46, 8693–8701. doi: 10.1021/ma400269j
Mino, Y., Ishigami, T., Kagawa, Y., and Matsuyama, H. (2015). Three-dimensional phase-field simulations of membrane porous structure formation by thermally induced phase separation in polymer solutions. J. Memb. Sci. 483, 104–111. doi: 10.1016/j.memsci.2015.02.005
Mondal, S., Griffiths, I. M., and Ramon, G. Z. (2019). Forefronts in structure-performance models of separation membranes. J. Memb. Sci. 588, 117166. doi: 10.1016/j.memsci.2019.06.006
Morthomas, J., Fusco, C., Zhai, Z., Lame, O., and Perez, M. (2017). Crystallization of finite-extensible nonlinear elastic Lennard-Jones coarse-grained polymers. Phys. Rev. E 96, 52502. doi: 10.1103/PhysRevE.96.052502
Mousavi, S. M., and Zadhoush, A. (2017). Investigation of the relation between viscoelastic properties of polysulfone solutions, phase inversion process and membrane morphology: the effect of solvent power. J. Memb. Sci. 532, 47–57. doi: 10.1016/j.memsci.2017.03.006
Mukherjee, A., Ankit, K., Reiter, A., Selzer, M., and Nestler, B. (2016). Electric-field-induced lamellar to hexagonally perforated lamellar transition in diblock copolymer thin films: kinetic pathways. Phys. Chem. Chem. Phys. 18, 25609–25620. doi: 10.1039/C6CP04903F
Müller, M., and Abetz, V. (2021). Nonequilibrium processes in polymer membrane formation: theory and experiment. Chem. Rev. 121, 14189–14231. doi: 10.1021/acs.chemrev.1c00029
Müller, M., and Binder, K. (1998). Wetting and capillary condensation in symmetric polymer blends: a comparison between monte carlo simulations and self-consistent field calculations. Macromolecules 31, 8323–8346. doi: 10.1021/ma980052x
Nakao, T., Akashi, M., Ishibashi, M., Yao, M., Nakagawa, K., and Shintani, T. (2021). In situ nanoporous structural characterization of asymmetric hollow fiber membranes for desalination using Raman spectroscopy. J. Memb. Sci. 631, 119337. doi: 10.1016/j.memsci.2021.119337
Nakatsuka, K., Ohmukai, Y., Maruyama, T., and Matsuyama, H. (2010). Analysis of solidification rate of polymer solutions during PVDF membrane fabrication via TIPS method. Desalinat. Water Treat. 17, 275–280. doi: 10.5004/dwt.2010.1729
Negi, V., Wodo, O., van Franeker, J. J., Janssen, R. A. J., and Bobbert, P. A. (2018). Simulating phase separation during spin coating of a polymer–fullerene blend: a joint computational and experimental investigation. ACS Appl. Energy Mater. 1, 725–735. doi: 10.1021/acsaem.7b00189
Nguyen, P.-M., Guiga, W., Dkhissi, A., and Vitrac, O. (2017). Off-Lattice flory–huggins approximations for the tailored calculation of activity coefficients of organic solutes in random and block copolymers. Ind. Eng. Chem. Res. 56, 774–787. doi: 10.1021/acs.iecr.6b03683
Nivedita, S., Ahamed, D., and Joseph, S. (2020). Thermodynamic analysis of phase diagram of H2O-DMF-PCL system: investigation on the influence of inorganic additives TiO2/MMT. J. Mater. Sci. 55, 5431–5444. doi: 10.1007/s10853-020-04386-z
Nunes, S. P., Culfaz-Emecen, P. Z., Ramon, G. Z., Visser, T., Koops, G. H., Jin, W., et al. (2020). Thinking the future of membranes: perspectives for advanced and new membrane materials and manufacturing processes. J. Memb. Sci. 598, 117761. doi: 10.1016/j.memsci.2019.117761
Nunes, S. P., and Inoue, T. (1996). Evidence for spinodal decomposition and nucleation and growth mechanisms during membrane formation. J. Memb. Sci. 111, 93–103. doi: 10.1016/0376-7388(95)00281-2
Oh, J., and Rey, A. D. (2000). Theory and simulation of polymerization-induced phase separation in polymeric media. Macromol. Theory Simul. 9, 641–660. doi: 10.1002/1521-3919(20001101)9:8<641::AID-MATS641>3.0.CO;2-E
Oh, J., and Rey, A. D. (2001). Computational simulation of polymerization-induced phase separation under a temperature gradient. Comput. Theor. Polym. Sci. 11, 205–217. doi: 10.1016/S1089-3156(00)00013-1
Padilha Júnior, E. J., Staudt, P. B., Tessaro, I. C., and Medeiros Cardozo, N. S. (2020). A new approach to phase-field model for the phase separation dynamics in polymer membrane formation by immersion precipitation method. Polymer 186, 122054. doi: 10.1016/j.polymer.2019.122054
Pandey, Y. N., and Doxastakis, M. (2012). Detailed atomistic Monte Carlo simulations of a polymer melt on a solid surface and around a nanoparticle. J. Chem. Phys. 136, 94901. doi: 10.1063/1.3689316
Pant, P. V. K., and Theodorou, D. N. (1995). Variable connectivity method for the atomistic monte carlo simulation of polydisperse polymer melts. Macromolecules 28, 7224–7234. doi: 10.1021/ma00125a027
Pego, R. L. (1989). Front migration in the nonlinear Cahn-Hilliard equation. Proc. R. Soc. Lond. A 422, 261–278. doi: 10.1098/rspa.1989.0027
Peng, N., Chung, T.-S., and Li, K. Y. (2009). The role of additives on dope rheology and membrane formation of defect-free Torlon® hollow fibers for gas separation. J. Memb. Sci. 343, 62–72. doi: 10.1016/j.memsci.2009.07.010
Periole, X. (2017). Interplay of G protein-coupled receptors with the membrane: insights from supra-atomic coarse grain molecular dynamics simulations. Chem. Rev. 117, 156–185. doi: 10.1021/acs.chemrev.6b00344
Pochivalov, K. V., Basko, A. V., Lebedeva, T. N., Ilyasova, A. N., Yurov, M. Y., and Golovanov, R. Y. (2021). Thermally induced phase separation in semicrystalline polymer solutions: how does the porous structure actually arise? Mater. Today Commun. 28, 102558. doi: 10.1016/j.mtcomm.2021.102558
Powers, P. (1942). Cloud point of varnish resins in drying oils. Ind. Eng. Chem. Anal. Ed. 14, 387–391. doi: 10.1021/i560105a003
Prakash, S. S., Francis, L. F., and Scriven, L. E. (2006). Microstructure evolution in dry cast cellulose acetate membranes by cryo-SEM. J. Memb. Sci. 283, 328–338. doi: 10.1016/j.memsci.2006.07.001
Puri, S., and Binder, K. (2002). Surface-directed phase separation with off-critical composition: analytical and numerical results. Phys. Rev. E Stat. Nonlin. Soft Matter Phys. 66 (6 Pt. 1), 61602. doi: 10.1103/PhysRevE.66.061602
Qin, P. Y., Chen, C. X., Han, B., Takuji, S., Li, J. D., and Sun, B. H. (2006a). Preparation of poly(phthalazinone ether sulfone ketone) asymmetric ultrafiltration membrane. J. Memb. Sci. 268, 181–188. doi: 10.1016/j.memsci.2005.06.011
Qin, P. Y., Chen, C. X., Yun, Y. B., Chen, Z., Shintani, T., and Li, X. (2006b). Formation kinetics of a polyphthalazine ether sulfone ketone membrane via phase inversion. Desalination 188, 229–237. doi: 10.1016/j.desal.2005.04.121
Rabani, R., Sadafi, H., Machrafi, H., Abbasi, M., Haut, B., and Dauby, P. (2021). Influence of evaporation on the morphology of a thin film of a partially miscible binary mixture. Colloids Surf. A Physicochem. Eng. Aspects 612, 126001. doi: 10.1016/j.colsurfa.2020.126001
Rahman, N. A., Sotani, T., and Matsuyama, H. (2008). Effect of the addition of the surfactant Tetronic 1307 on poly(ether sulfone) porous hollow-fiber membrane formation. J. Appl. Polym. Sci. 108, 3411–3418. doi: 10.1002/app.27940
Rall, D., Menne, D., Schweidtmann, A. M., Kamp, J., Kolzenberg, L., Mitsos, A., et al. (2019). Rational design of ion separation membranes. J. Memb. Sci. 569, 209–219. doi: 10.1016/j.memsci.2018.10.013
Reister, E., Müller, M., and Binder, K. (2001). Spinodal decomposition in a binary polymer mixture: dynamic self-consistent-field theory and Monte Carlo simulations. Phys. Rev. E Stat. Nonlin. Soft Matter Phys. 64 (4 Pt. 1), 41804. doi: 10.1103/PhysRevE.64.041804
Ren, J., Zhou, J., and Deng, M. (2010). Morphology transition of asymmetric flat sheet and thickness-gradient membranes by wet phase-inversion process. Desalination 253, 1–8. doi: 10.1016/j.desal.2009.12.001
Reuvers, A. J. (1987). Membrane Formation. diffusion induced demixing processes in ternay polymeric systems. (Dissertation), Faculty of Science and Technology, University of Twente, Enschede (Netherlands).
Reuvers, A. J., Altena, F. W., and Smolders, C. A. (1986). Demixing and gelation behavior of ternary cellulose acetate solutions. J. Polym. Sci. B Polym. Phys. 24, 793–804. doi: 10.1002/polb.1986.090240406
Ritt, C. L., Stassin, T., Davenport, D. M., DuChanois, R. M., Nulens, I., and Yang, Z. (2022). The open membrane database: synthesis–structure–performance relationships of reverse osmosis membranes. J. Memb. Sci. 641, 119927. doi: 10.1016/j.memsci.2021.119927
Rogers, D. (1989). Numerical study of late-stage coarsening for off-critical quenches in the Cahn-Hilliard equation of phase separation. Phys. Rev. B Condens. Matter 39, 11956–11964. doi: 10.1103/PhysRevB.39.11956
Romay, M., Diban, N., and Urtiaga, A. (2021). Thermodynamic modeling and validation of the temperature influence in ternary phase polymer systems. Polymers 13, 678. doi: 10.3390/polym13050678
Ronsin, O. J. J., Jang, D., Egelhaaf, H.-J., Brabec, C. J., and Harting, J. (2020). A phase-field model for the evaporation of thin film mixtures. Phys. Chem. Chem. Phys. 22, 6638–6652. doi: 10.1039/D0CP00214C
Ruzette, A.-V. G., and Mayes, A. M. (2001). A simple free energy model for weakly interacting polymer blends. Macromolecules 1894–1907. doi: 10.1021/ma000712+
Sadrzadeh, M., and Bhattacharjee, S. (2013). Rational design of phase inversion membranes by tailoring thermodynamics and kinetics of casting solution using polymer additives. J. Memb. Sci. 441, 31–44. doi: 10.1016/j.memsci.2013.04.009
Saiz, L., Bandyopadhyay, S., and Klein, M. L. (2002). Towards an understanding of complex biological membranes from atomistic molecular dynamics simulations. Biosci. Rep. 22, 151–173. doi: 10.1023/A:1020130420869
Sammon, C., Boussetta, S., and Melia, C. (2002). Mapping the distribution of components in formulated polymeric membranes using FTIR-ATR microscopy. Macromol. Symp. 184, 357–370. doi: 10.1002/1521-3900(200208)184:1<357::AID-MASY357>3.0.CO;2-5
Sandhu, P., Zong, J., Yang, D., and Wang, Q. (2013). On the comparisons between dissipative particle dynamics simulations and self-consistent field calculations of diblock copolymer microphase separation. J. Chem. Phys. 138, 194904. doi: 10.1063/1.4804608
Sariban, A., and Binder, K. (1987). Critical properties of the Flory–Huggins lattice model of polymer mixtures. J. Chem. Phys. 86, 5859–5873. doi: 10.1063/1.452516
Saylor, D. M., Kim, C.-S., Patwardhan, D. V., and Warren, J. A. (2007). Diffuse-interface theory for structure formation and release behavior in controlled drug release systems. Acta Biomater. 3, 851–864. doi: 10.1016/j.actbio.2007.03.011
Schaefer, C., Michels, J. J., and van der Schoot, P. (2017). Dynamic surface enrichment in drying thin-film binary polymer solutions. Macromolecules 50, 5914–5919. doi: 10.1021/acs.macromol.7b01224
Schaper, J. (2002). Untersuchungen zur herstellung von lösungen und membranen aus celluloseacetat. (Dissertation), Universität Hannover, Hannover (Germany).
Schuhmacher, E., Soldi, V., and Nunes Pires, A. T. (2001). PMMA or PEO in THF/H2O mixture: phase diagram, separation mechanism and application. J. Memb. Sci. 184, 187–196. doi: 10.1016/S0376-7388(00)00624-4
Schulz, G. V. (1937). Über die löslichkeit und fällbarkeit hochmolekularer stoffe. Z. Phys. Chem. 179A, 321–355. doi: 10.1515/zpch-1937-17930
Semiromi, D. T., and Azimian, A. R. (2011). Molecular dynamics simulation of nonodroplets with the modified Lennard-Jones potential function. Heat. Mass Transf. 47, 579–588. doi: 10.1007/s00231-010-0747-7
Seol, D. J., Hu, S. Y., Li, Y. L., Shen, J., Oh, K. H., and Chen, L. Q. (2003). Computer simulation of spinodal decomposition in constrained films. Acta Mater. 51, 5173–5185. doi: 10.1016/S1359-6454(03)00378-1
Shao, S., Shi, D., Hu, J., Qing, W., Li, X., and Li, X. (2022). Unraveling the kinetics and mechanism of surfactant-induced wetting in membrane distillation: an in situ observation with optical coherence tomography. Environ. Sci. Technol. 56, 556–563. doi: 10.1021/acs.est.1c05090
Shen, J., and Yang, X. (2010). Numerical approximations of Allen-Cahn and Cahn-Hilliard equations. Discrete Contin. Dyn. Syst. A 28, 1669–1691. doi: 10.3934/dcds.2010.28.1669
Shimizu, R., and Tanaka, H. (2017). Impact of complex topology of porous media on phase separation of binary mixtures. Sci. Adv. 3, eaap9570. doi: 10.1126/sciadv.aap9570
Shojaie, S. S., Krantz, W. B., and Greenberg, A. R. (1994a). Dense polymer film and membrane formation via the dry-cast process part I. Model development. J. Membr. Sci. 94, 255–280. doi: 10.1016/0376-7388(93)E0228-C
Shojaie, S. S., Krantz, W. B., and Greenberg, A. R. (1994b). Dense polymer film and membrane formation via the dry-cast process part II. Model validation and morphological studies. J. Membr. Sci. 94, 281–298. doi: 10.1016/0376-7388(93)E0229-D
Shull, K. R., and Kramer, E. J. (1990). Mean-field theory of polymer interfaces in the presence of block copolymers. Macromolecules 23, 4769–4779. doi: 10.1021/ma00224a005
Sides, S. W., and Fredrickson, G. H. (2004). Continuous polydispersity in a self-consistent field theory for diblock copolymers. J. Chem. Phys. 121, 4974–4986. doi: 10.1063/1.1776557
Singh, A., Puri, S., and Dasgupta, C. (2014). Kinetics of phase separation in polymer mixtures: a molecular dynamics study. J. Chem. Phys. 140, 244906. doi: 10.1063/1.4884824
Smit, B. (1992). Phase diagrams of Lennard-Jones fluids. J. Chem. Phys. 96, 8639–8640. doi: 10.1063/1.462271
Smolders, C. A., Aartsen, J. J., and Steenbergen, A. (1971). Liquid-liquid phase separation in concentrated solutions of non-crystallizable polymers by spinodal decomposition. Kolloid Z. Z. Polymere 243, 14–20. doi: 10.1007/BF01500609
Stropnik, C., Germic, L., and Zerjal, B. (1996). Morphology variety and formation mechanisms of polymeric membranes prepared by wet phase inversion. J. Appl. Polym. Sci. 61, 1821–1830. doi: 10.1002/(SICI)1097-4628(19960906)61:10<1821::AID-APP24>3.0.CO;2-3
Su, S.-L., Wang, D.-M., and Lai, J.-Y. (2017). Critical residence time in metastable region – a time scale determining the demixing mechanism of nonsolvent induced phase separation. J. Memb. Sci. 529, 35–46. doi: 10.1016/j.memsci.2017.01.059
Su, Y.-S., Kuo, C.-Y., Wang, D.-M., Lai, J.-Y., Deratani, A., Pochat, C., et al. (2009). Interplay of mass transfer, phase separation, and membrane morphology in vapor-induced phase separation. J. Memb. Sci. 338, 17–28. doi: 10.1016/j.memsci.2009.03.050
Sun, A. C., Kosar, W., Zhang, Y., and Feng, X. (2013). A study of thermodynamics and kinetics pertinent to formation of PVDF membranes by phase inversion. Desalination 309, 156–164. doi: 10.1016/j.desal.2012.10.005
Sun, X., Sun, G., and Wang, X. (2017). Morphology modeling for polymer monolith obtained by non-solvent-induced phase separation. Polymer 108, 432–441. doi: 10.1016/j.polymer.2016.12.026
Tabatabaieyazdi, M., Chan, P. K., and Wu, J. (2016). A computational study of long range surface-directed phase separation in polymer blends under a temperature gradient. Comput. Mater. Sci. 111, 387–394. doi: 10.1016/j.commatsci.2015.09.059
Tan, L., Krantz, W. B., Greenberg, A. R., and Sani, R. L. (1995). Studies of convective transport in evaporative casting of dense polymer films. J. Membrane Sci. 108, 245–255. doi: 10.1016/0376-7388(95)00167-0
Tan, L., Pan, D., and Pan, N. (2008). Thermodynamic study of a water-dimethylformamide-polyacrylonitrile ternary system. J. Appl. Polym. Sci. 110, 3439–3447. doi: 10.1002/app.28392
Tanaka, H. (1996). Universality of viscoelastic phase separation in dynamically asymmetric fluid mixtures. Phys. Rev. Lett. 76, 787–790. doi: 10.1103/PhysRevLett.76.787
Tanaka, H. (1997). Viscoelastic model of phase separation. Phys. Rev. E 56, 4451–4462. doi: 10.1103/PhysRevE.56.4451
Tanaka, H. (2000). Viscoelastic phase separation. J. Phys. Condens. Matter 12, R207-R264. doi: 10.1088/0953-8984/12/15/201
Tanaka, T., Swislow, G., and Ohmine, I. (1979). Phase separation and gelation in gelatin gels. Phys. Rev. Lett. 42, 1556–1559. doi: 10.1103/PhysRevLett.42.1556
Tang, Q., and Müller, M. (2021). Evaporation-induced liquid expansion and bubble formation in binary mixtures. Phys. Rev. Lett. 126, 28003. doi: 10.1103/PhysRevLett.126.028003
Tang, Y., Lin, Y., Ford, D. M., Qian, X., Cervellere, M. R., Millett, P. C., et al. (2021a). A review on models and simulations of membrane formation via phase inversion processes. J. Memb. Sci. 640, 119810. doi: 10.1016/j.memsci.2021.119810
Tang, Y., Lin, Y., Ma, W., and Wang, X. (2021b). A review on microporous polyvinylidene fluoride membranes fabricated via thermally induced phase separation for MF/UF application. J. Memb. Sci. 639, 119759. doi: 10.1016/j.memsci.2021.119759
Tang, Y. H., Lin, H. H., Liu, T. Y., Matsuyama, H., and Wang, X. L. (2016). Multiscale simulation on the membrane formation process via thermally induced phase separation accompanied with heat transfer. J. Memb. Sci. 515, 258–267. doi: 10.1016/j.memsci.2016.04.024
Tegze, G., Pusztai, T., and Gránásy, L. (2005). Phase field simulation of liquid phase separation with fluid flow. Mater. Sci. Eng. A 413–414, 418–422. doi: 10.1016/j.msea.2005.09.045
Teraoka, I. (2002). Polymer Solutions. An Introduction to Physical Properties. New York, NY: Wiley-Interscience. Available online at: ebookcentral.proquest.com/lib/kxp/detail.action?docID=210518
Torrie, G. M., and Valleau, J. P. (1977). Monte Carlo study of a phase-separating liquid mixture by umbrella sampling. J. Chem. Phys. 66, 1402–1408. doi: 10.1063/1.434125
Tree, D. R., Delaney, K. T., Ceniceros, H. D., Iwama, T., and Fredrickson, G. H. (2017). A multi-fluid model for microstructure formation in polymer membranes. Soft Matter 13, 3013–3030. doi: 10.1039/C6SM02839J
Tree, D. R., F, Dos Santos, L., Wilson, C. B., Scott, T. R., Garcia, J. U., and Fredrickson, G. H. (2019). Mass-transfer driven spinodal decomposition in a ternary polymer solution. Soft Matter 15, 4614–4628. doi: 10.1039/C9SM00355J
Tree, D. R., Iwama, T., Delaney, K. T., Lee, J., and Fredrickson, G. H. (2018). Marangoni flows during nonsolvent induced phase separation. ACS Macro Lett. 7, 582–586. doi: 10.1021/acsmacrolett.8b00012
Tsai, F. J., and Torkelson, J. M. (1990). The roles of phase separation mechanism and coarsening in the formation of poly(methyl methacrylate) asymmetric membranes. Macromolecules 23, 775–784. doi: 10.1021/ma00205a014
Tsai, H.-A., Hong, M. J., Huang, G. S., Wang, Y.-C., Li, C.-L., Lee, K.-R., et al. (2002). Effect of DGDE additive on the morphology and pervaporation performances of asymmetric PSf hollow fiber membranes. J. Memb. Sci. 208, 233–245. doi: 10.1016/S0376-7388(02)00265-X
Tsai, H.-A., Kuo, C.-Y., Lin, J. H., Wang, D.-M., Deratani, A., and Pochat-Bohatier, C. (2006). Morphology control of polysulfone hollow fiber membranes via water vapor induced phase separation. J. Memb. Sci. 278, 390–400. doi: 10.1016/j.memsci.2005.11.029
Tsai, H.-A., Kuo, C.-Y., Su, S.-L., Wang, D.-M., and Lai, J.-Y. (2009). The morphological evolution of solvent-containing PMMA membranes in various solvent removal processes. J. Memb. Sci. 345, 288–297. doi: 10.1016/j.memsci.2009.09.011
Tsai, J. T., Su, Y.-S., Wang, D.-M., Kuo, J. L., Lai, J.-Y., and Deratani, A. (2010). Retainment of pore connectivity in membranes prepared with vapor-induced phase separation. J. Memb. Sci. 362, 360–373. doi: 10.1016/j.memsci.2010.06.039
Tsay, C. S., and McHugh, A. J. (1990). Mass transfer modeling of asymmetric membrane formation by phase inversion. J. Polym. Sci. B Polym. Phys. 28, 1327–1365. doi: 10.1002/polb.1990.090280810
Tsay, C. S., and McHugh, A. J. (1991). The combined effects of evaporation and quench steps on asymmetric membrane formation by phase inversion. J. Polym. Sci. B. Polym. Phys. 29, 1261–1270. doi: 10.1002/polb.1991.090291010
Tu, G., Liu, X., Li, Z., Li, S., Liu, J., and Li, W. (2021). Characterizing gelation kinetics of chitosan dissolved in an alkali/urea aqueous solution: mechanisms accounting for the morphological development. J. Memb. Sci. 635, 119516. doi: 10.1016/j.memsci.2021.119516
van Aartsen, J. J., and Smolders, C. A. (1970). Light scattering of polymer solutions during liquid-liquid phase separation. Eur. Polym. J. 6, 1105–1112. doi: 10.1016/0014-3057(70)90135-7
van Emmerik, P. T., and Smolders, C. A. (1972). Phase separation in polymer solutions. I. Liquid-liquid phase separation of PPO poly (2, 6-dimethyl 1, 4-phenylene oxide) in binary mixtures with toluene and ternary mixtures with toluene and ethyl alcohol. J. Polym. Sci. C Polym. Symp. 38, 73–86. doi: 10.1002/polc.5070380108
Venault, A., Jumao-as-Leyba, A. J., Yang, Z.-R., Carretier, S., and Chang, Y. (2016). Formation mechanisms of low-biofouling PVDF/F127 membranes prepared by VIPS process. J. Taiwan Inst. Chem. Eng. 62, 297–306. doi: 10.1016/j.jtice.2015.12.033
Wang, C., Quan, X., Liao, M., Li, L., and Zhou, J. (2017). Computer simulations on the channel membrane formation by nonsolvent induced phase separation. Macromol. Theory Simul. 26, 1700027. doi: 10.1002/mats.201700027
Wang, D.-M., Lin, F.-C., Wu, T.-T., and Lai, J.-Y. (1998). Formation mechanism of the macrovoids induced by surfactant additives. J. Memb. Sci. 142, 191–204. doi: 10.1016/S0376-7388(97)00322-0
Wang, F., Altschuh, P., Ratke, L., Zhang, H., Selzer, M., and Nestler, B. (2019). Progress report on phase separation in polymer solutions. Adv. Mater. 31, e1806733. doi: 10.1002/adma.201806733
Wang, F., Choudhury, A., Strassacker, C., and Nestler, B. (2012). Spinodal decomposition and droplets entrapment in monotectic solidification. J. Chem. Phys. 137, 34702. doi: 10.1063/1.4734485
Wang, F., and Nestler, B. (2021). Wetting transition and phase separation on flat substrates and in porous structures. J. Chem. Phys. 154, 94704. doi: 10.1063/5.0044914
Wang, F., Ratke, L., Zhang, H., Altschuh, P., and Nestler, B. (2020). A phase-field study on polymerization-induced phase separation occasioned by diffusion and capillary flow—a mechanism for the formation of porous microstructures in membranes. J. Sol. Gel. Sci. Technol. 94, 356–374. doi: 10.1007/s10971-020-05238-7
Wang, J., Zheng, L., Wu, Z., Zhang, Y., and Zhang, X. (2016). Fabrication of hydrophobic flat sheet and hollow fiber membranes from PVDF and PVDF-CTFE for membrane distillation. J. Memb. Sci. 497, 183–193. doi: 10.1016/j.memsci.2015.09.024
Wang, L., Zhang, L., and Lin, J. (2008). Microphase separation in multigraft copolymer melts studied by random-phase approximation and self-consistent field theory. J. Chem. Phys. 129, 114905. doi: 10.1063/1.2980052
Wang, Q., Taniguchi, T., and Fredrickson, G. H. (2004). Self-consistent field theory of polyelectrolyte systems. J. Phys. Chem. B 108, 6733–6744. doi: 10.1021/jp037053y
Wang, Z., Lee, S. L., Huang, T.-C., Lin, G.-S., Yoshioka, T., and Tung, K.-L. (2022). Molecular Modelling and Simulation of Membrane Formation. 60 Years of the Loeb-Sourirajan Membrane. Amsterdam; Oxford; Cambridge, MA: Elsevier, 463–497. doi: 10.1016/B978-0-323-89977-2.00017-8
Wang, Z., and Ma, J. (2012). The role of nonsolvent in-diffusion velocity in determining polymeric membrane morphology. Desalination 286, 69–79. doi: 10.1016/j.desal.2011.11.006
Wenning, C., Barbe, S., Achten, D., Schmidt, A. M., and Leimenstoll, M. C. (2018). Prediction of initial miscibility for ternary polyurethane reaction mixtures on basis of solubility parameters and Flory-Huggins theory. Macromol. Chem. Phys. 219, 1700544. doi: 10.1002/macp.201700544
Wijmans, J. G., Kant, J., Mulder, M., and Smolders, C. A. (1985). Phase separation phenomena in solutions of polysulfone in mixtures of a solvent and a nonsolvent: relationship with membrane formation. Polymer 26, 1539–1545. doi: 10.1016/0032-3861(85)90090-4
Wodo, O., and Ganapathysubramanian, B. (2012). Modeling morphology evolution during solvent-based fabrication of organic solar cells. Comput. Mater. Sci. 55, 113–126. doi: 10.1016/j.commatsci.2011.12.012
Wodo, O., and Ganapathysubramanian, B. (2014). How do evaporating thin films evolve? Unravelling phase-separation mechanisms during solvent-based fabrication of polymer blends. Appl. Phys. Lett. 105, 153104. doi: 10.1063/1.4898136
Wohlert, J., Otter, W. K. d, Edholm, O., and Briels, W. J. (2006). Free energy of a trans-membrane pore calculated from atomistic molecular dynamics simulations. J. Chem. Phys. 124, 154905. doi: 10.1063/1.2171965
Yaldram, K., and Binder, K. (1991). Monte Carlo simulation of phase separation and clustering in the ABV model. J. Stat. Phys. 62, 161–175. doi: 10.1007/BF01020864
Yamamoto, S., and Hyodo, S. A. (2003). A computer simulation study of the mesoscopic structure of the polyelectrolyte membrane nafion. Polym. J. 35, 519–527. doi: 10.1295/polymj.35.519
Yam-Cervantes, M., León-Campos, I., Sánchez, J., Santiago-García, J. L., Estrella-Gómez, N. E., and Aguilar-Vega, M. (2019). Poly(hydroxyamide) as support for thin-film composite membranes for water treatment. Polym. Bull. 76, 4613–4625. doi: 10.1007/s00289-018-2619-0
Yan, L.-T., Li, J., Li, Y., and Xie, X.-M. (2008). Kinetic pathway of pattern-directed phase separation in binary polymer mixture films. Macromolecules 41, 3605–3612. doi: 10.1021/ma702616s
Yan, L.-T., and Xie, X.-M. (2006). Numerical simulation of surface effects on spinodal decomposition in polymer binary mixture: quench depth dependence. Macromolecules 39, 2388–2397. doi: 10.1021/ma0524878
Yang, H.-C., Wu, Q.-Y., Liang, H.-Q., Wan, L.-S., and Xu, Z.-K. (2013). Thermally induced phase separation of poly(vinylidene fluoride)/diluent systems: optical microscope and infrared spectroscopy studies. J. Polym. Sci. B Polym. Phys. 51, 1438–1447. doi: 10.1002/polb.23347
Yave, W., Quijada, R., Serafini, D., and Lloyd, D. R. (2005). Effect of the polypropylene type on polymer–diluent phase diagrams and membrane structure in membranes formed via the TIPS process part I. Metallocene and ziegler–natta polypropylenes. J. Membr. Sci. 263, 146–153. doi: 10.1016/j.memsci.2005.04.043
Yilmaz, L., and McHugh, A. J. (1986). Modelling of asymmetric membrane formation. I. Critique of evaporation models and development of a diffusion equation formalism for the quench period. J. Membr. Sci. 28, 287–310. doi: 10.1016/S0376-7388(00)82040-2
Yilmaz, L., and McHugh, A. J. (1988). Modeling of asymmetric membrane formation. II. The effects of surface boundary conditions. J. Appl. Polym. Sci. 35, 1967–1979. doi: 10.1002/app.1988.070350722
Yin, C. Q., Dong, J., Li, Z., Zhang, Z. X., and Zhang, Q. (2015). Ternary phase diagram and fiber morphology for nonsolvent/DMAc/polyamic acid systems. Polym. Bull. 72, 1039–1054. doi: 10.1007/s00289-015-1324-5
Yoo, S. H., and Kim, C. K. (2008). Effects of the diluent mixing ratio and conditions of the thermally induced phase-separation process on the pore size of microporous polyethylene membranes. J. Appl. Polym. Sci. 108, 3154–3162. doi: 10.1002/app.27891
Yoshimoto, K., and Taniguchi, T. (2021). Viscoelastic phase separation model for ternary polymer solutions. J. Chem. Phys. 154, 104903. doi: 10.1063/5.0039208
Zausch, J., Horbach, J., Virnau, P., and Binder, K. (2010). A combined molecular dynamics and Monte Carlo study of the approach towards phase separation in colloid-polymer mixtures. J. Phys. Condens. Matter 22, 104120. doi: 10.1088/0953-8984/22/10/104120
Zeman, L., and Fraser, T. (1993). Formation of air-cast cellulose acetate membranes. Part I. Study of macrovoid formation. J. Membr. Sci. 84, 93–106. doi: 10.1016/0376-7388(93)85053-Y
Zeman, L., and Fraser, T. (1994). Formation of air-cast cellulose acetate membranes. Part II. Kinetics of demixing and microvoid growth. J. Membr. Sci. 87, 267–279. doi: 10.1016/0376-7388(94)87033-0
Zhang, B., Lu, C., Liu, Y., and Zhou, P. (2018). Wet spun polyacrylontrile-based hollow fibers by blending with alkali lignin. Polymer 149, 294–304. doi: 10.1016/j.polymer.2018.07.019
Zhang, H., Wang, F., and Nestler, B. (2022). Janus droplet formation via thermally induced phase separation: a numerical model with diffusion and convection. Langmuir 22, 6882–6895. doi: 10.1021/acs.langmuir.2c00308
Zhang, H., Wu, Y., Wang, F., Guo, F., and Nestler, B. (2021). Phase-Field modeling of multiple emulsions via spinodal decomposition. Langmuir 37, 5275–5281. doi: 10.1021/acs.langmuir.1c00275
Zhang, L., Sevink, A., and Schmid, F. (2011). Hybrid lattice boltzmann/dynamic self-consistent field simulations of microphase separation and vesicle formation in block copolymer systems. Macromolecules 44, 9434–9447. doi: 10.1021/ma2018638
Zhang, T., Cogan, N., and Wang, Q. (2008). Phase-field models for biofilms II 2-D Numerical simulations of biofilm-flow interaction. Commun. Comput. Phys. 4, 72–101. Available online at: global-sci.org/intro/article_detail/cicp/7782.html
Zhang, Z., An, Q., Ji, Y., Qian, J., and Gao, C. (2010). Effect of zero shear viscosity of the casting solution on the morphology and permeability of polysulfone membrane prepared via the phase-inversion process. Desalination 260, 43–50. doi: 10.1016/j.desal.2010.05.002
Zhao, S., Wang, Z., Wei, X., Tian, X., Wang, J., Yang, S., et al. (2011). Comparison study of the effect of PVP and PANI nanofibers additives on membrane formation mechanism, structure and performance. J. Memb. Sci. 385-386, 110–122. doi: 10.1016/j.memsci.2011.09.029
Zheng, X., Yang, C., Cai, X.-C., and Keyes, D. (2015). A parallel domain decomposition-based implicit method for the Cahn–Hilliard–Cook phase-field equation in 3D. J. Comput. Phys. 285, 55–70. doi: 10.1016/j.jcp.2015.01.016
Zhou, Y., Mei, B., and Schweizer, K. S. (2020). Integral equation theory of thermodynamics, pair structure, and growing static length scale in metastable hard sphere and Weeks-Chandler-Andersen fluids. Physical review. E 101, 42121. doi: 10.1103/PhysRevE.101.042121
Zhu, J., Lu, X., Balieu, R., and Kringos, N. (2016). Modelling and numerical simulation of phase separation in polymer modified bitumen by phase-field method. Mater. Des. 107, 322–332. doi: 10.1016/j.matdes.2016.06.041
Zoppi, R. A., Contant, S., Duek, E. A. R., Marques, F. R., Wada, M. L. F., and Nunes, S. P. (1999). Porous poly(l-lactide) films obtained by immersion precipitation process: morphology, phase separation and culture of VERO cells. Polymer 40, 3275–3289. doi: 10.1016/S0032-3861(98)00562-X
Zoumpouli, G. A., and Yiantsios, S. G. (2016). Hydrodynamic effects on phase separation morphologies in evaporating thin films of polymer solutions. Phys. Fluids 28, 82108. doi: 10.1063/1.4961303
Keywords: membrane formation, modeling and simulation, kinetics, phase inversion, in-situ, experimental characterization, porous polymer membranes
Citation: Bohr SJ, Wang F, Metze M, Vukušić JL, Sapalidis A, Ulbricht M, Nestler B and Barbe S (2023) State-of-the-art review of porous polymer membrane formation characterization—How numerical and experimental approaches dovetail to drive innovation. Front. Sustain. 4:1093911. doi: 10.3389/frsus.2023.1093911
Received: 09 November 2022; Accepted: 17 January 2023;
Published: 08 February 2023.
Edited by:
Eric C. D. Tan, National Renewable Energy Laboratory (DOE), United StatesReviewed by:
Serene Sow Mun Lock, University of Technology Petronas, MalaysiaNing Sun, Berkeley Lab (DOE), United States
Copyright © 2023 Bohr, Wang, Metze, Vukušić, Sapalidis, Ulbricht, Nestler and Barbe. This is an open-access article distributed under the terms of the Creative Commons Attribution License (CC BY). The use, distribution or reproduction in other forums is permitted, provided the original author(s) and the copyright owner(s) are credited and that the original publication in this journal is cited, in accordance with accepted academic practice. No use, distribution or reproduction is permitted which does not comply with these terms.
*Correspondence: Sven Johann Bohr,  c3Zlbl9qb2hhbm4uYm9ockB0aC1rb2Vsbi5kZQ==; Stéphan Barbe, c3RlcGhhbi5iYXJiZUB0aC1rb2Vsbi5kZQ==; Fei Wang, ZmVpLndhbmdAa2l0LmVkdQ==