- 1Intrinsik Corp, Calgary, AB, Canada
- 2Moccasin Flower Consulting, Slave Lake, AB, Canada
- 3Chipewyan Prairie Industry Relations Corporation, Lac La Biche, AB, Canada
- 4Askip Napew Consulting Ltd. (Formerly of Swan River First Nation, Kinuso, AB, Canada), Slave Lake, AB, Canada
The consumption of traditional foods, including moose, is vitally important to Canada's indigenous communities for dietary, social, and cultural reasons. Cadmium is a key contaminant of concern in moose as it accumulates primarily the organs, with the kidney accumulating more than the liver. The objectives of this study were to identify relationships between cadmium concentrations in the kidney, liver and muscle tissue of moose, and to estimate benchmark consumption quantities that are associated with minimal health risk for three First Nation communities: the Chipewyan Prairie Déné First Nation, the Swan River First Nation and Cold Lake First Nations. Moose quality studies were conducted with the Chipewyan Prairie Déné First Nation in 2012, the Swan River First Nation in 2014 and the Cold Lake First Nations in 2016, all located in Alberta, Canada. The measured cadmium tissue concentrations from these studies were found to be comparable to those reported in the 2016 Alberta First Nations Food, Nutrition and Environment Study, and other North American studies. The results of our study suggest that linear relationships exist between cadmium concentrations in kidney and liver tissue, which can be used as a tool to predict organ concentrations in moose from northern Alberta. First Nations communities can use this information to predict cadmium tissue concentrations in both kidney and liver in the absence of actual, measured cadmium concentrations. Benchmark consumption quantities that are associated with minimal risk were estimated for the different tissue types.
Introduction
The consumption of moose muscle and organ tissue is of high dietary, social, and cultural significance to First Nations communities in Canada. Since it is traditional for individuals to consume the majority of a harvested animal, First Nation hunters and harvesters may have exposure to higher levels of contaminants than their non-Indigenous counterparts. This is because organ meats, especially the liver and kidney, typically have higher concentrations of inorganic elements than muscle tissue. As a result, First Nation hunters and their families may ingest concentrations of metals that exceed recommended levels through their consumption of both moose organ meat and muscle tissue. In the three moose quality studies completed in northern Alberta, moose tissue samples were collected by First Nation hunters as part of their food harvesting practices and then generously shared for investigation. The cadmium concentrations in moose tissues were measured, as part of larger studies, to characterize the tissue quality of moose (muscle, kidney, and liver) harvested from the First Nations' traditional territories in north central and northeastern Alberta. The measured moose tissue concentrations and locally obtained consumption information were used to complete human health risk assessments for moose consumption for each of the Nations.
The studies were undertaken with the Chipewyan Prairie Déné First Nation (CPDFN) in 2012, with Swan River First Nation (SRFN) in 2014 and with Cold Lake First Nations (CLFN) in 2016. The CLFN and the SRFN studies were funded through Health Canada's First Nations Environmental Contaminants Program (FNECP) and the CPDFN study was funded through their Industry Relations Corporation.
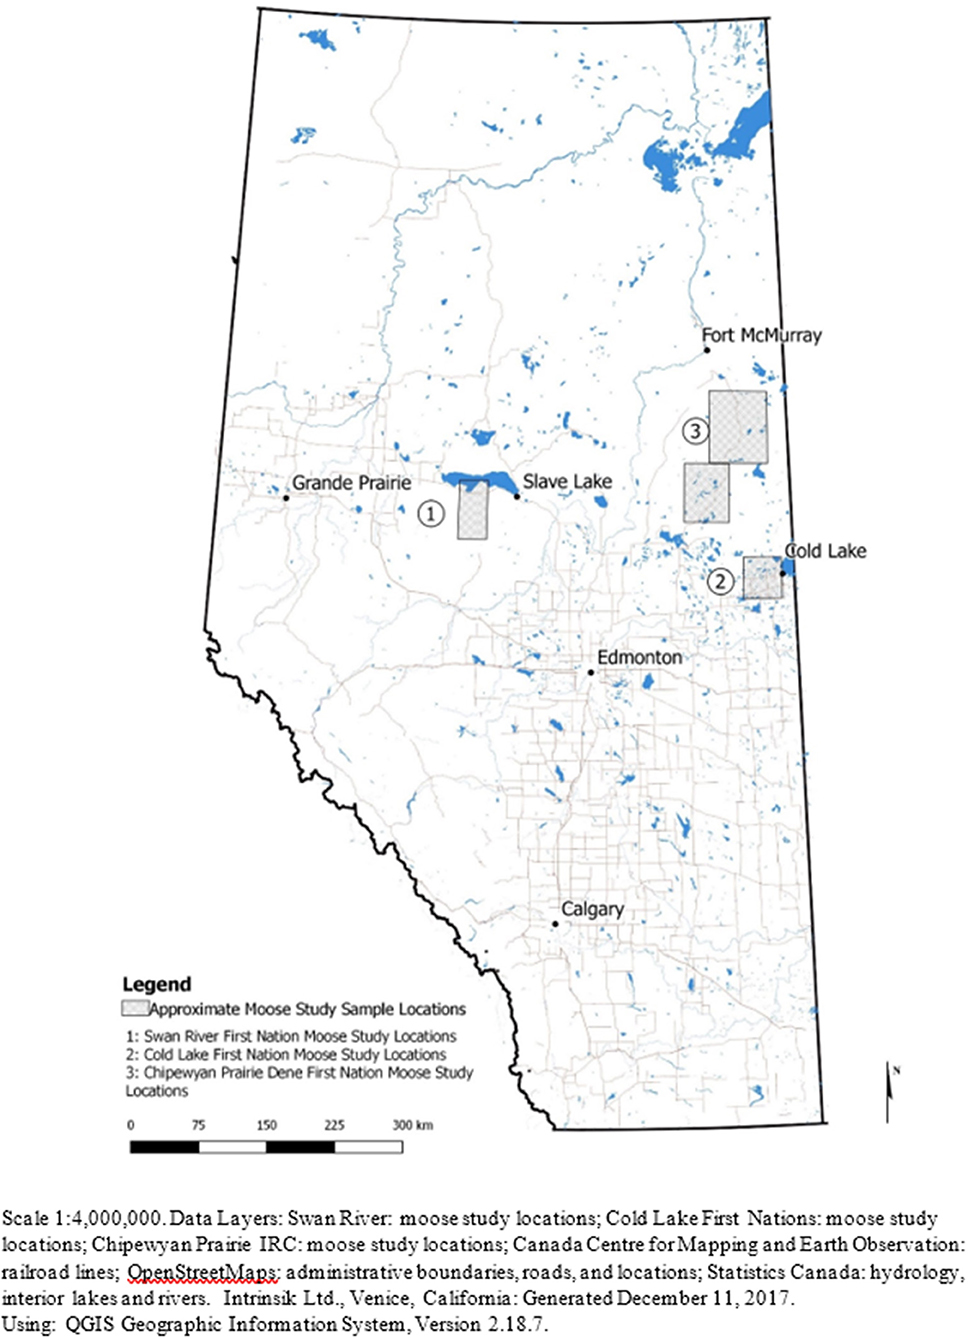
A total of 50 moose were harvested between the three studies: nine from CLFN, 15 from SRFN and 26 from CPDFN. Animals were harvested from north central Alberta in the area of Lesser Slave Lake and Swan Hills, in east central Alberta in the vicinity of the heavy oil deposits on the Alberta/Saskatchewan borders (Cold Lake Oil Sands) and in northeastern Alberta in the southern oil sands region (Southern Athabasca Oil Sands). Samples of muscle, liver and kidney tissue were submitted for metals analysis and cadmium was the primary inorganic element (metal) of focus in the studies. The age, sex, and approximate weight of the moose were identified by the hunters at the time of harvest. Details of the measured cadmium concentrations in the tissues of each of the animals harvested are provided. The age and weight estimates for the individual moose were subjective to the harvester, which introduced a level of uncertainty in the correlations.
The data from the three studies are presented individually and as a pooled dataset to identify possible relationships between kidney, liver and muscle cadmium concentrations and the age and sex of animals. The measured concentrations were compared to measured cadmium concentrations reported in the 2016 Alberta First Nations Food, Nutrition and Environment Study (FNFNES) (Chan et al., 2016) and to other North American studies.
Materials and Methods
Sample Collection
Moose were harvested from northern Alberta by community members from CLFN, SRFN, and CPDFN (Figure 1). The moose were collected as part of each community's regular harvesting activities, and the communities generously shared muscle, liver and kidney samples from a total of 50 individual moose for the study. A total of 47 muscle samples, 48 liver samples and 49 kidney samples, were collected for analysis. CLFN provided samples from nine moose collected in the fall of 2016 and the winter of 2017 near Cold Lake, Alberta. SRFN collected moose in the summer and fall of 2015 near Kinuso, Alberta and provided samples from 15 animals. CPDFN contributed samples from 26 moose collected throughout 2012 near Janvier, Alberta in the area south of Fort McMurray.
Workshops took place in each community prior to sample collection so that community members could be trained in sample collection, sample integrity, an understanding of potential sources of contamination, documentation, and storage. A clean and unused set of gloves was worn for handling each sample and a new knife blade was used for cutting each sample. In order reduce any variability in cadmium concentrations associated with tissue type and to provide consistency across the assessment, muscle samples were taken from the hind left leg of each animal and liver samples were taken from the middle section or the left lobe of the liver. One entire kidney was submitted from each animal. Each sample weighed approximately 450 g (or 1 lb). Each sample was placed into a clean, unused plastic bag provided by the laboratory and the samples remained frozen until they were received by the laboratory for analysis.
Sample Questionnaires
The sex, the approximate age and the weight, of each harvested animal were recorded in a questionnaire completed by each hunter. The sample questionnaires were designed to provide information about the harvested animal, anecdotal details regarding wildlife abundance in the area and details of sampling or harvesting effort. The sample location reported by the hunter was recorded on a community map.
Inorganic Elements Analysis
The CLFN samples were analyzed by ALS Environmental (Edmonton, Alberta) and the SRFN and CPDFN samples were analyzed by Maxxam Analytics (Edmonton, Alberta). Each sample was homogenized in the laboratory prior to chemical analysis. Cadmium (Cd) and other inorganic elements were quantified using inductively coupled plasma—mass spectrometry (ICP-MS). The analytical methods were modified from Method 6020A, developed by the United States Environmental Protection Agency (US EPA, 1998). The three studies were undertaken independent of each other and the analytical work was completed over four years at different laboratories. The reportable cadmium detection limit for the CPDFN assessment was 0.01 mg/kg (Maxxam Analytics), for the SRFN assessment it was 0.002 mg/kg (Maxxam Analytics) and for the CLFN assessment it was 0.001 mg/kg (ALS Environmental). All results were provided on a wet weight basis.
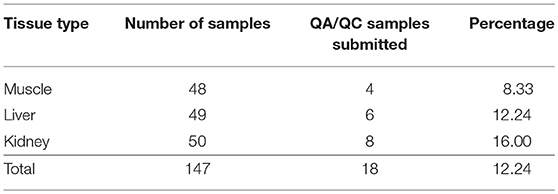
A quality assurance and quality control (QA/QC) target equivalent to 10% of the total number of tissue samples submitted was set for each program. At a minimum, at least one duplicate sample for each tissue type was submitted for metals analysis in each of the three studies; these samples were blind duplicates. Details of the number of QA/QC samples from each study are included in Table 1. The analytical results were compared using a relative percent difference calculation (RPD). The RPD was calculated through a mathematical comparison of the analyte concentration in the sample and the duplicate. A guideline of RPD ≤ 30% (US EPA NE and US ACE NED 2004) (US EPA New England, 2004) was used to determine acceptability of the duplicate vs. the control. This criterion was deemed to be acceptable as the tissue samples are not entirely homogenous and therefore slight differences in composition may occur. The RPD results showed that the majority of duplicates met the guideline of RPD ≤ 30%, with very few exceptions; the exceptions were confirmed by the lab to be due to sample heterogeneity. The concentrations of the duplicate samples were not included in the calculations of the summary statistics.
In addition to blind duplicate samples being submitted by each First Nation, the laboratories also completed internal QA/QC protocols. These protocols included the use of laboratory duplicates, laboratory control samples, method blanks, matrix spikes, and relative percent difference calculations for laboratory control duplicate samples. The QA/QC results met the data quality objectives required by each of the laboratories. In all cases, the percent recovery for the matrix spikes was within the QC target of 75–125% (ranging between 92 and 101%); the percent recovery for the spiked blanks was within the QC target of 75–125% (ranging between 94 and 109%); the method blanks recorded concentrations below the method detection limit for all analytes; and the RPD was below the QC target of 35% (ranging between 2.0 and 4.8%).
Data Analysis
To determine whether there was a correlation between cadmium concentrations in the kidney and liver, the square of the Pearson product moment correlation coefficient (r2 value) was calculated. This analysis was done for each study individually and for the pooled data from all three studies.
The analytical results for the cadmium concentrations in muscle tissue for the CLFN and SRFN studies were compared against one another to determine if the populations were statistically different. The Student's t-test was used, assuming unequal variance and a two-tailed distribution at a significance level of 0.05. A similar comparison was not made for the CPDFN data because the reportable detection limits were higher than the CLFN and SRFN studies, and the majority of the muscle tissue concentrations from CPDFN were below the reportable detection limit.
Results
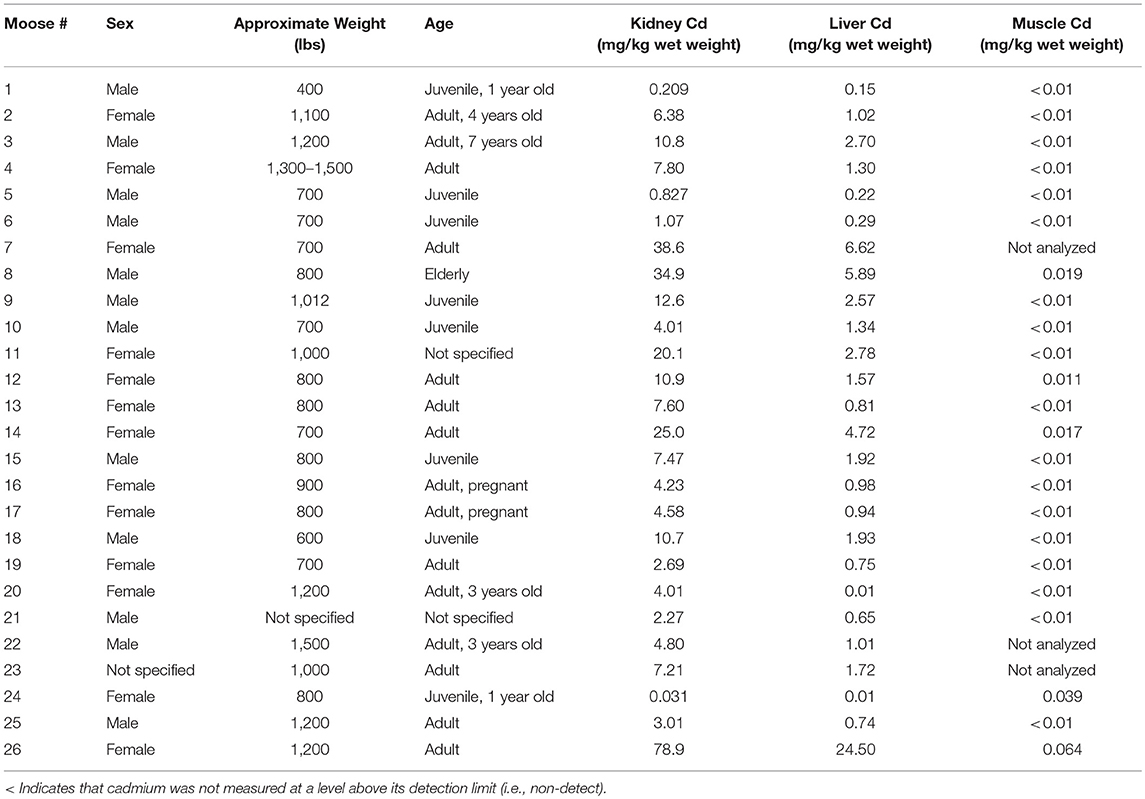
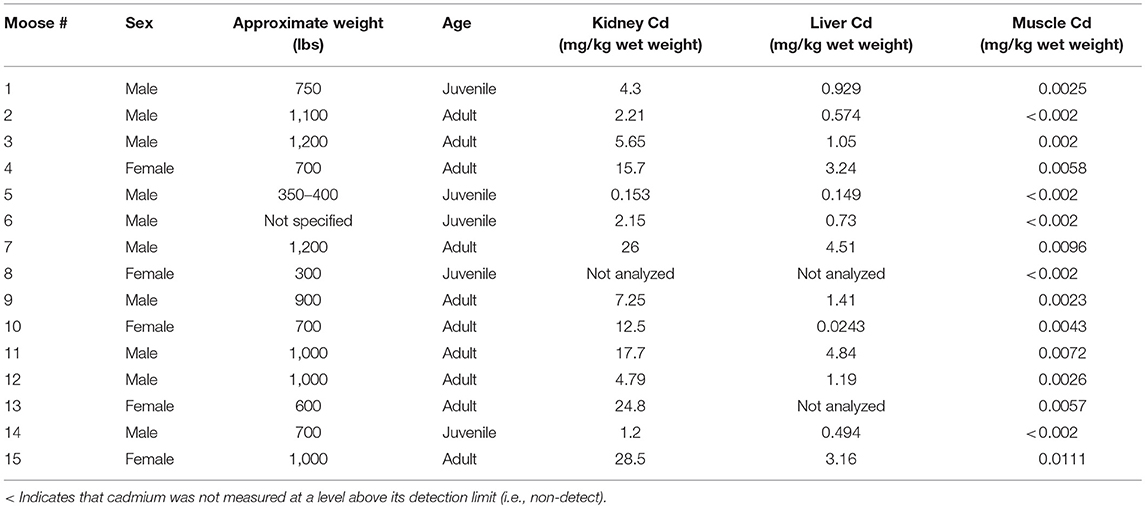
Results for each study are presented in Tables 2–4, from CPDFN, SRFN, and CLFN respectively. None of the cadmium concentrations in either organ were below the reportable detection limit in any of the studies. Five muscle samples were below the reportable detection limit of 0.002 mg/kg in the SRFN study and 18 of the 26 muscle samples submitted in the CPDFN study had concentrations below the reportable detection level of 0.01 mg/kg.
Summary statistics (minimum, maximum, mean, standard deviation) were calculated for each study. Tables 5–7 present the summary statistics for CPDFN, SRFN, and CLFN, respectively.
Comparison of Cadmium Concentrations Between Moose Harvested by the Three Nations
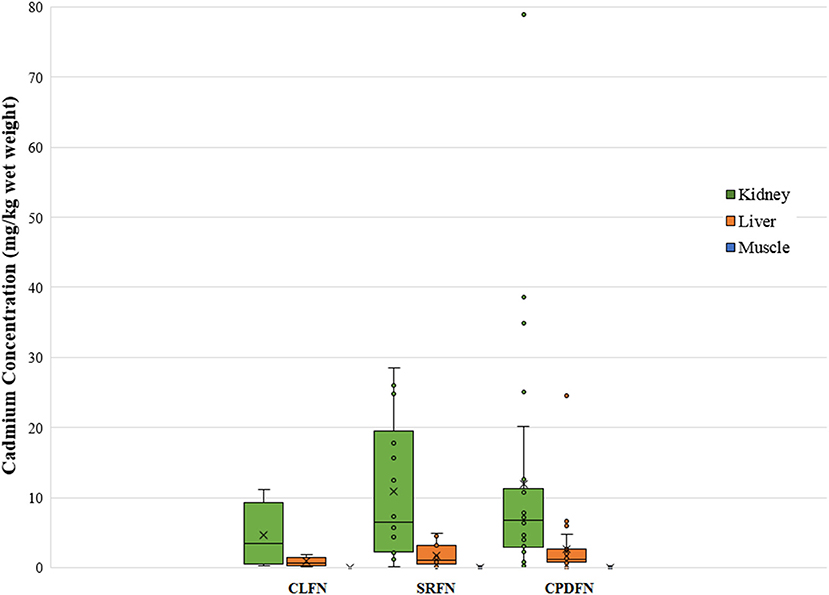
Based on review of the data and the fact that the cadmium concentrations increase with age in the liver and kidney, the t-test showed expected differences in the data for these organs. As cadmium does not accumulate in the muscle tissue, the muscle tissue concentrations were compared to establish if the moose were from the same population. A two-tailed t-test run between muscle concentrations from moose harvested by the SRFN and the CLFN identified that the moose were from the same population (p-value = 0.82). As the analytical detection level for cadmium in muscle tissue for the CPDFN moose was an order of magnitude higher than both the SRFN and CLFN studies, a box plot was used to identify whether the data appeared comparable (Figure 2). Figure 2 shows that, with the exceptions of several outliers, the majority of the CPDFN data are within the range of cadmium concentrations seen in the CLFN and SRFN studies.
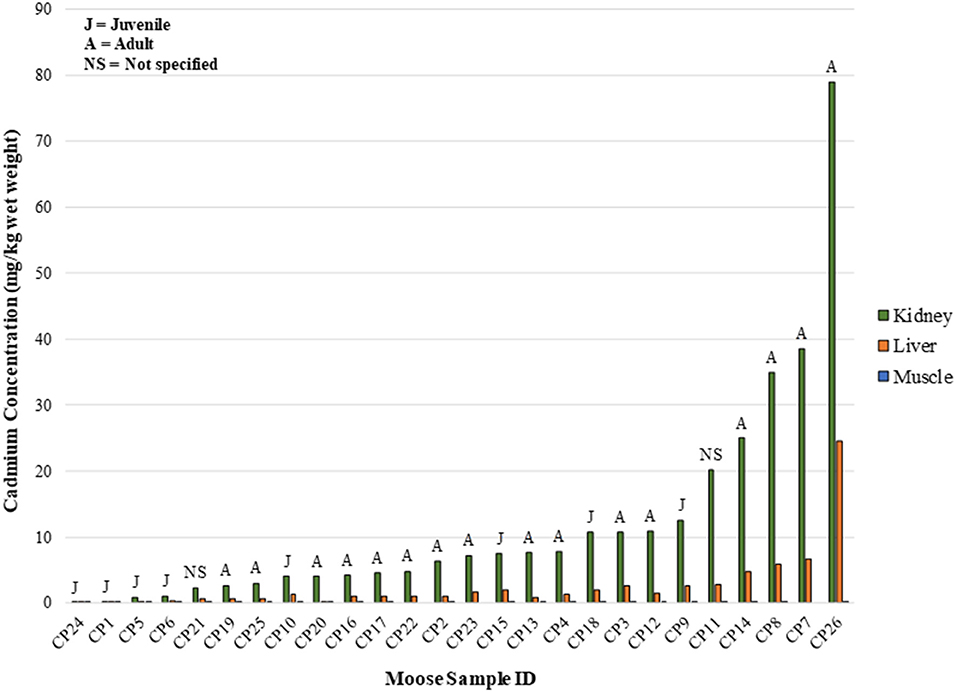
In the CPDFN samples, the measured cadmium concentrations in the kidney and liver of juvenile animals are lower than those measured in moose identified as adults (Figure 3). A linear regression of the CPDFN organ concentration values resulted in a r2 value of 0.92, indicating a positive relationship between the cadmium concentrations in the organ tissues. A linear regression of the natural log transformed organ concentrations resulted in an r2 value of 0.72, again indicating a positive relationship.
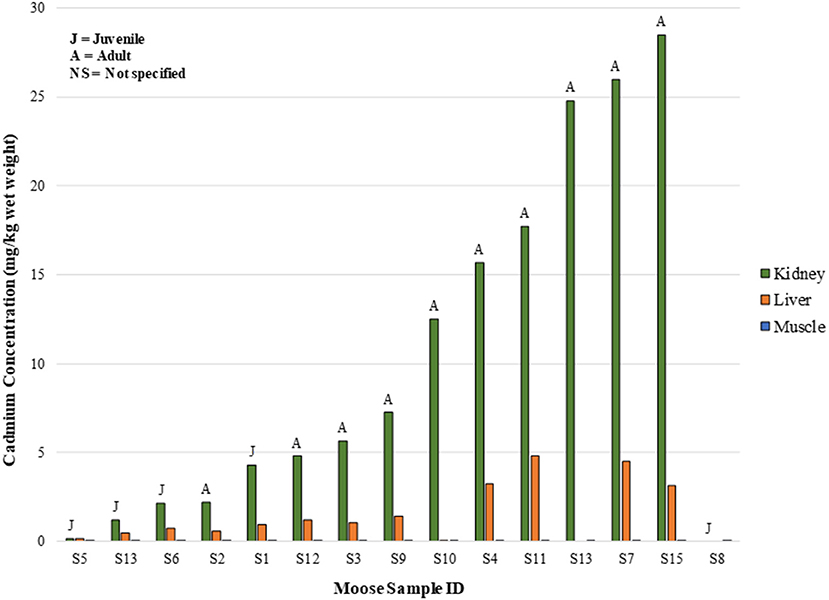
In the SRFN samples, with the exceptions of five moose muscle samples, there were measurable concentrations of cadmium in all moose tissues tested. Correlations between liver and muscle cadmium concentrations, liver and kidney concentrations, and kidney and muscle cadmium concentrations were evident in the tissue concentration data (i.e., the animal with the higher cadmium muscle concentrations generally also had the higher cadmium liver and kidney concentrations, with the kidney concentrations being the highest of all tissues) (Figure 4). The r2 value for the linear regression of the organ concentration values was 0.67, again indicating a positive relationship.
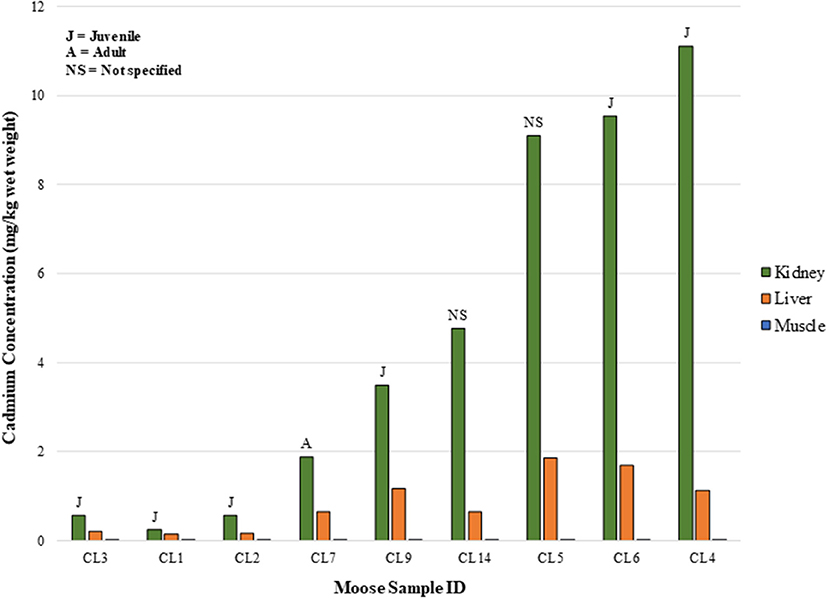
In the CLFN samples, as with the SRFN samples, correlations between liver and muscle cadmium concentrations, liver and kidney concentrations, and kidney and muscle cadmium concentrations were evident in the tissue concentration data (Figure 5). The muscle samples had the lowest cadmium concentrations (range: 0.0011–0.0068 mg/kg). The r2 value for the linear regression of the organ concentration values was 0.70, indicating a positive relationship between the cadmium concentrations in the organ tissues evaluated in this assessment (plotted on a linear scale). The results of the sample questionnaires indicate that primarily younger animals (identified as juvenile and calf) were harvested in this study. As a result, the data could not be correlated with approximate age.
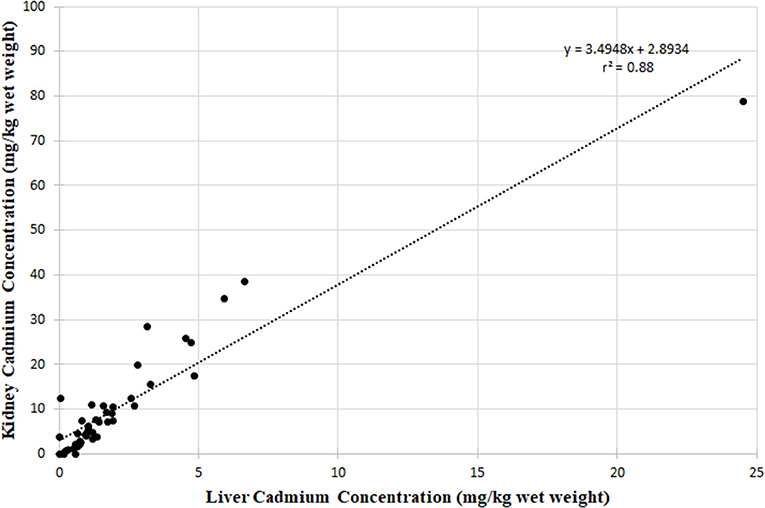
Figure 6 shows the liver cadmium concentrations plotted against the kidney cadmium concentrations for the pooled CLFN, SRFN and CPDFN data. For the pooled data, the r2 value was 0.88, indicating a positive relationship between the cadmium concentrations in the organ tissues (Figure 6).
Relationship Between Cadmium Kidney and Liver Concentrations
Danielsson and Frank (2009) investigated cadmium concentrations in moose kidney and liver tissues using data from a study of approximately 4,000 moose in Sweden. They derived a relationship based on both animal age and sex to express cadmium concentrations in kidney and liver. The relationship allowed for the estimation of cadmium concentrations in the kidney from liver values. They determined that a linear regression of the natural log transformed cadmium concentrations (estimated as yearly uptake) generated the relationship Cdkidney = 3.4*(Cdliver)0.8, using acronyms of Cdkidney to represent the cadmium concentration in kidney and Cdliver to represent the cadmium concentration in the liver. They stated that the relationship did not account for the fact that the cadmium concentration in the kidney increased more rapidly with age than the cadmium concentration in the liver, and they also assumed that the model was valid for all moose in the sample for each sex and organ. They ascertained a relationship of r = 0.77 for their data (where r = 1 denotes a 1:1 relationship).
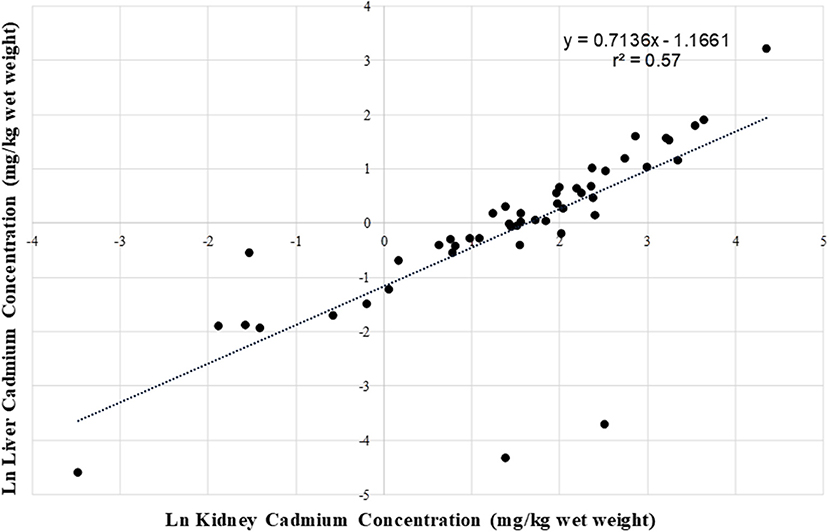
In the application of the Danielsson and Frank equation to the pooled data from this study, it was observed that it was useful in predicting the kidney concentrations but was limited to cases where liver concentrations were less than <1 mg/kg. For the current assessment, (CLFN, SRFN and CPDFN) when the liver concentration was used as the predictive variable, a stronger relationship was seen on a linear scale (r = 0.94, r2 = 0.88; Figure 6) than for the natural log transformed cadmium values (r = 0.75, r2 = 0.57; Figure 7). The linear equation of the pooled data was 2.9; the linear equation using the kidney concentration as the predictive variable 0.71 provided a stronger correlation (r = 0.96, r2 = 0.92). Neither of the equations was age or sex specific, and both could be used to predict one organ concentration given the availability of the other.
Discussion
Cadmium has been identified by the Government of Canada (2008) as a key contaminant of concern in moose. Kelly et al. (2010) identified cadmium as one of 13 priority pollutants investigated in the environment in the vicinity of the Athabasca River and the mineable oil sands area (i.e., north of the Southern Athabasca Oil Sands). Cadmium is a naturally occurring metal that does not break down in the environment, is absorbed by plants and enters the food chain through consumption by mammals. Studies have shown that cadmium is naturally accumulated by willow plants (Robinson et al., 2000; Kuzovkina et al., 2004) and willows are a forage species for moose (Gamberg, 2000; McGee et al., 2007). Ingested cadmium accumulates over time as the animal ages and is primarily concentrated in the organs, with the kidney accumulating more than the liver (Gamberg, 2000). Higher cadmium levels are associated with increased age, which is why older moose show higher cadmium concentrations (Arnold et al., 2006). The principal source of cadmium exposure for humans is through the smoking of cigarettes. For those individuals who do not smoke, the greatest source of cadmium is from the diet. Moose organs were identified as the primary source of cadmium in the diet of First Nations individuals consuming traditional foods in the 2016 Alberta FNFNES (Chan et al., 2016).
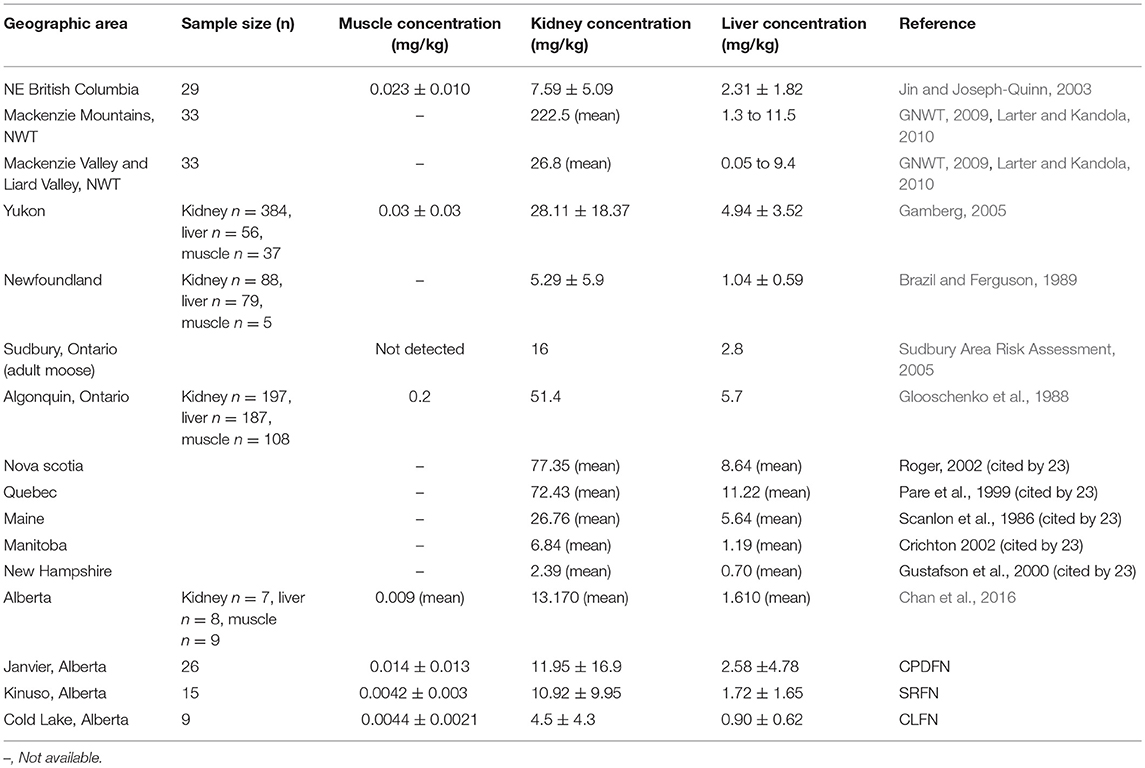
Moose cadmium tissue concentrations from various geographic areas in North America are presented in Table 8. The measured cadmium concentrations in the tissues and organs from the pooled data are within the same range as concentrations measured in other northern locations. Concentrations from the three studies (CPDFN, SRFN, and CLFN) are included at the bottom of Table 8 and are presented as mean ± standard deviation in order to facilitate comparison to the other data.
The average concentrations in the three studies are similar to the muscle, kidney, and liver concentrations reported in the 2016 Alberta FNFNES (Chan et al., 2016), although the FNFNES (Chan et al., 2016) results were based on a relatively small sample size (Table 8). For all three studies pooled together, the average cadmium muscle concentration is 0.0092 mg/kg, the average kidney concentration is 10 mg/kg and the average liver concentration is 2.0 mg/kg.
The average muscle cadmium concentrations in the three studies (CPDFN, SRFN, and CLFN) are lower than those reported in other Canadian provinces possibly due to the influence of local geology on regional soil metal concentrations (Table 8). The average kidney and liver concentrations in the three studies are within the range of concentrations reported in other parts of Canada and the United States. It can be seen from Table 8 that the data from the CPDFN, SRFN, and CLFN studies are consistent with what is known about cadmium accumulation being primarily concentrated in the organs, with the kidney accumulating more than the liver (Robinson et al., 2000; Parker, 2003).
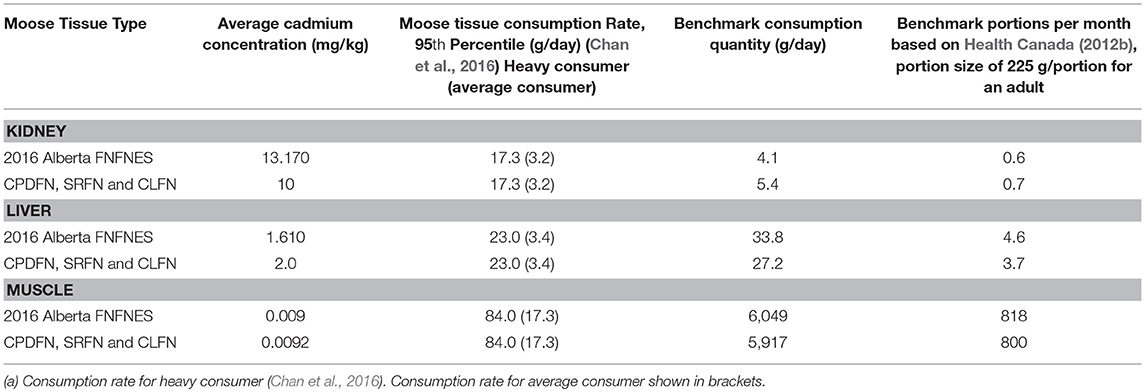
Risk assessment equations that were used to calculate benchmark consumption quantities incorporate techniques and procedures to predict or calculate exposure. The equations were developed by various regulatory agencies (e.g., US EPA, Canadian Council of Ministers of the Environment and Health Canada) and published by academic and scientific literature sources. Receptor characteristics (e.g., adult body weight of 70.7 kg) and the cadmium toxicological reference value of 1 μg/kg-bw/day (i.e., RfD) based on Health Canada (Health Canada, 2010, 2012a), were used in the assessment. The 2016 Alberta FNFNES provides consumption rates of moose muscle, kidney and liver. The FNFNES defined both heavy and mean consumption rates. Heavy consumers were defined as those individuals eating at the upper end, or the 95th percentile of intakes; the mean consumption rate was the mean rate for those self-identifying as “eaters.” The 95th percentile consumption rate reported in the 2016 Alberta FNFNES for moose muscle, kidney and liver were used in combination with the mean muscle, kidney and liver cadmium concentrations reported in the FNFNES to calculate benchmark consumption quantities—amounts of moose muscle and organs that can be safely consumed (Table 9).
Using the concentration data from the pooled dataset, a risk assessment was completed and risk-based benchmark consumption quantities were calculated. In order to characterize cadmium exposures from sources other than moose consumption, and to be consistent with (Jin and Joseph-Quinn, 2003), “background exposure” to other sources of cadmium was incorporated into the benchmark calculations. Daily exposure from air, drinking water, food, soil, and cigarette smoke was assumed to be 0.22 μg/kg-bw/day (CCME, 1996; Jin and Joseph-Quinn, 2003; Garner and Levallois, 2016). When the background exposure is subtracted from the toxicological reference value, an allowable cadmium exposure of 0.78 μg/kg-bw/day remains [i.e., (1–0.22) μg/kg-bw-day]. The average muscle and organ concentrations in the CPDFN, SRFN and CLFN studies were similar to those reported in the 2016 Alberta FNFNES (Chan et al., 2016), therefore the risk-based benchmark consumption quantities are directly comparable (Table 9).
For each dataset, the calculations indicated that for adults, consumption of liver and kidney should be limited to minimal quantities in order to avoid health risks. For the 95th percentile consumer or heavy consumer (eating 17.3 g/day kidney), moose cadmium kidney concentrations of ≤ 3.1 mg/kg are associated with a risk estimate (HQ value) of 1.0. Of the 49 kidney samples from the three studies, 16 samples had cadmium concentrations below 3.1 mg/kg. For cadmium liver concentrations of ≤ 2.4 mg/kg, the HQ value is below 1.0 for a consumption rate of 23 g/day of liver (FNFNES heavy consumer). Eleven of 48 liver samples had cadmium concentrations below 2.4 mg/kg. For moose muscle, consumption of 84 g/day (FNFNES heavy consumer) of tissue with the average cadmium concentration (0.0092 mg/kg) resulted in an HQ value below 1.0. None of the muscle samples had cadmium concentrations that resulted in a risk estimate (HQ value) above 1.0, meaning that moose muscle is safe to consume in quantities in excess of those reported.
The measured liver and kidney concentrations were incorporated into the Danielsson and Frank (2009) equation. When the equation was applied to the measured liver cadmium concentrations, the calculated kidney cadmium concentrations were comparable to the measured kidney cadmium concentration for liver concentrations of <1 mg/kg. In all cases, measured liver concentrations of <1 mg/kg were identified in younger animals. For older animals when the measured liver concentrations were >1 mg/kg the equation vastly underestimated the kidney concentrations. In the absence of measured concentrations of both kidney and liver cadmium in moose, First Nations communities could use either of the linear equations of the pooled data to predict one organ concentration given the availability of the other.
The community focus of the three First Nations' studies meant that while the studies were designed to answer community questions, the information may not be directly transferrable to addressing a certain scientific hypothesis or to meet the needs of certain statistical analysis. Even though training was provided to community harvesters there may have been some variability in sampling techniques. Limitations also include the hunters identifying the characteristics of the animals (weight, age, etc.) and the reliance on newly learned practices to reduce inadvertent contamination. All of the data were included in the assessment. The dataset included tissue concentrations for 50 animals and all of the data were considered valid. All but three of the animals had kidney and liver concentrations below 30 and 5 mg/kg respectively. The incorporation of the three higher concentrations, without accounting for animal age, may have introduced uncertainty into the linear equations. The Pearson's correlation coefficient for the dataset, excluding the three highest concentrations, was r2 = 0.77. Further uncertainty in the assessment includes the calculation of the cadmium muscle concentrations for the dataset when a number of the concentrations were below the analytical detection level, and the inherent uncertainty in the toxicological information. There is a limited amount of toxicological information on the effects associated with human exposures to low levels of chemicals in the environment and the available studies are generally based on epidemiological studies of occupationally exposed workers, which may not be applicable to chronic or continuous exposures to low levels of chemicals.
Conclusion
The study provided cadmium tissue concentrations for 50 moose harvested by three First Nations communities in northern Alberta. The results show that the measured concentrations of cadmium in moose muscle and organs in each of the CLFN, SRFN and CPDFN studies are comparable to those tissue concentrations reported in the 2016 Alberta FNFNES and other North American studies. Using consumption rates reported in the 2016 Alberta FNFNES, the risk assessment calculations completed indicated that adults can consume moose muscle in excess of the quantities consumed in the typical diet but should consume minimal quantities of both liver and kidney in order to remain below risk benchmarks. The measured tissue concentrations suggest that the formulae Ckidney = +2.9 or Cliver = 0.71 can be used to predict either kidney or liver concentrations when one of these is known. First Nations communities in northern Alberta can use this relationship in the absence of measured concentrations of kidney and liver cadmium to generate approximate tissue concentrations and determine safe levels for consumption.
Ethics Statement
The CLFN study was completed under the Health Canada Research Ethics Board Approval Number 2016-006. The SRFN study was completed under the Health Canada Research Ethics Board Approval Number 2014-007.
Author Contributions
CM and AD conceived of the study (based on requests from the SRFN, CPDFN, and CLFN) and participated in its design and coordination and drafted the manuscript. CM drafted the manuscript and conducted statistical and mathematical calculations. DS and SM-M participated in the study design and coordinated its implementation with the First Nations communities. BK provided insight into data interpretation and critically reviewed the manuscript. BK, SM-M, and AD reviewed the original reports. All authors read and approved the final manuscript.
Funding
The Funding for the CLFN and SRFN studies was provided by the Government of Canada's First Nations Environmental Contaminants Program.
Conflict of Interest Statement
CM and BK are employed by Intrinsik Corp. AD is employed by Moccasin Flower Consulting Ltd. SM-M is employed by the Chipewyan Prairie Industry Relations Corporation. DS was employed by Swan River First Nation at the time of the study and is now employed by Askip Napew Consulting Ltd.
Acknowledgments
The authors wish to thank the Elders and Harvesters from Cold Lake First Nations (CLFN), Swan River First Nation (SRFN), and Chipewyan Prairie Déné First Nation (CPDFN) who graciously shared their food. These three communities involved in the study retained Intrinsik to address their concerns regarding moose meat quality; the contribution of the collected information to the knowledge body of science is a tertiary benefit of the assessments. The authors also wish to thank Ms. Sarah Chileen and Mr. Findlay Macdermid of the CLFN Consultation Department for their assistance in coordination and Andrew Thomason from Intrinsik for creating the map figure. The authors also wish to thank Ms. Brenda Tink who provided editing during the submission process.
References
Arnold, S. M., Zarnke, R. L., Lynn, T. V., Chimonas, M. R., and Frank, A. (2006). Public health evaluation of cadmium concentrations in liver and kidney of moose (Alces alces) from four areas of Alaska. Sci. Total Environ. 357, 103–111. doi: 10.1016/j.scitotenv.2005.02.040
CCME (1996). Canadian Council of Ministers of the Environment. Human Health Effects: Inorganic Cadmium. Canadian Soil Quality Guidelines for Contaminated Sites. The National Contaminated Sites Remediation Program. February 1996.
Chan, L., Receveur, O., Batal, M., David, W., Schwartz, H., Ing, A., et al. (2016). First Nations Food, Nutrition and Environment Study (FNFNES): Results from Alberta 2013. Ottawa, ON: University of Ottawa.
Danielsson, R., and Frank, A. (2009). Cadmium in moose kidney and liver–age and gender dependency, and standardization for environmental monitoring. Environ. Monit. Assess. 157, 73–88. doi: 10.1007/s10661-008-0516-y
Gamberg, M. (2000). Contaminants in Yukon Country Foods. Report prepared for the Yukon Contaminants Committee and the Department of Indian and Northern Affairs, June 2000.
Gamberg, M. (2005). Contaminants in Yukon Moose and Caribou. Report prepared for the Yukon Contaminants Committee and the Department of Indian and Northern Affairs, March 2005.
Garner, R., and Levallois, P. (2016). Health Reports: Cadmium Levels and Sources of Exposure Among Canadian Adults. Statistics Canada. Available online at https://www150.statcan.gc.ca/n1/pub/82-003-x/2016002/article/14311-eng.htm
Glooschenko, V., Downes, C., Frank, R., Braun, H. E., Addison, E. M., and Hickey, J. (1988). Cadmium levels in Ontario moose and deer in relation to soil sensitivity to acid precipitation. Sci. Tot. Environ. 71, 173–186.
GNWT (2009). Government of Northwest Territories. Public Health Advisory–Limit Consumption of Moose Organs From the Southern Mackenzie Mountains in the Dehcho, due to High Cadmium Levels. Available online at: https://www.stha.hss.gov.nt.ca/advisory/limit-consumption-moose-organs-southern-mackenzie-mountains-dehcho-due-high-cadmium-levels
Government of Canada (2008). What is the Northern Contaminants Program? Indian and Northern Affairs Canada. QS-Y323-000-EE-A1 Catalogue: R74-1/2009E-PDF. Government of Canada.
Health Canada (2010). Federal Contaminated Site Risk Assessment in Canada. Part II: Health Canada Toxicological Reference Values (TRVs) and Chemical Specific Factors. Health Canada.
Health Canada (2012a). Health Canada's Food Guide for First Nation's Inuit and Métis. Available online at https://www.canada.ca/en/health-canada/services/food-nutrition/reports-publications/eating-well-canada-food-guide-first-nations-inuit-metis.html
Health Canada (2012b). Federal Contaminated Site Risk Assessment in Canada. Part I: Guidance on Human Health Preliminary Quantitative Risk Assessment (PQRA), Version 2.0. Health Canada.
Jin, A., and Joseph-Quinn, K. (2003). Consumption guidelines for cadmium in moose meat in northern British Columbia, Canada. Circumpolar Health 2003, 169–173.
Kelly, E. N., Schindler, D. W., Hodson, P. V., Short, J. W., Radmanovich, R., and Nielsen, C. C. (2010). Oil sands development contributes elements toxic at low concentrations to the Athabasca River and its tributaries. Proc. Natl. Acad. Sci. U.S.A. 107, 16178–16183. doi: 10.1073/pnas.1008754107
Kuzovkina, Y. A., Knee, M., and Quigley, M. (2004). Cadmium and copper uptake and translocation in five willow (Salix L.) species. Int. J. Phytoremediation 6, 269–287. doi: 10.1080/16226510490496726
Larter, N. C., and Kandola, K. (2010). Levels of arsenic, cadmium, lead, mercury, selenium, and zinc in various tissues of moose harvested in the Dehcho, Northwest Territories. Circump. Health Suppl. (2010) 7, 351–355.
McGee, C., Fernandez, I., Norton, S., and Stubbs, C. (2007). Cd, Ni, Pb and Zn concentration in forest vegetation and soils in Maine. Water Air Soil Pollut. 180, 141–153. doi: 10.1007/s11270-006-9257-0
Parker, G. (2003). Status Report on The Eastern Moose (Alces alces Americana Clinton) in Mainlant Nova Scotia. Accessed August, 2014. http://novascotia.ca/natr/wildlife/biodiversity/pdf/statusreports/StatusReportMooseNSComplete.pdf
Robinson, B., Mills, T., Petit, D., Fung, L., Green, S., and Clothier, B. (2000). Natural and induced cadmium-accumulation in poplar and willow: Implications for phytoremediation. Plant Soil 227, 301–306. doi: 10.1023/A:1026515007319
Sudbury Area Risk Assessment (2005). Sudbury Area Risk Assessment, Cadmium as a Chemical of Concern. Sudbury Soils Study. HHRA/ERA Document. Version 3.0. October 5, 2005. Available online at http://www.sudburysoilsstudy.com/EN/media/Volume_I/SSS_Vol_I_Appendix_F_CadmiumasaChemicalofConcern_Jan232006.pdf
US EPA (1998). United States Environmental Protection Agency. “Method 6020A (SW-846): Inductively Coupled Plasma-Mass Spectrometry,” Revision 1. Available online at https://www.epa.gov/sites/production/files/2015-07/documents/epa-6020a.pdf
US EPA New England (2004). US EPA NE and US ACE NED (US EPA New England and US Army Corps of Engineers, New England District). Regional Implementation Manual for the Evaluation of Dredged Material Proposed for Disposal in New England Waters, Appendix II. Available online at: https://www.epa.gov/sites/production/files/2015-10/documents/r1rim.pdf
Keywords: First Nations, cadmium, moose, kidney, liver, muscle, risk assessment
Citation: McAuley C, Dersch A, Mouille-Malbeuf S, Koppe B and Sowan D (2018) Cadmium Tissue Concentrations in Kidney, Liver and Muscle in Moose (Alces alces) From First Nations Communities in Northern Alberta. Front. Sustain. Food Syst. 2:69. doi: 10.3389/fsufs.2018.00069
Received: 05 July 2018; Accepted: 28 September 2018;
Published: 17 October 2018.
Edited by:
Kathleen L. Hefferon, Cornell University, United StatesReviewed by:
Zheng Feei Ma, University of Liverpool, United KingdomEda Bozkir, Università Politecnica delle Marche, Italy
Copyright © 2018 McAuley, Dersch, Mouille-Malbeuf, Koppe and Sowan. This is an open-access article distributed under the terms of the Creative Commons Attribution License (CC BY). The use, distribution or reproduction in other forums is permitted, provided the original author(s) and the copyright owner(s) are credited and that the original publication in this journal is cited, in accordance with accepted academic practice. No use, distribution or reproduction is permitted which does not comply with these terms.
*Correspondence: Claire McAuley, Y21jYXVsZXlAaW50cmluc2lrLmNvbQ==
 Claire McAuley
 Ave Dersch2
 Bart Koppe