 Symon Mezbahuddin1,2*
 David Spiess1
 David Hildebrand1Len Kryzanowski1Daniel Itenfisu1Tom Goddard1Javed Iqbal1Robert Grant2
- 1Environmental Stewardship Branch, Alberta Agriculture and Forestry, Edmonton, AB, Canada
- 2Department of Renewable Resources, University of Alberta, Edmonton, AB, Canada
Effective agronomic nitrogen management strategies ensure optimum productivity, reduce nitrogen losses, and enhance economic profitability and environmental quality. Farmers in western Canada make key decisions on formulation, rate, timing, and placement of fertilizer nitrogen that are suitable for soils, weather, and farming operations within which they operate. Suitability of agronomic nitrogen management options are assessed by estimates from linear interpolations and extrapolations of temporally and spatially discrete field-plot measurements of nitrogen responses. Such estimates do not account for non-linear and offsetting biogeochemical feedbacks of nitrogen cycles and cannot provide comprehensive nitrogen budgets for alternative nitrogen management options. These limitations can be overcome by using process-based agro-ecosystem models that adequately simulate basic processes of nitrogen biogeochemical cycles and are rigorously tested against site observations. Ecosys is a process-based ecosystem model that successfully simulated the biogeochemical feedbacks among nitrogen, carbon, and phosphorus cycles across different agro-ecosystems. This study deployed ecosys to generate spatially and temporally continuous estimates to assess crop nitrogen use and agronomic nitrogen losses from the crop fields across Alberta for alternative nitrogen fertilizer management scenarios. The study simulated effects of four nitrogen management scenarios: fall banded urea, fall banded ESN (Environmentally Smart Nitrogen), spring banded urea, and spring banded ESN on nitrogen recovery and losses from barley fields on mid-slope landforms. These simulations were done at township grids of ~10 km × 10 km over 2011–2015 utilizing provincial soil and climate datasets. Modeled annual N2O, N2, and NH3 emissions, and nitrogen losses in surface runoff and sub-surface discharge were lower by about 25, 30, 70, and 40%, respectively, with spring banding than in fall banding across Alberta. Modeled barley yields and grain nitrogen uptake were similar in spring and fall banding, indicating agro-economic and environmental sustainability advantage of spring banding in Alberta. These modeled estimates were consistent with estimates based on plot and laboratory research for Alberta and similar prairie conditions. This study pioneered a methodology of process-based agroecosystem modeling, which is replicable and scalable to assess cumulative impacts of alternative agronomic nitrogen management options on crop production and the environment on provincial, regional, federal, continental, and global scales.
Introduction
Sustainable fertilizer use management is key for optimizing crop production. Fertilizer nitrogen (N) is a major input for crop production across western Canadian prairies (Shen et al., 2019a,b). About 75% of total Canadian fertilizer N application takes place across the three prairie provinces of Alberta, Saskatchewan, and Manitoba (Statistics Canada, 2016). Alberta contains one third of the agricultural land area in Canada and encompasses a wide range of agro-climatic and soil conditions (Statistics Canada, 2016). The agricultural zone (i.e., white zone) of Alberta encompasses about 42% of total agricultural lands of Canada, which includes about 21 million ha of farmlands (Statistics Canada, 2016). However, nitrogen use efficiency (NUE) on Alberta farmlands is low, as only about 30–50% of the total applied fertilizer N is recovered in crops (Cassman et al., 2002; Janzen et al., 2003). Nitrogen fertilizers not taken up by the crop can either be immobilized by microbes or vulnerable to losses as ammonia (NH3), nitrate (), nitrous oxide (N2O), and di-nitrogen (N2) through volatilization, leaching, and denitrification processes, respectively (Janzen et al., 2003; Qiao et al., 2015; Shrestha et al., 2018; Cui and Wang, 2019; Shen et al., 2019a,b). Losses of N can contaminate water bodies, release potent greenhouse gas (GHG) (e.g., N2O) and create particulate aerosols (e.g., NH3) that impact human health (Forster et al., 2007; Qiao et al., 2015; Shrestha et al., 2018; Cui and Wang, 2019; Shen et al., 2019a,b). Minimizing N losses from agro-ecosystems could thus provide opportunities for reducing the environmental footprint of crop production in western Canada (Shen et al., 2019a,b). In addition, reduced fertilizer N loss can enhance fertilizer NUE, which minimizes fertilizer requirements and saves input costs (Grant and Wu, 2008). Optimal fertilizer N management ensures high crop production for human and livestock consumption and is the foundation of value-added sustainable agricultural products. Efficient fertilizer N use would increase consumers' confidence in crop production sustainability and food security and hence would support an increased market access for the producers (Urso and Gilbertson, 2018). Management of the balance between fertilizer N losses and recovery in agriculture is also very critical since humanity has already exceeded the safety threshold of biogeochemical N cycling (Rockström et al., 2009). The need to reduce N losses and increase NUE is one of the top 10 global environmental priorities (UNEP, 2014), which is also a part of the sustainable development goals and aligns with the growing popularity of the cyclical economy awareness of industry and governments (MacArthur Foundation, 2019).
Optimization of agronomic N fertilizer application depends on agro-climatic, soil, crop, nutrient management, and economic variables (Snyder, 2017). In western Canada, farmers' agronomic nutrient planning includes making key decisions on fertilizer products, and timing, placement, and rates of application based on operational variables such as product availability, time, budget, labor, and equipment (Grant and Wu, 2008). The majority of N fertilizers used in western Canada are ammonium-based (Statistics Canada, 2016). Although the majority of N fertilizers in western Canada are applied in the spring, fall application is sometimes preferred to distribute the workload and take advantage of lower fertilizer prices in the fall (Statistics Canada, 2016). However, fall applied fertilizer N is prone to losses, especially during the subsequent spring thaw before the crop can utilize it. After application, N fertilizers undergo hydrolysis and release ammonium (), which is further oxidized to nitrate () by a microbial process called nitrification (Butterbach-Bahl et al., 2013; Bhanja et al., 2019; Shen et al., 2019a,b; Li et al., 2020). Ammonium () and nitrate () are the forms of N utilized by crops. However, is highly mobile through the soil and hence more prone to losses through runoff and leaching through the soil especially during spring snowmelt, which can cause surface water and groundwater pollution. can also be denitrified to produce potent GHG N2O and inert N2 gases under saturated conditions (Butterbach-Bahl et al., 2013; Bhanja et al., 2019; Shen et al., 2019a,b; Li et al., 2020). These N losses can be minimized with a spring application that can optimize fertilizer NUE and reduce loss concerns. For instance, N2O emissions from prairie crop fields can be reduced by up to 30% depending on weather and soil type by avoiding spring thaw following a fall N fertilizer application (Dunmola et al., 2010; Glenn et al., 2012; Li et al., 2012, 2016; Maas et al., 2013).
Fertilizer application placement also plays an important role in crop N use efficiency and agronomic N losses. Although most of the N fertilizers in western Canada are applied in some forms of in-soil banding, broadcasting is still a dominant placement method in large areas of pastures or forages and in split or in-season applications (Grant and Wu, 2008). However, surface broadcasting can be very inefficient agronomically, economically, and environmentally since it can cause up to 50% more N losses through NH3 volatilization compared to banding (Sheppard et al., 2010). Various enhanced efficiency products such as nitrification and urease inhibitors, and coated urea, have been developed with the objective of reducing N losses and to improve crop N use efficiency (Li et al., 2020). For instance, Environmentally Smart N (ESN, Nutrien) is a polymer-coated urea that is designed to slow down the rate of N release to better match the crop demand than conventional urea, which would improve crop N use and reduce N losses (Cahill et al., 2010; Gao et al., 2015). Selecting the right combinations of fertilizer products, rate, application timing, and placement, i.e., the 4R (Right Source @ Right Rate, Right Time, and Right Place) nutrient stewardship, can thus be an economically viable and environmentally sustainable strategy in western Canadian prairies (Malhi et al., 2001; Grant et al., 2002).
Effectiveness of 4R options for optimizing crop N use efficiency and minimizing N losses varies with variations in soils, landforms, and weather. Suitability assessment of a given combination of 4R for a given weather, landform, and soil condition is a prerequisite before a farmer makes a decision on adopting it. A provincial or prairie-wide numerical inventory of the fate of N applied in the agro-ecosystems would identify dominant regional N loss pathways and direct farmers to the most beneficial N management practices across various landforms, soils, and weather conditions (Dimitrov and Wang, 2019). The fertilizer industry can also use these assessments to identify opportunities of developing and commercializing enhanced efficiency fertilizer products. These estimates can also be scaled-up and displayed spatially across the province to show locations of “hot-spots,” which would support governments in targeting and designing appropriate incentive programs and policies. Currently, the effects of various 4R N management combinations on the fate of applied N in agro-ecosystems are being assessed based on site measurements, which are usually temporally and spatially discrete (e.g., Rawluk et al., 2001; Asgedom et al., 2014; Gao et al., 2015). The field measurements of different forms of N losses require linear temporal interpolations and spatial extrapolations for these assessments, which impart substantial uncertainties into these evaluations, since N transformation processes are highly non-linear and often involve offsetting mechanisms (Flesch et al., 2018). Moreover, the site measurements are limited to fewer soil types, weather conditions, and management options for logistic reasons. Often different field projects are intended to evaluate different pathways of N transformations, which makes construction of a comprehensive budget for the fate of applied N into the agro-ecosystems very difficult. Consequently, a comprehensive inventory with temporally and spatially continuous estimates of crop N uses and fertilizer N loss under various agronomic N management does not exist to date for any of the prairie provinces.
Process-based mechanistic agro-ecosystem models can provide spatially and temporally scaled-up numerical estimates of different N pools under different N management scenarios. However, such a process model has to be built upon site-independent algorithms from independent research, which can then be applied to various soil, weather, and agronomic management conditions without site-specific calibration of the model algorithms. The model should be able to reproduce a particular field condition from site-specific model inputs on soils, weather, and land, crop, and nutrient managements rather than tweaking the model codes for each scenario depending on the training dataset. The model outputs of different N pools have to be rigorously validated against site measurements under varying soils, weather, and agronomic management to evaluate model precision. Ecosys is such an ecosystem model, which successfully simulated soil–plant–atmosphere N continuum across different agro-ecosystems within and outside western Canada (Grant and Pattey, 1999, 2003, 2008; Grant, 2001; Grant et al., 2006, 2016; Metivier et al., 2009). Building upon those field-level validation studies, this study aimed at deploying the ecosys model spatially to generate provincial estimates of crop N use and agronomic N losses for Alberta crop fields under alternative N fertilizer management scenarios. In this study, we describe ecosys simulations to assess the effects of four selected N management scenarios: fall banded urea, fall banded ESN, spring banded urea, and spring banded ESN on yield, N uptake, and N losses across dryland barley fields of Alberta. We then corroborate the modeled results against available data and literature values to examine the adequacy of the simulated results in describing spatial distribution of the pathways of movement of applied N within Alberta agro-ecosystems. These selected scenarios serve as prototypes for establishing a scaling-up methodology, which numerically estimate the fate of fertilizer N under various N management scenarios.
Methods
Model Description
Ecosys is a process-based, hourly time-step, terrestrial, ecosystem model where transformations, transport, and exchanges of N within the modeled ecosystem are simulated in conjunction with those of carbon (C) and phosphorus (P) in a comprehensive modeling scheme, in which they are coupled with soil water, heat, and solute transport (Grant, 2001). Nitrogen transformation processes in ecosys are predominantly governed by coupled reduction–oxidation reactions, which result in microbial and root energy yields, decomposition, and growth, and hence drive N mineralization–immobilization, nitrification, and denitrification. Root and mycorrhizal N uptake occur through ion exchange, radial diffusion, and convection, which affects rubisco (ribulose-1,5-bisphosphate carboxylase/oxygenase) activation that drives modeled crop productivity, growth, and yields in ecosys. Rubisco activation in ecosys can also be affected by functions of water, temperature, and oxygen stresses, and availability of other nutrients such as P. Gaseous and aqueous N losses through NH3 gas and dissolved organic and inorganic N are also modeled in ecosys. Nitrogen availability in the modeled soil solution is also affected by simulated adsorption and desorption of between soil solution and clay surfaces.
Nitrogen inputs to a modeled ecosystem in ecosys include various chemical fertilizer formulations, manure, organic amendments, atmospheric deposition, and biological N2. Formulation, timing, placement, and rates of a fertilizer application event are explicitly defined by model inputs. Granular NH3-based fertilizers (e.g., urea) undergo hydrolysis, which controls the rate of N release from fertilizer granules. The hydrolysis process in ecosys is a function of soil moisture and temperature that is mediated by microbial activity. The rate of hydrolysis is calculated from a specific rate constant multiplied by total heterotrophic microbial activity, the urea concentration relative to its Michaelis-Menten (MM) constant, and an Arrhenius function of soil temperature, and can be reduced by urease inhibition. The urease inhibition is calculated from another MM function of the aqueous concentration of total active heterotrophic activity that serves as a proxy of urease activity. For ESN, the specific rate constant is one-fourth of the rate constant for urea until 10% of the total applied N is hydrolyzed, after which the rate constants for both ESN and urea become the same. This algorithm simulates an initial lag in N release from ESN as opposed to urea, which approaches a sigmoidal N release response for ESN (Cahill et al., 2010). All of the above algorithms are parameterized from the kinetics and equilibria of complex biogeochemical and eco-physiological processes reported by independent research on ecosystem functioning within a broad scope of spatial scale. These algorithms in ecosys thus do not require calibration, training, or parameterizing for each unique space–time scenario. Instead, a modeled agro-ecosystem in ecosys is simulated from site-specific model inputs of weather, soil, and agronomic management data. A more detailed description of ecosys algorithms representing N transformation, transport, and exchange including all key equations, variable definitions, parameters, and references can be found in Grant and Pattey (2003), Grant et al. (2006), Metivier et al. (2009), and Grant et al. (2002).
Methodology and Model Inputs
The N transformation, transport, and exchange algorithms in ecosys were used to derive numerical estimates of effects of N fertilizer timing and products on crop N use and agronomic N losses in the western Canadian province of Alberta. Alberta is the fourth largest province of Canada, which extends between 49°−60°N and 110°−114°W occupying an area of 661,848 km2 (Figure 1). The southern part of Alberta has a semi-arid climate (Köppen climate classification BSk) whereas central and northern Alberta experience humid continental climate (Köppen climate classification Dfb). A total of four parallel sets of model simulations were set up to simulate four selected N management scenarios: fall banded urea, fall banded ESN, spring banded urea, and spring banded ESN. Modeled outputs of N recovery in yield and N uptake of dryland/rain-fed barley; gaseous N losses as N2O, NH3, and N2; and aqueous N losses through surface runoff and subsurface discharge from those barley fields were used to determine the effects of the selected N management scenarios on the fate of N in Alberta crop fields. Each of these four simulations had a total of 3,063 township scale (~10 km × 10 km) spatially explicit grid cells that spread across the agricultural areas of Alberta (Figure 2; Table 1). Each of the township grid cells was divided into four landforms: top-, mid-, and foot-slopes, and depressional areas for simulations, depending on slope classification for different landforms (MacMillan and Pettapiece, 2000). Since mid-slope landforms comprise the largest proportion (40%) of the total arable lands in Alberta, we simulated the mid-slope land form elements in this study (Table 1). However, the other three landforms will eventually be simulated in future phases of this modeling project to generate more comprehensive scenarios of fate of N in prairie agro-ecosystems. Model inputs of the soil properties represented the key characteristics of four major agricultural soil groups of Alberta, i.e., Brown Chernozems (Aridic Borolls), Dark Brown Chernozems (Typic Borolls), Black Chernozems (Udic Borolls), and Dark Gray and Gray Chernozems and Luvisols (Boralfs and Mollic Cryoboralfs) (Figure 2; Table 1). The soil properties were derived from the most frequently occurring soil (modal or dominant) profile in each slope position for each township (Protz et al., 1968). The modal soil profiles were selected from the lands falling within Land Suitability Rating System's rating of 2–4 to represent Alberta's best arable lands for spring seeded small grains (Bock et al., 2018; LSRS, 2019).
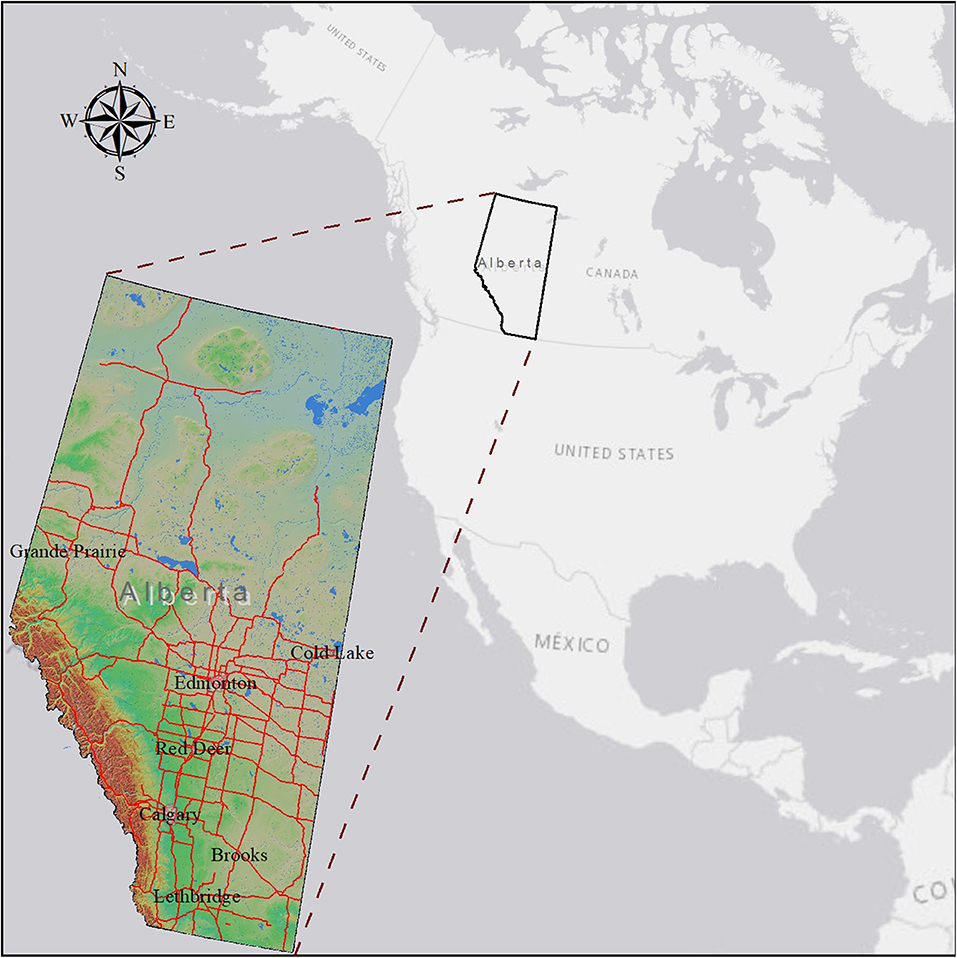
Figure 1. A map showing the geographic location of the western Canadian province of Alberta. Labels are the major cities and red lines are major highways of Alberta.
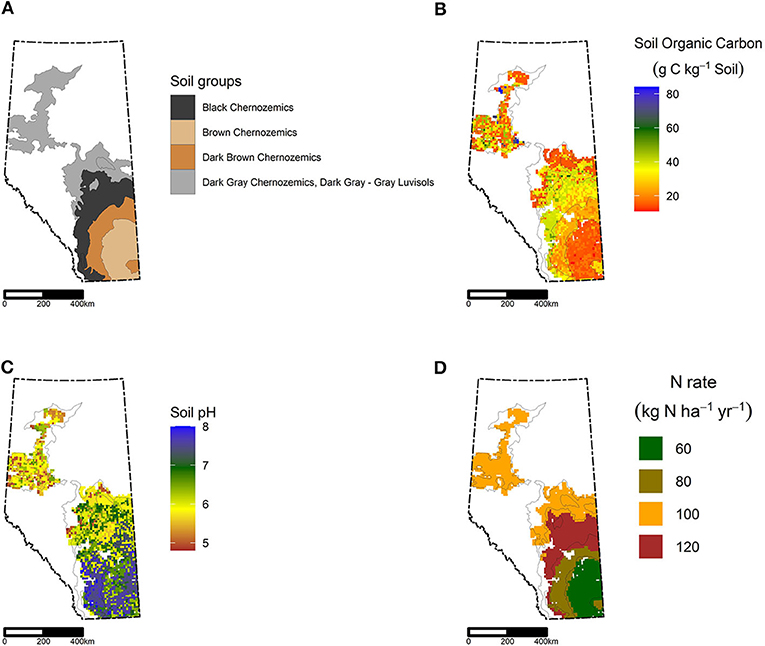
Figure 2. (A) Spatial distribution of the soil groups comprising the agricultural zone of Alberta, which represents the study area for ecosys simulation. (B) Spatial distribution of top soil (0–15 cm) organic carbon contents, and (C) pH of the agricultural zone of Alberta that was simulated in this study. (D) Spatial distribution of typical fertilizer nitrogen application rates used in ecosys simulations. The white areas on the map were not modeled based on the selection criteria as described in section Methodology and Model Inputs. The thick dashed lines on the maps represent Alberta's provincial boundary, and the thin black lines within the maps demarcate soil group areas.
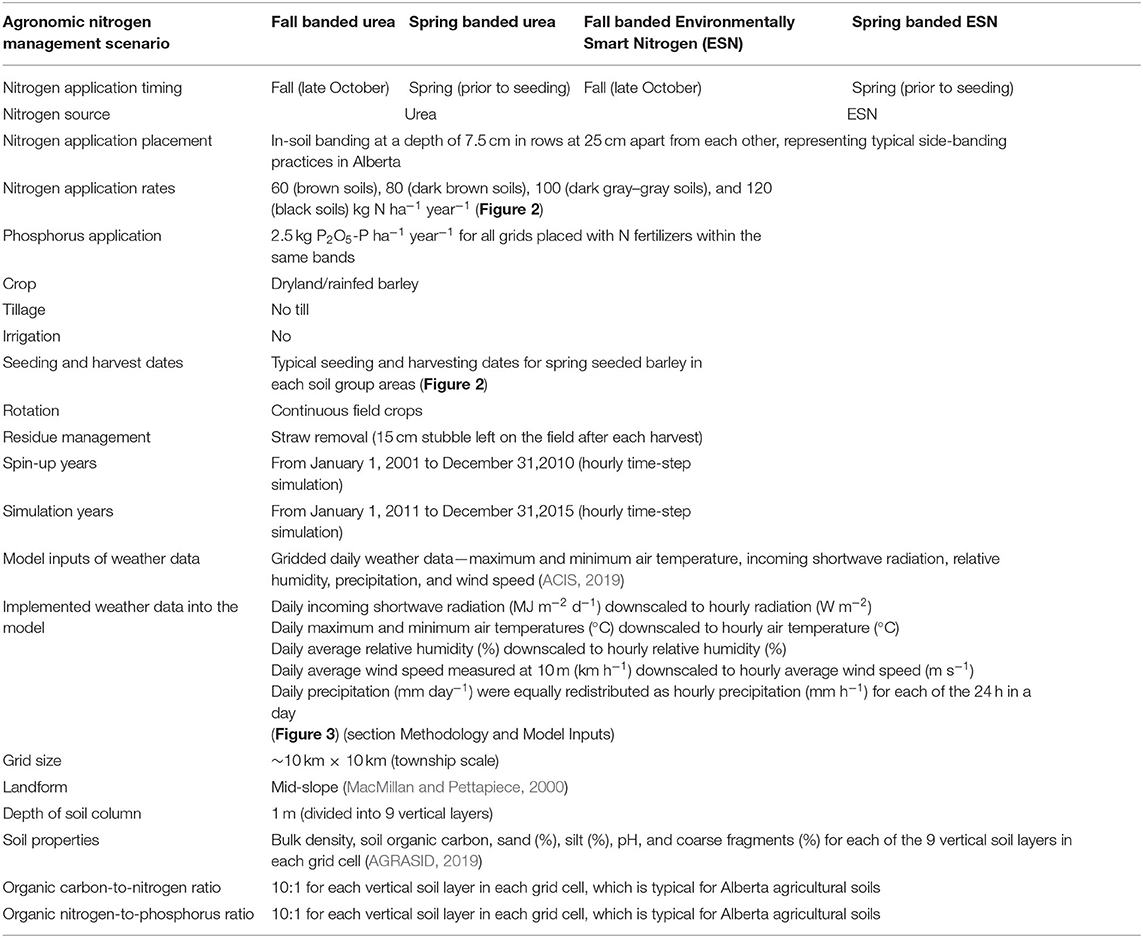
Table 1. Key model inputs to ecosys model to simulate effects of agronomic nitrogen management on crop nitrogen uptake and nitrogen losses from simulated barley fields across the agricultural areas of Alberta during 2011–2015.
Each grid cell was seeded with a barley plant functional type (PFT) (Table 1). Barley was selected as the model crop for this study since it is the third largest crop grown in Canada, with over 90% of production located in the three Prairie Provinces of Alberta, Saskatchewan, and Manitoba (Statistics Canada, 2016). The barley PFT was built by customizing the wheat PFT in Grant et al. (2011) for eco-physiological adaptation for barley crops in Alberta. The ecological adaptation in the barley PFT were represented by adjusting the crop climate zone adaptation to the appropriate Köppen climate zones for different regions in Alberta. The physiological adaptation in the barley PFT was represented by raising the fractions of leaf proteins in rubisco and in mesophyll chlorophyll by 40%, which would simulate higher productivity and hence more rapid accumulation of grain biomasses in barley than in the wheat PFT in Grant et al. (2011). These adjustments to the barley PFT in ecosys with respect to the wheat PFT were made based on relative performance between ecosys simulated barley and wheat yields, biomass growth, and nitrogen uptake, which were rigorously tested by Grant et al. (2020) against Alberta field data. Typical soil, crop, and nutrient management practices and recommended N fertilizer rates across different regions of Alberta were used as model inputs (Figure 2; Table 1). The ratios of organic C to N, and N to P, in each soil layer were assumed as 10–1, which were typical to agricultural soils in Alberta. Sustained grain removal would create P limitation in the modeled crop. To eliminate P limitation, a phosphate fertilizer at a rate of 2.5 kg P ha−1 year−1 was applied to each grid cell in each simulation along with banded N fertilizers (Table 1). The spin-up runs ensured that the modeled ecosystems attained mass and energy balances to represent stable site conditions. All the simulations started with spin-ups from 2001 to 2010, which then extended to simulation runs from 2011 to 2015 using gridded, real-time, daily, weather data, i.e., maximum and minimum air temperature, incoming shortwave radiation, precipitation, wind speed, and relative humidity (Table 1) (ACIS, 2019). Since the ecosys model is an hourly time-step model, the model inputs of daily weather variables were first scaled down to hourly, to be implemented as hourly vertical model boundary conditions, to drive hourly model calculations. This temporal downscaling of the weather variables from daily to hourly was done internally inside the ecosys weather sub-model. The daily incoming shortwave radiation was downscaled to hourly values using a sinusoidal curve for radiation based on day length (Figure 3). The maximum and minimum daily air temperatures were used to drive a sinusoidal curve that calculated hourly temperature, so that the minimum temperature was reached at dawn and the maximum temperature was reached at 3 h after solar noon (Figure 3). Relative humidity was downscaled from daily to hourly by using a similar sinusoidal curve as the temperature (Figure 3). The daily precipitation was equally distributed to each hour in a day, and the average daily wind speed was used for each hour of the day as model upper boundary conditions. The temporal downscaling of air temperature and radiation would enable simulation of diurnal variations in N, C, heat, and water balance in the model. However, the temporal downscaling procedure of daily weather variables to hourly values, as described above, could still miss a sudden drop or rise of temperature from 1 h to another in a day, or a large precipitation event that occurred in some hours of a day. Lack of model inputs for these episodic events may affect the model's capability of accurately simulating sudden flushes of N losses (e.g., N2O). Model vertical boundary conditions, as described by the model inputs of air temperature and precipitation above, adequately represented drier growing seasons in the southern part of the province and long harsh winters, with relatively shorter and wetter growing seasons in the north. This is apparent in the monthly mean temperature and precipitation distribution across Alberta over the period of 5 simulation years from 2011 to 2015 (Figure 4).
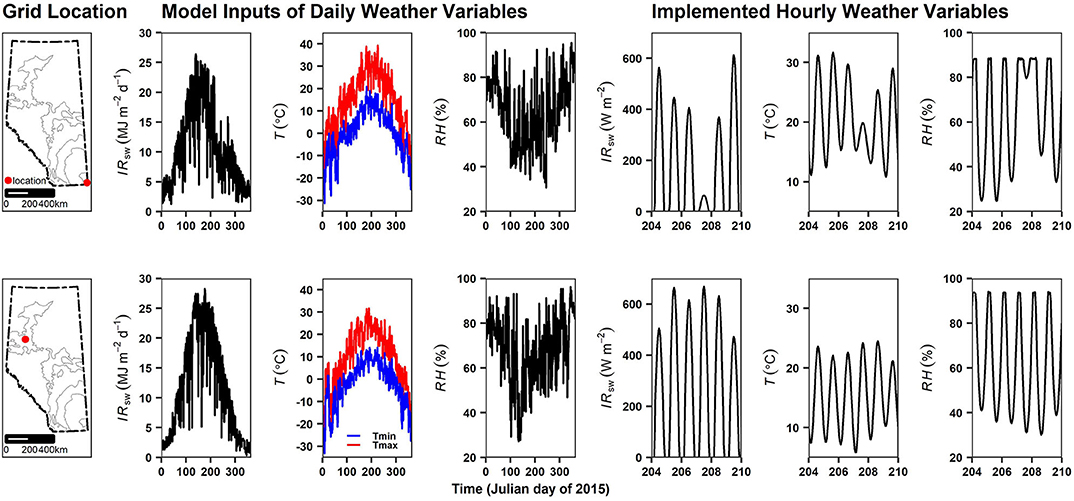
Figure 3. Example representations of temporal downscaling of daily weather data to hourly weather variables to be implemented as hourly model inputs for vertical boundary conditions over two selected township grids using sinusoidal functions. IRsw, incoming shortwave radiation; T, air temperature; Tmin, daily minimum air temperature; Tmax, daily maximum air temperature; and RH, relative humidity. The thick dashed lines on the maps represent Alberta's provincial boundary, and the thin black lines within the maps demarcate soil group areas.
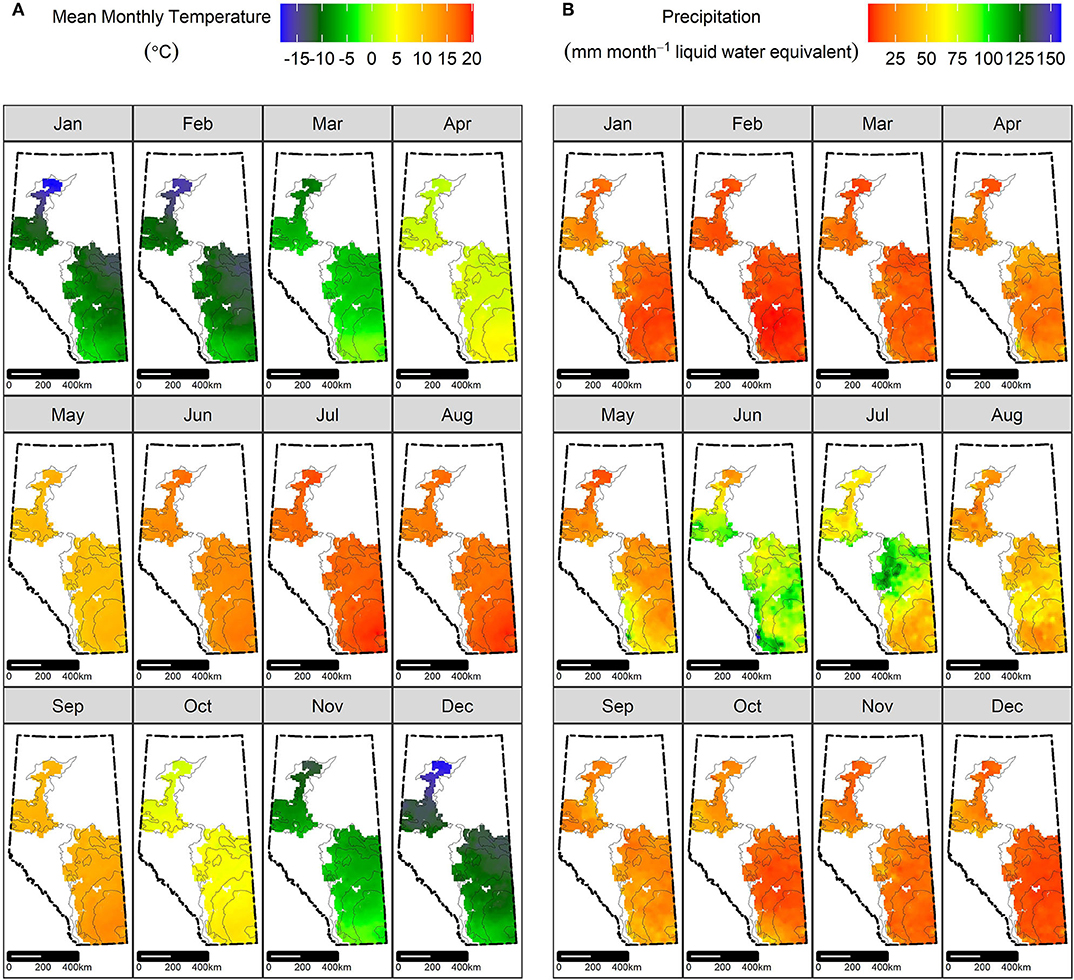
Figure 4. Spatial distribution of (A) mean monthly temperature and (B) mean monthly precipitation across agricultural areas of Alberta averaged over the simulation period (January 1, 2011–December 31, 2015) (ACIS, 2019). The white areas on the map were not modeled based on the selection criteria as described in section Methodology and Model Inputs. The thick dashed lines on the maps represent Alberta's provincial boundary and the thin black lines within the maps demarcate soil group areas.
Validation and Analyses of Modeled Outputs
Enhanced efficiency N fertilizers like ESN differ from conventional urea in their N release patterns from fertilizer granules. The granules of urea are coated with a polymer to slow down N release rates in ESN fertilizers. This slower release is designed to better match crop N demand to enhance crop N uptake and minimize agronomic N losses. Simulated N release patterns for ESN vs. urea were compared against laboratory data to examine how well ecosys simulated the observed differences between ESN and urea in their N release patterns. For this purpose, daily modeled N releases were accumulated and averaged as percentages of total applied N, for all four simulations, for all years, across all soils. The N release percentages of urea vs. ESN were then plotted against thermal time expressed as degree days. The thermal time was cumulative of daily accumulated modeled hourly soil temperatures above 0°C at the depth of N fertilizer banding. The N release to thermal time relationship curves were then compared with similar curves constructed by data from a laboratory experiment.
The laboratory experiment was performed with a commercial top soil “Greensmix” of a sandy loam texture with a pH of 6.6 (Dowbenko, personal communication). Two separate sets of measurements were performed to account for N release from urea vs. ESN granules with a gradual increment and decline of temperature at the rate of about 5°C/week. Each of these sets of measurements was performed under two moisture levels: 50 and 75% of the field capacity (Dowbenko, personal communication). During these laboratory experiments, the soil samples were maintained in sample pots within a growth chamber with designated temperature controls. While preparing the experiment pots, the fertilizer samples were evenly dispersed and covered with a 0.6-cm-thick soil layer. The two stated levels of moisture contents in the pots were checked daily and maintained throughout the experiment period (3–4 months). The rate of fertilizer release for each sample pot was measured once every week. For this purpose, the soil layer at the top of the fertilizer layer was removed very carefully to prevent any damage to the fertilizer granules. The loose soil particles were washed out of the granules by using a gentle stream of deionized water. The granules were then analyzed for N concentration by using colorimetry in aqueous solutions.
Seasonal and interannual variations in weather can significantly affect yield and crop N uptake. Modeled annual barley grain yields at typical grain moisture contents (13.5%) were averaged for each township over the simulation period (2011–2015) to include effects of a range of weather conditions. The averaged modeled barley yields and annual grain N uptake were reported as rates in kg ha−1 year−1. The rates of modeled barley yield and grain N uptake were then compared for the four scenarios to assess the effects of N fertilizer timing and products on the recovery of applied N fertilizer. These comparisons were performed spatially at township scales in maps and also by comparing soil group averages in bar charts.
Modeled barley grain yields were validated against Agriculture Financial Services Corporation (AFSC) of Alberta data across agricultural areas of Alberta for the simulation period (2011–2015). In Alberta, farmers using crop insurance have to report annual crop yields to be in compliance with the AFSC for crop insurance purposes (AFSC, 2019). The AFSC compiles and publishes the reported annual yields for each crop based on an area weighted averaging for a total of 22 risk zones across the agricultural areas of Alberta (AFSC, 2019). In this study, modeled barley grain yields were averaged for all modeled townships that fell within each of the AFSC agricultural risk zones, for all four N management scenarios, over the simulation period to facilitate comparison against AFSC compiled observed barley yields, averaged over the same time period (2011–2015). The comparison between modeled and observed (AFSC data) barley yields would provide a measure of model accuracy in simulating geo-spatial variations in barley yields across Alberta over the simulation period. Model accuracy was evaluated by geo-spatial Pearson's correlation, slope, intercept, and root mean square for errors (RMSE) of linear regression of modeled vs. observed yields. This test would provide details on model accuracy and uncertainties in simulating regional and provincial scale crop yields and N uptake.
Modeled hourly outputs for different forms of agronomic N losses were accumulated annually as rates in kg N ha−1 year−1 and were also averaged for each grid cell in each simulation over the simulation period. These N losses were mapped and compared to facilitate township scale spatial comparisons among the four N management scenarios. The rates of different forms of N losses were also averaged and scaled up to the soil group levels to facilitate regional comparisons among different N management scenarios. While averaging by soil groups over the simulation period (2011–2015), standard deviations were illustrated and coefficients of variations were reported to demonstrate the spatiotemporal variations of the modeled N recovery and losses due to variations in soils and weather.
Percent changes in modeled yields and in the key components of modeled N budget for a change in N fertilizer timing or product were listed to facilitate a comprehensive summary of the N management scenario analyses. Modeled trends, and magnitudes and ranges of modeled values for yields, grain N uptake, and various forms of N losses, were also compared with field observations and estimates from available published research for Alberta or similar prairie conditions.
Results
Modeling Nitrogen Release From Urea vs. ESN
Modeled ESN and urea differed from each other in their average N release patterns, which was corroborated well by the observed laboratory results (Figure 5). The rate of modeled average N release from urea initially increased rapidly with increasing thermal time, after which it plateaued (Figure 5). Averaged modeled N release rate from ESN was slower than that of urea at lower thermal time after which it became very close to that of urea, approaching a sigmoidal N release pattern (Figure 5). Modeled N release rates for both fertilizer products for a given exposure to a thermal time varied [Coefficient of variation (CV) up to ±25%] due to variations in soils and weather across Alberta agricultural areas (spatial distribution not shown) (Figure 5). The observed laboratory results for urea showed a similar increase with increasing thermal time at a gradually decreasing rate as modeled (Figure 5). Observed N release rate for ESN followed an initial lag similar to the N release pattern as modeled (Figure 5).
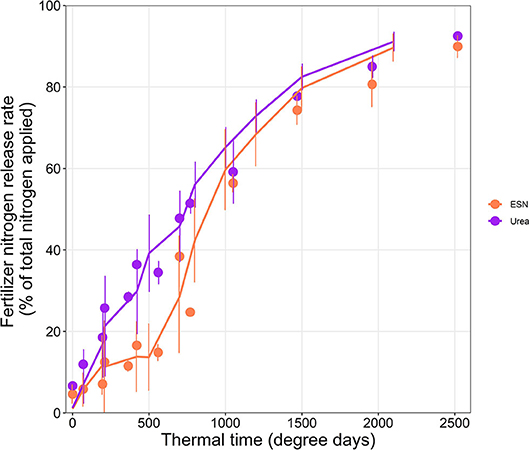
Figure 5. Modeled (lines) and laboratory results (symbols) for nitrogen release with thermal time from urea and ESN applications. Modeled data (lines) were averaged for all the grid cells over the simulation period (January 1, 2011–December 31, 2015) for fall and spring banding across mid-slope landforms of Alberta under simulated barley cultivation. Error bars on modeled N release rates represent standard deviations of modeled N release rates due to variations in weather and soils. Observed laboratory results (symbols) were averaged for four treatments. Error bars on observed N release rates represent standard deviations of observed N release rates due to variations in moisture (section Validation and Analyses of Modeled Outputs).
Modeling the Effects of Agronomic Nitrogen Management on Nitrogen Recovery in Barley Grain
Effects of agronomic N management on the recovery of applied N were assessed by the variations of modeled estimates of barley grain yields and N uptake with variations in N application timing and products. Geo-spatial variations in modeled barley yields across Alberta agricultural areas during 2011–2015 corroborated well against observed (AFSC data) barley yields as indicated by a strong geo-spatial correlation between modeled and observed yields (Figure 6). However, a slope of 1.1 and an intercept of 538 kg ha−1 year−1 from a simple linear regression of modeled vs. observed barley yields, meant the modeled barley yields were larger than the observed yields (Figure 6). A smaller RMSE of 215 kg ha−1 year−1 from a simple linear regression of modeled vs. observed barley yields, however, showed lower model uncertainties in predicting geo-spatial variations in barley yields across Alberta during the simulation period (Figure 6). Modeled barley yields varied across the province by region, with the drier brown soils having the lowest average yields and the wetter black soils having the highest average yields (Figures 5, 7). Overall, the modeled barley yields remained mostly unaffected, either by a variation in the timing of application (fall vs. spring) or by a variation in N fertilizer products (urea vs. ESN) (Figure 7; Table 2). A change in the application timing from fall to spring resulted in only about 2% overall increase in modeled barley yields across Alberta during 2011–2015 (Table 2). Contrary to the expectation that ESN would produce higher yields, modeled ESN application indicated no significant yield effect when compared to modeled urea application across the province (Table 2). However, there were localized effects of fertilizer timing and products on modeled barley yields, which was revealed at the township-scale spatial distribution of the modeled barley yields (Figure 7). For instance, there was about 20% reduction in modeled barley yields in some parts of the southeast dark gray–gray soil zone caused by a change from fall to spring application (Figure 7). These reductions were greater in ESN than in urea (Figure 7). In contrast, there were increases in modeled barley yields in some parts of the northwest dark gray–gray soil zone and in the southern dark brown zone, for a change from fall to spring application (Figure 7).
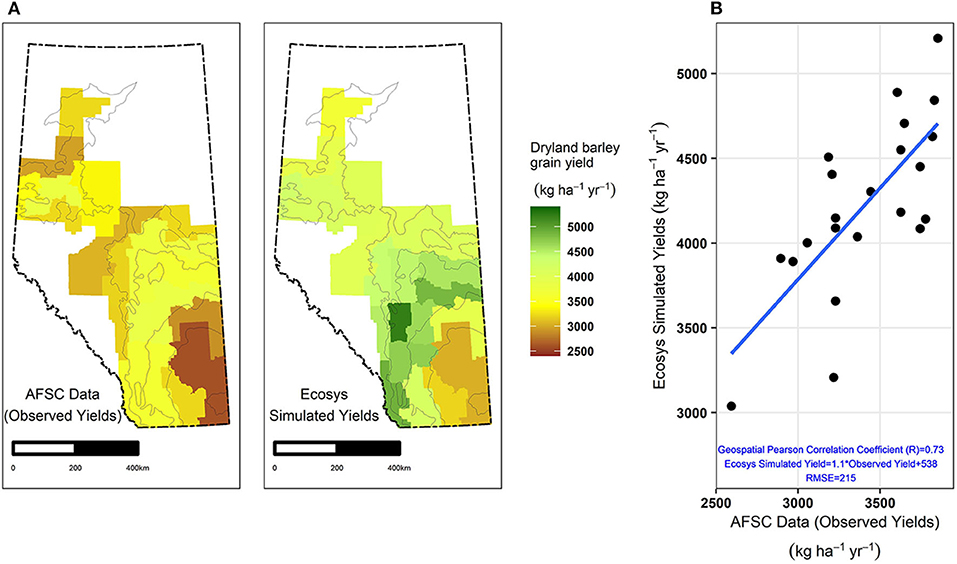
Figure 6. (A) Spatial distribution of observed and modeled dryland or rainfed barley grain yields across Alberta's agricultural areas averaged over the simulation period (2011–2015). Modeled barley grain yields were simulated only for mid-slope landforms. Observed grain yields were averaged (area-weighted) for fields across all landforms as compiled and published by Alberta Financial Services Corporation (AFSC) based on farmers' reported yields (AFSC, 2019). Both the simulated and observed yields were averaged to each of the 22 AFSC designated risk areas (AFSC, 2019). The white areas on the map were not modeled based on the selection criteria as described in section Methodology and Model Inputs. The thick dashed lines on the maps represent Alberta's provincial boundary and the thin black lines within the maps demarcate soil group areas. (B) Relationship between simulated and observed yields (AFSC data) averaged over the simulation period (2011–2015) for each of the AFSC risk areas. RMSE, root mean square for errors in kg ha−1 year−1.
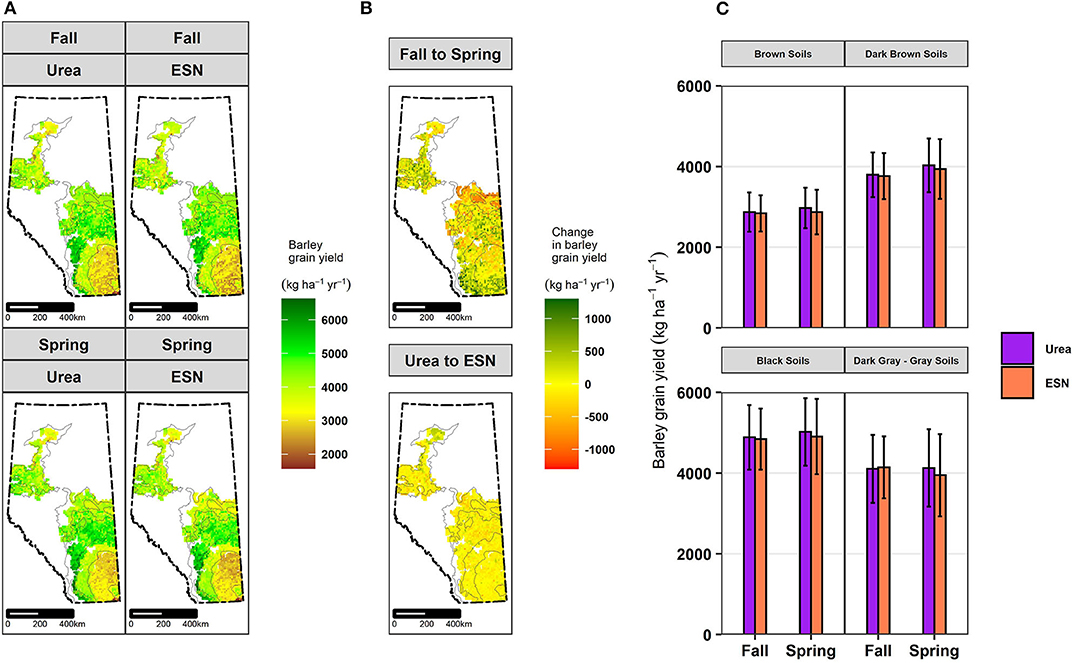
Figure 7. (A) Spatial distribution of modeled dryland or rainfed barley grain yields averaged over the simulation period (2011–2015) for each township for each of the fall and spring banded urea and ESN applications across mid-slope landforms of Alberta under simulated barley cultivation. (B) Spatial distribution of differences in modeled dryland barley grain yields for fall vs. spring and urea vs. ESN applications averaged over the simulation period (2011–2015) for each township across mid-slope landforms of Alberta under simulated barley cultivation. A positive change represents an increase in yield for a change from fall to spring or from urea to ESN and vice versa. The white areas on the map were not modeled based on the selection criteria as described in section Methodology and Model Inputs. The thick dashed lines on the maps represent Alberta's provincial boundary, and the thin black lines within the maps demarcate soil group areas. (C) Soil group-wise averages of modeled dryland barley grain yields for fall vs. spring banding and urea vs. ESN applications averaged over the simulation period (2011–2015) for all the townships in each soil group area across mid-slope landforms of Alberta under simulated barley cultivation. Error bars represent standard deviations illustrating spatiotemporal variations in modeled grain yields within each soil group area.
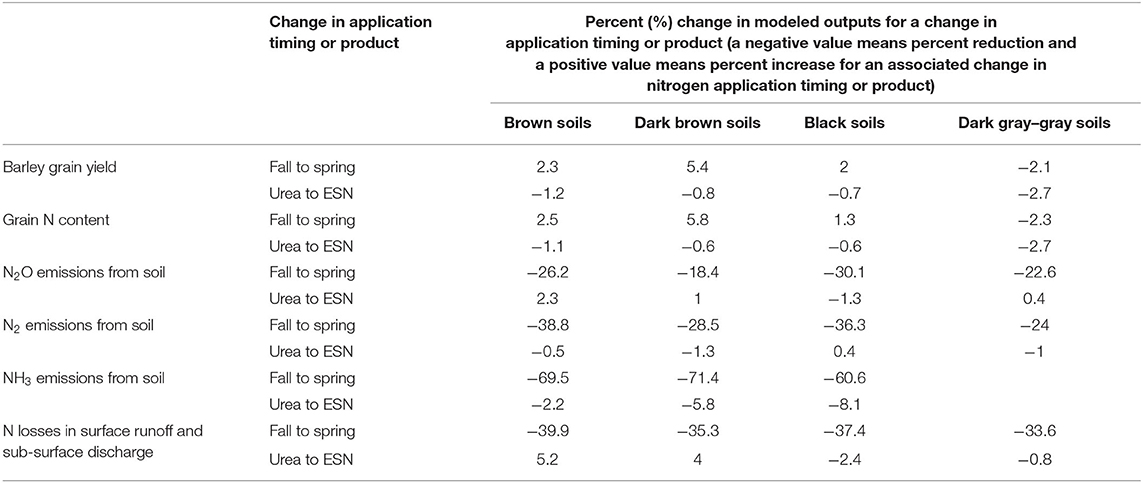
Table 2. Effects of nitrogen fertilizer application timing (fall vs. spring) and products (urea vs. ESN) on modeled annual dryland or rain-fed barley grain yields, modeled annual grain N uptake, and different forms of modeled annual nitrogen losses averaged over the simulation period (2011–2015) for all the townships across mid-slope landforms of Alberta under simulated barley cultivation.
Modeled barley grain quality, as represented by grain N uptake (or content), showed a similar spatial pattern as the modeled grain yields, with brown soils having the lowest, and black soils having the highest average grain N uptake (Figure 8). Like modeled barley grain yields, grain N uptake did not show any regional or province-wide consistently discernible effects of N fertilizer timing or products (Figure 8; Table 2). Modeled grain N content was higher by about 2% in the spring application over the fall application and was down by only 1%, while ESN was applied instead of urea across the province (Figure 8; Table 2). However, the modeled barley grain N uptake also showed similar localized effects of N fertilizer timing and products, as did the modeled grain yields. Modeled grain N uptake declined by about 10–15% from fall to spring applications in parts of the southeast dark gray–gray soil zone and increased in parts of the northwest dark gray–gray and southern dark brown soil zones (Figure 8).
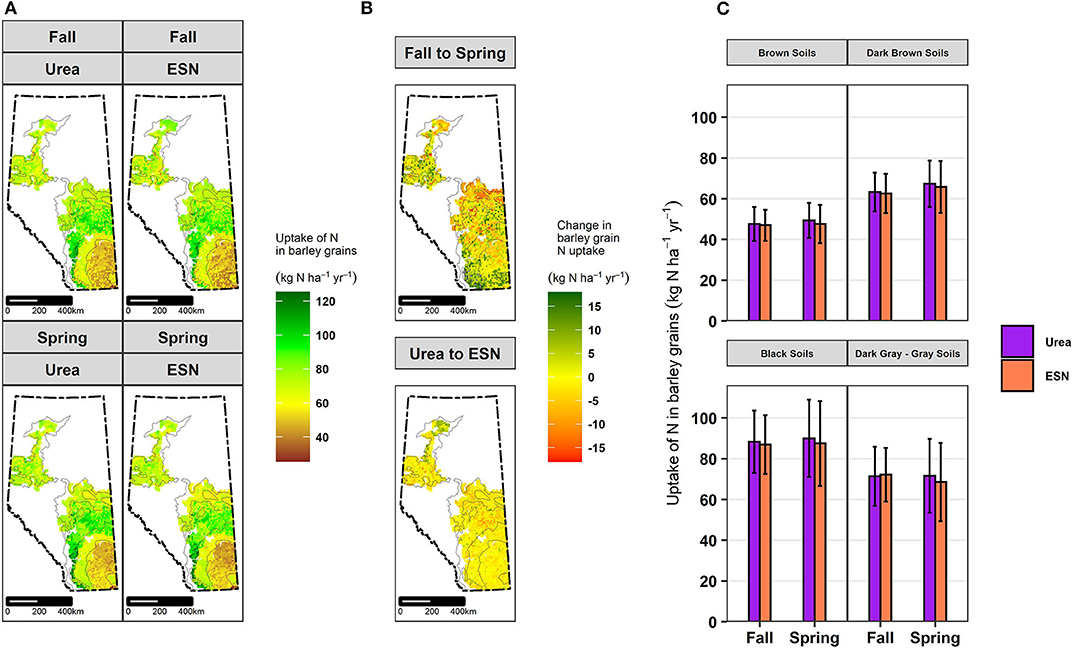
Figure 8. (A) Spatial distribution of modeled annual nitrogen uptake into dryland or rainfed barley grains averaged over the simulation period (2011–2015) for each township for each of the fall and spring banded urea and ESN applications across mid-slope landforms of Alberta under simulated barley cultivation. (B) Spatial distribution of differences in modeled dryland barley grain nitrogen uptake for fall vs. spring and urea vs. ESN applications averaged over the simulation period (2011–2015) for each township across mid-slope landforms of Alberta under simulated barley cultivation. A positive change represents an increase in grain nitrogen uptake for a change from fall to spring or from urea to ESN and vice versa. The white areas on the map were not modeled based on the selection criteria as described in section Methodology and Model Inputs. The thick dashed lines on the maps represent Alberta's provincial boundary, and the thin black lines within the maps demarcate soil group areas. (C) Soil group-wise averages of modeled dryland barley grain nitrogen uptake for fall vs. spring banding and urea vs. ESN applications averaged over the simulation period (2011–2015) for all the townships in each soil group area across mid-slope landforms of Alberta under simulated barley cultivation. Error bars represent standard deviations illustrating spatiotemporal variations in modeled grain nitrogen uptake within each soil group area.
Modeling Effects of Agronomic Nitrogen Management on Nitrogen Losses
Variations in N application timing (fall vs. spring) and products (urea vs. ESN) had different effects on modeled N losses in the forms of N2O, N2, and NH3 gases, and N losses in surface runoff and sub-surface discharge. Average modeled annual soil N2O emissions varied from 0.68 (CV ± 20%) to 1.88 (CV ± 47%) kg N ha−1 year−1 across the soil groups in all scenarios (Figure 9). Modeled average annual N2O emission varied among soil groups. Black and dark gray–gray soils had higher modeled N2O emissions than the brown and dark brown soils (Figure 9). Modeled N2O also varied substantially within each soil group area (Figure 9). Modeled N2O emissions were smaller in spring banding than in fall banding, irrespective of fertilizer products (Figure 9). On average, modeled N2O emissions from spring banding was 24% less than that from fall banding throughout dryland barley fields on mid-slope landforms across Alberta during 2011–2015 (Figure 9; Table 2). Annual reductions in N2O emissions with a change from fall to spring banding was almost double in black and dark gray–gray soils than those in brown and dark brown soils (Figure 9; Table 2). However, there was no discernible soil-group-wide or province-wide difference in modeled N2O emissions for variations in N products from urea to ESN (Figure 9; Table 2).
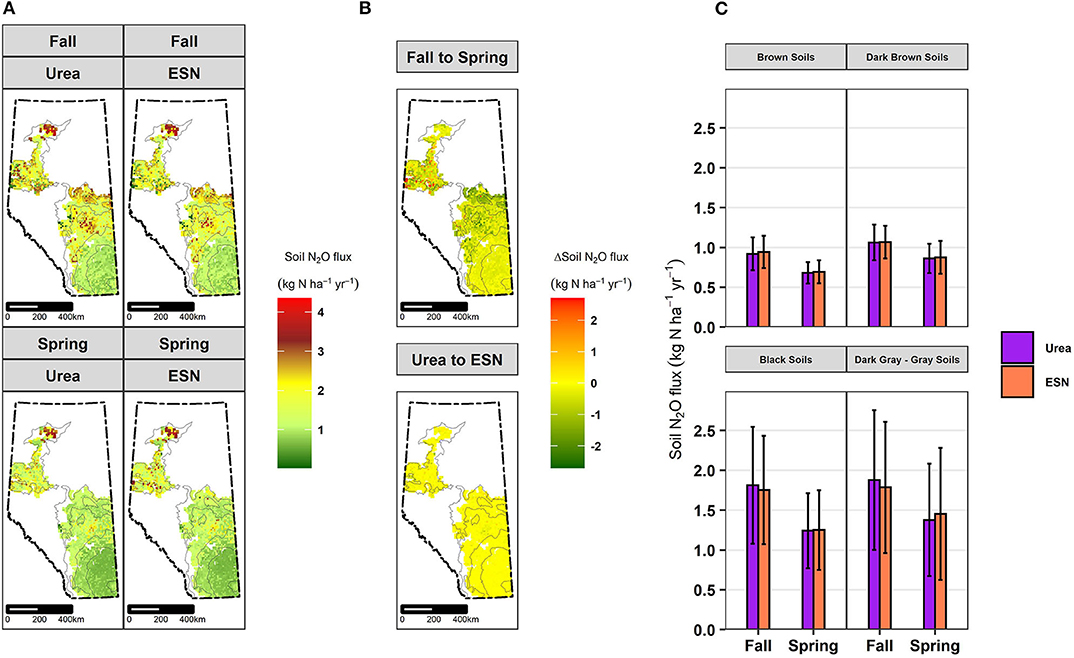
Figure 9. (A) Spatial distribution of modeled annual (January 1–December 31) soil N2O fluxes averaged over the simulation period (2011–2015) for each township for each of the fall and spring banded urea and ESN applications across mid-slope landforms of Alberta under simulated barley cultivation. Positive fluxes represent emissions and vice versa. (B) Spatial distribution of differences in modeled annual soil N2O fluxes for fall vs. spring and urea vs. ESN applications averaged over the simulation period (2011–2015) for each township across mid-slope landforms of Alberta under simulated barley cultivation. A positive change represents an increase in N2O fluxes for a change from fall to spring or from urea to ESN and vice versa. The white areas on the map were not modeled based on the selection criteria as described in section Methodology and Model Inputs. The thick dashed lines on the maps represent Alberta's provincial boundary, and the thin black lines within the maps demarcate soil group areas. (C) Soil group-wise averages of modeled annual soil N2O fluxes for fall vs. spring banding and urea vs. ESN applications averaged over the simulation period (2011–2015) for all the townships in each soil group area across mid-slope landforms of Alberta under simulated barley cultivation. Error bars represent standard deviations illustrating spatiotemporal variations in modeled annual soil N2O fluxes within each soil group area.
Complete denitrification simulated agronomically inconsequential N losses in the form of N2, averages of which ranged between 0.63 (CV ± 48%) and 1.20 (CV ± 56%) kg N ha−1 year−1 across the soil groups in all scenarios (Figure 10). A change from fall to spring banding reduced N2-N losses by about 32% across the province (Figure 10; Table 2). Variations in N products (urea vs. ESN) did not simulate any discernible change in N2-N losses (Figure 10; Table 2).
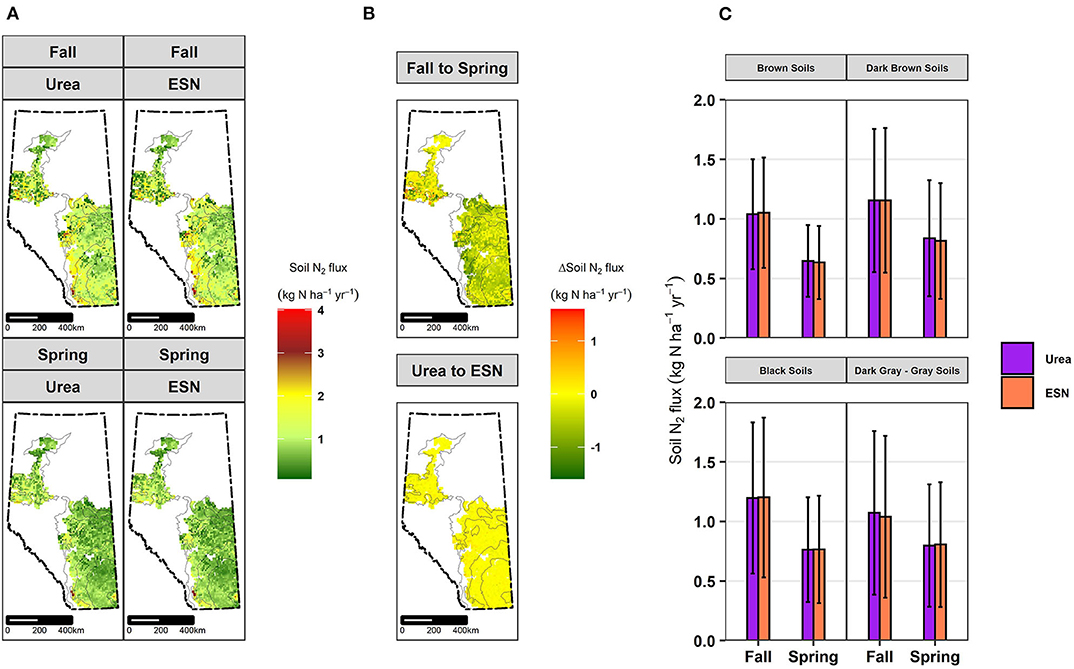
Figure 10. (A) Spatial distribution of modeled annual (January 1–December 31) soil N2 fluxes averaged over the simulation period (2011–2015) for each township for each of the fall and spring banded urea and ESN applications across mid-slope landforms of Alberta under simulated barley cultivation. Positive fluxes represent emissions and vice versa. (B) Spatial distribution of differences in modeled annual soil N2 fluxes for fall vs. spring and urea vs. ESN applications averaged over the simulation period (2011–2015) for each township across mid-slope landforms of Alberta under simulated barley cultivation. A positive change represents an increase in N2 fluxes for a change from fall to spring or from urea to ESN and vice versa. The white areas on the map were not modeled based on the selection criteria as described in section Methodology and Model Inputs. The thick dashed lines on the maps represent Alberta's provincial boundary and the thin black lines within the maps demarcate soil group areas. (C) Soil group-wise averages of modeled annual soil N2 fluxes for fall vs. spring banding and urea vs. ESN applications averaged over the simulation period (2011–2015) for all the townships in each soil group area across mid-slope landforms of Alberta under simulated barley cultivation. Error bars represent standard deviations illustrating spatiotemporal variations in modeled annual soil N2 fluxes within each soil group area.
Modeled average volatilization of NH3 ranged from a consumption of 0.19 (CV ± 150%) kg N ha−1 year−1 to an emission of 1.18 (CV ± 138%) kg N ha−1 year−1 across the soil groups in all scenarios (Figure 11). On an average, dark gray–gray soils consumed NH3 from the air, and the other soils emitted NH3 (Figure 11). Spring banding of both fertilizers showed a reduction of NH3 emissions by about 67% across brown, dark brown, and black soil zones (Figure 11; Table 2). However, only a 5% reduction in NH3-N loss was simulated for a change from urea to ESN across these soils (Figure 11; Table 2). Effects of N fertilizer timing and product on NH3-N were not relevant for dark gray–gray soils since all the modeled fertilizer management scenarios simulated average consumptions of NH3 (Figure 11; Table 2).
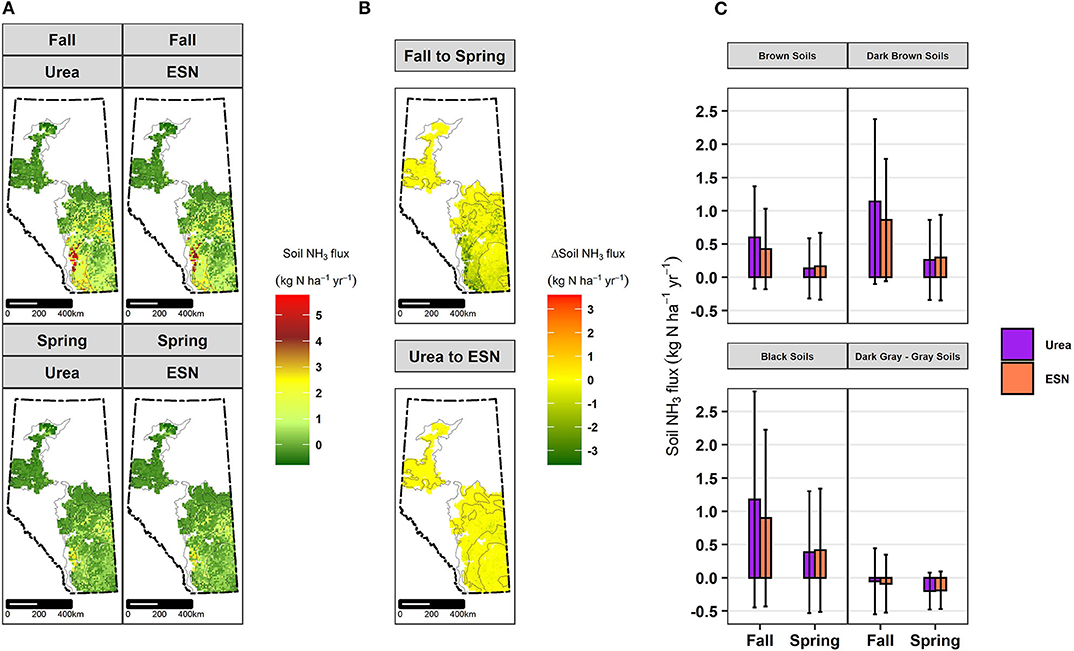
Figure 11. (A) Spatial distribution of modeled annual (January 1–December 31) soil NH3 fluxes averaged over the simulation period (2011–2015) for each township for each of the fall and spring banded urea and ESN applications across mid-slope landforms of Alberta under simulated barley cultivation. Positive fluxes represent emissions and vice versa. (B) Spatial distribution of differences in modeled annual soil NH3 fluxes for fall vs. spring and urea vs. ESN applications averaged over the simulation period (2011–2015) for each township across mid-slope landforms of Alberta under simulated barley cultivation. A positive change represents an increase in NH3 fluxes for a change from fall to spring or from urea to ESN and vice versa. The white areas on the map were not modeled based on the selection criteria as described in section Methodology and Model Inputs. The thick dashed lines on the maps represent Alberta's provincial boundary and the thin black lines within the maps demarcate soil group areas. (C) Soil group-wise averages of modeled annual soil NH3 fluxes for fall vs. spring banding and urea vs. ESN applications averaged over the simulation period (2011–2015) for all the townships in each soil group area across mid-slope landforms of Alberta under simulated barley cultivation. Error bars represent standard deviations illustrating spatiotemporal variations in modeled annual soil NH3 fluxes within each soil group area.
Modeled average dissolved organic and inorganic N in surface runoff and sub-surface discharge ranged from 0.32 (CV ± 90%) to 1.15 (CV ± 66%) kg N ha−1 year−1 across the soil groups in all fertilizer management scenarios (Figure 12). Nitrogen losses in surface runoff and sub-surface discharge varied regionally with black and dark gray–gray soils producing higher losses than the other two soils (Figure 12). However, there were large variations in modeled N losses in surface runoff and sub-surface discharge within each soil group area (Figure 12). Overall, N losses in surface runoff and sub-surface discharge were 37% less in spring banding than in fall banding across the province during 2011–2015 (Figure 12). Variations in N products from urea to ESN did not apparently affect N losses in surface runoff and sub-surface discharge (Figure 12; Table 2).
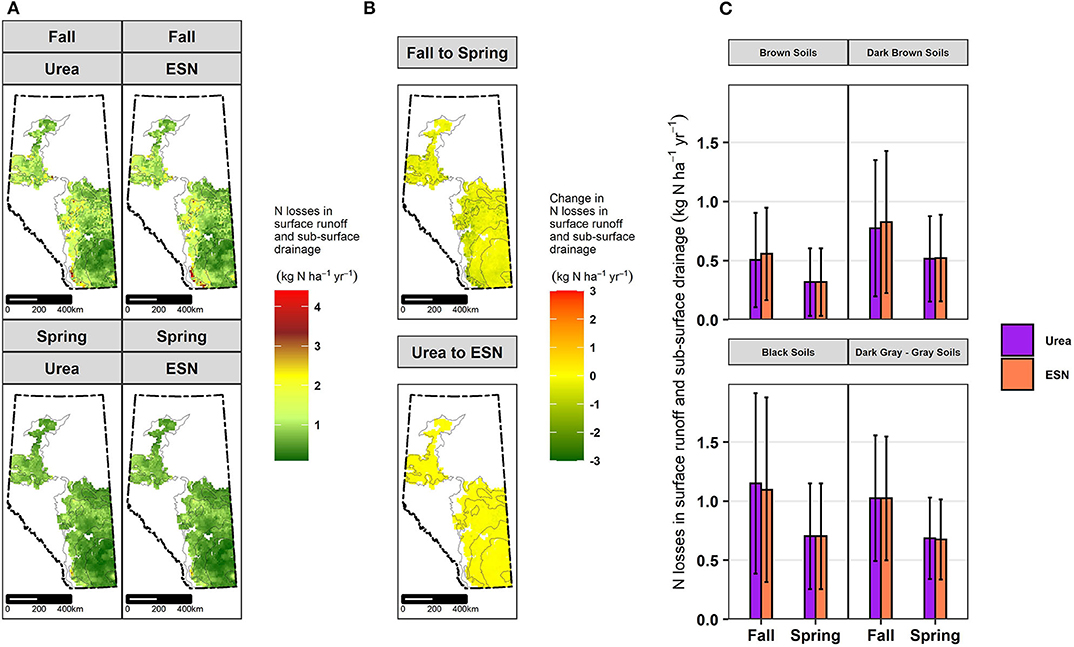
Figure 12. (A) Spatial distribution of modeled annual (January 1–December 31) nitrogen losses in surface runoff and sub-surface drainage averaged over the simulation period (2011–2015) for each township for each of the fall and spring banded urea and ESN applications across mid-slope landforms of Alberta under simulated barley cultivation. (B) Spatial distribution of differences in modeled annual nitrogen losses in surface runoff and sub-surface drainage for fall vs. spring and urea vs. ESN applications averaged over the simulation period (2011–2015) for each township across mid-slope landforms of Alberta under simulated barley cultivation. A positive change represents an increase in nitrogen losses in surface runoff and sub-surface drainage for a change from fall to spring or from urea to ESN and vice versa. The white areas on the map were not modeled based on the selection criteria as described in section Methodology and Model Inputs. The thick dashed lines on the maps represent Alberta's provincial boundary, and the thin black lines within the maps demarcate soil group areas. (C) Soil group-wise averages of modeled annual nitrogen losses in surface runoff and sub-surface drainage for fall vs. spring banding and urea vs. ESN applications averaged over the simulation period (2011–2015) for all the townships in each soil group area across mid-slope landforms of Alberta under simulated barley cultivation. Error bars represent standard deviations illustrating spatiotemporal variations in modeled annual nitrogen losses in surface runoff and sub-surface drainage within each soil group area.
Discussion
The geo-spatial variations of modeled dryland barley grain yields and N uptake across different soil groups and climates in Alberta during 2011–2015 matched reasonably well against observed variations in barley yields and N uptake reported across Alberta (Figures 6–8) (McKenzie et al., 2004; Anbessa and Juskiw, 2012; Perrott, 2016). However, modeled barley yields were about 25% larger than the AFSC reported observed yields during this period across Alberta (Figure 6). We provide the following explanations for such deviation. The observed yields published by AFSC included reduction in yields due to hail events, insect and pest damages, and lodging that were not simulated in the modeled scenarios (AFSC, 2019). Moreover, the AFSC data included reported yields from landforms that were not modeled in this study (e.g., top- and foot-slope positions and depressional areas) and from fields where lower than recommended N fertilizers may have been applied, which further contributed to the modeled vs. observed grain yield divergence. Model inputs for P fertilizer (Table 1) would have alleviated any possible P limitation to the simulated barley yield, which could have also contributed to the larger modeled yields vs. observed AFSC data. Barley yields in top-slope positions could be suppressed by low moisture availability. Yields in foot-slope and depressional area could also be affected by excessive moisture and lodging. These phenomena were not accounted for in these simulations since these simulations included only well-drained, mid-slope landforms, which tend to be higher yielding. Although the modeled dryland barley grain yields were larger than the AFSC data, the modeled grain yields and grain N uptake were well within the ranges of long-term experimental data on barley grain yields (i.e., 4,300–6,900 kg ha−1 year−1) and N uptake (i.e., 81–131 kg N ha−1 year−1) across brown, dark brown, black, and gray soils of southern and central Alberta (Figures 7, 8) (McKenzie et al., 2004; Anbessa and Juskiw, 2012; Perrott, 2016).
Variations in barley grain yields and N uptake across soil groups were modeled predominantly by adequate simulation of moisture and N availability to the modeled crop (Figures 6–8). Brown soils in southern Alberta have the lowest soil organic matter levels and received the lowest fertilizer rates and the lowest mid-growing season (July) precipitation during the simulation period (Figures 2, 3). Low soil organic matter in drier soils provided less substrate for N mineralization in the model, which, along with low fertilizer inputs, caused low available N for modeled crop growth and uptake. Low moisture availability also simulated crop water stress and, hence, a further decline in modeled crop growth and N uptake. Lower N and moisture availability caused lower modeled barley grain yields and N uptake in brown soils compared to the other soils that received relatively higher moisture and N inputs and had higher N mineralization from higher organic matter (Figures 2, 3, 6–8).
Modeled spring banding produced about 5% higher barley grain yields than fall banding in the dark brown soils, with no apparent change in yields between fall and spring banding in other soils (Figure 7; Table 2). This is supported by Malhi et al. (1992), whose plot research found that spring banding of urea fertilizer produced about 8% higher barley grain yield than late fall banding across Alberta. Modeled ESN demonstrated an initial lag response in N release compared to urea, which was corroborated well by independent laboratory studies (Figure 5) (Cahill et al., 2010). Despite the slower release, modeled ESN produced similar barley yields and N uptake to those under urea application (Figures 7, 8; Table 2). Gao et al. (2015) also found no significant change in spring wheat yields and grain N uptake between banded urea and ESN in two black chernozemic soils in Canadian prairies. Although initial slow release of ESN compared to urea was modeled and measured in laboratory studies (Figure 5) (Cahill et al., 2010), there was no field data available to validate the differences in modeled release pattern of N between urea and ESN. While the validation of modeled N release pattern of urea vs. ESN against the laboratory studies facilitated a comparative validation of modeled N release pattern between urea vs. ESN, it is still very important to corroborate the modeled N release pattern against field data where various factors like weather, soil temperature, moisture, land management, and crop uptake interact frequently. Validation of modeled N release against field data in future studies would further reduce the uncertainties in modeling the effects of conventional vs. controlled release N fertilizers and further improve our predictive capacity on the fate of these N management practices.
N fertilizer timing and products affected modeled barley yields and grain uptake differently based on soils and weather conditions. For instance, modeled grain yields and N uptake were lower in spring application than in fall application in some parts of southeast dark gray–gray soil group area (Figures 7, 8). The reduction in grain yields and N uptake from fall to spring were higher with ESN than with urea (Figures 7, 8). This was predominantly modeled from slower crop N availability governed by slower rates of urea hydrolysis as limited by lower microbial activity due to less soil organic C (Figure 2). Less over winter and spring precipitation over that area also increased aqueous concentration of microbial biomass, which further inhibited urease activity and hence rates of urea hydrolysis in spring banding scenarios that caused slower N release and reduced modeled grain yields and N uptake compared to those in fall banding scenarios (Figures 4, 7, 8). Slower N release in ESN than in urea further hindered modeled grain yields and N uptake in spring banded ESN in those areas (Figures 5, 7, 8). Asgedom et al. (2014) also found that slower release of N from banded ESN reduced spring wheat and rapeseed yields progressively over 2 years in a black chernozemic soil in the prairies. The simulations in this study, however, did not include any blend of ESN and urea, which is becoming a farm practice in some areas of Alberta to overcome the early N needs and to reduce the higher cost of ESN.
On the contrary to the southeast dark gray–gray soil group areas, modeled barley grain yields and N uptake in spring banding were higher than the fall banding in some parts of northwest dark gray–gray and southern dark brown soil group areas (Figures 7, 8). These increases in grain yields and N uptake from fall to spring banding were modeled from rapid N release from spring application as facilitated by adequate microbial activity from higher soil organic C and higher urease activity due to lower aqueous microbial concentration caused by adequate over winter and spring precipitation in those areas (Figures 2, 3, 7, 8).
Modeled N2O-N losses were well within the range of estimates (i.e., 0.1–3.0 kg N ha−1 year−1) based on linear temporal interpolations of measured N2O fluxes in no-till fields across different soils and climates of Alberta under spring wheat and barley cultivation (Figure 9) (Lemke et al., 1998, 1999; Rochette et al., 2008; Soon et al., 2011). Higher N2O emissions from black and dark gray–gray soils compared to brown and dark brown soils were simulated predominantly from larger accumulation from greater N inputs and N mineralization in wetter soils that enhanced the denitrification process in saturated soils (Figure 9). Like the modeled trend, increased N2O-N losses from fertilized crop fields were also reported for Alberta and globally with the increase in available substrate () for denitrification (Rochette et al., 2008; Shcherbak et al., 2014; Chai, 2017). Estimates from periodic field measurements of soil N2O fluxes showed larger N2O fluxes in black and gray soils than in brown and dark brown soils, which corroborates very well with the modeled geo-spatial distribution of N2O emissions from dryland barley fields on mid-slope landforms of Alberta across different soils and climates (Lemke et al., 1999; Rochette et al., 2008). Although modeled N release was slower in ESN than in urea, N2O emissions did not differ markedly in ESN simulations than in urea simulations for both application timing (Figures 5, 9; Table 2). Annual estimates based on periodic field measurements of N2O fluxes also showed that for recommended application rates of N fertilizer, ESN did not show any significant reduction in N2O-N losses from spring wheat, barley, and canola fields across Alberta and other prairie provinces as compared to the conventional urea (Li et al., 2012, 2016; Gao et al., 2015). However, estimated annual N2O-N losses were 15–25% larger in urea than in ESN when application rates were 1.5 times higher than the recommended rates, or when there was considerable seeding delay in the spring that created excessive accumulation from the spring banded N fertilizer (Li et al., 2012, 2016; Gao et al., 2015). Annual modeled N2O emissions were predominantly contributed by large flushes of N2O fluxes during spring thaw when inadequate O2 supply forced modeled microbes to reduce as alternate electron acceptors. Consequently, larger soil N2O fluxes (by up to 30%) from fall banding than from spring banding were modeled for both urea and ESN applications (Figure 9; Table 2). Estimates based on field measurements also showed that up to 30% of the total annual N2O emissions could be contributed by the large flushes of soil N2O fluxes during winter and spring thaw from fertilized crop fields across Canadian prairies (Dunmola et al., 2010; Glenn et al., 2012; Maas et al., 2013). Some estimates based on field data showed that fall banding could cause up to 50% greater N2O-N losses than spring banded urea and ESN from wheat-barley-canola systems in dark gray soils of Alberta (Soon et al., 2011). From a plot-based periodic flux measurement study, Hao et al. (2001) estimated about 60% greater N2O emissions with fall broadcasting of ammonium nitrate fertilizer followed by tillage than with similar spring applications. Modeled N2O emissions varied spatially with availability and degree of soil saturation (Figure 9). Higher availability in wetter soils produced large modeled N2O emissions of up to 4 kg N ha−1 year−1 in some parts of northern and central Alberta (Figure 9). Wetter soils were simulated in those areas during the simulation period (2011–2015) since water inputs through precipitation were greater than vertical water losses through evaporation in the modeled landscapes representing those areas. Based on periodically measured N2O fluxes, Nyborg et al. (1997) estimated that the N2O-N losses can be up to 3.5 kg N ha−1 within only an 11-day period of spring thaw, further indicating potentials of greater N2O losses due to accumulation during wetter spring. Current field data-based N2O-N loss estimates are predominantly based on linear interpolations of periodic flux measurements, which may miss the episodic flushes of N2O and, hence, may underestimate annual N2O losses. Flesch et al. (2018) further emphasizes the importance of higher temporal resolution measurements in estimating annual N2O-N losses while measuring 6-hourly N2O emissions from barley fields on gray luvisolic soils of central Alberta by using micrometeorological techniques. This study revealed that N2O-N emissions could accumulate up to 5.3 kg N ha−1 from barley fields over only a month during spring thaw, which were larger than the current annual estimates for western Canadian prairies (Flesch et al., 2018). However, maintaining long-term high-resolution N2O measurements and replicating them spatially are highly demanding of time, technology, and cost. Some of these limitations could be overcome by supplementing current estimates with the modeled annual N2O estimates in this study that were derived by accumulating hourly calculated outputs (section Validation and Analyses of Modeled Outputs).
Di-nitrogen (N2) emission is usually overlooked but can be a very significant form of N loss from agro-ecosystems that receive large N inputs and are under prolonged saturation (Zistl-Schlingmann et al., 2019). Modeled N2-N emissions were simulated predominantly from complete denitrification under saturated soil conditions during spring thaw, which eventually contributed to greater modeled N2-N losses in fall than spring banded urea and ESN (Figure 10; Table 2). Delayed release in N from ESN than urea did not produce a lower N2 emission (Figures 5, 10; Table 2). Modeled N2-N was not large enough to be agronomically and economically significant (Figure 10; Table 2).
Modeled NH3 emissions were higher in fall vs. spring banded urea and ESN in brown, dark brown, and black soils across Alberta (Figure 11; Table 2). The higher NH3 volatilization in fall was simulated from higher availability of for volatilization in fall banding simulations resulting from over winter and early spring hydrolyses. Generally moist soils during and shortly after spring application increased solubility in the model and, hence, also reduced modeled NH3 volatilization from spring banding than in fall banding. Reduced rate of urea hydrolysis in ESN caused about 5–8% reduction in NH3 volatilization compared to urea across dark brown and black soils in Alberta (Figure 11; Table 2) (Rawluk et al., 2001). Overall, modeled NH3 emissions across southern and central Alberta were lower than the estimate of about 2.5 kg NH3-N ha−1 year−1 for western Canadian wheat fields in an emission factor based monthly NH3 emission modeling (Sheppard et al., 2010). Simulated NH3 emissions were also affected by soil pH. For instance, black and dark brown soils that had pH between 7 and 8 shifted the modeled chemical equilibrium in such a way that solubility was reduced, which ultimately enhanced NH3 volatilization (Figures 2, 11) (Sommer and Ersbøll, 1996; Bouwman et al., 2002; Havlin et al., 2013; Grant et al., 2016). In contrast, most of the dark gray–gray soils had pH under 6, which enhanced modeled solubility and hence caused net NH3 consumption instead of emission (Figures 2, 11) (Sommer and Ersbøll, 1996; Bouwman et al., 2002; Havlin et al., 2013; Grant et al., 2016).
Nitrogen losses in surface runoff and sub-surface discharge from crop fields in western Canadian prairies are primarily snowmelt driven (Casson et al., 2008; Tiessen et al., 2010). Dissolved inorganic N from fall banded urea and ESN were transported along with the surface runoff and sub-surface discharge waters during snowmelt and spring thaw, which produced larger modeled N-runoff in fall vs. spring banding across Alberta over the simulation period (Figure 12; Table 2). Less runoff, combined with lower accumulation from lower N inputs and less N mineralization, caused lower modeled N-runoff fluxes in brown soils than the other soils (Figures 2, 12) (Casson et al., 2008). Modeled N-runoff fluxes were overall smaller compared to the estimates of 7.2–11.7 kg N-runoff losses ha−1 year−1 from eastern Canadian crop fields that received higher precipitation and N inputs (De Jong et al., 2009). However, in western Canada, N loss through leaching was estimated to vary from 1.5 to 4.5 kg N ha−1 year−1 for various N application rates in various rotations in long-term (over 30 years) research plots (Campbell et al., 1994, 2006). These leaching losses in western Canada were negligible in continuously cropped and fall seeded fields but were very large in excessively fertilized fields and fields under summer fallows, which favored accumulation and soil moisture buildup that are precursors of leaching (Campbell et al., 1994, 2006). Modeled losses through subsurface drainage in this study could be a proxy of leaching since these were transported out of the modeled root zone along with subsurface drainage through lateral model boundaries. Assuming modeled loss through sub-surface drainage as a proxy of N leaching, modeled losses of dissolved organic and inorganic N from continuously cropped fields through surface runoff and subsurface discharge in this study can be considered very conservative when compared to the aqueous N loss estimates through leaching from long-term field studies in western Canada (Figure 12) (Campbell et al., 1994, 2006).
Although the N loss estimates in this modeling are within the range of most field-plot based estimates, the modeled estimates can be considered conservative since the simulation did not include foot-slope or depressional areas where N losses can be 2- to 3-fold higher than those from mid-slope landforms (Izaurralde et al., 2004). Extending these simulations to remaining landforms in interconnected transects of top-, mid-, and foot-slopes, and depressional areas would thus provide more comprehensive estimates of agronomic N losses and crop N use from various N management scenarios. Reproducing these simulations for highly fertilized crop (e.g., canola) fields, irrigated lands, and for agronomic management such as pulses in rotations, and residue retention, would also include simulations of extreme N losses and, hence, would provide better approximations of the fate of N from various agronomic N management. Besides, the simulations in this study were performed over large spatial extents of each grid cell (~10 km × 10 km) using only four selected N management scenarios, extrapolated weather data, and dominant soil properties. Given the variabilities in soils, weather, crop, land use, and management practices within each grid cell of this size, the soil, weather, and N management practices used as inputs for these simulations may not always adequately represent the conditions in a field or a farm within a grid. So, the estimates from this modeling study can only be a first approximation of crop N recovery and agronomic N losses at a field or a farm scale. However, finer resolution modeling can be performed at a field or farm scale by selecting locations of interests from the modeled landscape and providing inputs to the model for soil, weather, crop, and management practices to adequately represent a field or a farm within the simulations (Table 1).
Conclusions
The process-based modeling analyses in this study indicated that the spring application of fertilizer could be an optimal N fertilizer application timing for Alberta farmers in reducing N losses while not compromising agronomic and economic returns in dryland barley cultivation across mid-slope landforms. Effectiveness of the spring banding in optimizing benefits and minimizing N losses, however, would be dependent on variations in soils, climate, and rates of N inputs. The modeled results, however, did not show discernible differences in barley N use or agronomic N losses from Alberta barley fields on the mid-slope landscapes due to a difference in N fertilizer products between urea and ESN.
Resilience of any agronomic N management option in terms of long-term sustainability and profitability is a key to successful farming operations. The desire to maximize production rather than optimize it may end up with N fertilizer application rates beyond economic profitability or environmental sustainability. This study opens up windows of opportunities for assessing the potential impacts of increasing N fertilizer application rates on agronomic N loss and crop yields and N uptake in Alberta. Such a study can also be used in assessing topographic influence on variable N fertilizer rates in precision farming to optimize crop productivity and minimize agricultural N losses. Application timing and placement, which are considered less efficient and more prone to losses, such as fall application and surface broadcast, are sometimes preferred for operational reasons. “What if” scenario analyses based on such modeling would provide the farmers with options of working with different enhanced efficiency N fertilizer products such as coated urea, urease inhibitors, nitrification inhibitors, or any combination of these technologies to reduce N losses and optimize production while operating within their operational limitations in terms of timing and placement.
This modeling approach can be used to identify “hot spots” or sensitive areas that are more prone to N losses. Policy makers can use this information to formulate applicable and sustainable policies and to devise incentive plans for promoting environmental stewardship in farming operations. The fertilizer industry can get valuable first-hand forecast to formulate and commercialize suitable products for profitable and sustainable agri-business. This study pioneered a methodology to assess the suitability of 4R nutrient stewardship options for sustainable crop production across a broad area of about 21 million ha. The simulations are also scalable to regional, federal, continental, and global scales by feeding the model with soil, climate, and management data appropriate to the scales (Table 1). Therefore, this study has important practical application, replicability, and validity in contributing to the existing knowledge pool of agricultural nutrient management science.
Data Availability Statement
The original sources and links of all data used as model inputs and for model validation are appropriately cited in the article.
Code Availability
Ecosys codes can be downloaded from https://github.com/jinyun1tang/ECOSYS.
Author Contributions
SM led the study and contributed to the formulation of the original idea, extracting data, designing modeling experiment, performing simulations, analyzing data, and writing the manuscript. DS, DH, LK, and DI contributed to the design and implementation of data extraction procedure for the modeling experiment and to manuscript writing. TG and JI contributed to the design of modeled output visualizations and manuscript writing. RG is the original developer of the model ecosys used in this study and also contributed to the modeling experiment and manuscript writing. All authors contributed to the article and approved the submitted version.
Funding
Funding for this project was provided by Growing Forward 2 Research and Innovation Internal Initiatives of federal–provincial partnership between Canada and Alberta. Computing support for this project was provided by Compute Canada WestGrid. Organization and analyses of model inputs and modeled outputs were performed by using R 3.6.3 packages of dplyr and tidyr. All the graphs and the maps (except Figure 1) were created by using R 3.6.3 packages of ggplot2 and rgdal.
Conflict of Interest
The authors declare that the research was conducted in the absence of any commercial or financial relationships that could be construed as a potential conflict of interest.
Acknowledgments
We thank Deb Werk, Fatima Shire, and Rachel Berardi for their inputs in data extraction for model inputs and modeled output visualization. We also thank Karen Raven for advocating and supporting the project throughout the administrative processes of funding competition.
References
ACIS (2019). Data From: Alberta Climate Information Service. Available online at: https://agriculture.alberta.ca/acis/
AFSC (2019). Data From: Yield Alberta 2015 and 2016 compiled by Agriculture Financial Services Corporation (AFSC) Alberta. Available online at: https://afsc.ca/resources/
AGRASID (2019). Data From: Agricultural Regions of Alberta Soil Inventory Database. Available online at: https://www.alberta.ca/agricultural-regions-of-alberta-soil-inventory-database.aspx
Anbessa, Y., and Juskiw, P. (2012). Nitrogen fertilizer rate and cultivar interaction effects on nitrogen recovery, utilization efficiency, and agronomic performance of spring barley. ISRN Agronomy 2012:531647. doi: 10.5402/2012/531647
Asgedom, H., Tenuta, M., Flaten, D. N., Gao, X., and Kebreab, E. (2014). Nitrous oxide emissions from a clay soil receiving granular urea formulations and dairy manure. Agron. J. 106, 732–744. doi: 10.2134/agronj2013.0096
Bhanja, S. N., Wang, J., Shrestha, N. K., and Zhang, X. (2019). Microbial kinetics and thermodynamic (MKT) processes for soil organic matter decomposition and dynamic oxidation-reduction potential: model descriptions and applications to soil N2O emissions. Environ. Pollut. 247, 812–823. doi: 10.1016/j.envpol.2019.01.062
Bock, M., Gasser, P. Y., Pettapiece, W. W., Brierley, A. J., Bootsma, A., Schut, P., et al. (2018). The land suitability rating system is a spatial planning tool to assess crop suitability in Canada. Front. Environ. Sci. 6:77. doi: 10.3389/fenvs.2018.00077
Bouwman, A. F., Boumans, L. J. M., and Batjes, N. H. (2002). Estimation of global NH3 volatilization loss from synthetic fertilizers and animal manure applied to arable lands and grasslands. Glob. Biogeochem. Cy. 16:8. doi: 10.1029/2000GB001389
Butterbach-Bahl, K., Baggs, E. M., Dannenmann, M., Kiese, R., and Zechmeister-Boltenstern, S. (2013). Nitrous oxide emissions from soils: how well do we understand the processes and their controls?. Philos. T. R. Soc. B 368:20130122. doi: 10.1098/rstb.2013.0122
Cahill, S., Osmond, D., and Israel, D. (2010). Nitrogen release from coated urea fertilizers in different soils. Commun. Soil Sci. Plan. 41, 1245–1256. doi: 10.1080/00103621003721437
Campbell, C. A., Lafond, G. P., Zentner, R. P., and Jame, Y. W. (1994). Nitrate leaching in a udic haploboroll as influenced by fertilization and legumes. J. Environ. Qual. 23, 195–201. doi: 10.2134/jeq1994.00472425002300010030x
Campbell, C. A., Selles, F., Zentner, R. P., De Jong, R., Lemke, R., and Hamel, C. (2006). Nitrate leaching in the semiarid prairie: effect of cropping frequency, crop type, and fertilizer after 37 years. Can. J. Soil Sci. 86, 701–710. doi: 10.4141/S05-008
Cassman, K. G., Dobermann, A., and Walters, D. T. (2002). Agroecosystems, nitrogen-use efficiency, and nitrogen management. AMBIO 31, 132–141. doi: 10.1579/0044-7447-31.2.132
Casson, J. P., Olson, B. M., Little, J. L., and Nolan, S. C. (2008). Assessment of Environmental Sustainability in Alberta's Agricultural Watersheds Project, Volume 4: Nitrogen Loss in Surface Runoff. Edmonton, AB: Alberta Agriculture and Rural Development.
Chai, L. L. (2017). Nitrous oxide emissions in southern alberta croplands in response to nitrogen rates, fertigation and moisture (Master's thesis). University of Alberta, Edmonton, AB.
Cui, G., and Wang, J. (2019). Improving the DNDC biogeochemistry model to simulate soil temperature and emissions of nitrous oxide and carbon dioxide in cold regions. Sci. Total Environ. 687, 61–70. doi: 10.1016/j.scitotenv.2019.06.054
De Jong, R., Drury, C. F., Yang, J. Y., and Campbell, C. A. (2009). Risk of water contamination by nitrogen in Canada as estimated by the IROWC-N model. J. Environ. Manage. 90, 3169–3181. doi: 10.1016/j.jenvman.2009.05.034
Dimitrov, D. D., and Wang, J. (2019). Geographic inventory framework for estimating spatial pattern of methane and nitrous oxide emissions from agriculture in Alberta, Canada. Environ. Dev. 32:100461. doi: 10.1016/j.envdev.2019.100461
Dunmola, A. S., Tenuta, M., Moulin, A. P., Yapa, P., and Lobb, D. A. (2010). Pattern of greenhouse gas emission from a Prairie Pothole agricultural landscape in Manitoba, Canada. Can. J. Soil Sci. 90, 243–256. doi: 10.4141/CJSS08053
Flesch, T., Baron, V., Wilson, J., Basarab, J., Desjardins, R., Worth, D., et al. (2018). Micrometeorological measurements reveal large nitrous oxide losses during spring thaw in Alberta. Atmosphere 9:128. doi: 10.3390/atmos9040128
Forster, P., Ramaswamy, V., Artaxo, P., Berntsen, T., Betts, R., Fahey, D. W., et al. (2007). “Changes in atmospheric constituents and in radiative forcing,” in Climate Change 2007: The Physical Science Basis, eds S. D. Solomon, M. Qin, Z. Manning, M. Chen, K. B. Marquis, and M. T. Averyt (Cambridge; New York, NY: Cambridge University Press), 129–234.
Gao, X., Asgedom, H., Tenuta, M., and Flaten, D. N. (2015). Enhanced efficiency urea sources and placement effects on nitrous oxide emissions. Agron. J. 107, 265–277. doi: 10.2134/agronj14.0213
Glenn, A. J., Tenuta, M., Amiro, B. D., Maas, S. E., and Wagner-Riddle, C. (2012). Nitrous oxide emissions from an annual crop rotation on poorly drained soil on the Canadian prairies. Agr. Forest Meteorol. 166, 41–49. doi: 10.1016/j.agrformet.2012.06.015
Grant, C., and Wu, R. (2008). Enhanced-efficiency fertilizers for use on the Canadian prairies. Crop Management 7, 1–15. doi: 10.1094/CM-2008-0730-01-RV
Grant, C. A., Peterson, G. A., and Campbell, C. A. (2002). Nutrient considerations for diversified cropping systems in the northern great plains. Agron. J. 94, 186–198. doi: 10.2134/agronj2002.0186
Grant, R. F. (2001). “A review of the Canadian ecosystem model ecosys,” in Modeling Carbon and Nitrogen Dynamics for Soil Management, eds. M. J. Shaffer, L. Ma, and S. Hansen (Boca Raton, FL: CRC Press), 173–264.
Grant, R. F., Dyck, M., and Puurveen, D. (2020). Nitrogen and phosphorus control carbon sequestration in agricultural ecosystems: modelling carbon, nitrogen, and phosphorus balances at the breton plots with ecosys under historical and future climates. Can. J. Soil Sci. doi: 10.1139/cjss-2019-0132
Grant, R. F., Kimball, B. A., Conley, M. M., White, J. W., Wall, G. W., and Ottman, M. J. (2011). Controlled warming effects on wheat growth and yield: field measurements and modeling. Agron. J. 103, 1742–1754. doi: 10.2134/agronj2011.0158
Grant, R. F., Neftel, A., and Calanca, P. (2016). Ecological controls on N2O emission in surface litter and near-surface soil of a managed grassland: modelling and measurements. Biogeosciences 13, 3549–3571. doi: 10.5194/bg-13-3549-2016
Grant, R. F., and Pattey, E. (1999). Mathematical modeling of nitrous oxide emissions from an agricultural field during spring thaw. Glob. Biogeochem. Cy. 13, 679–694. doi: 10.1029/1998GB900018
Grant, R. F., and Pattey, E. (2003). Modelling variability in N2O emissions from fertilized agricultural fields. Soil Biol. Biochem. 35, 225–243. doi: 10.1016/S0038-0717(02)00256-0
Grant, R. F., and Pattey, E. (2008). Temperature sensitivity of N2O emissions from fertilized agricultural soils: mathematical modeling in ecosys. Glob. Biogeochem. Cy. 22:GB4019. doi: 10.1029/2008GB003273
Grant, R. F., Pattey, E., Goddard, T. W., Kryzanowski, L. M., and Puurveen, H. (2006). Modeling the effects of fertilizer application rate on nitrous oxide emissions. Soil Sci. Soc. Am. J. 70, 235–248. doi: 10.2136/sssaj2005.0104
Hao, X., Chang, C., Carefoot, J. M., Janzen, H. H., and Ellert, B. H. (2001). Nitrous oxide emissions from an irrigated soil as affected by fertilizer and straw management. Nutr. Cycl. Agroecosys. 60, 1–8. doi: 10.1023/A:1012603732435
Havlin, J. L., Tisdale, S. L., Nelson, W. L., and Beaton, J. D. (2013). Soil Fertility and Fertilizers: An Introduction to Nutrient Management. Hoboken, NJ: Pearson Inc.
Izaurralde, R. C., Lemke, R. L., Goddard, T. W., McConkey, B., and Zhang, Z. (2004). Nitrous oxide emissions from agricultural toposequences in Alberta and Saskatchewan. Soil Sci. Soc. Am. J. 68, 1285–1294. doi: 10.2136/sssaj2004.1285
Janzen, H. H., Beauchemin, K. A., Bruinsma, Y., Campbell, C. A., Desjardins, R. L., Ellert, B. H., et al. (2003). The fate of nitrogen in agroecosystems: an illustration using Canadian estimates. Nutr. Cycl. Agroecosys. 67, 85–102. doi: 10.1023/A:1025195826663
Lemke, R. L., Izaurralde, R. C., and Nyborg, M. (1998). Seasonal distribution of nitrous oxide emissions from soils in the parkland region. Soil Sci. Soc. Am. J. 62, 1320–1326. doi: 10.2136/sssaj1998.03615995006200050025x
Lemke, R. L., Izaurralde, R. C., Nyborg, M., and Solberg, E. D. (1999). Tillage and N source influence soil-emitted nitrous oxide in the Alberta Parkland region. Can. J. Soil Sci. 79, 15–24. doi: 10.4141/S98-013
Li, C., Hao, X., Blackshaw, R. E., Clayton, G. W., O'Donovan, J. T., and Harker, K. N. (2016). Nitrous oxide emissions in response to ESN and urea application in a no-till barley cropping system. Commun. Soil Sci. Plan. 47, 692–705. doi: 10.1080/00103624.2016.1146745
Li, C., Hao, X., Blackshaw, R. E., O'Donovan, J. T., Harker, K. N., and Clayton, G. W. (2012). Nitrous oxide emissions in response to ESN and urea, herbicide management and canola cultivar in a no-till cropping system. Soil Tillage Res. 118, 97–106. doi: 10.1016/j.still.2011.10.017
Li, Y., Shah, S. H. H., and Wang, J. (2020). Modelling of nitrification inhibitor and its effects on emissions of nitrous oxide (N2O) in the UK. Sci. Total Environ. 709:136156. doi: 10.1016/j.scitotenv.2019.136156
LSRS (2019). Data From: Land Suitability Rating System. LSRS. Available online at: https://open.alberta.ca/publications/land-suitability-rating-system
Maas, S. E., Glenn, A. J., Tenuta, M., and Amiro, B. D. (2013). Net CO2 and N2O exchange during perennial forage establishment in an annual crop rotation in the red river valley, manitoba. Can. J. Soil Sci. 93, 639–652. doi: 10.4141/cjss2013-025
MacArthur Foundation (2019). Financing Sustainable Development Goals. Available online at: https://www.macfound.org/press/grantee-publications/financing-sustainable-development-goals/ (accessed November 13, 2019).
MacMillan, R. A., and Pettapiece, W. W. (2000). Alberta Landforms, Quantitative Morphometric Descriptions and Classification of Typical Alberta Landforms. Saskatchewan: Agriculture and Agri-Food Canada.
Malhi, S. S., Grant, C. A., Johnston, A. M., and Gill, K. S. (2001). Nitrogen fertilization management for no-till cereal production in the canadian great plains: a review. Soil Tillage Res. 60, 101–122. doi: 10.1016/S0167-1987(01)00176-3
Malhi, S. S., Nyborg, M., Solberg, E. D., and Heany, D. J. (1992). Fall Compared to Spring Application of Nitrogen Fertilizers in Alberta. Edmonton, AB: Agriculture Canada.
McKenzie, R. H., Middleton, A. B., Hall, L., DeMulder, J., and Bremer, E. (2004). Fertilizer response of barley grain in south and central Alberta. Can. J. Soil Sci. 84, 513–523. doi: 10.4141/S04-013
Metivier, K. A., Pattey, E., and Grant, R. F. (2009). Using the ecosys mathematical model to simulate temporal variability of nitrous oxide emissions from a fertilized agricultural soil. Soil Biol. Biochem. 41, 2370–2386. doi: 10.1016/j.soilbio.2009.03.007
Nyborg, M., Laidlaw, J. W., Solberg, E. D., and Malhi, S. S. (1997). Denitrification and nitrous oxide emissions from a black Chernozemic soil during spring thaw in Alberta. Can. J. Soil Sci. 77, 153–160. doi: 10.4141/S96-105
Perrott, L. A. (2016). Advanced agronomic practices to maximize feed barley (Hordeum vulgare L.) yield, quality, and standability in Alberta environments (Master's thesis). University of Alberta, Edmonton, AB.
Protz, R., Presant, E. W., and Arnold, R. W. (1968). Establishment of the modal profile and measurement of variability within a soil landform unit. Can. J. Soil Sci. 48, 7–19. doi: 10.4141/cjss68-002
Qiao, C., Liu, L., Hu, S., Compton, J. E., Greaver, T. L., and Li, Q. (2015). How inhibiting nitrification affects nitrogen cycle and reduces environmental impacts of anthropogenic nitrogen input. Glob. Change Biol. 21, 1249–1257. doi: 10.1111/gcb.12802
Rawluk, C. D. L., Grant, C. A., and Racz, G. J. (2001). Ammonia volatilization from soils fertilized with urea and varying rates of urease inhibitor NBPT. Can. J. Soil Sci. 81, 239–246. doi: 10.4141/S00-052
Rochette, P., Worth, D. E., Lemke, R. L., McConkey, B. G., Pennock, D. J., Wagner-Riddle, C., et al. (2008). Estimation of N2O emissions from agricultural soils in Canada. I. Development of a country-specific methodology. Can. J. Soil Sci. 88, 641–654. doi: 10.4141/CJSS07025
Rockström, J., Steffen, W. L., Noone, K., Persson, Å., Chapin, F. S. III., Lambin, E. F., et al. (2009). Planetary boundaries: exploring the safe operating space for humanity. Ecol. Soc. 14:32. doi: 10.5751/ES-03180-140232
Shcherbak, I., Millar, N., and Robertson, G. P. (2014). Global metaanalysis of the nonlinear response of soil nitrous oxide (N2O) emissions to fertilizer nitrogen. Proc. Natl. Acad. Sci. U.S.A. 111, 9199–9204. doi: 10.1073/pnas.1322434111
Shen, J., Melaku, N. D., Treu, R., and Wang, J. (2019a). Inventories of methane and nitrous oxide emissions from animal and crop farms of 69 municipalities in Alberta, Canada. J. Clean. Prod. 234, 895–911. doi: 10.1016/j.jclepro.2019.06.270
Shen, J., Treu, R., Wang, J., Hao, X., and Thomas, B. W. (2019b). Modeling growing season and annual cumulative nitrous oxide emissions and emission factors from organically fertilized soils planted with barley in Lethbridge, Alberta, Canada. Agric. Syst. 176:102654. doi: 10.1016/j.agsy.2019.102654
Sheppard, S. C., Bittman, S., and Bruulsema, T. W. (2010). Monthly ammonia emissions from fertilizers in 12 canadian ecoregions. Can. J. Soil Sci. 90, 113–127. doi: 10.4141/CJSS09006
Shrestha, N. K., Thomas, B. W., Du, X., Hao, X., and Wang, J. (2018). Modeling nitrous oxide emissions from rough fescue grassland soils subjected to long-term grazing of different intensities using the soil and water assessment tool (SWAT). Environ. Sci. Pollut. Res. Int. 25, 27362–27377. doi: 10.1007/s11356-018-2719-2
Snyder, C. S. (2017). Enhanced nitrogen fertiliser technologies support the ‘4R'concept to optimise crop production and minimise environmental losses. Soil Res. 55, 463–472. doi: 10.1071/SR16335
Sommer, S. G., and Ersbøll, A. K. (1996). Effect of air flow rate, lime amendments, and chemical soil properties on the volatilization of ammonia from fertilizers applied to sandy soils. Biol. Fertil. Soils 21, 53–60. doi: 10.1007/BF00335993
Soon, Y. K., Malhi, S. S., Lemke, R. L., Lupwayi, N. Z., and Grant, C. A. (2011). Effect of polymer-coated urea and tillage on the dynamics of available N and nitrous oxide emission from gray luvisols. Nutr. Cycl. Agroecosys. 90, 267–279. doi: 10.1007/s10705-011-9428-2
Statistics Canada (2016). Data from: 2016 Census of Agriculture. Available online at: https://www.statcan.gc.ca/eng/ca2016
Tiessen, K. H. D., Elliott, J. A., Yarotski, J., Lobb, D. A., Flaten, D. N., and Glozier, N. E. (2010). Conventional and conservation tillage: influence on seasonal runoff, sediment, and nutrient losses in the canadian prairies. J. Environ. Qual. 39, 964–980. doi: 10.2134/jeq2009.0219
UNEP (2014). UNEP Year Book 2014: Emerging Issues in Our Global Environment. United Nations Environment Programme: Division of Early Warning, and Assessment. Available online at: https://agriculture.alberta.ca/acis/
Urso, J. H., and Gilbertson, L. M. (2018). Atom conversion efficiency: a new sustainability metric applied to nitrogen and phosphorus use in agriculture. ACS Sustain. Chem. Eng. 6, 4453–4463. doi: 10.1021/acssuschemeng.7b03600
Keywords: nitrous oxide, ammonia, mineralization, grain yield, denitrification, nitrification, volatilization, Alberta
Citation: Mezbahuddin S, Spiess D, Hildebrand D, Kryzanowski L, Itenfisu D, Goddard T, Iqbal J and Grant R (2020) Assessing Effects of Agronomic Nitrogen Management on Crop Nitrogen Use and Nitrogen Losses in the Western Canadian Prairies. Front. Sustain. Food Syst. 4:512292. doi: 10.3389/fsufs.2020.512292
Received: 26 November 2019; Accepted: 14 August 2020;
Published: 24 September 2020.
Edited by:
Alisa W. Coffin, United States Department of Agriculture (ARS), United StatesReviewed by:
Laura Ercoli, Institute of Life Sciences, ItalyReynald L. Lemke, Saskatoon Research and Development Centre, Canada
Copyright © 2020 Mezbahuddin, Spiess, Hildebrand, Kryzanowski, Itenfisu, Goddard, Iqbal and Grant. This is an open-access article distributed under the terms of the Creative Commons Attribution License (CC BY). The use, distribution or reproduction in other forums is permitted, provided the original author(s) and the copyright owner(s) are credited and that the original publication in this journal is cited, in accordance with accepted academic practice. No use, distribution or reproduction is permitted which does not comply with these terms.
*Correspondence: Symon Mezbahuddin, c3ltb24ubWV6YmFodWRkaW5AZ292LmFiLmNh