 Andrea Fongar
 Vincent Linderhof
 Beatrice Ekesa
 Youri Dijkxhoorn
 Martha Dorcas Nalweyiso
- 1Alliance of Bioversity International and CIAT, Kampala, Uganda
- 2Wageningen University and Research, Wageningen Economic Research, Wageningen, Netherlands
Healthy diets are unaffordable for almost 3.1 billion people worldwide, and in 2018, already 43% of the African population were urban dwellers. Our food systems are changing rapidly, coupled with rising dietary aspirations. What are healthy diets and how can healthy diets be reached and increased in an urban context was the question of project NOURICITY. Looking into different information channels to deliver information on healthy diets in a low-income area in urban Kampala, Uganda, two packages of interventions were developed based on information on the selected focus group discussions with parish representatives. The first package consisted of a flier including graphic information on healthy diets and three food groups (treatment group 1). The second included the same flier plus interactive voice responses (IVRs) as a phone call to deliver the flier information in a different format (treatment group 2). For the study, we targeted 450 randomly selected households, which were randomly assigned into three groups (control, treatment group 1, and treatment group 2). Respondents from Kanyanya (a low-income parish of Kampala city) were randomly selected. They were visited two times in March as well as in December of the year 2021, while the intervention was rolled out in the period from September to November 2021. Healthy diets are measured using the Household Dietary Diversity Score and the food variety score is based on a 7-day food consumption recall, while dietary quality is measured for a subsample of women and the minimum dietary diversity for all of the selected women. The results indicated statistically significant changes per group at household food consumption in March 2021 compared to December 2021. However, the results of the difference-in-difference method between the control and the treatment groups did not display any significant difference at the household level. However, increased dairy and meat consumption in the treatment groups was observed. Over 90% of the households in treatment group 2 listened to any type of IVR message. Although no significant treatment effects were found, almost all households receiving intervention package 2 mentioned that the IVR calls were easy to follow, while almost 80% indicated sharing the information with their neighbors and 92% enjoyed receiving the message. However, the intervention has potential but needs to be improved upon.
1. Introduction
Around the world, almost 3.1 billion people were not able to afford a healthy diet in 2020 among others as a result of increased food prices influenced by the pandemic and other crises (FAO, 2022). On the one hand, the estimated number of people facing hunger in 2021 ranged from 702 to 828 million, representing almost 10% of the world's population (FAO, 2022). While on the other hand, over 40% of all men and women (2.2 billion) worldwide are already overweight or obese due to overconsumption of food energy and nutrients (Development Initiatives, 2021). Moreover, the prevalence of overweight children under 5 years of age increased in half of the countries worldwide from 33.3 million in 2000 to 38.9 million in 2020 (FAO, 2022). Adding to the economic impacts of malnourishment, urbanization is increasing globally. It is estimated that, by 2030, about 5 billion people – 66% of the global population – will live in urban areas, which is two times as many as in 1950 (World Health Organization UN-Habitat., 2016). In 2018, 43% of the population in Africa already lived in urban areas. The UN estimates that urbanization will mostly occur in low- and middle-income countries (LMICs), thus manifesting in Africa and Asia more rapidly than in other continents (United Nations, 2019). As a result of the fast process of urbanization, poverty and malnutrition hotspots are moving from rural to urban communities more and more (Sahn and Stifel, 2003). This trend changes and challenges the food systems in urban settings. Moreover, the rising dietary aspirations of African urban populations often lead to increased consumption of unhealthy processed foods while hunger remains an issue (Ziraba et al., 2009; Tschirley et al., 2015). African cities face increased overweight, obesity, micronutrient deficiency, and undernourishment simultaneously (Popkin, 2003; Popkin et al., 2012).
People's food choices are influenced by many different factors, such as behavioral predispositions, personal food experience, and intra-personal factors, including traditions, attitudes, beliefs, and knowledge, as well as environmental factors (Contento, 2008). Consumer behavior including food consumption is so far understudied in low-income countries (Melesse and Van den Berg, 2021), with only a few examples of studies aiming to understand the underlying causes of consumer behavior and food choice motives. A study in Addis Ababa (Ethiopia) examined whether more nutritional knowledge translates into more diversified food consumption (Melesse and Van den Berg, 2021). They found that the Household Dietary Diversity Score (HDDS) increased with nutrition knowledge, with health (regarding food safety; 91%) being the most important aspect. Nutritional value and easiness of preparation were the least important food choice motives (63 and 59%) (Melesse and Van den Berg, 2021). In addition, the studies that link nutritional knowledge to diets are rare in eastern Africa. Most related studies investigated the relationship between maternal nutrition training/knowledge and child nutrition in rural Ethiopia or other east African countries (Nabugoomu et al., 2015; Debela et al., 2017). Compared to vitamin knowledge, dietary knowledge had a larger effect on women's and children's dietary diversity, while men's dietary knowledge showed a positive and significant association with HDDS, the mean dietary diversity score (MDD), and the mean dietary diversity score for women (MDD-W) in Ethiopia, which indicates potential for men's engagement in improving household nutrition (Ambikapathi et al., 2020). Other studies relate nutritional knowledge to the consumption of specific food items or food groups with particular nutritional values such as fruits and vegetables (Raaijmakers et al., 2018).
Food consumption and food choice motivation and influencers are highly important for guiding policy efforts toward healthier diets. Often nutritional knowledge and nutritional advice are provided for specific target groups, such as young children or people with specific needs. Additionally, advice is often delivered in person, which is often not suitable for urban dwellers. However, as aforementioned, more insights are needed to develop, design, and offer food and nutrition-related information that better fits a driver's range of consumers. Currently, a rise in smartphone ownership and technical developments is seen worldwide, especially in LMIC, providing an opportunity and entry point for food assessments or nutritional knowledge delivery. Already mobile phones are used in the health sector (mHealth) for data collection, management, service delivery, communication, and diagnostics, for example, with information on maternal, newborn, and child health (Feroz et al., 2017; Mildon and Sellen, 2019). Short message service (SMS) for written texts or interactive voice response (IVR) technology for audio content is most commonly used for behavior change communication interventions using mobile phones (Mildon and Sellen, 2019), and two recent reviews displayed their feasibility in various settings, finding that direct messaging intervention is acceptable to target users and is a potential for improving maternal, newborn, and child health knowledge and practices (Feroz et al., 2017; Mildon and Sellen, 2019). Evidence from a randomized control trial in Mozambique showed positive effects of text messages for family planning services with reminders with encouragement to visit a clinic – the results showed that women who received the reminders are more likely to visit a clinic (Leight et al., 2022). The ENRICH project, for example, used text messaging as a tool to assess diets in the settlements of Nairobi. Participants received 20 prompts on food choice motives and questions on the intake of fruits and vegetables of the previous day (Raaijmakers et al., 2019).
In Uganda, malnutrition is a prominent problem. The prevalence of severe food insecurity in the total population increased in the period from 2019 to 2021, where 23% of the population faced severe food insecurity while stunting rates slightly reduced from 2012 to 2020. At the same time, the overweight rates for children under 5 years of age as well as obesity rates for adults increased in the same period (FAO, 2022). In total, 1.5 million inhabitants in Kampala suffer from increasing urbanization and migration from rural to urban centers (Uganda Bureau of Statistics, 2016). A study by Auma et al. (2019) looking into different dietary patterns of women of reproductive age (WRA) provided evidence of a dietary transition. Particularly in urban areas, women consumed a more varied diet that incorporated more animal products with high environmental impact indicating that this sample of urban Ugandan women is at the mid-stage of the nutrition transition (Auma et al., 2019). Based on the literature, there is still a need for more balanced and healthy diets to improve food security while mitigating the risk of obesity.
Within the NOURICITY project, there was an objective to improve food security in urban settings by improving the consumption of healthy diets, and Kampala was one of the case studies. Based on a participatory workshop in Kampala for the NOURICITY project, the lack of nutrition knowledge was recognized to be a hampering factor in improving food and nutrition security. Therefore, we examined whether nutrition information material affects consumers' behavior concerning food consumption and dietary outcomes at the household and individual levels in a low-income area. We used a randomized control trial method to test the effects of nutrition information on food security. The nutritional information on healthy food items and diets is presented in two ways (i.e., two treatment groups). The first treatment group received a flier with nutrition information. The second treatment group received the same flier, and in addition, they also received four interactive voice responses (IVRs) with short messages verbalizing the key messages of the flier.
This study is structured as follows. “Section 2” presents the method and the study design. “Section 3” describes the data. In “Section 4”, the results are presented and discussed. “Section 5” describes the conclusion.
2. Methods
2.1. Study area
This study was undertaken in the city of Kampala, which consists of five administrative subcounties, namely, Makindye, Kawempe, Rubaga, Nakawa Division, and Kampala Central. Those subcounties are further subdivided into 76 parishes and 3,213 villages/zones (Uganda Bureau of Statistics, 2017). The selection of the study area followed a two-step sampling procedure using a set of predefined criteria, such as diverse social classes in terms of income, to present different food and nutrition security settings, possibilities of urban agriculture, and accessibility. Within the first step, secondary data from the national population and housing census 2014 (Uganda Bureau of Statistics, 2016) were used to identify eligible parishes. In total, three parishes were identified (Kanyanya, Bwaise II, and Mpererwe), and the parish Kanyanya was purposefully selected through a transect walk activity with key interviews of parish dwellers.
Kanyanya parish is a densely populated parish with approximately 27,000 inhabitants in 2014, is located within the Kawempe division in the northern part of Kampala, and consists of five villages/zones, namely, Kikuubo, Kiyanja, Kitambza, Luutunda, and Wampamba (Uganda Bureau of Statistics, 2016, 2017).
2.2. Intervention design
The study builds on a randomized controlled trial (RCT) with two treatment groups and one control group. In total, two different interventions were designed by the project to enhance healthier diets.
The first component included a flier on healthier diets, which was developed by the project team. The content was arrived through a careful review of key information gathered on knowledge gaps during the baseline survey and focus group discussions with key parish representatives (Fongar et al., 2020). The content was adapted to the target context from the FAO family nutrition guide (2004) and the presidential initiative (2019) (Burgess et al., 2004; Museveni, 2019). The flier holds recommendations on energy-giving foods (calory foods), body-building foods (high-protein food), and body protection foods (healthy vegetables and fruits), as well as recommendations on a healthy daily plate. The flier, as mentioned in Linderhof and Ekesa (2021), mainly uses graphics to display the importance of three key food groups in the Kanyanya community and visual examples of a healthy plate and food items. Graphics and visuals were used because respondents might be illiterate. The flier was presented in English, and when offered, an explanation in Luganda was provided.
The second component included instant voice recordings (IVRs) and text messages containing information on healthy diets and purposeful nutrition, as indicated by the exact messages in Fongar et al. (2022). Development of the messages was carried out in collaboration with VIAMO, a private sector company with extended experience in digitalization. The content of the respective nutrition-related information was derived from the flier and further edited, translated into Luganda, and converted into a text message and audio recording. Both the finalized text messages and audio recordings were pretested with ~10 colleagues from the Alliance of Bioversity International and CIAT and after adjustments, and the roll-out to the community was initiated in November 2021 (for a timeline refer to Figure 2). In total, the participants received six messages and five calls. Overall, two initial messages/calls including an introduction to the IVR approach and the text message procedure and four content-based calls and messages sent out weekly.
2.3. Key indicators
The interest of the study is to measure the impact of the different interventions on healthy food consumption. In total, three different indicators were used to define the impact of the interventions on healthier diets. Household economic access to dietary energy was measured using the Household Dietary Diversity Score derived from a 7-day food consumption recall (Swindale and Bilinsky, 2006). The list-based recall covered 130 food times, which were adapted to the local context during the pretesting period. Usually, the HDDS is based on a 24-h recall (Kennedy et al., 2011), while several other studies derived the score from a 7-day recall (Carletto et al., 2013; Fongar et al., 2019; Wanyama et al., 2019a,b; Mekonnen et al., 2020). HDDS describes the number of food groups consumed by the household over a given period of time and is constructed out of 12 predefined food groups according to the guidelines of Kennedy et al. (2011). The food groups include (i) cereal, (ii) white roots and tubers and plantain, (iii) vegetables, (iv) fruits, (v) meat, (vi) eggs, (vii) fish and seafood, (viii) legumes, (ix) nuts and seeds, (x) milk and milk products, (xi) oil and fats, and (xii) sweets and condiments. To verify the variety of food consumed, the food variety score (FVS) was created. The FVS refers to the number of dietary items consumed during a given reference period, displaying as the number of discrete food items (Hatløy et al., 2000; Ruel, 2003; Savy et al., 2005; Ruel et al., 2013).
We acknowledge the fact that 7-day recall surveys tend to underestimate consumption of infrequently consumed items but overestimate values conditional on positive consumption (Zezza et al., 2017). Thus, in addition, we added another dietary diversity indicator at the individual with a 24-h food group-based recall administered to female household members following a standard protocol of questions. The food group diversity indicator minimum dietary diversity for women (MDD-W) was calculated as a proxy for micronutrient adequacy and dietary quality of women of reproductive age (WRA 15–49 years) (Martin-Prével et al., 2015; FAO and FHI, 2016; FAO, 2021). The score is based on a ten-food group count including grains, white roots and tubes and plantain, pulses, nuts, and seeds, dairy, meat, poultry and fish, eggs, dark green leafy vegetables, and other vitamin A-rich fruits and vegetables and other vegetables and other fruits.
Furthermore, to accompany the food groups explained within the flier, HDDS food groups were allocated to the three named food groups. Thus, the energy-giving foods comprised the food group cereal, white roots, and tubers. The body protection food included the food groups such as vegetables and fruits, while the bodybuilding foods contained the food groups such as meat, eggs, fish and seafood, legumes, nuts and seeds, and dairy (Table A2). With the difference-in-difference method, mean comparisons are used to display the differences between the two time periods and the three groups.
3. Data
3.1. Sampling strategy
The sample size calculation was based on power calculations with the Household Dietary Diversity Score (HDDS) as the key indicator. The calculation used a two-sample t-test using an HDDS of 9.15 (SD 1.999). The result indicated a sample size of 440, and considering an attrition rate of 3%, 450 households were targeted and distributed equally over the five villages/zones, e.g., 90 participating households each. The selection of the household was based on a random walk involving a field assistant and each village/zone leader of Kanyanya Parish. During the walk, the name and mobile phone numbers of the selected households were captured to be able to inform the household of the interview day, place, and time.
After the baseline survey and pre-intervention (September 2021), the households were revisited by the field assistant to verify their mobile phone number, consent, and living location. In total, 45 participants had either shifted away from the target parish or had passed away. Hence, the new sample size was 405 for the endline data collection.
Thus, the randomization strategy was based on the 405 participating households, which were randomly assigned into three groups: (1) a group of participants receiving only the flier; (2) a group receiving the flier and the IVR calls/text messages; and (3) a group acting as a control group not receiving the flier or the IVR calls. Randomization was done using Excel and was based on the proportions of participating households per village. The distribution is displayed in Table 1. During the period of intervention, respondents in the control group might have been in contact with the respondents in one of the treatment groups. However, the period between the intervention and the endline survey (December) was rather short, which makes it unlikely that control group respondents met with other respondents. To apply the ethical procedures, the control group also received the flier after the data collection was finalized. The flier was distributed by hand to each selected household and later to the control group.
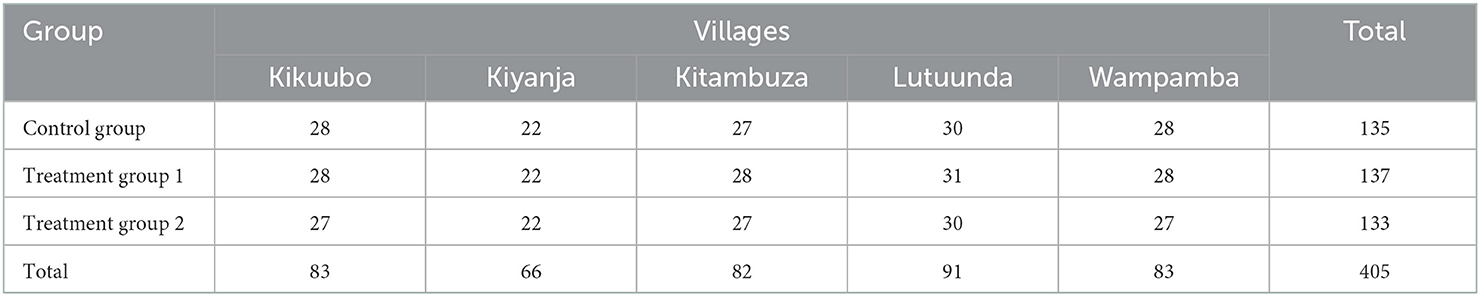
Table 1. Distribution of households in the intervention according to five villages/zones of Kanyanya.
The same set of households was targeted during the endline data collection. Due to high fluctuations and movement within the different parishes of Kampala, a total of 373 households were re-interviewed. The average attrition rate between baseline and the endline survey was 17%, and considering the verified sample pre-intervention, we have an attrition rate of 8% with some variations across treatment groups (in the Appendix). Figure 1 displays the design and timeline of the study.
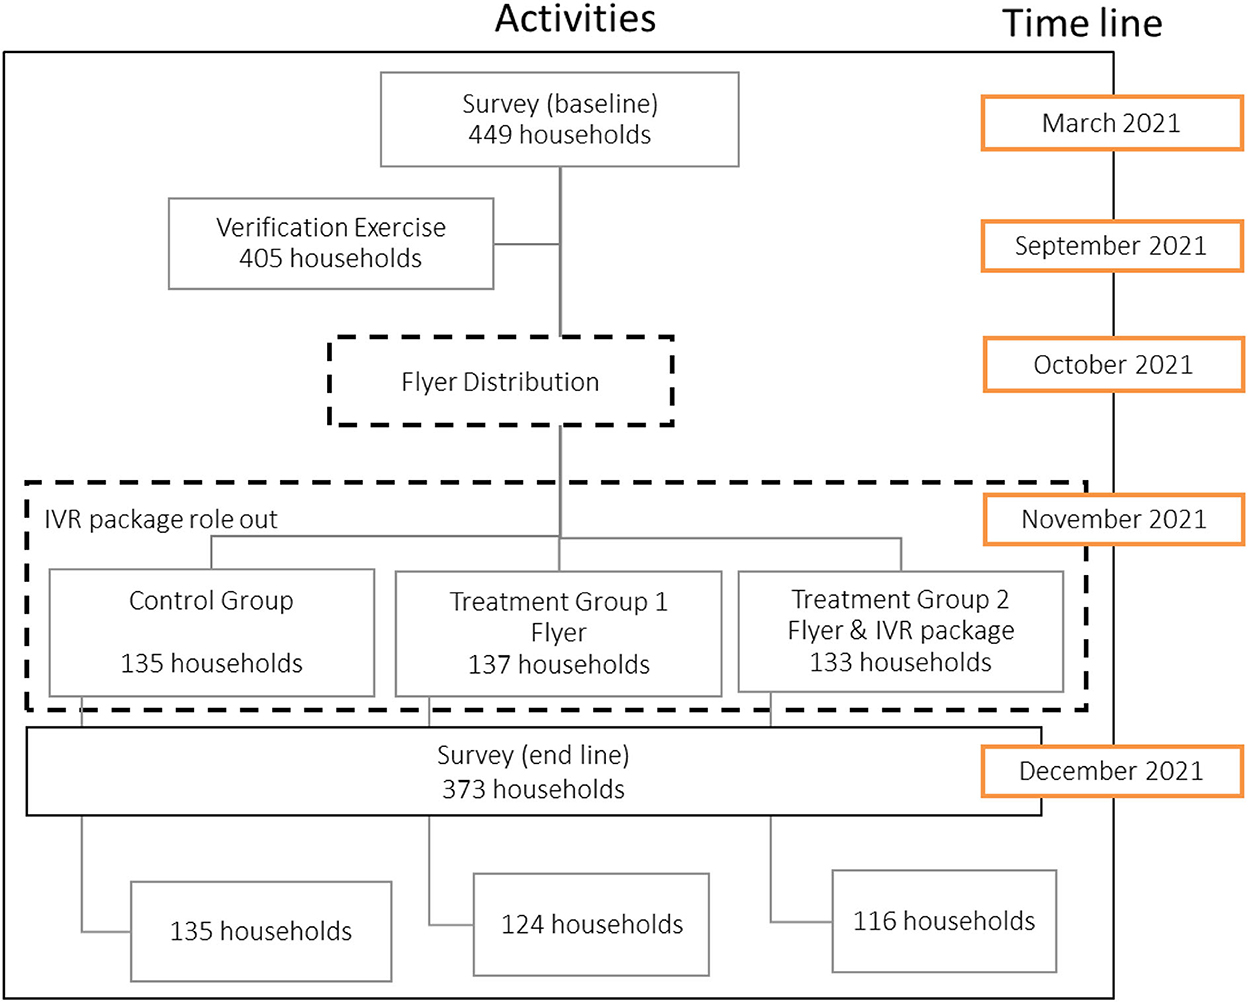
Figure 1. Study design and timeline.
3.2. Data collection
To assess the intervention's impact, two rounds of survey data were collected in 2021 (April and December) within the project. The baseline data collection was administered under COVID-19 pandemic regulations and therefore took place in an aerate venue (common meeting) within each village/zones of the parish, where standard operational practices (SOPs) were followed (provision of hand washing facilities, face masked and ventilation). Each participating household was invited at a particular day and time to the venue to be interviewed. Similarly, due to the consistency of the survey and to ensure compliance with COVID-19 SOP, participants were invited for the endline survey to an aerated venue again. Endline data collection took place in December in a month of plenty, 8 months after the baseline collection and straight after the finalization of the interventions. The same households from the baseline were targeted.
Data in both survey rounds were collected through tablet-based face-to-face interviews in the local language by a team of six enumerators, which remained the same for both surveys except for one change. Before each survey, the team received an intensive 2-day training on the tool, including pretesting with six local representatives. The survey collected data on household sociodemographic characteristics, income and assets, and dietary patterns at household and individual levels. To maintain comparability, the endline survey precisely assessed most information as in the baseline.
Ethical clearance was granted by the institutional review board at Makerere University College of Health Sciences (REC Number: #SHSREC REF NO: 2019-048). In addition, written and verbal consent was asked.
The data were analyzed using the statistical software package R. First, the indicators were calculated for the April survey as well as the December survey. Then, the indicators (either mean or their distribution) for both surveys were then compared and tested for statistically significant differences. Whenever applicable, the descriptive statistics were calculated at the village level. For the intervention, the descriptive statistics were calculated for the treatment groups without recognizing the possible differences among the villages. With the difference-in-difference approach, the impact of the intervention on dietary diversity was tested.
4. Results
4.1. Household characteristics
Table 2 shows the descriptive statistics of basic household characteristics and key nutrition outcomes variables at baseline and endline in March and December 2021. We found a statistically significant difference at the household level for a few variables, such as gender and age of household heads, which can be explained through the fluctuation within urban households and during the given time under the pandemic. On average, household heads were men, their age was approximately 43 years, and over 40% were self-employed. Any type of urban agricultural activity significantly increased by around 30%. Access to mobile phones of the respondent on the other hand differed significantly between the two data collections, showing a 10% decrease in access. However, mobile phone access at the household level was checked in the baseline for inclusion in the survey.
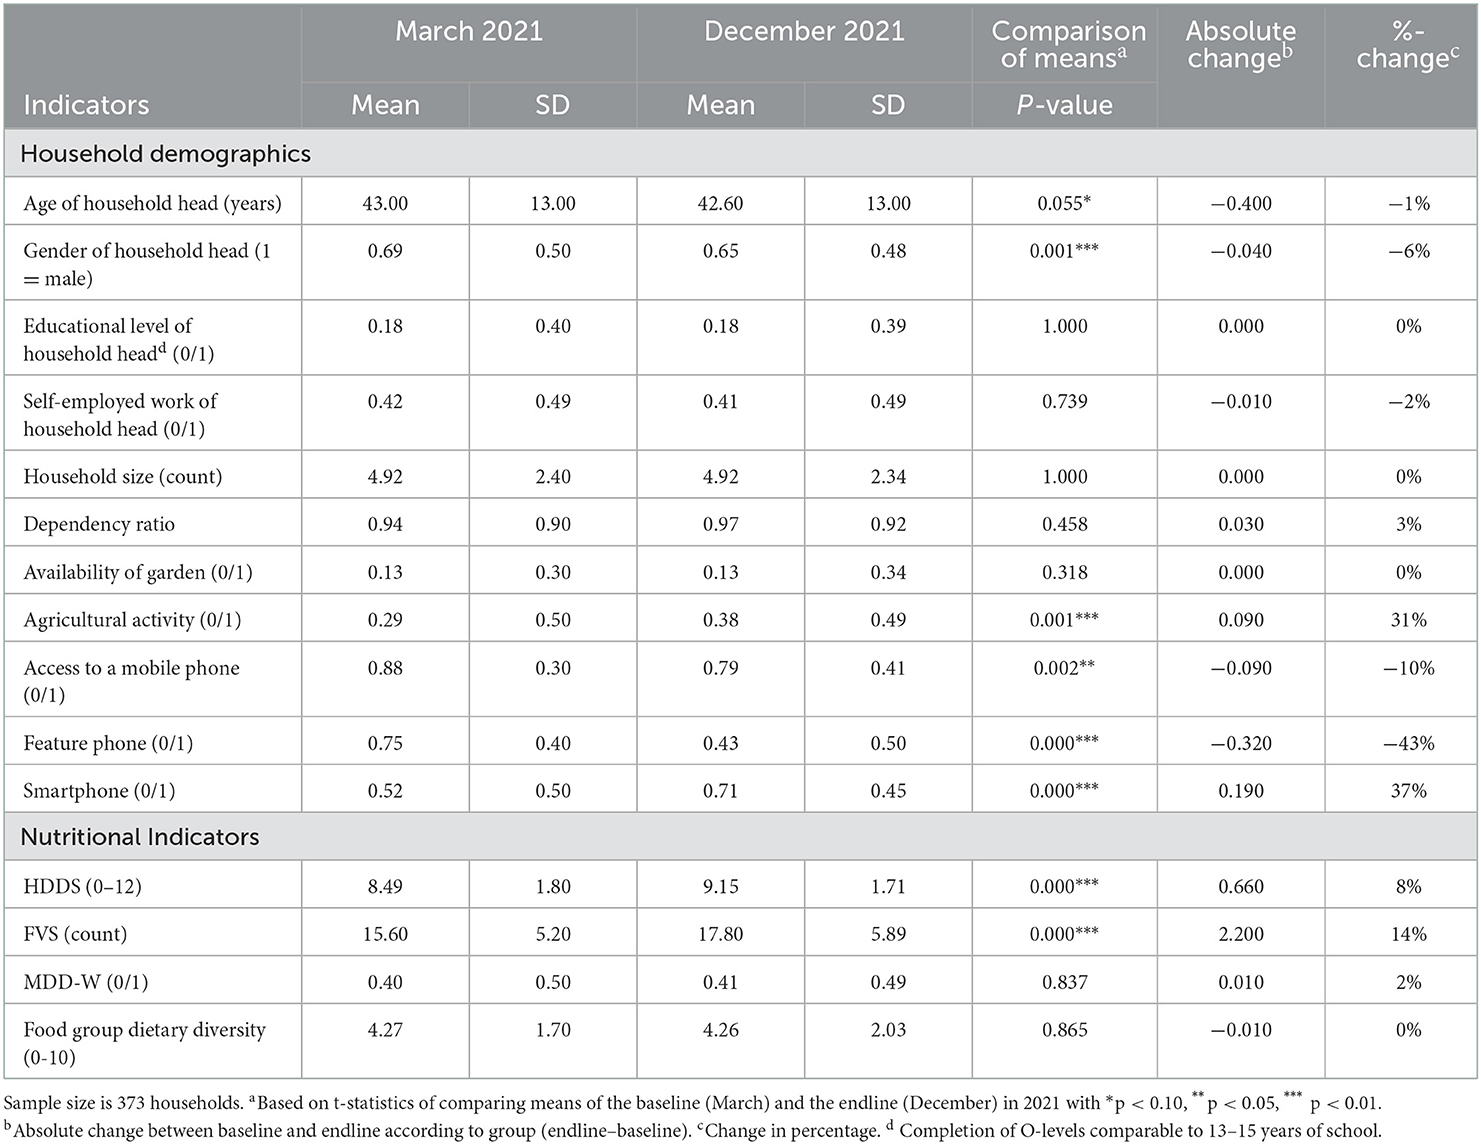
Table 2. Socioeconomic data in the March and December survey.
Household-level dietary intake was measured using the HDDS. The average HDDS at the endline was 9.2, indicating that households consumed more than nine food groups over the past 7-day recall period, which statistically differed from the baseline average score of 8.5. The count of food items, displaying food variety, also significantly differed between March and December. Usually, Uganda has two rainy seasons, the wettest from March to May and the other between September and December, indicating similar planting conditions, and thus similar supply of food crops. In March 2021, COVID-19 pandemic regulation still influenced consumption, which lasted until September and December generally is the month of plenty food items available.
Figure 2 displays the consumption of each of the twelve HDDS food groups for the total sample at both data points. Over 90% of households consumed the food groups, namely, cereal, white roots and tubers, vegetables, legumes, nuts and seeds, and sweets and condiments. A statistically significant difference between March and December can be seen in the consumption of the food groups, namely, cereals, vegetables, fruits, eggs fish and seafood, milk and milk products, as well as sweets and condiments.
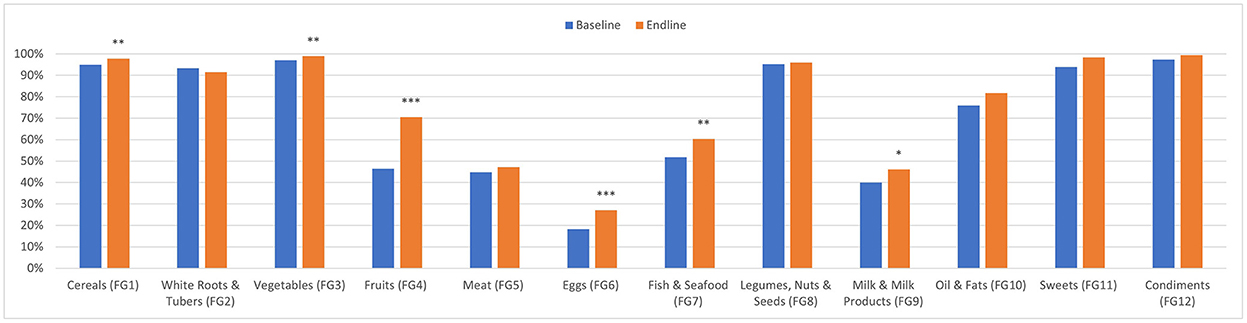
Figure 2. Distribution of food group consumption in the March (baseline) and December (endline) survey in 2021. *p < 0.10, **p < 0.05, ***p < 0.01.
4.2. Changes in treatment and control groups over time
Table 3 indicates the changes in mean comparison of the key nutrition outcome variables over time by both the treatment and control groups (comparisons of all variables can be seen within Table A3). Statistically significant differences can be seen for the household-level consumption indicators such as HDDS and FVS with an increase from baseline to endline for all three groups. The increase is slightly larger for the two treatment groups (with an average HDDS value of 9.2 and 9.3 for treatment groups 1 and 2, respectively) compared to the control group (average HDDS value of 8.6). For the food variety score (FVS), the same observations hold. In contrary, no statistically significant changes are found when comparing the three flier food groups of energy-giving foods, body protection, and body-building foods (Table 3).
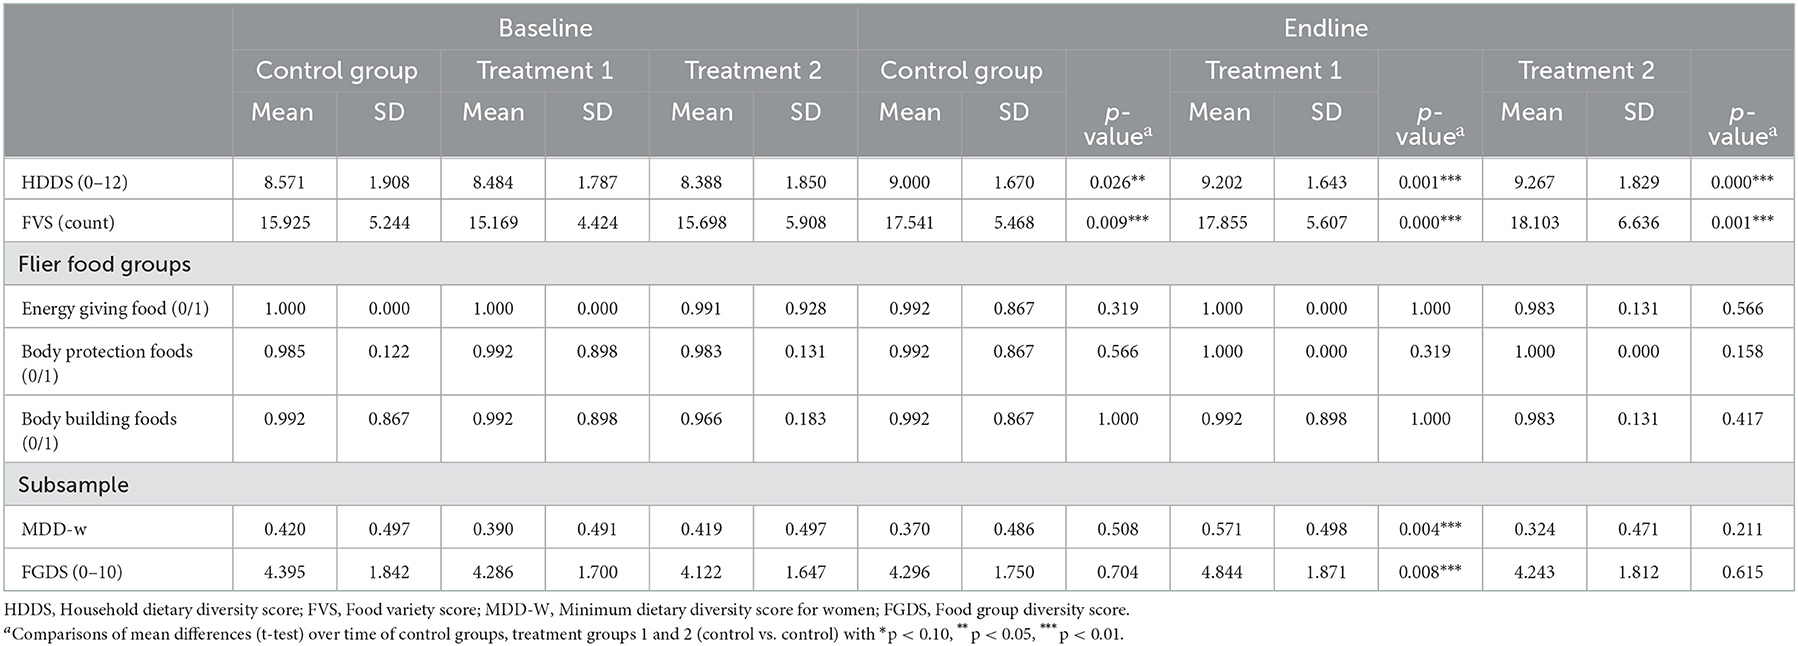
Table 3. Nutritional indicators in the March (baseline) and December (endline) survey by treatment and control groups.
Looking into the subsample of women, statistically significant differences are seen in treatment group 1, where MDD-W and the food group diversity score of women increased by 43 and 14% compared to the MDD-W in the March survey.
4.3. Impact of the different nutritional education interventions on dietary intake
No statistically significant difference could be found when comparing the household-level nutritional indicators by the control group to both treatment groups (Table 4). Neither when looking into the introduced food groups by the flier. Consumption is almost similar in each group, as those include basic food items on a daily plate.
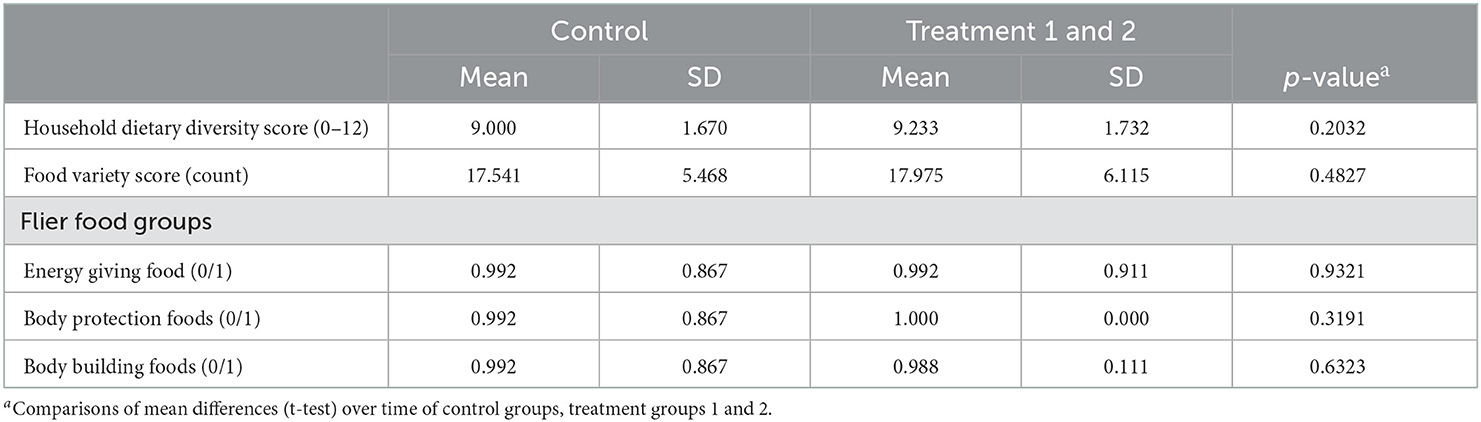
Table 4. Descriptive statistics of nutritional indicators comparing control and treatment groups in December survey (post intervention).
Thus, we want to look more specifically into the two different treatment groups and whether the different types of information had a difference. Table 5 depicts the results of the difference-in-difference method comparing the control group to the treatment 1 group (only flier) and the treatment 1 group to the treatment 2 group (flier and IVR messages). No statistically significant differences are found for the different household-level indicators, while statistically significant differences are seen at the individual level, contrary to the assumption. We can see an increase in MDD-W and food group diversity for women compared to the control group to the treatment group 1 group, while a comparison of treatment groups displays a decrease in treatment group 2.
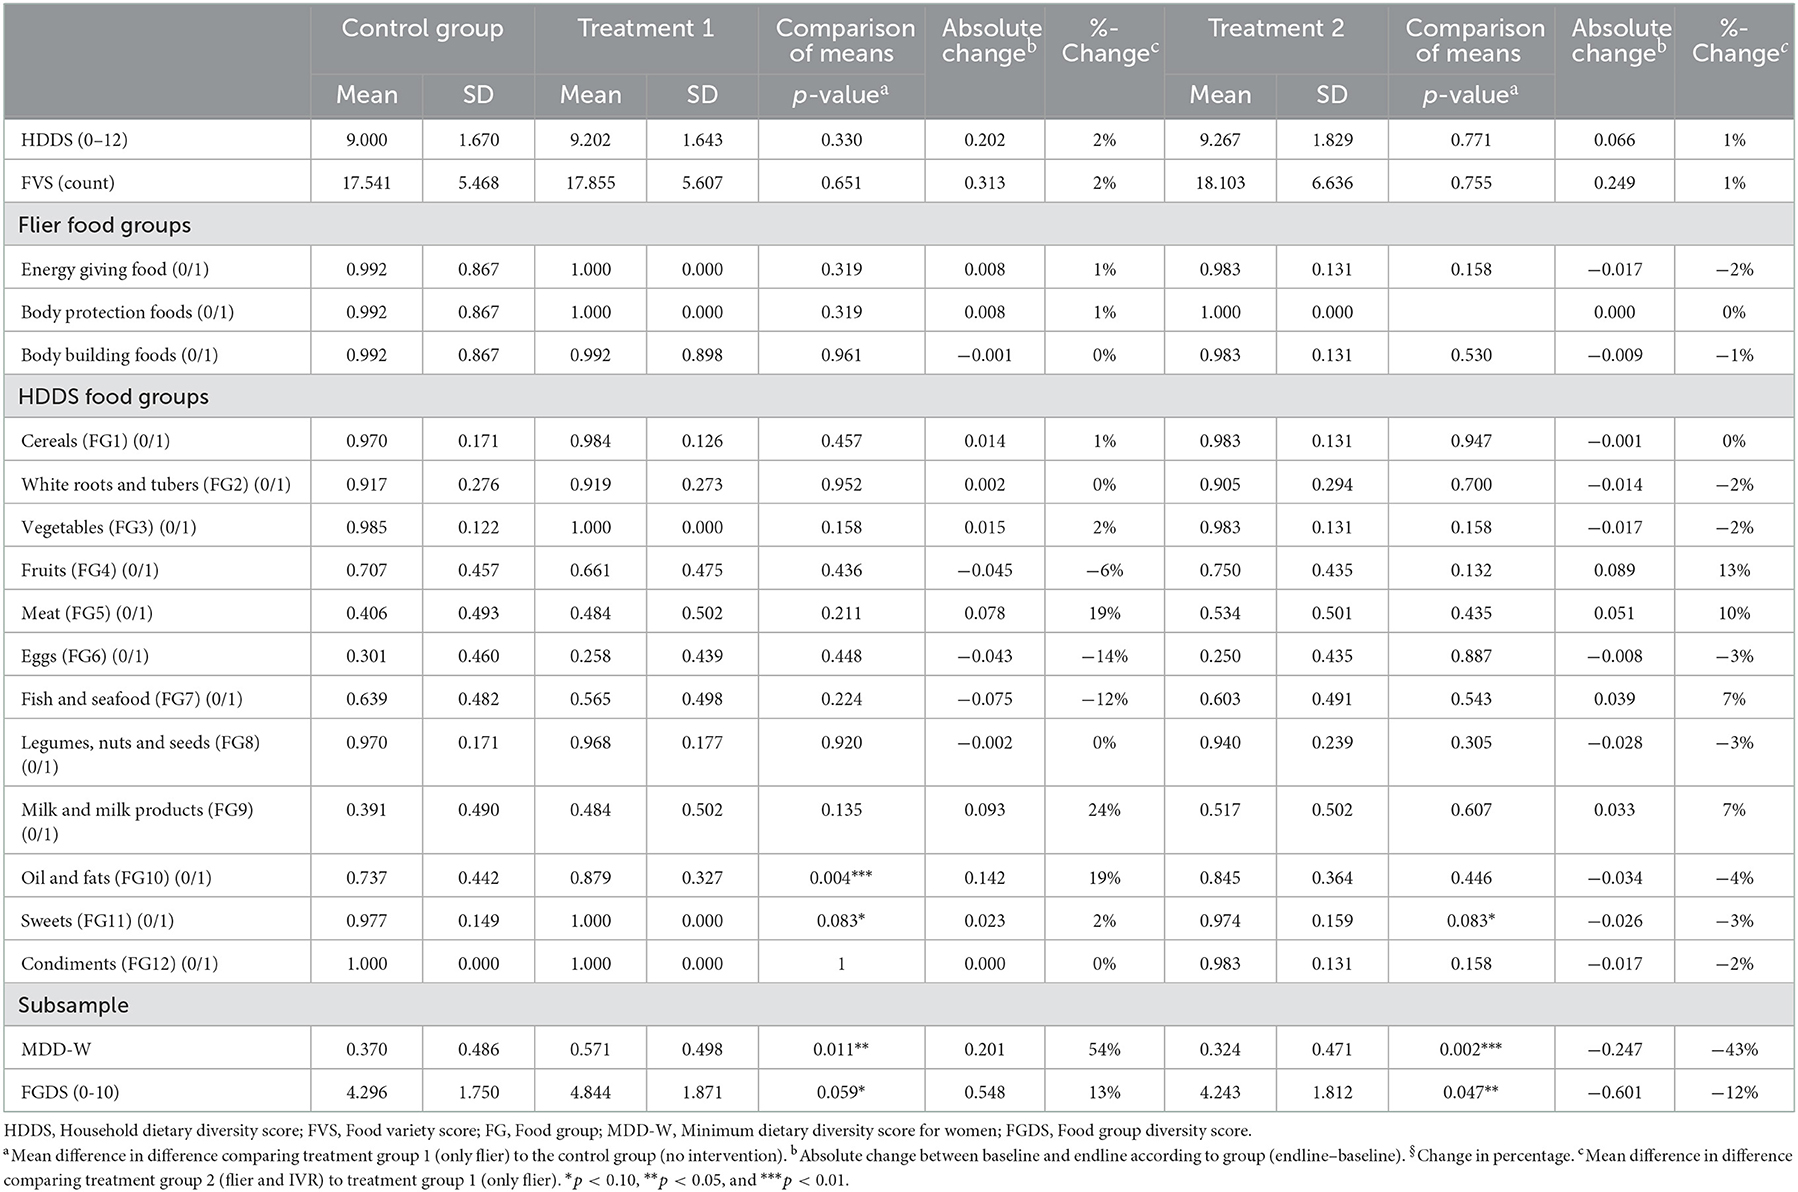
Table 5. Descriptives statistics of nutritional indicators by treatment groups in December 2021 (post intervention).
4.4. Experiences with IVR messages
The respondents that received IVR messages during the intervention were asked to answer a number of questions on their experience with IVR messaging on healthy foods. Of the 116 households within treatment group 2, 90% picked up the phone for any of the four messages. More specifically, 89% of the IVR treatment group started listening to message 1, i.e., message in the first week after receiving the flier, and 91% listened to more than two-third of the length of the message. Message 2 was started by 92%, while 93% listen to most of the message. Message 3 was listened to the most with 97% each and the message 2 was started by 94% (see also Table A4). Additionally, we asked the IVR respondents how the messages were perceived. Almost all mentioned that the messages were easy to follow, while almost 80% indicated sharing the information with their neighbors and 92% enjoyed receiving the message. If the messages were sufficient, 37% said yes, while 17% mentioned that the messages were not enough and 46% indicated the messages were too many (refer to also Table A5).
5. Discussion and conclusions
Within this study, dietary outcomes were assessed at two different levels (household level and individual level) to measure food security and dietary quality.
Household Dietary Diversity Score values are comparable to other studies of Uganda and within the same geographical area. Mean comparisons of urban HDDS from different LSMS waves (2010, 2012, 2014, and 2016) showed similar ranges, from 8.25 in 2010 to 8.39 in 2016, the most recent LSMS data set (Linderhof et al., 2022). More specifically, the review investigated the rural–urban comparison of the central region, which is located in Kampala. HDDS values were highest in 2014 with a score of 9.16 and of 8.61 in 2016 (Linderhof et al., 2022). Wanyama et al. (2019a) found HDDS of 8.8 in Kampala and 10.4 in Nairobi in the period 2016–2017 (Wanyama et al., 2019a,b). Similarly, a study from Addis Ababa, Ethiopia reports HDDS of 8.5 and 7.9 for urban Ethiopia (Mekonnen et al., 2020; Melesse and Van den Berg, 2021). While data from a study in 2019 from different parishes in Kampala display a smaller HDDS of 5.7, although based on a 24-h dietary recall (Hemerijckx et al., 2022). FVS is not often measured. Data from rural Kenya in 2015 display slightly larger numbers of food items (22.5), while FVS based on 24-h dietary recall in Tanzania indicates the consumption of 8.2 food items (Keding et al., 2012; Fongar et al., 2019). Most studies in the literature are presenting food security indicators within a cross-sectional context and not over time. Moreover, there are hardly studies that measured or estimated the impacts of interventions for improving food security at the local level.
Individual dietary outcomes were assessed for a subsample of households interviewing women of reproductive age to create the MDD-W. Around 40% of women at both periods reached MDD-W and consumed at least five of the10 predefined food groups. On average, women within the sample consumed 4.3 food groups, which is comparable to the results from Kampala and Nairobi, where women consumed 4.2 and 4.7 food groups in 2016–2017 (Wanyama et al., 2019a,b). Similarly, 40% of women in Nairobi reached MDD-W with 14% more in Kampala (Wanyama et al., 2019a,b).
As dietary consumption is increasing, food systems are changing, availability and affordability of healthy diets are sometimes difficult, and nutritional knowledge can be an important factor. Currently, nutritional knowledge was one hampering factor identified in improving food and nutrition security. Within this study, we examined whether nutritional information material delivered in different formats influences food consumption and dietary outcomes within low-income, urban households in Kampala, Uganda. Evidence from urban and peri-urban Mozambique showed positive and statistically significant effects of text reminders for control visits to a clinical and reported receiving a contraceptive choice. This effect was shown particularly for younger women (Leight et al., 2022). Those results demonstrate the potential of mobile reminders to encourage uptake. Nevertheless, approaches to delivering generalized nutrition information and dietary recommendations for the whole family are scarce. Up to now, messages and information are targeted on specific outcomes, tailored to the target population's needs, such as one MNCH practice (care service, child immunization, or exclusive breastfeeding or pregnant women and women in a postnatal period (Feroz et al., 2017; Mildon and Sellen, 2019). The evidence presented in our study indicates that the nutritional knowledge information presented in the flier and audio messages had an impact on dietary diversity with an increased score. However, the impact is not statistically significant, which could be attributed to the high availability of food items or spillover effects as the village and households are situated very close to each other. However, due to the short time between the intervention and the endline survey in December, there are no spillover effects expected. The results also displayed no significant difference between the delivery of a flier and additional audio messages.
Although through additional evidence gathered, we know that the format and the content of the messages were perceived as useful, sufficient, and easy to follow, some of the respondents also indicated to have shared the content with their neighbors or others living in the village. However, not every respondent within treatment group 2 listened to IVR messages. According to the endline information, 82 respondents in the treatment group 2 listened to at least one message and had access to a mobile phone at the endline survey, while 20 respondents indicated not having access to a mobile phone but listening to the messages anyhow (using a mobile phone device of a household member), and 10 respondents had a phone but did not pick up any of the messages.
We acknowledge limitations of the current study. Household dietary consumption could be overestimated due to the 7-day recall period, which leads to an overestimation of the HDDS (De Haen et al., 2011; Zezza et al., 2017). Although both periods in the time display a month within the rainy season, December is usually attributed to be the month with plenty of rainfall, also being the holiday time of the year. Additionally, the data collection in March 2021 (baseline) was conducted under COVID-19 pandemic restrictions, while in December 2021 (end line), the economy was reopened. Although the time period of the impact of the intervention researched was expected to be short, the time period after the intervention was implemented, and before the endline, data collected were quite tight due to the timeline of the project. Usually, the change of behavior and food choice motivation takes time, although there is no clear evidence of how long the intervention either flier or flier and IVR messages will be recalled by the respondents. This could be tested in the follow-up experiments.
Nevertheless, the approach and the intervention were mentioned to be interesting for the community, and many households indicated that they would like to receive more messages on healthy nutrition. Further research should use the approach to refine it to optimize the impact of an intervention with a longer implementation time and assessment periods.
Data availability statement
The raw data supporting the conclusions of this article will be made available by the authors, without undue reservation.
Author contributions
VL, AF, YD, and BE designed the problem. MN and AF collected data under the supervision of BE, VL, and YD. AF and VL explored and analyzed the data. YD and BE reviewed the manuscript. All authors contributed to the article and approved the submitted version.
Funding
This research was carried out as part of the Knowledge Base program Food Security and Valuing Water of Wageningen University and Research, and it was subsidized by the Dutch Ministry of Agriculture, Nature and Food Quality.
Conflict of interest
The authors declare that the research was conducted in the absence of any commercial or financial relationships that could be construed as a potential conflict of interest.
Publisher's note
All claims expressed in this article are solely those of the authors and do not necessarily represent those of their affiliated organizations, or those of the publisher, the editors and the reviewers. Any product that may be evaluated in this article, or claim that may be made by its manufacturer, is not guaranteed or endorsed by the publisher.
Supplementary material
The Supplementary Material for this article can be found online at: https://www.frontiersin.org/articles/10.3389/fsufs.2022.1063331/full#supplementary-material
References
Ambikapathi, R., Passarelli, S., Madzorera, I., Canavan, C. R., Noor, R. A., Abdelmenan, S., et al. (2020). “Men's nutrition knowledge is important for women's and children's nutrition in Ethiopia.” Mat. Child Nutr. 17: e13062. doi: 10.1111/mcn.13062
Auma, C. I., Pradeilles, R., Blake, M. K., and Holdsworth, M. (2019). “What can dietary patterns tell us about the nutrition transition and environmental sustainability of diets in Uganda?” Nutrients 11, 342. doi: 10.3390/nu11020342
Burgess A. Glasauer P. Food Agriculture Organization of the United Nations. (2004). Family Nutrition Guide. Rome: Food and Agriculture Organization of the United Nations.
Carletto, C., Zezza, A., and Banerjee, R. (2013). Towards better measurement of household food security: harmonizing indicators and the role of household surveys. Global Food Security 2, 30–40. doi: 10.1016/j.gfs.2012.11.006
Contento, I. R. (2008). Nutrition education: linking research, theory, and practice. Asia Pacific J. Clin. Nutr. 17, 176–179.
De Haen, H., Klasen, S., and Qaim, M. (2011). What do we really know? metrics for food insecurity and undernutrition. Food Policy 36, 760–769. doi: 10.1016/j.foodpol.2011.08.003
Debela, B. L., Demmler, K. M., Rischke, R., and Qaim, M. (2017). Maternal nutrition knowledge and child nutritional outcomes in urban Kenya. Appetite 116, 518–526. doi: 10.1016/j.appet.2017.05.042
Development Initiatives (2021). 2021 Global Nutrition Report: The State of Global Nutrition. Bristol, UK: Development Initiatives. Available online at: https://globalnutritionreport.org/reports/2021-global-nutrition-report/ (accessed August 09, 2022).
FAO FHI (2016). Minimum Dietary Diversity for Women (MDD-W): A Guide for Measurement. Rome: Food and Agriculture Organization of the United Nations. Available online at: http://www.fantaproject.org/monitoring-and-evaluation/minimum-dietary-diversity-women-indicator-mddw (accessed October 30, 2016).
FAO IFAD, UNICEF, WFP, WHO. (2022). The State of Food Security and Nutrition in the World: 2022 : Repurposing Food and Agricultural Policies to Make Healthy Diets More Affordable. Rome: FAO; IFAD; UNICEF; WFP; WHO. Available online at: https://www.fao.org/documents/card/en/c/cc0639en (accessed July 14, 2022).
FAO. (2021). Minimum Dietary Diversity for Women: An Updated Guide to Measurement – from Collection to Action. Rome, Italy: FAO. Available online at: http://www.fao.org/documents/card/en/c/cb3434en (accessed February 09, 2022).
Feroz, A., Perveen, S., and Aftab, W. (2017). Role of mhealth applications for improving antenatal and postnatal care in low and middle income countries: a systematic review. BMC Health Serv. Res. 17, 704. doi: 10.1186/s12913-017-2664-7
Fongar, A., Ekesa, B., Dijkxhoorn, Y., and Linderhof, V. (2022). NOURICITY: End of Project Report 2019–2022. Wageningen: Wageningen Economic Research.
Fongar, A., Ekesa, B., Dijkxhoorn, Y., and Linderhof, V. (2020). NOURICITY - Technical Report on Qualitative Data Collection (Focus Group Discussions). Report. https://cgspace.cgiar.org/handle/10568/110491 (accessed May 27, 2022).
Fongar, A., Gödecke, T., Aseta, A., and Qaim, M. (2019). “How well do different dietary and nutrition assessment tools match? Insights from Rural Kenya. Pub. Health Nutr. 22, 391–403. doi: 10.1017/S1368980018002756
Hatløy, A., Hallund, J., Diarra, M. M., and Oshaug, A. (2000). Food variety, socioeconomic status and nutritional status in urban and rural areas in koutiala (Mali). Publ. Health Nutr. 3, 57–65. doi: 10.1017/S1368980000000628
Hemerijckx, L. M., Janusz, K., Van Emelen, S., Tumwesigye, S., Davis, J., Lwasa, S., et al. (2022). Food accessibility of different socioeconomic groups in sub-saharan african cities: a mixed-method analysis in kampala, Uganda. Food Secur. 14, 677–694. doi: 10.1007/s12571-021-01248-7
Keding, G. B., Msuya, J. M., Maass, B. L., and Krawinkel, M. B. (2012). Relating dietary diversity and food variety scores to vegetable production and socio-economic status of women in rural Tanzania. Food Secur. 4, 129–140. doi: 10.1007/s12571-011-0163-y
Kennedy, G., Ballard, T., and Dop, M. C. (2011). Guidelines for Measuring Household and Individual Dietary Diversity. Rome, Italy: Food and Agriculture Organization of the United Nations.
Leight, J., Hensly, C., Chissano, M., Safran, E., Ali, L., Dustan, D., et al. (2022). The effects of text reminders on the use of family planning services: evidence from a randomised controlled trial in urban Mozambique. BMJ Global Health 7. e007862. doi: 10.1136/bmjgh-2021-007862
Linderhof, V., and Ekesa, B. (2021). Healthy Diets Kanyanya. Wageningen Economic Research and the Alliance of Bioversity International and CIAT. Avaialable online at: https://edepot.wur.nl/563788 (accessed October 06, 2022).
Linderhof, V., Janssen, V., Motovska, N., Hidayah, I., and Fongar, A. (2022). How Did Diets in Urban Uganda Develop over Time? An Analysis of Rural and Urban Food Security. Wageningen: Wageningen Economic Research.
Martin-Prével, Y., Allemand, P., Wiesmann, D., Arimond, M., Ballard, T., Deitchler, M., et al. (2015). Moving Forward on Choosing a Standard Operational Indicator of Women's Dietary Diversity. Edited by FAO I4942, 226. Available online at: https://cgspace.cgiar.org/handle/10568/72450 (accessed October 31, 2022).
Mekonnen, D. A., Talsma, E. F., Trijsburg, L., Linderhof, V., Achterbosch, T., Nijhuis, A., et al. (2020). Can household dietary diversity inform about nutrient adequacy? lessons from a food systems analysis in Ethiopia. Food Secur. 12, 1367–1383. doi: 10.1007/s12571-020-01056-5
Melesse, M. B., and Van den Berg, M. (2021). Consumer nutrition knowledge and dietary behavior in urban Ethiopia: a comprehensive study. Ecol. Food Nutr. 60, 244–256. doi: 10.1080/03670244.2020.1835655
Mildon, A., and Sellen, D. (2019). Use of mobile phones for behavior change communication to improve maternal, newborn and child health: a scoping review. J. Global Health 9, 020425. doi: 10.7189/jogh.09.020425
Museveni, Y. K. (2019). Presidential Initiative On Healthy Eating and Healthy Lifestyle | Ministry of Health Knowledge Management Portal. Kampala: Yoweri K. Museveni President of the Republic of Uganda. Available online at: http://library.health.go.ug/publications/food-and-nutrition/presidential-initiative-healthy-eating-healthy-lifestyle.
Nabugoomu, J., Namutebi, A., Kaaya, A. N., and Nasinyama, G. (2015). Nutrition education influences child feeding knowledge attitudes and practices of caregivers in Uganda. Am. J. Health Res. 3, 82. doi: 10.11648/j.ajhr.20150302.15
Popkin, B. M. (2003). The nutrition transition in the developing world. Dev. Policy Rev. 21, 581–597. doi: 10.1111/j.1467-8659.2003.00225.x
Popkin, B. M., Adair, L. S., and Ng, S. W. (2012). Global nutrition transition and the pandemic of obesity in developing countries. Nutr. Rev. 70, 3–21. doi: 10.1111/j.1753-4887.2011.00456.x
Raaijmakers, I., Snoek, H., Maziya-Dixon, B., and Achterbosch, T. (2018). Drivers of vegetable consumption in urban nigeria: food choice motives, knowledge, and self-efficacy. Sustainability 10, 4771. doi: 10.3390/su10124771
Raaijmakers, I., Van den Puttelaar, J., Linderhof, V., Janssen, V., Odhiambo, F., Melse-Boonstra, A., et al. (2019). “The ENRICH Bot, a Smartphone Application Measuring Fruit and Vegetable Intake and Food Choice Motives; Development and Validation for the Case of Urban Kenyan Consumers.” Report 2019-076C. Wageningen: Wageningen Economic Research.
Ruel, M. T. (2003). Is dietary diversity an indicator of food security or dietary quality? A Review of Measurement Issues and Research Needs - FCND Discussion Papers No.140. Food Nutr. Bull 24, 231–232. doi: 10.1177/156482650302400217
Ruel M. T. Alderman H. Maternal Child Nutrition Study Group. (2013). Nutrition-sensitive interventions and programmes: how can they help to accelerate progress in improving maternal and child nutrition? Lancet 382, 536–551. doi: 10.1016/S0140-6736(13)60843-0
Sahn, D. E., and Stifel, D. C. (2003). Urban–rural inequality in living standards in Africa. J. Afr. Econ. 12, 564–597. doi: 10.1093/jae/12.4.564
Savy, M., Martin-Prével, Y., Sawadogo, P., Kameli, Y., and Delpeuch, F. (2005). Use of variety/diversity scores for diet quality measurement: relation with nutritional status of women in a rural area in burkina Faso. Eur. J. Clin. Nutr. 59, 703–716. doi: 10.1038/sj.ejcn.1602135
Swindale, A., and Bilinsky, P. (2006). Development of a universally applicable household food insecurity measurement tool: process, current status, and outstanding issues. J. Nutr. 136, 1449S−1452S. doi: 10.1093/jn/136.5.1449S
Tschirley, D., Reardon, T., Dolislager, M., and Snyder, J. (2015). The rise of a middle class in east and southern africa: implications for food system transformation. J. Int. Dev. 27, 628–646. doi: 10.1002/jid.3107
Uganda Bureau of Statistics (2016). The National Population and Housing Census 2014 – Main Report. Kampala, Uganda: UBOS. https://www.ubos.org/onlinefiles/uploads/ubos/2014CensusProfiles/KAMPALA-KCCA.pdf.
Uganda Bureau of Statistics (2017). Uganda Bureau of Statistics 2017, The National Population and Housing Census 2014 – Area Specific Profile Series, Kampala, Uganda. Kampala: Uganda Bureau of Statistics (UBOS).
United Nations Department of Economic, and Social Affairs, Population Division. (2019). World Urbanization Prospects 2018: Highlights. Vol. (ST/ESA/SER.A/421). New York, NY, USA.
Wanyama, R., Gödecke, T., Chege, C. G., and Qaim, M. (2019a). How important are supermarkets for the diets of the urban poor in Africa? Food Secur. 11, 1339–1353. doi: 10.1007/s12571-019-00974-3
Wanyama, R., Gödecke, T., and Qaim, M. (2019b). Food security and dietary quality in african slums. Sustainability 11, 5999. doi: 10.3390/su11215999
World Health Organization UN-Habitat. (2016). Global Report on Urban Health: Equitable Healthier Cities for Sustainable Development. Geneva: World Health Organization. Available online at: https://apps.who.int/iris/handle/10665/204715.
Zezza, A., Carletto, C., Fiedler, J. L., Gennari, P., and Jolliffe, D. (2017). Food counts. measuring food consumption and expenditures in household consumption and expenditure surveys (HCES). introduction to the special issue. Food Policy Food Counts 72, 1–6. doi: 10.1016/j.foodpol.2017.08.007
Keywords: nutritional education methods, interactive voice response (IVR), food security, urban Uganda, household dietary diversity score
Citation: Fongar A, Linderhof V, Ekesa B, Dijkxhoorn Y and Nalweyiso MD (2023) Impact of healthy food and diet information on household food security: A randomized control trial in Kampala, Uganda. Front. Sustain. Food Syst. 6:1063331. doi: 10.3389/fsufs.2022.1063331
Received: 06 October 2022; Accepted: 30 November 2022;
Published: 10 January 2023.
Edited by:
Giuseppe Di Vita, University of Turin, ItalyReviewed by:
Nester Mashingaidze, One Acre Fund, RwandaTherese Mwatitha Gondwe, Independent Researcher, Lilongwe, Malawi
Copyright © 2023 Fongar, Linderhof, Ekesa, Dijkxhoorn and Nalweyiso. This is an open-access article distributed under the terms of the Creative Commons Attribution License (CC BY). The use, distribution or reproduction in other forums is permitted, provided the original author(s) and the copyright owner(s) are credited and that the original publication in this journal is cited, in accordance with accepted academic practice. No use, distribution or reproduction is permitted which does not comply with these terms.
*Correspondence: Vincent Linderhof,  dmluY2VudC5saW5kZXJob2ZAd3VyLm5s