 Alejandro Nin-Pratt
 Gert-Jan Stads
- Environment and Production Technology Division, International Food Policy Research Institute, Washington, DC, United States
Introduction: This article contributes to a better understanding of the context in which agricultural R&D investment takes place in low- and middle-income countries, and how innovation capacity, the development of the food system, and the size of the research system affect R&D investment.
Methods: A three-step methodology is proposed where the first step consists of creating an index of the development of a food system using indicators of the technological transformation of the food supply chain and the changes in diets on the demand side. The second step involves developing a measure of innovation capacity at the country level, while the final step consists of systematic comparisons of countries with large and small agricultural research systems to find the relationship between the size of a country's research system, the level of development of its food system, and its overall capacity to innovate.
Results: The results reveal that there is a high and positive correlation between innovation capacity and the development of the food system and a negative correlation between these two indicators and the size of the agricultural research system in low- and middle-income countries. The lower overall quality and level of development of the education and scientific research systems in countries with small agricultural research systems are important factors contributing to reduced innovation capacity. In addition, countries with small agricultural research systems are challenged with a comparatively poor innovation environment, poor market development, a weak private sector, a lack of competition in domestic markets, and a largely rural population with poor links to markets.
Discussion: The results of the analysis stress the need to increase the efficiency and productivity of agricultural research by implementing policies that get the most out of available resources while minimizing the negative effect of small-scale research operations. Increased coordination and integration of agricultural research at the regional and global level can help avoid duplication, enhance the efficiency of small-scale organizations, and make research more cost-effective and impactful.
1. Introduction
As the world's population moves toward 10 billion by 2050, unprecedented increases in global food production—of at least 60% over 2007 levels—will be needed to meet growing demand. Innovation is essential to address challenges associated with population growth and those caused by increased pressure on natural resources and climate change. Innovation will be needed in agricultural technologies to increase and diversify production in ways that make more efficient use of resources, but it will also be needed in the infrastructure, institutions, and services that support food systems to make them more inclusive, resilient, and sustainable (Stads et al., 2022).
There is considerable evidence that investing in agricultural research is a highly effective pathway for both reducing poverty and hunger and addressing climate change impacts on food systems (Rosegrant et al., 2017; Mason-D'Croz et al., 2019; Agricultural Science and Technology Indicators, 2022). Regardless of the mode of investments, timeframe, and specific targets for adaptation chosen, studies have consistently shown that spending on agricultural research has had a greater impact on agricultural productivity than other types of public expenditures. Agricultural research spending has also performed best or second-best in reducing poverty, whether the comparison is with other investments, such as irrigation, soil conservation, and farm subsidies, or with investments in other rural areas, such as health, education, and roads (Diaz-Bonilla et al., 2014; Mogues, 2015).
Given the widespread evidence of the positive impact of agricultural R&D investment on agricultural productivity and poverty reduction, it is no surprise that global agricultural research spending grew by 50% (in inflation-adjusted terms) during 2000–2016. This global growth, however, was mostly driven by China and other large middle-income countries, while growth in high-income countries (HICs) has largely stalled (Beintema et al., 2020). Coinciding with the observed fast growth in R&D spending in low-and middle-income countries (LMICs), the global gap in agricultural research investment—that is actual agricultural research investment as a percentage of attainable investment levels—dropped from 45% in 1996 to 39% in 2016 (see Nin-Pratt, 2021 for more information on investment gaps).
Accelerated growth in agricultural R&D investment in LMICs could be construed as very good news given the vast amount of literature going back decades showing that the returns to agricultural R&D investment average around 40–60% (Alston et al., 2000; Evenson, 2001), and that there has been substantial underinvestment in public agricultural R&D (Roseboom, 2003). Yet, a closer look at R&D investment data reveals that the investment gap in LMICs other than China and India as a group has widened since 2008 after contracting significantly in the early 2000's (Nin-Pratt, 2021).
A recent study by Rao et al. (2019), which used a newly updated and expanded global database of estimated returns to agricultural R&D and a robust statistical methodology, finds that today's returns to agricultural R&D investments are as high as ever. Yet, most LMICs continue to underinvest. James et al. (2008) point to three distinct features of LMICs that can help explain the underinvestment challenge: incomplete markets, appropriability problems, and price distortions. First, LMICs face a comparatively high incidence of incomplete markets, resulting from high transaction costs and inadequate property rights, which in turn may be attributable to inadequate infrastructure and defective institutions. These are likely to reduce adoption rates of new inventions, decreasing the expected returns, and increasing the risk of R&D investments. Second, appropriability problems are more pronounced for the types of technological innovations best suited to much of LMIC agriculture, such as improved crop varieties and farm management practices—innovations that have been comparatively neglected by the private sector. Third, in many developing countries, poor policies and distorted prices have diminished incentives and opportunities for farmers to adopt new technologies.
James et al. (2008) also point to additional features that contribute to underinvestment in the public sector. Budget constraints due to low government revenues together with underinvestment in several other essential public goods, including transportation and communications infrastructure, schools, and hospitals, can result in high social rates of return on these investments and high opportunity costs for investment in agricultural research. Adding to this, agriculture in less developed LMICs represents a much greater share of the total economic activity and per capita incomes are much lower relative to higher-income countries. Under such circumstances, investment in public agricultural research can impose a much higher cost on individual citizens, especially when this burden is felt now and the payoff may take years or decades to come, thereby diminishing the political appeal of supporting agricultural R&D. Finally, one of the factors determining the extent of underinvestment in agricultural R&D, which is particularly relevant for this study, is that of economies of scale in knowledge accumulation and dissemination. In most cases, LMICs attempting to conduct most of their own research may be too small to achieve an efficient scale in many, if any, of their R&D priority areas. If technological spillovers are available and accessible, it might not make sense for small, poor, agrarian nations to spend their scarce intellectual and other capital resources on agricultural science.
This article revisits the agricultural R&D underinvestment problem in LMICs with the aim of contributing to a better understanding of the context in which public R&D investment takes place, and how innovation capacity, the development of the food system, and the size of the research system affect R&D investment. This is achieved by using the analytical framework of the food system developed by Reardon et al. (2019) together with elements of the agricultural information system (AIS) approach by (Spielman and Birner, 2008). The hypothesis motivating the analysis is that research systems are endogenous to the development process. In other words, countries with more developed food systems are better positioned to get the most out of their agricultural R&D investment as they have more developed value chains, better integrated national output and input markets, and better infrastructure. This implies a positive correlation between the development of the food system and a country's capacity to innovate, which is a function of several factors, including the quality of human capital and research capacity, the innovation environment, innovation policies, and institutions. If this is the case, LMICs face the chicken-and-egg dilemma of not being able to increase agricultural research efficiently to promote innovation and development, precisely because they are underdeveloped and lack the capacity to innovate. On the other hand, it is not clear a priori why R&D investment is growing faster in LMICs with large agricultural R&D systems. Is the better investment performance of large LMIC economies explained mostly by economies of scale in research, or are there also important differences in innovation capacity and food system development in these countries?
To answer these questions, we look at the evolution of global agricultural R&D investment, breaking down the analysis by countries' income levels and the size of their R&D systems. This is followed by the conceptual framework, methodology, and data used to build indices of food system development and of innovation capacity. The subsequent section presents the results of an analysis of the productivity, costs, and scale of agricultural research systems in the context of food system development and agricultural innovation capacity, while the concluding section discusses the main findings and suggests policy implications.
2. Long-term trends in agricultural R&D investment
In inflation-adjusted terms, global public agricultural research investment doubled between 1981 and 2016 (Figure 1). While HICs still accounted for the bulk of research spending around the turn of the millennium, rapid increases in spending by large middle-income countries, coupled with stagnating spending growth in HICs, have shifted the global balance. By 2016, LMICs accounted for nearly 60% of global agricultural research spending. China, India, and Brazil alone accounted for more than half of LMIC spending, while sub-Saharan Africa's (SSA's) share in global public agricultural R&D spending has stagnated at about 5% (Agricultural Science and Technology Indicators, 2022). Private sector involvement in agricultural research also shifted the balance in investment. Private spending tripled from $5.1 to $15.6 billion globally between 1990 and 2014, outpacing growth in public spending. Though most private R&D expenditures originate in HICs, more than a quarter of these expenditures directly target commodities or research areas relevant to LMIC farmers (Fuglie, 2016).
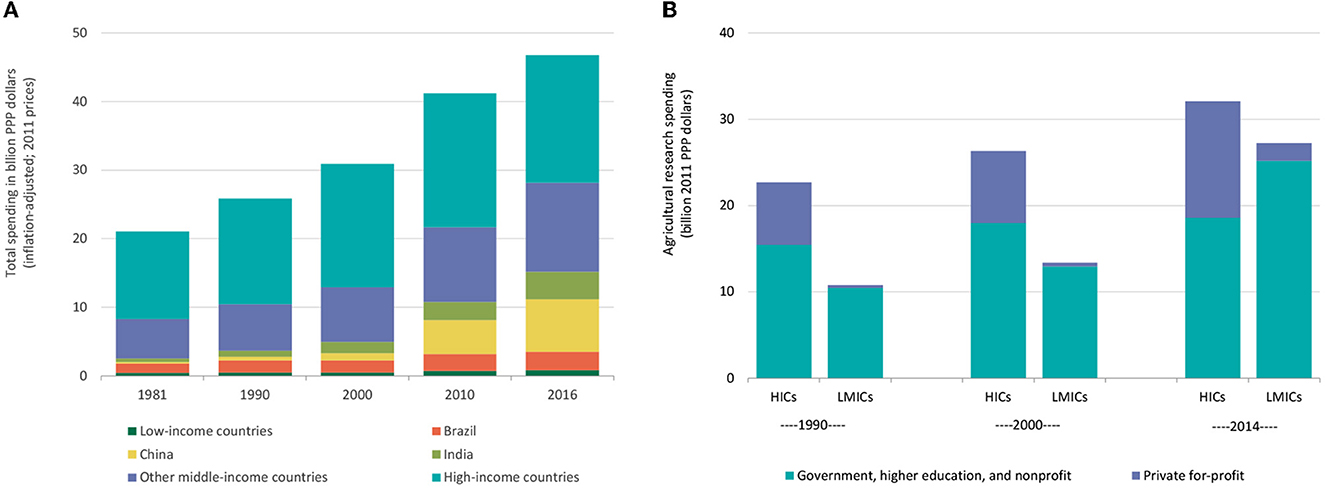
Figure 1. Long-term trends in agricultural research spending. (A) Public spending by income group, 1981–2016. (B) Public and private spending by income group, 1990–2014. Sources: Fuglie (2016) and Agricultural Science and Technology Indicators (2022).
Figure 2 groups the 98 countries included in the analysis based on the size of their research system (measured by average annual investment in 2011 PPP dollars at the beginning and end of the 1996–2016 period). During 1996–2000 (Figure 2A), the seven countries investing more than 1,000 million PPP dollars (in 2011 constant prices) were Germany, Indonesia, France, India, Brazil, Japan, and the United States. The group of countries investing between 400 and 1,000 million PPP dollars during 1996–2000 included seven HICs as well as 5 LMICs, namely: Egypt, Argentina, Mexico, Malaysia, and China. The group investing between 100 and 400 million PPP dollars includes Kenya, Morocco, Nigeria, and South Africa in SSA, Bangladesh, Philippines, Pakistan, and Thailand in the Asia-Pacific region, and Chile and Colombia in the Latin America and Caribbean (LAC) region. The largest research systems among countries investing 100 million PPP dollars or less include Vietnam, Côte d'Ivoire, Algeria, Ghana, and Sri Lanka. The average size of investment for the 98 countries combined was more than 60 million PPP dollars during 1996–2000.
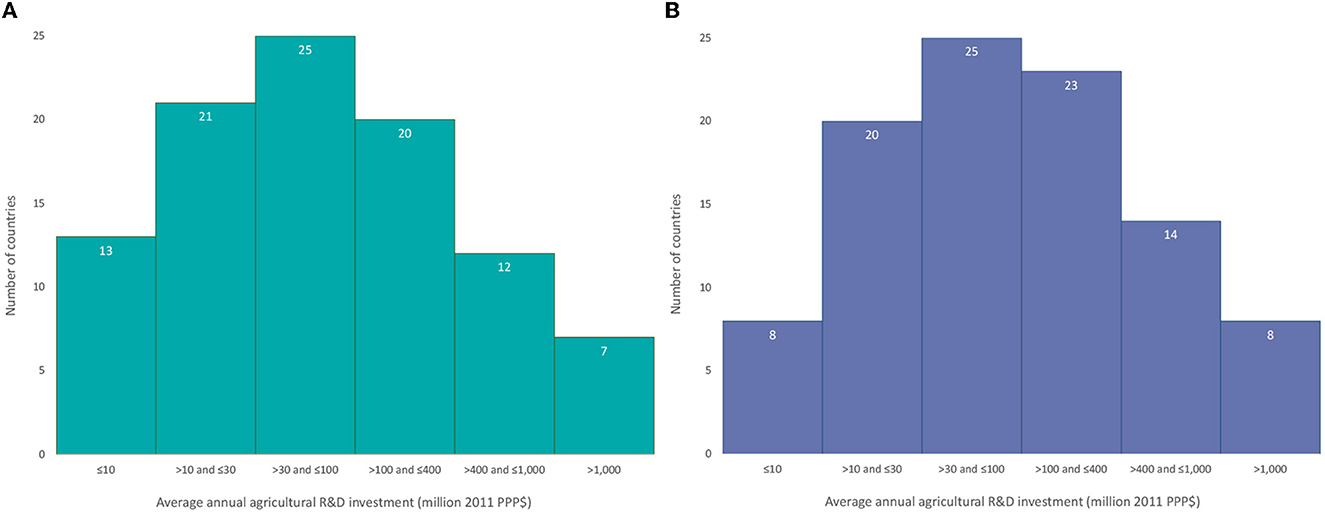
Figure 2. Size distribution of national agricultural research systems based on average annual investment levels. (A) 1996–2000. (B) 2011–2016. Source: Elaborated by authors based on Agricultural Science and Technology Indicators (2022).
Figure 2B shows the distribution of countries by their level of R&D investment during 2011–2016. Sixty-one of the 98 countries are still in the same investment group as they were during 1996–2000; 28 countries moved to a higher investment group, while nine countries moved to a lower investment group. The main difference can be observed in the group investing <10 million PPP dollars. The number of countries in this group decreased from 13 to 8. Details of the distribution of countries by R&D spending levels at the beginning and end of the period summarized in Figure 2 can be found in the Supplementary material to this article.
To study the differences in investment and performance between countries with large and small agricultural research systems, countries' agricultural research systems were classified as small, medium, or large, based on average R&D investment levels during 1996–2000, the beginning of the period of analysis. R&D investment and other indicators for the period 2000–2016 from the groups of small, medium, and large countries are then used to compare investment performance and other characteristics of the three groups.1 The group of countries with large agricultural research systems (Large) includes those LMICs in the highest 20% of the distribution shown in Figure 2A, i.e., those with average annual R&D investment of more than 400 million PPP dollars during 1996–2000. The LMICs in this group include China, Brazil, India, Argentina, Indonesia, Mexico, Egypt, and Malaysia. On the other extreme, countries spending <100 million PPP dollars in agricultural R&D during 1996–2000 are included in the group of countries with small research systems (Small). This group is very heterogeneous, with annual investments ranging from 1 to 100 million PPP dollars. Between these two groups, countries with medium-size research systems (Medium), are those with an average annual agricultural R&D investment ranging from 100 to 400 million PPP dollars.2
As Figure 3 shows, annual investment levels by large agricultural research systems are considerably higher than those by medium-sized and small systems, both in absolute and relative per-capita terms. Moreover, large systems' long-term growth in agricultural research investment has far exceeded investment growth in other LMICs as well as HICs. Large LMICs have also been the main driver behind global growth in agricultural R&D investment. China alone was responsible for about half of this increase in global investment.
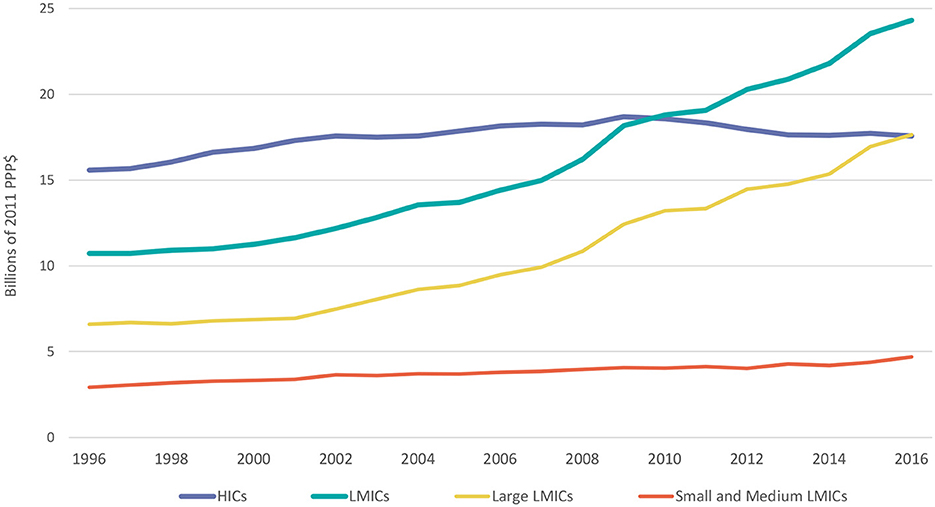
Figure 3. Trends in public agricultural R&D investment in HICs and LMICs grouped by the size of their research system, 1996–2016. Sources: Elaborated by authors based on Agricultural Science and Technology Indicators (2022) and United States Department of Agriculture, Economic Research Service (2022). The size of the national agricultural research system is determined based on average annual agricultural R&D investment (in 2011 PPP$) for the 1996–2000 period. Large: >400 million PPP$; Medium: 100–400 million PPP$; and Small: <100 million PPP$.
Increasing the productivity of agricultural production—that is, getting more output from the same amount of resources—is critical for improving food security. TFP is an indicator of how efficiently agricultural land, labor, capital, and other inputs (seed, fertilizer, and so on) are used to produce a country's agricultural outputs (crops and livestock). TFP is calculated as the ratio of total agricultural outputs to total production inputs, so when more output is produced from a constant amount of resources, TFP increases. R&D activities producing new technologies and innovations are a crucial factor driving TFP, but technological spillovers from abroad, higher numbers of skilled workers, investments that favor the development of input and output markets (such as in roads and communications), and government policies and institutions that promote market development and competition, are major drivers as well. During 1996–2016, global TFP increased steadily (United States Department of Agriculture, Economic Research Service, 2022). Large LMICs, which were the main drivers of global growth in agricultural R&D spending, were also the main drivers of global growth in TFP. Over this period, TFP growth in large LMICs was nearly twice as high as in smaller LMICs and HICs (Figure 4).
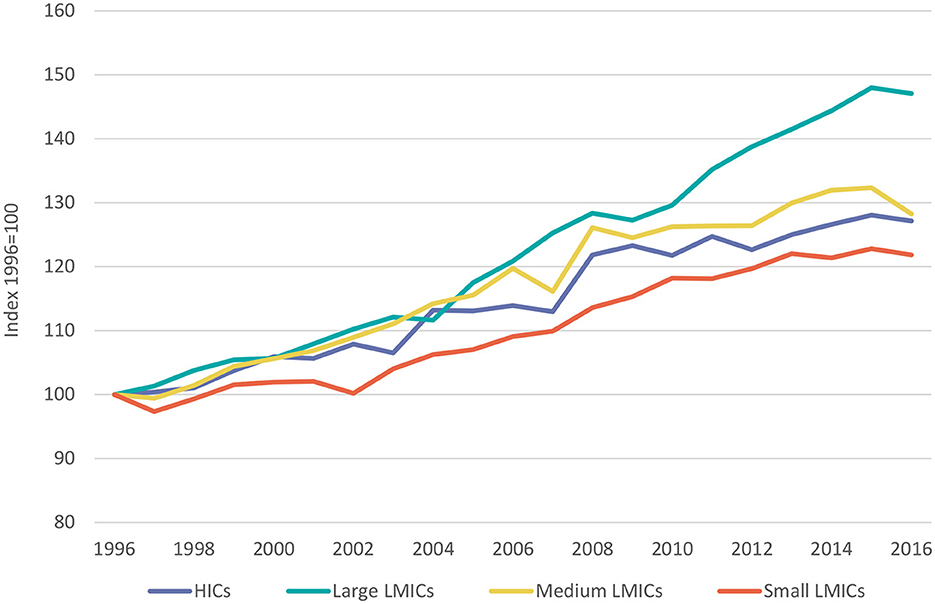
Figure 4. TFP growth in HICs and LMICs with large, medium, and small agricultural research system, 1996–2016. Sources: Elaborated by authors based on Agricultural Science and Technology Indicators (2022) and United States Department of Agriculture, Economic Research Service (2022). The size of the national agricultural research system is determined based on average annual agricultural R&D investment (in 2011 PPP$) for the 1996–2000 period. Large: >400 million PPP$; Medium: 100–400 million PPP$; and Small: <100 million PPP$.
Table 1 reveals that there are important structural differences between LMICs with large, medium, and small national agricultural research systems. With almost 1 billion people living in countries with small agricultural research systems, these countries account for 15% of the global population and 12% of global agricultural GDP (AgGDP). Yet, they generate only 5% of global GDP, and their average GDP per capita is about half of that in Large countries. Agricultural R&D investment by LMICs averaged around 22 billion PPP dollars during 2013–2016, equivalent to 56% of global agricultural R&D spending. However, countries with small research systems contributed only 6% of R&D spending, similar to their contribution to global GDP.
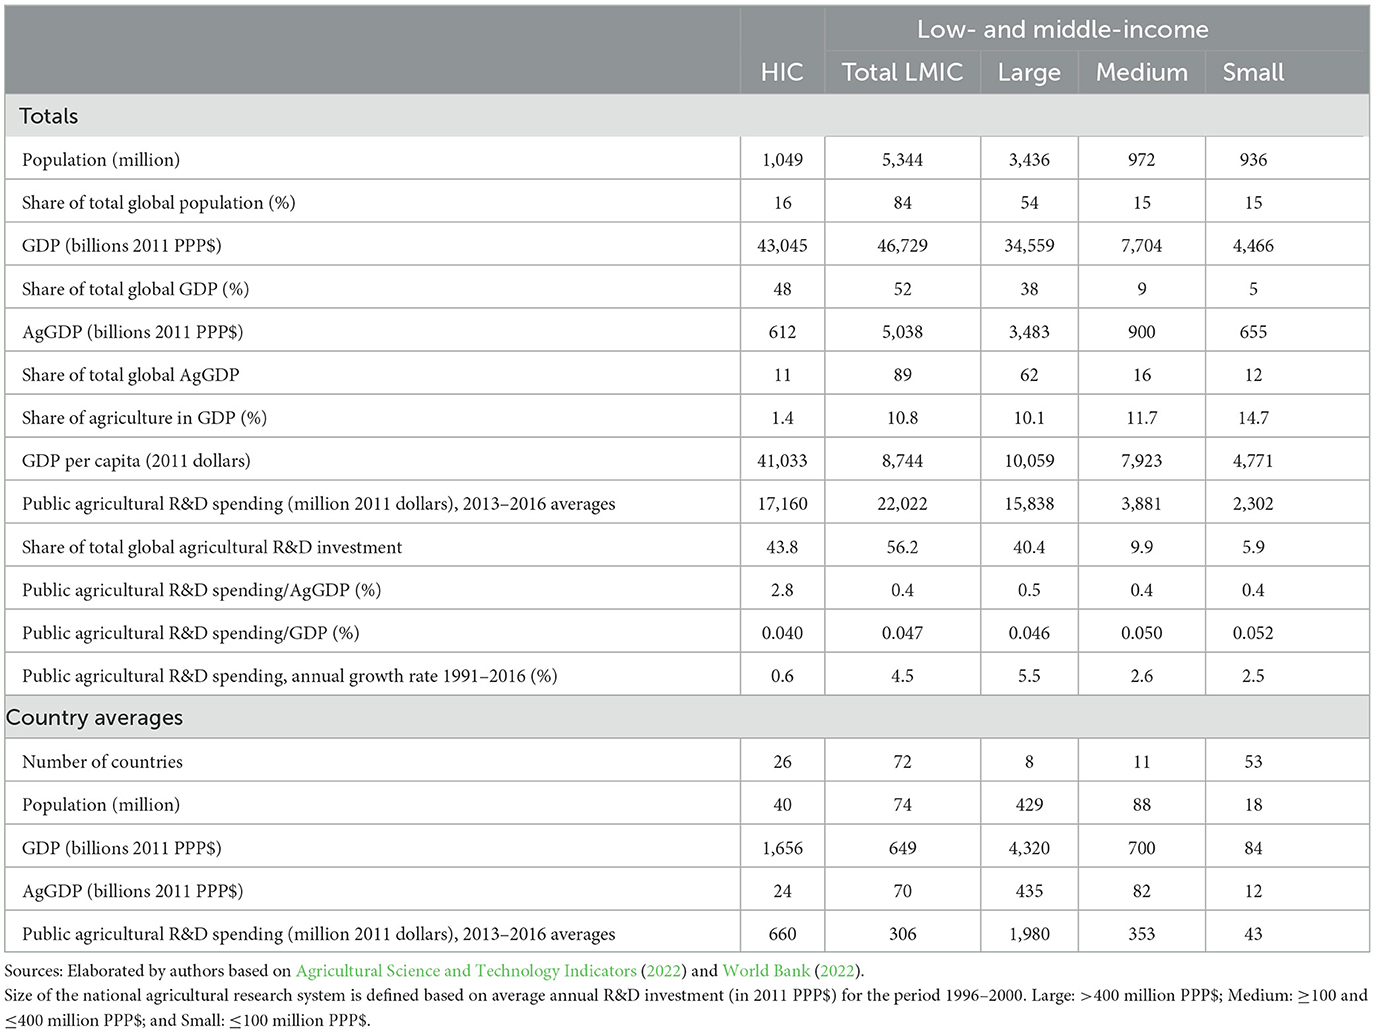
Table 1. Macroeconomic and agricultural R&D investment indicators for HICs and LMICs grouped by the size of the research system.
These figures provide a simple and intuitive explanation of why the share of agricultural R&D investment in AgGDP is not a good measure of a country's effort in R&D investment. Table 1 shows that this share in HICs is 2.8%, much higher than the 0.4% recorded in LMICs. However, if GDP is used instead of AgGDP, the difference in R&D investment “intensity” between HICs and LMICs disappears. In fact, the share of agricultural R&D investment in GDP is actually higher in LMICs (0.047%) than in HICs (0.040%), with Small countries showing the highest share (0.052%) among the four groups of countries. In other words, Small countries are investing more in agricultural R&D relative to the size of their economy than HICs. These country differences are, perhaps, not too surprising. With a much smaller share of agriculture in GDP and higher GDP per capita, HICs are in a position to invest more relative to AgGDP than LMICs, and there are a number of political economy factors explaining the reasons for this, which will be discussed later.
The bottom rows in Table 1 summarize the important size differences that exist across country groups in terms of population, GDP, AgGDP, and agricultural R&D spending. For example, the average Small country spends more than eight times less in agricultural R&D than the average Medium country and nearly fifty times less than the average Large country.
3. Conceptual framework
New developments in the dialogue about the transformation of the food system and how knowledge is transformed into innovations have clear implications for the analysis of public agricultural R&D investment and the factors behind underinvestment in LMICs. This complexity seems to be at odds with a mechanistic view of policy research and investment that assumes that the production of new knowledge by the National Agricultural Research System (NARS) is in practical terms, exogenous to the economic and social conditions of the country and the structural variables that determine them. This might well be the assumption behind the across-the-board recommendation to governments in LMICs to increase investment in agricultural research without distinction of the country's level of development, research capacity, research institutions, and opportunity costs of alternative investments. The point here is not to deny the importance of agricultural R&D investment but rather approach research as part of a knowledge value chain in the food system, and as such, subject to the same complexities and constraints as the other value chains in the food system. For this reason, there is a need to refine the conceptual and analytical tools to identify how policies and investments can best promote innovative behavior and practices in the agricultural sector.
3.1. The innovation system
Spielman and Birner (2008) argue that the agricultural innovation system (AIS) framework offers an interesting perspective for guiding investment and policy interventions in this area. The World Bank (2006) defines an innovation system as “…a network of organizations, enterprises, and individuals focused on bringing new products, new processes, and new forms of organization into economic use, together with the institutions and policies that affect their behavior and performance.” This approach to the analysis of innovations includes not only the science suppliers, but it extends beyond the creation of knowledge to encompass the factors affecting demand for and use of knowledge (World Bank, 2006).
Spielman and Birner (2008) propose a conceptual framework of the AIS that captures its essential elements, the linkages between these elements, and the institutions and policies that constitute the enabling environment for innovation. According to this framework, essential elements of an innovation system include (a) a knowledge and education domain composed of the agricultural research and education systems; (b) a business and enterprise domain that includes the set of value chain actors and activities that both use outputs from the knowledge and education domain and innovate independently; (c) bridging institutions that link the two domains, including extension services, political channels, and stakeholder platforms—that facilitate the transfer of knowledge and information between the domains; and (d) the context conditions that foster or impede innovation, including public policies on innovation and agriculture; and informal institutions that condition how individuals and organizations within each domain act and interact. Influencing factors that are not part of the system include the linkages to other sectors of the economy (manufacturing and services); general science and technology policy; international sources of knowledge and markets; and the political system.
3.2. The food system
According to Reardon et al. (2019), a food system is a cluster of value chains that includes farmers producing agricultural output; inputs that are supplied to farmers and the post-farmgate segments of the system; rural and urban wholesalers; transporters who bring outputs and inputs to markets, to the processing industry, and retailers; and financial services offered to each segment and every chain in the system. The R&D supply chain is closely linked with the other components of the system to deliver technology and product innovations. It comprises the NARS, private players investing in R&D, the International Agricultural Research Centers (IARCs), and universities. A broad set of public assets such as infrastructure, police protection, court systems for contract enforcement, and innovation policies act as the “lubricant” between the different value chains, facilitating linkages within the system, and with other systems in the economy (Reardon et al., 2019).
Urbanization, income growth, and population growth play crucial roles in the structural transformation of food systems. Urbanization fuels the spatial expansion of supply chains as cities need larger catchment areas to feed themselves. At the initial stages of development, supply chains in the food system are mostly local, with most of the value added occurring at the farm level and limited involvement by off-farm players in the supply chain. As the chain grows longer and economies of specialization emerge in the midstream and downstream segments of the chain, the role of post-farmgate segments grows while the farmers' share in the total value added of the chain drops (Reardon et al., 2019).
Longer value chains and the specialization in the chain's downstream segments result in product differentiation and the rise of trade in perishables, triggering institutional changes along the chain. One of these changes is the emergence of quality and safety standards, formulated by supermarket chains, large processors, and fast-food chains to reduce losses in processing, increase shelf life, control quality, and consistency, and assure safety. Governments also institute public food safety regulations for retail and food service (Reardon et al., 2019).
Finance arrangements also evolve as the food system develops. In traditional systems, farmers receive money or input from traders in advance to be paid back with the harvest. As food systems evolve, and competition among traders and farmers increases, off-farm cash sources become more common, as does increased vertical integration in some value chains where contracts are used when food industry firms must rely on small farmers to complete their supply and farmers face market failures for credit and inputs (Reardon et al., 2019).
Increased urbanization and income growth also prompt shifts in diets. As citizens can afford to spend a higher proportion of their budget on non-staple foods, the supply chains of vegetables and fruit, meat and fish, dairy, and edible oils become more sophisticated. Pro-market policies tend to favor these changes as they increase the participation of the private sector (large input firms, processors, supermarkets, and fast-food chains) encouraged by the expanding urban markets. Finally, investments in infrastructure facilitate the development of the food supply chain from rural areas to cities and towns by reducing transaction costs and strengthening linkages between supply chains (Reardon et al., 2019).
With urbanization and rising labor participation in industry and services, labor in agriculture becomes increasingly scarce. The limited supply of labor increases labor costs and the use of capital inputs and investments per worker to enhance labor productivity. Responding to the increased demand for capital inputs, countries increase supply by industrializing production or increasing imports. This drives down the cost of capital inputs. With labor scarcity increasing, technical change and capital intensification among farmers are induced. The use of capital inputs is also powered by research and the production of high-yield crop varieties and improved livestock breeds adapted to local conditions that produce more output per unit of input. As urban demand rises and production specializes, the importance of breeding for traits of quality and the ability to store and process agricultural commodities increases relative to breeding for yield (Reardon et al., 2019).
As with farm technologies, a gradual increase in wages, combined with a decrease in physical capital prices (from local industrialization and imports), induces midstream and downstream capital intensification and upgrading. On the other hand, demand-side factors such as the demand for new products, improved quality, and safety attributes, and greater and more storable volumes also induce technological change. Much of the initial innovation occurred earlier, in HICs, and was transferred and adapted to LMICs. These technological advances include among others, innovations in logistics, processing, freezing, packaging, traceability, inventory, and safety monitoring technologies.
3.3. Links between innovation and food systems
Innovation and food systems overlap to a certain extent. This is because several of the factors that contribute to a country's capacity to innovate are precisely the factors that determine the level of development of a food system. Figure 5 attempts to capture this relationship by laying out the different food system components in the form of a Porter Diamond representing a country's environment for innovation (Porter and Stern, 2001). The four vertexes of the diamond display the attributes affecting innovation in the food system as well as its overall competitiveness. The first of these attributes is what Porter calls the factor conditions. The presence of high-quality human capital is one of these factor conditions. It determines the capacity of the agricultural research system, and at the same time, it is the product of the quality and scope of the education system and the development of scientific research in the country.
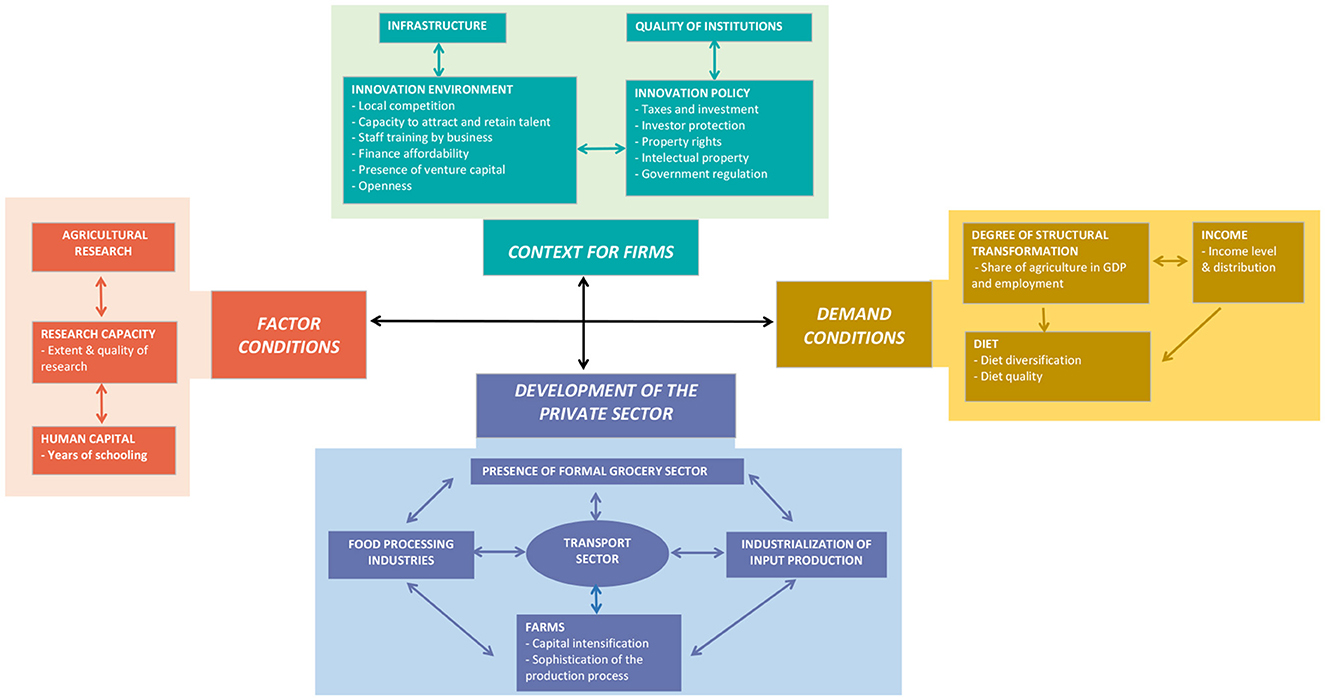
Figure 5. The food system and the innovation context. Sources: Elaborated by authors based on Porter and Stern (2001), Spielman and Birner (2008), and Reardon et al. (2019).
The second attribute is the development and strength of the private sector, reflected by the firms that take part in the food system directly and those that provide services and inputs to them. Developed output and input markets, the length and breadth of the value chains, the development of industrial clusters, vertical integration, or tighter links between upstream and low-stream segments of the chain indicate a more developed food chain.
The third attribute is food demand, which is associated with income growth, shifts in diets, urbanization, and increased labor participation in industry and services. Food demand acts as a pull factor in the development of the value chain in that it influences the types and quality of products produced. It also has the potential to determine technology changes at the farm level and investment in the off-farm segments of the chain.
Finally, the “environment” in which firms in the private sector operate is the fourth attribute of the diamond. It includes a country's innovation environment, which is the product of the level of local competition, the capacity to attract and retain talent, affordability of credit, the presence of venture capital, and other factors. This environment is shaped and affected by innovation policies, infrastructure (especially in communications and IT), and by the quality of institutions.
3.4. Indices to quantify innovation capacity and food system development
To gain a better understanding of the factors behind public R&D investment, and how innovation capacity and structural country characteristics affect investment at different stages of development of the food system, a three-step methodology is proposed based on the conceptual framework summarized in Figure 5. The first step is the construction of an index that quantifies the development of a food system using indicators that capture the technological transformation of the food supply chain and the changes in diets that act as demand-side pull factors. Two sub-indices measure the technological transformation of the supply side of the food system. The first sub-index is a measure of intensity in the use of capital inputs—irrigation equipment, seeds, fertilizer, insecticides, herbicides, tractors and combines, and sprayers—measured as total capital inputs per worker. The second sub-index quantifies post-farm innovations reflected in the “length” and reach of the value chain. As mentioned above, an index measuring changes in diets is included to capture changes on the demand side of the system.
The second step is to develop a measure of innovation capacity at the country level. Factors associated with innovation capacity include education and human capital; research investment and research quality; innovation policy and environment; and the quality of political and innovation institutions. The final step consists of systematic comparisons of countries with large and small agricultural research systems to find the relationship between the size of a country's research system, the level of development of its food system, and its overall capacity to innovate. Detailed information on the indicators used to build the food system development index (FSDI) and the index of innovation capacity (IIC) and on the approach used is included in the Supplementary material to this article.
4. Results
The average values of the FSDI and IIC indices for HICs and LMICs are presented in Figure 6. The median values of the two indices divide Figures 6A, B in quadrants of low-low, low-high, high-high, and high-low food system development and capacity to innovate, respectively. As expected, Figure 6A demonstrates a high and positive correlation between the development of a food system and a country's capacity to innovate. About 80% of the points representing countries in the figure are displayed along a fitted line with a positive slope, with half of these points in the low-low quadrant and the other half in the high-high quadrant. The remaining 20% of countries are distributed equally between the low-high and high-low quadrants. What is most revealing about Figure 6A is that two-thirds of the countries with small national agricultural research systems (35 out of 53) are in the low-low quadrant, while only one out of 8 large-sized systems and two out of 11 medium-sized systems find themselves in this quadrant. This means that countries in the Large group are not only investing more in agricultural R&D, but they are also doing so in a more favorable environment, with higher prospects of transforming research outputs into innovations.
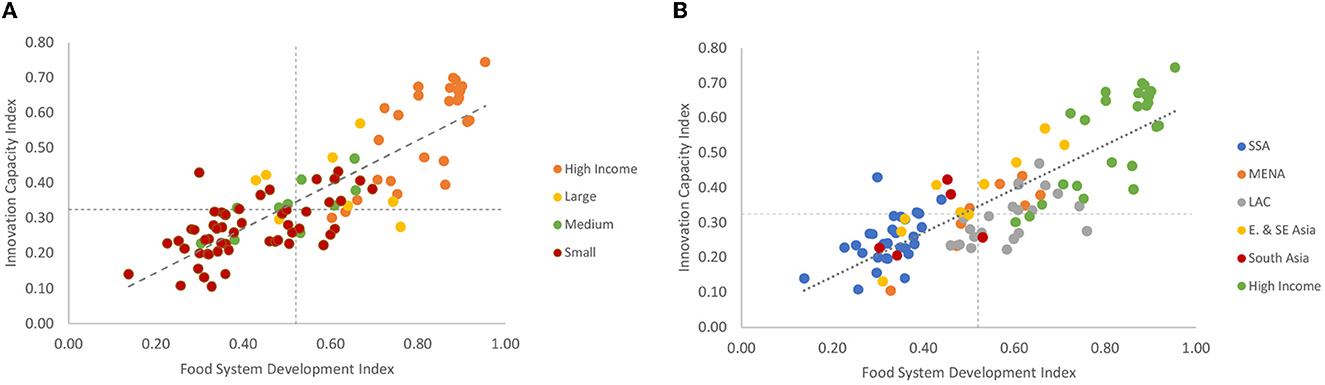
Figure 6. Food system development vs. innovation capacity. (A) By size of the research system. (B) By geographic region. Sources: Elaborated by authors based on Schwab (2018), Schwab (2019), Agricultural Science and Technology Indicators (2022), FAO (2022), SCImago (2022), United States Department of Agriculture, Economic Research Service (2022), and World Bank (2022).
Figure 6B repeats the same scatterplot, but this time the countries are depicted by geographic region instead of the size of their research systems. The figure reveals that more than 60% of the countries in the low-low quadrant (24 out of 38) are SSA countries. It also shows that all East and Southeast Asian (ESEA) countries except one (Myanmar) are on or above the fitted line, while most LAC countries are below this line. For example, among countries with a FSDI greater than the medium value in Figure 6B, there are four ESEA countries and 14 LAC countries. While all four ESEA countries are above the fitted line, only two of the 14 LAC countries are. This indicates that at the same level of development of the food system, ESEA countries have a higher capacity to innovate than LAC countries.
Of interest is the group of countries in the low-high quadrant in Figure 6B. These nine countries show a high capacity to innovate, despite a relatively low level of development of their food systems. Four of these countries—Botswana, Kenya, Namibia, and Rwanda—are in SSA. Other low-high countries include Indonesia, India, Morocco, the Philippines, and Sri Lanka.
4.1. Development of the food system and innovation capacity
Table 2 presents more detailed results of the FSDI and its components for countries grouped by the size of their research system, revealing systematic differences in the demand and supply components of the FSDI between countries in the Large and Small groups. On average, countries in the Small group consume less animal protein, suggesting that income growth, urbanization, and the diet changes associated with them occurred earlier or are taking place faster in Large countries. Important supply-side differences between the Large and Small groups were observed as well. The capital intensity in agriculture, measured as the use of capital inputs per worker, is almost 30% lower in the group of Small countries compared to the group of Large countries. Note, however, that there is great variability and no significant differences between groups of countries in the use of individual inputs per worker except fertilizer, which is used more intensively in Large countries. In contrast, significant differences between the Large and Small groups of countries were observed in all indicators that quantify the development of the value chain. This suggests that the development of longer value chains and the specialization in the chain's downstream segments is more prominent in Large countries than in Small countries.
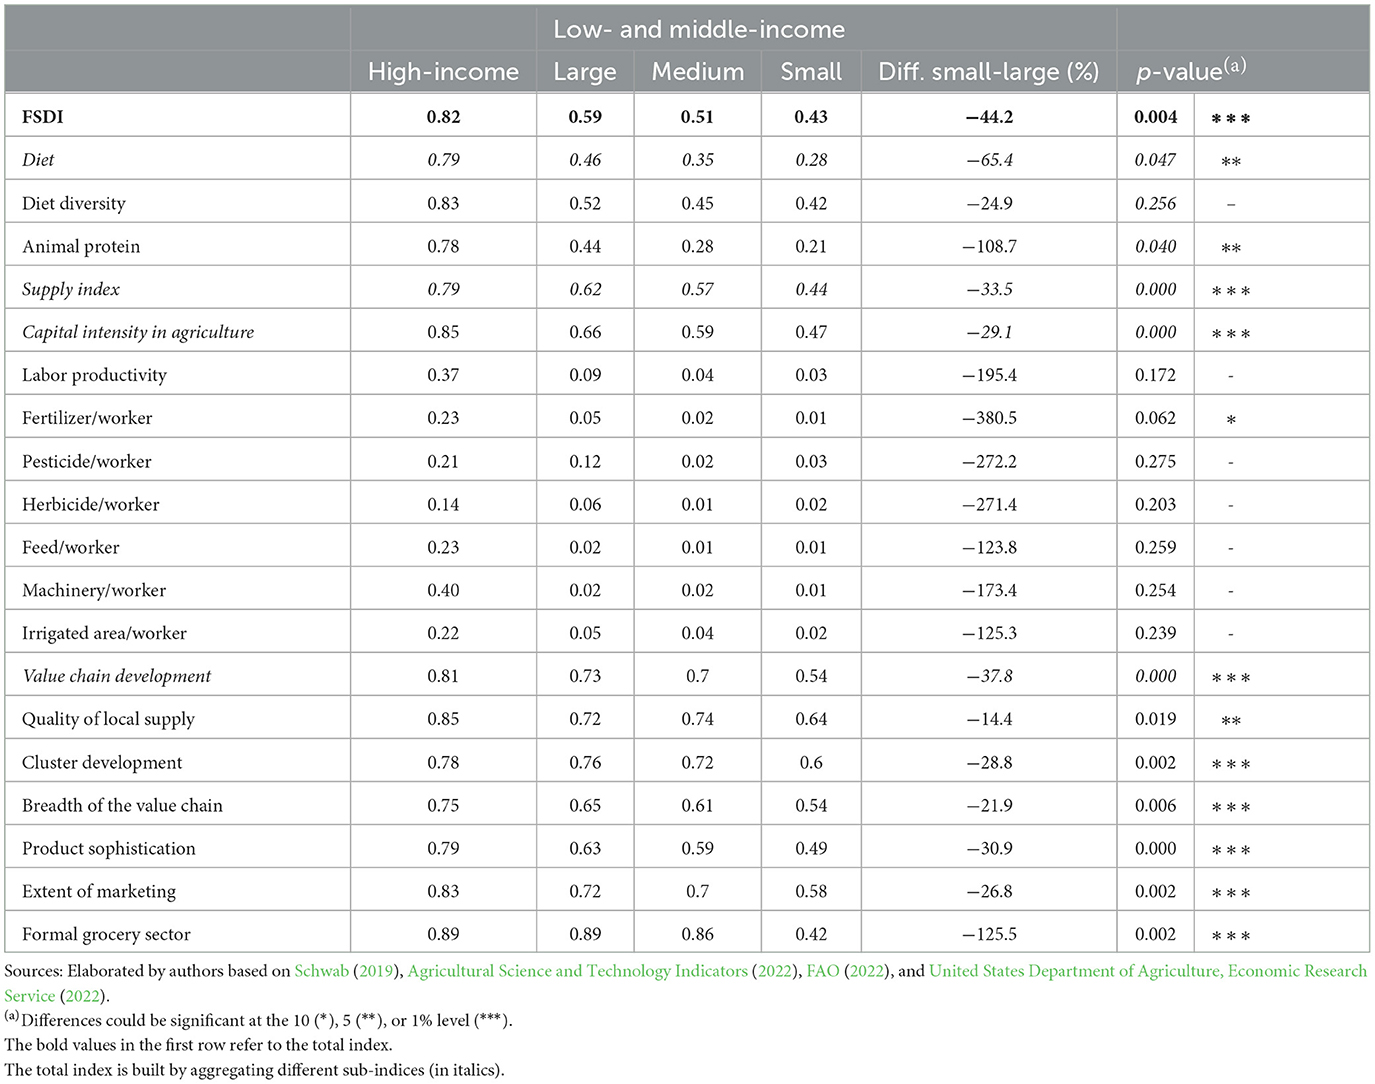
Table 2. The Food System Development Index and its components for HICs and LMICs grouped by the size of their agricultural research systems, average values for 2011–2016.
Table 3 shows the IIC index and its subindices measuring a country's capacity to innovate. The results show large variations between countries with large and small research systems that are particularly significant when it comes to human capital and research capacity. Countries with small research systems have lower enrollment at all levels of education, especially in tertiary education where the value of the sub-index in countries with small research systems is less than half (0.156) than the value in the Large group (0.322).
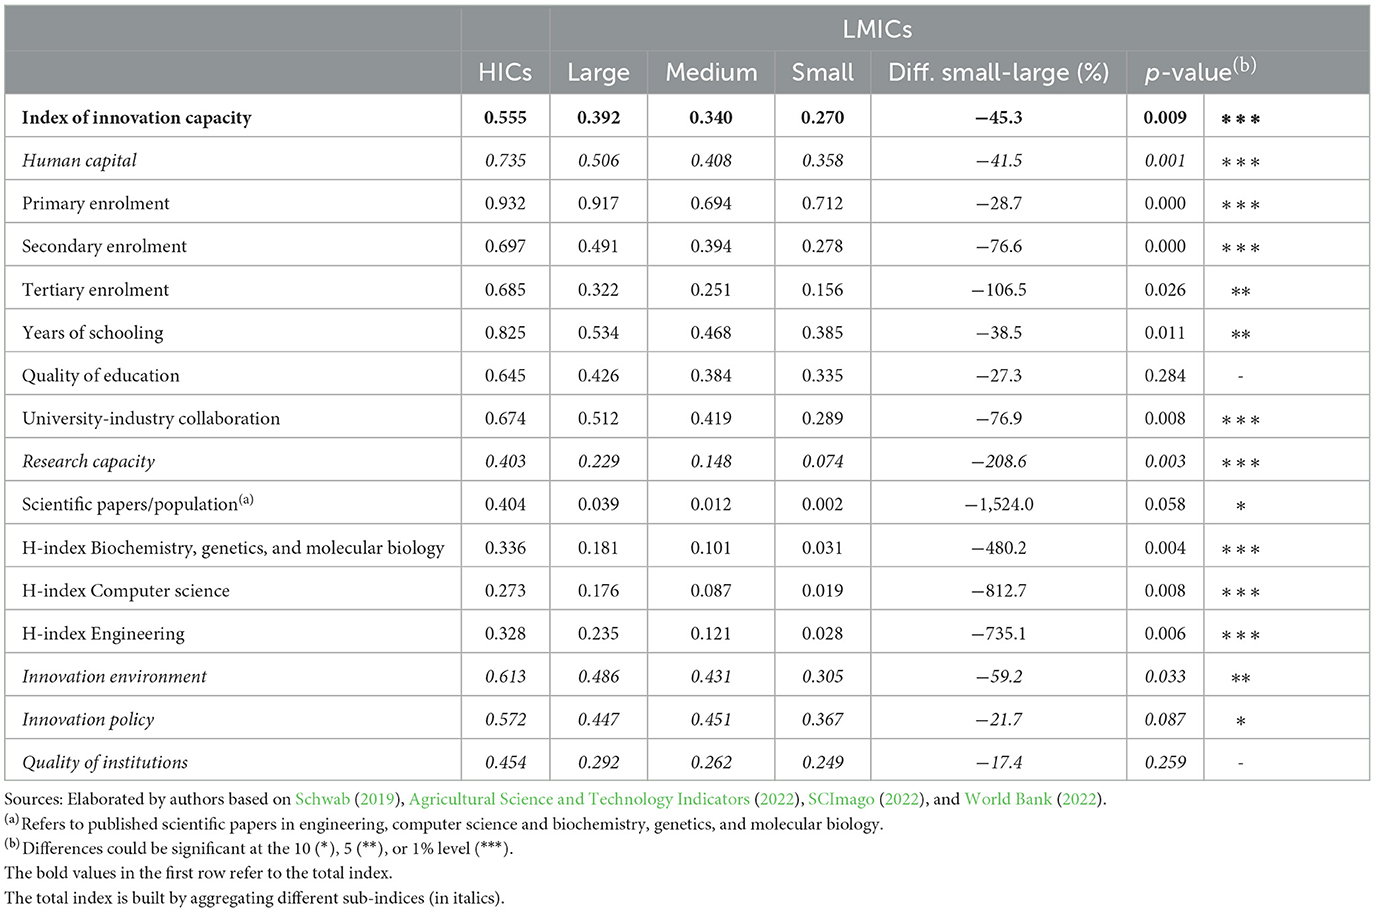
Table 3. The index of innovation capacity (IIC) and its components for HICs and LMICs grouped by the size of their agricultural research systems, average values for 2011–2016.
Research capacity and its subindices in Table 3 gauge a country's overall performance in science including the number of publications in engineering, computer science and biochemistry, genetics, and molecular biology, as well as the H-index—a metric for evaluating the performance and impact of scholarly output, which measures the quantity and quality of publications in each of these areas. The H-index for biochemistry, genetics, molecular biology, computer science, and engineering in countries with large research systems is six times larger than the same index in countries with small research systems. The value of the index measuring the number of scientific publications per person in the population aged 15–64 is nearly 20 times higher in Large countries (0.039) than in Small countries (0.002). This indicates a much stronger development of science and of the scientific community in Large countries, which is expected to have positive spillovers to R&D in agriculture. Nonetheless, the gap in research output between large LMICs and HICs remains large, with HICs producing more than 10 times more publications on a per capita basis than Large LMICs.
Table 3 also illustrates significant differences of about 60% in the innovation environment between countries with small and large systems. This means that countries in the group of small systems demonstrate lower competition in local markets, more expensive financial services, sparser access to credit, and lower R&D investment and staff training, all of which are factors that are congruent with a less developed and less competitive private sector.
4.2. Productivity, costs, and scale of agricultural research
Table 4 compares the agricultural research indicators of the average country with large, medium, and small R&D systems, providing descriptive statistics on agricultural R&D investment, the total number of agricultural researchers, and enrollment in tertiary education. The table shows that countries with small systems spend on average 43 million PPP dollars per year on agricultural R&D and employ 293 full-time equivalents (FTE) researchers. This compares to 353 million dollars and 1.3 thousand researchers in countries with medium-size research systems, and close to 2.0 billion dollars and 13,000 researchers in countries with large agricultural research systems.
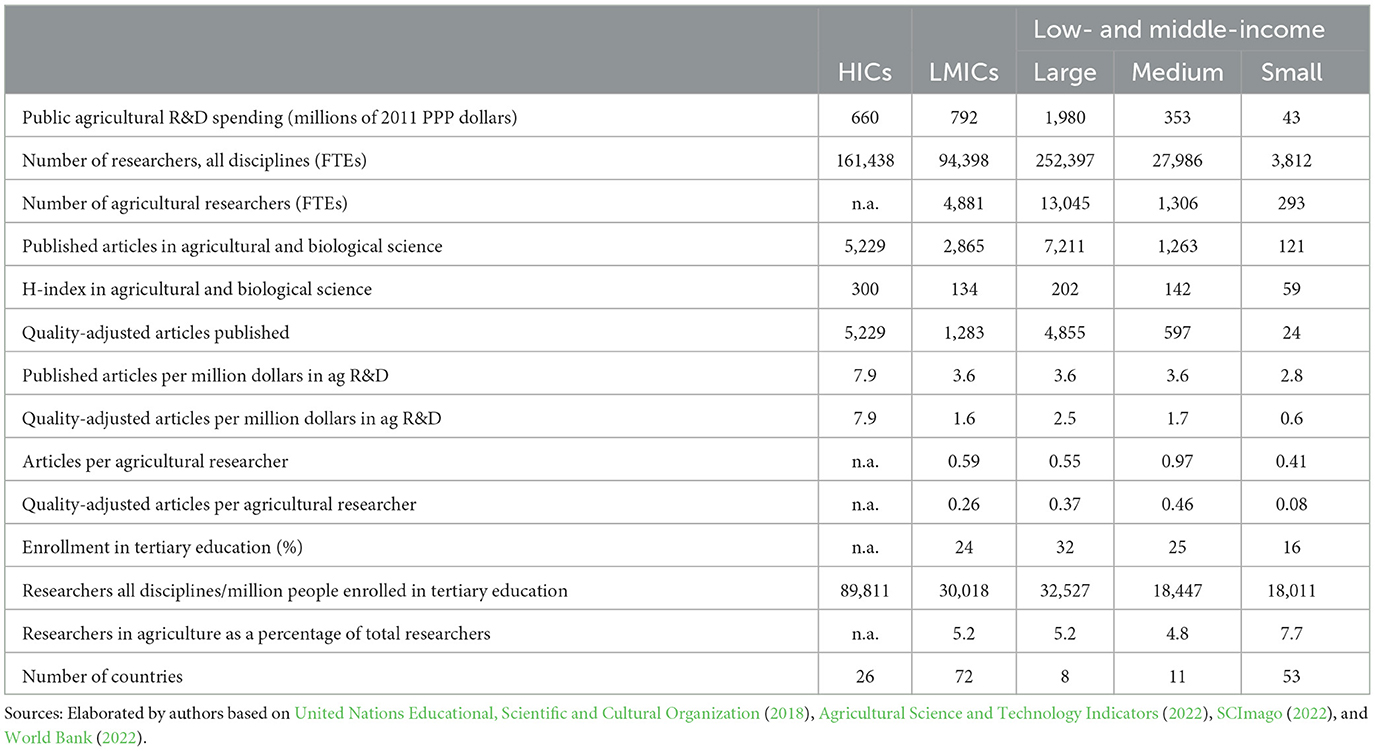
Table 4. Agricultural R&D input and output indicators of HICs and LMICs grouped by the size of their research systems, 2011–2016.
The number of published articles in agricultural and biological science is used in Table 4 as an indicator of the scientific production of research systems. Publications are only one type of research output, others being new crop varieties, improved livestock breeds, new inputs, and intangibles like new processes and more efficient ways to allocate resources and manage the production process. Data on these other research outputs are not available for country comparisons at this level, but it is assumed that scientific outputs like published articles are a by-product of research on new technologies and reflect the productivity and quality of the research being conducted in the country. In that respect, they are a useful indicator for this analysis. The number of published articles in agricultural and biological science per million dollars spent on agricultural R&D totaled nearly 8.0 in HICs, 3.6 in both Large and Medium LMICs, and 2.8 in Small LMICs. Researchers in countries with large research systems published on average four times more articles per year than their colleagues in countries with small research systems.
These differences in productivity and the cost of research outputs cannot solely be attributed to differences in the size of the research system. This is evident from the comparison of the number of articles per million PPP dollars spent on agricultural research between HICs and LMICs. The agricultural research system is larger in the average LMIC than in the average HIC, but R&D spending per publication in HICs is only half the LMIC (and one-third of the average Small LMIC).
One of the explanations for the differences in productivity and research costs between HICs and LMICs beyond size is the quality and development of the national scientific research system. Note that the average HIC employs almost 90,000 FTE researchers across all disciplines for every million people enrolled in tertiary education, compared to 30,000 in the average LMIC and 18,000 in the average Small LMIC. This can be an indication that agricultural research in HICs benefits from a higher overall level of science development, a greater critical mass, and better and more effective research networks. Evidence of these differences is the impact and quality of research measured by the H-index for agricultural and biological science. The value of the index is 300 in the average HIC, 134 in the average LMIC, 202 in the average Large LMIC, and only 59 in the average Small LMIC. Adjusting the number of publications proportionally by “quality” using the H-index further enlarges the research productivity gap measured by publications per researcher or per dollar spent between HICs and Large LMICs. In quality-adjusted terms, the average LMIC publishes 1.6 articles per million dollars spent on agricultural R&D compared to 7.9 articles in HICs and just 0.6 articles in the average Small LMIC.
Results so far have shown that low research productivity is prevalent among countries with small agricultural research systems. Two main factors are associated with low productivity in research: the presence of economies of scale in the production of knowledge and the quality of research and human capital at the national level. In what follows, we look in more detail at these two factors and examine the structural nature of low productivity and underinvestment in agricultural research in countries with small research systems.
Figure 7 plots the number of published articles in agricultural and biological science against agricultural R&D investment. Outputs increase exponentially when countries invest more than 100 million PPP dollars per year, and differences between countries investing more than 100 million dollars per year and those investing less are highly significant. The average spending per published article in countries investing <100 million PPP dollars in agricultural R&D was 514,000 dollars. The equivalent for countries spending more than 400 million PPP dollars was 308,000 dollars and only 123,000 dollars in HICs. Although these numbers only refer to published articles, there is evidence that they also apply to other research outputs. For example, Jin et al. (2005) found strong economies of scale for both wheat and maize research institutes in China. Their results show that if the number of new varieties produced increases by 10%, research costs increase by no more than 3.2%.
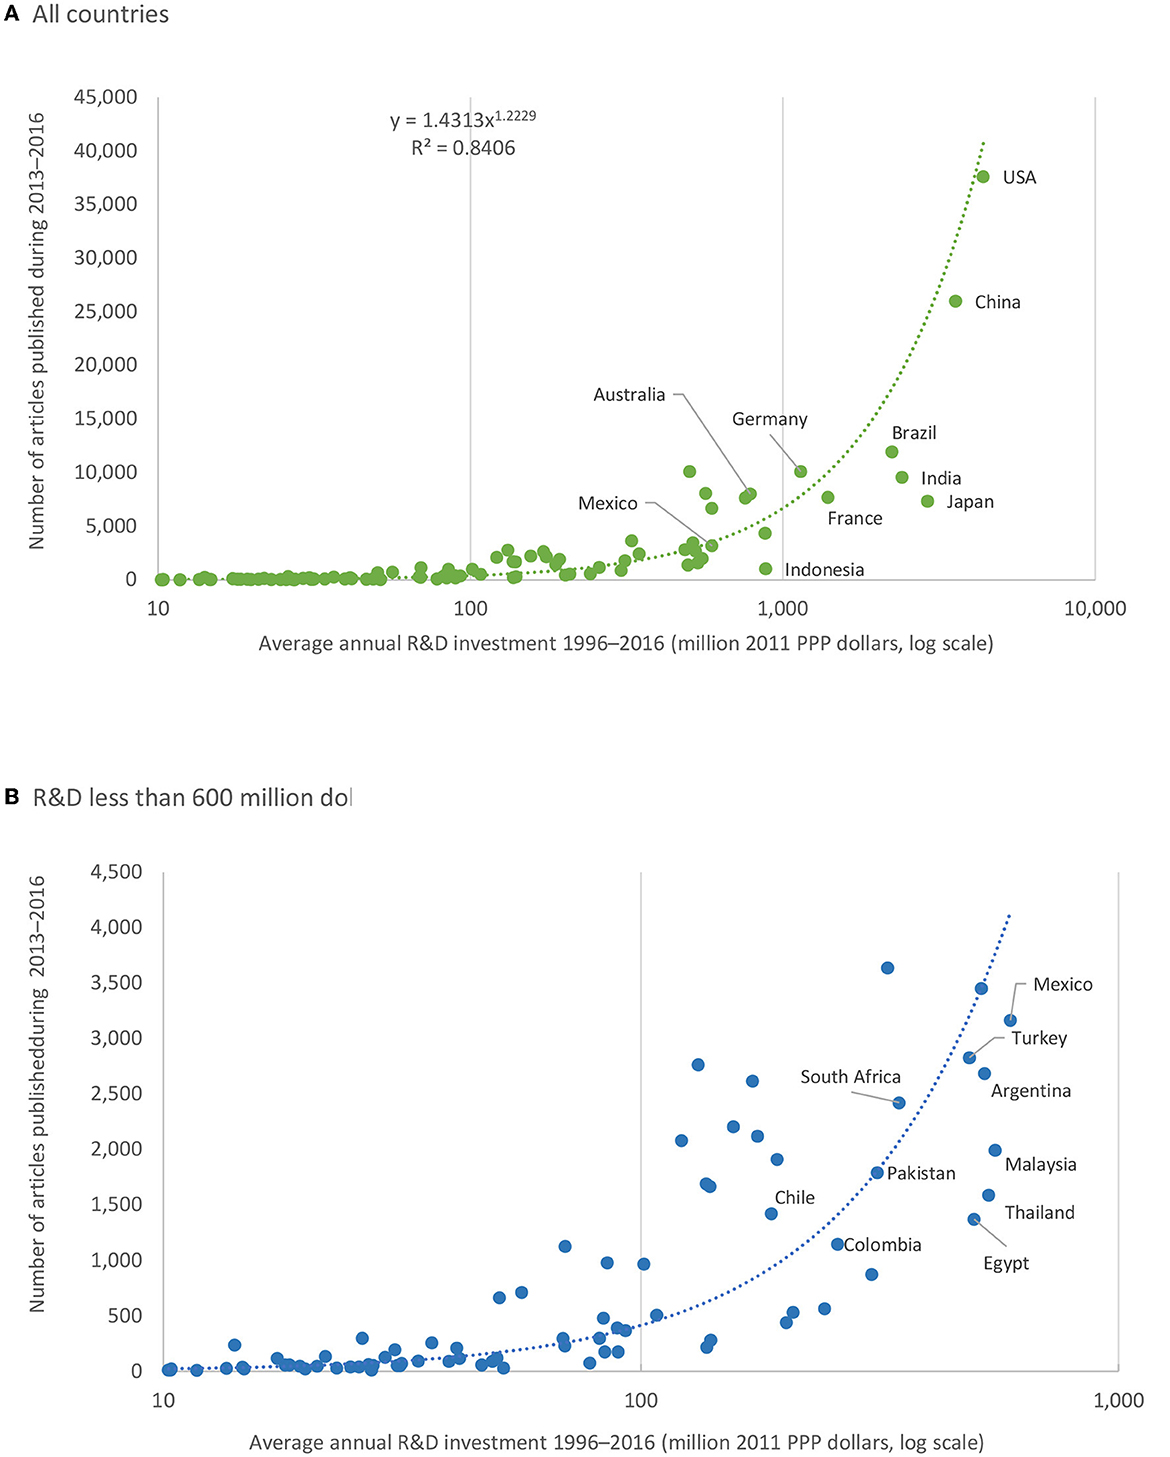
Figure 7. Size of the agricultural research system measured in dollars of R&D spending vs. the number of scientific publications in agricultural and biological science. (A) All countries. (B) Countries investing less than 600 million. PPP$ in agricultural research. Sources: Elaborated by authors based on Agricultural Science and Technology Indicators (2022) and SCImago (2022).
Despite the limited resources that Small LMICs allocate to agricultural research, they still need to spread these resources across a similar number of research areas and activities as countries with larger research systems, limiting the breadth and quality of research and resulting in low critical mass in specialty areas. Figure 8 shows that the number of researchers in countries with small research systems is only a fraction of that in countries with large research systems. For example, while the average Large LMIC allocates more than a thousand researchers to livestock and 600 researchers to cash crops, those numbers in Small LMICs average only 69 and 32, respectively.
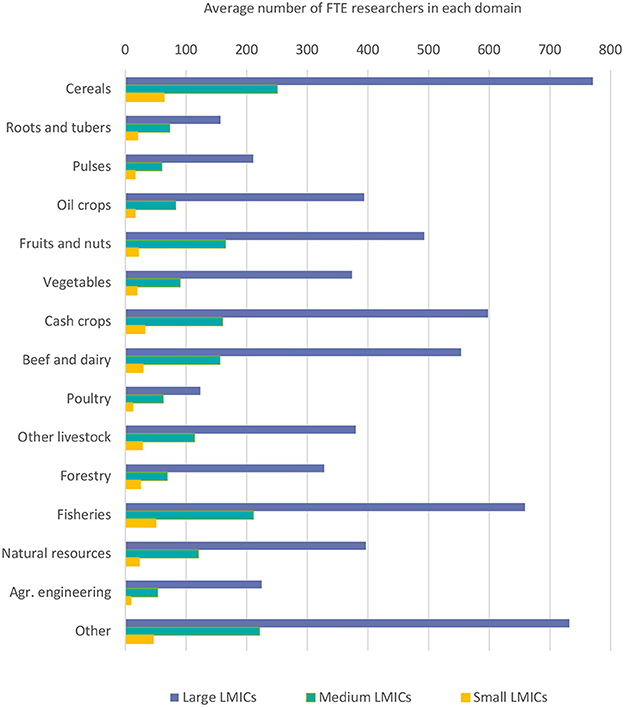
Figure 8. Average number of FTE researchers allocated to different research activities in LMICs with large, medium, and small agricultural research system, 2011–2016. Source: Elaborated by authors based on Agricultural Science and Technology Indicators (2022).
At present, agricultural research in LMICs must respond to an ever-increasing demand that includes increased productivity and output quality; the development of new technologies that make sustainable use of natural resources; adaptation to and mitigation of climate change; responding to shifting consumer demands in terms of diets and food safety; and satisfying the demand for new product characteristics demanded by food processing industries, transportation and distribution systems, retailers, or by consumers in export markets. In addition, donors and other stakeholders are demanding that R&D contributes to poverty and inequality reduction and nutritional goals; and even that R&D strategies aimed at poverty reduction must take a broad variety of smallholders with very different resources, livelihoods, and needs into account (see Hazell, 2019 and the discussion in Tomich et al., 2019a).
These ever-increasing demands on research systems do not take into consideration the challenges that LMICs are facing to increase R&D investment. Any attempt to increase R&D investment in countries with small research systems is faced with structural constraints that can contribute to increased research costs and inefficiencies. Agricultural research represents only a part—in many countries a small one—of the national scientific research system, which in turn is highly dependent on the extent and quality of the education system. Low years of schooling, low enrollment rates, and low quality of education affect the quality of research by constraining the overall supply of researchers in all areas, including agriculture, and could result in increased salary costs rather than improved research capacity (Goolsbee, 1998).
To get a better sense of the structural constraints faced by LMICs when it comes to increasing agricultural R&D, we regress agricultural R&D against different structural variables based on the following three assumptions. First, R&D spending on agriculture should be proportional to the total number of researchers across all disciplines. This is trivial given that the number of researchers in agriculture is a fraction of researchers in all disciplines, and that the salary costs of researchers are a major component of agricultural R&D spending. Second, the number of researchers in all R&D disciplines should be proportional to the number of people enrolled in tertiary education, as qualified scientists are an important output of the education system. Finally, the number of people enrolled in tertiary education is, by definition, a proportion of the number of people aged 18–24. What is important here is that the size of this proportion depends on the extent and development of the education system and the number of years of schooling, which in turn depend on a country's income level and other factors correlated with economic development. Based on these assumptions, the top half of Table 5 shows the results of regressing the number of researchers in all R&D disciplines against enrollment in tertiary education and related variables, while the bottom half presents coefficients from regressing spending in agricultural R&D against the total number of researchers across all R&D disciplines and other structural variables related to the development of the research system. As the log of the variables is used in the regression, the coefficients in the table express the percentage change in the dependent variable as the result of a 1% change in the independent variables.
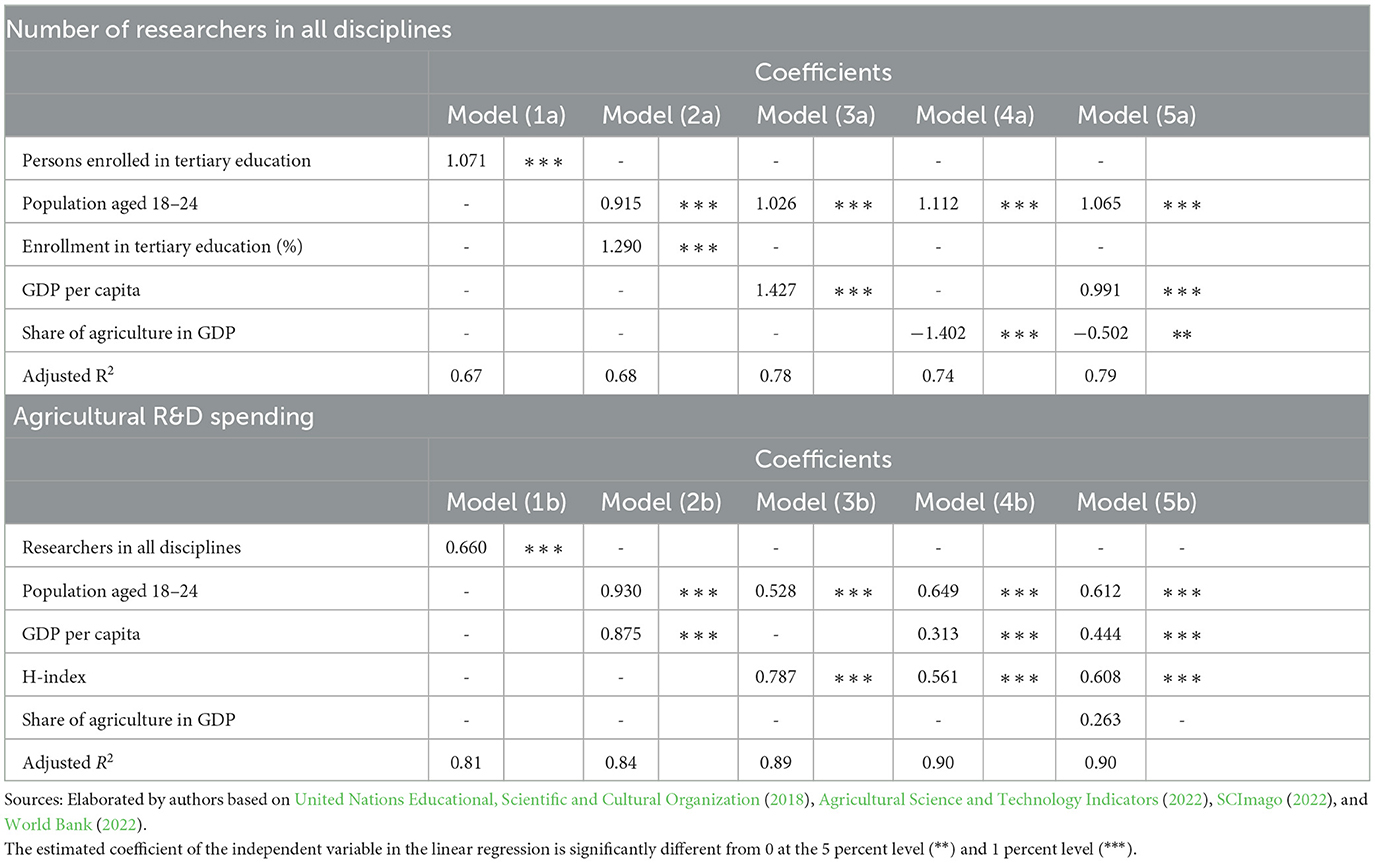
Table 5. Coefficients and R2 obtained from regressing the log of the number of researchers in R&D in all disciplines and agricultural R&D spending against the log of different explanatory variables, average values 2011–2016.
Results in Table 5 show that there is a high correlation between the total number of researchers in all scientific research disciplines and the number of people enrolled in tertiary education (Model 1a). The coefficient indicates that a 1% increase in the number of people enrolled in tertiary education results in a 1.07% increase in the number of researchers. Model 2a replaces the number of people enrolled in tertiary education (NE3) with the total population aged 18–24 (P18 − 24) and the percentage of people enrolled (E%), given that, by definition, NE3 = (P18 − 24×E%). Unlike the number of people aged 18–24, the proportion of people enrolled does not depend on the size of the population, but rather on income and economic development. Model 2a shows that when controlling for the size of the population, a 1% increase in the rate of enrollment in tertiary education results in almost a 1.3% increase in the number of researchers. Given the high correlation between the percentage of enrollment and income level, Model 3a replaces enrollment with GDP per capita. Increasing per capita income by 1% results in an increase in the number of researchers by 1.4%. Models 4a and 5a include the share of agriculture in GDP, a variable that is negatively correlated with GDP per person. Model 5a is equivalent to Model 3a, but it includes the share of agriculture in GDP. The estimated coefficients of Model 5a indicate that when controlling for population and GDP per person, a reduction of 1% in the share of agriculture in GDP results in an increase of 0.5% in the number of researchers.
The bottom half of Table 5 shows coefficients and R2 of regressing agricultural R&D spending against the total number of researchers in all scientific research disciplines. Model 1b shows that the correlation between agricultural R&D and the total number of researchers in all disciplines is high, with an R2 of 0.81 and an elasticity of 0.66, meaning that a 1% increase in the number of researchers in all disciplines is expected to be associated with a 0.66% increase in agricultural R&D investment. Models 2b to 5b replace the number of researchers in all disciplines with the structural variables used as independent variables in the regressions in the top half of Table 5: the number of people aged 18–24, GDP per capita, and the share of agriculture in GDP. The H-index of biological, computer, and engineering sciences is also included as a measure of the quality and development of research in the country. Coefficients obtained with Model 5b indicate that agricultural R&D spending is positively related to a country's income level and the quality and development of its scientific research as measured by the H-index. The coefficient of the share of agriculture in GDP is positive but it is not significantly different from zero.
The evidence points to what appears to be three major challenges faced by small LMICs (which represent the majority of LMICs) to increase agricultural R&D investment notwithstanding widespread evidence of high rates of return. The first of these challenges is the underdevelopment of science and the small size of agricultural research systems in these countries, important factors that contribute to high average costs per unit of output and low overall research productivity. Second, LMICs with small agricultural research systems have a lower capacity to innovate, not only because of their less developed research and education systems but also because of a poor innovation environment, which in turn is correlated with the underdevelopment of the food system. Finally, most of the Small LMICs are SSA countries that have made slow progress in the process of structural transformation. They are still characterized by a high share of agriculture in employment and GDP, lower incomes, and traditional food systems with short value chains, poor market development, a weak private sector, lack of competition in domestic markets, and a large and diverse rural population that consists mostly of smallholders with poor links to markets. Small LMICs with a weak private sector and fragile links in the value chain face more difficulties and uncertainties to transform agricultural R&D into innovations, because as Reardon et al. (2019) put it, the private sector in the food system is the centerpiece of the supply chain that delivers innovations, determining the transformation of the entire food system.
In this context, it is not surprising to see underinvestment and slow growth of agricultural R&D in LMICs with small agricultural research systems. From a political perspective, two characteristics of agricultural research that affect public R&D investment are worth mentioning here: the time lag between allocating R&D funding and the realization of its outputs and subsequent returns; and the collective-action problem in R&D advocacy (Mogues, 2015). First, agricultural research is a long-term and risky activity with potentially high payoffs sometime in the future that could benefit a large and diffuse group of producers or consumers. These potential beneficiaries of research are unlikely to attribute benefits to research that was conducted years ago and transfer their voting allegiances accordingly. As a result, there is likely to be little incentive for governments to allocate a high share of the public budget to research (Harris and Lloyd, 1990).
The collective action problem in agricultural research refers to the costs of coordinating societal groups to advocate collectively for certain types of public investment or public policies. As argued by Benin et al. (2016), a small group of well-informed and educated beneficiaries with more economic resources is in a better position to assess which policies they should support, and which are detrimental to the group's economic interests, and coordinate actions to support policymakers who allocate public resources to the group's preferred activities. This is the opposite of what is observed in Small underinvesting LMICs with a large number of dispersed farmers that are less well-informed and educated, and who have fewer resources to financially support policymakers. Adding to this, and because agriculture represents a bigger share of the total economy in Small LMICs, meaningful investment in public agricultural research might impose a much higher cost on individual citizens, further diminishing the political appeal of supporting agricultural R&D. As Harris and Lloyd (1990) put it more than 30 years ago:
“…private research is hampered by pervasive market failure, while public research is a long-term and expensive activity which is politically ‘unprofitable.' It would be surprising if a combination of market failure and ‘government failure' did not produce high rates of return.”
Note that the characteristics of agricultural research mentioned above apply to all countries, but that the problem is exacerbated in Small LMICs because of weak research systems that increase the risk of research outputs and low capacity to innovate, which reduces the chances of transforming new knowledge into innovation and impact.
5. Discussion
This article revisited the debate around agricultural R&D underinvestment in LMICs with new data and methods to provide a better understanding of the structural factors behind agricultural R&D investment, innovation capacity, and food system development. The results revealed that the development of the food system is strongly correlated to a country's research and innovation capacity. Larger LMICs like China, India, Malaysia, Pakistan, and Thailand in Asia; Argentina, Brazil, Chile, Colombia, and Mexico in LAC, and South Africa in SSA, have demonstrated a higher capacity to innovate, based on the higher quality of their education and science and technology systems, a more favorable innovation environment as well as more developed food systems with longer and more integrated food value chains. The better innovation environment in these countries reduces risks of public investment in R&D and creates opportunities for private investment at different segments of the value chain, while allowing public investment to play a more strategic role focusing on politically strategic subsectors or in areas where market failures persist.
In contrast, the results also showed that LMICs with small agricultural research systems, many of which are in SSA, have less developed food systems and a low capacity to innovate. The overall share of agriculture in these countries' GDP and employment has remained relatively high, while diets remain less diversified, and value chains shorter. A higher proportion of the value added by these chains is generated by farms, which use relatively low levels of capital inputs and demonstrate lower levels of land and labor productivity compared to farms in countries with more developed food systems. Low enrollment and quality of the education system are constraining the supply of researchers, while low levels of local competition, poor and expensive services, and restricted access to credit are additional factors holding back these countries with less-developed food systems in their capacity to innovate. Adding to this, the scarce resources of research systems in smaller LMICs are spread very thinly over a wide range of demands increasing the inherent risks of agricultural research and the quality of the final research outputs. The cost of research per unit of output is estimated to be up to four times lower in HICs than in LMICs with small agricultural R&D systems, pointing to important inefficiencies in the latter group.
The fact that the results show that research and innovation capacity are highly correlated to the overall development of the food system is hardly surprising. However, it brings us back to the chicken-and-egg problem raised in the introduction of this article. Why do we continue to expect small developing economies to invest more in agricultural research if the R&D value chain in these countries faces potentially the same or more market and government failures than other investments that contribute to development like investments in infrastructure, education, and health? Or equivalently, why do we expect that an endogenous factor that is in part an explanation of underdevelopment, should become the solution to it? Gollin (2020) provides an answer to this question by referring to a recent set of papers analyzing the impacts of the Green Revolution. According to Gollin, those papers emphasize the fact that the Green Revolution served as an essentially exogenous productivity shock to recipient countries because of the very specific nature of the scientific advances involved. The presence of this exogenous shock could explain, at least in part, the success of the Green Revolution and how NARS, working with international centers, were able to overcome the limited availability of resources and low productivity of research in LMICs.
These developments of the past raise the question: Can the Green Revolution be repeated today if only the right technological innovations can be found? If the answer to this question is “yes,” then the limited availability of resources and limited research capacity in LMICs would be less of a constraint than the results presented in the previous sections suggest. If the answer is “no,” there is an urgent need to find new strategies for LMICs to access the technologies they need while simultaneously revamping agricultural research systems to increase their productivity and facilitate investment, given structural constraints. Gollin (2020) goes to great lengths to show that the historical experience of the Green Revolution is not replicable. This does not mean that new advances in biology and information technology would be less effective than the Green Revolution in the transformation of agriculture. On the contrary, the transformation of agriculture is already ongoing. The problem is that in the context of this new technological revolution in agriculture, the limited availability of resources and limited research capacity in LMICs threatens to widen the technological gap between poor and rich countries. This is because the nature of the scientific advances involved is quite different from those during the Green Revolution and also because of the significant changes in the economies of LMICs.
For a start, today's LMICs are more urbanized and less dependent on agriculture than the countries that benefited most from the early Green Revolution, while urban diets today are more diverse and less dependent on local supplies than was true for rural diets in Asia during the Green Revolution. Gollin (2020) argues, for instance, that urbanization and improvements in infrastructure have put African cities within plausible reach of food imports and made them far less dependent on their surrounding agricultural hinterlands. This has allowed urban consumers to rapidly shift from consuming foods produced in rural areas to consuming processed, prepared, and convenience foods that are mostly imported, a striking difference from Asia in the 1960's when urban consumers simply wanted larger quantities of grains. Producers, on the other hand, are often interested in reducing labor demand to free up time for off-farm activities rather than seeking yield increases. This process has led to an emerging disconnect between urban consumption and rural production, making agricultural growth more dependent on external markets for cash crops, rather than on domestic markets for food crops. Gollin concludes that in this context, the Green Revolution may not be easy to replicate. How can smaller LMICs then overcome the human capital, cost, and low productivity challenges related to the small scale of their agricultural research systems?
Several decades of persistent underinvestment despite widespread evidence of high rates of return shows that there is no simple formula to break the vicious circle of market and government failure in agricultural research. Economies of scale in knowledge accumulation and dissemination appear to be significant, so in most cases, LMICs aiming to conduct most of their research themselves may be too small to achieve an efficient scale in many, if any, of their R&D priority areas. Slow TFP growth of agriculture in these economies also suggests innovation problems beyond research. For example, limited adoption of improved crop varieties and livestock breeds, and practices could also indicate a broken R&D value chain where available technologies do not reach the end-user or, if they do, they are only partially adopted.
Offering solutions to a problem of this magnitude and complexity is well beyond the scope of this study, but results suggest some general principles to be applied in the future by small LMICs. First, the adoption of a food systems lens, as suggested by Reardon et al. (2019)—rather than a much narrower agricultural sector lens—is needed to provide new insights into the long-term impact of agricultural research, its synergies with multiple sources of activity within and outside agriculture, and its multiplying effects on growth. Second, a broad perspective of innovation is also needed given that agricultural research is one but not the only source of knowledge feeding the innovation process. As discussed by Harris and Kells (1997), if public and private R&D are seriously constrained, as in the case of LMICs with small research systems, policy actions designed to enhance the dissemination and diffusion of knowledge (spillover effects) may be a greater policy issue than the production of knowledge (R&D). In this respect, if large LMICs sustain fast growth of R&D investment in the coming decades, they can play a major role as sources of knowledge spillovers for small LMICs, making up for the dwindling investment in HICs.
As most countries will continue to conduct public R&D in agriculture, there is a need to increase the productivity of research by getting the most out of available resources and minimizing the negative effect of small-scale operations. Two complementary approaches could contribute to increasing productivity in research systems. The first one is to strengthen universities and government research institutions and innovation capacity in the private sector through policies and investments. A possible way forward is through a more strategic definition of research priorities, narrowing the research focus, organizing research around problems and not commodities or thematic areas, and adapting research institutions and governance of public research to these changes. The second approach is to increase coordination and integration between NARS and regional and global research organizations to overcome resource constraints, help avoid duplication, increase productivity of small-scale organizations, and thus make research more cost-effective. Defining research priorities is key, and prioritization necessarily implies the exclusion of everything that is not a priority for the country.
The issue of increasing coordination and integration of research organizations is not new. It has been argued before that closer integration of agricultural R&D at the subregional and regional level (through joint research programs and regional centers of excellence) is indispensable, given that it allows countries with less developed agricultural research and food systems to benefit from the gains made in countries with similar agro-ecological conditions and more advanced systems. However, the challenges to implementing an institutional reform, and coordinating national, regional, and international research organizations and other stakeholders with multiple demands and political interests could be a daunting task. Research integration and coordination bring a new set of issues to the table, that go from the contradictory research goals for regional, country, and local research, to governance, institutional and political conflicts in the organization of research and control and allocation of funding (see discussion in Sumberg, 2005). Implementing these institutional changes will require much more emphasis on collaboration, partnership, and strategic alliances with a high degree of stakeholder ownership around a shared vision.
For research coordination to work, Clark (2002) suggests that the interaction between partners should work like that of well-organized and cooperative “knowledge markets,” which are central to the conception of innovation systems. According to Clark, formal, rulebound, and hierarchical systems where cooperation is viewed with resentment and suspicion, are unlikely to make a positive impact. In most cases, ineffective collaboration results in more organizations, requiring more overheads, chasing the same money, and fewer resources available to fund research. To avoid problems observed in the past, Tomich et al. (2019b) indicate that new institutions for research collaboration will require much flatter governance structures, linking local and global agendas, and enhancing national government interests and research capacities through multi-stakeholder partnerships rather than establishing new parallel and competing arrangements.
To conclude, the sustainable transformation of food systems in LMICs will undoubtedly need technical change and higher R&D investment. The question facing LMICs with small research systems is how to achieve this. Greater emphasis will need to be put on assessing where an additional dollar has the largest impact and what kind of institutions, networks, and mechanisms will help to effectively align country, regional, and global research goals to define, implement, and fund research agendas that will ultimately produce higher research impact.
We consider this study a first step in the analysis of R&D investment and innovation in LMICs. Based on our findings, future research will contribute to a better understanding of the relationships between structural factors determining agricultural research and the direction of causation between them through modeling and regression analysis.
Data availability statement
The original contributions presented in the study are included in the article/Supplementary material, further inquiries can be directed to the corresponding author.
Author contributions
AN-P and G-JS contributed to the design and implementation of the research, to the analysis of the results, and to the creation of the tables and graphs as well as the writing of the manuscript. Both authors contributed to the article and approved the submitted version.
Funding
This work was supported by the CGIAR Initiative on Foresight, the Micronutrient Action Policy Support (MAPS) project funded by the Bill and Melinda Gates Foundation, as well as contributions from the Inter-American Development Bank and the United States Agency for International Development to the International Food Policy Research Institute's (IFPRI's) Agricultural Science and Technology Indicators (ASTI) Program.
Conflict of interest
The authors declare that the research was conducted in the absence of any commercial or financial relationships that could be construed as a potential conflict of interest.
Publisher's note
All claims expressed in this article are solely those of the authors and do not necessarily represent those of their affiliated organizations, or those of the publisher, the editors and the reviewers. Any product that may be evaluated in this article, or claim that may be made by its manufacturer, is not guaranteed or endorsed by the publisher.
Supplementary material
The Supplementary Material for this article can be found online at: https://www.frontiersin.org/articles/10.3389/fsufs.2023.1051356/full#supplementary-material
Footnotes
1. ^For example, to look at differences in the number of publications in agricultural and biological science by group, the groups of countries with large, medium, and small research systems are defined by the average R&D investment of each country at the beginning of the period (1996–2000). The number of publications of these three groups presented in the results represents articles published between 2000 and 2016 by countries in each group.
2. ^The purpose of defining a Medium group is to clearly separate the two extreme groups: Large and Small. A different group classification could be to include countries above median R&D investment in the Medium group. Nonetheless, the conclusions of the analysis would remain the same. If the Medium group is merged with the Large group, differences between Small and Large would still be large and significant. If the Medium group is expanded to include some of the larger countries from the small group, differences between Small and Large would increase.
References
Alston, J. M., Marra, M. C., Pardey, P. G., and Wyatt, T. J. (2000). Research returns redux: A meta-analysis of the returns to agricultural R&D. Austral. J. Agri. Resour. Econ. 44, 185–215. doi: 10.1111/1467-8489.00107
Beintema, N., Nin-Pratt, A., and Stads, G. J. (2020). Key Trends in Global Agricultural Research Investment. ASTI Program Note. Washington, DC: International Food Policy Research Institute.
Benin, S., McBride, L., and Mogues, T. (2016). “Why do African countries underinvest in agricultural R&D?” in Agricultural Research in Africa: Investing in Future Harvests, eds J. Lynam, N. Beintema, J. Roseboom, O. Badiane (Washington, DC: International Food Policy Research Institute, IFPRI), 109–138.
Clark, N. (2002). Innovation systems, institutional change and the new knowledge market: Implications for third world agricultural development. Econ. Innov. N. Technol. 11, 353–368. doi: 10.1080/10438590200000004
Diaz-Bonilla, E., Orden, D., and Kwieciński, A. (2014). Enabling Environment for Agricultural Growth and Competitiveness: Evaluation, Indicators and Indices, OECD Food, Agriculture and Fisheries Papers, No. 67. Paris: OECD Publishing.
Evenson, R. E. (2001). Economic impacts of agricultural research and extension. Handb. Agri. Econ. 1, 573–628. doi: 10.1016/S1574-0072(01)10014-9
FAO (2022). Food and Agriculture Organization of the United Nations. FAOSTAT Database. Available online at: https://www.fao.org/faostat/en/#data (accessed June, 2022).
Fuglie, K. (2016). The growing role of the private sector in agricultural research and development world-wide. Glob. Food Secur. 10, 29–38. doi: 10.1016/j.gfs.2016.07.005
Gollin, D. (2020). Agricultural Productivity and Structural Transformation: Evidence and Questions for African Development. CEPR STEG Pathfinding Paper. Available online at: https://steg.cepr.org/publications/agricultural-productivity-and-structural-transformation-evidence-and-questions-african
Goolsbee, A. (1998). Does Government R&D Policy Mainly Benefit Scientists and Engineers? NBER Working Paper No. 6532. Cambridge, MA: National Bureau of Economic Research.
Harris, M., and Kells, S. S. (1997). Knowledge Spillovers, Location, and Growth: Theory and Evidence. Working Paper No. 6/97. Carlton, VIC: Melbourne Institute of Applied Economic and Social Research.
Harris, M., and Lloyd, A. G. (1990). “The returns to agricultural research and the underinvestment hypothesis—A survey,” in 1990 Conference (34th), February 13–15. Brisbane, QLD: Australian Agricultural and Resource Economics Society.
Hazell, P. B. (2019). “Urbanization, agriculture, and smallholder farming,” in Agriculture & Food Systems to 2050. Global Trends, Challenges and Opportunities, eds R. Serraj and P. Pingali (Singapore: World Scientific Publishing), 137–160. doi: 10.1142/9789813278356_0004
James, J. S., Pardey, P. G., and Alston, J. M. (2008). Agricultural R&D Policy: A Tragedy of the International Commons. Minneapolis, MN: University of Minnesota Department of Applied Economics: Staff Paper Series.
Jin, S., Rozelle, S., Alston, J., and Huang, J. (2005). Economies of scale and scope and the economic efficiency of China's agricultural research system. Int. Econ. Rev. 46, 1033–1057. doi: 10.1111/j.1468-2354.2005.00356.x
Mason-D'Croz, D., Sulser, T. B., Wiebe, K., Rosegrant, M. W., Lowder, M. W., Nin-Pratt, S. K., et al. (2019). Agricultural investments and hunger in Africa modeling potential contributions to SDG2 – Zero Hunger. World Dev. 16, 38–53. doi: 10.1016/j.worlddev.2018.12.006
Mogues, T. (2015). Political economy determinants of public spending allocations: A review of theories, and implications for agricultural public investment. Eur. J. Dev. Res. 27, 452–473. doi: 10.1057/ejdr.2015.35
Nin-Pratt, A. (2021). Agricultural R&D investment intensity: A misleading conventional measure and a new intensity index. Agri. Econ. 52, 317–328. doi: 10.1111/agec.12620
Porter, M. E., and Stern, S. (2001). National innovative capacity. Glob. Competitiv. Rep. 2002, 102–118.
Rao, X., Hurley, T. M., and Pardey, P. G. (2019). Are agricultural R&D returns declining and development dependent? World Develop. 122, 27–37. doi: 10.1016/j.worlddev.2019.05.009
Reardon, T., Echeverria, R., Berdegué, J., Minten, B., Liverpool-Tasie, L., Tschirley, D., et al. (2019). Rapid transformation of food systems in developing regions: Highlighting the role of agricultural research. Agri. Syst. 172, 47–59. doi: 10.1016/j.agsy.2018.01.022
Roseboom, J. (2003). Optimizing Investment in Agricultural Research, or the Quest for Prosperity. Research Report 23. The Hague: ISNAR.
Rosegrant, M. W., Sulser, T. B., Mason-D'Croz, D., Cenacchi, N., Nin-Pratt, A., Dunston, S., et al. (2017). Quantitative Foresight Modeling to Inform the CGIAR Research Portfolio. Project Report for USAID. Washington, DC: International Food Policy Research Institute (IFPRI). Available online at: http://ebrary.ifpri.org/cdm/ref/collection/p15738coll2/id/131144 (accessed March, 2022).
Schwab, K. (2018). The Global Competitiveness Report 2018. World Economic Forum. Available online at: https://www3.weforum.org/docs/GCR2018/05FullReport/TheGlobalCompetitivenessReport2018.pdf
Schwab, K. (2019). The Global Competitiveness Report 2019. World Economic Forum. Available online at: http://www3.weforum.org/docs/WEF_TheGlobalCompetitivenessReport2019.pdf (accessed March, 2022).
SCImago (2022). SJR — SCImago Journal & Country Rank [Portal]. Available online at: http://www.scimagojr.com (accessed November, 2021).
Spielman, D. J., and Birner, R. (2008). How Innovative Is Your Agriculture? Using Innovation Indicators and Benchmarks to Strengthen National Agricultural Innovation Systems. Washington, DC: World Bank. Available online at: https://documents1.worldbank.org/curated/en/696461468316131075/pdf/448700NWP0Box327419B01PUBLIC10ARD0no1041.pdf (accessed November, 2021).
Stads, G. J., Wiebe, K. D., Nin-Pratt, A., Sulser, T. B., Benfica, R., Reda, F., et al. (2022). “Research for the future: Investments for efficiency, sustainability, and equity,” in IFPRI book chapters, in 2022 Global Food Policy Report: Climate Change and Food Systems, Chapter 4, pages 38–47. Washington, DC: International Food Policy Research Institute (IFPRI). doi: 10.2499/9780896294257_04
Sumberg, J. (2005). Systems of innovation theory and the changing architecture of agricultural research in Africa. Food Pol. 30, 21–41. doi: 10.1016/j.foodpol.2004.11.001
Tomich, T. P., Lidder, P., Coley, M., Gollin, D., Meinzen-Dick, R., Webb, P., et al. (2019b). Food and agricultural innovation pathways for prosperity. Agri. Syst. 172, 1–15. doi: 10.1016/j.agsy.2018.01.002
Tomich, T. P., Lidder, P., Dijkman, J., Coley, M., Webb, P., and Gil, M. (2019a). Agri-food systems in international research for development: Ten theses regarding impact pathways, partnerships, program design, and priority-setting for rural prosperity. Agri. Syst. 172, 101–109. doi: 10.1016/j.agsy.2018.12.004
United Nations Educational Scientific Cultural Organization (UNESCO). (2018). Montreal, the UNESCO Institute for Statistics (UIS) Statistics Database. Available online at: http://data.uis.unesco.org/
United States Department of Agriculture Economic Research Service. (2022). International Agricultural Productivity Database. Available online at: http://www.ers.usda.gov/data-products/international-agricultural-productivity/ (accessed June, 2022).
World Bank (2006). Enhancing Agricultural Innovation: How to Go Beyond the Strengthening of Research Systems. Washington, DC: World Bank.
World Bank (2022). World Development Indicators. Available online at: http://datatopics.worldbank.org/world-development-indicators/ (accessed June, 2022).
Keywords: agriculture, food system, innovation, research system, R&D investment
Citation: Nin-Pratt A and Stads G-J (2023) Innovation capacity, food system development, and the size of the agricultural research system. Front. Sustain. Food Syst. 7:1051356. doi: 10.3389/fsufs.2023.1051356
Received: 22 September 2022; Accepted: 10 February 2023;
Published: 06 March 2023.
Edited by:
Ruben G. Echeverria, Bill and Melinda Gates Foundation, United StatesReviewed by:
Pablo Pérez-Akaki, Monterrey Institute of Technology and Higher Education (ITESM), MexicoCarl Pray, Rutgers, The State University of New Jersey, United States
Copyright © 2023 Nin-Pratt and Stads. This is an open-access article distributed under the terms of the Creative Commons Attribution License (CC BY). The use, distribution or reproduction in other forums is permitted, provided the original author(s) and the copyright owner(s) are credited and that the original publication in this journal is cited, in accordance with accepted academic practice. No use, distribution or reproduction is permitted which does not comply with these terms.
*Correspondence: Gert-Jan Stads, Zy5zdGFkc0BjZ2lhci5vcmc=