 Angel Salazar-Rojas
 Ricardo Castro-Huerta
 Miguel Altieri
- 1Laboratorio de Historia de los Agroecosistemas, Departamento de Geografía, Historia y Filosofía, Universidad Pablo de Olavide, Sevilla, Spain
- 2Instituto Agroecosistemas, Curicó, Chile
- 3Facultad de Ciencias Agrarias y Forestales, Universidad Católica del Maule, Curicó, Chile
- 4Department of Environmental Science, Policy, and Management, University of California Berkeley, Berkeley, CA, United States
The simplification of the landscape as a consequence of the decrease in biodiversity and the adoption of monoculture production systems has led to a significant decrease in the provision of ecosystem services in the territory. The conversion of agroecosystems requires the adoption of agroecological techniques, which aim to design the agroecosystem as an integrated part of a vegetation matrix of the landscape, interconnecting the different production systems with the agricultural landscape. In order to measure the degree of connectivity of agroecosystems with the landscape, we used the Main Agroecological Structure (MAS) method, which was applied to 36 small agroecosystems of vegetable, livestock and fruit producers, which generally presented a low degree of connectivity. This allows us to evaluate the potential of these systems for agroecological transition, since being present in a moderately complex agricultural landscape gives important advantages over a more simplified system, allowing these producers to dispense with the use of many energy subsidies. This evaluation allows a first approximation to the quantification of the landscape matrix and will allow a comparison between agroecosystems or an evaluation of the evolution of the MAS over time. It is necessary to complement the MAS by quantifying the ecosystem services that may be associated with it.
1 Introduction
The intensification of agricultural systems has led to the simplification of landscapes, resulting in significant losses of biodiversity and associated ecosystem services (Gonthier et al., 2014; Campbell et al., 2017; IPBES, 2019; Sánchez-Bayo and Wyckhuys, 2019). A homogeneous landscape, ecologically simplified in structure and composition, results from large agricultural areas dominated by a few crop species (Margosian et al., 2009; Jonsson et al., 2015; Franzluebbers et al., 2020). The result has been the development of risk situations that exacerbate global food insecurity (Díaz-Hormazábal and González, 2016; Barrios et al., 2020; Bezner et al., 2021) because the poor provision of ecosystem services derived from the diminished biodiversity is subsidized through chemical inputs, which generate pollution to human and environmental health (Sabzevari and Hofman, 2022), soil fertility (Bünemann et al., 2018; Tibbett et al., 2020) and worsen pest and disease problems (Altieri and Nicholls, 2019).
The FAO urgently calls for the agroecological transformation of agricultural systems (FAO, 2018), as it will allow to increase the provision of ecosystem services to agriculture (Harrison et al., 2014; Tamburini et al., 2020) and ensure future food security (Bommarco et al., 2013) through agroecosystem designs that consider all levels or scales (Cappelli et al., 2022) for the integral development of the whole society (Vanbergen et al., 2020). The conversion of agroecosystems to agroecological management depends in part on the type of landscape matrix that surrounds them, since farm transformation involves the positioning of the agroecosystem and its connectivity relationship with the different types of semi-natural habitats that surround it (León-Sicard et al., 2018). Understanding the spatial and functional organization of this matrix of near-natural elements in interaction with agricultural structure is essential for promoting patterns and mechanisms which foster biodiversity and the provision of multiple ecosystem services by agricultural landscapes (Perfecto and Vandermeer, 2010; Marull et al., 2016, 2019; Cappelli et al., 2022).
Agroecology, through its methodological approach, initiates the analysis of agricultural sustainability from the farm scale [agroecosystem] (Guzmán and González de Molina, 2015), but it is necessary to scale this observation to spatial scales such as the landscape (Guzmán et al., 2018). The Main Agroecological Structure [MAS] of agroecosystems is an environmental index that includes ecosystem and cultural criteria, which allows visualizing some of the main relationships established between human groups [farmers] and their biophysical environment (Cleves-Leguízamo et al., 2017; Quintero et al., 2022). MAS uses metrics of composition, configuration, and heterogeneity of landscapes surrounding agroecosystems (León-Sicard et al., 2018), deriving key information to be taken into account when designing agroecosystems in the context of agroecological transition (Rudel, 2020; Vanbergen et al., 2020).
In this study, we use the MAS to perceive how the agrarian landscape is currently constructed and configured in the Chilean Mediterranean, a region where about 2 million people live in rural areas, occupying about 80% of the total land area (FAO, 2017; INE, 2017). This region of Chile has experienced profound geopolitical changes in the last four decades, which have reconfigured the landscape matrices in the region, as well as the agrarian structure and social relations (Kay, 1996, 2002), disrupting local economies, fragmenting and homogenizing the landscape, and exposing thousands of people to social and environmental risks in rural and surrounding urban areas (Armesto et al., 2010; Nahuelhual et al., 2012; Wratten et al., 2019).
In the face of growing evidence that agricultural sustainability at the agroecosystem scale largely depends on the management of the cultivated and uncultivated diversity of the surrounding landscape (Scherr and Mcneely, 2008; Garibaldi et al., 2016; Tamburini et al., 2020; Garibaldi et al., 2021), our hypothesis is that smallholder agroecosystems that use agroecological practices and are surrounded by a moderately heterogeneous matrix have better attributes to initiate the agroecological transition process at the community level. The objective of our study is to validate the MAS as a useful methodology for characterizing the landscape of the participating agroecosystems and how these are related to the application of agroecological practices, in a context of agroecological transition of a group of farmers in the Maule region, specifically the area near the commune of San Clemente, Chile.
2 Materials and methods
2.1 Study area
The Maule region is located within the Chilean Mediterranean (see Figure 1), and presents an area of 30296.1 km2, which represents 4.0% of the national surface, has a population of about 1 million inhabitants and a rich agrarian cultural diversity, where the rural population represents 33.6% of the regional total, about 330 thousand inhabitants (INE, 2017). It presents a warm and sub-humid climate of Mediterranean type, where there are four geomorphological zones: Andean Mountain range, intermediate depression, coastal mountain range and coastal plains. This allows the existence of native vegetation and the development of agricultural and forestry activities (ODEPA, 2018).
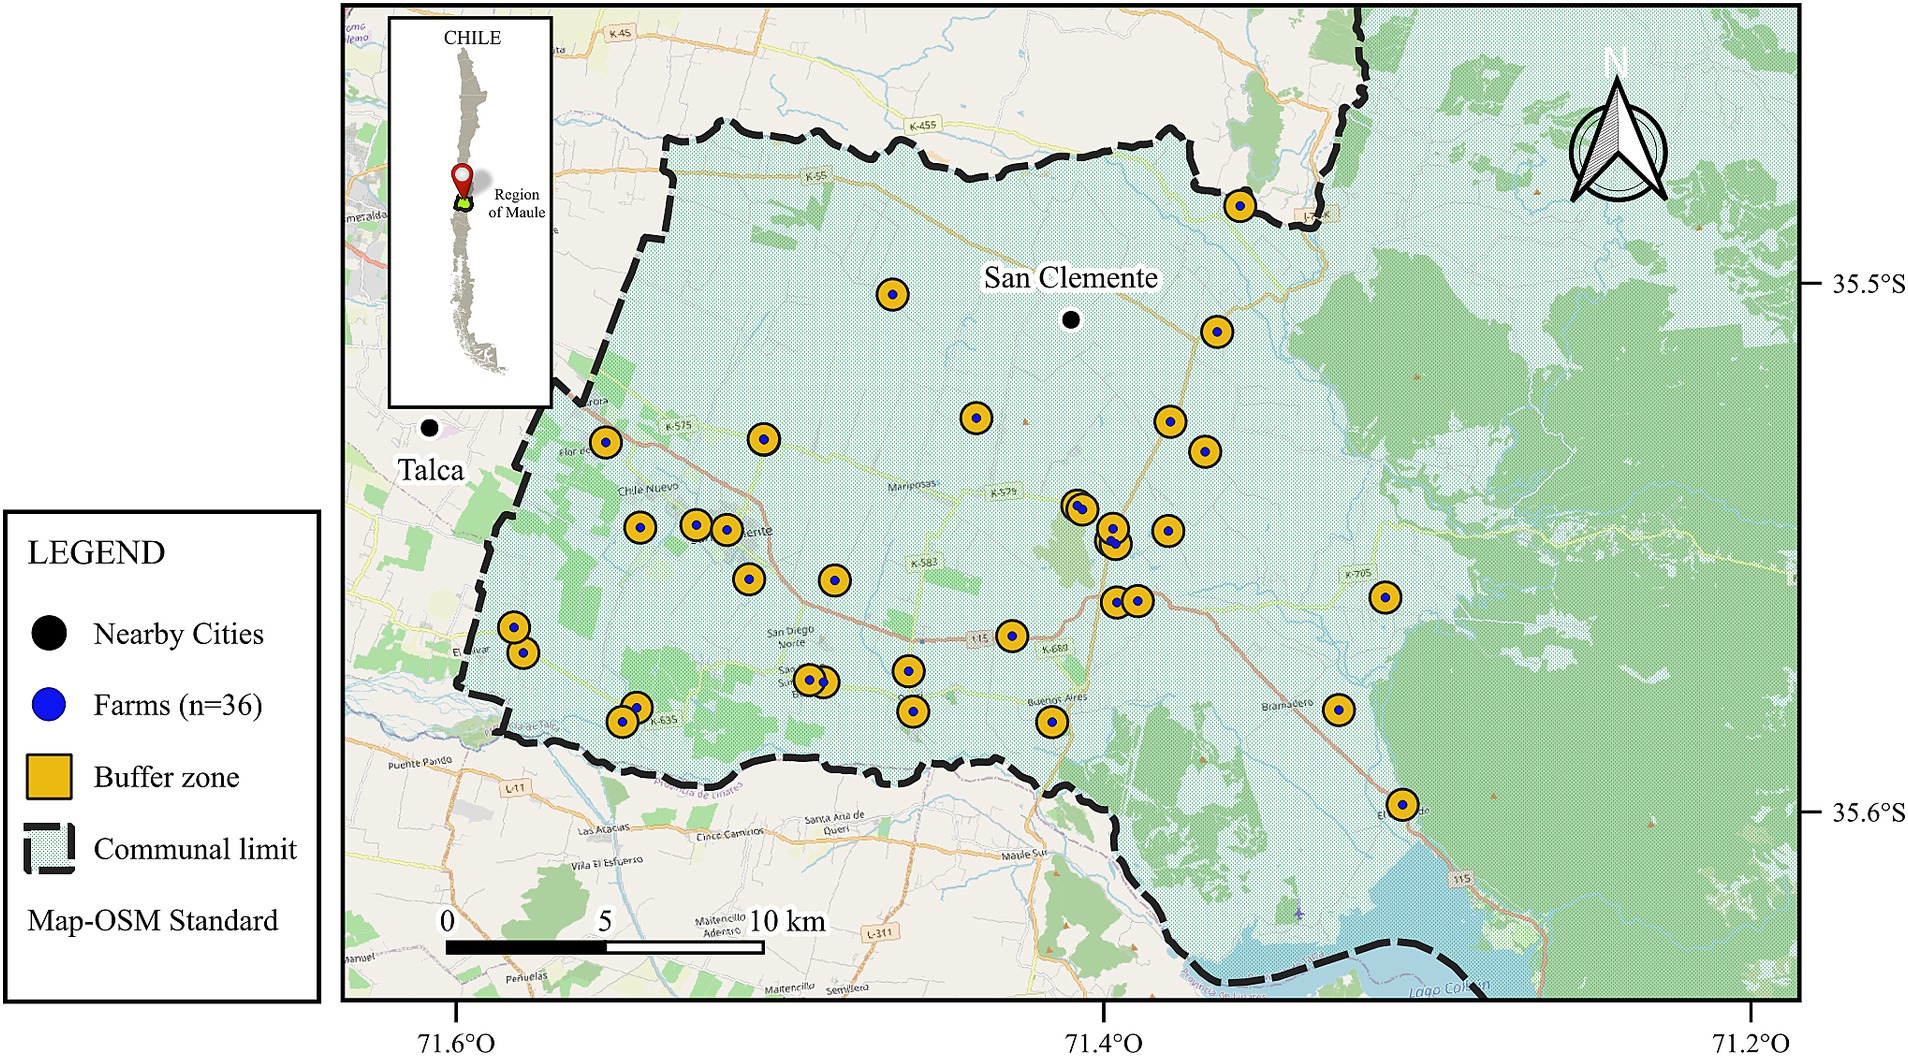
Figure 1. Study area, in blue point agroecosystem, the green buffer is landscape assessment.
The area known as the intermediate depression, also known as the Central Valley, has a characteristic Mediterranean climate with cold, wet winters and hot, dry summers. It is considered a priority region for the conservation of world biodiversity (Myers et al., 2000) due to its high level of endemism and continuous habitat loss, as it is where most of the agricultural sector is located today. It is dominated by export crops, which occupy 90% of the land, out of a total of 811,480 ha available, and are represented in percentage terms by forestry plantations (60.8%), fruit trees and vineyards (12.4%), cereals (9.1%) and fodder crops (5.7%). With a much smaller area are vegetables, legumes, tubers and home gardens, which reach 22,236 ha planted, representing no more than 2.7% of the total regional area available (ODEPA, 2018).
2.2 Construction of MAS as an index of agrobiodiversity at the local scale
Satellite images [Sentinel 2] available for March 2022 (see list of images in the Supplementary material) were used to characterize the landscape by photointerpretation, and only for the identification of patches of native vegetation and water bodies present in the landscape, vector information corresponding to the CONAF vegetation cadastre (CONAF, 2021) was used (Table 1). Patch extent metrics and distances between patches and agroecosystems were processed and analyzed with Qgis and RStudio software using the sf, terra and rgdal libraries (QGIS Development Team, 2021; R Core Team, 2023).

Table 1. Spatial information used, description and source.
In order to characterize and analyze the relationship between the agroecosystems of the Maule region, specifically the area near the municipality of San Clemente and the surrounding landscape, the methodology proposed by León-Sicard et al. (2018). Main Agroecological Structure [EAM], expressed in equation [1], is used to characterize the design of agroecosystems and their relationship with the surrounding landscape over time in an integrated manner. The Kruskal-Wallis test was used to assess significant differences between agroecosystem types.
This methodological tool allows us to look at the ecological, social and cultural links that exist between an agroecosystem and its environment [buffer zone], with an emphasis on water bodies, semi-natural areas and other non-productive uses. The buffer zone of [500 m] was defined as an area within which, for example, insect movements (Raymond et al., 2015) of interest to participating farmers and researchers could be distinguished. It was calculated using the agroecosystem perimeter and corresponds to a measure to normalize differences in total area between the types of agroecosystems studied (livestock, orchard, and horticulture). The index focuses on the quantitative and qualitative measurement of agrobiodiversity, particularly in terms of structure. The indicators used to construct the index are described in the Table 2.
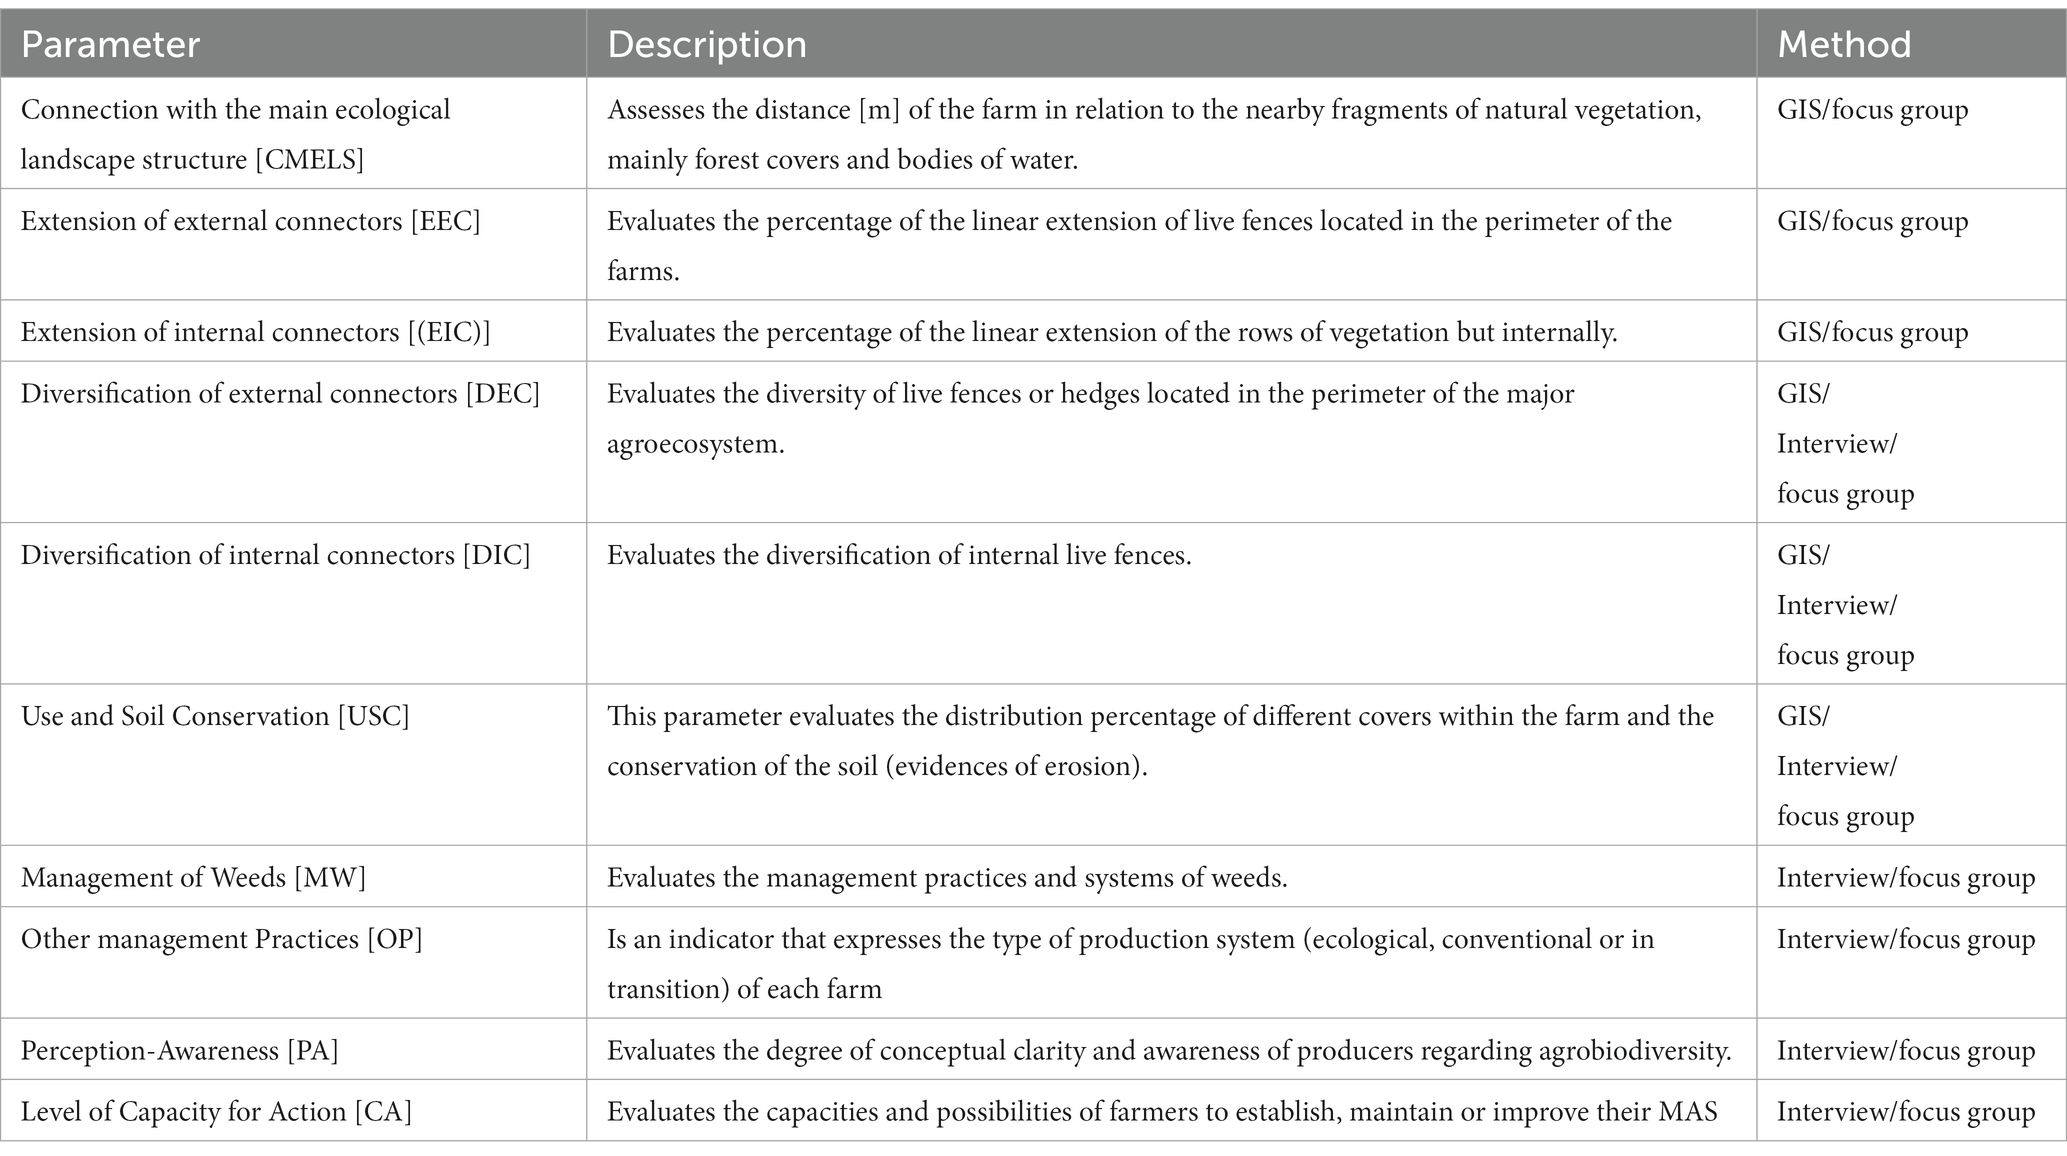
Table 2. Metrics evaluated, description and methods.
2.3 Data collection
Qualitative and quantitative methods were combined to analyze the biophysical and agroecological conditions present in each agroecosystem. The following tools were used for data collection.
2.3.1 Workshop
Two extended workshops were held with a total of 65 farmers from the Maule region, specifically the area near the commune of San Clemente. This workshop defined the main problems and strengths of the group and some possible collective strategies for agroecological transition.
2.3.2 Focus group
Four group workshops were held with a balanced sample of the main crops present in the municipality. In the workshops, the variables and evaluation criteria of the main agroecological structure of the agroecosystems were diagnosed in a participatory way. For each agroecosystem and its buffer zone, a map was produced where the farmer identified the different types of soil, areas of native vegetation, water bodies and connections present (more details in the Supplementary material).
2.3.3 Surveys and semi-structured interviews
Surveys were conducted in each of the agroecosystems studied (N = 36), using a questionnaire consisting of closed multiple-choice questions and some open-ended questions (Córdoba et al., 2020). This allowed a greater degree of flexibility and depth in obtaining information (more details in the Supplementary material).
3 Results
3.1 Issues for the agroecological transition of agroecosystems
The workshops initially identified some of the problems that the group of participating farmers identified as priorities in their agroecosystem, see Table 3, including the lack of support for agroecological transition from the state and its agencies, technical difficulties such as pest, disease, and weed control, low yields, and low sales prices. The increase in external inputs and the general devaluation of traditional knowledge of the farmers were some of the most frequent observations made in the workshops held.
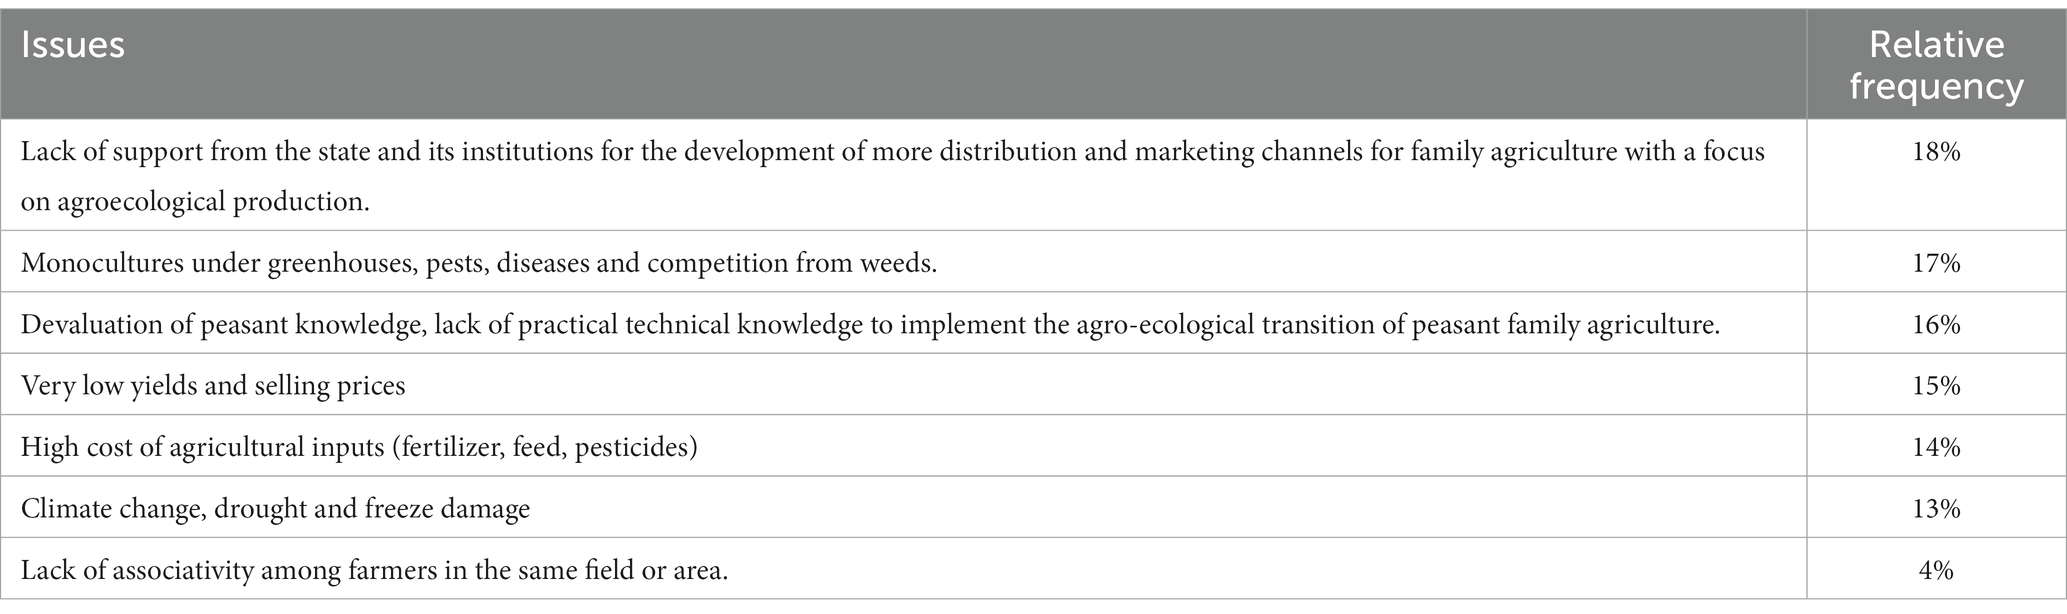
Table 3. Weighting of the main problems according to farmers.
3.2 The main agroecological structure of the Mediterranean agroecosystems
The results show that, in general, the Mediterranean agroecosystems studied cover an average area of 1.96 ± 0.1 ha, with a low presence of native vegetation patches and water bodies within the agroecosystems and in the surrounding landscape, reaching no more than 4.0 ± 0.2% of the total area studied covered by native forest and 0.3 ± 0.05% of the total area with water bodies. Most of the native vegetation types present are of the renoval type of sclerophyll forest, with formations dominated by Cryptocarya alba (Chilean peumo), Quillaja saponaria Mol. (Quillay) and [Lithrea caustica Mol. (Liter) species]. The connection between the agroecosystems and the few surrounding patches of native vegetation or water bodies present was low or zero, as can be seen from the average distance between the patches and the center of each agroecosystem [DFFCF DBWCF], where only for horticulture patches of water bodies and native vegetation were found.
In general, distances between native vegetation patches and water bodies were smaller in vegetable agroecosystems, but the presence of patches in the buffer zone was significantly higher in livestock systems. Mean distances between native vegetation patches were low for all three agroecosystem types, with a mean of 31.4 ± 1.8 m. The distance between water body patches was 17.8 ± 5.6 and the distance from the center of the agroecosystems to the water body patches was 37.3 ± 28.4 (see Table 4).
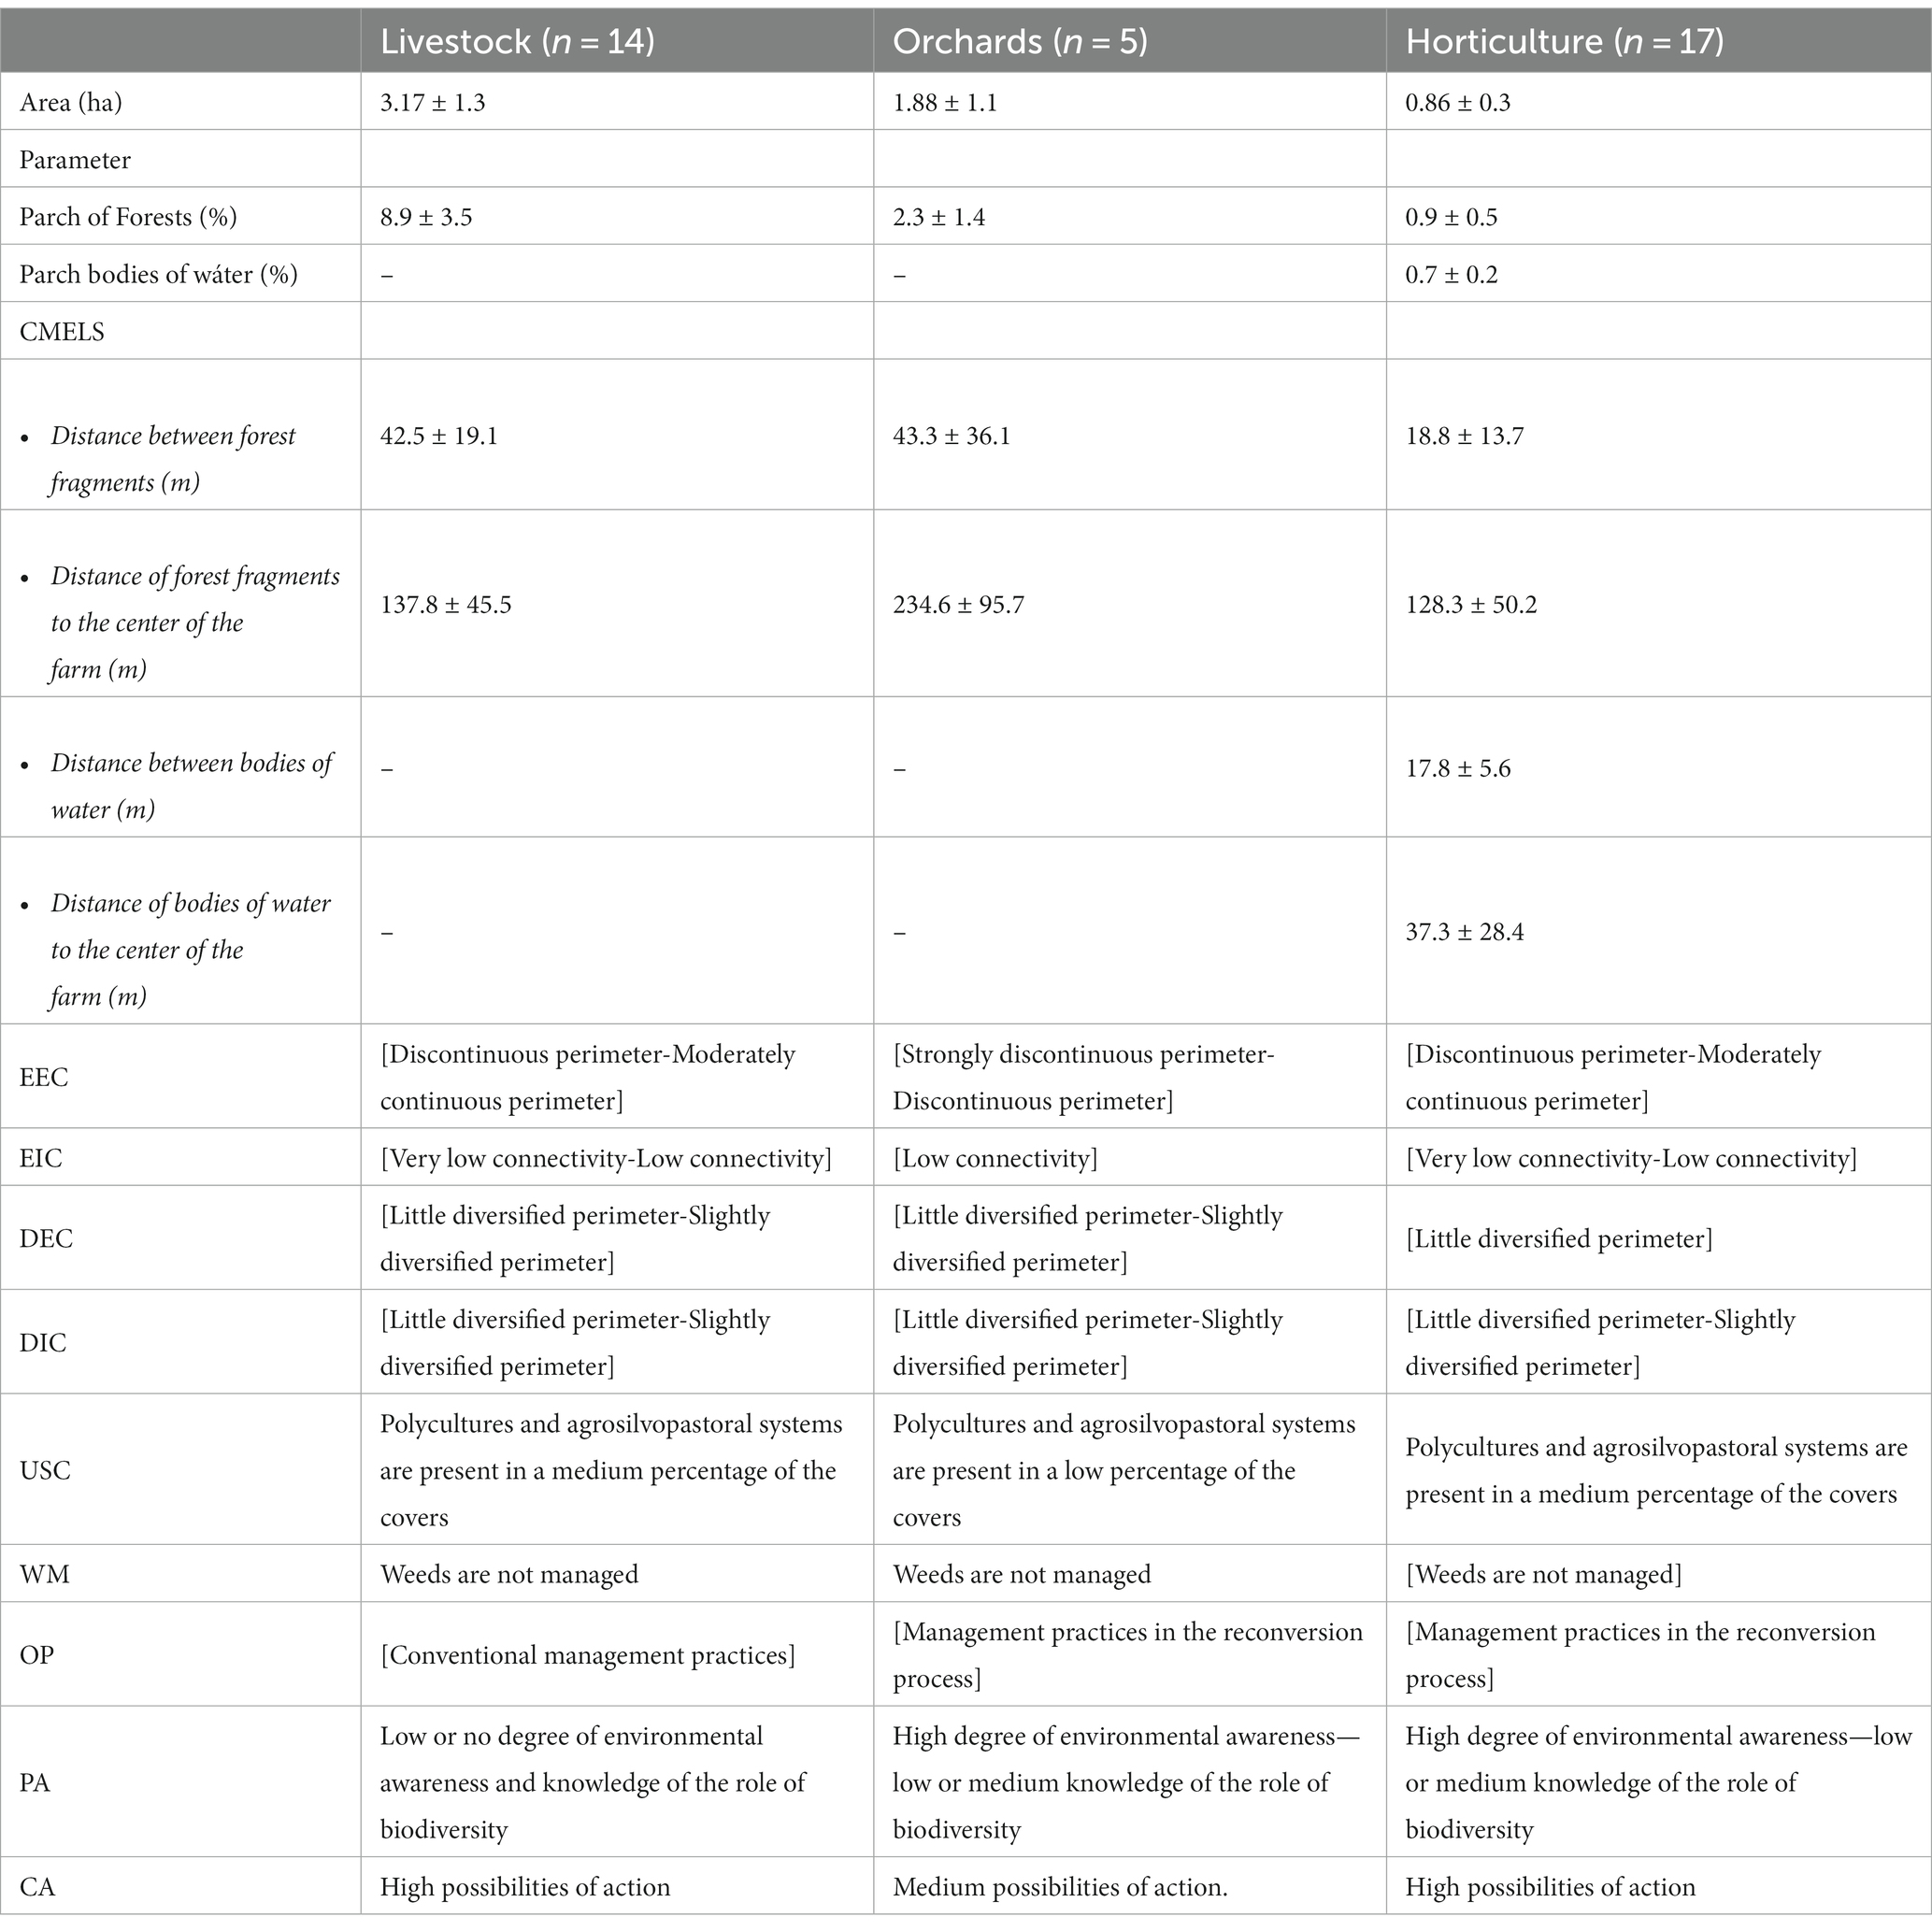
Table 4. Results metrics evaluated (mean ± error deviation).
The MAS of the evaluated agroecosystems can be considered as slightly developed, with a calculated mean of 52.6 ± 0.27. Livestock agroecosystems received the highest and lowest scores for the main agroecological structure, i.e., agroecosystems with important proportions of native forest and water bodies in the buffer zone, which were also connected by vegetation edges, and others that did not have any of these types of patches were characterized. As there were no statistical differences between the types of agroecosystems assessed (Kruskal-Wallis, p = 0.14), the distribution of observations can be seen in Figure 2. The mean was calculated for livestock (53.4 ± 3.2), orchards (55.7 ± 2.9) and horticulture (49.5 ± 1.8) (More details in the Supplementary material).
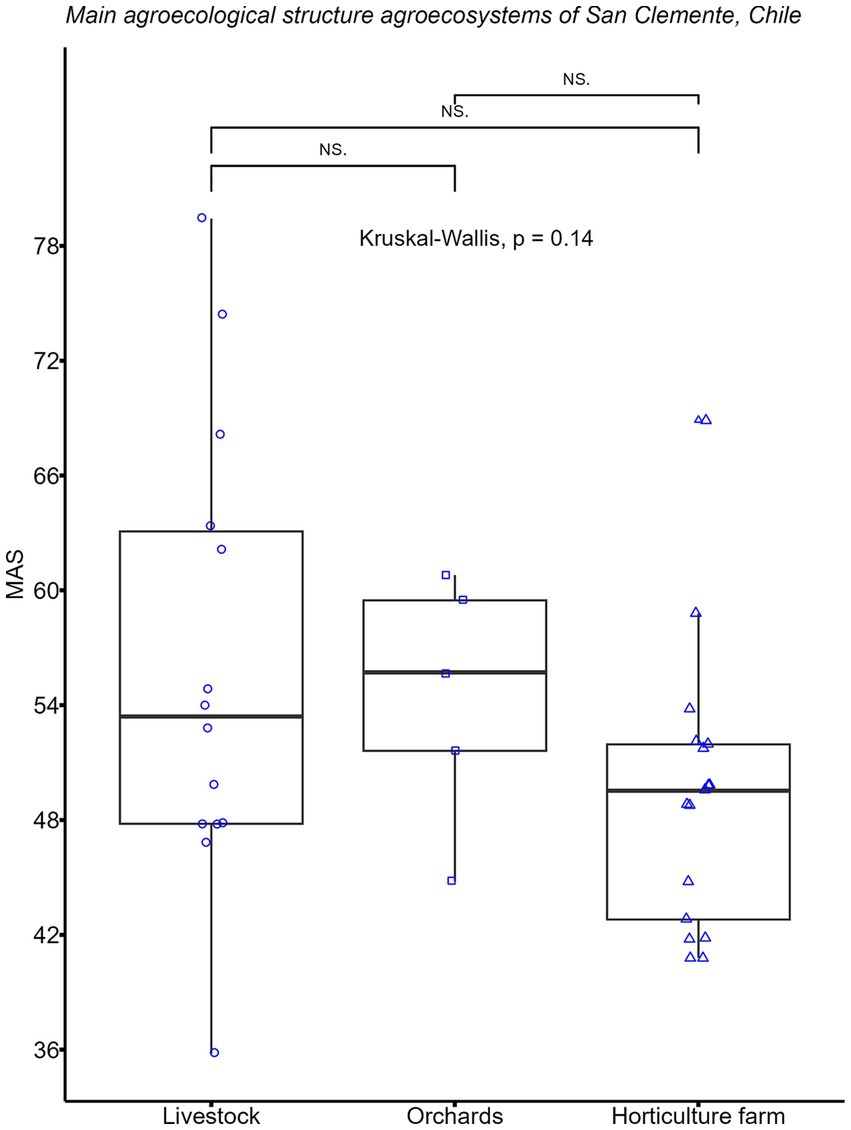
Figure 2. Boxplot by type of agroecosystems evaluated.
3.3 Agroecological practices and their contribution to the collective construction of the landscape
The research process allowed us, through the application of the MAS methodology, to know in detail the management that each farmer carries out in his agroecosystem. A set of 11 practices was identified (see Table 5), recognized for their positive contribution to key ecological functions for Mediterranean agricultural systems, soil fertility, natural regulation of pest organisms and weed control. At least 50% of the agroecosystems studied use spatial and temporal diversification as a strategy to maintain soil fertility. These strategies include at least 3 agroecological practices, crop rotation [85.3%], crop diversification in the agroecosystem [73.5%] and integration of the animal component [67.6%], whether it is sheep, cattle or poultry production systems.
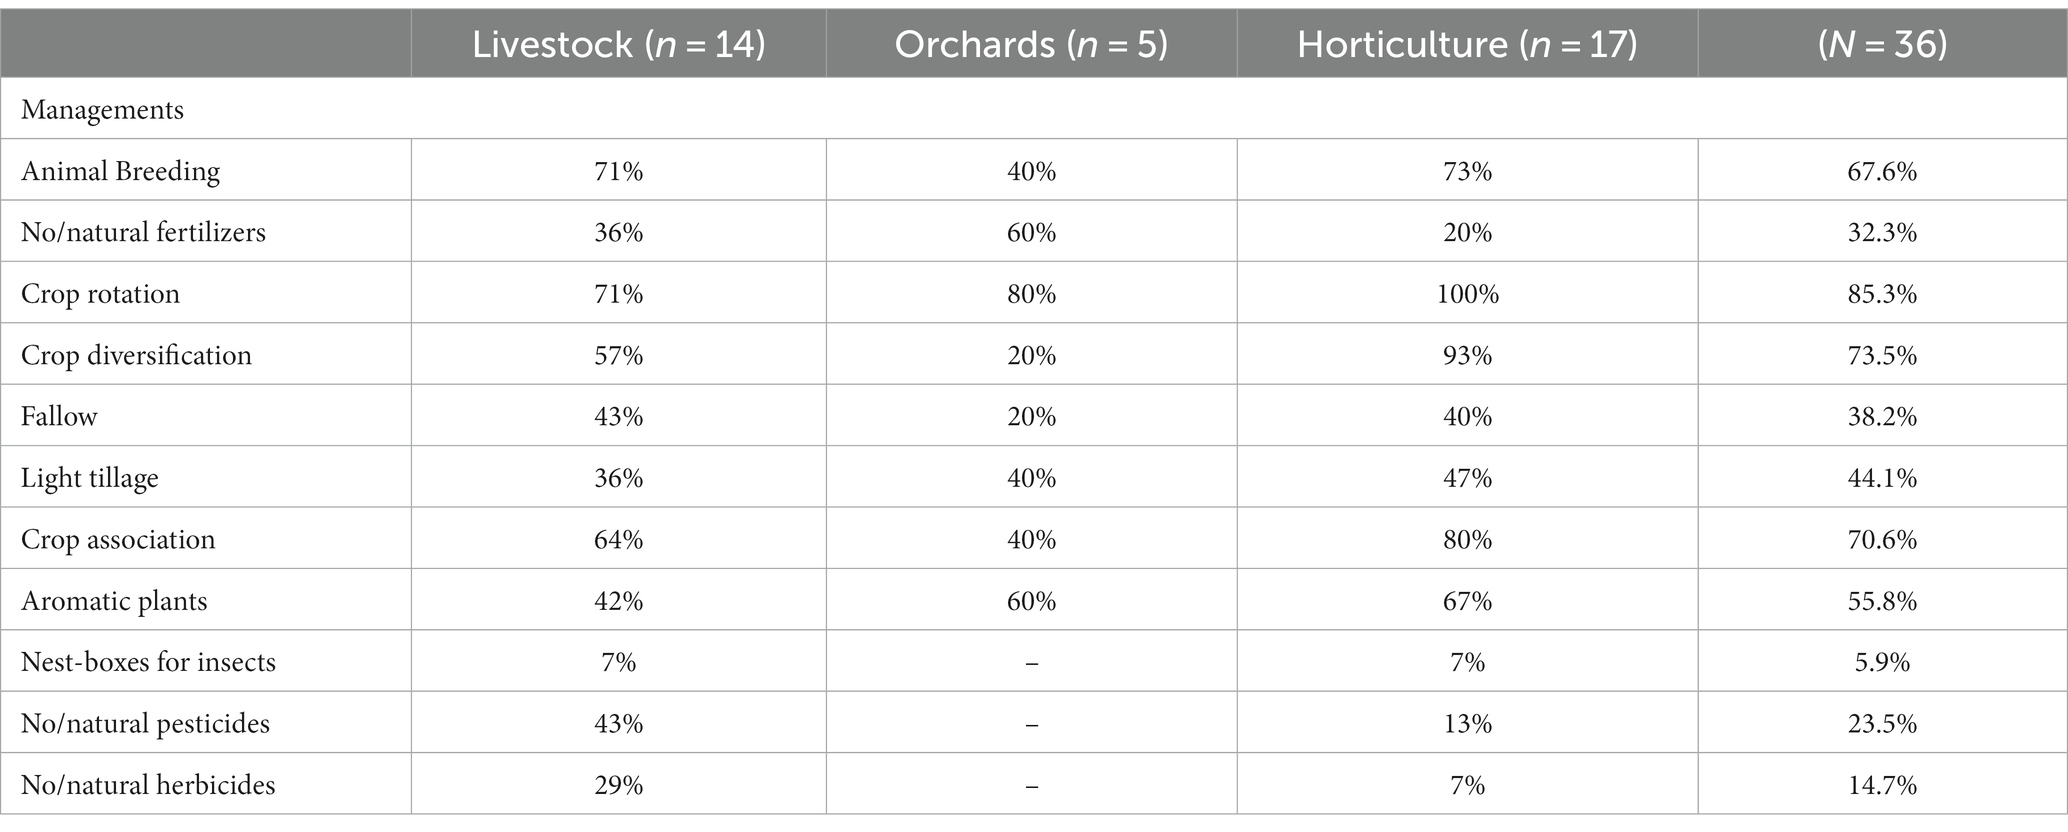
Table 5. Practices used by type of agroecosystem.
Natural pest regulation is another key element in agroecosystems with Mediterranean, in the group no strategies developed to optimize this ecological process were identified, however, at least 50% of farmers use, crop association [70.6%] and the inclusion of aromatic plants [55.8%]. It is important to highlight the use of chemical products in an important group of agroecosystems [76%] to replace the ecological processes of soil fertility and natural pest regulation.
4 Discussion
4.1 Contributions to the use of MAS in practice and methodological adaptations
In this study, the methodology proposed by León-Sicard et al. (2018) was used, as at the time of the fieldwork, the update of the methodology carried out in 2022 had not yet been officially published. The work of Quintero et al. (2022) promotes an equitable weighting, through the aggregation or balanced summation of each of the parameters involved in the construction of the MAS, which included the metrics of composition, configuration, heterogeneity, and landscape management practices used in each agroecosystem (Fahrig et al., 2011). Given the apparent link between management practices and ES provision (Palomo-Campesino et al., 2018, 2022), it is crucial to identify which agroecosystems have the potential to contribute to ES provision and which do not, as illustrated in Figure 3 and highlighted by Sirami et al. (2019). The MAS values recorded ranged from 35 to 79, indicating a gradient between the agroecosystems studied, with one group with a poorly developed agroecological structure and considerable cultural potential, and another group with an agroecological structure in a moderately developed state, with management differences observed between the agroecosystems studied and a high degree of isolation from the ecological structure of the surrounding landscape.
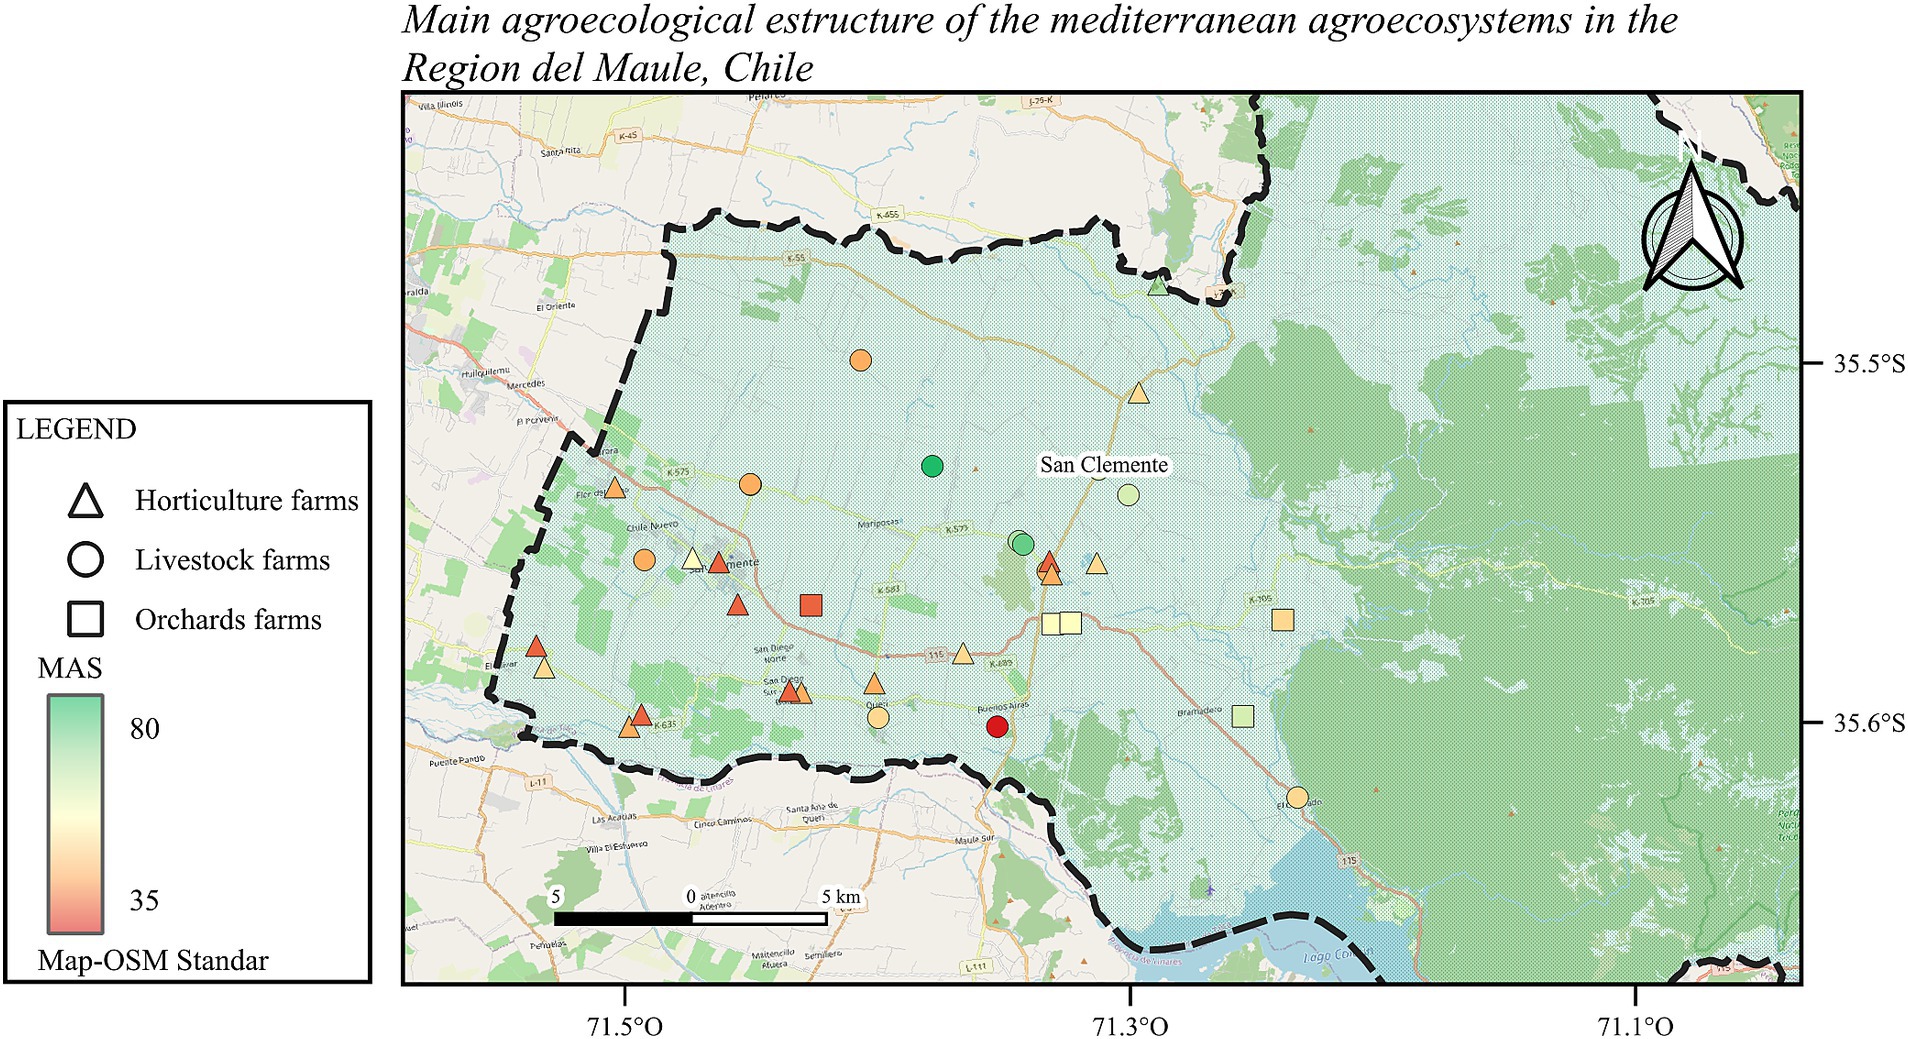
Figure 3. Geospatial location and assesment MAS of Mediterranean agroecosystems in the Region del Maule, Chile.
The use of maps and other GIS tools allowed for a participatory characterization of the landscape surrounding the agroecosystems studied, working together with farmers to identify strengths and weaknesses at the landscape scale. In this context, the MAS methodology allows aspects of landscape composition and configuration to be observed in an integrated manner, allowing for the standardization and local refinement of the landscape metrics used (Liere et al., 2017). Including the perspective of the farmers’ group (PA) on what they perceive as environmental degradation and biodiversity loss, which was little developed at the beginning of the workshops conducted. On the other hand, farmers also recognize an important individual and collective capacity for action (CA) that could significantly improve what is done in their production units.
Particularly in this region, the agriculture landscapes show a high homogeneity from an agricultural point of view, dominated in the last 20 years by the increase of forest plantations and agricultural export crops (Díaz-Hormazábal and González, 2016; Tapia and Morais, 2020). It is therefore not surprising that the valorization of the extension (EEC; EIC) and diversification (DEC and DIC) of the external and internal connectors of the agroecosystems are mostly low, since these agroecosystems do not have an established agroecological design, which is reflected in external connectors at the periphery that are abandoned and in some cases non-existent, internal connectors with low or no connectivity between the different areas within the agroecosystem, and in both cases, external and internal connectors, with a low diversity of tree and shrub plant species present. In this territory, agroecosystems play an important role in the conservation of organisms in an important global biodiversity hotspot (Henríquez-Piskulich et al., 2021).
A transversal characteristic of the agroecosystems studied is the integration of the animal component, which in practice is observed as different land uses (USC) in the agroecosystem, where these agrosilvopastoral subsystems are included, using an average area of less than 50% of each farm studied. Management of Weeds (MW) is mostly conventional, where mechanical control and the use of herbicides for weed control predominate. In general, the agroecosystems are characterized by conventional management, which includes at least 5 practices that, if properly applied, could serve as a basis for conversion to agroecological systems.
The use of landscape metrics for the construction of MAS, through methodological tools such as the creation of collective maps, makes it easier for farmers to understand the importance of the internal and external connectivity of the biodiversity of each agroecosystem with the agricultural matrix that surrounds it (Cattaneo et al., 2018). In addition, these tools allow researchers and other stakeholders to visualize some of the most common and necessary technical issues that need to be addressed in each context.
4.2 Perspectives for future research at local level
In order to promote the agroecological transition and expand the scale of agroecological experience (González de Molina et al., 2017), it is important to work with farmers through the use of practical, horizontal evaluation methods that take into account different scales, from the agroecosystem (Nicholls et al., 2020; Tamburini et al., 2020) to the landscape (León-Sicard et al., 2018; Vanbergen et al., 2020), which allow a better understanding of the impact of management on the agroecological landscape of all actors involved in this research, a complex and non-linear process that requires attention.
To achieve agroecological landscapes, it is crucial to understand the biodiversity patterns, biological interactions, and mechanisms of the natural ecosystems present in the territory (Brauman et al., 2020; Jeanneret et al., 2021), and to engage farmers in a bottom-up, context-specific approach to improve services at the landscape scale (Barrios et al., 2020; Brauman et al., 2020). In addition, it would be important to assess at the local scale the contribution that the portions of native vegetation cover [native forest or scrub] in the landscape adjacent to the agroecosystems included in this study could make to the provision of ecosystem services, such as natural regulation of pests and diseases at the landscape scale (Wratten et al., 2019). Considering that only a proportional 20% of the total area devoted to non-agricultural land could significantly improve the impact on local biodiversity and ES provision, reducing dependence on agricultural inputs by up to 50% (Garibaldi et al., 2021).
The MAS methodology is a useful collective planning tool in the process of socio-ecological transition, allowing the involvement of different actors of the territory (Quintero et al., 2022). Since participatory and quantitative methods are used in a combined way, accurate and relevant assessments of agroecological transitions can be made (Teixeira et al., 2018). This also allows a future work plan in terms of planning, seeking an integral connection of the environment of each agroecosystem, which can even be replicated and extended to peri-urban and urban production systems (Vaarst et al., 2018). In addition, successful cases of farmers were identified to become beacons that stimulate and guide the adoption of agroecological practices and principles in local communities of the area, where the recovery of traditional agricultural systems and their management, which have historically offered promising models of sustainability and resilience, can be observed (Nicholls and Altieri, 2018).
5 Conclusion
This study allowed us to characterize the main agroecological structure of the agroecosystems of the Maule region, specifically the area near the commune of San Clemente. The MAS methodology was useful to understand the partial complexity of the agroecosystems and their surrounding landscapes, which are generally in a slightly developed state. This evaluation is an important first input for a second level of research, whose objective is to answer if indeed the agricultural systems surrounded by a complex landscape matrix and that correctly apply agroecological practices present a better provision of ecosystem services in their properties. And where the MAS plays a valuable role in facilitating a complex learning process between the different actors of the territory.
Data availability statement
The original contributions presented in the study are included in the article/Supplementary material, further inquiries can be directed to the corresponding author.
Author contributions
AS-R conceived and designed the experiments, analyzed the data, wrote the manuscript, prepared the figures and tables, and authored or reviewed drafts of the paper, approved the final draft. RC-H conceived and designed the experiments, authored or reviewed drafts of the paper, approved the final draft. MA conceived and designed the experiments, authored or reviewed drafts of the paper, approved the final draft. All authors contributed to the article and approved the submitted version.
Acknowledgments
We are grateful to the Local Development Program (PRODESAL-SAN CLEMENTE), Municipality of San Clemente.
Conflict of interest
The authors declare that the research was conducted in the absence of any commercial or financial relationships that could be construed as a potential conflict of interest.
Publisher’s note
All claims expressed in this article are solely those of the authors and do not necessarily represent those of their affiliated organizations, or those of the publisher, the editors and the reviewers. Any product that may be evaluated in this article, or claim that may be made by its manufacturer, is not guaranteed or endorsed by the publisher.
Supplementary material
The Supplementary material for this article can be found online at: https://www.frontiersin.org/articles/10.3389/fsufs.2023.1241648/full#supplementary-material
References
Altieri, M., and Nicholls, C. (2019). Agroecología y diversidad. Agrobiodivers. Semillas Agric. Fam. Campesina 35:22.
Armesto, J. J., Manuschevich, D., Mora, A., Smith-Ramirez, C., Rozzi, R., Abarzúa, A. M., et al. (2010). From the Holocene to the Anthropocene: a historical framework for land cover change in southwestern South America in the past 15, 000 years. Land Use Policy 27, 148–160. doi: 10.1016/j.landusepol.2009.07.006
Barrios, E., Gemmill-Herren, B., Bicksler, A., Siliprandi, E., Brathwaite, R., Moller, S., et al. (2020). The 10 elements of agroecology: enabling transitions towards sustainable agriculture and food systems through visual narratives. Ecosyst. People 16, 230–247. doi: 10.1080/26395916.2020.1808705
Bezner, R., Madsen, S., Stüber, M., Liebert, J., Enloe, S., Borghino, N., et al. (2021). Can agroecology improve food security and nutrition? A review. Glob. l Food Secur. 29:100540. doi: 10.1016/j.gfs.2021.100540
Bommarco, R., Kleijn, D., and Potts, S. G. (2013). Ecological intensification: harnessing ecosystem services for food security. Trends Ecol. Evol. 28, 230–238. doi: 10.1016/j.tree.2012.10.012
Brauman, K. A., Garibaldi, L. A., Polasky, S., Aumeeruddy-Thomas, Y., Brancalion, P. H., DeClerck, F., et al. (2020). Global trends in nature’s contributions to people. Proc. Natl. Acad. Sci. 117, 32799–32805. doi: 10.1073/pnas.2010473117
Bünemann, E. K., Bongiorno, G., Bai, Z., Creamer, R. E., de Deyn, G., de Goede, R., et al. (2018). Soil quality – a critical review. Soil Biol. Biochem. 120, 105–125. doi: 10.1016/j.soilbio.2018.01.030
Campbell, B. M., Beare, D. J., Bennett, E. M., Hall-Spencer, J. M., Ingram, J. S., Jaramillo, F., et al. (2017). Agriculture production as a major driver of the earth system exceeding planetary boundaries. Ecol. Soc. 22:408. doi: 10.5751/ES-09595-220408
Cappelli, S. L., Domeignoz-Horta, L. A., Loaiza, V., and Laine, A. L. (2022). Plant biodiversity promotes sustainable agriculture directly and via belowground effects. Trends Plant Sci. 27, 674–687. doi: 10.1016/j.tplants.2022.02.003
Cattaneo, C., Marull, J., and Tello, E. (2018). Landscape agroecology. The dysfunctionalities of industrial agriculture and the loss of the circular bioeconomy in the Barcelona region, 1956–2009. Sustainability 10:4722. doi: 10.3390/su10124722
Cleves-Leguízamo, J. A., Toro-Calderón, J., Martínez-Bernal, L. F., and León-Sicard, T. (2017). La Estructura Agroecológica Principal (EAP): novedosa herramienta para planeación del uso de la tierra en agroecosistemas. Rev. Colombiana Cienc. Hortíc. 11, 441–449. doi: 10.17584/rcch.2017v11i2.7350
CONAF. (2021). Catastro de los Recursos Vegetacionales Nativos de Chile al año (2020). Departamento de Monitoreo de Ecosistemas Forestales, p. 76.
Córdoba, C., Triviño, C., and Toro Calderón, J. (2020). Agroecosystem resilience. A conceptual and methodological framework for evaluation. PLoS One 15:e0220349. doi: 10.1371/journal.pone.0220349
Díaz-Hormazábal, I., and González, M. E. (2016). Spatio-temporal analyses of wildfires in the region of Maule. Chile. Rev. Bosque 37, 147–158. doi: 10.4067/S0717-92002016000100014
Fahrig, L., Baudry, J., Brotons, L., Burel, F. G., Crist, T. O., Fuller, R. J., et al. (2011). Functional landscape heterogeneity and animal biodiversity in agricultural landscapes. Ecol. Lett. 14, 101–112. doi: 10.1111/j.1461-0248.2010.01559.x
FAO. (2017). FAOSTAT. Consultado el día 20 junio de 2020. Available at: http://www.fao.org/faostat.
FAO. (2018). The 10 elements of agroecology: Guiding the transition to sustainable food and agricultural systems. Rome: Food and Agriculture Organization of the United Nations. Available at: http://www.fao.org/3/i9037en/i9037en.pdf.
Franzluebbers, A. J., Wendroth, O., Creamer, N. G., and Feng, G. G. (2020). Focusing the future of farming on agroecology. Agric. Environ. Lett. 5:e20034. doi: 10.1002/ael2.20034
Garibaldi, L. A., Carvalheiro, L. G., Vaissière, B. E., Gemmill-Herren, B., Hipólito, J., Freitas, B. M., et al. (2016). Mutually beneficial pollinator diversity and crop yield outcomes in small and large farms. Science 351, 388–391. doi: 10.1126/science.aac7287
Garibaldi, L. A., Oddi, F. J., Miguez, F. E., Bartomeus, I., Orr, M. C., Jobbágy, E. G., et al. (2021). Working landscapes need at least 20% native habitat. Conserv. Lett. 14:e12773. doi: 10.1111/conl.12773
Gonthier, D. J., Ennis, K. K., Farinas, S., Hsieh, H. Y., Iverson, A. L., Batáry, P., et al. (2014). Biodiversity conservation in agriculture requires a multi-scale approach. Proc. R. Soc. B Biol. Sci. 281:20141358. doi: 10.1098/rspb.2014.1358
González de Molina, M., López García, D., and Guzmán Casado, G. (2017). Politizando el consumo alimentario: estrategias para avanzar en la transición agroecológica. REDES 22, 31–55. doi: 10.17058/redes.v22i2.9430
Guzmán, G. I., Aguilera, E., García-Ruiz, R., Torremocha, E., Soto-Fernández, D., Infante-Amate, J., et al. (2018). The agrarian metabolism as a tool for assessing agrarian sustainability, and its application to Spanish agriculture (1960-2008). Ecol. Soc. 23:2. doi: 10.5751/ES-09773-230102
Guzmán, G. I., and González de Molina, M. (2015). Energy efficiency in agrarian systems from an agroecological perspective. Agroecol. Sustain. Food Syst. 39, 924–952. doi: 10.1080/21683565.2015.1053587
Harrison, P. A., Berry, P. M., Simpson, G., Haslett, J. R., Blicharska, M., Bucur, M., et al. (2014). Linkages between biodiversity attributes and ecosystem services: a systematic review. Ecosyst. Serv. 9, 191–203. doi: 10.1016/j.ecoser.2014.05.006
Henríquez-Piskulich, P. A., Schapheer, C., Vereecken, N. J., and Villagra, C. (2021). Agroecological strategies to safeguard insect pollinators in biodiversity hotspots: Chile as a Case study. Sustainability 13:6728. doi: 10.3390/su13126728
INE. (2017). Censo Poblacional. Instituto Nacional de Estadística. Available at: https://www.bcn.cl (Accessed June 20, 2020).
IPBES. (2019). Global assessment report on biodiversity and ecosystem services of the intergovernmental science-policy platform on biodiversity and ecosystem services. Bonn: IPBES secretariat.
Jeanneret, P., Aviron, S., Alignier, A., Lavigne, C., Helfenstein, J., Herzog, F., et al. (2021). Agroecology landscapes. Landsc. Ecol. 36, 2235–2257. doi: 10.1007/s10980-021-01248-0
Jonsson, M., Straub, C. S., Didham, R. K., Buckley, H. L., Case, B. S., Hale, R. J., et al. (2015). Experimental evidence that the effectiveness of conservation biological control depends on landscape complexity. J. Appl. Ecol. 52, 1274–1282. doi: 10.1111/1365-2664.12489
Kay, C. (1996). The agrarian question in Chile since the democratic transition. Institute of Social Studies. Working paper series. Nro. 219.
Kay, C. (2002). Chile’s neoliberal agrarian transformation and the peasantry. J. Agrar. Chang. 2, 464–501. doi: 10.1111/1471-0366.00043
León-Sicard, T. E., Toro Calderón, J., Martínez-Bernal, L. F., and Cleves-Leguízamo, J. A. (2018). The main agroecological structure (MAS) of the agroecosystems: concept, methodology and applications. Sustainability 10:3131. doi: 10.3390/su10093131
Liere, H., Jha, S., and Philpott, S. (2017). Intersection between biodiversity conservation, agroecology, and ecosystem services. Agroecol. Sustain. Food Syst. 41, 723–760. doi: 10.1080/21683565.2017.1330796
Margosian, M. L., Garrett, K. A., Hutchinson, J. S., and With, K. A. (2009). Connectivity of the American agricultural landscape: assessing the national risk of crop pest and disease spread. Bioscience 59, 141–151. doi: 10.1525/bio.2009.59.2.7
Marull, J., Font, C., Padró, R., Tello, E., and Panazzolo, A. (2016). Energy–landscape integrated analysis: a proposal for measuring complexity in internal agroecosystem processes (Barcelona metropolitan region, 1860–2000). Ecol. Indic. 66, 30–46. doi: 10.1016/j.ecolind.2016.01.015
Marull, J., Herrando, S., Brotons, L., Melero, Y., Pino, J., Cattaneo, C., et al. (2019). Building on Margalef: testing the links between landscape structure, energy and information flows driven by farming and biodiversity. Sci. Total Environ. 674, 603–614. doi: 10.1016/j.scitotenv.2019.04.129
Myers, N., Mittermeier, R. A., Mittermeier, C. G., Da Fonseca, G. A., and Kent, J. (2000). Biodiversity hotspots for conservation priorities. Nature 403, 853–858. doi: 10.1038/35002501
Nahuelhual, L., Carmona, A., Lara, A., Echeverría, C., and González, M. E. (2012). Land-cover change to forest plantations: proximate causes and implications for the landscape in south-Central Chile. Landsc. Urban Plan. 107, 12–20. doi: 10.1016/j.landurbplan.2012.04.006
Nicholls, C. I., and Altieri, M. A. (2018). Pathways for the amplification of agroecology. Agroecol. Sustain. Food Syst. 42, 1170–1193. doi: 10.1080/21683565.2018.1499578
Nicholls, C., Altieri, M., Kobayashi, M., Tamura, N., McGreevy, S., and Hitaka, K. (2020). Estimando el nivel agroecológico de una finca: una herramienta de evaluación para agricultores. Agro Sur 48, 29–41. doi: 10.4206/agrosur.2020.v48n2-04
ODEPA. Región del Maule: Información Regional; Oficina de Estudios y Políticas Agrarias : Santiago, Chile: ODEPA (2018).
Palomo-Campesino, S., García-Llorente, M., Hevia, V., Boeraeve, F., Dendoncker, N., and González, J. A. (2022). Do agroecological practices enhance the supply of ecosystem services? A comparison between agroecological and conventional horticultural farms. Ecosyst. Serv. 57:101474. doi: 10.1016/j.ecoser.2022.101474
Palomo-Campesino, S., González, J. A., and García-Llorente, M. (2018). Exploring the connections between agroecological practices and ecosystem services: a systematic literature review. Sustainability 10:4339. doi: 10.3390/su10124339
Perfecto, I., and Vandermeer, J. (2010). The agroecological matrix as alternative to the land-sparing/agriculture intensification model. Proc. Natl. Acad. Sci. 107, 5786–5791. doi: 10.1073/pnas.0905455107
QGIS Development Team. (2021). QGIS Geographic information system. Open Source Geospatial Foundation Project. Available at: https://qgis.org
Quintero, I., Daza-Cruz, Y. X., and León-Sicard, T. (2022). Main agro-ecological structure: An index for evaluating agro-biodiversity in agro-ecosystems. Sustainability 14:13738. doi: 10.3390/su142113738
R Core Team. (2023). R: A language and environment for statistical computing. Vienna, Austria: R Foundation for Statistical Computing. Available at: https://www.R-project.org/.
Raymond, L., Ortiz-Martínez, S. A., and Lavandero, B. (2015). Temporal variability of aphid biological control in contrasting landscape contexts. Biol. Control 90, 148–156. doi: 10.1016/j.biocontrol.2015.06.011
Rudel, T. K. (2020). The variable paths to sustainable intensification in agriculture. Reg. Environ. Chang. 20:126. doi: 10.1007/s10113-020-01720-8
Sabzevari, S., and Hofman, J. (2022). A worldwide review of currently used pesticides’ monitoring in agricultural soils. Sci. Total Environ. 812:152344. doi: 10.1016/j.scitotenv.2021.152344
Sánchez-Bayo, F., and Wyckhuys, K. A. (2019). Worldwide decline of the entomofauna: a review of its drivers. Biol. Conserv. 232, 8–27. doi: 10.1016/j.biocon.2019.01.020
Scherr, S. J., and McNeely, J. A. (2008). Biodiversity conservation and agricultural sustainability: towards a new paradigm of ‘ecoagriculture’landscapes. Philos. Trans. R. Soc. B Biol. Sci. 363, 477–494. doi: 10.1098/rstb.2007.2165
Sirami, C., Gross, N., Baillod, A. B., Bertrand, C., Carrié, R., Hass, A., et al. (2019). Increasing crop heterogeneity enhances multitrophic diversity across agricultural regions. Proc. Natl. Acad. Sci. 116, 16442–16447. doi: 10.1073/pnas.1906419116
Tamburini, G., Bommarco, R., Wanger, T. C., Kremen, C., van der Heijden, M., Liebman, M., et al. (2020). Agricultural diversification promotes multiple ecosystem services without compromising yield. Sci. Adv. 6:1715. doi: 10.1126/sciadv.aba1715
Tapia, M. N., and Morais, M. V. B. (2020) Land use data in the middle Maule River sub-basin: classification and comparison between 1999 and 2019. In 2020 IEEE Latin American GRSS & ISPRS remote sensing conference (LAGIRS), pp. 201–206.
Teixeira, H. M., Van den Berg, L., Cardoso, I. M., Vermue, A. J., Bianchi, F. J., Peña-Claros, M., et al. (2018). Understanding farm diversity to promote agroecological transitions. Sustainability 10:4337. doi: 10.3390/su10124337
Tibbett, M., Fraser, T. D., and Duddigan, S. (2020). Identifying potential threats to soil biodiversity. PeerJ 8:e9271.
Vaarst, M., Escudero, A. G., Chappell, M. J., Brinkley, C., Nijbroek, R., Arraes, N. A., et al. (2018). Exploring the concept of agroecological food systems in a city-region context. Agroecol. Sustain. Food Syst. 42, 686–711. doi: 10.1080/21683565.2017.1365321
Vanbergen, A. J., Aizen, M. A., Cordeau, S., Garibaldi, L. A., Garratt, M. P., Kovács-Hostyánszki, A., et al. (2020). Transformation of agricultural landscapes in the Anthropocene: Nature's contributions to people, agriculture and food security. Adv. Ecol. Res. 63, 193–253. doi: 10.1016/bs.aecr.2020.08.002
Keywords: agriculture landscape, Mediterranean agroecosystem, agroecological transition, agroecological practices, ecosystem services
Citation: Salazar-Rojas A, Castro-Huerta R and Altieri M (2023) The main agroecological structure, a methodology for the collective analysis of the Mediterranean agroecological landscape of San Clemente, Region del Maule, Chile. Front. Sustain. Food Syst. 7:1241648. doi: 10.3389/fsufs.2023.1241648
Edited by:
Massimo De Marchi, University of Padua, ItalyReviewed by:
Ingrid Quintero, National University of Colombia, ColombiaDaniele Codato, University of Padua, Italy
Copyright © 2023 Salazar-Rojas, Castro-Huerta and Altieri. This is an open-access article distributed under the terms of the Creative Commons Attribution License (CC BY). The use, distribution or reproduction in other forums is permitted, provided the original author(s) and the copyright owner(s) are credited and that the original publication in this journal is cited, in accordance with accepted academic practice. No use, distribution or reproduction is permitted which does not comply with these terms.
*Correspondence: Angel Salazar-Rojas, YW5nZWxAYWdyb2Vjb3Npc3RlbWFzLmNs
†These authors have contributed equally to this work and share last authorship