 Shingo Yoshida
- Policy Research Institute, Ministry of Agriculture, Forestry and Fisheries, Tokyo, Japan
Research on sustainability practices and resilience in farm systems has focused on the mutual interrelationship between the two. When identifying critical variables related to sustainability, it is essential to take an integrated perspective that considers the interplay among sustainable practices and uses a dataset that includes both environmental and social indicators. Thus, this study aims to quantitatively identify the impact of integrated sustainability indices on farm resilience, which is classified as persistence and adaptation, in the face of Post-COVID-19 economic turbulence. We obtained data from a questionnaire survey of 4,604 farms conducted by a government financial institution. Integrated sustainability indices and resilience indices are formulated through the application of factor analysis. As a result, we develop six sustainability indices that integrate environmental and social practices. A regression analysis reveals a positive correlation between the integrated sustainability indices and short-term persistence as farm resilience. Moreover, these sustainability indices exhibit a more pronounced impact on long-term adaptive resilience. These results imply that the integrated sustainability indices are more adept at evaluating farmers’ sustainability endeavors and clarifying the relationship between sustainability and farm resilience than traditional environmental and social sustainability indicators.
1 Introduction
In the context of drastic changes in the socio-economic environment, there has been a marked increase in interest in the extent to which agricultural enterprises are resilient to various shocks. Resilience is generally defined as “the capacity of a system to absorb disturbance and reorganize while undergoing change so as to still retain essentially the same function, structure, identity, and feedback” (Walker et al., 2004). Moreover, many scholars perceive resilience to shocks as a return to the original state and a trigger for innovative change in agriculture (Darnhofer et al., 2010; Meuwissen et al., 2018). Furthermore, enhancing this resilience is an important component of agricultural economic sustainability (FAO, 2013). Consequently, elucidating the preconditions that lead to the phenomenon of “bounce forward” (Darnhofer, 2014) is an important research topic.
Empirically, it has been shown that a relative abundance of resilience attributes contributes to robustness against shocks, but fewer attributes promote adaptability and transformation triggered by such shocks (Nera et al., 2020; Soriano et al., 2023). Among these, sustainability-related activities are an important element embedded in the resilience cycle (Darnhofer et al., 2010). In particular, stakeholders within the agricultural system show a strong interest in this combination of sustainability and resilience (Accatino et al., 2022). For example, empirical evidence has confirmed that the resilience of organic agriculture exceeds that of conventional agricultural practices (Herman et al., 2018; Grigorescu et al., 2022). A study has shown a positive correlation between agricultural sustainability and resilience in many European countries using country-level aggregate data (Volkov et al., 2022). However, few studies have quantitatively demonstrated the impact of sustainability practices on farm resilience by indexing agricultural sustainability and farm resilience at the farm level.
Within a sustainable food system (SFS), each company must adhere to standards of Responsible Business Conduct that regulate the responsibility of stakeholders for the sustainability of SFS; this includes all enterprises in the supply chain, from small upstream farms to downstream retailers (OECD/FAO, 2016). The Farm to Fork Strategy emphasizes that an SFS, which offers business opportunities to numerous stakeholders, is the most competitive in the long run (European Union, 2020). Empirically, sustainability practices are expected to enhance economic value by mitigating risks and expanding business opportunities (Fatemi et al., 2015). Research on the impact of corporate social responsibility (CSR) activities on firms indicates that CSR positively affects firms’ reputations and customer satisfaction (Brammer and Pavelin, 2006; Saeidi et al., 2015), innovation (Sharma and Vredenburg, 1998; Surroca et al., 2010; Li et al., 2019), stakeholder management (Sharma and Vredenburg, 1998), and employee satisfaction (Pérez et al., 2018). Furthermore, sustainability practices are seen as a way to enhance farm resilience through their positive effects. Sustainability practices shape the fundamental attributes of farm resilience, including stakeholder management, innovation, human resource development, and diversification into various businesses (Meuwissen et al., 2018). In addition, case studies show that sustainability practices and resilience in a farm system are mutually reinforcing (Accatino et al., 2022). However, there is a lack of research quantifying the relationship between sustainability practices and farm resilience.
The COVID-19 pandemic and Russia’s military invasion of Ukraine have been significant socio-economic shocks that have affected agricultural management by changing global demand for agricultural products and increasing production costs. For example, Figure 1 shows the results of a survey of agricultural business conditions in Japan. More farmers reported that business conditions were better before the spread of COVID-19 than after the pandemic, as shown by a positive Diffusion Index (DI). However, the DI has become increasingly negative in the three years since the pandemic began, indicating a deterioration of business conditions in Japan that has grown more severe (Japan Finance Corporation, 2023). Similarly, in the European Union (EU), farm income in 2020 decreased by 7.9% compared to 2019 (Montanari et al., 2021) and historically high fuel and fertilizer prices were seen in 2022 (European Commission, Directorate-General for Agriculture and Rural Development, 2022). Now that the shock of the COVID-19 pandemic is ending, this is an appropriate time to analyze the extent of farm resilience and resilience attributes against it. In short, whether sustainability-focused activities can help improve farm resilience in this challenging socio-economic environment is an essential research question for the continued development of the agricultural industry. Furthermore, it is crucial to shift toward the type of sustainable agro-food system that we should establish instead of focusing on returning to a pre-pandemic “normal” (Darnhofer, 2020).
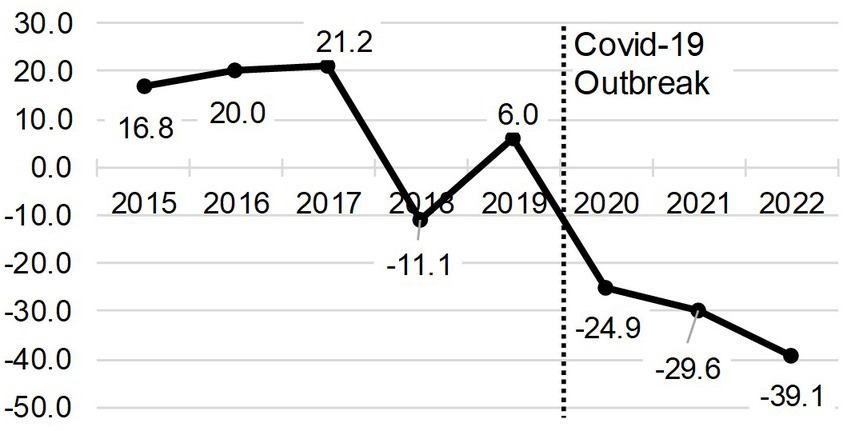
Figure 1. Economic conditions of farms in Japan. Diffusion Index (DI) is the difference between the percentage of respondents who indicated that financial performance has improved and those who indicated that it has worsened.
Are there available data that can capture sustainability indicators? In the EU, plans are already in place to incorporate environmental and social components into specific existing statistics, such as the Farm Accountancy Data Network (FADN) and Farm Structure Surveys (Khafagy and Dwyer, 2022). According to a study on converting the FADN to the Farm Sustainability Data Network (FSDN), one of the main challenges in developing the FSDN is “adding key variables on the environmental and social dimensions of farming” (European Commission, 2021).
When identifying critical variables related to sustainability, taking an integrated perspective that considers the interplay among sustainable practices and uses a dataset that includes both environmental and social indicators is lacking in previous studies. Economic, social, and ecological factors mutually influence one another over a long-term adaptive cycle (Darnhofer et al., 2010). More than relying on data related to specific environmental indicators is required for analyzing the impact of social activities, such as environmental education and landscape conservation, which are strongly linked to those indicators. Failing to account for these factors can lead to an inaccurate assessment of the overall sustainability of agricultural operations, which can hinder the promotion of sustainability practices. Conversely, developing an integrated sustainability index that reflects farmers’ sustainability goals in each indicator would enable a comprehensive assessment of the impact of sustainability practices on the environment, society, and farm management. Despite the significance of this approach, only some case studies have examined sustainability practices from this comprehensive perspective.
This study aims to construct integrated sustainability indices using Japanese farms as a case study. The study also tries to identify the impact of integrated sustainability practices on farm resilience, classified as persistence and adaptation, in the face of socio-economic changes, including the ongoing COVID-19 pandemic and the rising cost of production inputs. The findings indicate a strong correlation between integrated sustainability indices and farm resilience. Furthermore, it underscores the significance of acknowledging innovative endeavors by farmers, not tied to the framework of environmental or social themes, in advancing the sustainable development of agriculture.
2 Literature review and hypothesis
2.1 Integration of the sustainability index
Table 1 summarizes the topics discussed in the literature and guidelines on the existing sustainability index in agriculture and food systems. Other than economic sustainability, some literature divided sustainable practices into three subcategories: environmental sustainability, external social sustainability, and internal social sustainability (Van Calker et al., 2005; Meul et al., 2008; Lebacq et al., 2013). According to studies of sustainability index in agriculture, internal social sustainability refers to employees’ work environment, education, and other forms of employee well-being, while external social sustainability refers to social values and concerns, such as community revitalization and job creation on the part of agriculture, food security, and the like (Lebacq et al., 2013). In Table 1, more than half of the indicators mentioned are related to energy, water, biodiversity, air quality, land (environmental), food safety, supplier social assessment (external social), and workplace conditions, labor health (internal social). Unlike environmental indicators, social indicators tend to be adopted differently, depending on the purpose and context. In this study, sustainability is quantified for each theme by adding topics considered issues in Japanese agriculture and food systems.
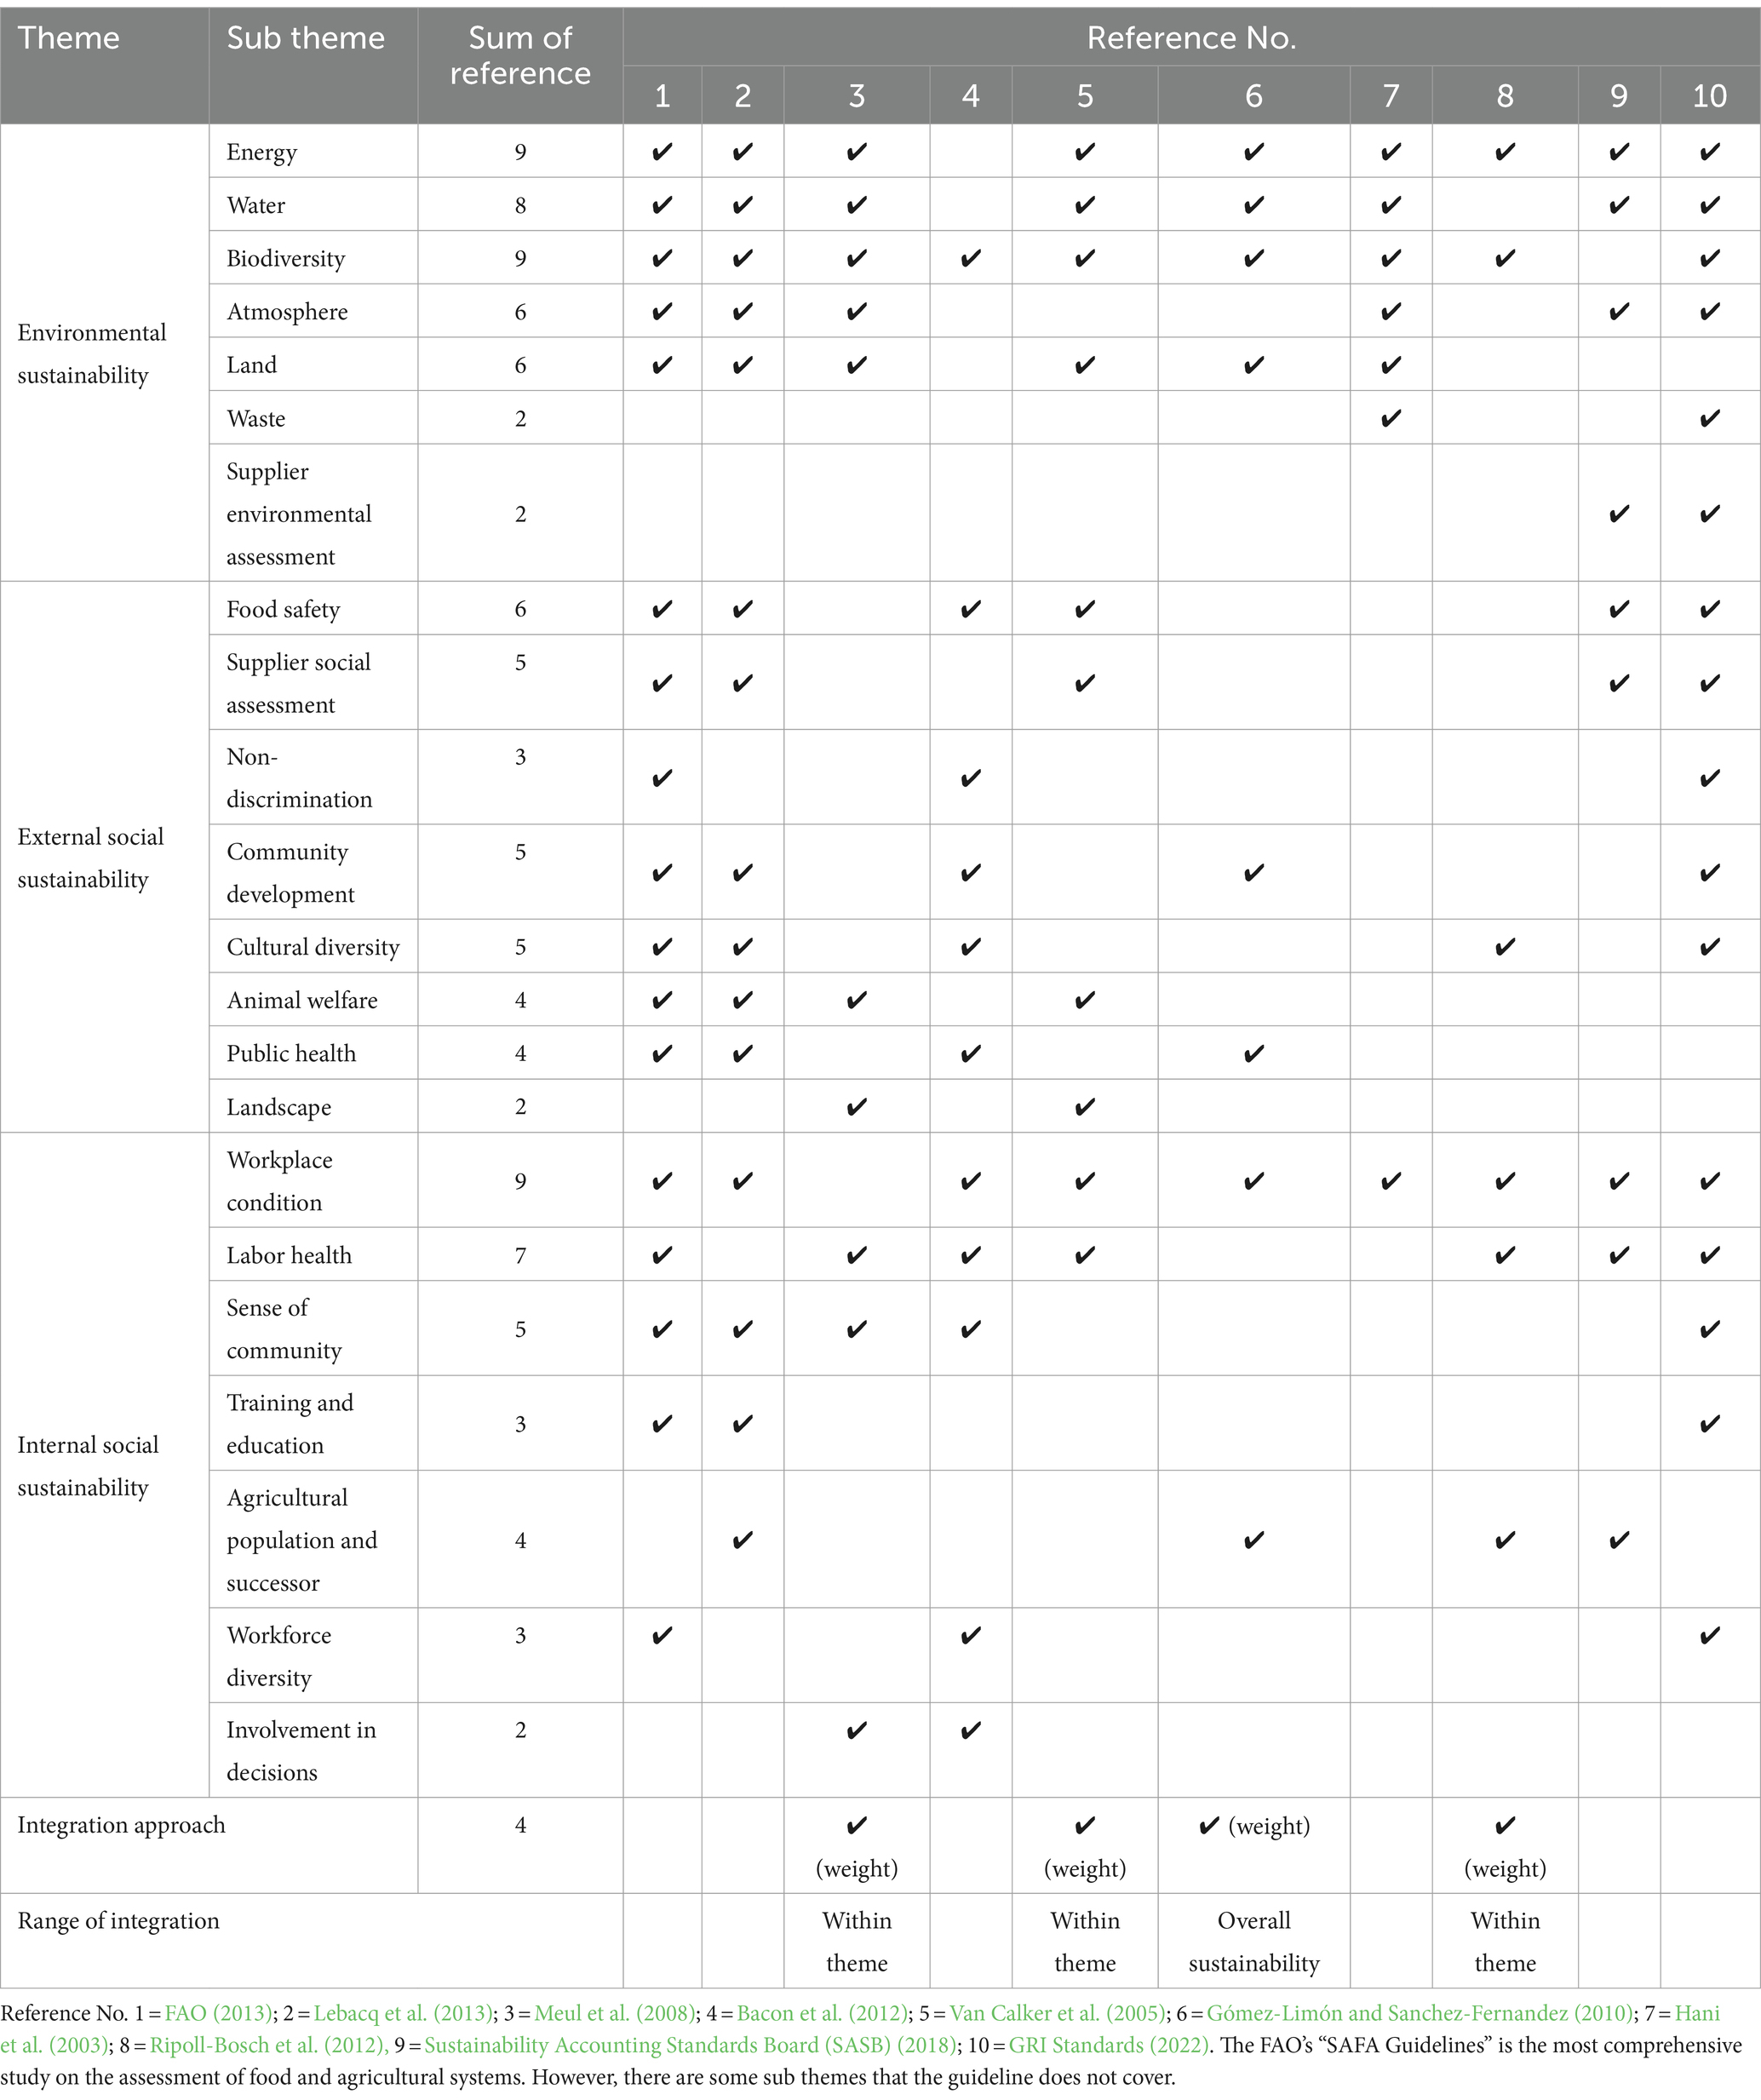
Table 1. Sustainability themes in the agricultural sector.
How can these various sustainability indicators be integrated? According to Table 1, more than half of the studies reviewed for this purpose report each indicator individually, without any integration description. However, some weight each indicator using input from experts and focus groups, integrating them into each theme (Van Calker et al., 2005; Meul et al., 2008; Ripoll-Bosch et al., 2012) or a single index (Gómez-Limón and Sanchez-Fernandez, 2010). On the other hand, a study analyzing the correlations among sustainability indicators in different countries has shown that there are synergies (significant positive correlations) among indicators of different themes (Zhang et al., 2021). Then, studies should include a perspective on the interrelationships among indicators across themes. One study that compares tools to assess the sustainability performance of farms highlights the importance of indicator interaction as a condition for understanding the complementarity of sustainability practices (Binder et al., 2010); however, none of the tools analyzed made any reference to indicator interactions (De Olde et al., 2016). Then, this study posits a hypothesis on the sustainability indices as follows:
Hypothesis 1: The sustainability practices of farms can be evaluated as integrated activities that go beyond the thematic framework of environmental, external social, or internal social sustainability.
To further enhance the validity of the indicator, firstly, the context in which it is used needs to be clarified (Latruffe et al., 2016). In comparative studies, the presence or absence of synergies among indicators varied widely across countries (Zhang et al., 2021). In other words, it is important to test the above hypotheses for a specific country or region. Secondly, this study uses practice-based indicators to quantify sustainability. Although performance-based indicators are generally preferred (FAO, 2013), the FAO’s guideline acknowledges that practice-based indicators may be the most practical for small-scale organizations, where measuring the performance of each indicator is not feasible. As this study focuses on small and medium-sized farms, practice-based indicators are used. These practice-based indicators have end-user validity in that it is easy for farmers to answer (Bockstaller and Girardin, 2003). Indicators with such contextual considerations and flexibility for users can also be used for farmers’ strategic decision-making (Coteur et al., 2016). In other words, the indexes in this study are also intended to be applied to farm management.
2.2 Sustainability practices and farm resilience
2.2.1 Evaluation of farm resilience
As an overview of strategies for farm resilience, farm-level approaches to stresses or shocks can be classified into two categories: persistence and adaptation (Darnhofer et al., 2010). Persistence encompasses an exploitation strategy, wherein the farm capitalizes on successful activities and reallocates more resources toward them, and an absorption strategy, wherein the farm maintains adequate buffer capacity to deal with crises. The components of adaptation are adjustment and transformation strategies. The former involves making adjustments at the farm level, such as implementing new production methods, on-farm processing, or direct marketing to address a disruption. The latter requires farms to reallocate management resources and diversify into unconventional activities.
When analyzing a farm’s resilience to shocks such as the COVID-19 pandemic and rising production costs, it is crucial to understand the resilience capacity of persistence that results from efficiently utilizing resources within the farm to respond promptly to shocks. It is also essential to demonstrate the resilience capacity of adaptation, specifically management innovation, to deal with long-term changes in the socio-economic environment.
How can we quantify farm resilience? Two approaches have been used: one examines actual farm changes, while the other assesses farmers’ subjective perceptions of resilience. As an example of the former, a paper measures robustness, adaptation, and transformation using return on assets (ROA), changes in production, and business diversification, respectively (Slijper et al., 2022). However, relying solely on a few indicators to assess resilience can trivialize the concept. For the latter, a paper obtained farmers’ views on eight items relating to the prospects for future farming resilience (Spiegel et al., 2021). This method considers various aspects of resilience while minimizing the burden on respondents. The current study uses farmers’ subjective perceptions of persistence, measured by a questionnaire survey conducted every six months over several years. The level of adaptation is assessed using the plans for new activities related to technology adoption, production, marketing, and business venturing.
2.2.2 Sustainability practices as resilience attributes
A prior work provides a detailed framework for identifying attributes that define farm system resilience (Meuwissen et al., 2018). Sustainability practices, which aim to reduce risk and seize market opportunities by addressing the needs of a range of stakeholders, are strongly associated with resilience attributes such as stakeholder engagement, resources to implement sustainable production, enterprise diversification, multiple sources of risk management, and high levels of natural, social, human, and financial capital. Other studies suggest that “sustainability is a concept complementary to resilience and refers to the adequate performance of all system functions across the environmental, economic, and social domains” (Nera et al., 2020; Reidsma et al., 2020).
As a concrete empirical example, if sustainability practices are viewed as a form of diversification, the objectives of farm diversification go beyond economies of scope and risk reduction to include expanding managerial expertise, knowledge, and social networks. For example, organic farmers in Austria identified or established niche markets for their goods, obtaining knowledge through social learning and experimentation (Darnhofer and Strauss, 2015). An extensive literature review of farmers’ motives for farm diversification shows that while most farmers diversify to mitigate risks and utilize resources, some seek to capitalize on market opportunities (Yoshida et al., 2019).
Furthermore, when sustainability practices are perceived as a component of stakeholder management, various stakeholders are shown to have distinct roles in augmenting a farm system’s capacity for resilience (Soriano et al., 2023). Moreover, analyses of farming systems encompassing individual farms reveal that cooperatives and producers’ organizations are effective ways for various stakeholders to enhance transformability (Nera et al., 2020). Additionally, studies show that farmers participating in workshops recognize the importance of peer-to-peer learning and knowledge networks in building resilience capabilities (Soriano et al., 2020; Spiegel et al., 2020).
However, only some efforts have attempted to quantify actual sustainability practices and assess their direct relationship to resilience. Numerous empirical studies show a positive correlation between sustainability practices and economic performance (Russo and Fouts, 1997; Waddock and Graves, 1997; Hull and Rothenberg, 2008; El Ghoul et al., 2016). For instance, a company’s ROA positively correlates with higher environmental ratings (Russo and Fouts, 1997), and a positive correlation exists between CSR activities and ROA (El Ghoul et al., 2016). Additionally, meta-analyses of ESG factors and economic indicators reveal a positive relationship (Friede et al., 2015). Moreover, some studies suggest that CSR is linked to innovation, which is considered to have a strong relationship with resilience (Li et al., 2019).
During the pandemic, case studies suggest that engagement in sustainability-oriented activities, such as direct marketing and organic farming, enhances resilience (Mastronardi et al., 2020, 2022; Yoshida and Yagi, 2021; Grigorescu et al., 2022; Little and Sylvester, 2022). However, a comparative analysis of European farming systems’ responses to the COVID-19 pandemic found that while many exhibited strong robustness due to pre-existing connectedness, few demonstrated adaptation or transformation (Meuwissen et al., 2021). Then, this study employs a novel methodology, which includes indexing and quantitative approaches to evaluating the relationship between sustainability practices and farm resilience. The hypotheses are as follows:
Hypothesis 2: Integrated sustainability indices positively correlate with the persistence resilience index.
Hypothesis 3: Integrated sustainability indices positively correlate with the adaptation resilience index.
3 Methodology
3.1 Conceptual framework
We use Meuwissen’s framework to evaluate the resilience of farming systems (Meuwissen et al., 2019). The conceptual framework is illustrated in Figure 2. First, all types of farms in Japan are included in the targeted farming system. Second, the COVID-19 pandemic and production cost escalation caused by Russia’s invasion of Ukraine are the challenges farmers face. Third, functions are determined by the most recent changes in the status of a farming business and the existence or non-existence of plans for some new activities over the next five years. Fourth, we clarify the type of resilience capabilities farmers exhibit, i.e., persistence or adaptation. Persistence corresponds to the recent business improvement, while adaptation corresponds to the presence or absence of new activities. Fifth, we focus on sustainability practices as resilience attributes.
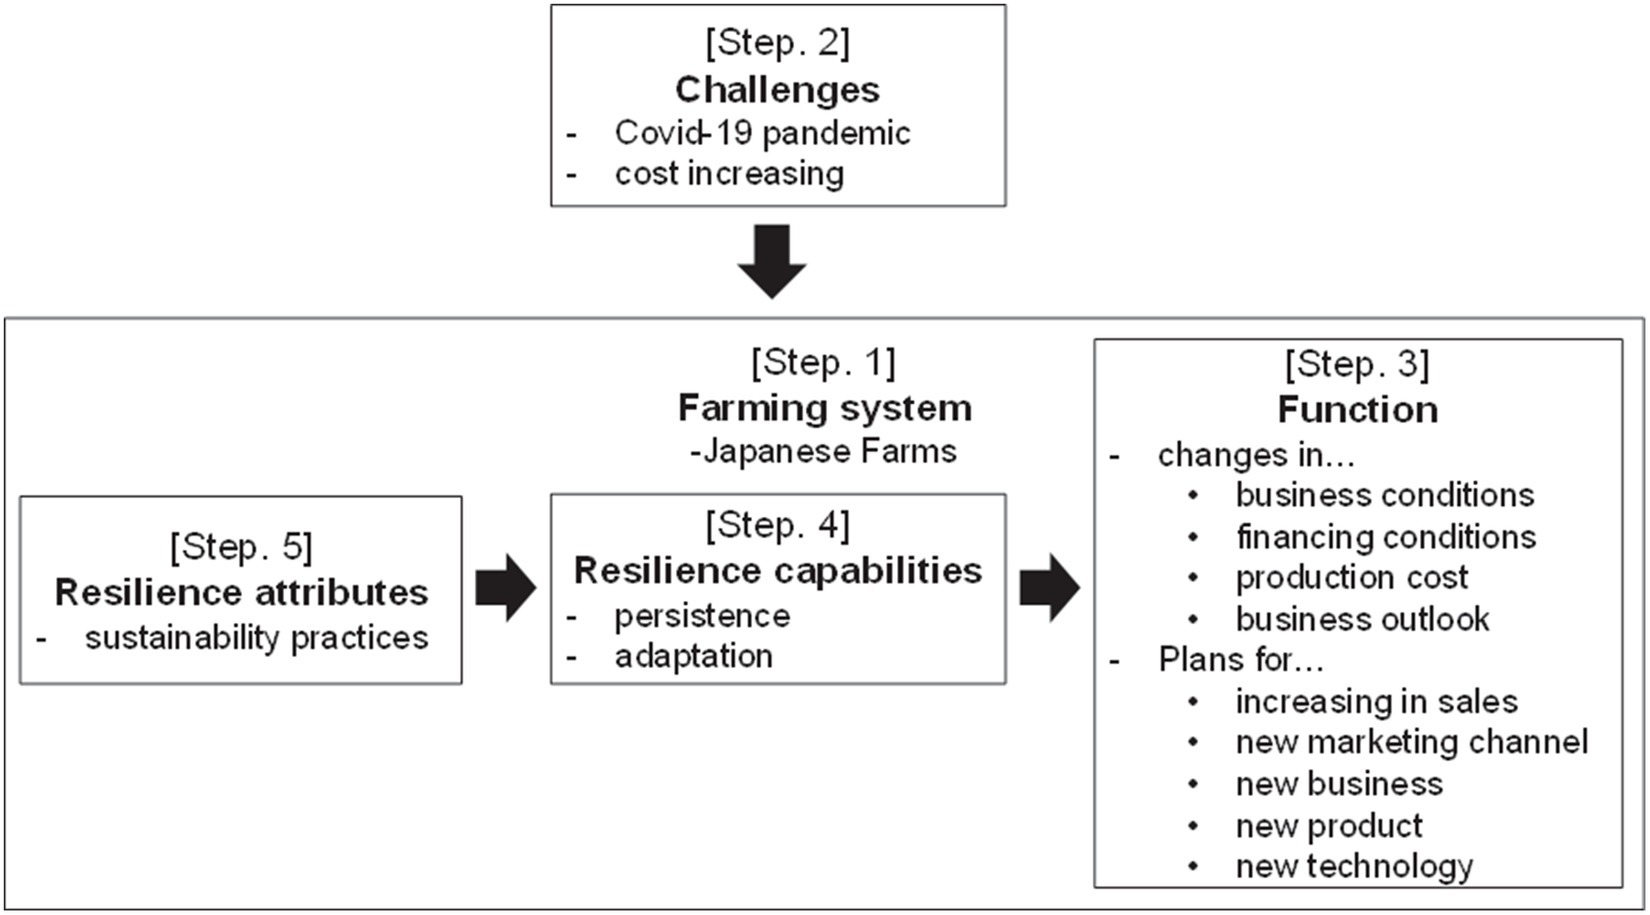
Figure 2. Conceptual framework.
3.2 Analytical framework
Figure 3 shows the analytical framework used in this study. The processes used to develop each indicator and conduct the analysis are explained according to this framework.
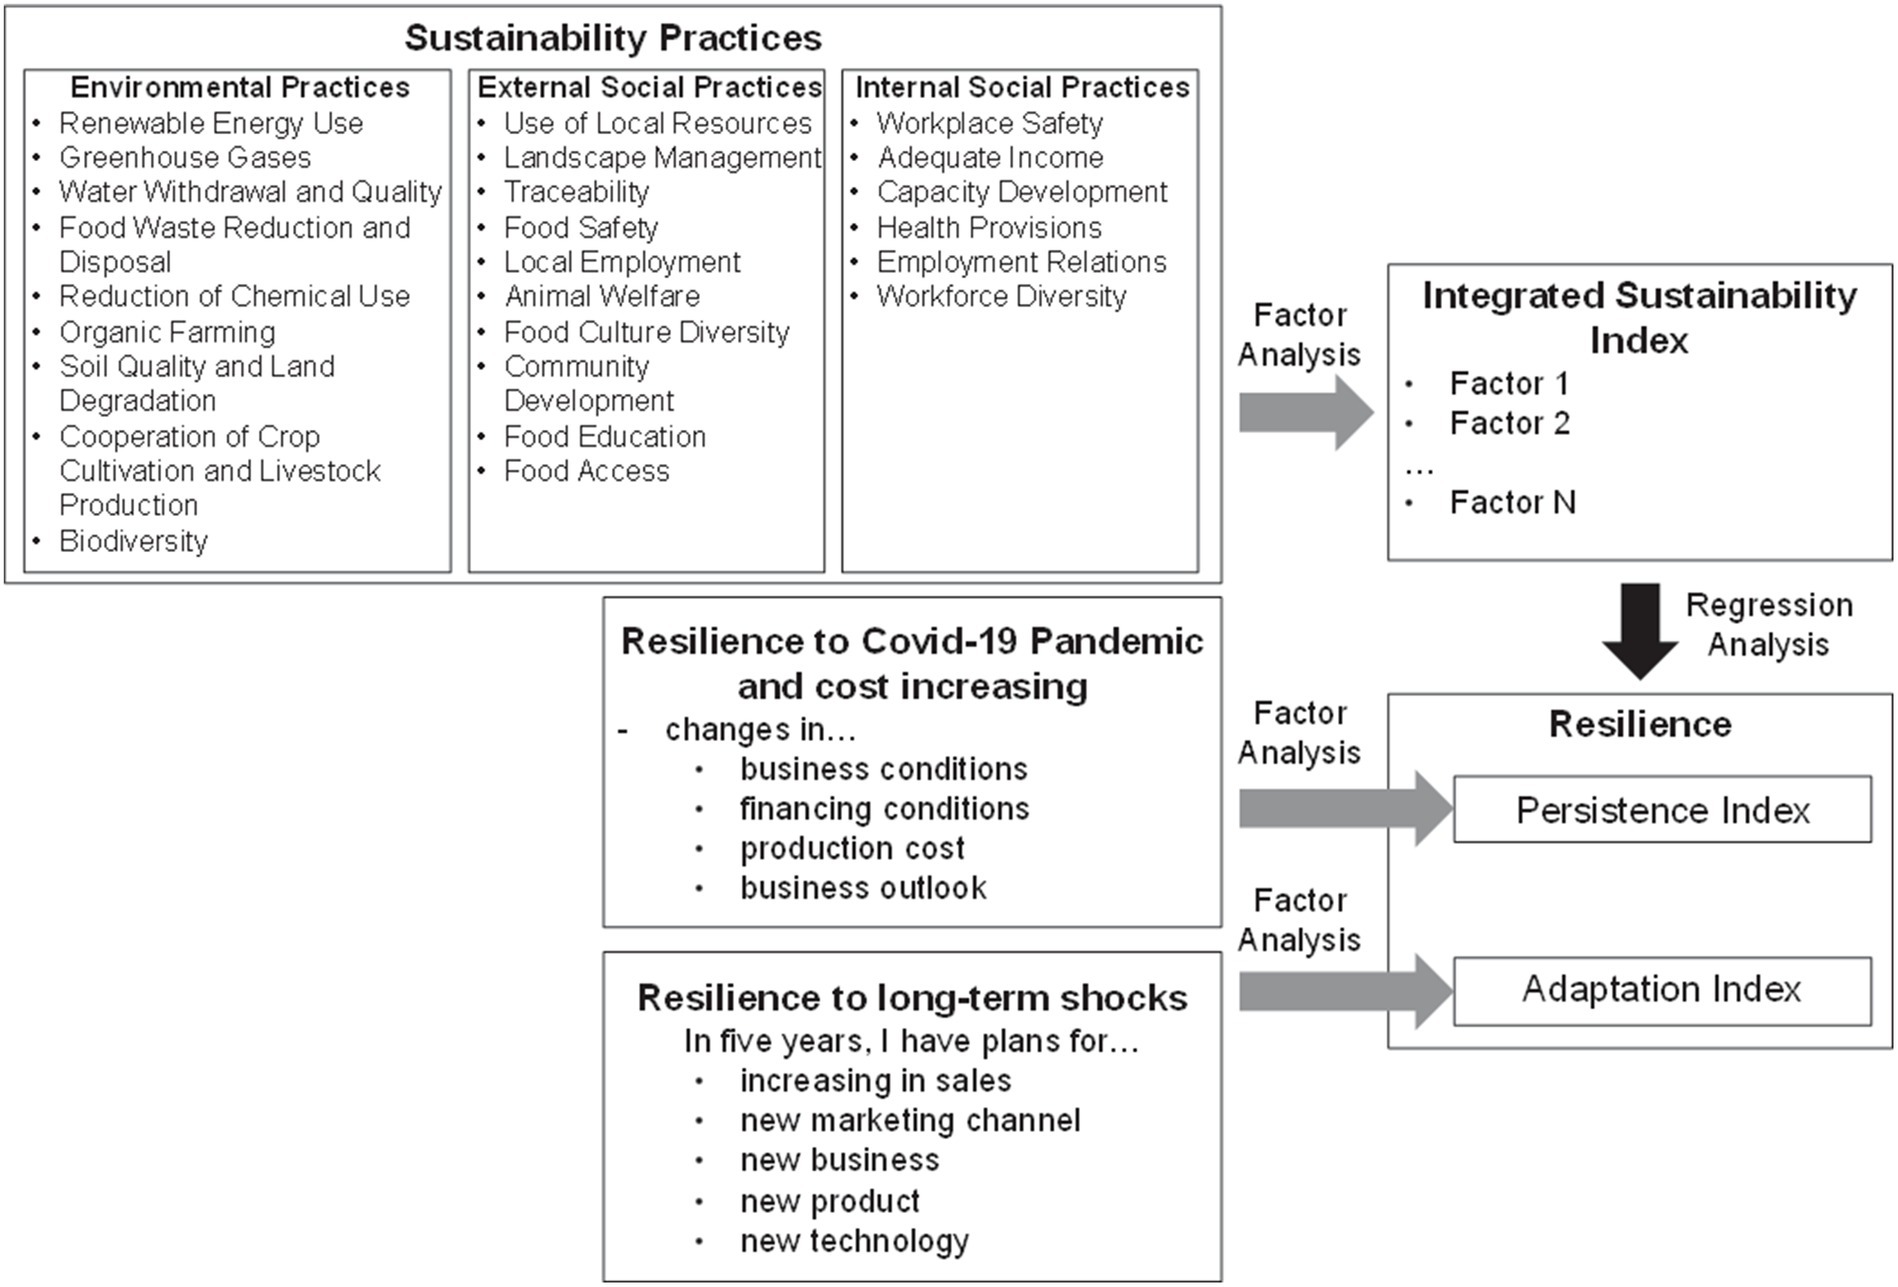
Figure 3. Analytical framework.
3.2.1 Integrated sustainability index
Sustainability practices are categorized into three themes: environmental (9 items), external social (10 items), and internal social (6 items). Indicators are dummy variables representing the presence or absence of specific activities. Referring to Table 1, the content of these indicators was discussed with the agriculture department of the Japan Finance Corporation, which administers the questionnaire, to incorporate responses to specific environmental and social issues in Japan.
More specifically, in addition to the sub-themes in Table 1, environmental sustainability includes the sub-themes “Reduction of Chemical Use” and “Organic Farming” which the production methods promoted by the government. “Cooperation of Crop Cultivation and Livestock Production” is another practice that attracts attention in Japan as a recycling-oriented agriculture that utilizes the by-products of each agricultural production. For external social sustainability, “Community development” in Table 1 is broken down into several indicators. The first is “Community Development,” which refers to the preservation of local traditional events. The second is “Use of Local Resources,” which refers to the utilization of natural and social capital. The last is “Local employment,” which means the creation of local employment. In addition to “Food Safety,” which means ensuring the safety of the production process, “Traceability,” which means recording the production history, was added. “Non-discrimination” is included in “workforce diversity” under internal social sustainability because it is considered to be an argument mainly applicable to employees within farms. On the other hand, sustainable procurement was excluded from the indicators, since small- and medium-sized farms are rather suppliers chosen by large enterprises. “Sense of community” was excluded from the indicators because it is mainly a discussion about labor unions in large companies.
One of the principal objectives of this study is to account for and integrate the interactions among these 25 variables. To do so, we develop indices using a factor analysis conducted on all variables across the three themes. This method demonstrates the feasibility of developing integrated sustainability indices that are meaningful to farmers and aligned with their sustainability goals. When the variables used in factor analysis are ordinal variables rather than continuous variables, it is recommended to use polychoric correlations instead of the usual Pearson correlations (Holgado–Tello et al., 2010). In that previous paper, binary variables can be treated as a special form of ordinal variables, and the correlation coefficients in that case are called tetrachoric correlations. In this study, sustainability practice indicators are dummy variables representing the presence or absence of specific activities. Therefore, in this study, tetrachoric correlations are calculated and used for factor analysis.
The number of factors is determined using a parallel analysis. The rationale underlying parallel analysis is that “nontrivial components from real data with a valid underlying factor structure should have larger eigenvalues than parallel components derived from random data having the same sample size and number of variables (Hayton et al., 2004).” Although parallel analysis is known to be more accurate than other methods of determining the number of factors, it is a method that is generally underutilized (Fabrigar et al., 1999). Then, in parallel analysis, eigenvalues obtained from real data are plotted against eigenvalues obtained from random data, and we retain only factors for which eigenvalues obtained from real data are obviously larger in the analysis. In addition, if the sample size is sufficiently large, it is recommended that variables with factor loading greater than 0.4 be used for factor interpretation (Guadagnoli and Velicer, 1988). To verify the overview of the integrated sustainability index, mean values of the factor scores for each farm type (rice, vegetable, dairy, and beef cattle) and farming area type (urban, plains, mid-mountainous, and mountainous) are compared using analysis of variance.
3.2.2 Resilience
Every six months, the Japan Finance Corporation surveys all farmers with whom it does business to ascertain how their business has fared compared to the previous year. This study uses the survey responses as indicators of farm persistence resilience. The survey asks about changes in the following four areas: business conditions, financing conditions, product cost, and business outlook (see Table 2 for details). As all of these indicators are also on the ordinal scale, they are quantified similarly to the integrated sustainability index. Then, the process of the factor analysis used to the integrated sustainability index is also applied in developing the resilience index. In this case, polychoric correlation is calculated for four ordinal variables. This resilience index represents the persistence component in the capacity for resilience, as it assesses the extent of improvement under recent business conditions.
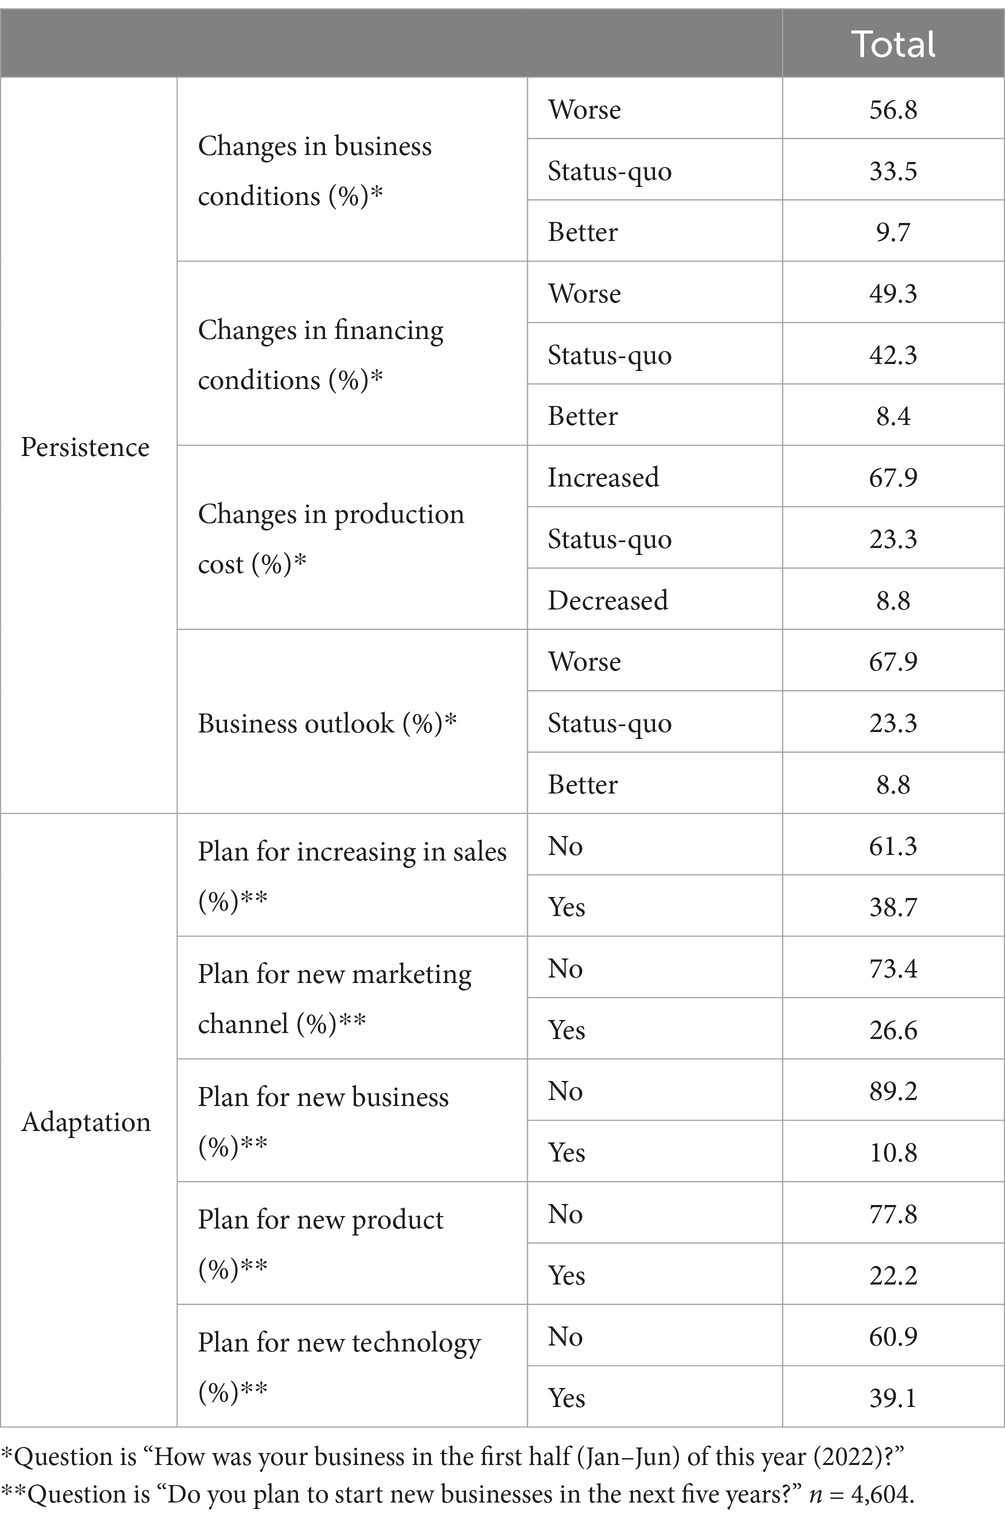
Table 2. Characteristics of persistence and adaptation indicators.
Regarding adaptation, the business plans spanning the forthcoming five years serve as indicators of adaptive resilience for the factor analysis. The types of business plans encompass increasing sales, exploring new marketing channels, starting new businesses, developing new products, and adopting new technology. The same factor analysis process can still be applied to these binary variables as is used for the integrated sustainability index.
3.2.3 Resilience and sustainability
Finally, we conduct regression analyses to identify the impact of sustainability practices on resilience. OLS regressions are performed using the resilience indices as the dependent variables and the integrated sustainability indices as independent variables. Other control variables include farm type, sales (ordinal variable), agricultural firm dummy, geographic type, and region. Assuming that the error terms are correlated for each farm type, cluster robust standard errors are used.
4 Data
As noted above, we use a questionnaire survey administered by Japan Finance Corporation as our data source. The survey targeted farmers who have borrowed funds to support their businesses. It was mailed in June 2022, garnering a response rate of 23% (6,772 respondents). Thus, the analysis considers the considerable variability in sustainability practices across different farm types. It is reasonable to assume that viable sustainability practices differ considerably, depending on the socio-economic and environmental conditions in which a given farm operates. Therefore, we restrict our analysis to farm types for which the sample size exceeds 500 to estimate variation within each farm type accurately. The analysis focuses on four types of farms, namely, rice farms (n = 2,180), vegetable farms (n = 1,254), dairy farms (n = 595), and beef cattle farms (n = 575), resulting in a total sample size of 4,604.
These four farm types essentially include arable farm (rice and vegetable) and livestock farm (dairy and beef cattle), which are expected to differ greatly in their sustainable practices and resilience status during this study period. Accounting for this variation among farm types contributes to the validity of the results of this study. Furthermore, according to the 2020 Census of Agriculture and Forestry, these four farm types account for 76.6% of the total number of farms in Japan. Even when limited to livestock production, the share of dairy and beef cattle farms is 84.2%. In other words, the four farm types in this study cover a wide range of the Japanese agricultural structure and are appropriate as a sample.
Table 3 presents the characteristics of the sample used in this study, showing the distribution of the number of farmers by farm type in this questionnaire and the Census of Agriculture and Forestry. The results show that this study’s proportion of rice farms is relatively low. Table 3 also reveals that the proportion of farmers with more than 100 million yen in sales is higher in this study than in the census for all farm types. It is important to note that the analysis in this study is confined to farmers with relatively large-scale operations who obtain business-related loans from government-sponsored financial institutions.
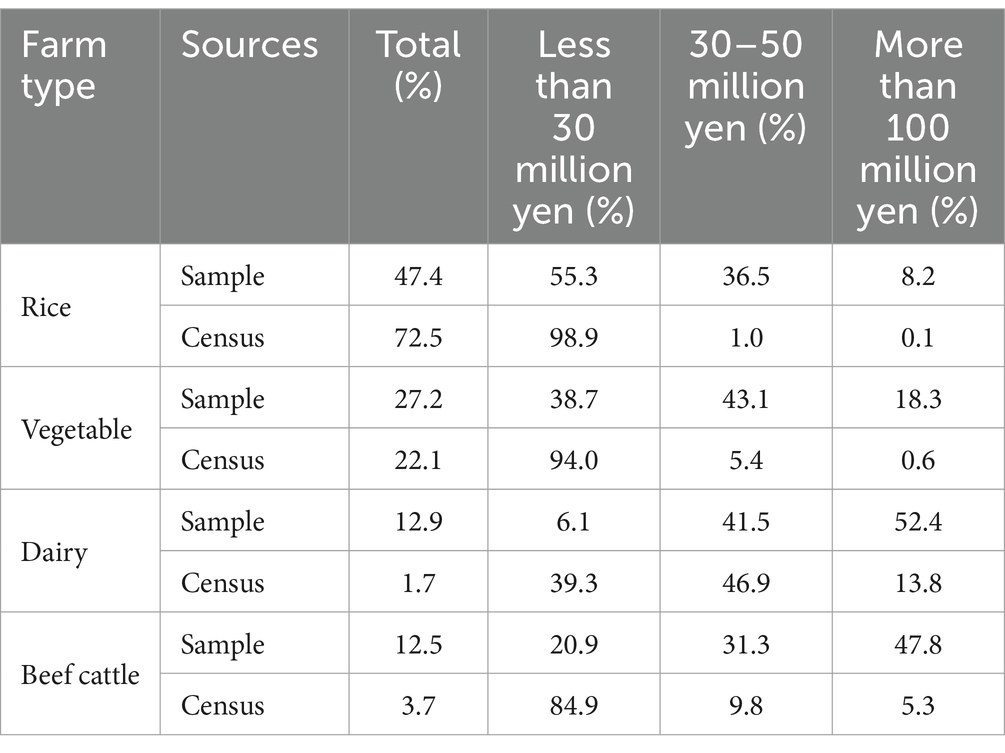
Table 3. Comparisons of data between the survey and agricultural census.
5 Results
5.1 Sustainability practices
Figure 4 depicts the percentage of respondents committed to sustainability practices by farm type. Regarding environmental sustainability, approximately 30% of rice and vegetable farms exhibit involvement in “reduction of chemical use” and “organic farming.” Notably, rice farming, which relies heavily on water as a natural resource, is characterized by a high degree of attention toward “water withdrawal and quality.” Over 50% of dairy and beef cattle farms pursue “cooperation of crop cultivation and livestock production.” This practice has garnered attention for its environmentally friendly aspects through resource recycling and its capacity to mitigate increasing production costs.
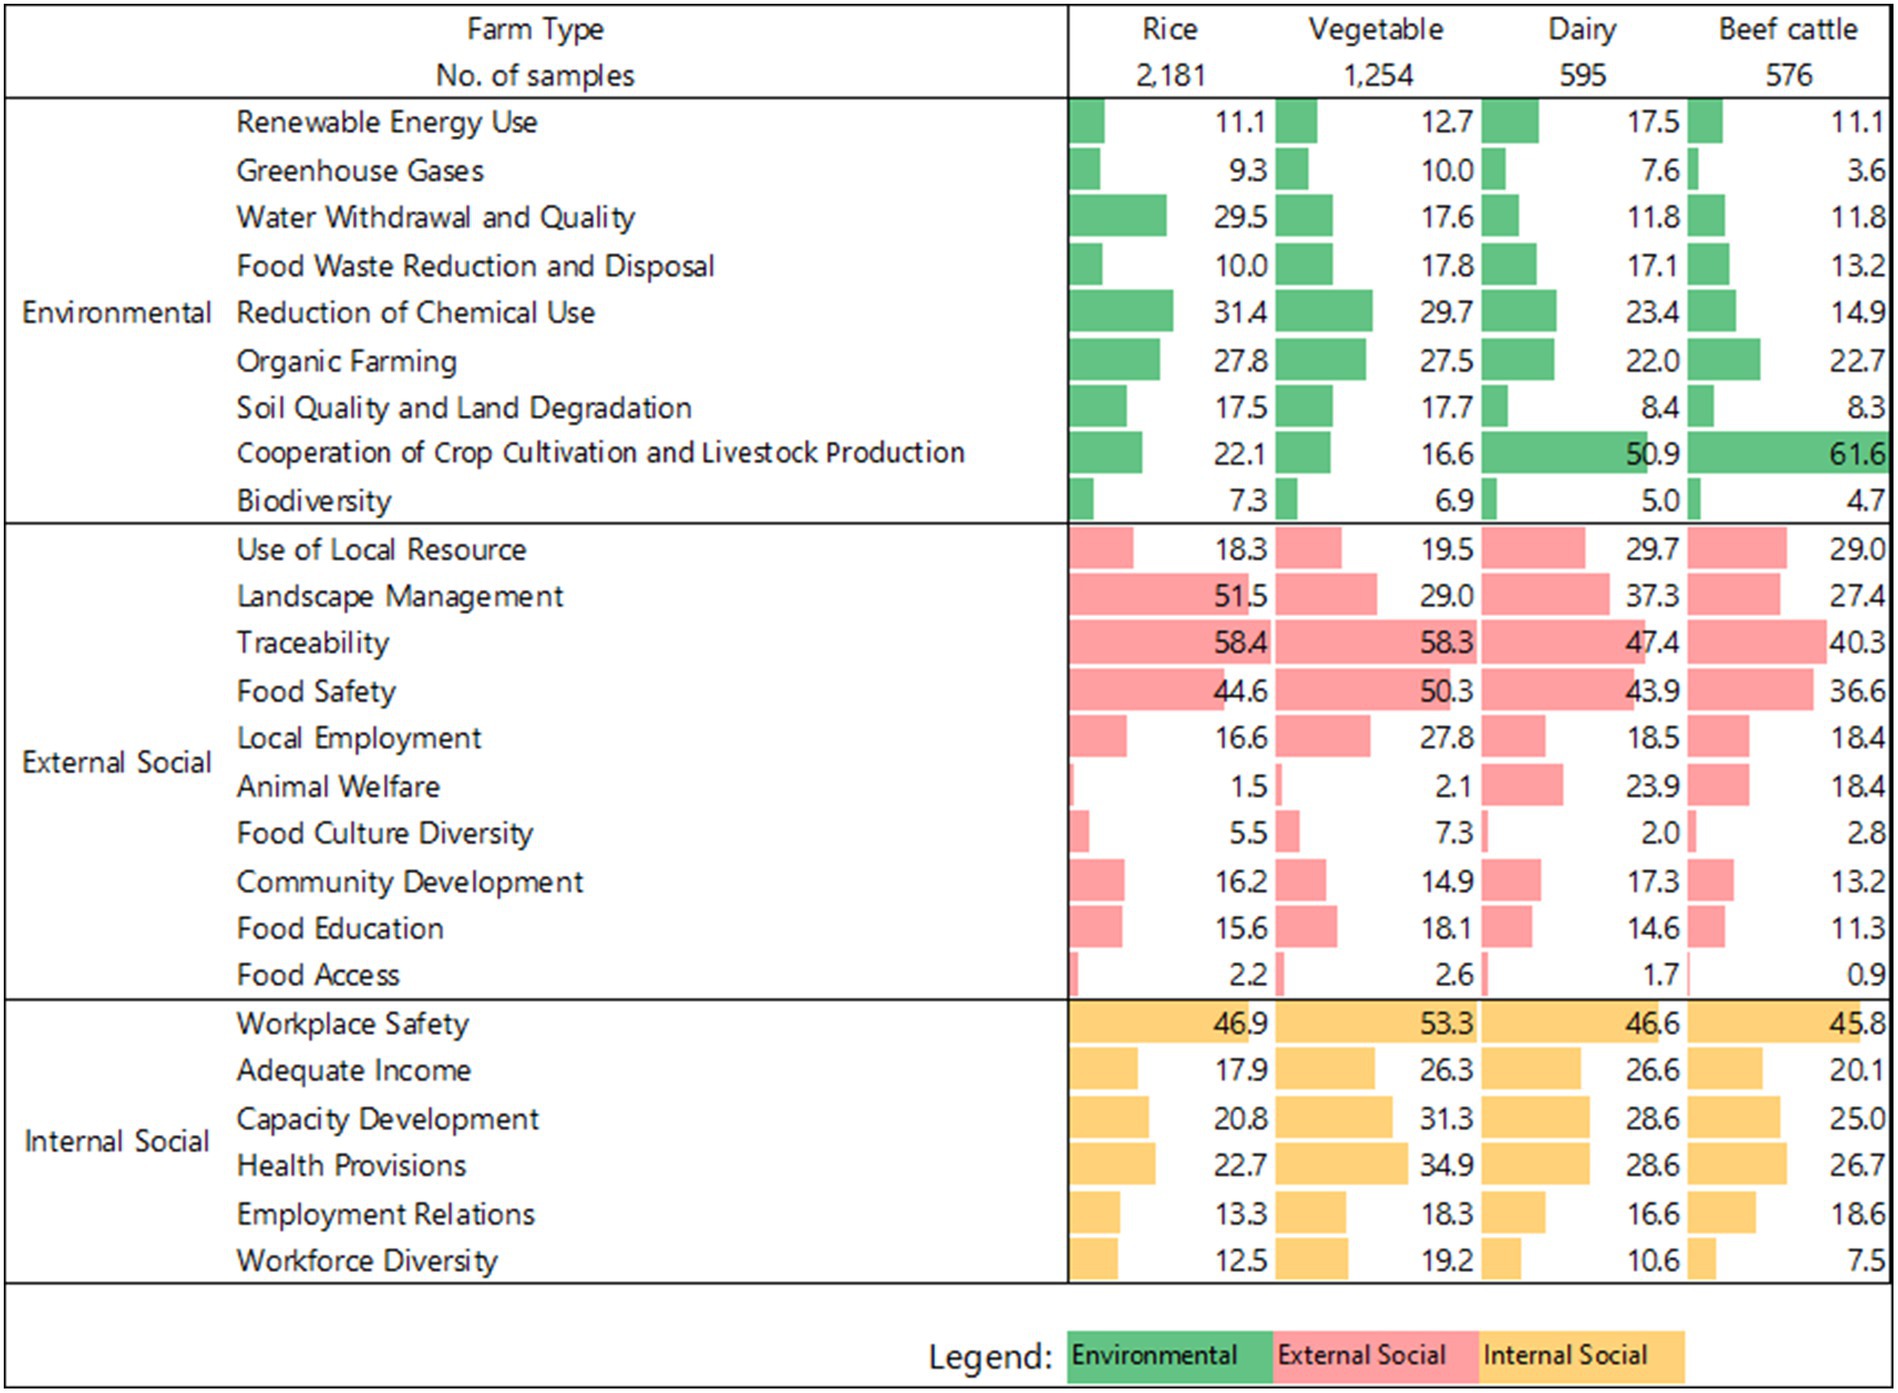
Figure 4. Proportion of sustainability practices. Survey question—“Which of the following sustainability practices are you implementing? (Multiple answer).”
In the category of external social sustainability, “traceability” and “food safety” are the most prominent practices, implying widespread production process innovations. Most rice farms included in the survey have implemented “landscape management,” indicating that rice farming significantly impacts Japan’s rural landscape. For vegetable farms, “local employment” is a popular form of pursuing social sustainability. Meanwhile, many dairy and beef cattle farms engage in practices involving the “use of local resources.” However, there is limited interest in some issues where agriculture is expected to play a significant role, including “food culture diversity” and “food access.”
Concerning internal social sustainability, “workplace safety” is the top priority for respondents across all farming types. However, investment in human resources such as “adequate income” and “capacity development” is relatively low. Aside from vegetable farms, only about 10% of farms prioritize “workforce diversity.” These findings emphasize the need for sustainability assessments in Japanese agriculture to encompass not only the environment, local communities, and consumers but also the welfare of farm employees.
5.2 Integration of sustainability practices
Based on a tetrachoric correlation analysis on sustainability indicators (see Supplementary Table S1), we employ a factor analysis to analyze the underlying farmers’ sustainability goals and use the factor scores as integrated sustainability indices. Figure 5 of the parallel analysis indicates that farmers’ sustainability goals can be characterized by six factors. Table 4 displays the factor loadings of these sustainability indicators within the six-factor model. Factor 1 includes high factor loadings for “local employment” and for all internal social sustainability elements, excluding “workforce diversity.” Hence, factor 1 is interpreted to represent the goal of job creation and investment in human capital, which we summarize as “caring for employees.” However, the factor loading for “Workplace Safety” is relatively low at 0.41, indicating that income and human resource development are more important in caring for employees.
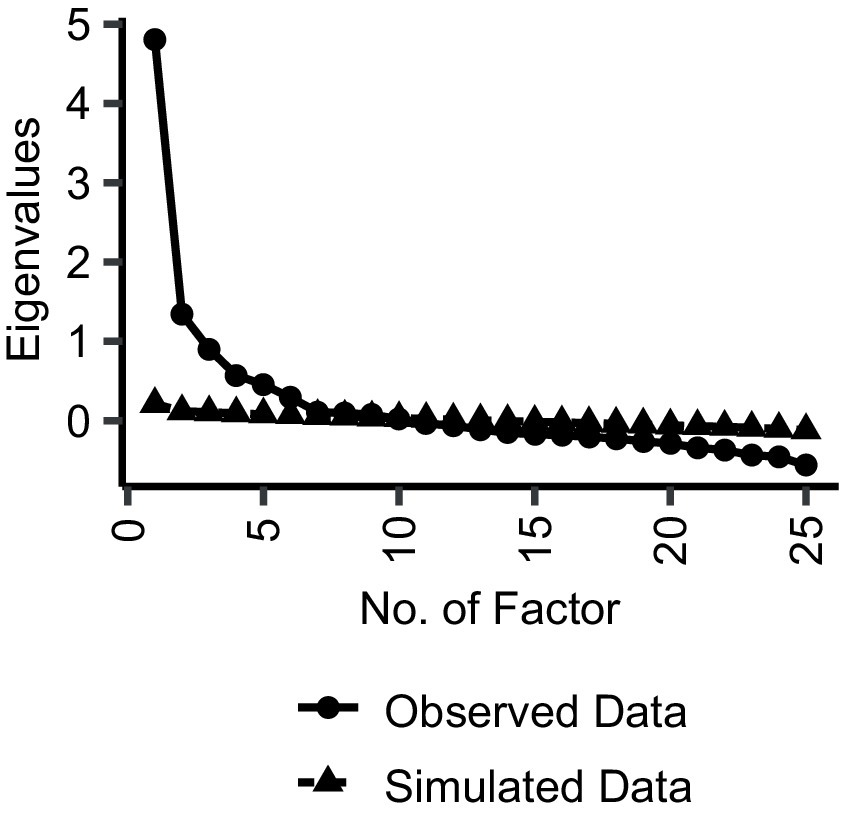
Figure 5. Parallel analysis for factor analysis on the sustainability index. The number of clusters where the eigenvalue from actual data certainly exceeds that of simulated data is six.
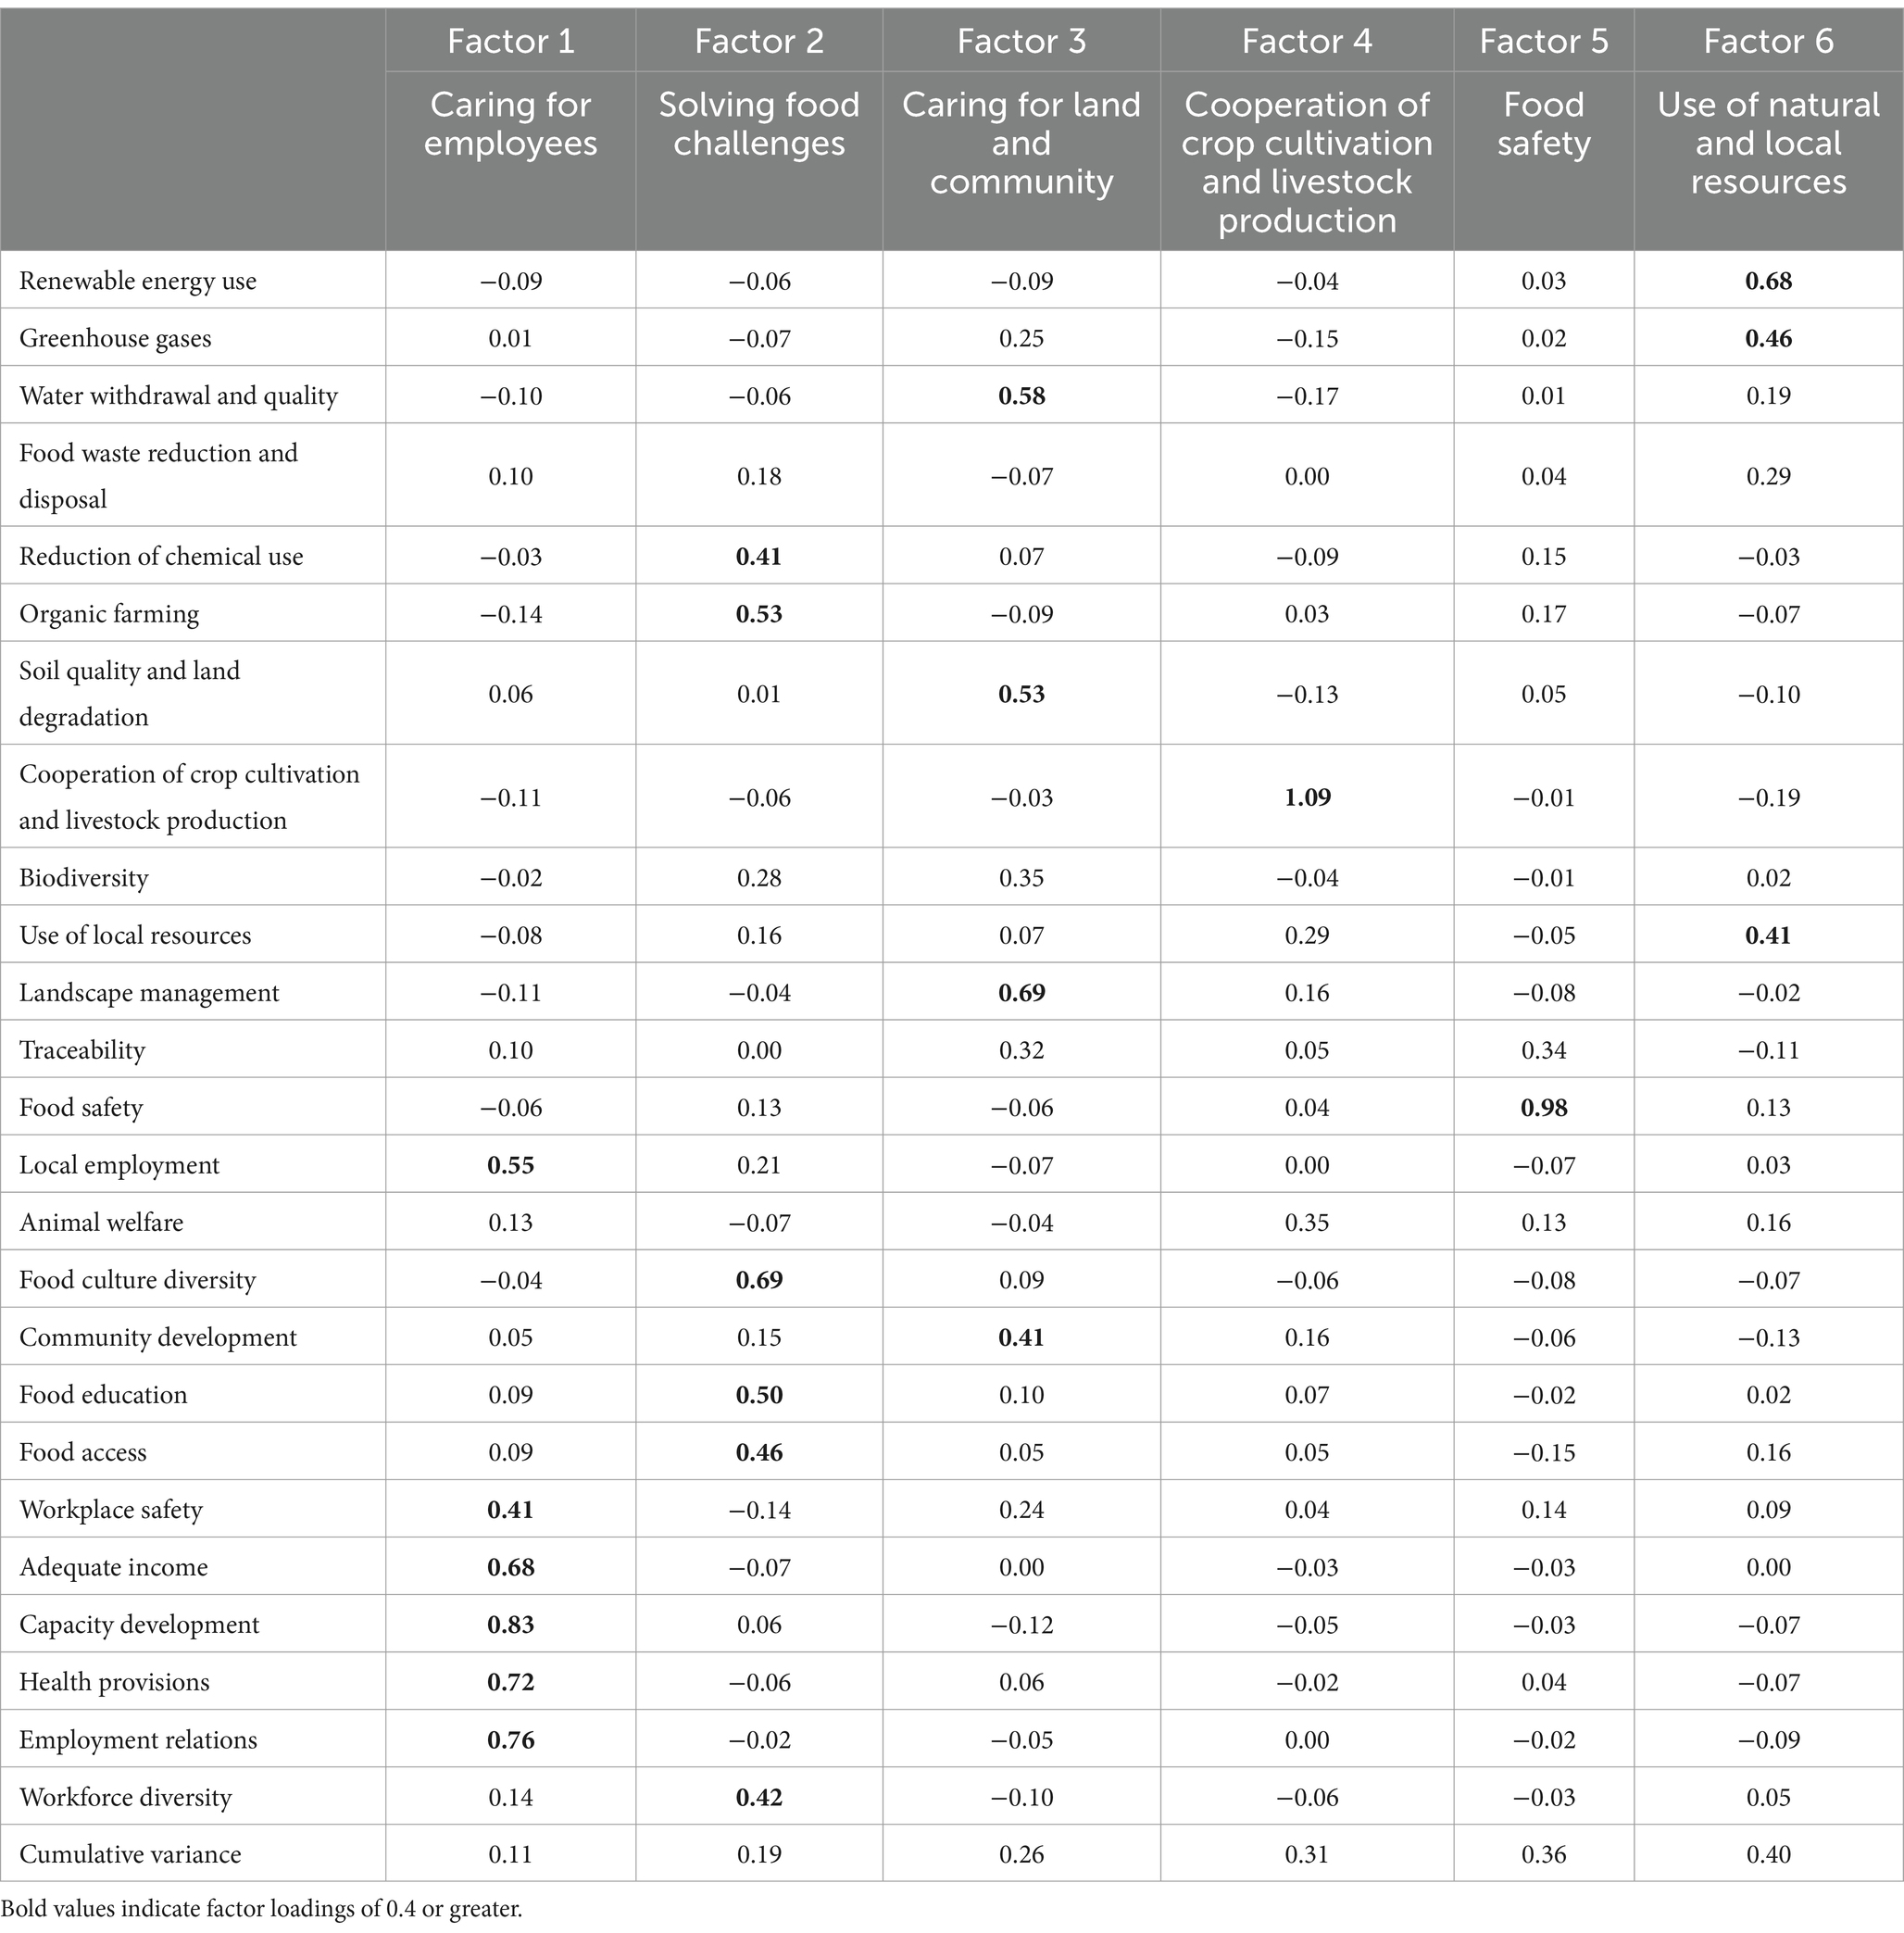
Table 4. Factor analysis for integrated sustainability indices.
Factor 2 incorporates food-related issues such as “food culture diversity,” “food education.” and “food access” into the environmental sustainability concerns represented by “reduction of chemical use” and “organic farming.” Thus, this factor addresses environmental and social issues linked to food and can be defined as “solving food challenges.” Factor 3 centers on conserving water and soil resources, encompassing aspects such as “water withdrawal and quality” and “soil quality and land degradation,” as well as the upkeep and enhancement of the region, including “landscape management” and “community development.” Accordingly, this factor is labeled as “caring for land and community,” signifying that farmers consider the conservation of local land and community as an integral part of their farming activities.
Factor 4 and factor 5 are composed exclusively of “cooperation of crop cultivation and livestock production” and “food safety,” respectively. Factor 4 also exhibits a relatively higher factor loading for “animal welfare,” which indicates it is a primary objective for livestock farmers. Factor 6 exhibits high factor loadings for climate change mitigation measures, including “renewable energy use” and “greenhouse gases reduction,” as well as for the “use of local resources.” Therefore, it can be defined as “use of natural and local resources,” as it aims to promote the efficient and integrated use of natural and local resources.
Four of these six factors denote the interactions between environmental sustainability and external or internal social sustainability indicators. This fact shows the importance of incorporating sustainability practices that align with farmers’ specific goals rather than solely analyzing the indicators or classifications obtained from standardized themes, supporting the hypothesis 1.
According to the results of the analysis of variance on the characteristics of the integrated sustainability indices by farming type and farming area type (Table 5), vegetable farms prioritize “caring for employees,” “solving food challenges,” and “food safety.” In contrast, rice farmers exhibit a significantly higher mean value for the “caring for land and community” factor than other farm types.

Table 5. Comparisons of integrated sustainability indices among farm type and geographic type.
Examining the relationship between geographic type and sustainability goals shows that “caring for employees,” “solving food challenges,” and “food safety” are predominantly addressed in urban regions. This fact may be attributed to the higher demand for quality working conditions and more health-conscious consumers in urban areas, where conditions for agricultural production are not always favorable due to urban sprawl.
5.3 Farm resilience index
Table 2 displays the descriptive statistics concerning the resilience index. As for the persistence resilience index, fewer than 10% of respondents said business or financing conditions, production costs, or the business outlook improved.
Additionally, Table 2 also demonstrates the indicators of adaptive resilience. Less than half of farmers had plans for any activities in the next five years. The results of Table 2 indicate that a limited number of farmers possess resilience capacities, such as persistence and adaptation, in the current socio-economic environment.
Table 6 exhibits the factor analysis findings conducted for the persistence index. Figure 6 of parallel analysis for persistence indicates the presence of a one-factor model in this context. This fact substantiates that the four indicators above collectively form the persistence index. Similarly, Table 7 presents the outcomes of the factor analysis conducted for the adaptation index. Figure 6 of the parallel analysis for adaptation suggests a two-factor model as optimal. Factor 1 demonstrates substantial factor loadings for “Plan for new marketing channel,” “Plan for new business,” and “Plan for new product,” indicating that it serves as an index representing farmers’ inclination towards diversifying their farms. On the other hand, factor 2 solely displays a large factor loading for “Plan for new technology.” Hence, this factor signifies farmers’ inclination towards future technological transformation.
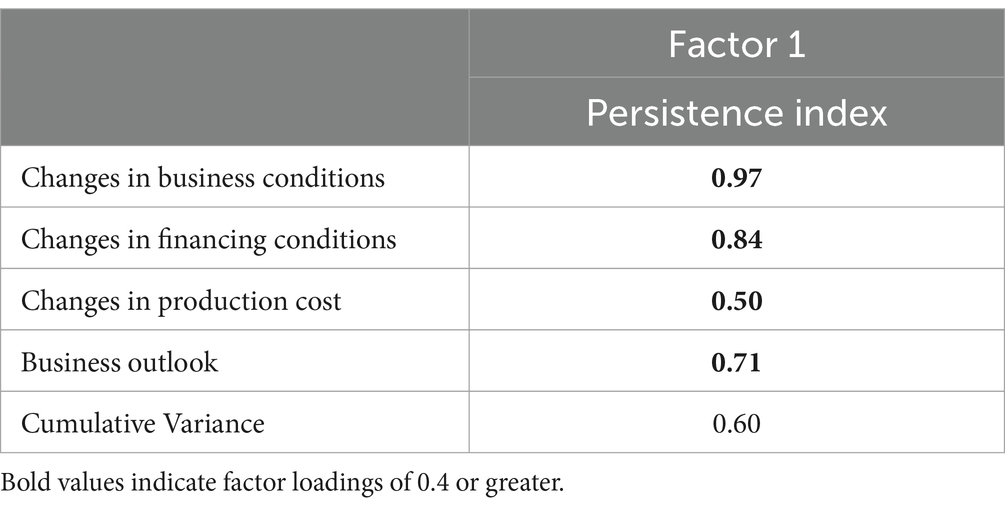
Table 6. Factor analysis for persistence index.
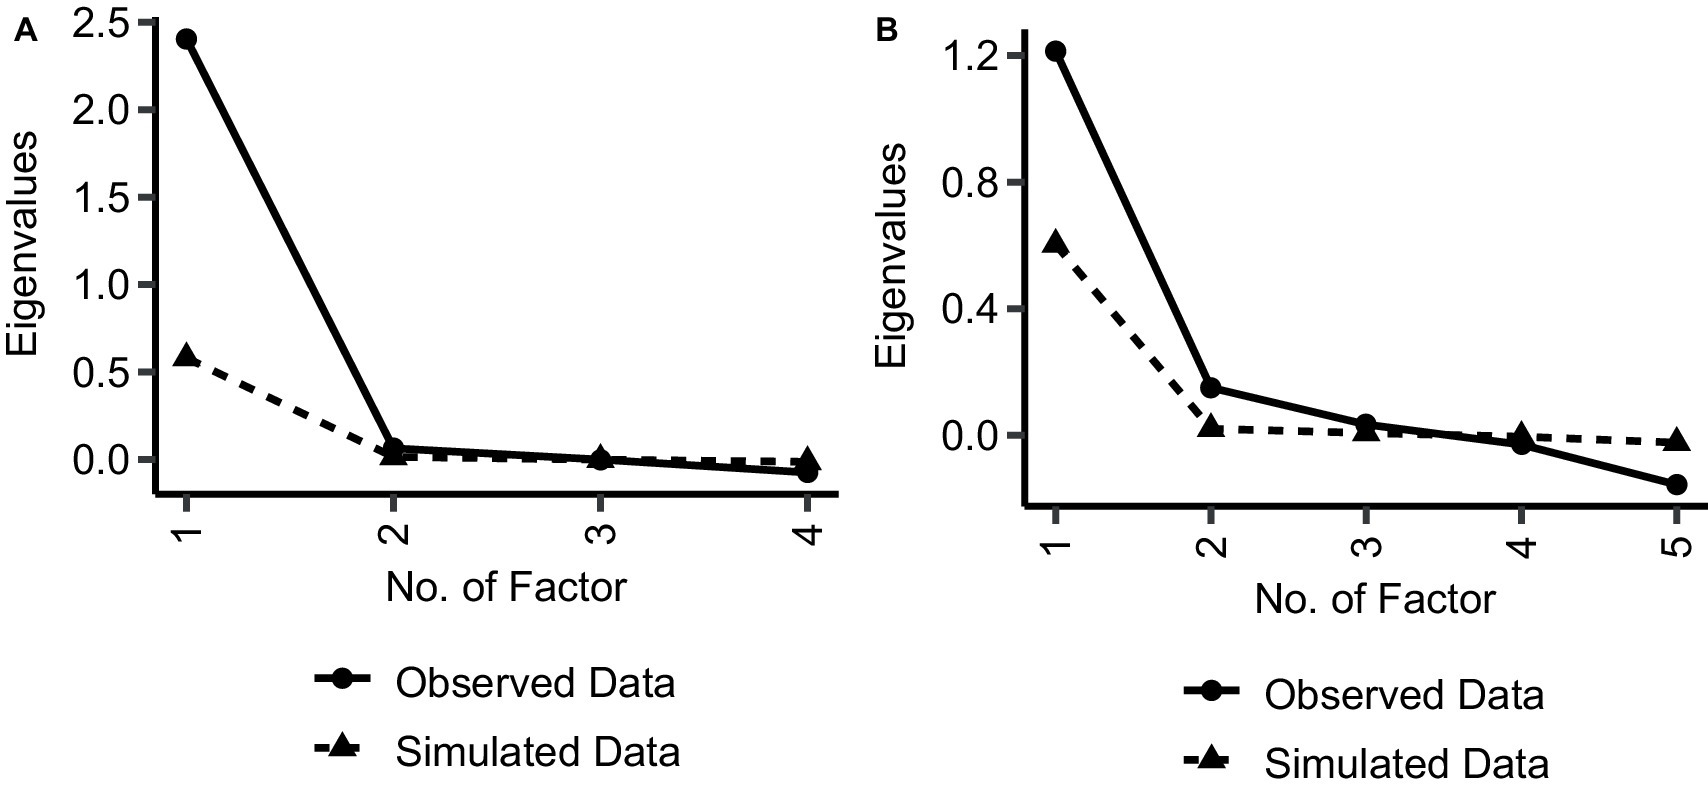
Figure 6. Parallel analysis for factor analysis on the farm resilience [(A) persistence and (B) adaptation]. (A) The number of clusters where the eigenvalue from actual data certainly exceeds that of simulated data is one. (B) The number of clusters where the eigenvalue from actual data certainly exceeds that of simulated data is two.
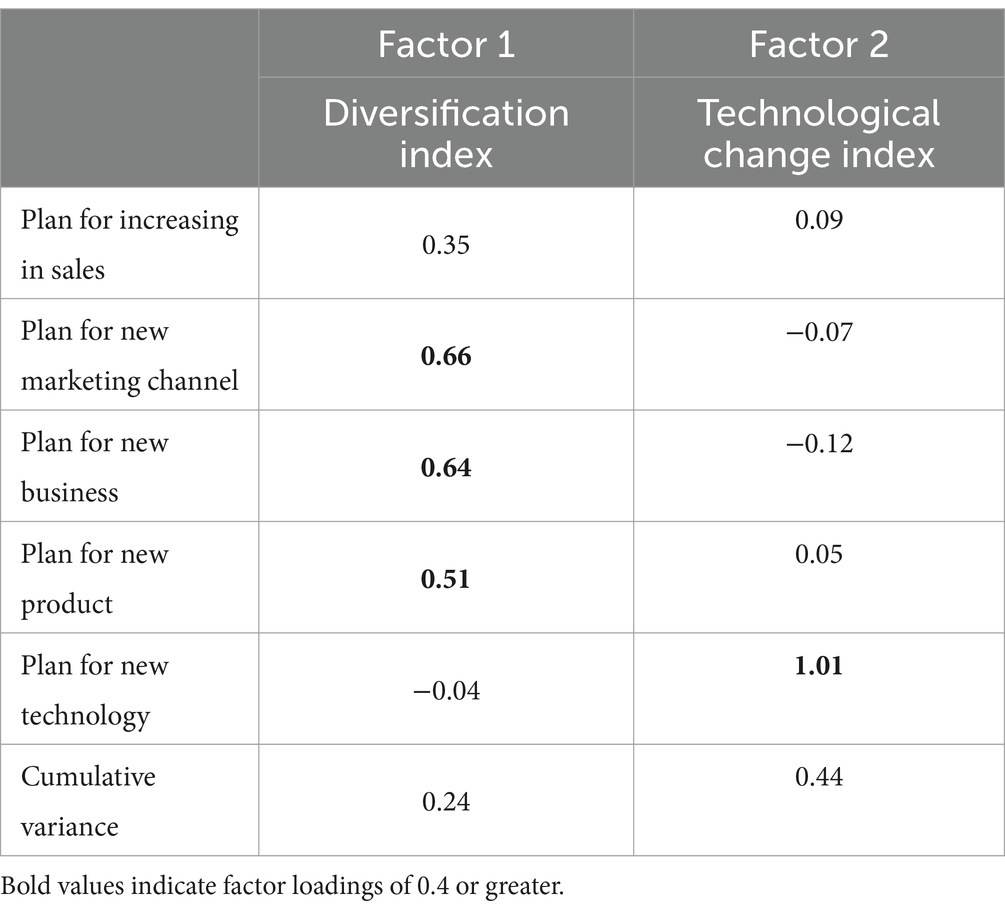
Table 7. Factor analysis for adaptation index.
5.4 Relationship between integrated sustainability index and farm resilience
The results of the regression analysis of the relationship between resilience and sustainability, controlling for the fundamental variables (see Supplementary Table S2), are presented in Table 8. Regarding the integrated sustainability index, we note that “caring for employees,” “solving food challenges,” and “use of natural and local resources” are positively correlated with the persistence index, supporting the hypothesis 2. These sustainability practices are, therefore, key attributes of short-term resilience.
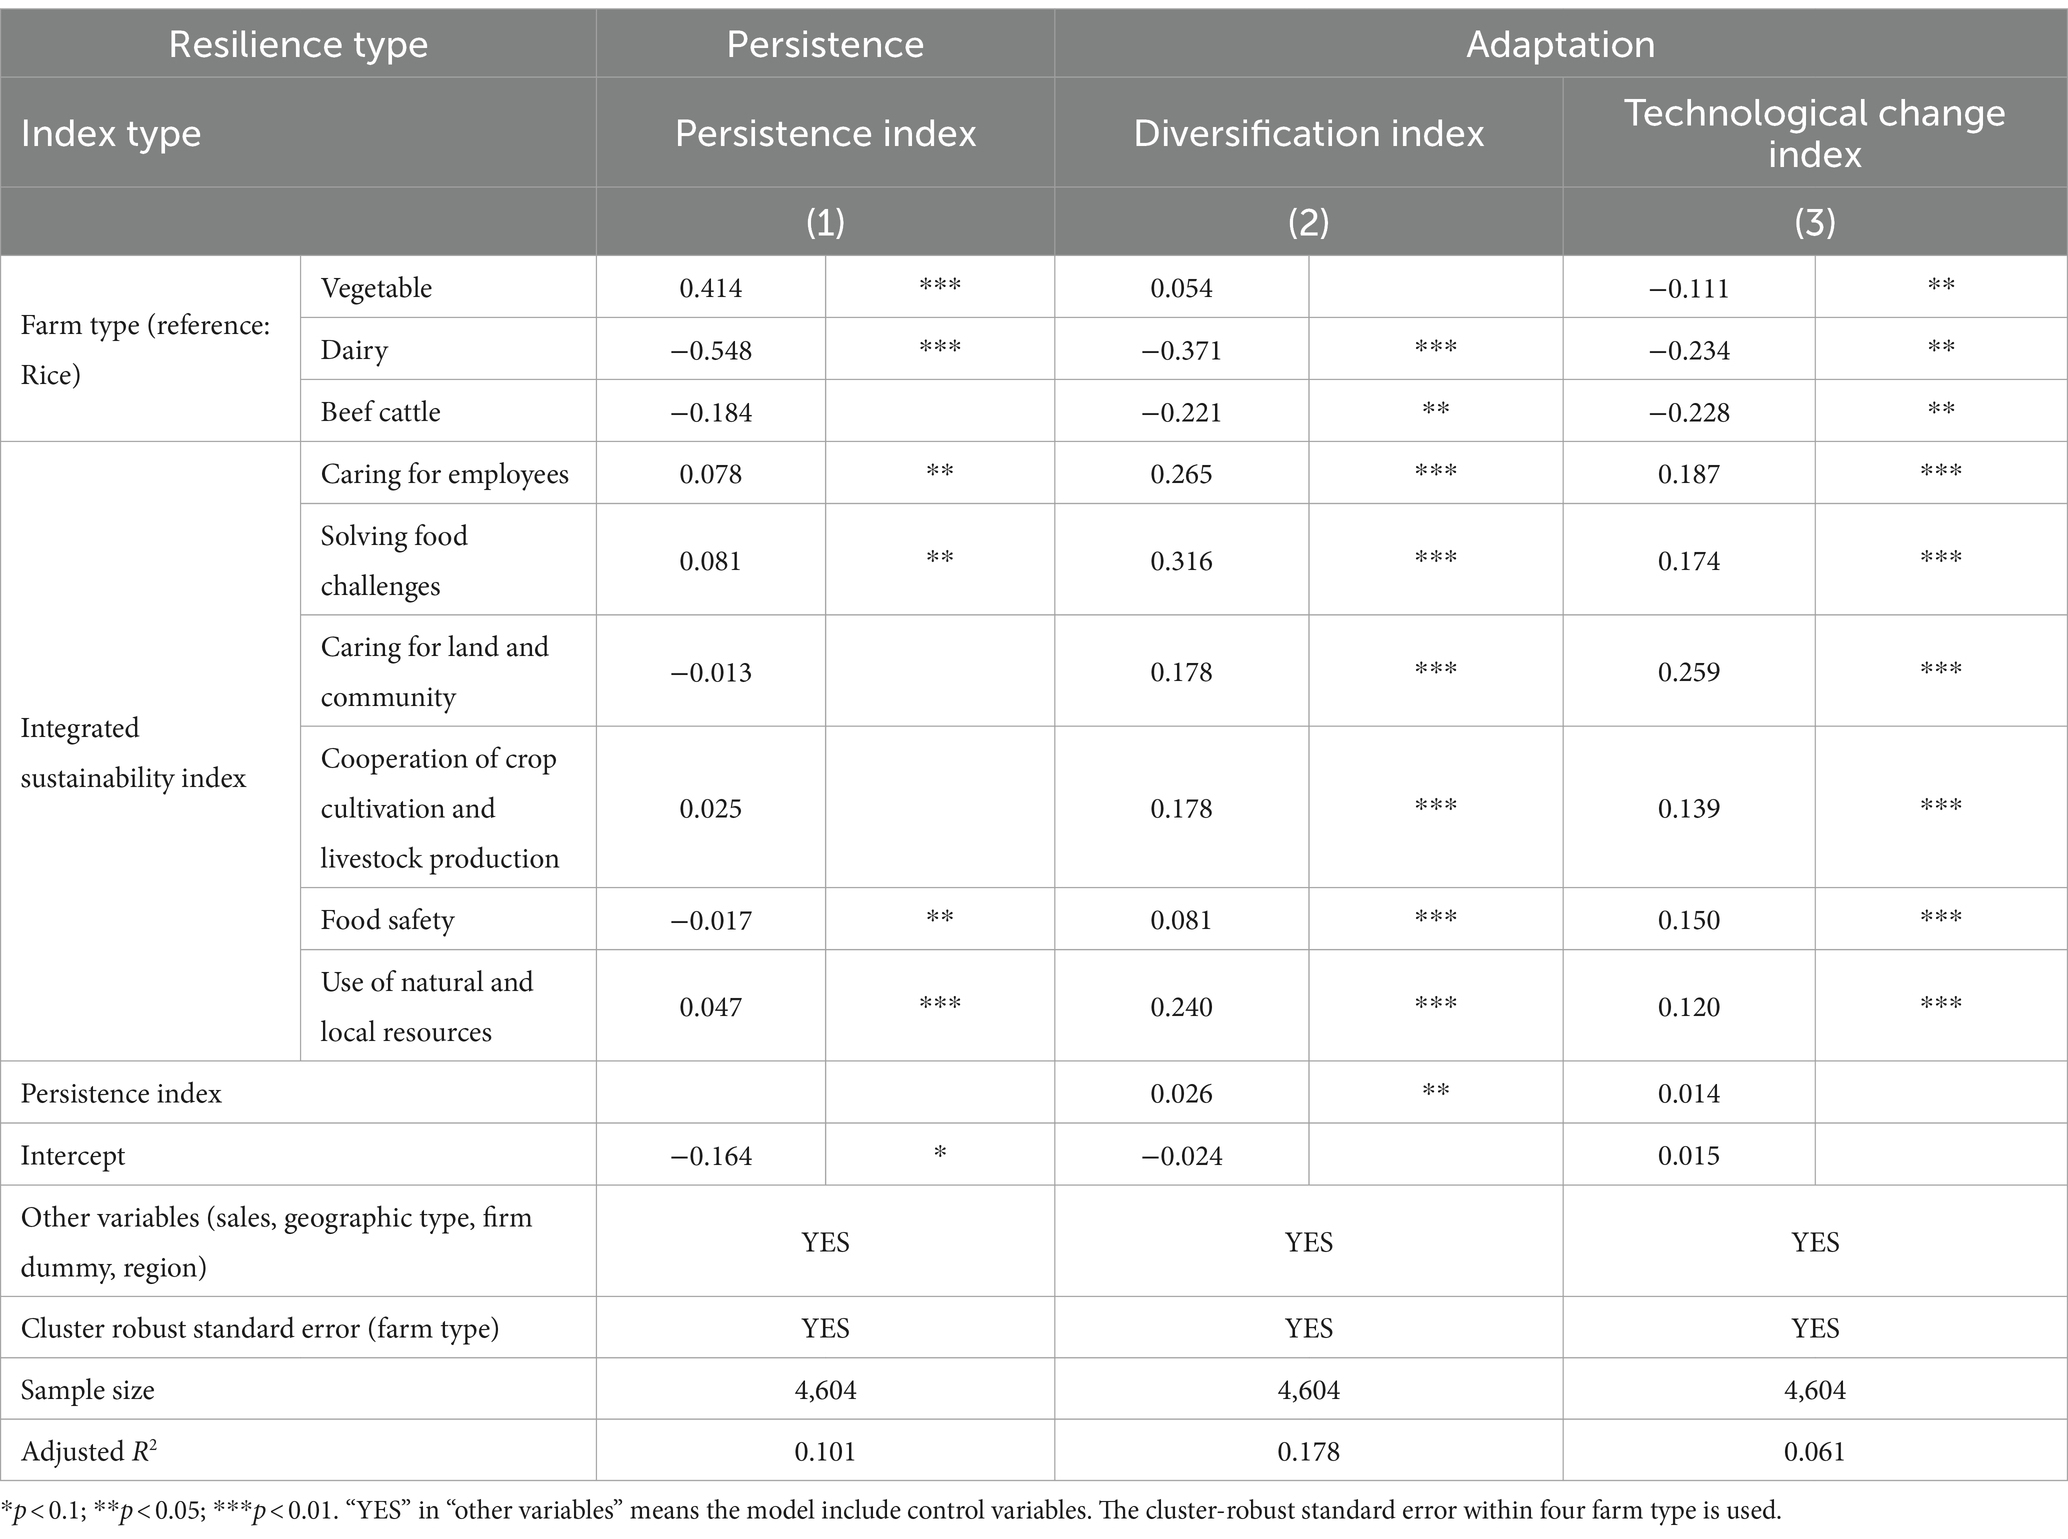
Table 8. Effects of integrated sustainability indices on farm resilience.
In addition to these three sustainability indices, the remaining three integrated sustainability indices, “caring for land and community,” “cooperation of crop cultivation and livestock production,” and “food safety,” are positively associated with the diversification index and technological change index, suggesting that a broader range of sustainability goals may potentially play a crucial role in the long-term adaptation aspect of resilience rather than in short-term persistence. This finding supports the hypothesis 3.
The positive effect of the persistence index on the diversification index suggests that demonstrating short-term resilience is an important step in attaining long-term resilience. The Aroian test estimated the indirect effects of each integrated sustainability index through the positive impact of the persistence index on the diversification index, and found that “caring for employees,” “solving food challenges,” and “use of natural and local resources” all had positive indirect effects (p < 0.01).
Table 8 also presents the resilience levels of four farm types. The coefficient for vegetable farms is the highest for the persistence index, while the coefficient for dairy farms is the lowest. These findings suggest that the effects of shocks such as the COVID-19 pandemic and rising production costs, which are the focus of this study, vary considerably across farm types. Regarding the adaptive resilience, rice and vegetable farms exhibit a greater propensity for planning various novel activities than livestock farms. Furthermore, rice farms predominantly prioritize the pursuit of technological transformation. Our results highlight a significant connection between integrated sustainability indices and farm resilience, even after accounting for farm types and other control variables.
6 Discussion
The results of the analysis conducted in this study are summarized in Figure 7. In this section, we discuss the implications of these findings.
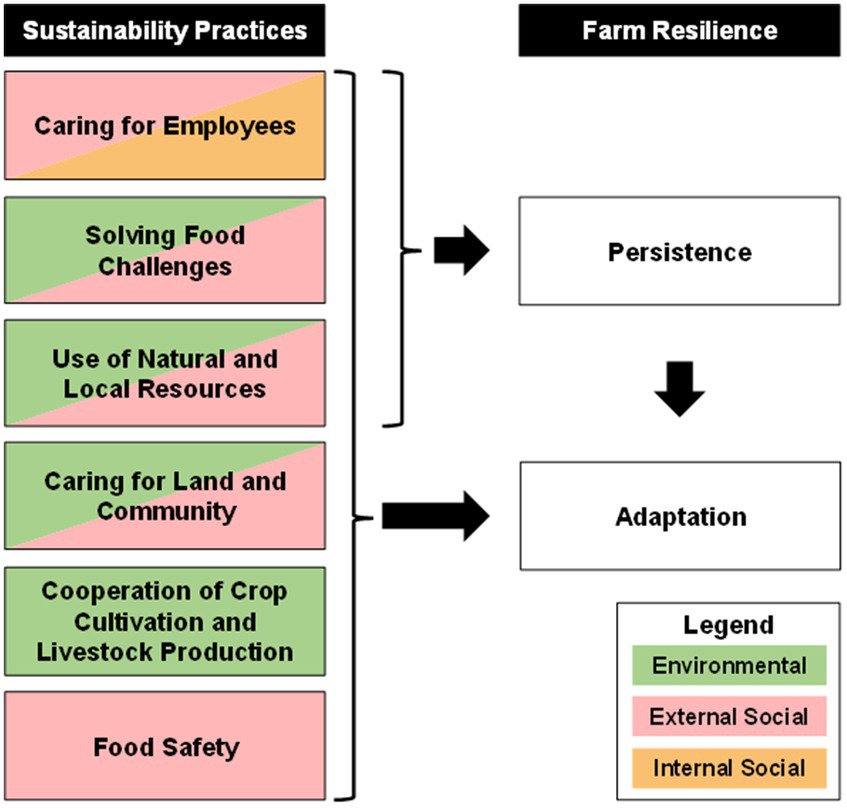
Figure 7. Summary of this study.
6.1 Validity of integrated sustainability index approach
The integrated sustainability index highlights the sustainability goals of Japanese farmers by accounting for the interactions between ranges of sustainability indicators. The findings show that four of the six factors we identify display linkages between environmental, external social, and internal social sustainability. This result confirms there is complementarity among sustainability practices (Binder et al., 2010) using practice-based indicators (FAO, 2013) of small and medium-sized farmers. As such, the results suggest that the indices used in this study are more adept at evaluating farmers’ sustainability endeavors than an index that integrates all indicators (Gómez-Limón and Sanchez-Fernandez, 2010) or that integrates indicators within a single theme (Van Calker et al., 2005; Meul et al., 2008; Ripoll-Bosch et al., 2012).
Using the indices constructed in this study reveals dissimilarities concerning certain sustainability practices by farm type, including consideration for employees and food-related challenges in vegetable farms, consideration for land and community in rice farms, employment of natural and local resources in dairy farms, and arable-livestock interdependence in beef cattle farms. Moreover, we demonstrate that the orientation of sustainability practices varies based on geography-based qualities. Notably, the findings that highlight differences in active consideration for employees and food-related challenges in urban areas, which face inherent farming difficulties, imply that sustainability practices are crucial in the continuity of farming in disadvantaged areas.
6.2 Enhancing farm resilience through sustainability practices
The post-COVID-19 economic turbulence precipitated a decline in economic performance for over half of all farmers during the study period. Furthermore, the proportion of farmers intending to alter their management practices within the forthcoming five years remained notably modest. Regression analysis elucidates substantial variations in economic performance across different farm types, notably highlighting the precarious situation within livestock farming sectors such as dairy and beef production. In essence, enhancing farm resilience emerges as a crucial imperative for the agricultural sector to surmount such economic adversities.
While previous study has shown a positive correlation between agricultural sustainability and resilience using country-level aggregate data (Volkov et al., 2022), this study has quantitatively demonstrated the impact of sustainability practices on farm resilience by indexing agricultural sustainability and farm resilience at the farm level. Moreover, by dividing agricultural resilience into persistence and adaptation, we have succeeded in approaching the important issue of identifying factors that lead to transformability resilience in agriculture (Meuwissen et al., 2021).
Firstly, the integrated sustainability indices developed in this study provide a better understanding of the relationship between farm resilience and sustainability. We find that “caring for employees,” “solving food challenges,” and “utilizing natural and local resources” are positively correlated with the farm resilience index for persistence. Consistent with the previous study (Meuwissen et al., 2018), one factor contributing to resilience could be the preservation and development of human resources through “caring for employees.” Secondly, “solving food challenges” is a resilience attribute for sustainable production. As shown in previous studies (Mastronardi et al., 2020, 2022; Yoshida and Yagi, 2021; Grigorescu et al., 2022; Little and Sylvester, 2022), diversifying to tackle various food-related challenges is also a crucial attribute of resilience. Finally, “utilizing natural and local resources” contributes to the resilience attribute of risk management by diversifying management resources. As shown in the previous study (Binder et al., 2010), this result suggests that implementing multiple practices aligned with each sustainability goal is critical to enhancing farm resilience.
On the other hand, we do not find a positive relationship between “caring for land and community” and the persistence index. This sustainability goal has traditionally been recognized as a critical function of Japanese rice farming, which helps preserve rural landscapes and communities. Nonetheless, if such activities are not linked to short-term farm resilience, this poses a significant challenge to the continuity of rural Japan. Similarly, “cooperation of crop cultivation and livestock production” and “food safety,” emphasized administratively in recent years, exhibit a weak relationship with farm resilience. In other words, while certain sustainability practices have a strong complementary relationship with farm resilience, others have a weak connection. The latter will only be able to maintain in the long term with measures to support continuous farm efforts.
Secondly, we observe a stronger positive correlation between sustainability practices and the long-term adaptive resilience indices. In other words, resilience attributes attained through sustainability practices are more closely associated with innovations that may significantly alter a farm’s management style in the long term rather than short-term financial performance improvements. As a form of diversification that transforms farm management and farm identity, sustainability practices promote stakeholder management and involvement, which are known to be highly effective in promoting transformability (Nera et al., 2020; Soriano et al., 2023). Furthermore, the adaptive resilience index has been shown to be influenced by the persistence resilience index. Consequently, the sustainability practices indirectly affect long-term resilience through short-term resilience improvement. Considering that many farm resilience studies indicate a lack of factors promoting transformability (Meuwissen et al., 2021), this study highlights the significant role that sustainability practices play in enhancing adaptive farm resilience.
The social implications of the above results are discussed. First, financial institutions can consider socially and environmentally sustainable practices in agriculture as a risk management tool and use them in their financing and investment decisions. Second, Japan’s Ministry of Agriculture, Forestry and Fisheries (MAFF) has developed guidelines on ESG regional finance. The results of this study provide evidence for the effectiveness of such guidance and also suggest a simplified method of identifying and interpreting sustainable practices. Third, for farmers who implement sustainable practices, the contribution of this study is that it clearly shows the process of achieving agricultural sustainability, in which farmers can attain economic sustainability by choosing multiple sustainable practices according to their business objectives.
7 Conclusion
This study aims to quantitatively examine the relationships that connect sustainability and farm resilience using indices that consider the interactions between sustainability indicators in agriculture. An analysis was conducted using the results of a questionnaire survey administered by a publicly-held Japanese bank. First, the findings indicate a complementary relationship between environmental, external social, and internal social sustainability, and six integrated sustainability indices were developed using factor analysis. This result suggests that to assess farmers’ sustainability practices adequately, they must be quantified in a way that aligns with the sustainability goals of farmers in each country or region. Second, a regression analysis demonstrates the positive relationship between sustainability and farm resilience. In the area of farm resilience, which has lacked a quantitative evaluation, this study makes a novel contribution by explicitly revealing the role of sustainability practices in responding to the shocks of the COVID-19 pandemic and the sharp rise in production costs resulting from Russia’s invasion of Ukraine. Furthermore, this study demonstrates that sustainability practices are strongly related to long-term adaptive resilience.
The limitations and future research suggested by this study are threefold. First, practice-based indicators that incorporate the level and extent of such practices will be required to develop a more precise sustainability index. The most important task will be to develop a list of evaluation items. According to previous research, the development of a valid sustainability assessment framework requires the active involvement of farmers from the start, alongside dialogue with other stakeholders across the food chain (Coteur et al., 2016). Then, once the list of the sustainable practices is completed, the causal relationship between the practices and the presumed outcomes needs to be scrutinized (Meul et al., 2008). Here, advice from experts in the respective fields and an extensive literature review are indispensable. Lastly, in order to verify the validity of the indicators, it is still important to take into account the context of each country and region. Hence multi-country surveys and comparative studies will be required.
Secondly, this study needs a way to verify the mechanisms by which sustainability practices affect farm resilience. Sustainability practices are expected to influence various attributes that constitute the foundation of farm resilience. Further research is needed to explore the role of sustainability practices in developing farm resources, networks, production, and learning.
In conclusion, this study holds several implications for developing an international index of agricultural sustainability. The integrated sustainability index approach presented here can serve as a valuable tool to accurately depict farmers’ sustainability practices and to evaluate their effectiveness in enhancing farm resilience and performance. However, it should be noted that the interactions among the indicators underlying the index developed here may differ considerably across countries and regions. Therefore, the integrated sustainability index approach should be applied with care and tailored to the specific objectives and scope of the investigation. Additionally, empirical analyses of the relationship between integrated sustainability index and farm resilience in different countries and regions will help ascertain sustainability practices’ universality in promoting long-term farm development. The accumulation of such empirical studies would be a crucial step toward refining an integrated sustainability index into a useful decision-making tool for farmers.
Data availability statement
The original contributions presented in the study are included in the article/Supplementary material, further inquiries can be directed to the corresponding author.
Author contributions
SY: Conceptualization, Data curation, Formal analysis, Funding acquisition, Investigation, Methodology, Project administration, Resources, Software, Validation, Writing – original draft, Writing – review & editing.
Funding
The author(s) declare financial support was received for the research, authorship, and/or publication of this article. This work was supported by the Japan Society for the Promotion of Science [grant number 23K14036]. This study received non-financial support from the Japan Finance Corporation, which conducted an annual survey that included the items used in this study.
Conflict of interest
The author declares that the research was conducted in the absence of any commercial or financial relationships that could be construed as a potential conflict of interest.
Publisher’s note
All claims expressed in this article are solely those of the authors and do not necessarily represent those of their affiliated organizations, or those of the publisher, the editors and the reviewers. Any product that may be evaluated in this article, or claim that may be made by its manufacturer, is not guaranteed or endorsed by the publisher.
Supplementary material
The Supplementary material for this article can be found online at: https://www.frontiersin.org/articles/10.3389/fsufs.2024.1341197/full#supplementary-material
References
Accatino, F., Paas, W., Herrera, H., Pinsard, C., Severini, S., Appel, F., et al. (2022). “Integrated assessment of the sustainability and resilience of farming systems: lessons from the past and ways forward for the future” in Resilient and sustainable farming Systems in Europe Exploring Diversity and Pathways. eds. M. P. M. Meuwissen, P. H. Feindt, A. Garrido, E. Mathijs, B. Soriano, and J. Urquhart, et al. (Cambridge: Cambridge University Press), 279–301.
Bacon, C. M., Getz, C., Kraus, S., Montenegro, M., and Holland, K. (2012). The social dimensions of sustainability and change in diversified farming systems. Ecol. Soc. 17:41. doi: 10.5751/ES-05226-170441
Binder, C. R., Feola, G., and Steinberger, J. K. (2010). Considering the normative, systemic and procedural dimensions in indicator-based sustainability assessments in agriculture. Environ. Impact Assess. Rev. 30, 71–81. doi: 10.1016/j.eiar.2009.06.002
Bockstaller, C., and Girardin, P. (2003). How to validate environmental indicators. Agric. Syst. 76, 639–653. doi: 10.1016/S0308-521X(02)00053-7
Brammer, S. J., and Pavelin, S. (2006). Corporate reputation and social performance: the importance of fit. J. Manag. Stud. 43, 435–455. doi: 10.1111/j.1467-6486.2006.00597.x
Coteur, I., Marchand, F., Debruyne, L., Dalemans, F., and Lauwers, L. (2016). A framework for guiding sustainability assessment and on-farm strategic decision making. Environ. Impact Assess. Rev. 60, 16–23. doi: 10.1016/j.eiar.2016.04.003
Darnhofer, I. (2014). Resilience and why it matters for farm management. Eur. Rev. Agric. Econ. 41, 461–484. doi: 10.1093/erae/jbu012
Darnhofer, I. (2020). Farm resilience in the face of the unexpected: lessons from the COVID-19 pandemic. Agric. Human Values 37, 605–606. doi: 10.1007/s10460-020-10053-5
Darnhofer, I., Fairweather, J., and Moller, H. (2010). Assessing a farm’s sustainability: insights from resilience thinking. Int. J. Agric. Sustain. 8, 186–198. doi: 10.3763/ijas.2010.0480
Darnhofer, I., and Strauss, A. (2015). Organic farming and resilience. Case Study Report Austria. Rethink project.
De Olde, E. M., Oudshoorn, F. W., Sørensen, C. A. G., Bokkers, E. A. M., and De Boer, I. J. M. (2016). Assessing sustainability at farm-level: lessons learned from a comparison of tools in practice. Ecol. Indic. 66, 391–404. doi: 10.1016/j.ecolind.2016.01.047
El Ghoul, S., Guedhami, O., Wang, H., and Kwok, C. C. Y. (2016). Family control and corporate social responsibility. J. Bank. Financ. 73, 131–146. doi: 10.1016/j.jbankfin.2016.08.008
European Commission (2021). Road map–Ares (2021) 3651157. European Commission, Conversion of FADN to a Farm Sustainability Data Network (FSDN). Available at: https://ec.europa.eu/info/law/better-regulation/have-your-say/initiatives/12951-Conversion-to-a-Farm-Sustainability-Data-Network-FSDN-_en (Accessed March 26, 2023).
European Commission, Directorate-General for Agriculture and Rural Development (2022). EU agricultural outlook for markets, income and environment 2022–2032, Publications Office of the European Union.
European Union (2020). Farm to fork strategy for a fair, healthy and environmentally friendly food system. European Union. Available at: https://food.ec.europa.eu/horizontal-topics/farm-fork-strategy_en (Accessed March 26, 2023).
Fabrigar, L. R., Wegener, D. T., MacCallum, R. C., and Strahan, E. J. (1999). Evaluating the use of exploratory factor analysis in psychological research. Psychol. Methods 4, 272–299. doi: 10.1037//1082-989x.4.3.272
FAO (2013). Sustainability assessment of food and agriculture systems (SAFA) guidelines (version 3.0). Rome: FAO.
Fatemi, A., Fooladi, I., and Tehranian, H. (2015). Valuation effects of corporate social responsibility. J. Bank. Financ. 59, 182–192. doi: 10.1016/j.jbankfin.2015.04.028
Friede, G., Busch, T., and Bassen, A. (2015). ESG and financial performance: aggregated evidence from more than 2000 empirical studies. J. Sustain. Financ. Invest. 5, 210–233. doi: 10.1080/20430795.2015.1118917
Gómez-Limón, J. A., and Sanchez-Fernandez, G. (2010). Empirical evaluation of agricultural sustainability using composite indicators. Ecol. Econ. 69, 1062–1075. doi: 10.1016/j.ecolecon.2009.11.027
GRI Standards (2022). GRI 13: Agriculture, Aquaculture and Fishing Sectors. Available at: https://www.globalreporting.org/search/?query=GRI+13 (Accessed March 26, 2023).
Grigorescu, I., Popovici, E.-A., Damian, N., Dumitracscu, M., Sima, M., Mitrică, B., et al. (2022). The resilience of sub-urban small farming in Bucharest metropolitan area in response to the COVID-19 pandemic. Land Use Policy 122:106351. doi: 10.1016/j.landusepol.2022.106351
Guadagnoli, E., and Velicer, W. F. (1988). Relation of sample size to the stability of component patterns. Psychol. Bull. 103, 265–275. doi: 10.1037/0033-2909.103.2.265
Hani, F., Braga, F. S., Stampfli, A., Keller, T., Fischer, M., and Porsche, H. (2003). RISE, a tool for holistic sustainability assessment at the farm level. Int. Food Agribus. Manag. Rev. 6, 78–90. doi: 10.22004/ag.econ.34379
Hayton, J. C., Allen, D. G., and Scarpello, V. (2004). Factor retention decisions in exploratory factor analysis: a tutorial on parallel analysis. Organ. Res. Methods 7, 191–205. doi: 10.1177/1094428104263675
Herman, A., Lähdesmäki, M., and Siltaoja, M. (2018). Placing resilience in context: investigating the changing experiences of Finnish organic farmers. J. Rural. Stud. 58, 112–122. doi: 10.1016/j.jrurstud.2017.12.029
Holgado–Tello, F. P., Chacón–Moscoso, S., Barbero–García, I., and Vila–Abad, E. (2010). Polychoric versus Pearson correlations in exploratory and confirmatory factor analysis of ordinal variables. Qual. Quant. 44, 153–166. doi: 10.1007/s11135-008-9190-y
Hull, C. E., and Rothenberg, S. (2008). Firm performance: the interactions of corporate social performance with innovation and industry differentiation. Strategic Manage. J. 29, 781–789. doi: 10.1002/smj.675
Japan Finance Corporation (2023). Agricultural business conditions survey (January 2023). Japan Finance Corporation. Available at: https://www.jfc.go.jp/n/findings/pdf/topics230314a.pdf (Accessed March 26, 2023).
Khafagy, A., and Dwyer, J. C. (2022). Synergies and gaps between farm and non-farm micro-level data for sustainable rural development. In: 29th meeting of the OECD network for farm-level analysis, remote.
Latruffe, L., Diazabakana, A., Bockstaller, C., Desjeux, Y., Finn, J., Kelly, E., et al. (2016). Measurement of sustainability in agriculture: a review of indicators. Stud. Agric. Econ 118, 123–130. doi: 10.7896/j.1624
Lebacq, T., Baret, P. V., and Stilmant, D. (2013). Sustainability indicators for livestock farming. A review. Agron. Sustain. Dev. 33, 311–327. doi: 10.1007/s13593-012-0121-x
Li, L., Li, G., Tsai, F.-S., Lee, H.-Y., and Lee, C.-H. (2019). The effects of corporate social responsibility on service innovation performance: the role of dynamic capability for sustainability. Sustain. Sci. Pract. Policy 11:2739. doi: 10.3390/su11102739
Little, M., and Sylvester, O. (2022). Agroecological producers shortening food chains during COVID-19: opportunities and challenges in Costa Rica. Agric. Human Values 39, 1133–1140. doi: 10.1007/s10460-022-10298-2
Mastronardi, L., Cavallo, A., and Romagnoli, L. (2020). Diversified farms facing the Covid-19 pandemic: first signals from Italian case studies. Sustain. Sci. Pract. Policy 12:5709. doi: 10.3390/su12145709
Mastronardi, L., Cavallo, A., and Romagnoli, L. (2022). How did Italian diversified farms tackle Covid-19 pandemic first wave challenges? Socio Econ. Plan. Sci. 82:101096. doi: 10.1016/j.seps.2021.101096
Meul, M., Van Passel, S., Nevens, F., Dessein, J., Rogge, E., Mulier, A., et al. (2008). MOTIFS: a monitoring tool for integrated farm sustainability. Agron. Sustain. Dev. 28, 321–332. doi: 10.1051/agro:2008001
Meuwissen, M. P. M., Feindt, P. H., Slijper, T., Spiegel, A., Finger, R., de Mey, Y., et al. (2021). Impact of Covid-19 on farming systems in Europe through the lens of resilience thinking. Agric. Syst. 191:103152. doi: 10.1016/j.agsy.2021.103152
Meuwissen, M. P. M., Feindt, P. H., Spiegel, A., Termeer, C. J. A. M., Mathijs, E., de Mey, Y., et al. (2019). A framework to assess the resilience of farming systems. Agric. Syst. 176:102656. doi: 10.1016/j.agsy.2019.102656
Meuwissen, M. P. M., Paas, W. H., Slijper, T., Coopmans, I., Ciechomska, A., Lievens, E., et al. (2018). Report on resilience framework for EU agriculture: Sustainable and resilient EU farming systems (SureFarm) project report, work package D1. 1. Wageningen University & Research.
Montanari, F., Ferreira, I., Lofstrom, F., Varallo, C., Volpe, S., Smith, E., et al. (2021). Research for agri committee–preliminary impacts of the COVID-19 pandemic on European agriculture: a sector-based analysis of food systems and market resilience. European Parliament, Policy Department for Structural and Cohesion Policies, Brussels.
Nera, E., Paas, W., Reidsma, P., Paolini, G., Antonioli, F., and Severini, S. (2020). Assessing the resilience and sustainability of a hazelnut farming system in Central Italy with a participatory approach. Sustain. Sci. Pract. Policy 12:343. doi: 10.3390/su12010343
OECD/FAO (2016). OECD-FAO guidance for responsible agricultural supply chains. Paris: OECD Publishing.
Pérez, S., Fernández-Salinero, S., and Topa, G. (2018). Sustainability in organizations: perceptions of corporate social responsibility and Spanish employees’ attitudes and behaviors. Sustain. Sci. Pract. Policy 10:3423. doi: 10.3390/su10103423
Reidsma, P., Paas, W. H., Accatino, F., Appel, F., Black, J., Bijttebier, J., et al. (2020). D5. 6 Impacts of improved strategies and policy options on the resilience of farming systems across the EU. SURE Farm.
Ripoll-Bosch, R., Díez-Unquera, B., Ruiz, R., Villalba, D., Molina, E., Joy, M., et al. (2012). An integrated sustainability assessment of Mediterranean sheep farms with different degrees of intensification. Agric. Syst. 105, 46–56. doi: 10.1016/j.agsy.2011.10.003
Russo, M. V., and Fouts, P. A. (1997). A resource-based perspective on corporate environmental performance and profitability. Acad. Manag. J. 40, 534–559. doi: 10.2307/257052
Saeidi, S. P., Sofian, S., Saeidi, P., Saeidi, S. P., and Saaeidi, S. A. (2015). How does corporate social responsibility contribute to firm financial performance? The mediating role of competitive advantage, reputation, and customer satisfaction. J. Bus. Res. 68, 341–350. doi: 10.1016/j.jbusres.2014.06.024
Sharma, S., and Vredenburg, H. (1998). Proactive corporate environmental strategy and the development of competitively valuable organizational capabilities. Strategic Manage. J. 19, 729–753. doi: 10.1002/(SICI)1097-0266(199808)19:8<729::AID-SMJ967>3.0.CO;2-4
Slijper, T., de Mey, Y., Poortvliet, P. M., and Meuwissen, M. P. M. (2022). Quantifying the resilience of European farms using FADN. Eur. Rev. Agric. Econ. 49, 121–150. doi: 10.1093/erae/jbab042
Soriano, B., Bardaji, I., Bertolozzi, D., San Martíin, C., Spiegel, A., Slijper, T., et al. (2020). D 2.6 report on state and outlook for risk management in EU agriculture.
Soriano, B., Garrido, A., Bertolozzi-Caredio, D., Accatino, F., Antonioli, F., Krupin, V., et al. (2023). Actors and their roles for improving resilience of farming systems in Europe. J. Rural. Stud. 98, 134–146. doi: 10.1016/j.jrurstud.2023.02.003
Spiegel, A., Slijper, T., de Mey, Y., Meuwissen, M. P. M., Poortvliet, P. M., Rommel, J., et al. (2021). Resilience capacities as perceived by European farmers. Agric. Syst. 193:103224. doi: 10.1111/1746-692X.12284
Spiegel, A., Soriano, B., de Mey, Y., Slijper, T., Urquhart, J., Bardají, I., et al. (2020). Risk management and its role in enhancing perceived resilience capacities of farms and farming systems in Europe. EuroChoices 19, 45–53. doi: 10.1016/j.agsy.2021.103224
Surroca, J., Tribó, J. A., and Waddock, S. (2010). Corporate responsibility and financial performance: the role of intangible resources. Strategic Manage. J. 31, 463–490. doi: 10.1002/smj.820
Sustainability Accounting Standards Board (SASB) (2018). Agricultural products sustainability accounting standard. San Francisco, CA: Sustainability Accounting Standards Board.
Van Calker, K. J., Berentsen, P. B. M., Giesen, G. W. J., and Huirne, R. B. M. (2005). Identifying and ranking attributes that determine sustainability in Dutch dairy farming. Agric. Human Values 22, 53–63. doi: 10.1007/s10460-004-7230-3
Volkov, A., Morkunas, M., Balezentis, T., and Streimikiene, D. (2022). Are agricultural sustainability and resilience complementary notions? Evidence from the north European agriculture. Land Use Policy 112:105791. doi: 10.1016/j.landusepol.2021.105791
Waddock, S. A., and Graves, S. B. (1997). The corporate social performance-financial performance link. Strategic Manage. J. 18, 303–319. Available at: https://www.jstor.org/stable/3088143
Walker, B., Holling, C. S., Carpenter, S. R., and Kinzig, A. (2004). Resilience, adaptability and transformability in social--ecological systems. Ecol. Soc. 9:5. doi: 10.5751/ES-00650-090205
Yoshida, S., and Yagi, H. (2021). Long-term development of urban agriculture: resilience and sustainability of farmers facing the Covid-19 pandemic in Japan. Sustain. Sci. Pract. Policy 13:4316. doi: 10.3390/su13084316
Yoshida, S., Yagi, H., Kiminami, A., and Garrod, G. (2019). Farm diversification and sustainability of multifunctional peri-urban agriculture: entrepreneurial attributes of advanced diversification in Japan. Sustain. Sci. Pract. Policy 11:2887. doi: 10.3390/su11102887
Keywords: resilience, sustainability, integrated sustainability index, factor analysis, regression analysis, COVID-19 pandemic
Citation: Yoshida S (2024) Impact of sustainability integrating environmental and social practices on farm resilience: a quantitative study of farmers facing the post-COVID-19 economic turbulence in Japan. Front. Sustain. Food Syst. 8:1341197. doi: 10.3389/fsufs.2024.1341197
Edited by:
James Heywood Cock, International Center for Tropical Agriculture (CIAT), ColombiaReviewed by:
Alia Raya, Gadjah Mada University, IndonesiaAmar Razzaq, Huanggang Normal University, China
Copyright © 2024 Yoshida. This is an open-access article distributed under the terms of the Creative Commons Attribution License (CC BY). The use, distribution or reproduction in other forums is permitted, provided the original author(s) and the copyright owner(s) are credited and that the original publication in this journal is cited, in accordance with accepted academic practice. No use, distribution or reproduction is permitted which does not comply with these terms.
*Correspondence: Shingo Yoshida, c2hpbmdvX3lvc2hpZGE2MTBAbWFmZi5nby5qcA==