 Manojit Chowdhury1
 Tapan Kumar Khura1*
 Pravin Kumar Upadhyay2*Roaf Ahmad Parray1H. L. Kushwaha1,3
 Chandu Singh4Achal Lama5Indra Mani6
- 1Division of Agricultural Engineering, ICAR-Indian Agricultural Research Institute, New Delhi, India
- 2Division of Agronomy, ICAR-Indian Agricultural Research Institute, New Delhi, India
- 3Division of Agricultural Engineering and Renewable Energy, ICAR-Central Arid Zone Research Institute, Jodhpur, India
- 4Division of Genetics, ICAR-Indian Agricultural Research Institute, New Delhi, India
- 5Division of Forecasting and Agricultural Systems Modelling, ICAR-Indian Agricultural Statistics Research Institute, New Delhi, India
- 6Vasantrao Naik Marathwada Krishi Vidyapeeth, Parbhani, Maharastra, India
Nitrogen responses vary under diverse agronomic management practices, influencing vegetation indices (VIs) and productivity across different ecological conditions. However, the proper quantification of these responses under various crop establishment methods with varied nitrogen levels is rarely studied. Therefore, a field experiment was conducted to investigate the impact of varying nitrogen levels on VIs, growth parameters, yield attributes, yield, and economic aspects of transplanted rice (TR) and direct-seeded rice (DSR). The experiment was conducted in the randomized block design consisted seven N levels, which included 0% recommended dose of nitrogen (RDN) or no nitrogen (N0), 33.33% RDN (N1), 66.66% RDN (N2), 100% RDN (N3), 133.33% RDN (N4), 166.66% RDN (N5) and 200% RDN (N6), and replicated thrice. The plots with higher N levels demonstrated increased values of VIs and treatment N3 (120 kg N ha−1), N4 (160 kg N ha−1), N5 (200 kg N ha−1), and N6 (240 kg N ha−1) showed no statistically significant differences in NDVI (normalized difference vegetation index), RVI (ratio vegetation index), NDRE (normalized difference red edge), and GNDVI (green normalized difference vegetation index) values across the various growth stages of rice. The application of treatment N4 resulted in the highest number of panicles m−2 (348.2 in TR, 376.8 in DSR), filled grains panicle−1 (74.55 in TR, 62.43 in DSR), and a 1,000-grain weight of 26.92 g in TR and 26.76 g in DSR. The maximum yield (4.89 t ha−1) was obtained in transplanted rice at treatment N4 and, 8.15% yield reduction was noted in DSR for the same treatment, which was statistically equivalent to N3, but significantly superior to other N levels. Conversely, in DSR with RDN (120 kg N ha−1), the cost–benefit ratio surpassed that of TR by 16.96%, signifying DSR’s adaptability for more profitable rice cultivation in the region. This research provides valuable insights into optimizing nitrogen management practices for TR and DSR, thereby enhancing rice crop performance and economic returns.
1 Introduction
Rice (Oryza sativa L.) plays a crucial role as a staple crop on a global scale, serving as a primary source of sustenance for a substantial portion of the world’s population. It plays a crucial role in ensuring global food security and addressing nutritional needs. Its cultivation methods vary, commonly encompassing transplanting seedlings or direct seeding. However, regardless of the method employed, fertilizer application is a critical management practice in rice cultivation. Among the various nutrients, nitrogen (N) fertilizer holds significant importance as it directly influences crop growth, tiller development, rice yields, and yield components (Saito et al., 2015; Djaman et al., 2018). Typically, farmers tend to apply N fertilizer in excess of the recommended dosage, assuming that increased nitrogen levels will always lead to higher crop yields (Singh et al., 2019). However, this conventional approach often results in inefficient utilization of nutrients, excessive nutrient losses, and increased production costs (Upadhyay et al., 2019; Kumari et al., 2023; Chowdhury et al., 2023a).
Excessive fertilizer usage has detrimental effects on the soil and contributes to environmental pollution through processes like immobilization, volatilization, denitrification, and leaching (Ma et al., 2019; Kurmi et al., 2023). Moreover, the excessive application of nitrogen fertilizer diminishes nitrogen use efficiency (Ata-Ul-Karim et al., 2013), with estimates suggesting that only 30–50% of the applied nitrogen is actually utilized by crops (Upadhyay et al., 2023). Intensive farming practices necessitate the judicious application of nitrogenous fertilizers to prevent the rise of nitrate levels in food (Ahmed et al., 2020). Consequently, there is a growing interest in investigating the impact of varying fertilizer doses on rice production (Gawande et al., 2023).
It is crucial to detect the uptake of N by crop canopies at a regional level and apply the appropriate amount of N at proper growth stage. This practice ensures high yields while minimizing pollution and input cost. Assessing the N status in plants is essential for maximizing the efficiency of nitrogen fertilizers. Traditional methods involving destructive chemical analyses of plant samples are highly accurate but impractical for large-scale assessments due to the need for extensive sampling and expensive laboratory procedures (Baresel et al., 2017; Frels et al., 2018). To overcome these limitations, non-destructive spectral analyses have emerged as a valuable tool for crop monitoring and assessing plant N status without the need for intensive sampling (Verrelst et al., 2015; Elsayed et al., 2018; Prey and Schmidhalter, 2019; Sahoo et al., 2023a). Hyperspectral remote sensing enables timely monitoring and allows for the estimation of chlorophyll content on regional and global scales (Sahoo et al., 2023b). Consequently, remote sensing of canopy reflectance provides an efficient approach for improving the optimization of N application. By leveraging these techniques, farmers and researchers can make informed decisions regarding N management, leading to improved agricultural productivity and reduced environmental impact.
A more advanced method for detecting the N status of crops is through the utilization of spectral analysis. Initially, researchers relied on the estimation of N status using the reflectance from a single spectral band (Blackmer et al., 1994, 1996). However, this approach encounters challenges in directly quantifying physiological and agronomic parameters due to the interferences caused by various factors like species, growth stages, canopy structure, and the environment (Ustin and Gamon, 2010; Li et al., 2014). To address these limitations, spectral indices have emerged as a valuable solution. These indices have the ability to mitigate the impact of external factors, providing a relatively straightforward and dependable method to extract the N nutritional signal from the intricate reflection patterns of crop canopies (Hatfield et al., 2008; Viña et al., 2011; Inoue et al., 2016; Sahoo et al., 2023b). By utilizing spectral indices, the influence of canopy structure, growth stages, species, and the environment can be minimized, enabling a more accurate assessment of the N status of crops.
The current research gap lies in the lack of comprehensive studies that assess the effects of variable fertilizer doses on vegetation indices, growth and yield attributes, economic aspect of rice. Additionally, there is a need to compare the outcomes between two commonly practiced rice cultivation methods: transplanted and direct seeded rice. Addressing these research gaps will provide valuable insights into the relationships between variable fertilizer doses and rice performance, contributing to more efficient and sustainable rice cultivation practices. Furthermore, by exploring the impact of variable fertilizer doses, the study aims to promote sustainable agriculture practices that minimize environmental pollution and reduce production costs for farmers.
2 Materials and methods
2.1 Experimental site and climatic condition
The field experiment was conducted over a period of 2 years (2022 and 2023) at the research farm of the ICAR-Indian Agricultural Research Institute (IARI) in New Delhi (Figure 1). The location of the farm is at 28°38′15´´ N latitude, 77°09′10″ E longitude, and an elevation of 228.6 meters above mean sea level. Throughout the experimental years (2022 and 2023), meteorological data regarding daily temperature and rainfall were recorded. The monthly weather data for the experimental period (2022 and 2023) was sourced from the ICAR-IARI meteorological observatory, situated in close proximity to the experimental site (Figure 2). The soil at the site is described as well-drained, non-saline, slightly alkaline in nature (pH 7.3), and possessing a sandy loam texture. The experimental site is situated in a semi-arid region with an average annual precipitation of 708 mm. The detailed soil characteristics are given in the Table 1.
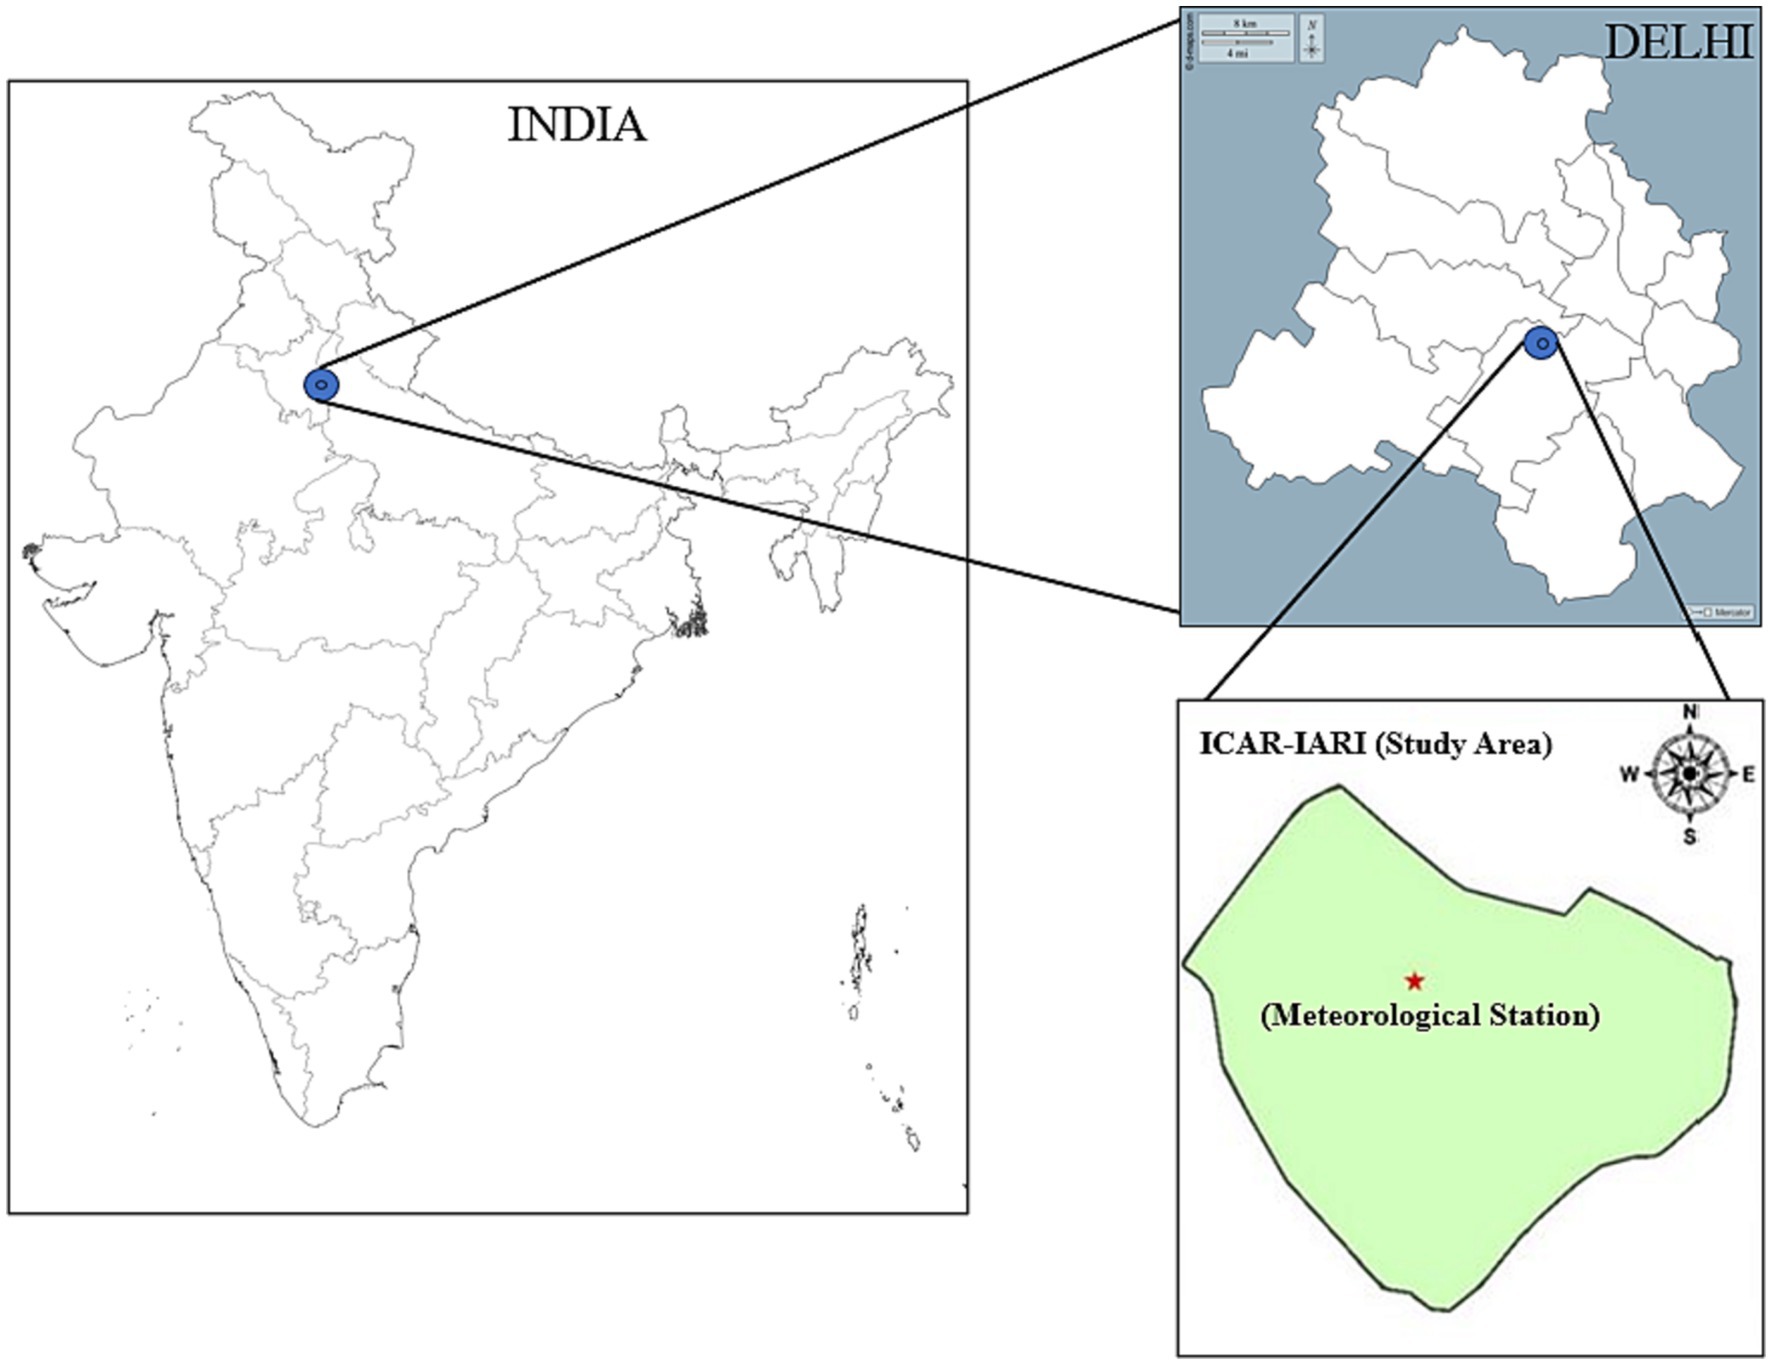
Figure 1. Location of the study area with meteorological station.
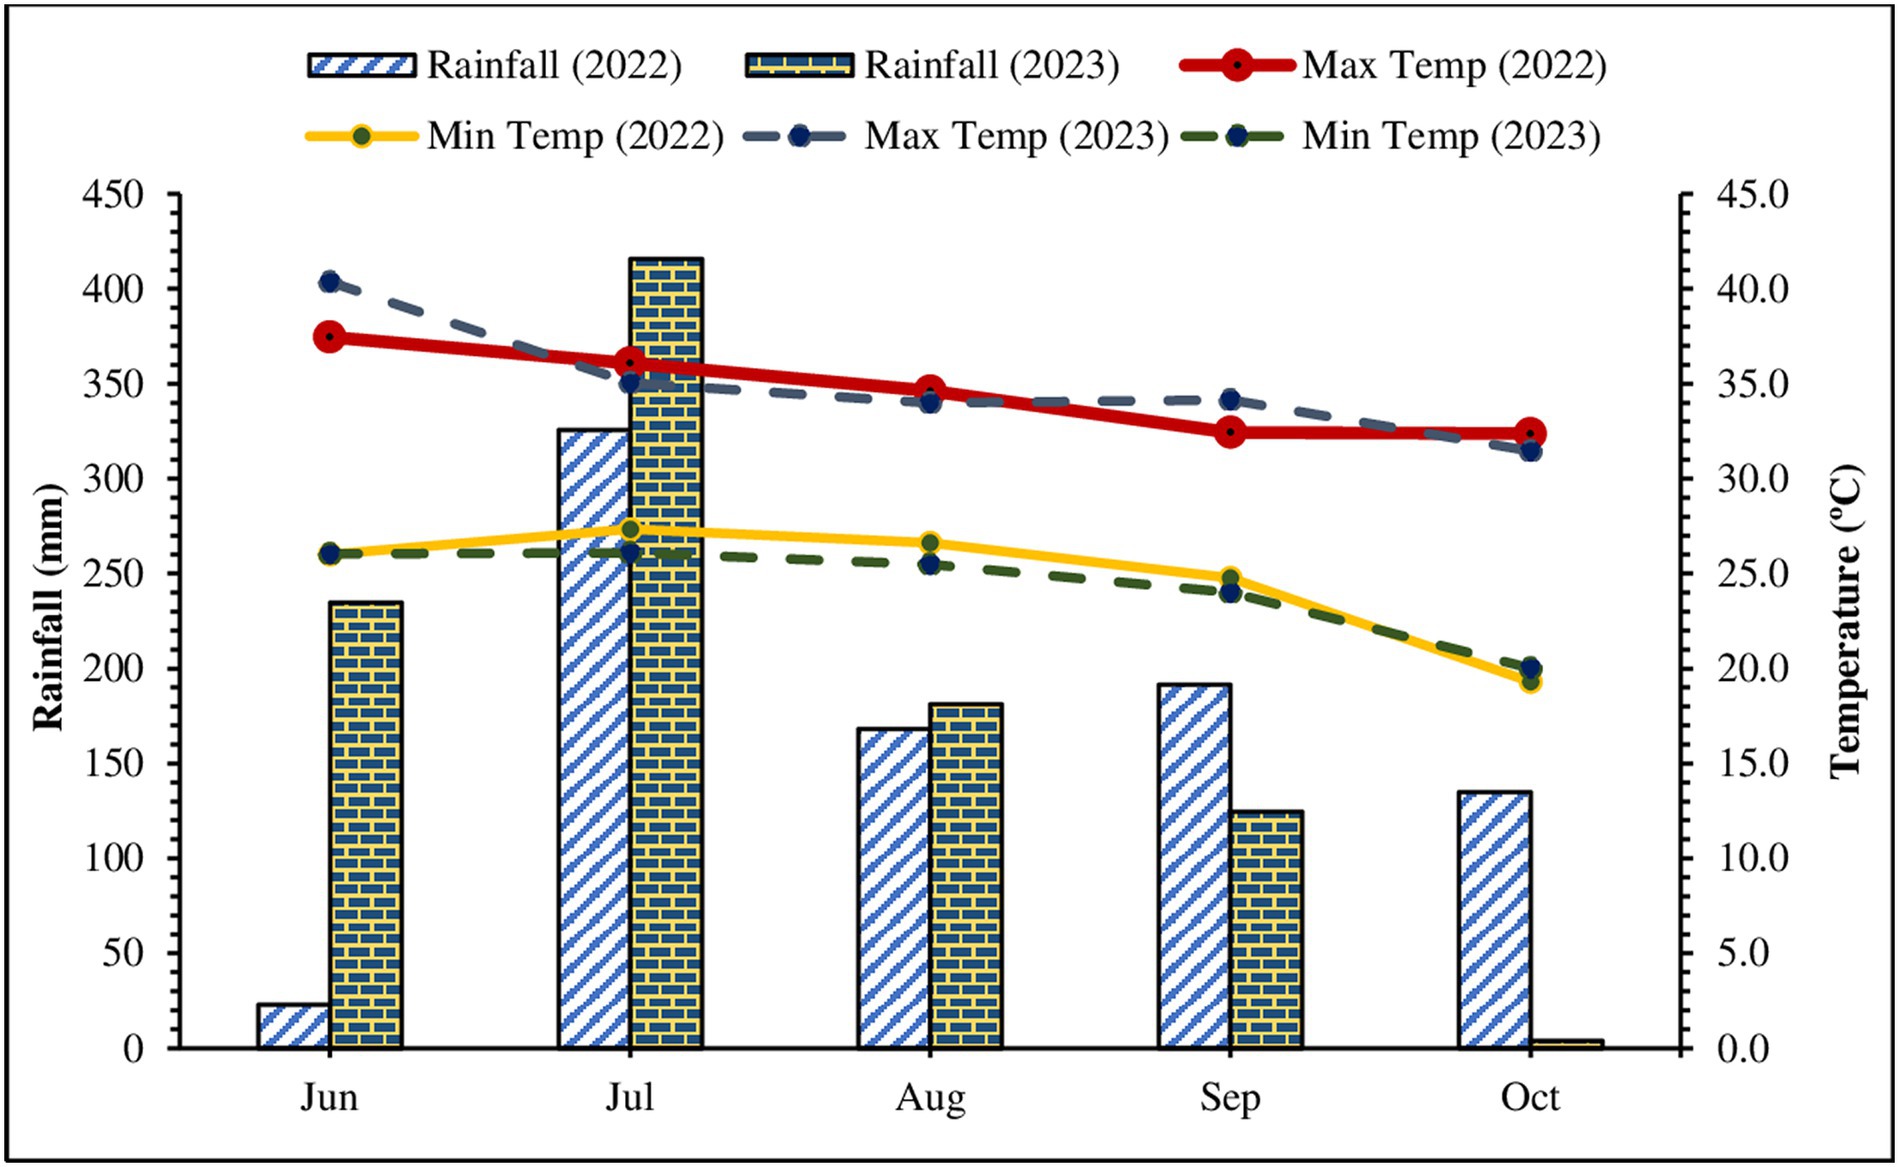
Figure 2. Meteorological parameters during the cropping period of 2022 and 2023.
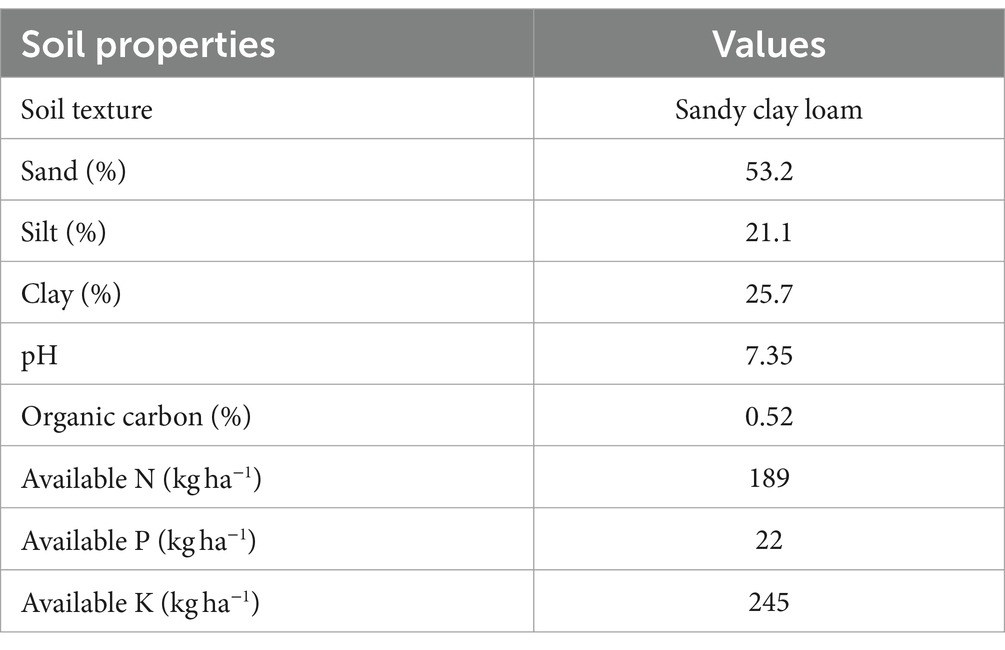
Table 1. Soil characteristics of the trial site.
2.2 Experimental design and details
The experiment was conducted using a randomized block design (RBD). The layout of the different fertilizer doses in RBD is shown in Figure 3. This design was selected to minimize the effects of variability and confounding factors by randomly allocating the different fertilizer doses to separate blocks within the study area (Kushwah et al., 2023). Pusa Basmati (PB)-1509 rice variety was taken as test crop. Each cultivation method (transplanted and direct seeded) was considered as a separate block, ensuring that any variations observed in the results could be attributed to the fertilizer doses rather than other factors.
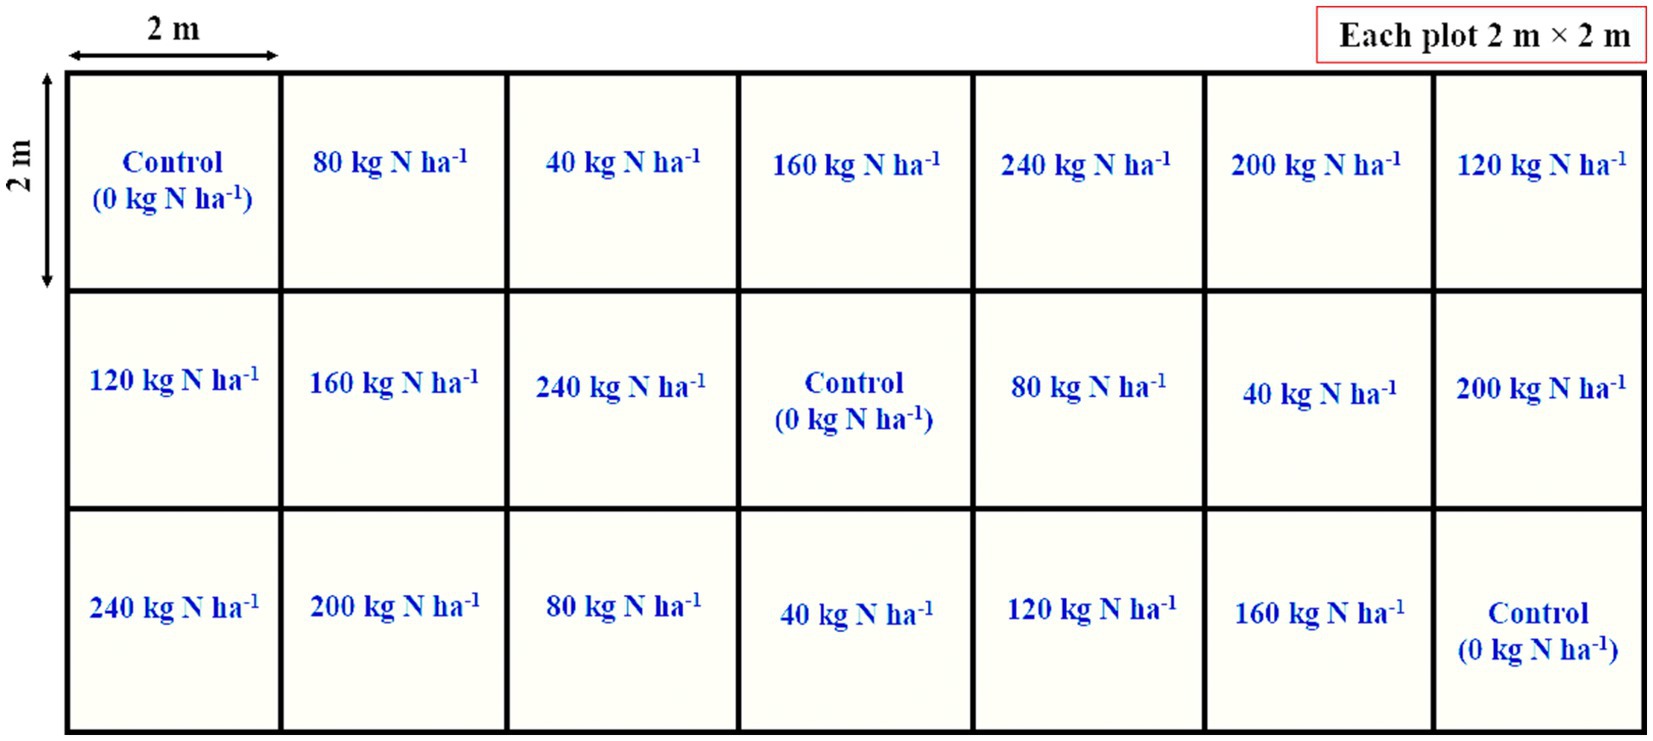
Figure 3. Layout plan of the field experiment.
For transplanted rice, the seedbed preparation involved two passes of a disc harrow, followed by one pass of a cultivator with a wooden plank, and finally the puddling operation. On the other hand, for direct-seeded rice, the field preparation only included two passes of a disc harrow and one pass of a cultivator with a wooden plank. After 21 days of growth, the rice seedlings were manually transplanted in the case of transplanted rice, while direct seeding was done using a tractor operated 9-row DSR planter immediately after field preparation in the case of direct-seeded rice (Kushwah et al., 2024a). The rice seeds were subjected to a treatment with Carbendazim 50 WP at a concentration of 2 g per kilogram of seeds prior to sowing. This treatment was applied to manage fungal diseases, tip burn, black spot, and collar spot (Chowdhury et al., 2023c). The treated PB-1509 rice seeds were sown at a seeding rate of 20 kg per hectare.
2.3 Fertilizer application
The N fertilizer doses varied from 0 to 240 kg ha−1 with the interval of 40 kg ha−1 for both transplanted and direct seeded rice were applied. The range of N fertilizer doses were chosen for both transplanted and direct-seeded rice in order to evaluate the effects of different levels of N fertilizer application on the crop. By varying the doses within this range, the experiment was aimed to assess the response of the rice plants to increasing amounts of fertilizer and determine the optimal dosage that would maximize yield and overall plant health. This range allows for a comprehensive analysis of the impact of fertilizer on both cultivation methods and provides valuable insights for agricultural practices and crop management. Phosphorus (P), potassium (K) and zinc (Zn) were applied as basal at the rate of 60 (P2O5), 60 (K2O), 25 (zinc sulfate) kg ha−1, respectively. P and K were applied through single super phosphate (SSP) and Muriate of Potash (MOP), respectively. The treatment details are given in Table 2.
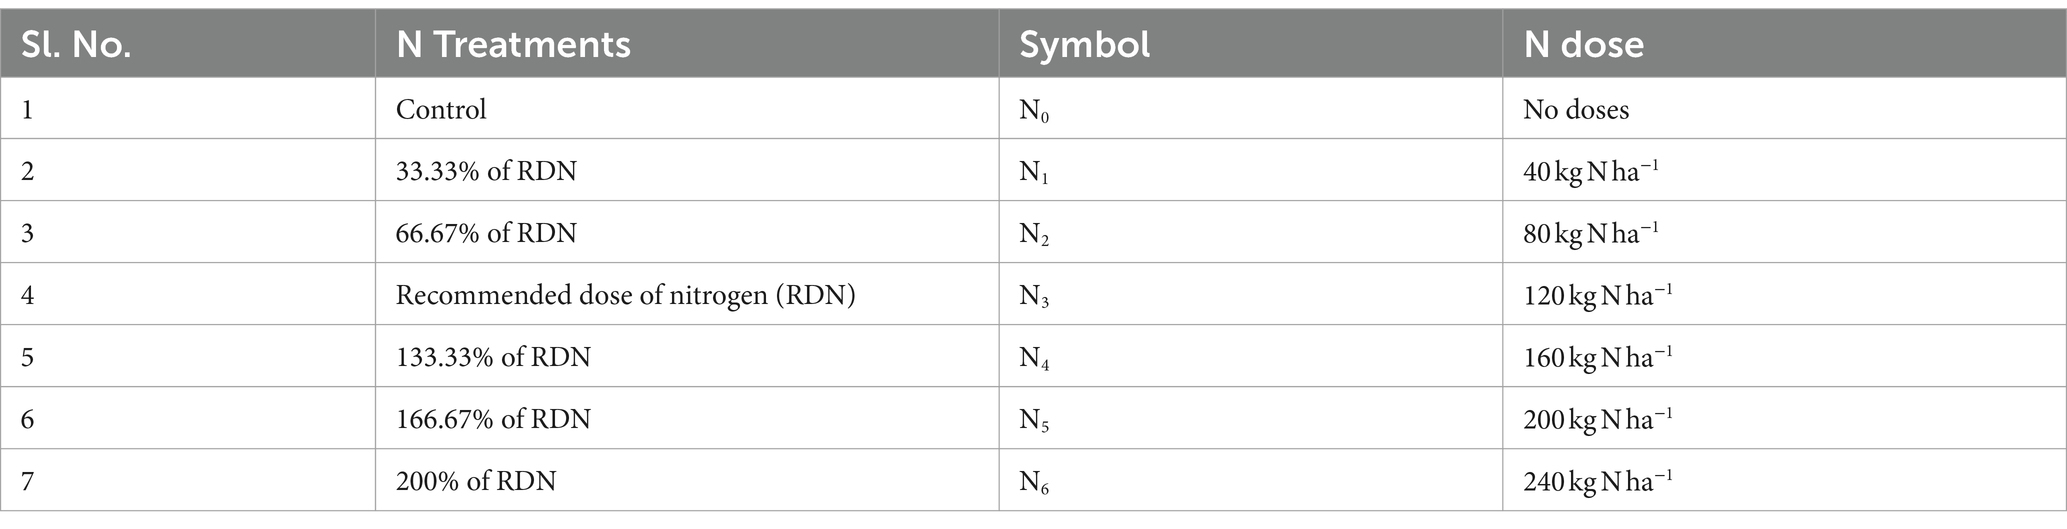
Table 2. Details of the applied N treatments in TR and DSR.
2.4 Data acquisition of spectral signature and estimation of vegetation indices
Spectral data, crucial for understanding crop development, were meticulously collected at significant growth stages for both TR and DSR. The spectral signature was recorded at three growth stages; 20 days after transplanting (DAT), 40 DAT and 60 DAT for TR. Whereas, the growth stages for DSR were taken 40 days after sowing (DAS), 60 DAS and 80 DAS to capture the spectral reflectance of the rice canopy. Employing a hyperspectral sensor, the Spectroradiometer (Spectral Evolution, PSR-1100f), data acquisition covered the extensive wavelength range of 320 nm to 1,100 nm, as shown in Plate 1A. Calibration using a white reference panel was undertaken to ensure precision in reflectance measurements. Maintaining strict consistency, the sensor was positioned at a height of 60 cm, capturing readings across experimental plots. The data acquisition process was synchronized, conducted at noon, when the sun is at zenith, to mitigate variations due to diurnal lighting changes (Bhagat et al., 2023). The captured spectral data were then meticulously analyzed using DARWin SP data acquisition software, focusing on bands pertinent to vegetation monitoring and index computation.
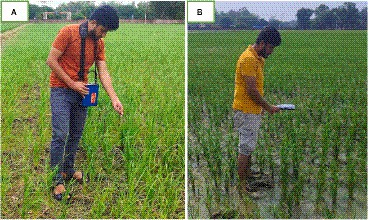
PLATE 1. Spectral signature and vegetation index measurement with (A) Spectroradiometer (B) GreenSeeker®.
Simultaneously, crop growth and vigor were monitored at specific growth stages using the GreenSeeker® handheld device, equipped with light-emitting diodes emitting red (656 nm) and near-infrared (NIR) (774 nm) light, as shown in Plate 1B. Normalized differential vegetation index (NDVI) was employed for assessing plots with varying fertilizer doses. To cross-verify measurements, comparisons were drawn between NDVIs obtained from GreenSeeker® and Spectroradiometer data. Beyond NDVI, numerous vegetation indices (VIs) were computed using specific wavelengths and formulas, tabulated in Table 3. This comprehensive approach ensured data accuracy, providing valuable insights into vegetative health and nitrogen status within the rice plants.
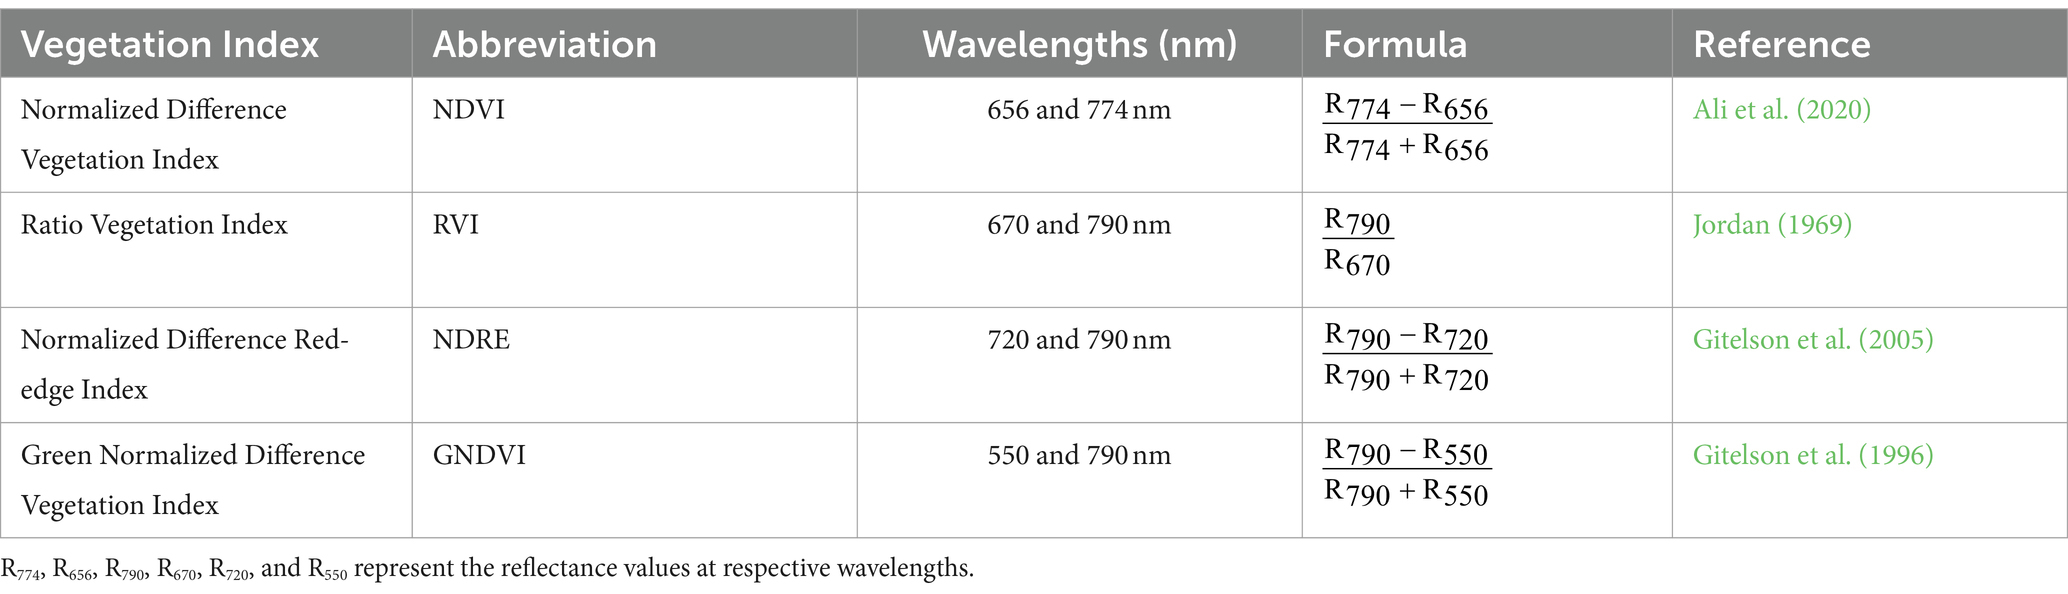
Table 3. Vegetation indices used in the study.
2.5 Measurement of growth, yield attributes and yield
Various growth characteristics, including plant height and leaf area index (LAI), as well as yield-related factors like number of effective tillers per hill, panicles per hill, grains per panicle, panicle length, thousand-grain weight, grain and straw yield, and harvest index were measured and assessed. This analysis aimed to gauge the impact of different levels of nitrogen fertilizer application and cultivation techniques to gather insights that could guide strategic choices for improving rice production. These attributes provide insights into the performance, productivity, and quality of the rice crop. Plant height was measured at different growth stages of both transplanted and direct seeded rice. To capture variations within each plot, multiple plant samples were randomly selected, and plant height was measured from the base to the tip of the longest leaf using a measuring tape. Harvesting was conducted when the rice plants reached maturity, characterized by physiological maturity and grain moisture content within the recommended range. The rice plants from each plot were harvested, threshed to separate the grains from the straw, and cleaned to remove impurities. Grain yield was determined by weighing the harvested grains after drying to a constant moisture content. Biomass yield was calculated by weighing the straw collected from each plot. Harvest index (HI) was calculated using the following formula (Equation 1);
2.6 Leaf area index measurement
In order to determine the leaf area in transplanted and direct seeded rice plants, a Portable Leaf Area Meter (LI-COR 3000) was utilized. This device allows for accurate and efficient measurement of leaf area. The experiment involved selecting five representative plants from each plot and tagging them for identification. Leaf area measurements were taken periodically at 20 DAT, 40 DAT, 60 DAT and 90 DAT for transplanted rice, and 40 DAS, 60 DAS, 80 DAS and 110 DAS for direct seeded rice to monitor leaf growth and development. LAI was calculated using the following formula (Patra et al., 2023) (Equation 2);
2.7 Economic analysis
The economic analysis involved evaluating the gross and net returns, as well as the net benefit–cost ratio (Chowdhury et al., 2023b; Kushwah et al., 2024b). The gross return (GR) was calculated by multiplying the economic outputs, which included grain and straw yields, by their respective prices. The calculation of GR involved utilizing the market minimum support price (MSP) for rice grain. On the other hand, the net returns (NR) were obtained from the Equation 3. Benefit–cost ratio was calculated by utilizing Equation 4. All economic analyses were conducted in Indian rupees (₹), which were subsequently converted into US dollars ($).
2.8 Statistical analysis
The collected data, including vegetation indices, growth and yield attributes, underwent rigorous statistical analysis to derive meaningful insights using statistical packages for social sciences (SPSS) software (BM Corp, 2012). Analysis of variance (ANOVA) was performed to assess the significance of differences among the N fertilizer doses and cultivation methods (transplanted and direct seeded rice). In order to determine the significance of the observed results, a p-value threshold of ≤0.05 was adopted. In cases where statistically significant differences were detected, Duncan’s Multiple Range Test (DMRT) was conducted to identify the specific differences among the treatments under investigation. Additionally, standard error (SE) was used to quantify the extent of variability among individual data values.
3 Results
3.1 Effect of N levels on plant height under TR and DSR
The nitrogen levels exerted a substantial and statistically significant (p < 0.05) influence on plant height of both transplanted and direct seeded rice. Significant variations in plant height were observed across different nitrogen doses at 20, 40, 60, and 90 days after transplanting (DAT). Significantly higher plant heights of 40.68, 55.28, 70.85 and 92.70 cm were observed at 20, 40, 60, and 90 DAT respectively, from the 160 kg N ha−1 (treatment N4) applied plot (Figure 4A). Comparing to the control treatment (0 kg N ha−1), the increase in plant height at harvest stage (90 DAT) amounted to 2.73, 7.83, 15.09, 15.15 14.91, and 13.35% for nitrogen doses of 40 kg, 80 kg, 120 kg, 160 kg, 200 kg and 240 kg N ha−1, respectively. Plant height increased significantly up to the recommended dose of nitrogen (120 kg N ha−1), above this, no significant differences were observed in transplanted rice.
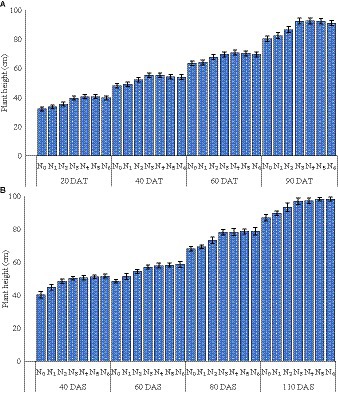
Figure 4. Plant height (2-year mean basis) at different growth stages of (A) Transplanted rice and (B) direct seeded rice. Standard errors (SE) within each treatment are represented by the vertical bars. *For detailed treatment-specific information, please refer to Table 2.
Comparative analysis with TR revealed that DSR consistently exhibited greater plant height at equivalent growth stages, with DSR presenting a 6.09% increase in plant height at the time of harvest. Plant heights exhibited a significant increase in the plot treated with 240 kg N ha−1 (treatment N6), measuring 51.75 cm, 58.90 cm, 78.85 cm, and 98.35 cm at 40, 60, 80, and 110 days after sowing (DAS), respectively (Figure 4B). In comparison to the control treatment (0 kg N ha−1), the growth in plant height at the harvest stage (110 DAS) showed increments of 3.16, 7.29, 11.59, 11.71, 12.88, and 12.91% for nitrogen doses of 40 kg, 80 kg, 120 kg, 160 kg, 200 kg, and 240 kg N ha−1, respectively.
3.2 Effect of N levels on LAI
The two-year mean LAI observed at 20, 40, 60, and 90 DAT for transplanted rice and at 40, 60, 80, and 110 DAS for direct seeded rice, exhibited significant variations among the different N levels, as shown in Figure 5. Across all treatments, the LAI displayed a consistent pattern of increase until reaching a plateau phase, occurring at approximately 40–55 DAT for TR and 60–75 DAS for DSR. Specifically, at the early stages of the experiment (20 DAT for TR and 40 DAS for DSR), the LAI values did not exhibit significant differences among the various nitrogen-fertilized treatments. During these initial measurements, the LAI values fell within a range of 1.12 to 1.38 (for TR) and 0.95 to 1.3 (for DSR), indicating a relatively modest to low level of foliage coverage. Subsequently, as the rice plants progressed through their growth cycle, a substantial increase in LAI became evident. The LAI values witnessed notable growth, ranging from 2.85 to 3.62 (at 40 DAT) and 2.95 to 3.71 (at 60 DAS), suggesting a significant expansion of canopy coverage and leaf area. The maximum LAI values (4.32 and 4.25) were observed at 60 DAT for TR and 80 DAS for DSR at 160 and 200 kg N ha−1 respectively, indicating further development of the canopy and an enhanced capacity to harness solar radiation for photosynthesis. Toward the harvesting stage, the LAI exhibited a reduction for both TR and DSR. During the active growth phase, 160 kg N ha−1 consistently displayed the highest LAI values, followed by 200 kg N ha−1, 240 kg N ha−1, and 120 kg N ha−1, respectively, for TR. In the case of DSR, 200 kg N ha−1demonstrated the highest LAI, followed by 160 kg N ha−1, 240 kg N ha−1, and 120 kg N ha−1, respectively. Notably, the LAI values in Treatments N₃ (120 kg N ha−1), N₄ (160 kg N ha−1), N₅ (200 kg N ha−1), and N₆ (240 kg N ha−1) were comparable between transplanted and direct seeded rice.
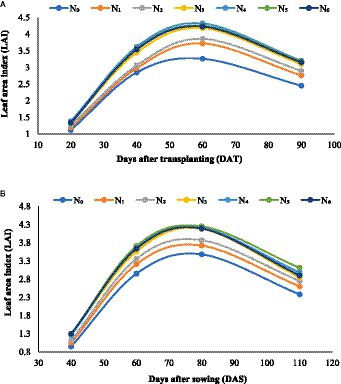
Figure 5. Effect of varying N doses on LAI (2-year mean basis) of (A) transplanted rice and (B) direct seeded rice.
3.3 Effect of N levels on vegetation indices of TR
In the years 2022 and 2023, noteworthy distinctions were observed in the performance of transplanted rice across various vegetation indices, including NDVI, RVI, NDRE, and GNDVI among different nitrogen fertilizer treatments, as delineated in Table 4. Analysis of NDVI, a key indicator of vegetation health, revealed conspicuous variations among the nitrogen fertilizer treatments, with mean values spanning from 0.45 (0 kg N ha−1) at 20 DAT to 0.83 (160 kg N ha−1) at 60 DAT in 2022 and 0.43 (0 kg N ha−1) at 20 DAT to 0.85 (0 kg N ha−1) at 60 DAT in 2023. Notably, treatment N4 consistently exhibited the highest NDVI values at various growth stages. In comparison to the control treatment (0 kg N ha−1), treatment N4 (160 kg N ha−1) exhibited a remarkable increment in NDVI values, registering a 28.89 and 39.53% increase at 20 DAT in 2022 and 2023 respectively, 16.13 and 23.73% increase at 40 DAT in 2022 and 2023, and a 12.16 and 14.86% increase at 60 DAT in 2022 and 2023, respectively. A similar trend was observed for RVI, where significant differences were evident among the N fertilizer treatments, with mean values ranging from 5.65 and 5.78 (0 kg N ha−1) in 2022 and 2023 at 20 DAT to 14.85 and 15.41 (200 kg N ha−1) in 2022 and 2023 at 60 DAT. In comparison to the control treatment, treatment N5 (200 kg N ha−1) exhibited notable increases in RVI values, with a 29.20% (2022) and 29.24% (2023) rise at 20 DAT, a 25.55% (2022) and 23.98% (2023) rise at 40 DAT, and an 18.23% (2022) and 17.99% (2023) rise at 60 DAT. Furthermore, the NDRE values ranged from 0.18 and 0.19 (0 kg N ha−1) at 20 DAT to 0.37 (under 120 kg N ha−1 and 200 kg N ha−1) and 0.38 (under 160 kg N ha−1) at 60 DAT in 2022 and 2023, respectively. In comparison to the control treatment (0 kg N ha−1), there were substantial increases in NDRE values, including a 44.44% (2022) and 47.37% (2023) rise at 20 DAT with N5 (200 kg N ha−1) and N6 (240 kg N ha−1) treatments, 50% (2022) and 47.83% (2023) rise at 40 DAT with N5 treatment (200 kg N ha−1), and 42.31% (2022) and 40.74% (2023) rise at 60 DAT with 120 kg N ha−1, 160 kg N ha−1 and 240 kg N ha−1. Additionally, the mean values of GNDVI ranged from 0.28 and 0.29 (under 0 kg N ha−1) at 20 DAT to 0.49 and 0.52 (under 160 kg N ha−1) at 60 DAT in 2022 and 2023, with treatment N4 (160 kg N ha−1) exhibiting the highest GNDVI values throughout the growth stages of transplanted rice. Compared to the control treatment, there were significant increases in GNDVI values, with a 39.28% (2022) and 37.93% (2023) rise at 20 DAT, 35.29% (2022) and 37.14% (2023) rise, and 28.95 and 30% rise at 60 DAT with N4 treatment (160 kg N ha−1) in 2022 and 2023, respectively.
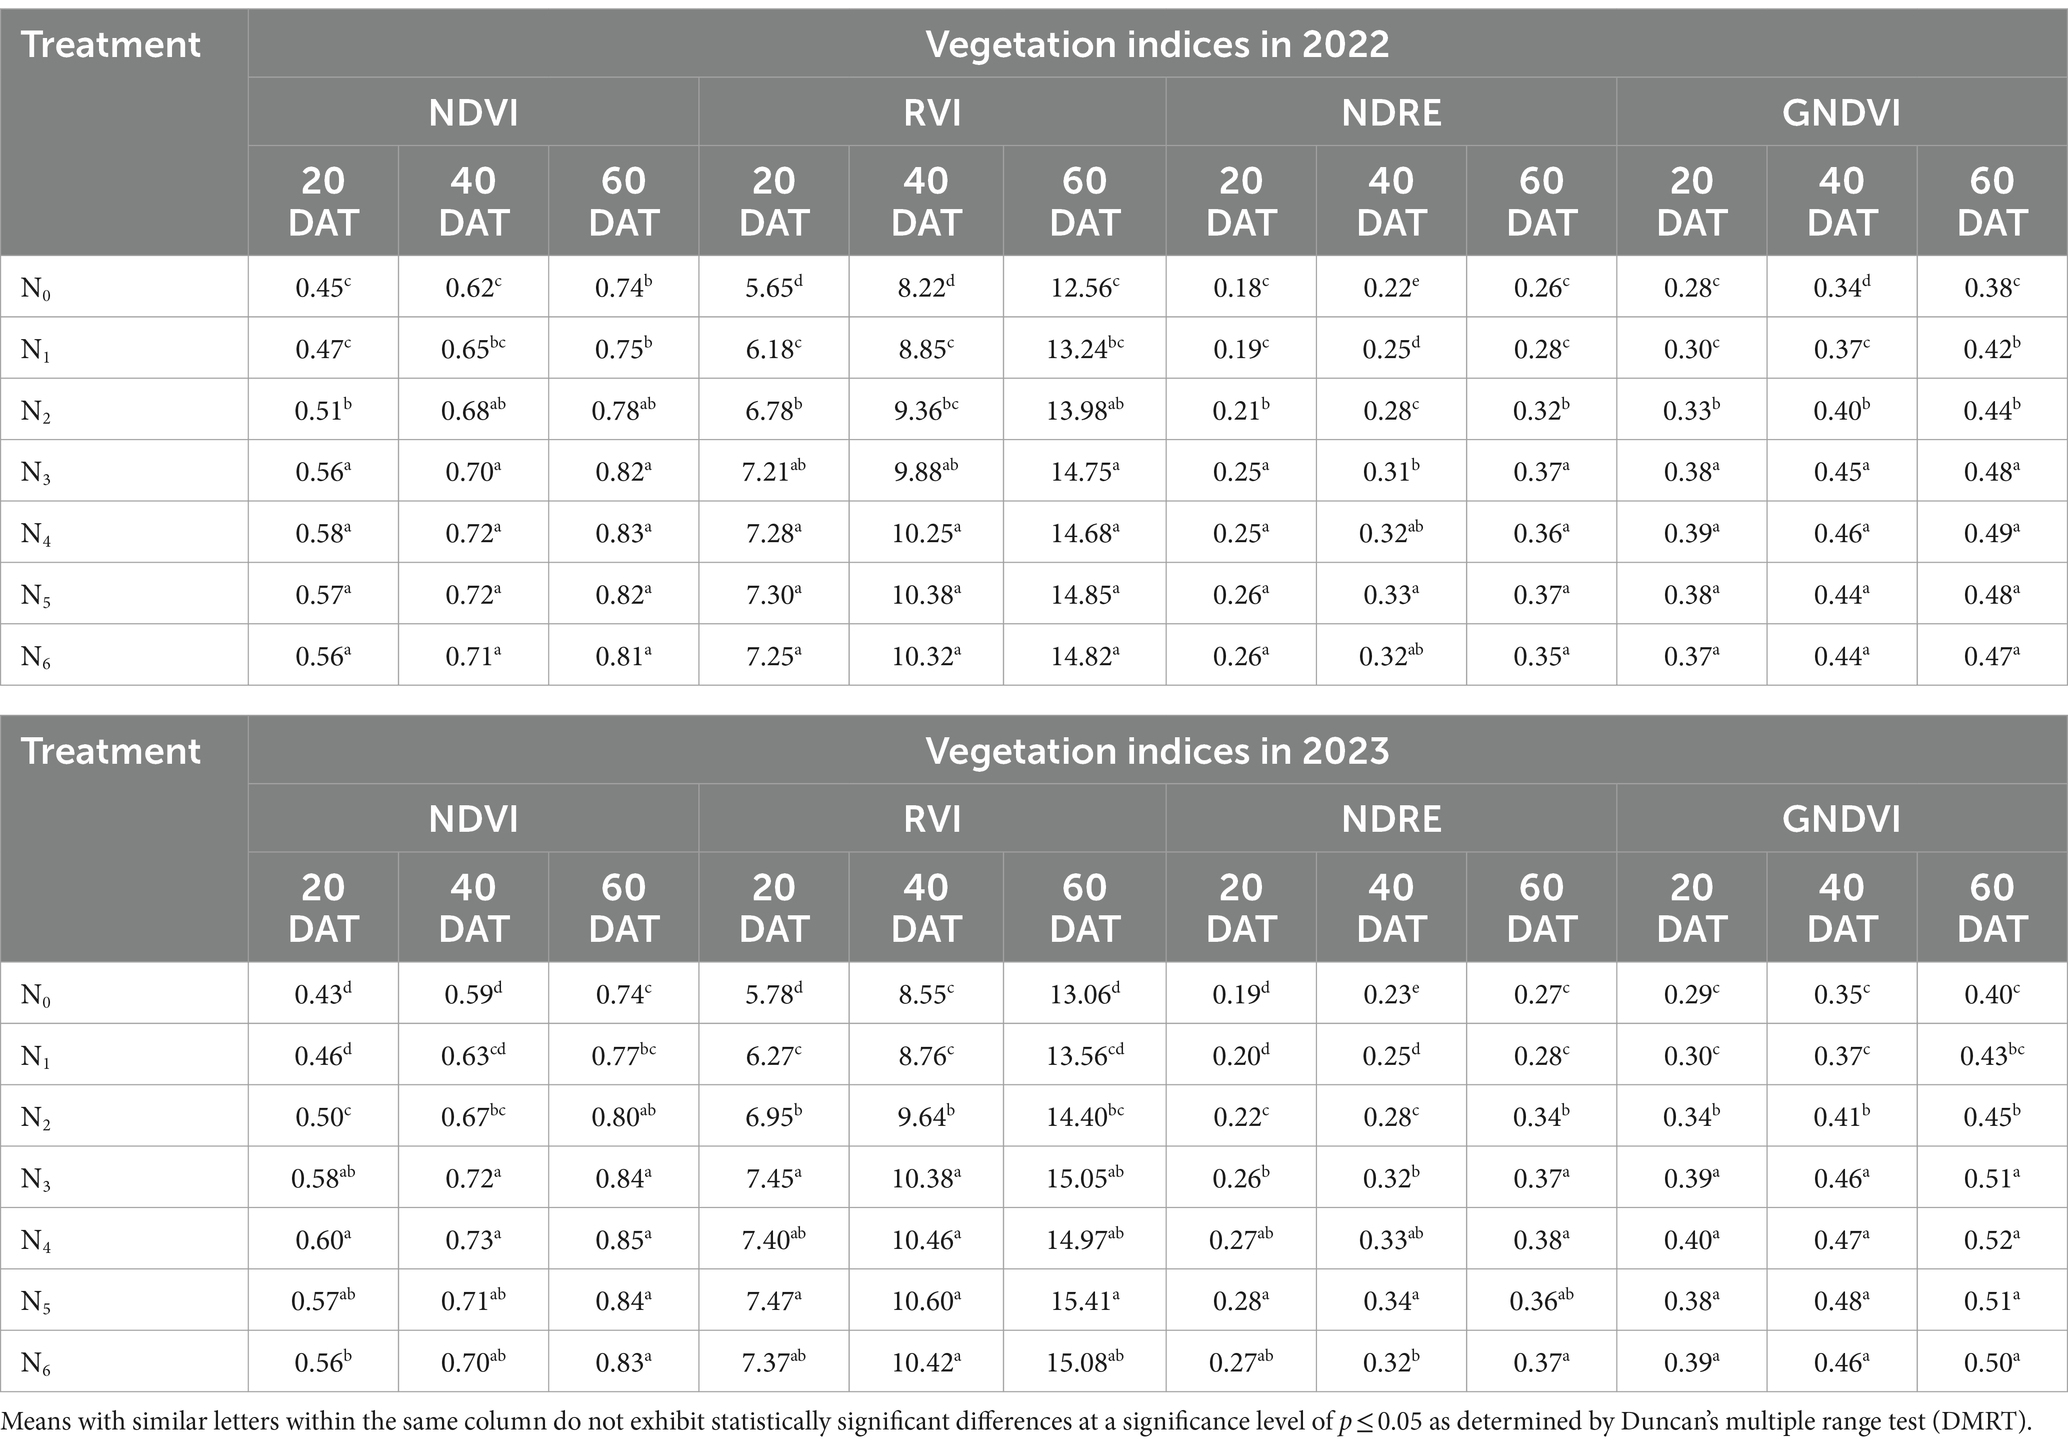
Table 4. Vegetation indices under variable N doses for TR in 2022 and 2023.
3.4 Effect of N levels on vegetation indices of DSR
In the years 2022 and 2023, we observed significant and systematic disparities in the performance of direct seeded rice concerning a spectrum of vegetation indices. These differences were particularly notable in response to varying levels of nitrogen treatments, as comprehensively tabulated in Table 5. NDVI demonstrated a conspicuous trend of enhancement as N fertilizer levels incrementally increased from N0 (0 kg N ha−1) to N6 (240 kg N ha−1) across all growth stages of the rice crop. In comparison to the control treatment, treatment N6 (240 kg N ha−1) exhibited remarkable increments in NDVI values, with a 40% increase in 2022 and a 44.12% increase in 2023 at 40 DAS, a 34.69% increase in 2022 and a 34.04% increase in 2023 at 60 DAS, and a 16.67% increase in 2022 and a 30.65% increase in 2023 at 80 DAS. Similarly, RVI displayed a coherent elevation in response to the progressive escalation of N fertilizer levels (0 kg N ha−1 to 240 kg N ha−1). Once again, treatment N6 (0 kg N ha−1) emerged with the highest RVI values, underscoring the beneficial influence of elevated N levels on vegetation vigor. In comparison to the control treatment (0 kg N ha−1), treatment N6 exhibited remarkable increments in RVI values, with a 53.19% increase in 2022 and a 58.04% increase in 2023 at 40 DAS, a 34.09% increase in 2022 and a 26.04% increase in 2023 at 60 DAS, and a 21.94% increase in 2022 and a 22.75% increase in 2023 at 80 DAS. The NDRE values for both years exhibited a conspicuous trend of improvement alongside increasing N levels. In comparison to the control treatment (0 kg N ha−1), treatment N6 (240 kg N ha−1) registered remarkable increments in NDRE values, with a 50% increase in 2022 and a 58.82% increase in 2023 at 40 DAS, a 52.63% increase in 2022 and a 54.54% increase in 2023 at 60 DAS, and a 42.31% increase in 2022 and a 50% increase in 2023 at 80 DAS. Furthermore, GNDVI values mirrored the overarching trend of improvement in conjunction with escalating N fertilizer levels. Treatment N6 (240 kg N ha−1) exhibited notable increments in GNDVI values compared to the control treatment, with a 52% increase in 2022 and a 48.15% increase in 2023 at 40 DAS, a 37.5% increase in 2022 and a 46.87% increase in 2023 at 60 DAS, and a 38.89% increase in 2022 and a 35.14% increase in 2023 at 80 DAS.
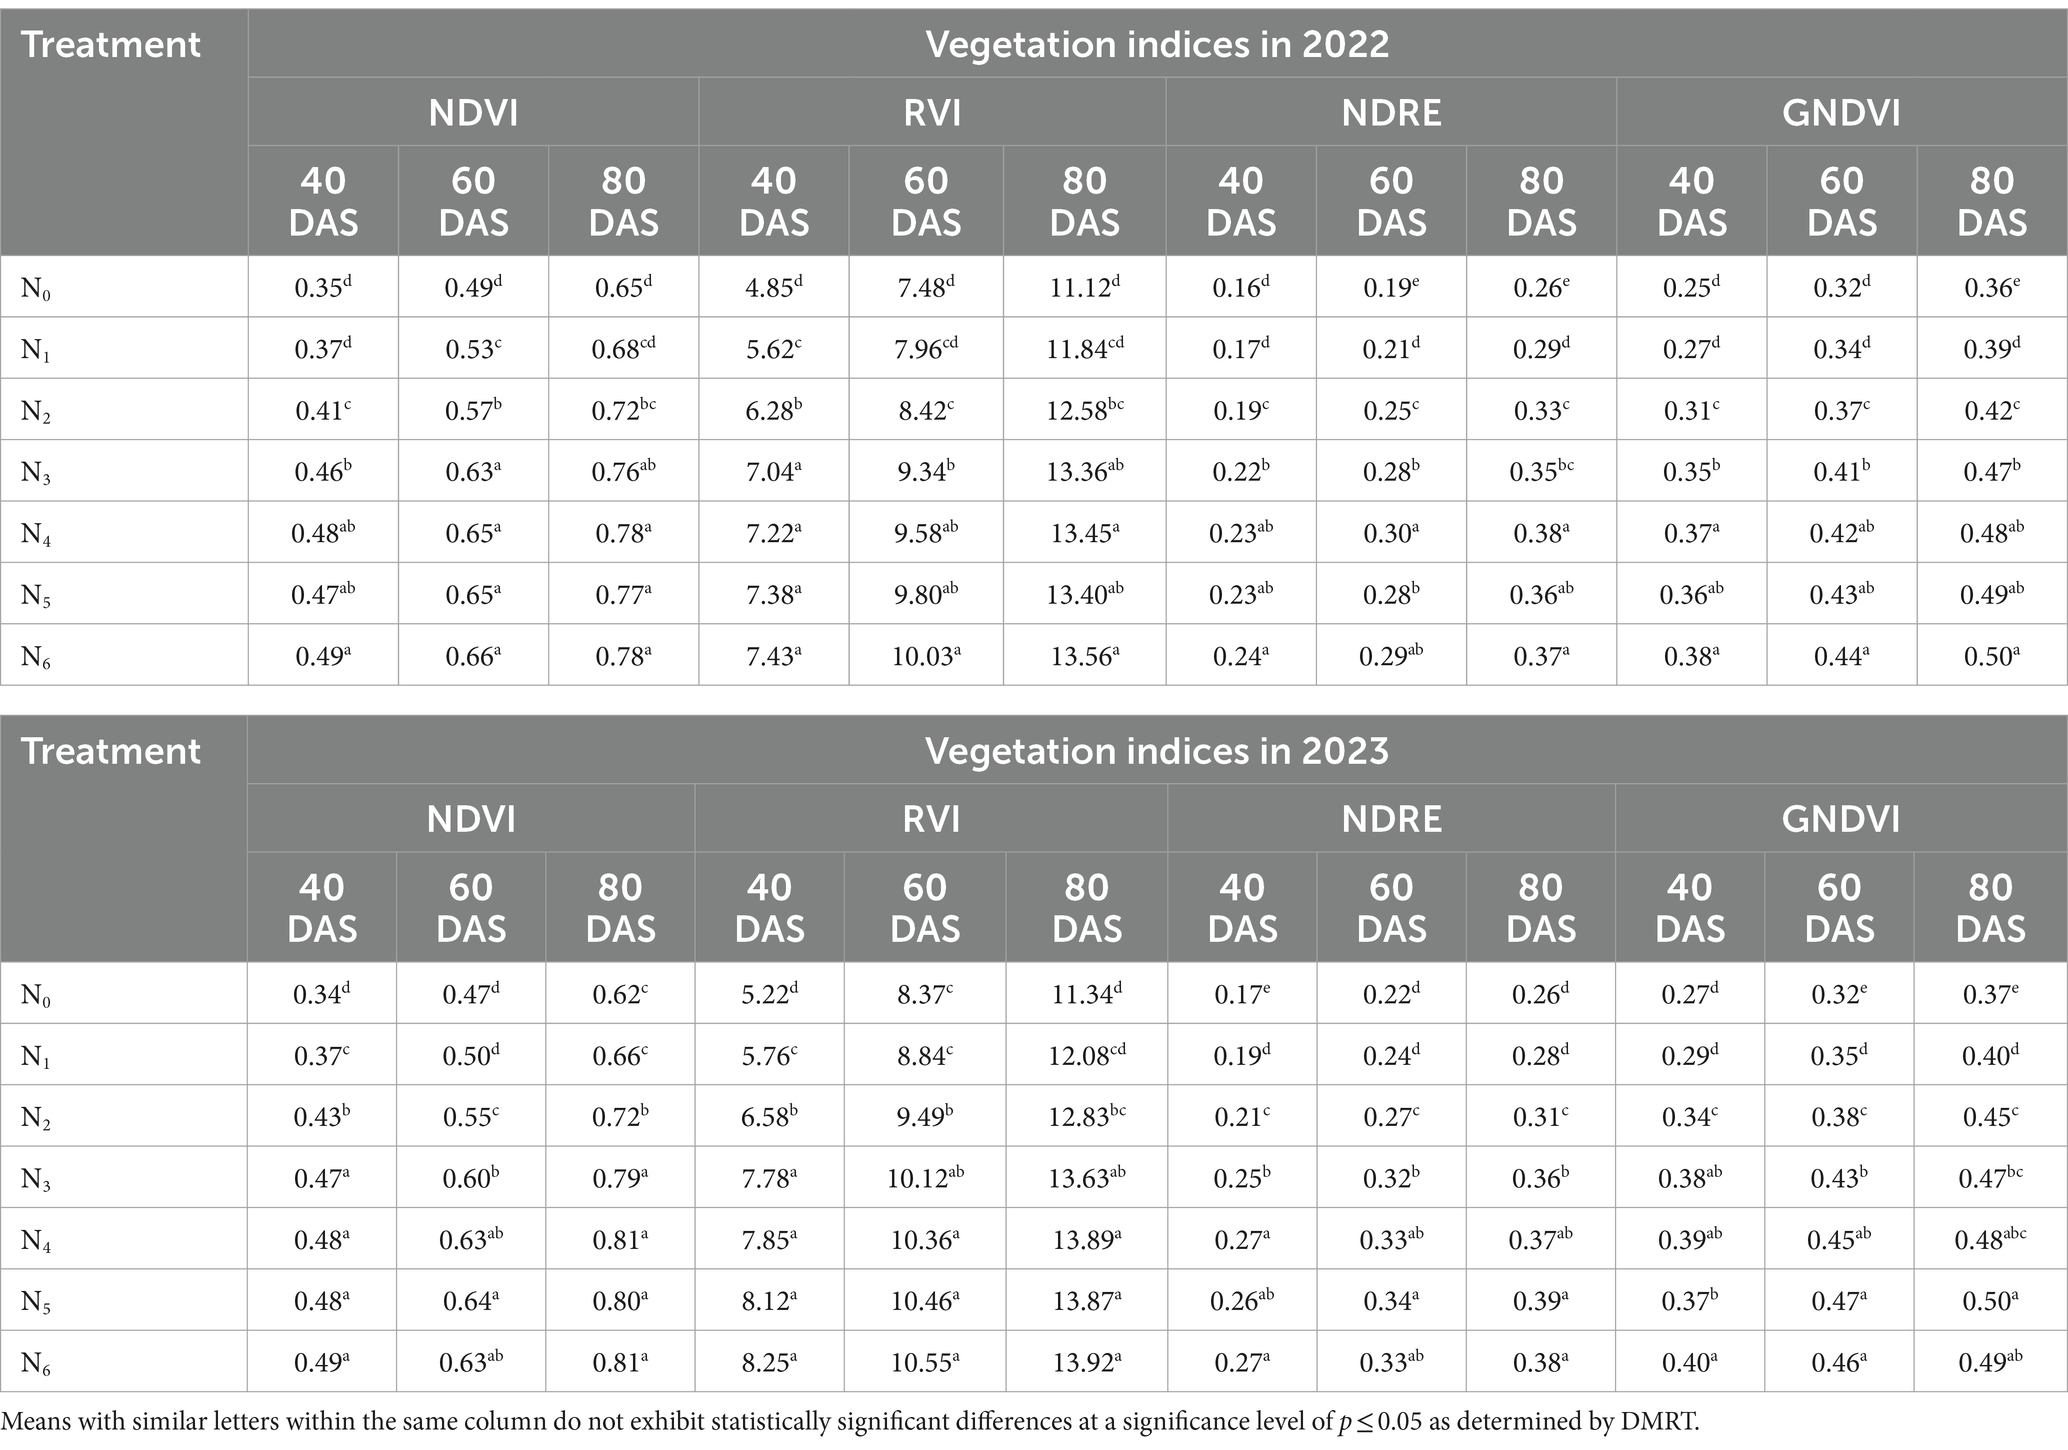
Table 5. Vegetation indices under variable N doses for DSR in 2022 and 2023.
3.5 Effect of N levels on yield attributes and yield of TR
The results indicated that different nitrogen treatments had a significant (p < 0.05) impact on the yield attributes and grain yield for transplanted rice over the 2 years of the study (Table 6). In terms of the number of effective tillers per hill, displayed significant variations among the treatments. Treatment N4 (160 kg N ha−1) exhibited the highest values (17.54 and 18.80) in both 2022 and 2023 cropping season. The number of panicles per hill showed significant variations among treatments in both 2022 and 2023. Notably, Treatment N4 (160 kg N ha−1) consistently resulted in the highest number of panicles m−2 (348.72 in 2022 and 335.28 in 2023) in both the years. Figure 6A depicts the linear relation relationship between the number of panicles and grain yield. Treatment N4 (160 kg N ha−1) consistently exhibited the highest number of filled grains per panicle (71.76 in 2022 and 74.55 in 2023) in both years, suggesting their positive influence on grain filling and yield potential (Figure 6B). Treatments N4 (160 kg N ha−1) and N5 (200 kg N ha−1) consistently led to longer panicles in both years (27.70 cm in 2022 and 27.94 cm in 2023). Figure 6C shows the direct relationship between panicle length and grain yield. Treatment N4 (160 kg N ha−1) displayed the highest 1,000-grain weight (26.86 g and 26.92 g) in 2022 and 2023, highlighting the influence of nitrogen on grain size and density. Figure 6D depicts the linearity between 1,000-grain weight and grain yield. As the N levels increased the grain yield also increased up to N4 treatment (160 kg N ha−1), after that the grain yield reduced in both the years, as shown in Figure 7A. Treatment N4 (160 kg N ha−1) consistently resulted in the highest grain yield m−2 (481.60 g and 495.65 g) in both 2022 and 2023, emphasizing its effectiveness in maximizing grain production. Treatment N6 (240 kg N ha−1) often had the highest straw yield m−2 (765.04 g in 2022 and 785.61 g in 2023) in both the year. Treatment N3 (120 kg N ha−1) consistently displayed the highest harvest indices (40.82% in 2022 and 39.37% in 2023) in both years. Using the obtained quadratic relationship (y = −0.0846x2 + 29.416x + 2178.8) between the rates of applied nitrogen (x) and the resulting grain yield (y) for TR, we determined the optimal N levels, for maximizing economic profit. we considered maximizing profit by finding the N level that maximizes the ratio of price per unit nitrogen (Px, ₹11.65) to price per unit grain yield (Py, ₹21.83). Solving the quadratic equation, we found that applying 170.69 kg N hectare−1 would generate the maximum profit, leading to a calculated rice production of 4733.97 kg hectare−1 at this N level.
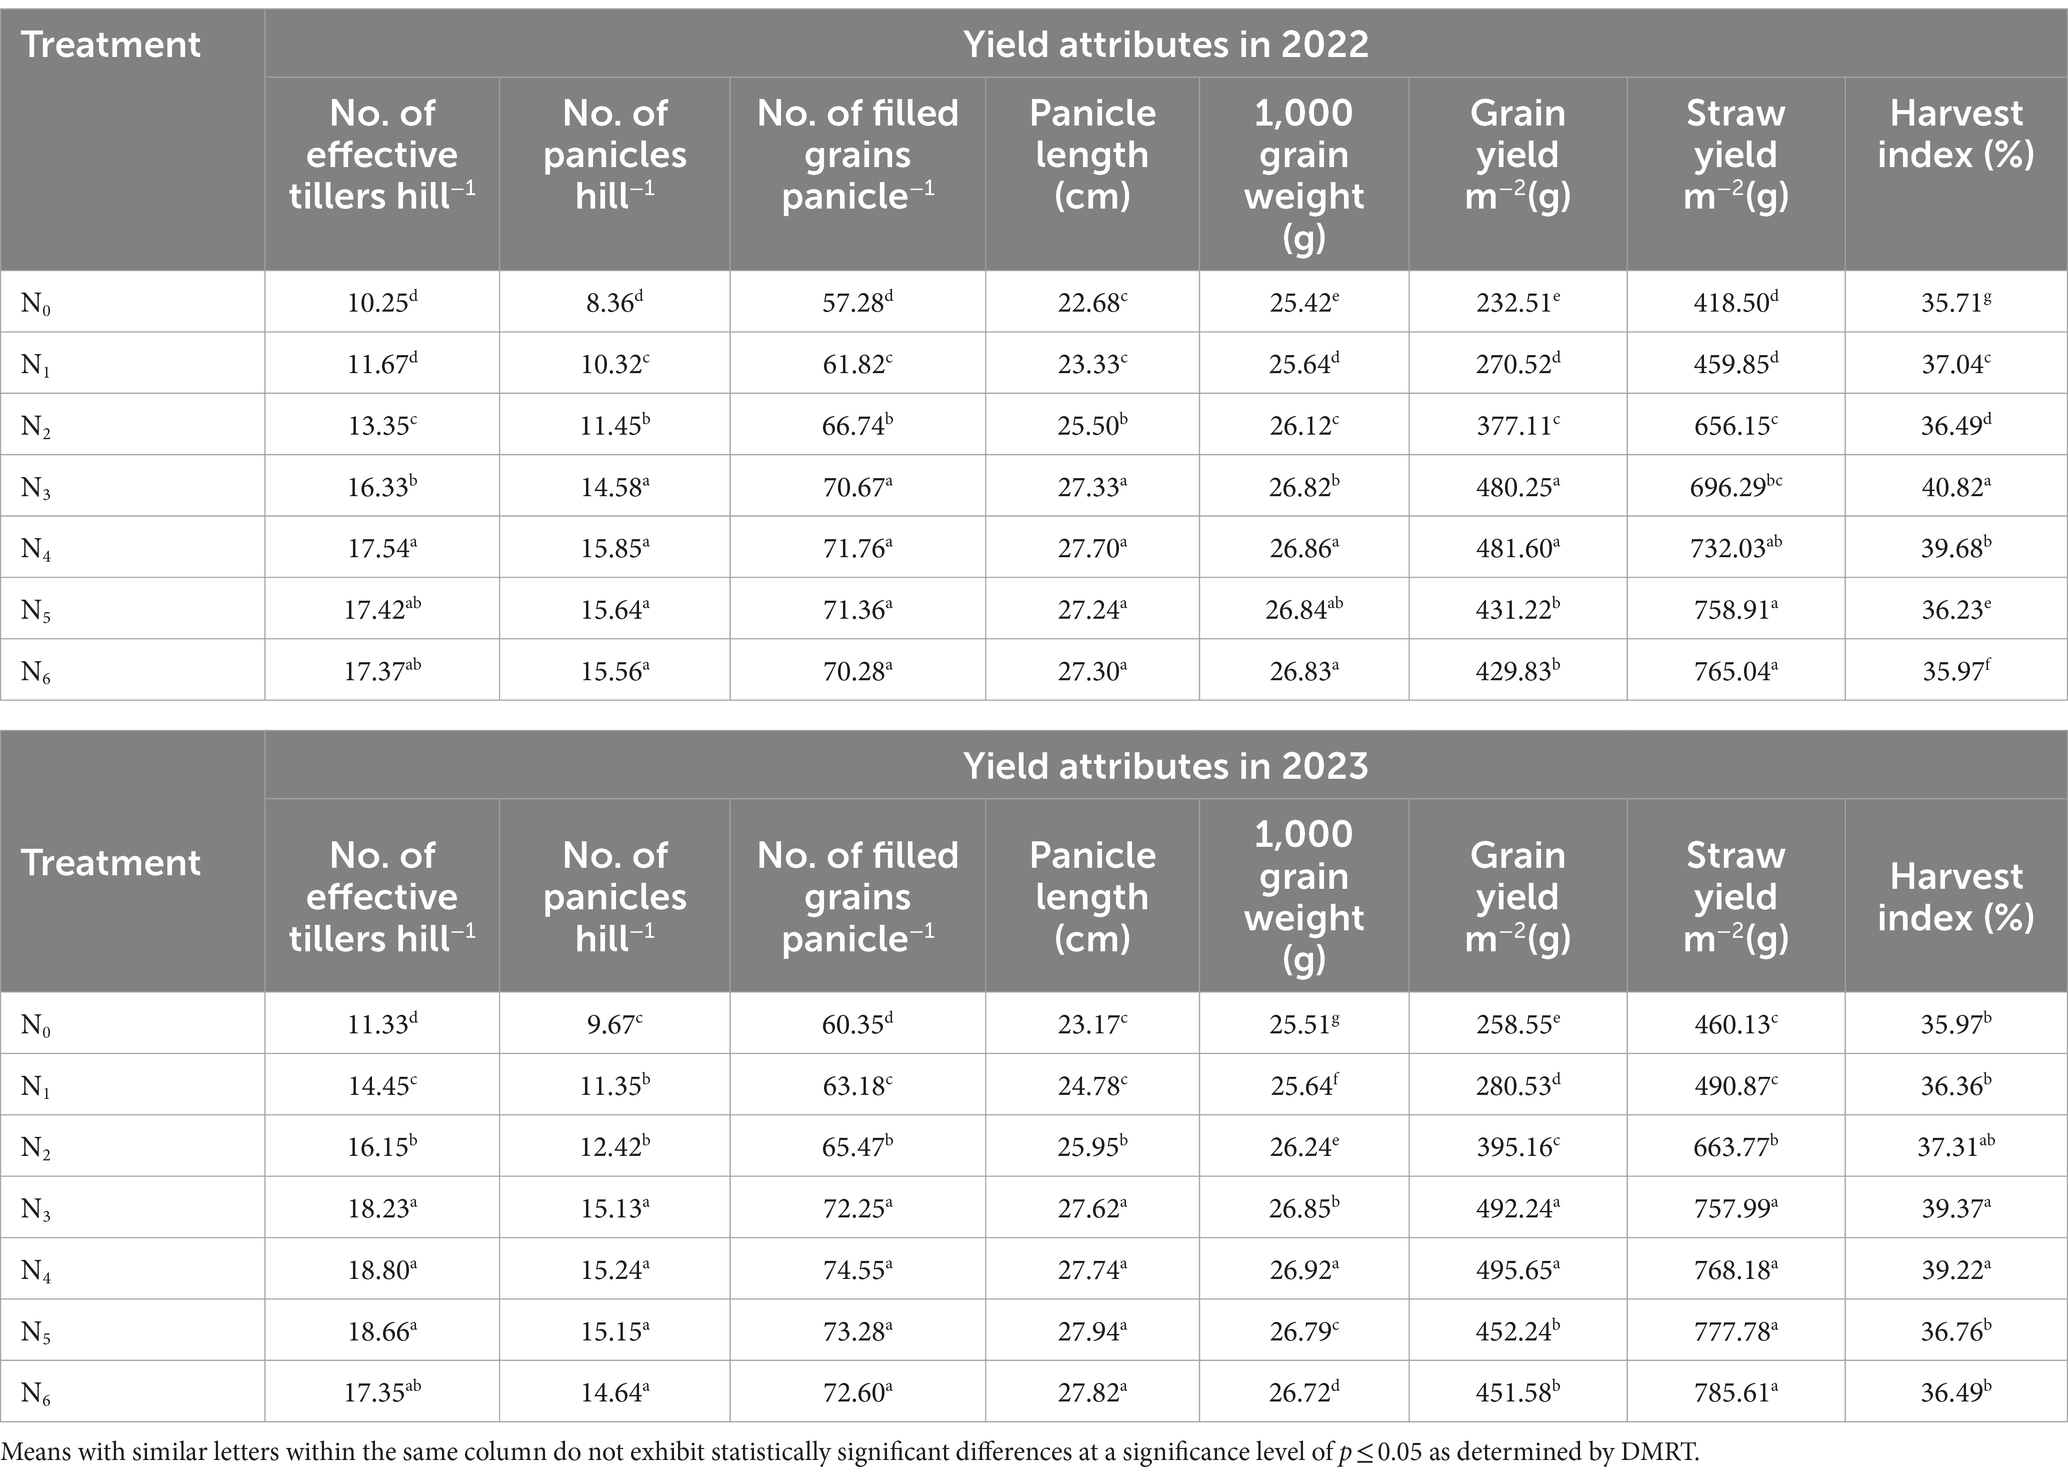
Table 6. Yield attributes and yield of TR under variable fertilizer doses.
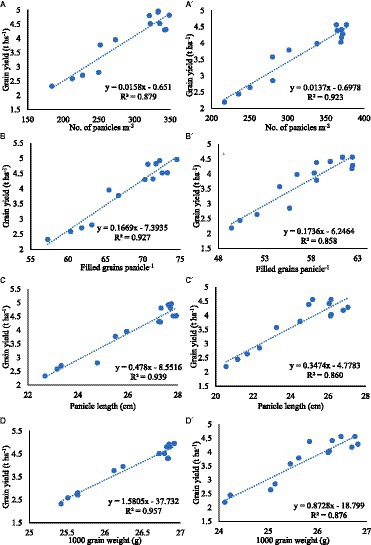
Figure 6. Linear regression between no. of panicles m−2, filled grains panicle−1, panicle length, 1,000 grain weight and grain yield of transplanted and direct seeded rice. Figures (A–D) represent the relation between yield attributes and yield of transplanted rice. Figures (A´–D´) illustrate the relationships between yield attributes and yield of direct seeded rice.
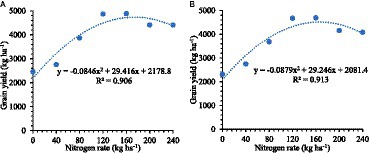
Figure 7. Relationship between N doses and grain yield (2-year mean basis) of (A) transplanted rice and (B) direct seeded rice.
3.6 Effect of N levels on yield attributes and yield of DSR
The findings of the 2-years study revealed that nitrogen treatments exerted a statistically significant (p < 0.05) influence on the yield attributes and grain yield in direct seeded rice, as presented in Table 7. Notably, Treatment N4 (160 kg N ha−1) consistently exhibited the highest values during both the 2022 and 2023 cropping seasons, signifying its capacity to stimulate robust tillering. The number of panicles per hill demonstrated notable disparities across the treatments in both 2022 and 2023. Noteworthy was the consistent predominance of Treatment N4 (160 kg N ha−1), consistently yielding the highest number of panicles m−2 (370.52 in 2022 and 376.85 in 2023). Figure 6A’ illustrates the linear relationship between the number of panicles and grain yield. Regarding the number of filled grains per panicle, treatment N4 (160 kg N ha−1) consistently showcased the highest values (60.05 in 2022 and 62.43 in 2023) in both years. This relationship is depicted in Figure 6B’. Treatment N5 consistently led to longer panicles (26.16 cm in 2022 and 27.05 cm in 2023) during both years, implying its role in enhancing panicle elongation. Figure 6C’ visualizes the direct connection between panicle length and grain yield. Treatment N4 exhibited the highest 1,000-grain weight in 2022 (26.30 g) and 2023 (26.82 g), underscoring the substantial influence of nitrogen on grain size and density. Figure 6D’ portrays the linear correlation between 1,000-grain weight and grain yield. As the nitrogen levels increased, grain yield also experienced a corresponding rise up to the N4 treatment, after which grain yield reduced significantly, as depicted in Figure 7B. Treatment N4 consistently yielded the highest grain output during both the 2022 (441.48 g m−2) and 2023 (456.23 g m−2) cropping seasons, highlighting its effectiveness in maximizing grain production in DSR. There was no statistically significant difference in DSR grain yield between the treatments N3 (120 kg N ha−1) and N4 (160 kg N ha−1) in both the years. Treatment N6 (240 kg N ha−1) frequently produced the highest straw yield (688.89 g m−2 in 2022 and 726.97 g m−2 in 2023) throughout both years. Treatment N3 (120 kg N ha−1) displayed the highest harvest index of 39.68% in 2022 and 40.33% in 2023.Utilizing the derived quadratic correlation (y = −0.0879x2 + 29.246x + 2081.4) between varying nitrogen application rates (x) and resultant grain yield (y) in the context of DSR, we conducted calculations to ascertain the optimal N levels, in terms of maximizing economic profit using the same methods used in TR. Solving the quadratic equation, we determined that applying 163.32 kg N hectare−1 would yield the maximum profit, resulting in a calculated rice production of 4513.26 kg hectare−1 at this optimal economic level.
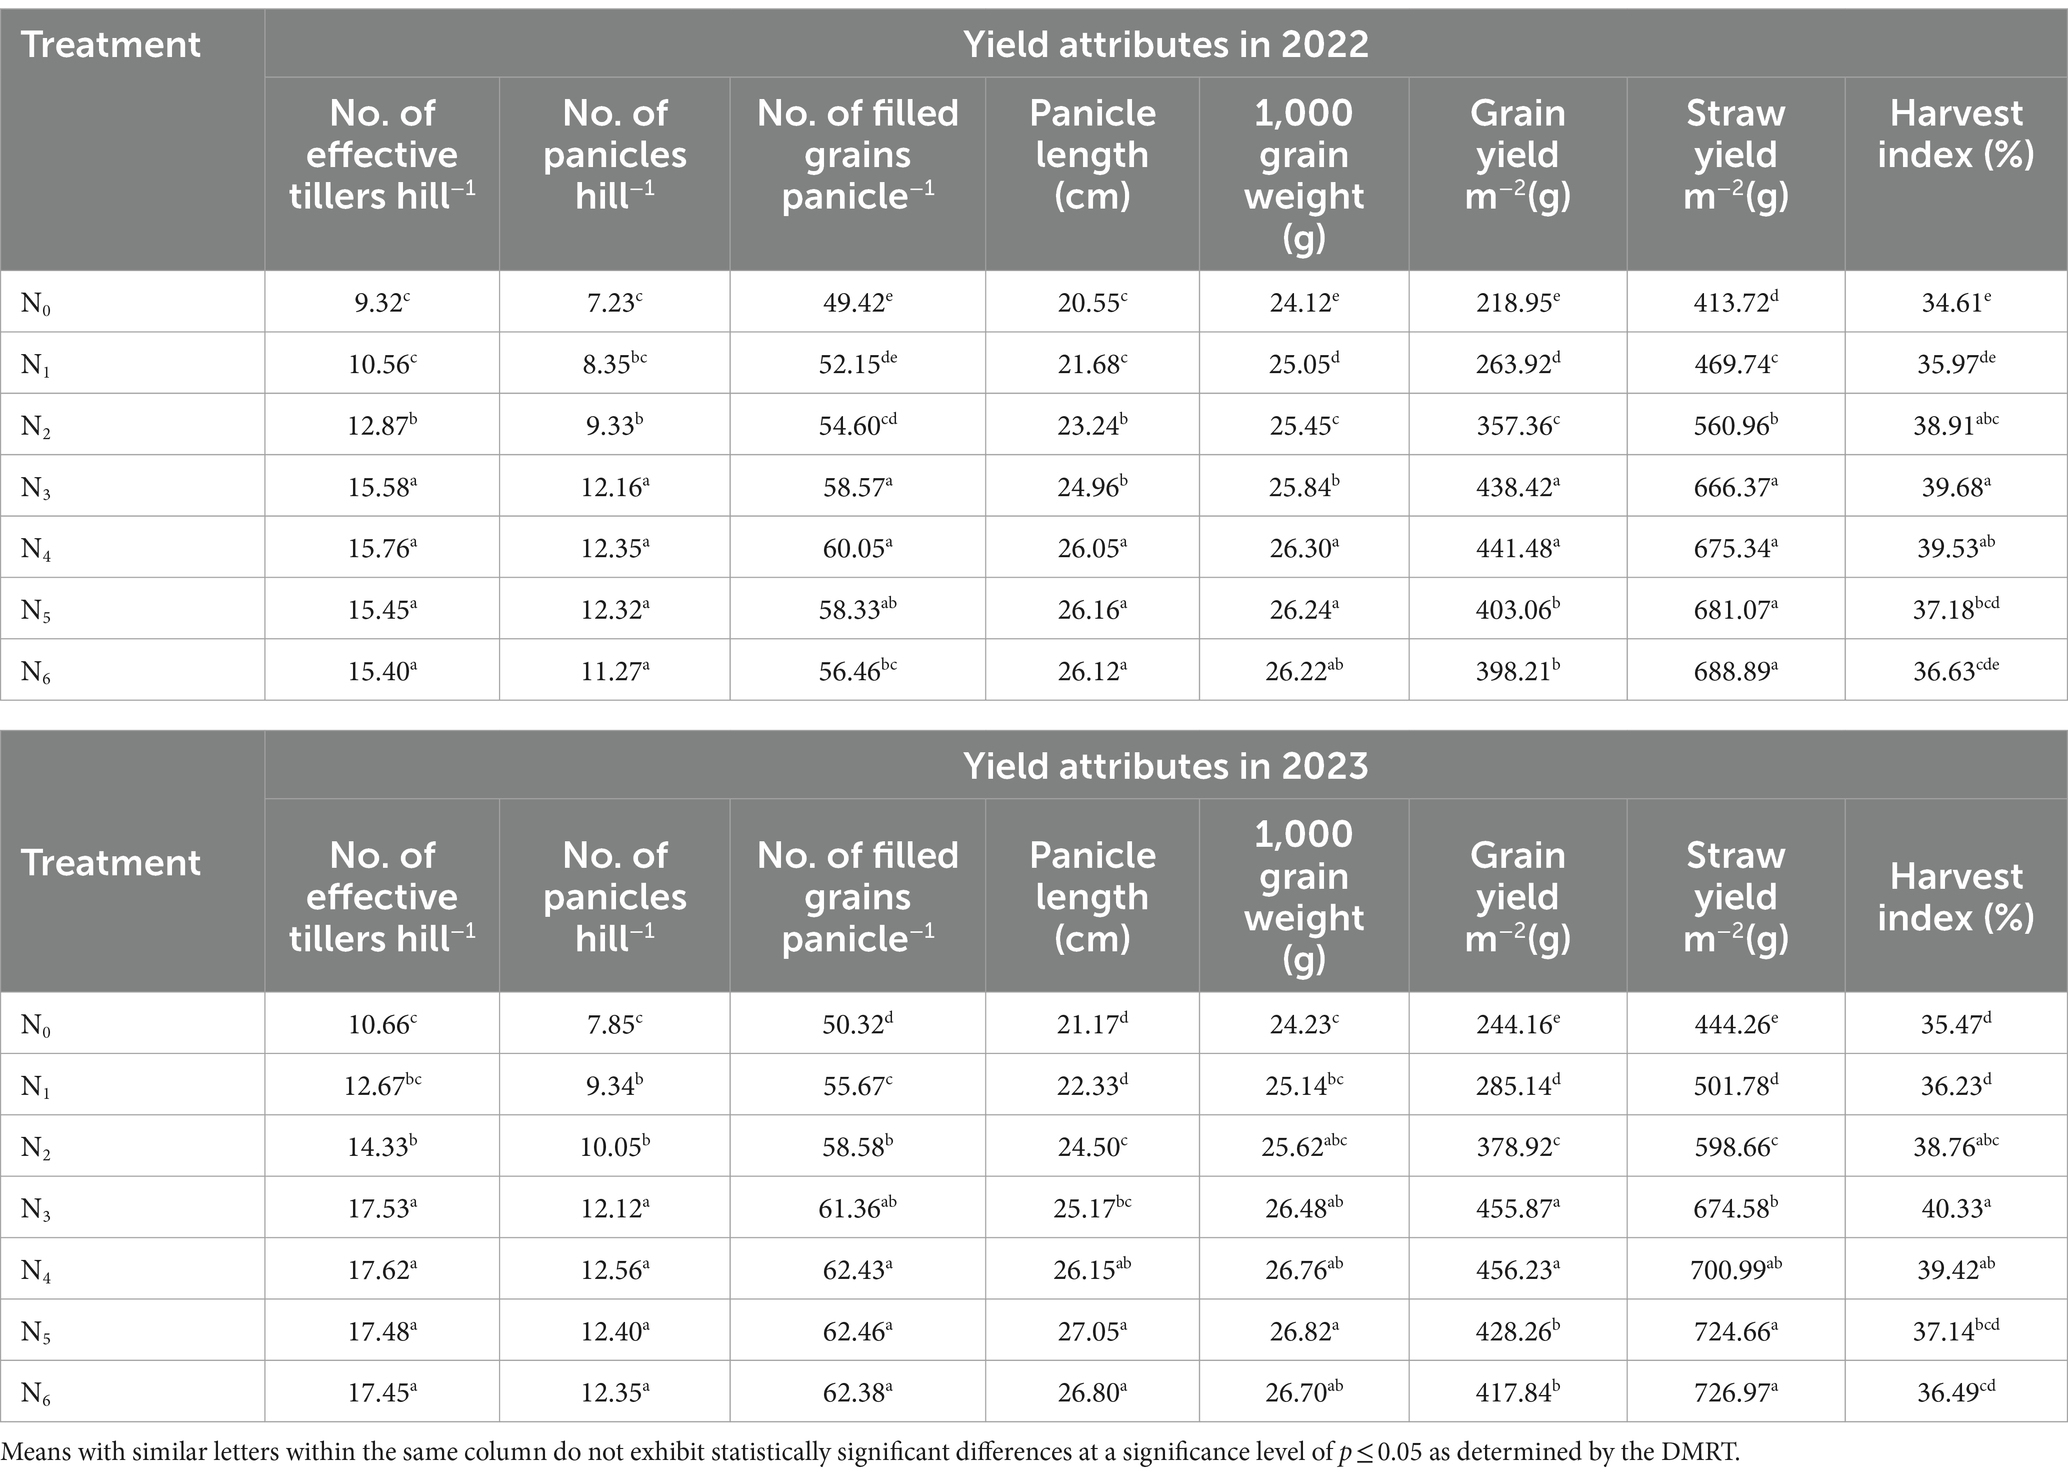
Table 7. Yield attributes and yield of DSR under variable N fertilizer doses.
3.7 Economics
The 2-year mean experimental results highlighted the influence of nitrogen treatments on the cost economics of both transplanted and direct seeded rice (Table 8). In the case of TR and DSR, the cost of production varied with nitrogen treatments. In TR, the highest cost of production was observed for treatment N6 (240 kg N ha−1), reaching $519.72 per hectare, while the lowest was for treatment N0 (0 kg N ha−1) at $486.16 per hectare. The gross return ranged from $695.91 (at 0 kg N ha−1) to $1370.01 (at 160 kg N ha−1), resulting in net returns between $209.75 (at 0 kg N ha−1) and $861.48 (at 160 kg N ha−1). The results indicate a range of benefit–cost ratio (BCR) values, with each treatment combination yielding a different level of profitability. The BCR values ranged from 0.43 (at 0 kg N ha−1) to 1.71 (at 120 kg N ha−1).
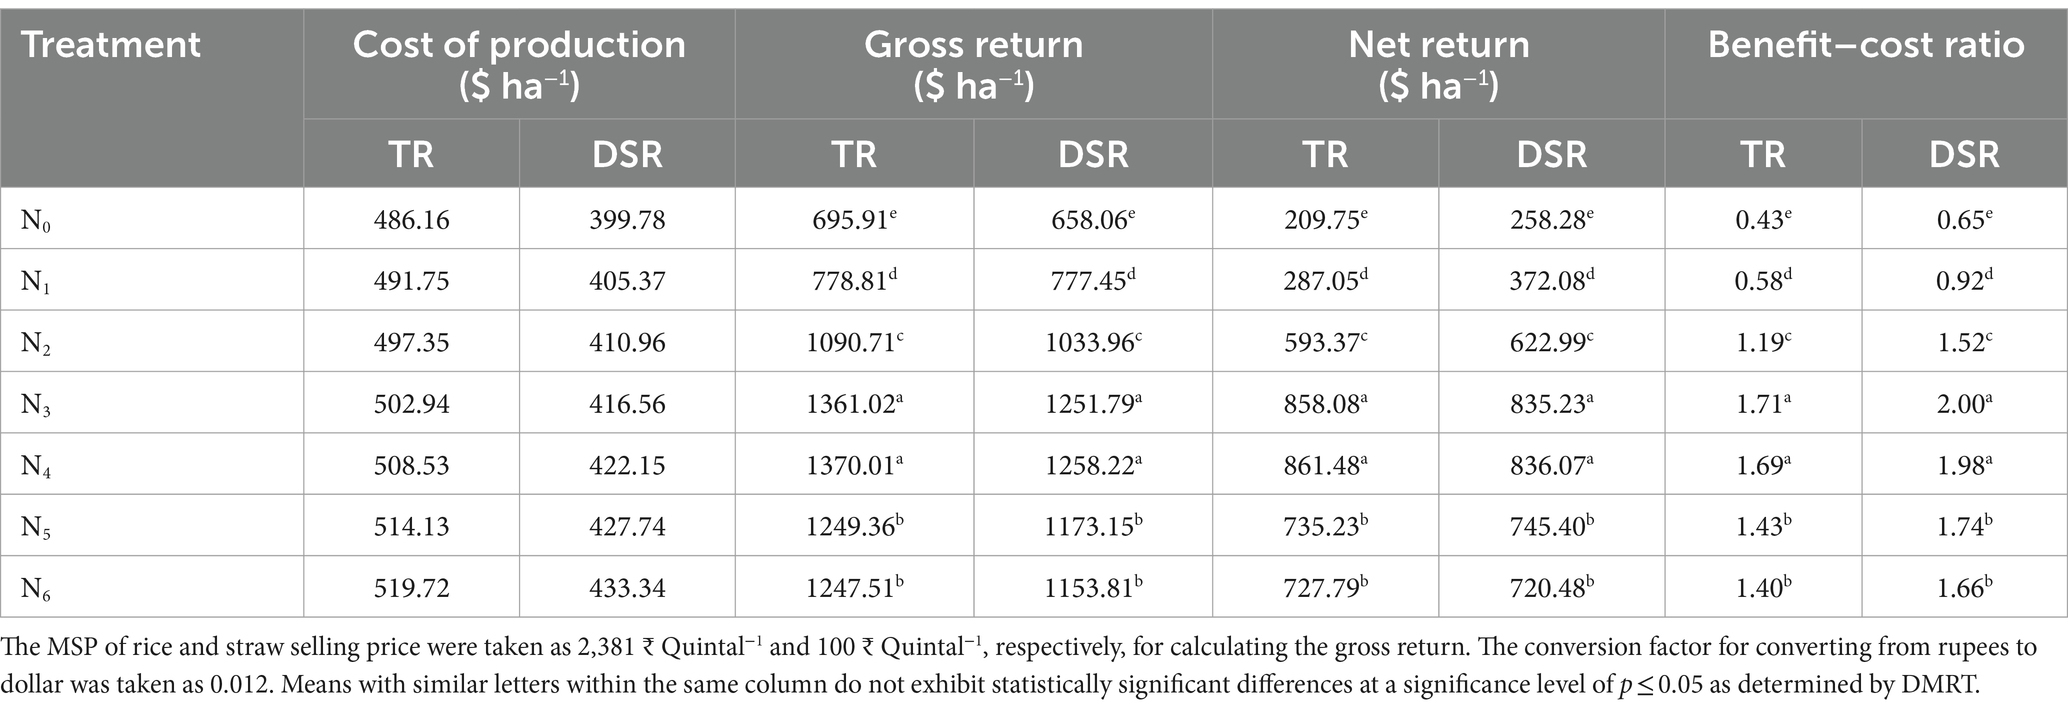
Table 8. Cost economics (2-year mean basis) of TR and DSR.
In the case of DSR, the cost of production ranged from $399.78 (at 0 kg N ha−1) to $433.34 (at 240 kg N ha−1) per hectare. Gross returns varied between $658.06 (at 0 kg N ha−1) and $1258.22 (at 240 kg N ha−1), resulting in net returns ranging from $258.28 (at 0 kg N ha−1) to $836.07 (at 240 kg N ha−1). The BCR for DSR treatments ranged from 0.65 (at 0 kg N ha−1) to 2.00 (at 120 kg N ha−1), indicating favorable returns on investment from treatment N2 to N6. DSR cultivation resulted in higher BCR than transplanted rice at treatment N3 (120 kg N ha−1). While the cost of production, gross returns, and net returns varied across treatments, the benefit–cost ratios suggest the profitability and economic viability of certain nitrogen treatments. However, Treatment N3 (120 kg N ha−1) resulted in highest BCR in transplanted (1.71) and direct seeded rice (2.00), indicating the highest returns on investment which was at par with treatment N4 (160 kg N ha−1).
4 Discussion
4.1 Growth parameters
The effect of N levels on plant height and LAI in both TR and DSR is a crucial aspect of comprehending rice cultivation dynamics. Our study revealed that elevated N levels had a positive impact on plant height in both TR and DSR, a phenomenon rooted in fundamental biological processes. Nitrogen is an indispensable element for the synthesis of amino acids, proteins, and chlorophyll, pivotal components for rice plant growth. An ample supply of nitrogen stimulates the production of proteins and enzymes directly involved in cell elongation, thereby promoting increased plant height (Bao et al., 2015; Upadhyay et al., 2022).
Furthermore, at comparable growth stages, DSR exhibited superior plant growth compared to TR. Saha et al. (2020) similarly reported significantly greater plant height in direct seeded rice compared to transplanted rice and noted that transplant shock in TR delayed growth, reduced tillering, and foliage development. The enhanced plant height in DSR can be attributed to advantages such as seed-based root establishment, absence of transplant shock, reduced interplant competition due to wider row spacing, a prioritized early root development strategy through resource allocation, adaptation to local conditions, and potentially more favorable environmental factors. These combined factors contribute to the overall enhanced plant growth observed in DSR.
The impact of varying N levels on rice LAI was conspicuous, as escalating N levels consistently led to increased LAI values in both TR and DSR. This pattern aligns with the established role of nitrogen in bolstering chlorophyll synthesis and leaf expansion, thereby augmenting photosynthetic capacity (Peng et al., 2021). However, it is essential to emphasize that there existed an optimal N level for optimizing LAI in both DSR and TR, beyond which excessive N application precipitated nutrient uptake imbalances, environmental apprehensions, and heightened vulnerability to lodging (Luo et al., 2022) and diseases. At the initial stage, DSR exhibited a lower LAI in comparison to TR at equivalent growth stages and N levels; however, by 80 DAS, DSR surpassed TR in LAI. Treatment N3 (120 kg N ha−1), N4 (160 kg N ha−1), N5 (200 kg N ha−1), and N6 (240 kg N ha−1) demonstrated statistical parity in LAI under TR, whereas treatment N4 (160 kg N ha−1), N5 (200 kg N ha−1), and N6 (240 kg N ha−1) exhibited statistical equivalence in LAI under DSR. Similar findings were corroborated by Meena et al. (2023) and Pattanayak et al. (2023).
4.2 Vegetation indices
Vegetation indices (VIs) (NDVI, RVI, NDRE and GNDVI) were greatly influenced by applied N levels and cultivation methods (TR and DSR). VIs increased with increasing the N levels in both TR and DSR. Elevated nitrogen levels lead to a higher chlorophyll concentration in plant leaves, improving the plant’s capacity to absorb sunlight and convert it into energy (Peng et al., 2021). Radiation absorption is improved when chlorophyll concentration is higher in leaves. All plants transmit a significant portion of near infrared (NIR) radiation since these wavelengths are not absorbed by photoreceptor cells. However, DSR exhibited less values as compared to TR at equivalent growth stages and N doses.
Notably, 120 kg N ha−1, 160 kg N ha−1, 200 kg N ha−1, and 240 kg N ha−1 treatments showed no statistically significant differences in NDVI, RVI, NDRE, and GNDVI values across the various growth stages of transplanted and direct seeded rice in both the years, indicating their similar effects on rice vegetation indices. The consistent trends across 2 years affirm the influence of different N fertilizer treatments on vegetation indices, with specific treatments consistently yielding higher values. Similar findings were reported by Kumar et al. (2023) where higher values of NDVI were obtained at higher nitrogen dose and growth stage.
4.3 Yield attributes, yield and profitability
Nitrogen fertilization and the choice of rice cultivation methods, namely TR and DSR, exerted significant effects on multiple agronomic parameters. Notably, grain yield exhibited a significant quadratic response to varying N levels across both years and cultivation methods. This observation aligns with findings reported by Liu et al. (2016) and Jahan et al. (2022). Both the cultivation methods (TR and DSR) resulted in highest grain yield at treatment N4 (160 kg N ha−1) which was at par with treatment N3 (120 kg N ha−1). In comparison to treatment N4, the grain yield exhibited reductions of 9.70 and 9.78% under TR at N5 (200 kg N ha−1) and N6 (240 kg N ha−1) treatments, and 7.39 and 9.09% under DSR at N5 and N6 treatments, respectively. The grain yield in both TR and DSR is contingent upon distinct yield components, including the number of panicles m−2, the spikelets panicle−1, thousand-grain weight, and the proportion of filled spikelets. The consensus in the literature underscores the pivotal role of panicle density in attaining higher yields, particularly in DSR (Gunawardena and Fukai, 2005; Tayefe et al., 2014). It is noteworthy that TR consistently outperformed DSR in terms of grain yield across various N levels, a finding that is congruent with the results obtained by Akhgari and Kaviani (2011) and Bastola et al. (2021). A primary contributing factor to the reduced yield in DSR as compared to puddled transplanting rice is the higher incidence of spikelet sterility, as elucidated by Xu et al. (2019) and Ishfaq et al. (2020). The number of panicles m−2 increased with escalating N levels in both cultivation methods. Among these, treatments N3, N4, N5, and N6 exhibited statistically equivalent numbers of panicles per hill. This trend aligns with the findings reported by Artacho et al. (2009), which underscored a linear relationship between N fertilization and the number of panicles per square meter. Furthermore, it is worth noting that DSR, in comparison to TR, produced a higher number of panicles m−2 but a lower number of spikelets panicle−1, as corroborated by Huang et al. (2011). The increased number of panicles m−2 in DSR primarily stemmed from a higher number of tillers m−2, as the number of tillers hill−1 remained modest in DSR plants. In terms of the thousand-grain weight, a pivotal parameter for achieving higher grain yield, TR consistently outperformed DSR across all N treatments. These outcomes align with prior research conducted by Naresh et al. (2013) and Bastola et al. (2021), which concurred that transplanted rice exhibited a higher thousand-grain weight in comparison to direct seeded rice.
Our study revealed that, in the context of DSR cultivation with varying levels of nitrogen treatments, the net returns were statistically at par to those of TR. However, the benefit–cost ratio was notably higher in DSR compared to TR. Specifically, in DSR with RDN treatment (N3), the cost–benefit ratio surpassed that of TR by 16.96%. This observation aligns with the findings of Chakraborty et al. (2017), who also reported higher net economic returns for farmers in wet or dry DSR compared to TR, with a 13% increase in returns for wet DSR. In contrast to TR, the cost of production resulted in a decrease of US$86.38 per hectare in the case of DSR. In a broader context, an extensive analysis of 77 published studies across Asian countries conducted by Kumar and Ladha (2011) demonstrated that various DSR methods led to a reduction in production costs by a range of US$9 to US$125 hectare−1 when compared to TR.
5 Conclusion
In this study, we investigated the impact of different nitrogen levels on vegetation indices, growth parameters, yield characteristics, and economic aspects of rice production through transplanting and direct seeding. Our findings demonstrate significant nitrogen influence on vegetation indices, plant height, LAI, and grain yields. Notably, treatment N4 (160 kg N ha−1) consistently resulted in the highest grain production across both methods. Direct seeding with recommended nitrogen level (120 kg N ha−1) proved more economically advantageous, surpassing transplanting by 16.96%. These insights offer valuable guidance for optimizing nitrogen management practices, enhancing rice crop performance, and maximizing economic returns in both cultivation methods.
Data availability statement
The original contributions presented in the study are included in the article/supplementary material, further inquiries can be directed to the corresponding authors.
Author contributions
MC: Formal analysis, Methodology, Writing – original draft, Writing – review & editing, Conceptualization, Investigation. TK: Conceptualization, Investigation, Methodology, Writing – original draft, Writing – review & editing, Data curation, Supervision. PU: Data curation, Methodology, Supervision, Writing – original draft, Writing – review & editing, Formal analysis. RP: Conceptualization, Data curation, Supervision, Writing – original draft, Writing – review & editing. HK: Conceptualization, Methodology, Supervision, Writing – original draft, Writing – review & editing. CS: Data curation, Formal analysis, Writing – original draft, Writing – review & editing. AL: Conceptualization, Methodology, Writing – original draft, Writing – review & editing. IM: Writing – review & editing.
Funding
The author(s) declare that no financial support was received for the research, authorship, and/or publication of this article.
Acknowledgments
Authors would like to thank the workers of seed production unit (SPU), ICAR-IARI, New Delhi, for their assistance and guidance to carry out the research work. We would like to convey our gratitude to Water Technology Centre, ICAR-IARI for providing the spectroradiometer instrument which was used to capture the spectral signature of rice canopy.
Conflict of interest
The authors declare that the research was conducted in the absence of any commercial or financial relationships that could be construed as a potential conflict of interest.
Publisher’s note
All claims expressed in this article are solely those of the authors and do not necessarily represent those of their affiliated organizations, or those of the publisher, the editors and the reviewers. Any product that may be evaluated in this article, or claim that may be made by its manufacturer, is not guaranteed or endorsed by the publisher.
References
Ahmed, M., Rauf, M., Akhtar, M., Mukhtar, Z., and Saeed, N. A. (2020). Hazards of nitrogen fertilizers and ways to reduce nitrate accumulation in crop plants. Environ. Sci. Pollut. Res. Int. 27, 17661–17670. doi: 10.1007/s11356-020-08236-y
Akhgari, H., and Kaviani, B. (2011). Assessment of direct seeded and transplanting methods of rice cultivars in the northern part of Iran. Afr. J. Agric. Res. 6, 6492–6498. doi: 10.5897/AJAR11.973
Ali, A. M., Ibrahim, S. M., and Singh, B. (2020). Wheat grain yield and nitrogen uptake prediction using at leaf and GreenSeeker portable optical sensors at jointing growth stage. Inf. Process. Agric. 7, 375–383. doi: 10.1016/j.inpa.2019.09.008
Artacho, P., Bonomelli, C., and Meza, F. (2009). Nitrogen application in irrigated rice grown in Mediterranean conditions: effects on grain yield, dry matter production, nitrogen uptake, and nitrogen use efficiency. J. Plant Nutr. 32, 1574–1593. doi: 10.1080/01904160903094339
Ata-Ul-Karim, S. T., Yao, X., Lio, X., Cao, W., and Zhu, Y. (2013). Development of critical nitrogen dilution curve of japonica rice in Yangtze River reaches. Field Crop Res. 149, 149–158. doi: 10.1016/j.fcr.2013.03.012
Bao, A., Zhao, Z., Ding, G., Shi, L., Xu, F., and Cai, H. (2015). The stable level of glutamine synthetase 2 plays an important role in rice growth and in carbon-nitrogen metabolic balance. Int. J. Mol. Sci. 16, 12713–12736. doi: 10.3390/ijms160612713
Baresel, J. P., Rischbeck, P., Kipp, S., Hu, Y., Barmeier, G., Mistele, B., et al. (2017). Use of a digital camera as alternative method for non-destructive detection of the leaf chlorophyll content and the nitrogen nutrition status in wheat. Comput. Electron. Agr. 140, 25–33. doi: 10.1016/j.compag.2017.05.032
Bastola, A., Karki, T., Marahatta, S., and Magain, L. P. (2021). Growth, phenology, yield and yield attributes of rice as influenced by tillage, residue and nitrogen management practice in Chitwan, Nepal. Afr. J. Agric. Res. 17, 128–136. doi: 10.5897/AJAR2020.15168
Bhagat, P., Kushwah, A., Yadav, R., Nag, R. H., Chowdhury, M., Carpenter, G., et al. (2023). SunSync innovation: empowering traditional solar flat plate collectors with autonomous sun-tracking for tea leaf drying. Int. J. Environ. Clim. Chang. 13, 2162–2171. doi: 10.9734/ijecc/2023/v13i113378
Blackmer, T. M., Schepers, J. S., and Varvel, G. E. (1994). Light reflectance compared with other nitrogen stress measurements in corn leaves. Agron. J. 86, 934–938. doi: 10.2134/agronj1994.00021962008600060002x
Blackmer, T. M., Schepers, J. S., Varvel, G. E., and Walter-Shea, E. A. (1996). Nitrogen deficiency detection using reflected shortwave radiation from irrigated corn canopies. Agron. J. 88, 1–5. doi: 10.2134/agronj1996.00021962008800010001x
Chakraborty, D., Ladha, J. K., Rana, D. S., Jat, M. L., Gathala, M. K., Yadav, S., et al. (2017). A global analysis of alternative tillage and crop establishment practices for economically and environmentally efficient rice production. Sci. Rep. 7:9342. doi: 10.1038/s41598-017-09742-9
Chowdhury, M., Kushwah, A., Satpute, A. N., Singh, S. K., and Patil, A. K. (2023a). A comprehensive review on potential application of nanomaterials in the field of agricultural engineering. J. Biosyst. Eng. 48, 457–477. doi: 10.1007/s42853-023-00204-x
Chowdhury, M., Lande, S. D., Khura, T. K., Parray, R. A., Upadhyay, P. K., and Kumar, P. (2023b). Energetics and cost economics of wheat–based cropping system. Ann. Agric. Res. 44, 37–45.
Chowdhury, M., Thomas, E. V., Jha, A., Kushwah, A., Kurmi, R., Khura, T. K., et al. (2023c). An automatic pressure control system for precise spray pattern analysis on spray patternator. Comput. Electron. Agric. 214:108287. doi: 10.1016/j.compag.2023.108287
Djaman, K., Mel, V. C., Ametonou, F. Y., Namaky, R. E., Diallo, M. D., et al. (2018). Effect of nitrogen fertilizer dose and application timing on yield and nitrogen use efficiency of irrigated hybrid Rice under semi-arid conditions. J. Agri. Sci. Food Res. 9:223.
Elsayed, S., Barmeier, G., and Schmidhalter, U. (2018). Passive reflectance sensing and digital image analysis allows for assessing the biomass and nitrogen status of wheat in early and late tillering stages. Front. Plant Sci. 9:1478. doi: 10.3389/fpls.2018.01478
Frels, K., Guttieri, M., Joyce, B., Leavitt, B., and Baenziger, P. S. (2018). Evaluating canopy spectral reflectance vegetation indices to estimate nitrogen use traits in hard winter wheat. Field Crop Res. 217, 82–92. doi: 10.1016/j.fcr.2017.12.004
Gawande, V., Saikanth, D. R. K., Sumithra, B. S., Aravind, S. A., Swamy, G. N., Chowdhury, M., et al. (2023). Potential of precision farming technologies for eco-friendly agriculture. Int. J. Plant Sci. 35, 101–112. doi: 10.9734/ijpss/2023/v35i193528
Gitelson, A. A., Kaufman, Y. J., and Merzlyak, M. N. (1996). Use of a green channel in remote sensing of global vegetation from EOS-MODIS. Remote Sens. Environ. 58, 289–298. doi: 10.1016/S0034-4257(96)00072-7
Gitelson, A. A., Viña, A., Ciganda, V., Rundquist, D. C., and Arkebauer, T. J. (2005). Remote estimation of canopy chlorophyll content in crops. Geophys. Res. Lett. 32:L08403. doi: 10.1029/2005GL022688
Gunawardena, T. A., and Fukai, S. (2005). The interaction of nitrogen application and temperature during reproductive stage on spikelet sterility in field-grown rice. Aust. J. Agric. Res. 56, 625–636. doi: 10.1071/AR04099
Hatfield, J. L., Gitelson, A. A., Schepers, J. S., and Walthall, C. L. (2008). Application of spectral remote sensing for agronomic decisions. Agron. J. 100, 117–131. doi: 10.2134/agronj2006.0370c
Huang, M., Zou, Y., Jiang, P., Xia, B., Feng, Y., Cheng, Z., et al. (2011). Yield component differences between direct-seeded and transplanted super hybrid rice. Plant Prod. Sci. 14, 331–338. doi: 10.1016/j.cj.2021.07.003
Inoue, Y., Guérif, M., Baret, F., Skidmore, A., Gitelson, A., Schlerf, M., et al. (2016). Simple and robust methods for remote sensing of canopy chlorophyll content: a comparative analysis of hyperspectral data for different types of vegetation. Plant Cell Environ. 39, 2609–2623. doi: 10.1111/pce.12815
Ishfaq, M., Akbar, N., Anjum, S. A., and Anwar-Ijl-Haq, M. (2020). Growth, yield and water productivity of dry direct seeded rice and transplanted aromatic rice under different irrigation management regimes. J. Integr. Agric. 19, 2656–2673. doi: 10.1016/S2095-3119(19)62876-5
Jahan, A., Islam, A., Sarkar, M. I. U., Iqbal, M., Ahmed, M. N., and Islam, M. R. (2022). Nitrogen response of two high yielding rice varieties as influenced by nitrogen levels and growing seasons. Geol. Ecol. Landsc. 6, 24–31. doi: 10.1080/24749508.2020.1742509
Jordan, C. F. (1969). Derivation of leaf-area index from quality of radiation on the forest floor. Ecology 50, 663–666. doi: 10.2307/1936256
Kumar, V., and Ladha, J. K. (2011). Direct seeding of rice: recent developments and future research needs. Advan. Agron. 111, 297–413. doi: 10.12944/CARJ.5.1.03
Kumar, B., Shaloo, B., Bisht, H., Meena, M. C., Dey, A., Dass, A., et al. (2023). Nitrogen management sensor optimization, yield, economics, and nitrogen use efficiency of different wheat cultivars under varying nitrogen levels. Front. Sustain. Food Syst. 7:1228221. doi: 10.3389/fsufs.2023.1228221
Kumari, A., Ashoka, P., Tiwari, P., Sachan, P., Malla, A. K., Tripathy, A., et al. (2023). Zero tillage Lead to enhanced productivity and soil health. Int. J. Environ. Clim. Chang. 13, 3707–3715. doi: 10.9734/ijecc/2023/v13i103042
Kurmi, R., Lande, S. D., Kurmi, J., Chowdhury, M., Singh, C., and Kumar, P. (2023). Comparative study on carbon footprint assessment of Rice-wheat production system. Int. J. Environ. Clim. Chang. 13, 390–398. doi: 10.9734/ijecc/2023/v13i113182
Kushwah, A., Chouriya, A., Tewari, V. K., Gupta, C., Chowdhury, M., Shrivastava, P., et al. (2024a). A novel embedded system for tractor implement performance mapping. Cogent Eng. 11:2311093. doi: 10.1080/23311916.2024.2311093
Kushwah, A., Sharma, P. K., Kushwaha, H. L., Nag, R. H., Carpenter, G., Choudhary, M. K., et al. (2024b). Economic evaluation of precise intelligent cauliflower harvester: a comparative study with manual harvesting. J. Sci. Res. Rep. 30, 33–42. doi: 10.9734/jsrr/2024/v30i11822
Kushwah, A., Sharma, P. K., Kushwaha, H. L., Sharma, B. B., Carpenter, G., Nag, R. H., et al. (2023). Innovative selective harvesting technology for cauliflower: a design approach using plant characteristics. Environ. Ecol. 41, 2595–2601. doi: 10.60151/envec/JMNF4522
Li, F., Mistele, B., Hu, Y., Chen, X., and Schmidhalter, U. (2014). Optimising three-band spectral indices to assess aerial N concentration, N uptake and aboveground biomass of winter wheat remotely in China and Germany. ISPRS J. Photogramm. Remote Sens. 92, 112–123. doi: 10.1016/j.isprsjprs.2014.03.006
Liu, X., Wang, H., Zhou, J., Hu, F., Zhu, D., Chen, Z., et al. (2016). Effect of N fertilization pattern on rice yield, N use efficiency and fertilizer–N fate in the Yangtze River basin, China. PLoS One 11:e0166002. doi: 10.1371/journal.pone.0166002
Luo, X., Wu, Z., Fu, L., Dan, Z., Yuan, Z., Liang, T., et al. (2022). Evaluation of lodging resistance in rice based on an optimized parameter from lodging index. Crop Sci. 62, 1318–1332. doi: 10.1002/csc2.20712
Ma, Z., Yue, Y., Feng, M., Yushun, L., Ma, X., Zhao, X., et al. (2019). Mitigation of ammonia volatilization and nitrate leaching via loss control urea triggered H-bond forces. Sci. Rep. 9:15140. doi: 10.1038/s41598-019-51566-2
Meena, R. K., Singh, Y. V., Shivay, Y. S., Kumar, D., Kumar, R., Ram, H., et al. (2023). Rice performance as influenced by crop establishment methods, green organic mulches and rates of nitrogen fertilization along with liquid Azotobacter chroococcum. J. Plant Nutr. 46, 401–422. doi: 10.1080/01904167.2022.2068440
Naresh, R. K., Misra, A. K., and Singh, S. P. (2013). Assessment of direct seeded and transplanting methods of rice cultivars in the western part of Uttar Pradesh. Int. J. Pharm. Sci. Bus. Manag. 1, 1–8.
Patra, K., Parihar, C. M., Nayak, H. S., Rana, B., Sena, D. R., Anand, A., et al. (2023). Appraisal of complementarity of subsurface drip fertigation and conservation agriculture for physiological performance and water economy of maize. Agric. Water Manag. 283:108308. doi: 10.1016/j.agwat.2023.108308
Pattanayak, S., Jena, S., Das, P., Roul, P. K., Maitra, S., Shankar, T., et al. (2023). Crop establishment methods and weed management practices influence the productivity and profitability of kharif rice (Oryza sativa L.) in a hot-humid summer climatic conditions. Paddy Water Environ. 21, 447–466. doi: 10.1007/s10333-023-00940-y
Peng, J., Feng, Y., Wang, X., Li, J., Xu, G., Phonenasay, S., et al. (2021). Effects of nitrogen application rate on the photosynthetic pigment, leaf fluorescence characteristics, and yield of indica hybrid rice and their interrelations. Sci. Rep. 11:7485. doi: 10.1038/s41598-021-86858-z
Prey, L., and Schmidhalter, U. (2019). Sensitivity of vegetation indices for estimating vegetative N status in winter wheat. Sensors 19:3712. doi: 10.3390/s19173712
Saha, S., Tuti, M. D., Kumar, R. M., and Singh, T. V. (2020). Suitability of elite genotypes for wet-direct seeding in rice-rice system in vertisol. ORYZA Int. J. Rice 57, 36–42. doi: 10.35709/ory.2020.57.1.4
Sahoo, R. N., Gakhar, S., Rejith, R. G., Ranjan, R., Meena, M. C., Dey, A., et al. (2023a). Unmanned aerial vehicle (UAV)–based imaging spectroscopy for predicting wheat leaf nitrogen. Photogramm. Eng. Remote Sens. 89, 107–116. doi: 10.14358/PERS.22-00089R2
Sahoo, R. N., Rejith, R. G., Gakhar, S., Ranjan, R., Meena, M. C., Dey, A., et al. (2023b). Drone remote sensing of wheat N using hyperspectral sensor and machine learning. Precis. Agric. doi: 10.1007/s11119-023-10089-7
Saito, K., Diack, S., Dieng, I., and Ndiaye, M. K. (2015). On-farm testing of a nutrient management decision-support tool for rice in the Senegal River valley. Comput. Electron. Agric. 116, 36–44. doi: 10.1016/j.compag.2015.06.008
Singh, V. K., Dwivedi, B. S., Mishra, R. P., Shukla, A. K., Timsina, J., Upadhyay, P. K., et al. (2019). Yields, soil health and farm profits under a Rice-wheat system: long-term effect of fertilizers and organic manures applied alone and in combination. Agron Basel. 9, 1–22. doi: 10.3390/agronomy9010001
Tayefe, M., Gerayzade, A., Amiri, E., and Zade, A. N. (2014). Effect of nitrogen on rice yield, yield components and quality parameters. Afr. J. Biotechnol. 13, 91–105. doi: 10.5897/AJB11.2298
Upadhyay, P. K., Sen, A., Rathore, S. S., Kumar, B., Singh, R. K., Prasad, S. K., et al. (2019). Scientific validation of indigenous organic formulation-panchagavya for sustaining rice productivity and residual effect in rice-lentil system under hot semi-arid eco-region of middle Indo-Gangetic plains. Indian J. Tradit. Know. 18, 104–113.
Upadhyay, P. K., Sen, A., Singh, Y., Singh, R. K., Prasad, S. K., Sankar, A., et al. (2022). Soil health, energy budget, and Rice productivity as influenced by cow products application with fertilizers under south Asian eastern Indo-Gangetic Plains zone. Front. Agron. 3:758572. doi: 10.3389/fagro.2021.758572
Upadhyay, P. K., Singh, V. K., Rajanna, G. A., Dwivedi, B. S., Dey, A., Singh, R. K., et al. (2023). Unveiling the combined effect of nano fertilizers and conventional fertilizers on crop productivity, profitability, and soil well-being. Front. Sustain. Food Syst. 7:1260178. doi: 10.3389/fsufs.2023.1260178
Ustin, S. L., and Gamon, J. A. (2010). Remote sensing of plant functional types. New Phytol. 186, 795–816. doi: 10.1111/j.1469-8137.2010.03284.x
Verrelst, J., Camps-Valls, G., Muñoz-Marí, J., Rivera, J. P., Veroustraete, F., Clevers, J. G., et al. (2015). Optical remote sensing and the retrieval of terrestrial vegetation bio-geophysical properties – a review. ISPRS J. Photogramm. Remote Sens. 108, 273–290. doi: 10.1016/j.isprsjprs.2015.05.005
Viña, A., Gitelson, A. A., Nguy-Robertson, L. A., and Peng, Y. (2011). Comparison of different vegetation indices for the remote assessment of green leaf area index of crops. Remote Sens. Environ. 115, 3468–3478. doi: 10.1016/j.rse.2011.08.010
Keywords: direct seeded rice, economics, transplanted rice, vegetation indices, yield, yield attributes
Citation: Chowdhury M, Khura TK, Upadhyay PK, Parray RA, Kushwaha HL, Singh C, Lama A and Mani I (2024) Assessing vegetation indices and productivity across nitrogen gradients: a comparative study under transplanted and direct-seeded rice. Front. Sustain. Food Syst. 8:1351414. doi: 10.3389/fsufs.2024.1351414
Edited by:
Raju Datla, Global Institute for Food Security (GIFS), CanadaReviewed by:
Atique ur Rehman, Bahauddin Zakariya University, PakistanKulasekaran Ramesh, Indian Institute of Oilseeds Research (ICAR), India
Copyright © 2024 Chowdhury, Khura, Upadhyay, Parray, Kushwaha, Singh, Lama and Mani. This is an open-access article distributed under the terms of the Creative Commons Attribution License (CC BY). The use, distribution or reproduction in other forums is permitted, provided the original author(s) and the copyright owner(s) are credited and that the original publication in this journal is cited, in accordance with accepted academic practice. No use, distribution or reproduction is permitted which does not comply with these terms.
*Correspondence: Pravin Kumar Upadhyay, cHJhdmluLm5kdUBnbWFpbC5jb20=; Tapan Kumar Khura, dGFwYW5raHVyYTIwMjBAZ21haWwuY29t