 Misbah A. Hussein1,2
 Amare Haileslassie3
 Melkamu B. Derseh1
 Tewodros T. Assefa2
 Fikadu T. Riga1
 Aberra Adie1
 Aschalew K. Tebeje2,4
 Chris S. Jones1
 Seifu A. Tilahun2,5*
- 1International Livestock Research Institute (ILRI), Addis Ababa, Ethiopia
- 2Faculty of Civil and Water Resources Engineering, Bahir Dar Institute of Technology, Bahir Dar University, Bahir Dar, Ethiopia
- 3International Water Management Institute (IWMI), Addis Ababa, Ethiopia
- 4Lihiket Design and Supervision Corporation, Bahir Dar, Ethiopia
- 5International Water Management Institute (IWMI), Accra, Ghana
Introduction: The increasing pressure on land and water resources, fueled by high population growth and climate change, has profound implications for crop yield and quality. While studies thrive for various crops, a notable research gap exists in understanding the responses of forage crops to irrigation and nutrient management in developing countries. This study aims to address this gap by assessing the impact of irrigation and fertilizer application on forage production in the Ethiopian sub-humid highlands.
Methods: The experiment focused on four forage varieties, namely Napier grass (Cenchrus purpureus) cultivars, ILRI-16791, ILRI-16819, ILRI-16803, and Guinea grass (Megathyrsus maximus) ILRI-144 cultivated in experimental plots. Three irrigation levels designated as IR60 (60% of total available soil water), IR80 (80%), and IR100 (100%) were applied, along with three fertilizer rates: organic manure at 30 t ha−1, and Urea-N at 100 kg ha−1 and 300 kg ha−1. Agronomic data including growth performance, forage dry matter yield, and nutritional quality were collected during two trial years.
Results and discussion: Among the various irrigation treatments, IR80 demonstrated the most favorable balance between forage yield, WUE, net benefit, and LWP. In addition, the highest DMY, WUE, net benefit, and LWP were obtained for UREA at the rate of 300 kg ha−1 while the lowest DMY and WUE were observed for UREA at the rate of 100 kg ha−1. Significant variations were observed among the four forage varieties, with Napier grass ILRI-16791 having the highest DMY (9.8 tons ha−1), WUE (39 kg ha−1 mm−1), LWP (0.28 USD m−3 for local cows, and 1.04 USD m−3 for crossbred cows), and net benefit (783 USD ha−1). For all forages combined, a 40 and 20% decrease in irrigation increased water use efficiency by 17 and 9.4%, respectively. These results indicate that a moderate level of deficient irrigation such as IR80 could be a viable water management strategy for irrigated forage, especially in water-scarce areas. The conserved water saved from the deficit irrigation can thus be used to irrigate additional land, contributing to a more sustainable and efficient water usage approach.
1 Introduction
Pressure on land and water resources is increasing due to high population growth and the expansion of agricultural land for crop production across the globe. Feeding a growing population amid climate change is a major development challenge (Spiertz, 2009). The sustainability of cropping systems in the future will be intimately tied to how we enhance synergies and complementarity through integrating crop and livestock production and optimizing resource allocation including the efficient use of agricultural inputs such as fertilizer and water (Sinclair and Rufty, 2012).
In developing countries such as Ethiopia, livestock play a vital role in smallholders’ livelihoods by providing food, cash income, farm power, and other inputs to crop production. However, the productivity of livestock has remained very low due to various factors, among which feed shortages both in quantity and quality for year-round feeding are one of the major ones (Tessema and Alemayehu, 2010). In Ethiopia, crop residues (43%) are the most utilized feed type followed by natural pasture (35%), while improved forage production is very low (0.2%) (CSA, 2020). Feed shortages are aggravated by limited investment in the area of feed and forage development and the increasing encroachment of crop farming into grazing lands (Mengistu et al., 2017). Moreover, the rapid population growth in Ethiopia has led to a significant reduction in grazing lands due to the expansion of arable cropping land, urbanization, and land use changes, resulting in critical feed shortages (Feyissa et al., 2022). This implies that business-as-usual livestock feed sourcing and feeding can no longer be a viable option. There is an urgent need to look at forage production during dry periods through irrigation and to optimally use the available land, water, and capital resources to produce high-quality and quantity fodder for sustainable livestock production. Despite the enormous potential, small-scale irrigation systems for producing improved fodder are limited and rarely used (Baranchuluun et al., 2014).
To promote and establish effective irrigation management strategies, it is very important to quantify the crop response to irrigation (Daneshnia et al., 2015). Proper irrigation treatment is required in crop production to permit optimal productivity per volume of irrigation water applied (Daneshnia et al., 2015). One way of maximizing water use efficiency (WUE) during irrigation is deficit irrigation (Bekele and Tilahun, 2007). In areas where a shortage of irrigation water is a problem, deficit irrigation is considered a practical solution to overcome the problem (Keshavarz Afshar et al., 2012). In deficit irrigation, the crop is subjected to water stress for the entirety of the growing season or only for a particular growth stage (Afshar et al., 2014). Crops like maize, onion, wheat, tomato, and teff were studied for their response under deficit irrigation previously in the Ethiopian highlands (Asmamaw et al., 2021), while the study of forage crops under deficit irrigation is limited in developing countries.
In addition to the irrigation treatment, other factors that affect the feed quality and quantity of different forage species should be considered (Choudhary and Prabhu, 2016). Among the factors that affect crop yield and quality, nutrient management is the major one (Sinclair and Rufty, 2012; Choudhary and Prabhu, 2016). Gains in agricultural productivity have mostly been attributed to field management techniques that boosted the availability of nitrogen (Sinclair and Rufty, 2012). However, the use of chemical fertilizers in forages is constrained due to rising fertilizer prices and their scarcity during the peak growing season (Choudhary and Prabhu, 2016). Nitrogen (N) is a main yield-determining macronutrient (Spiertz, 2009; Hao et al., 2014). The price of nitrogen fertilizer is increasing rapidly. Therefore, it is necessary to reduce the application of nitrogen fertilizer and increase nitrogen use efficiency (NUE) to maintain profitability (Hao et al., 2014). Understanding the forage production response to fertilizer application rates, in combination with irrigation strategies, could help to manage nitrogen use efficiency.
As the Ethiopian highlands are one of the most densely populated areas with livestock in east Africa (Benin et al., 2003), and an increase in livestock-based products is required, there is a need to study the agronomic performance of forage varieties and their responses to nutrients and water management (Worqlul et al., 2022). Therefore, this study aimed to investigate the performance and responses of selected fodder species under different irrigation and fertilizer application rates. We explored yield, water use efficiency, livestock water productivity, and the net benefit of selected forages in the Ethiopian highlands. Understanding the agronomic performance of forage varieties and their responses to management practices is crucial for informing policies aimed at improving livestock productivity, enhancing food security, and promoting sustainable agricultural development in the country and corresponding region.
2 Materials and methods
2.1 Description of the study area
This experiment was conducted in Robit Bata Kebele, Bahir Dar Zuriya Wereda (or district), Amhara regional state, Ethiopia (Figure 1). Robit Bata is located in the Lake Tana basin, 20 km north of Bahir Dar city (the capital city of Amhara regional state) at an altitude of 1851 meters above sea level. The climate is sub-humid (Woina Dega), with a mean annual rainfall of 1,444 mm (based on 20 years of data). From June to September, the rainfall distribution is unimodal. The mean monthly air temperature ranges between 8.1°C and 30.3°C (Figure 2). The average monthly minimum temperature is 12.5°C, while the average monthly maximum temperature is 27.5°C. The mean monthly sunshine hour is 8 h while the mean monthly relative humidity and wind speed are 58% and 0.82 m s−1, respectively. Rural livelihoods are dominantly based on rain-fed mixed crop-livestock farming. Mixed-crop farming, principally rain-fed agriculture, and livestock husbandry are the mainstays of rural livelihoods. Maize (Zea mays), finger millet (Eleusine coracana), tef (Eragrostis tef), and barley (Hordeum vulgare) are the main crops cultivated during the rainy season, and small-scale irrigation is increasing, with 13% of croplands under vegetable cultivation irrigated during the dry season, from October to May (Fenta et al., 2022). Tomatoes, onions, potatoes, cabbage, peppers, and garlic are the most commonly irrigated crops (Yimam et al., 2020). Crop residues and naturally occurring grass are the most common livestock diets. However, those feed sources are often of poor quality and lack the necessary protein, energy, vitamins, and minerals.
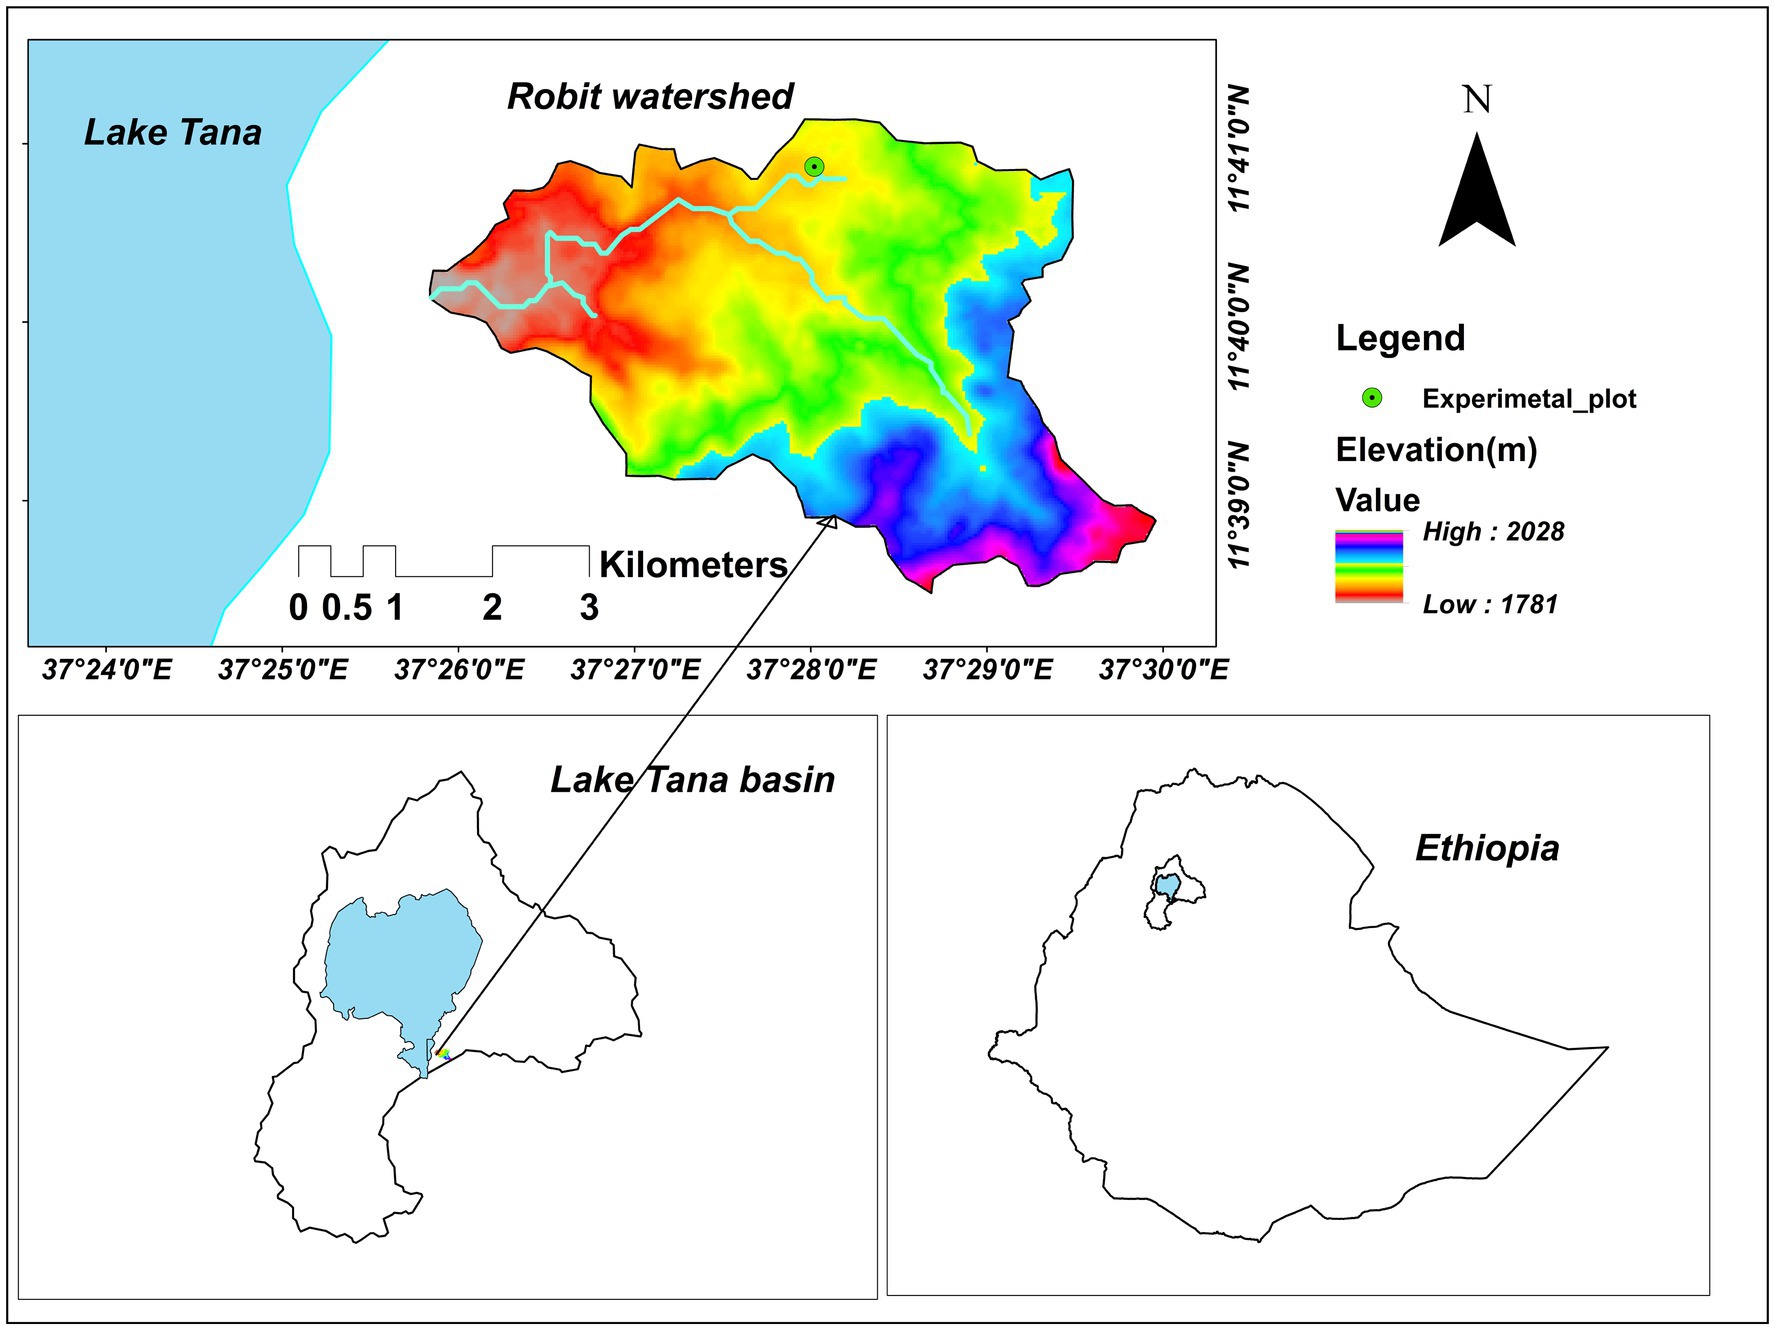
Figure 1. Location map of the experimental site in Robit watershed, Robit Kebele, Ethiopia.
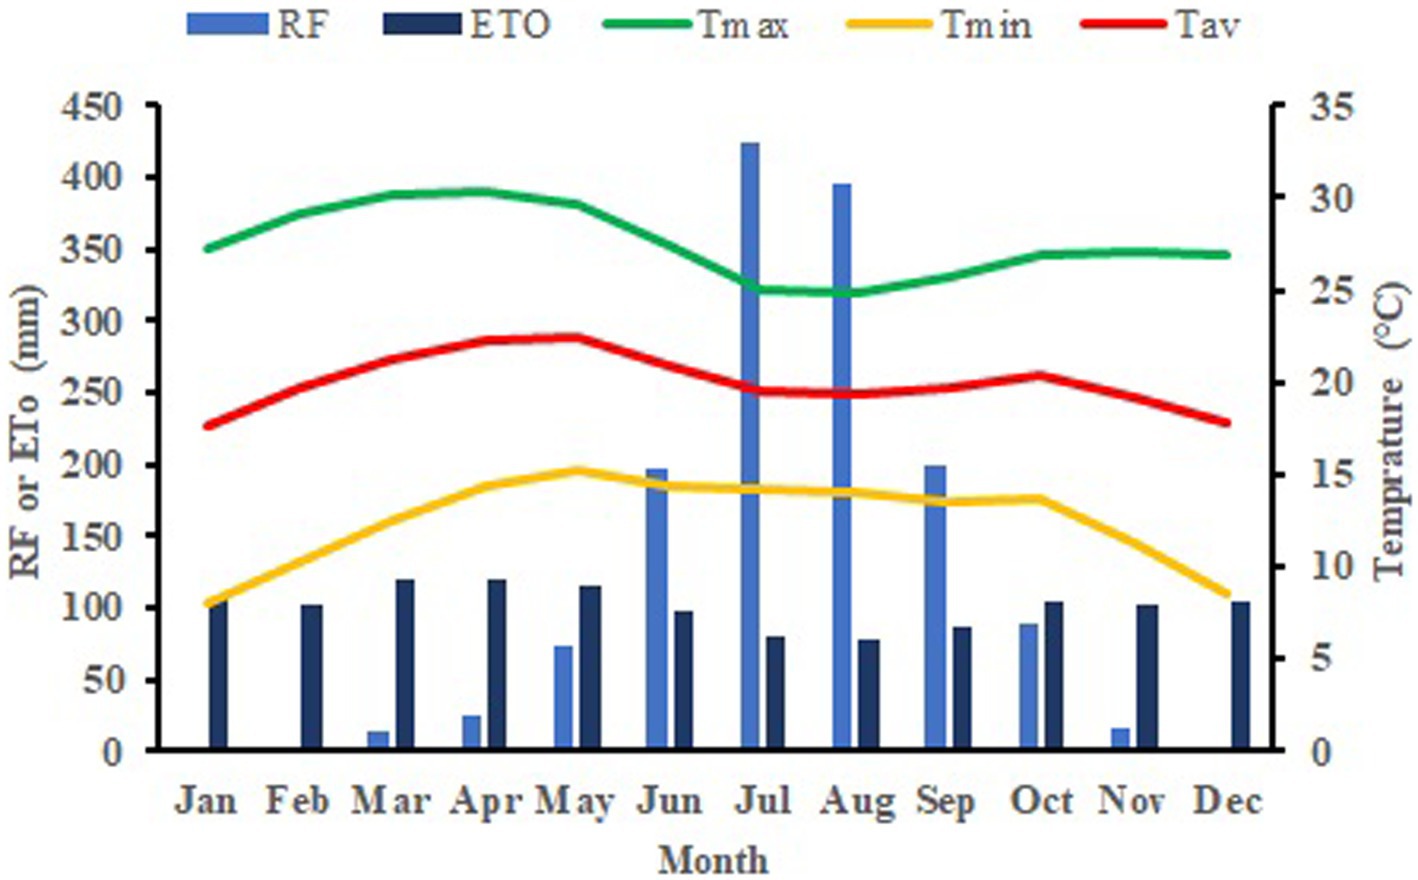
Figure 2. Long-term mean monthly rainfall, temperature, and reference evapotranspiration in the study area.
2.2 Experimental design and setup
The experiment was conducted in a randomized split-split plot design with irrigation scheduling as the main plot, fertilizer rate as the subplot, and forage genotype as sub-sub plots (Gomez and Gomez, 1984). The size of each sub-sub plot was 9m2 with three replicates for each treatment. There were 108 sub-sub plots for this experiment divided by three irrigation schedules, three fertilizer rates, four forage genotypes, and three replicates (Figure 3).
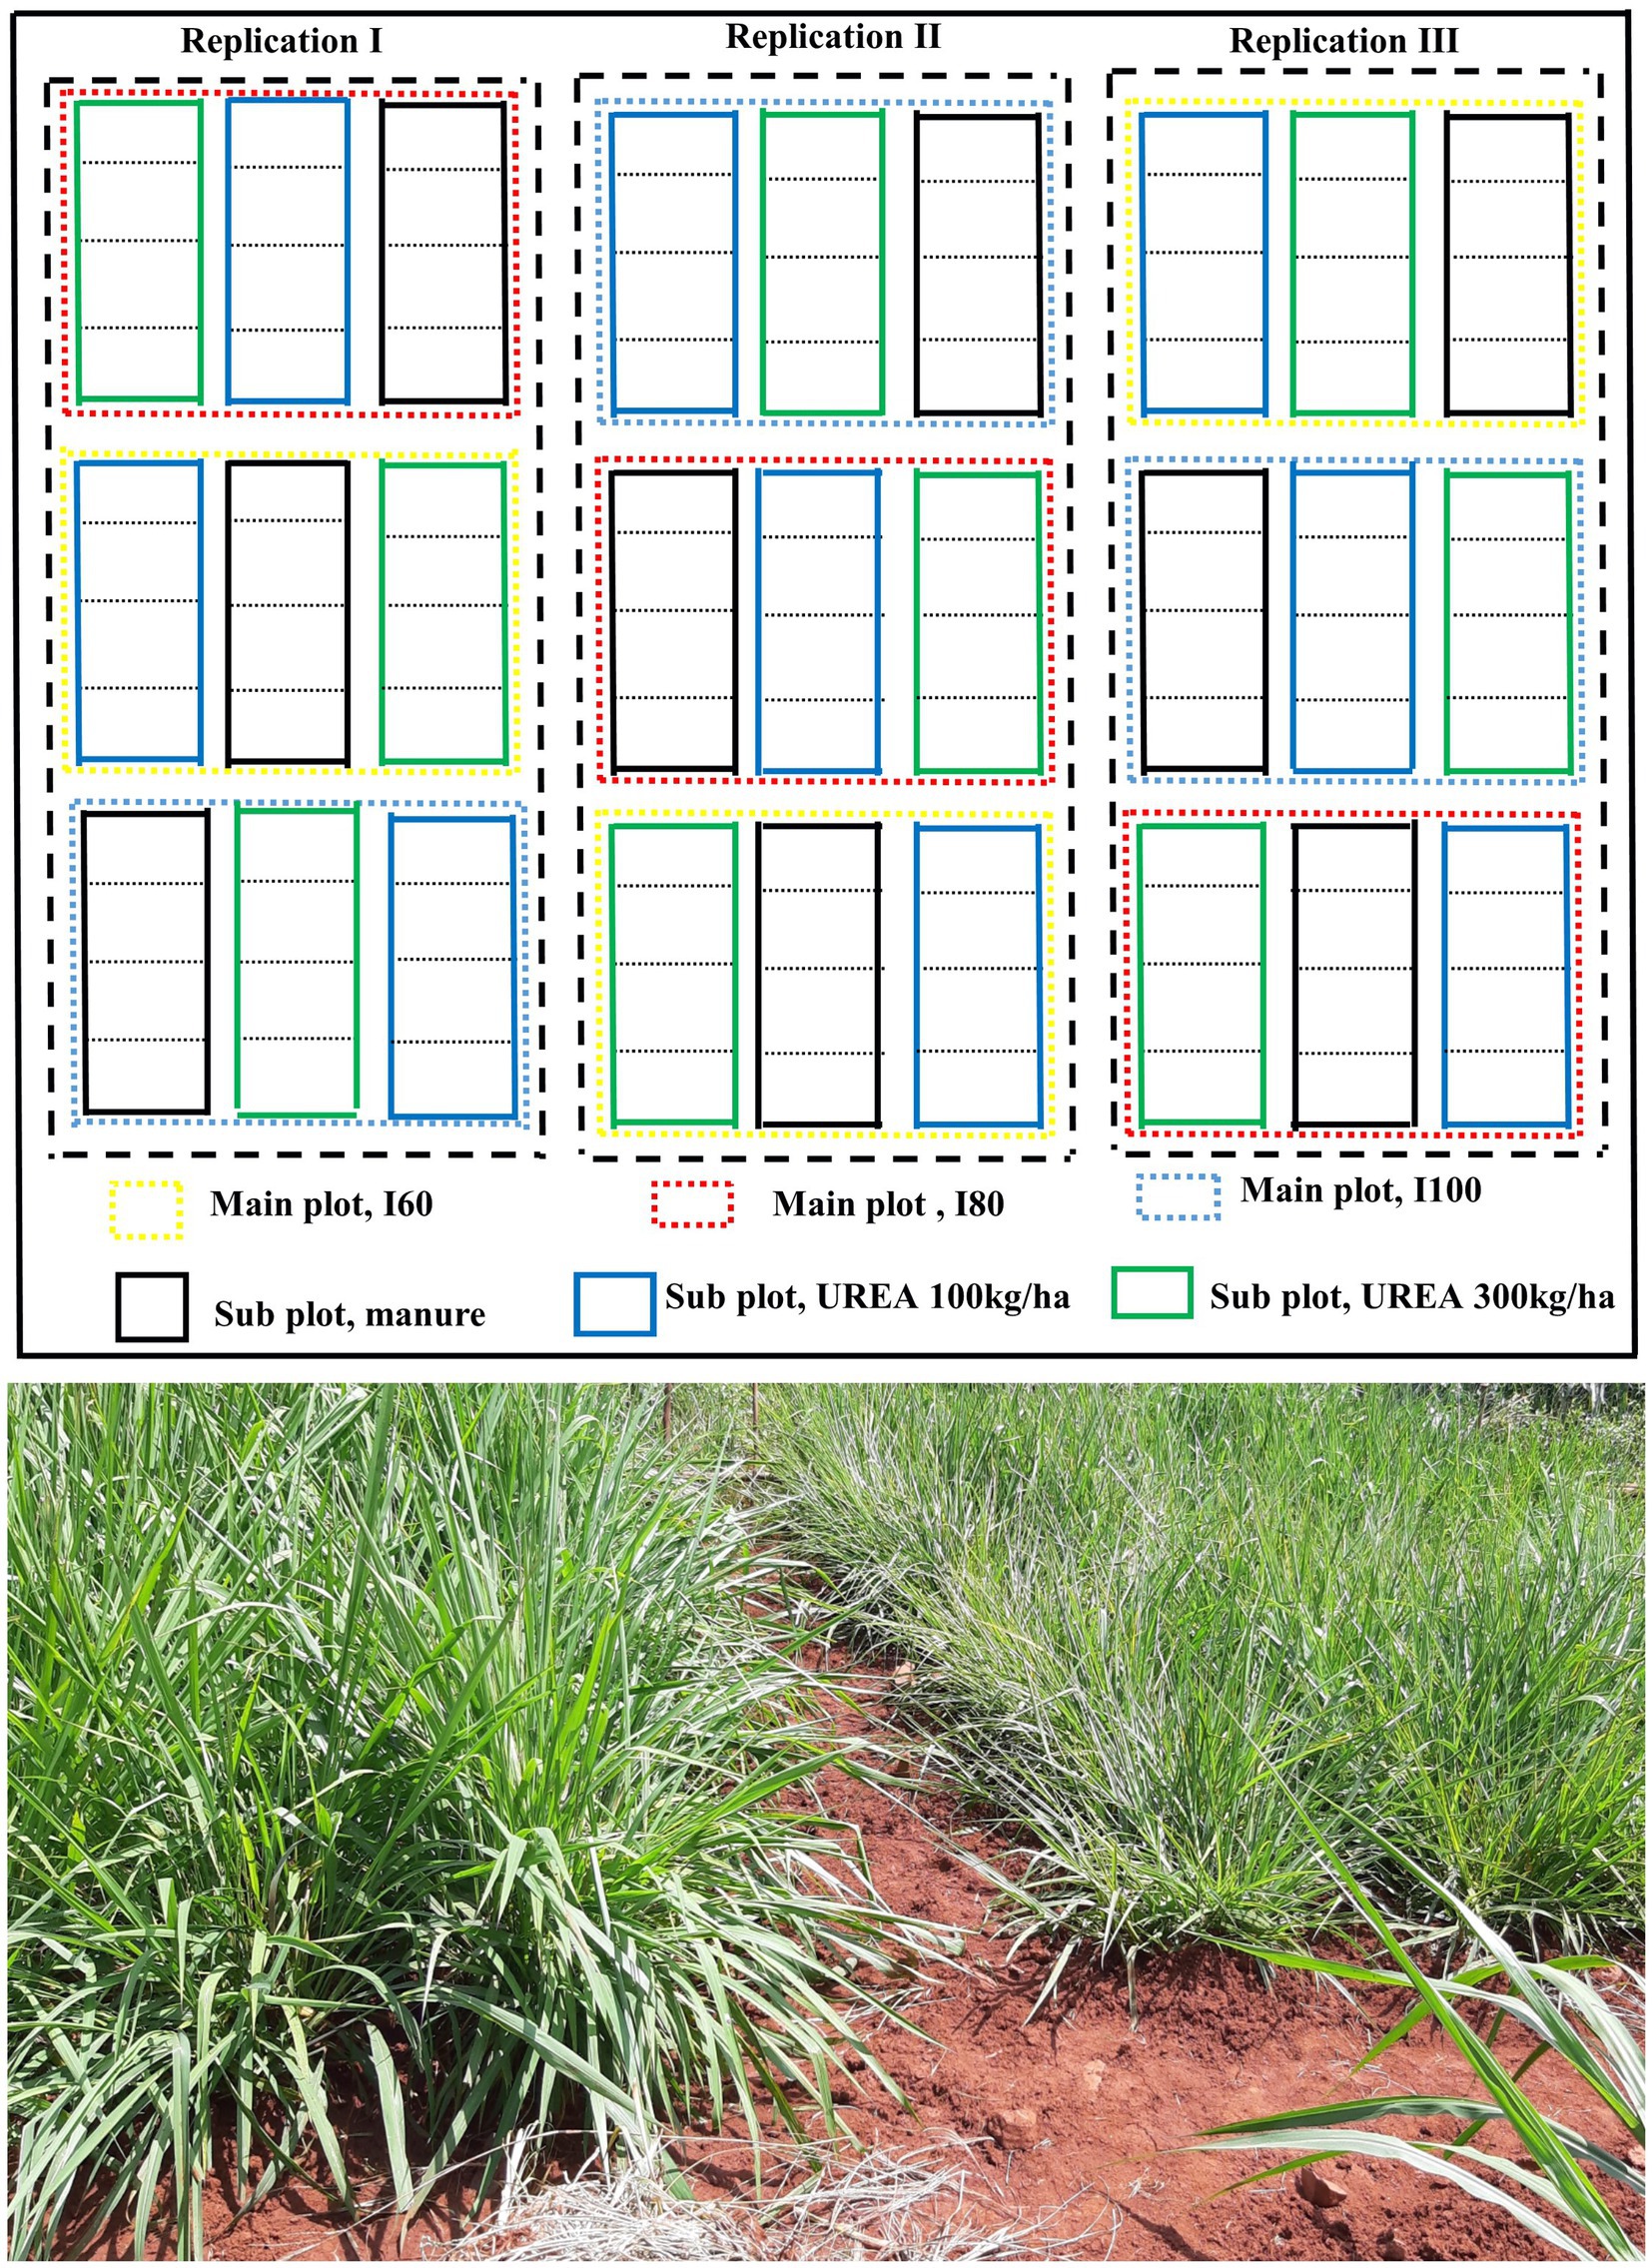
Figure 3. General overview of the experimental design (top) and picture of the forages (bottom, Napier grass (left) and Guinea grass (right)), the different forages (sub-sub plots) were randomly assigned in the fertilizer plot (subplots).
Four different forage genotypes (three Napier grass accessions and one Guinea grass accession) sourced from the International Livestock Research Institute (ILRI) forage genebank, Addis Ababa, Ethiopia (Table 1) were used in the experiment. Napier grass was selected as it is the most preferred forage for small-scale irrigation due to its endurance to drought, adaptability to a variety of soil conditions, and high photosynthetic and water-use efficiency (Mwendia et al., 2006). Guinea grass was selected due to its biomass yield, usage for long-term pastures and soil conservation, high production rate, fodder quality, suitability for clay and sandy soils and drought resistance (Das et al., 2016). The forages were established during the rainy season in July 2020. The irrigation treatments were started after harvesting at the end of the rainy season.
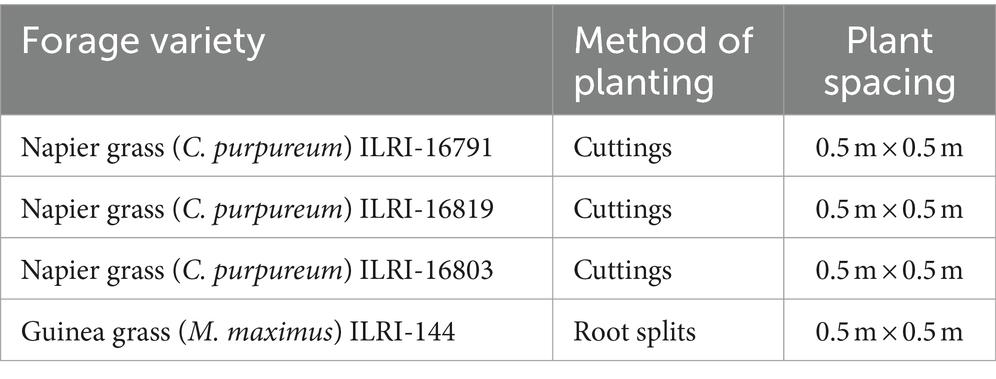
Table 1. Forage accessions, spacing, and method of planting.
The forages were grown using three different fertilizer application rates. The fertilizer treatments were organic manure at a rate of 30 t ha−1, and UREA at rates of 100 kg ha−1 and 300 kg ha−1. The manure rate of 30 t ha−1 was according to farmers’ practices in the area. UREA/Nitrogen (46.6% N-NH4+) at a rate of 100 kg ha−1 was based on a national recommendation (Sime and Aune, 2014) and to see the effect of an increased fertilizer rate on the productivity of the forages, a higher fertilizer rate of 300 kg ha−1 was applied as a third treatment (Chakwizira et al., 2015). The fertilizers were applied in splits, i.e., 50% of the fertilizer was applied for the first harvest and the remaining 50% for the second harvest (Rostamza et al., 2011). For the organic manure treatment, two-thirds of the manure was applied for the first harvest while the remaining one-third was applied for the second harvest, according to farmers’ practices. In this experimental study, the manure applied was sourced from a local youth association that specializes in preparing and selling manure in the area.
Three different irrigation scheduling’s via 60, 80, and 100% of total available soil water (IR60, IR80, and IR100, respectively) were applied (Ahmadi-Mirabad et al., 2014; Mwinuka et al., 2021). The amount of irrigation water applied for the full irrigation treatment for each forage variety and fertilizer type and rate was calculated as shown in Eq. 1 (Rostamza et al., 2011; Dadrasan et al., 2015).
In the study, the source of irrigation water was hand-dug shallow water wells. These wells serve as the principal source of water. Hand-dug shallow water wells are commonly utilized in the area where this experiment is conducted (Tilahun et al., 2020). However, it is important to acknowledge potential limitations associated with this water source, such as vulnerability to fluctuations in groundwater levels, seasonal variability, and susceptibility to contamination. Despite these challenges, hand-dug shallow water wells remain integral to irrigation practices in the study area, highlighting the importance of understanding and managing water resources effectively for sustainable agricultural production.
2.3 Data collection and analysis
2.3.1 Soil data
Before the start of the trial, soil samples were collected at depths of 0–30 cm, 30–60 cm, and 60–100 cm. The soil samples were analyzed at Lihiket Design and Supervision Corporation Laboratory for different soil parameters such as field capacity (FC), wilting point (PWP), soil organic carbon (SOC), total nitrogen (TN), exchangeable potassium (Ex-K), available phosphorus (Av-P), pH, soil texture (clay, silt, sand), electrical conductivity (Ec), and cation exchange capacity (CEC). Sulfur (SO4-S) and nitrate-nitrogen (NO3-N) were analyzed at the Horticoop Ethiopia (Horticulture) PLC, soil and water analysis laboratory following standard procedures. The soil bulk density (Bd) was determined at Bahir Dar Institute of Technology soil laboratory from undisturbed soil samples collected at depths of 10, 20, 30, 40, 60, and 100 cm. The details of the methods and procedures for the soil analysis can be found in Fenta et al. (2022). The pre-treatment soil sample results are given in Table 2.

Table 2. The physical and chemical properties of soils at the experimental plot before any treatments were conducted (pre-treatment).
2.3.2 Soil water content
Soil moisture measurements up to a depth of 1 m (at different depths) were taken using a soil moisture profiler (PR2/6, Delta T device). One access tube was installed at the center of each of the experimental sub-sub plots. The soil moisture measurements were carried out at six soil depths of 10, 20, 30, 40, 60, and 100 cm, in all replications before the start of the experiment, every week from December 2020 to June 2021 during the first year and from November 2021 to June 2022 in the second year, and at harvest. These neutron probes were calibrated on ten different plots within the experimental area, covering a range of water contents from field capacity to wilting point. Linear regression was used to determine the calibration equations between neutron probe count and volumetric soil water content, with separate equations being used for 10, 20 and 30 cm depths and a single equation used for 40–100 cm soil (Neal et al., 2011).
2.3.3 Yield and yield components data
The plant height was measured from ten randomly selected plants in each sub-sub plot. The total number of tillers was counted for ten bunches from each sub-sub plot. The leaf area was measured using a leaf area meter (CI-203 laser area meter, CID Bioscience, United States). Each sub-sub plot was harvested separately, and the total fresh biomass was weighed using a sensitive balance. The forages were harvested twice during each irrigation season. After the fresh herbage from each sub-sub plot was weighed, a 500–1,000 g subsample was placed in a paper bag, weighed on site, and taken to the laboratory. In the laboratory, the samples were dried at 60 C0 for 48 h in a forced air oven, and then reweighed to determine the percent (%) dry matter (DM) and DM yield.
2.3.4 Forage quality analysis
Forage sub-samples from each sub-sub plot were analyzed for digestibility in the animal nutrition laboratory of the International Livestock Research Institute in Addis Ababa. The samples were analyzed by near-infrared reflectance spectroscopy (NIRS) using a FOSS Forage Analyzer 5,000 with the software package WinISI II (version 1.5, Intra Soft International, LLC) and specifically developed calibration equations.1
2.3.5 Water use efficiency calculation
Water use efficiency (WUE) can be based on either transpiration or evapotranspiration and grain yield or total dry matter yield. In this experiment, the WUE was calculated as the total above-ground dry matter yield per unit of total evapotranspiration (Rostamza et al., 2011) as shown in Eq. 2.
The evapotranspiration (ET) was calculated using the water balance equation as shown in Eq. 3.
2.3.6 Livestock water productivity
Livestock water productivity refers to the proportion of net beneficial products and services related to livestock production in relation to the amount of water consumed during the production process (Peden et al., 2007). To enhance livestock water productivity, it is important to evaluate the feed demands of livestock and opt for feeds that exhibit greater water productivity as compared to other agricultural uses of water (Peden et al., 2007). The livestock water productivity was determined based on Haileslassie et al. (2009a) as shown in Eq. 5.
The water requirement for drinking was not considered, as it accounts for less than 2% of the total water used (Peden et al., 2007). The water used by evapotranspiration to produce the feed was calculated as explained in Section 2.3.5.
In this study, we considered only milk as a livestock output. The milk price was based on the current market price obtained from Genet Lerobit milk and milk products dairy cooperative in the area. The cost of feed production was determined as shown in Section 2.3.7.
Two types of cows, local and crossbred, were considered for the calculation of livestock water productivity. The local cow was assumed to weigh 250 kg and produce an average of 1.7 liters of milk per day for a 200-day lactation period (Descheemaeker et al., 2011). The crossbred cow was assumed to weigh 400 kg and produce an average of 8 liters of milk per day during a nine-month lactation period (Ahmed et al., 2004). The feed intake and requirement for each type of cow were determined considering the energy requirement for maintenance, lactation and weight gain based on the digestibility of the forages for each treatment. It was assumed that the fodder was fed only to the lactating cows. It was also assumed that half the lactating period coincides with the irrigation period, as the irrigation period accounts for nearly 6 months of the year.
2.3.7 Economic analysis
The net benefit from each irrigation, fertilizer, and forage treatment was determined by subtracting the total cost incurred for each treatment from the total revenue. The cost included land preparation/plowing, planting, weeding, fertilizer and manure application, irrigation, harvesting and the cost of inorganic fertilizer/manure. For instance, the average cost of urea fertilizer was determined to be 0.68 USD per kilogram, while organic manure costs 0.011 USD per kilogram. Hired labor costs were factored in, covering activities such as plowing, planting, fertilizing, weeding, irrigation, harvesting, and general handling of forages for each treatment. The total labor hours were converted into man-days, considering an 8 h workday, which corresponds to a rate of 3.3 USD per day (reflecting prevailing labor rates in the study area). The total revenue was determined by the benefits that can be gained through the sale of green fodder. As green forage marketing is at its inception in the area, the price of fodder was conservatively assumed to be equal to pasture hay which was estimated to be 4 ETB/kg (Abera et al., 2022).
2.3.8 Statistical analysis
The data were checked for normality using Q-Q plot and Shapiro–Wilk tests before conducting the analysis. In cases of non-normality, data were transformed using Log (data) and analysis was performed for the transformed data. The interaction of the forage type, fertilizer, irrigation, and year was conducted first. After checking for the interaction effects, analysis of variance (p < 0.05) with the ANOVA packages of the SPSS® statistics software 26.0 (IBM Corporation, United States) was employed. Duncan’s Multiple Range Test was used for mean separation when the analysis of variance showed statistically significant differences (p < 0.05) between the parameters.
3 Results
The interaction effects of the different treatments and their significance levels are shown in Supplementary Table S1. When there is a significant interaction effect, the interaction effect is presented. When no significant interaction effects are found, only the main effects are presented.
3.1 Yield and yield components
3.1.1 Impact of irrigation treatments on forage phenotypes and yield
Irrigation treatment had a significant (p = 0.007) effect on the number of tillers (Supplementary Figure S1). In addition, irrigation treatment had a significant effect on leaf area index (p < 0.001). Among the three irrigations, the highest LAI was observed for the full irrigation treatment while the lowest was for the deficit irrigation IR60 (Table 3). The effect of irrigation on dry matter yield was statistically significant at a p value of 0.003 (Table 3; Figure 4A). The full irrigation (IR100) had a higher dry matter yield than the deficit irrigation. There was no significant difference in DMY between I100 and I80 (p = 0.35) and I80 and I60 (p = 0.099).
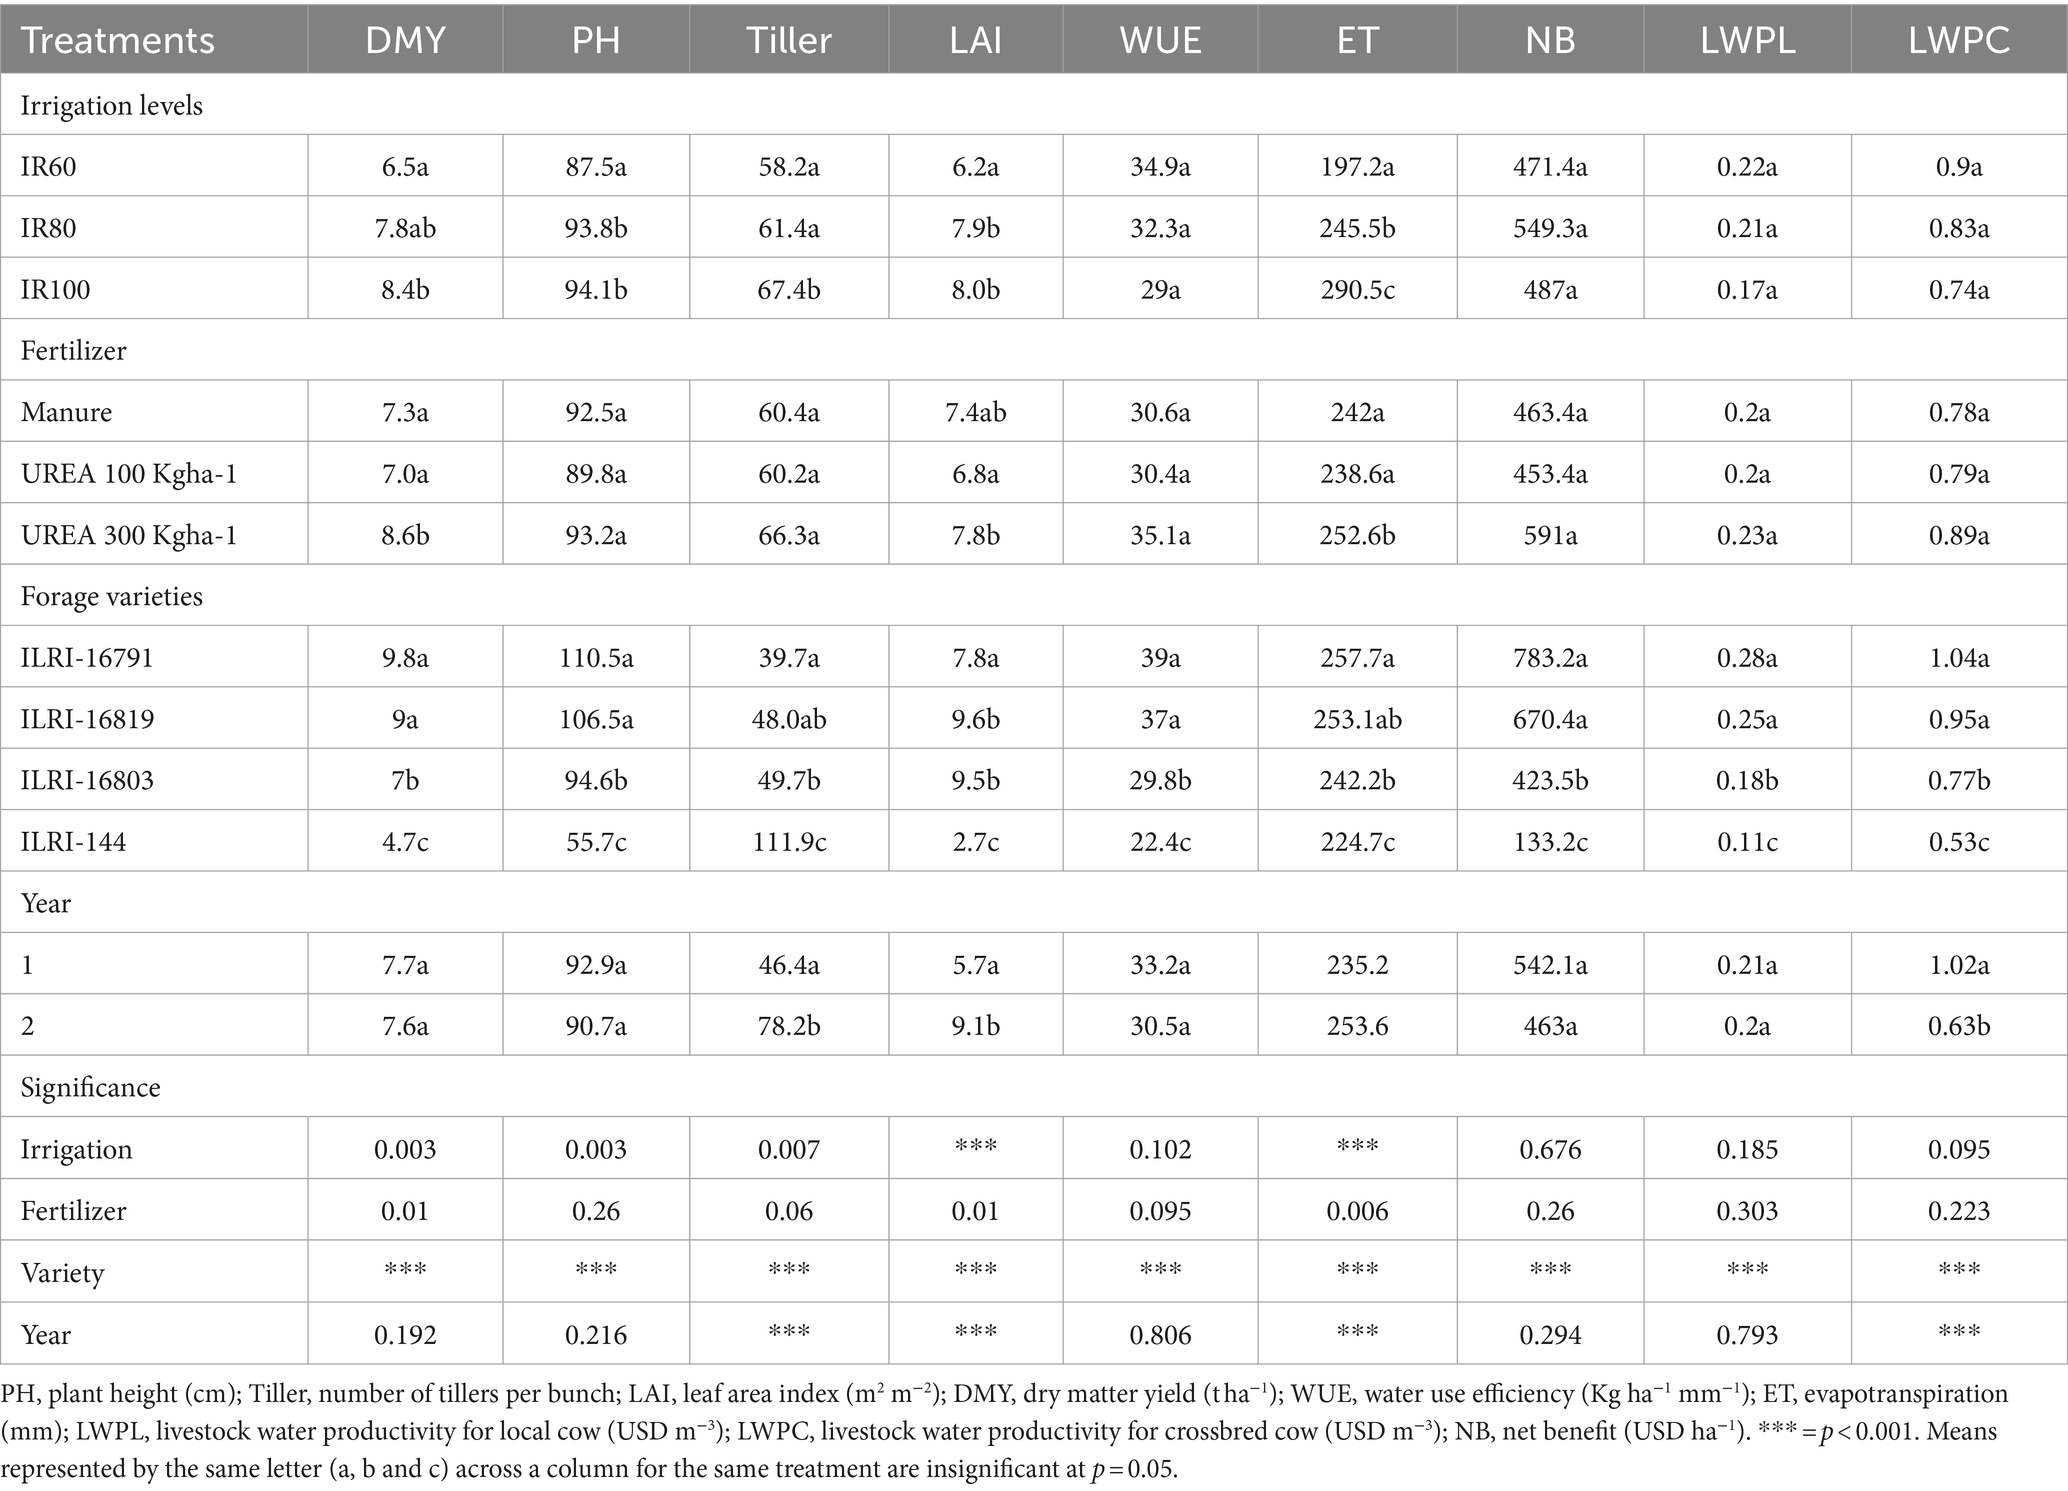
Table 3. Main effect of irrigation, fertilizer, forage variety and year on the response variables.
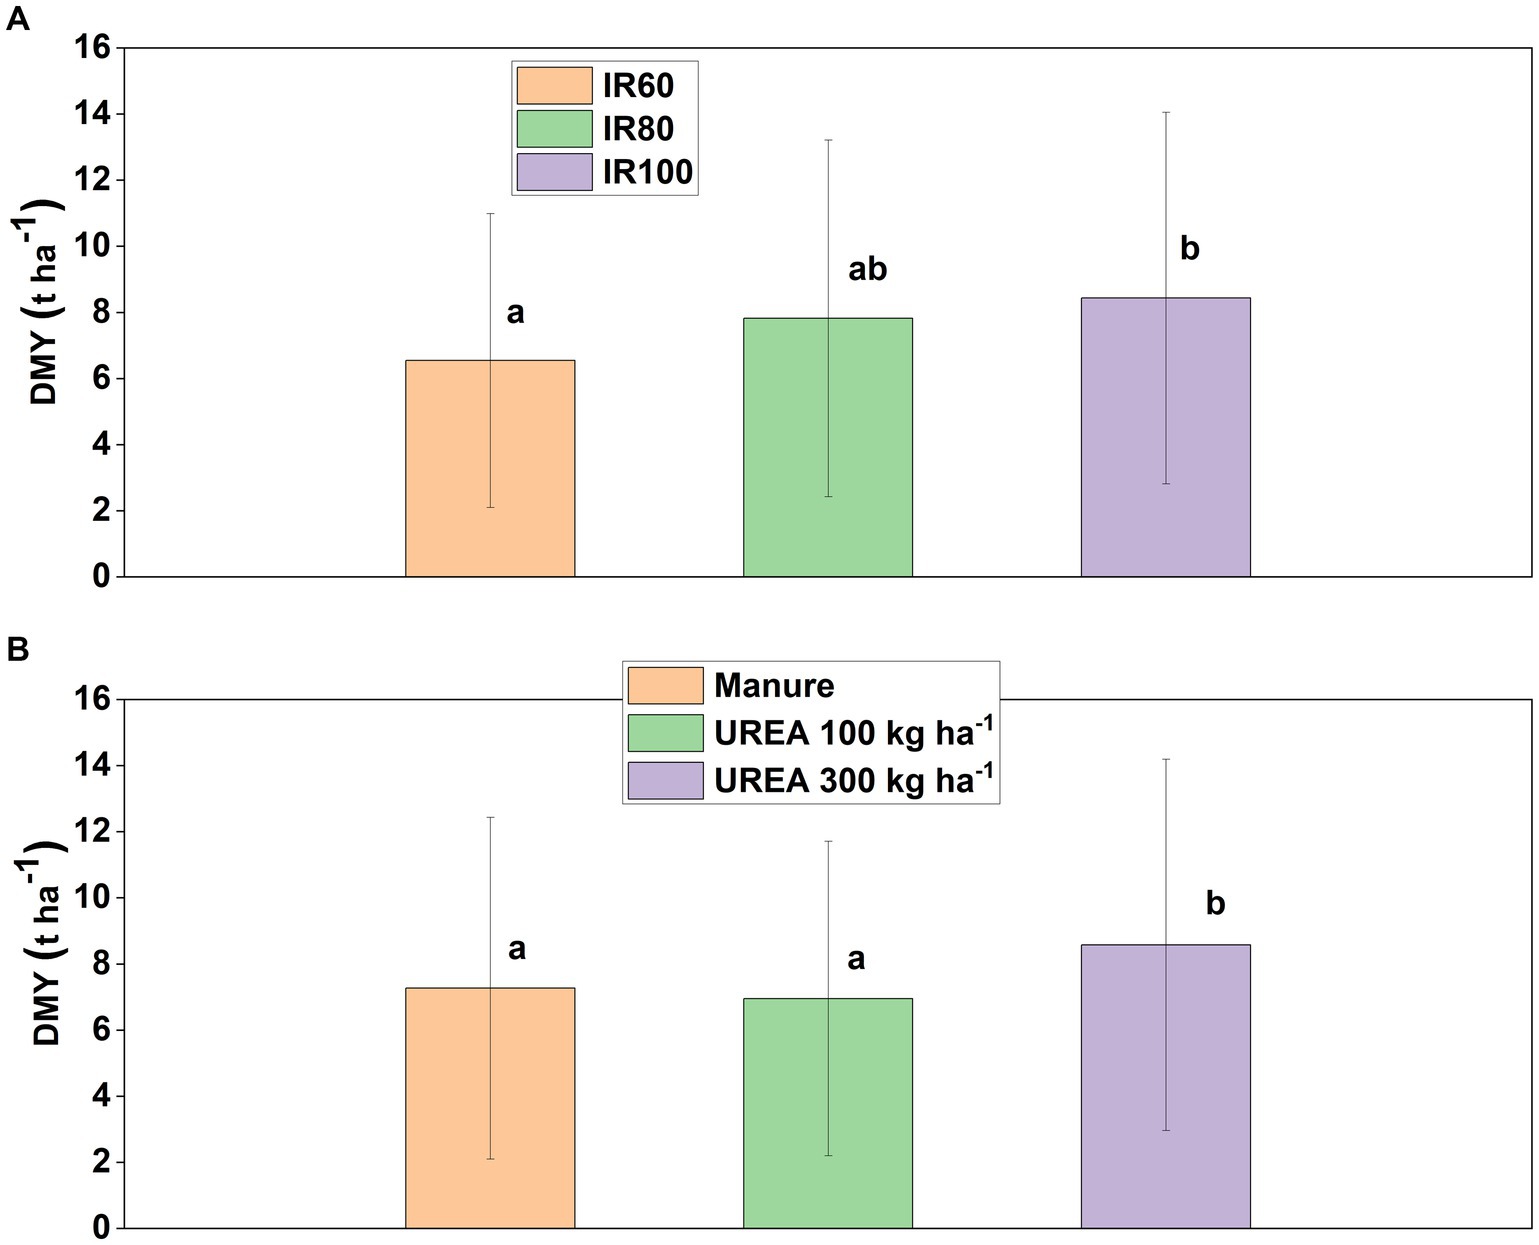
Figure 4. Effect of forage variety on (A) plant height (B) tiller number (C) LAI (D) DMY. Letters a, b and c are indicating statistical significan at p = 0.05. Similar letters are indicating insignificance and different letters are significance in difference of measured responce variables becasue of the factors.
3.1.2 Impact of fertilizer treatments on forage phenotypes and yield
The effect of fertilizer on the number of tillers was not significant (p = 0.06). However, the effect of fertilizer on leaf area index was significant (p = 0.01). The highest LAI (7.8 m2 m−2) was observed for UREA 300 Kgha−1 while the lowest (6.8 m2 m−2) was for UREA 100 kgha−1. Table 3; Figure 4B shows that fertilizer type and rate have a significant effect on dry matter yield (p = 0.01). The highest dry matter yield (8.6 t ha−1) was obtained for UREA 300 Kgha−1 while the lowest (7 t ha−1) was for UREA 100 kgha−1.
3.1.3 Impact of irrigation and fertilizer interactions on forage phenotypes and yield
There was a significant (p = 0.003) interaction effect of irrigation and fertilizer on plant height (Supplementary Table S1). For the inorganic fertilizer (UREA) treatments, both at the rate of 100 kg ha−1 and 300 kg ha−1, the highest plant height was at the deficit irrigation level of IR80 while for the organic manure, the highest plant height was observed for the full irrigation treatment IR100 (Supplementary Table S2). However, the interaction effect of irrigation and fertilizer on tiller number (p = 0.257), leaf area index (p = 0.486), and dry matter yield (p = 0.939) was not significant.
3.1.4 Effect of forage variety on forage phenotypes and yield
The effect of forage variety on plant height was significant (p < 0.001). The tallest and shortest plant heights were for ILRI-16791 and ILRI-144, respectively (Table 3; Figure 5A). In addition, forage variety (p < 0.001) had a statistically significant effect on number of tillers. ILRI-144 had the highest number of tillers per bunch while ILRI-16791 had the lowest tiller number (Figure 5B).
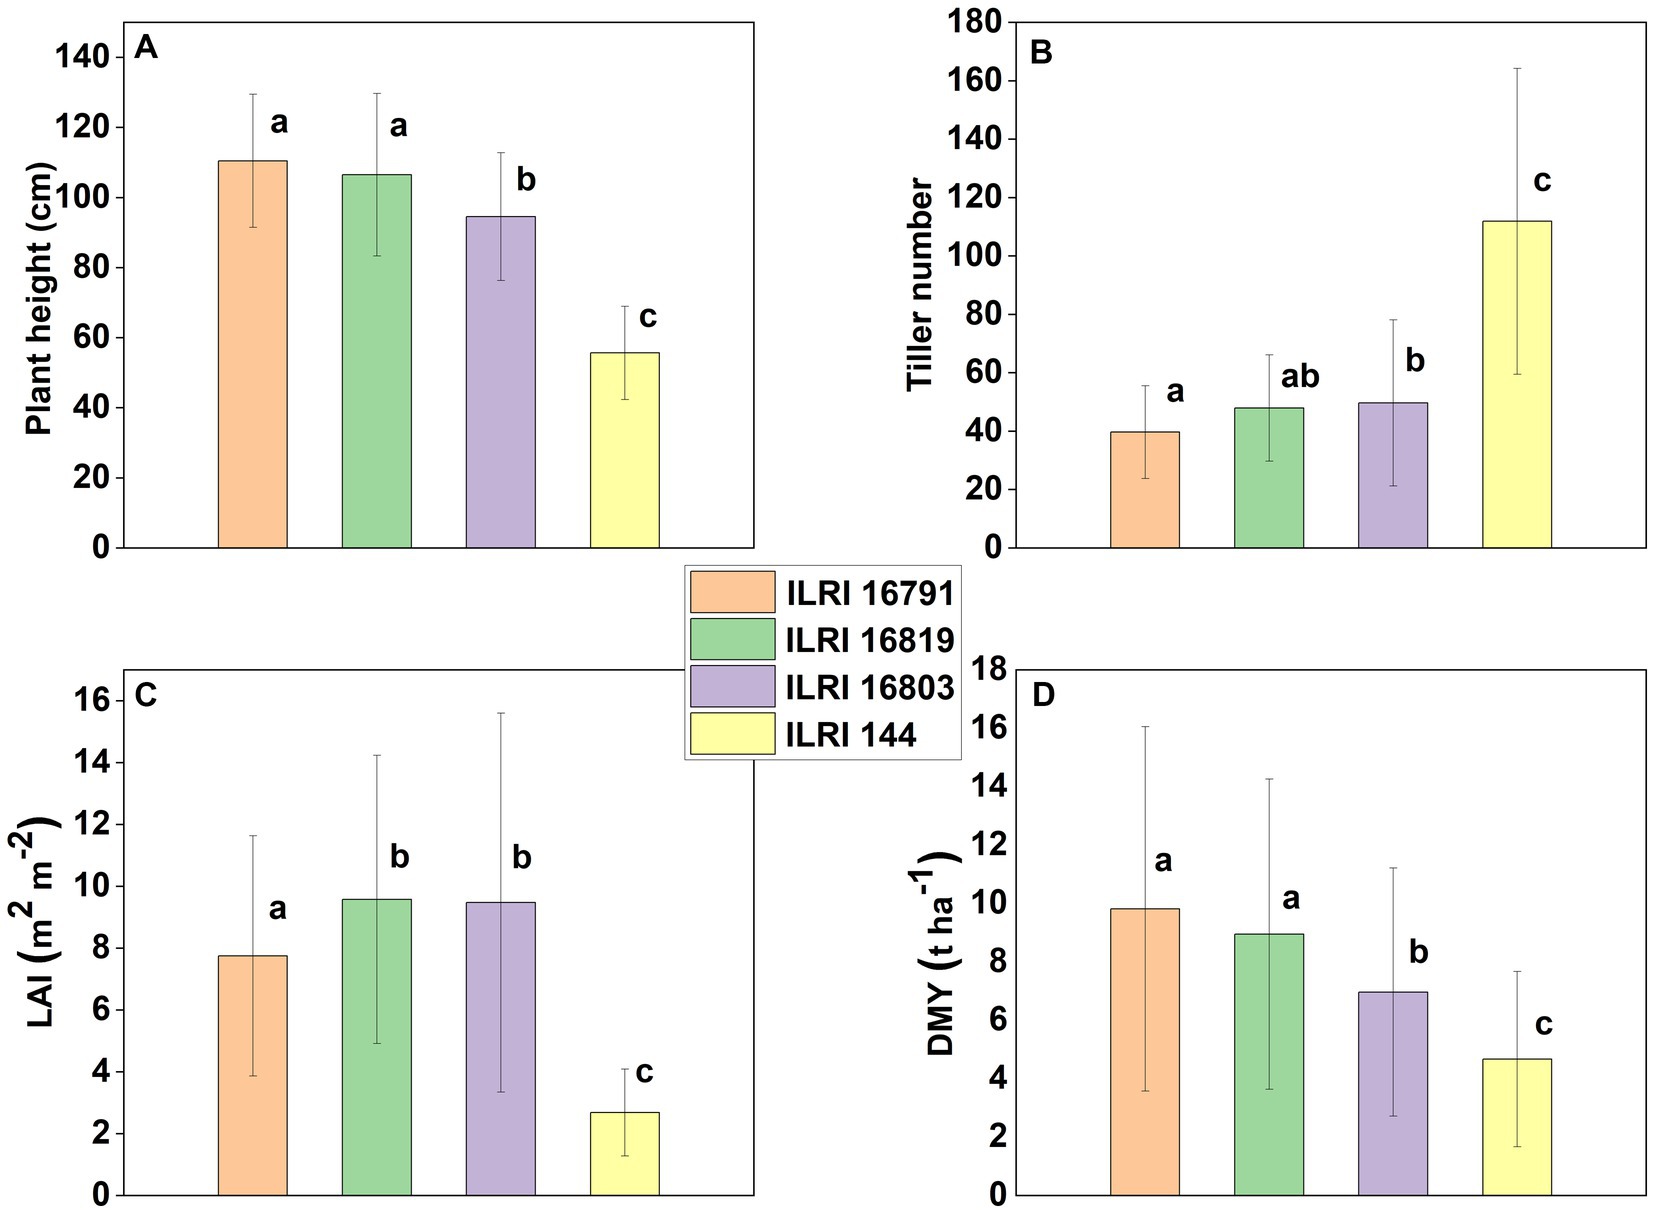
Figure 5. The effect of irrigation on DMY (A) and the effect of fertilizer on DMY (B). Letters a, b and c indicate statistical significance at p = 0.05. Similar letters indicate insignificance and different letters are significant in difference of measured response variables because of the factors.
The effect of forage variety on leaf area index (LAI) was significant (Table 3). Among the four forages, the highest LAI of 9.6 was observed for ILRI-16819 while the lowest (2.7) was observed for ILRI-144 (Table 3; Figure 5C). In addition, forage type had a significant effect on dry matter yield (p < 0.001) as shown in Table 3, the Napier grass accessions ILRI-16791 and ILRI 16819 had a significantly higher DMY than ILRI-16803 and ILRI-144. And, there was a significant difference (p < 0.001) in DMY between ILRI-16803 and ILRI-144. However, there was no significant difference (p = 0.82) in DMY between the top two Napier grass accessions (Figure 5D).
3.2 Effect of forage type, fertilizer type and rate on water requirement
Forage type has a significant (p < 0.001) effect on the amount of irrigation water requirement (application) at full irrigation treatments. ILRI-16791 had the highest irrigation water application while ILRI-144 had the lowest water application. The water application was equivalent to the amount of water required based on the soil moisture deficit in this study. During the whole study period, averaged over fertilizer, year and harvest, the highest irrigation water amount applied (including effective rainfall) was for ILRI-16791 (315 mm), followed by ILRI-16819 (307 mm) and ILRI-16803 (292 mm) while the lowest irrigation water applied was for ILRI-144 (270 mm).
The effect of fertilizer type and rate on the amount of irrigation water required was not significant (p = 0.052). Those plots treated with UREA at a rate of 300kgha−1 had slightly higher irrigation water applications than the other treatments. Averaged over forages, year and harvest, the total amount of water applied for each harvest (including effective rainfall) for organic manure, and UREA at a rate of 100 kgha−1and 300 kgha−1 were 294 mm, 288 mm, and 306 mm, respectively, for the whole study period. As the application rate of fertilizer increased, the requirement for irrigation water also increased.
3.3 Impact of forage types, irrigation and fertilizer treatment on water use efficiency
There was a significant difference in evapotranspiration (p < 0.001) among the irrigation treatments. The highest ET was observed for the full irrigation treatment while the lowest was observed for the deficit irrigation treatment (IR60) (Supplementary Figure S2A). The average ET for the three irrigation treatments was 197.2 mm for IR60, 245.5 mm for IR80 and 290.5 mm for IR100.
There was a significant interaction effect of forage and fertilizer (p = 0.007) on ET. For all forage types, the highest ET observed was for UREA at a rate of 300 kg ha−1, while the lowest ET was observed for manure in ILRI-16791 and ILRI-144. For ILRI-16819 and ILRI-16803, the lowest ET was observed for UREA at a rate of 100 Kg ha−1 (Table 4). These computed ET were used to calculate WUE and LWP which is described in the next section.
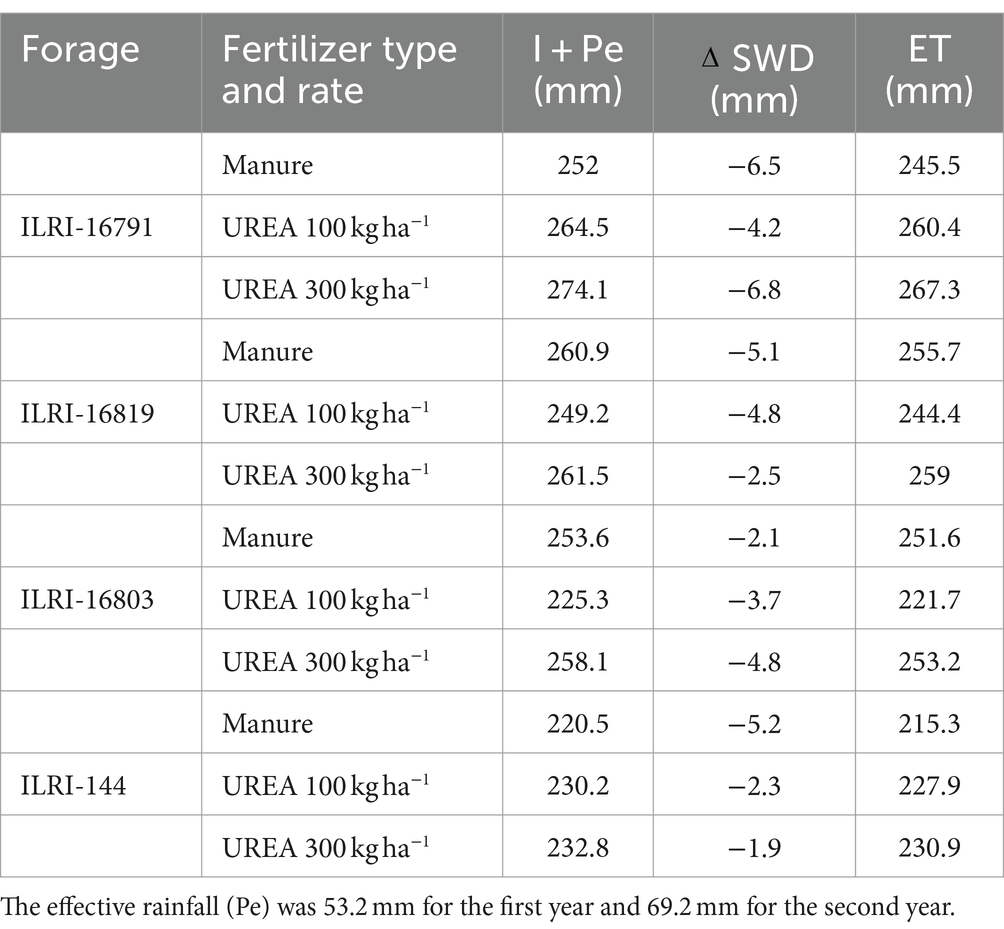
Table 4. Components of the water balance equation by forage type and fertilizer.
It was only forage variety and accession that had a significant (p < 0.001) effect on water use efficiency (Table 3). Among the four forages tested, ILRI-16791 had the highest water use efficiency (39 kg ha−1 mm−1) followed by ILRI-16819 (37 kg ha−1 mm−1), ILRI-16803 (29.8 kg ha−1 mm−1), and ILRI-144 (22.4 kg ha−1 mm−1) (Figure 6A).
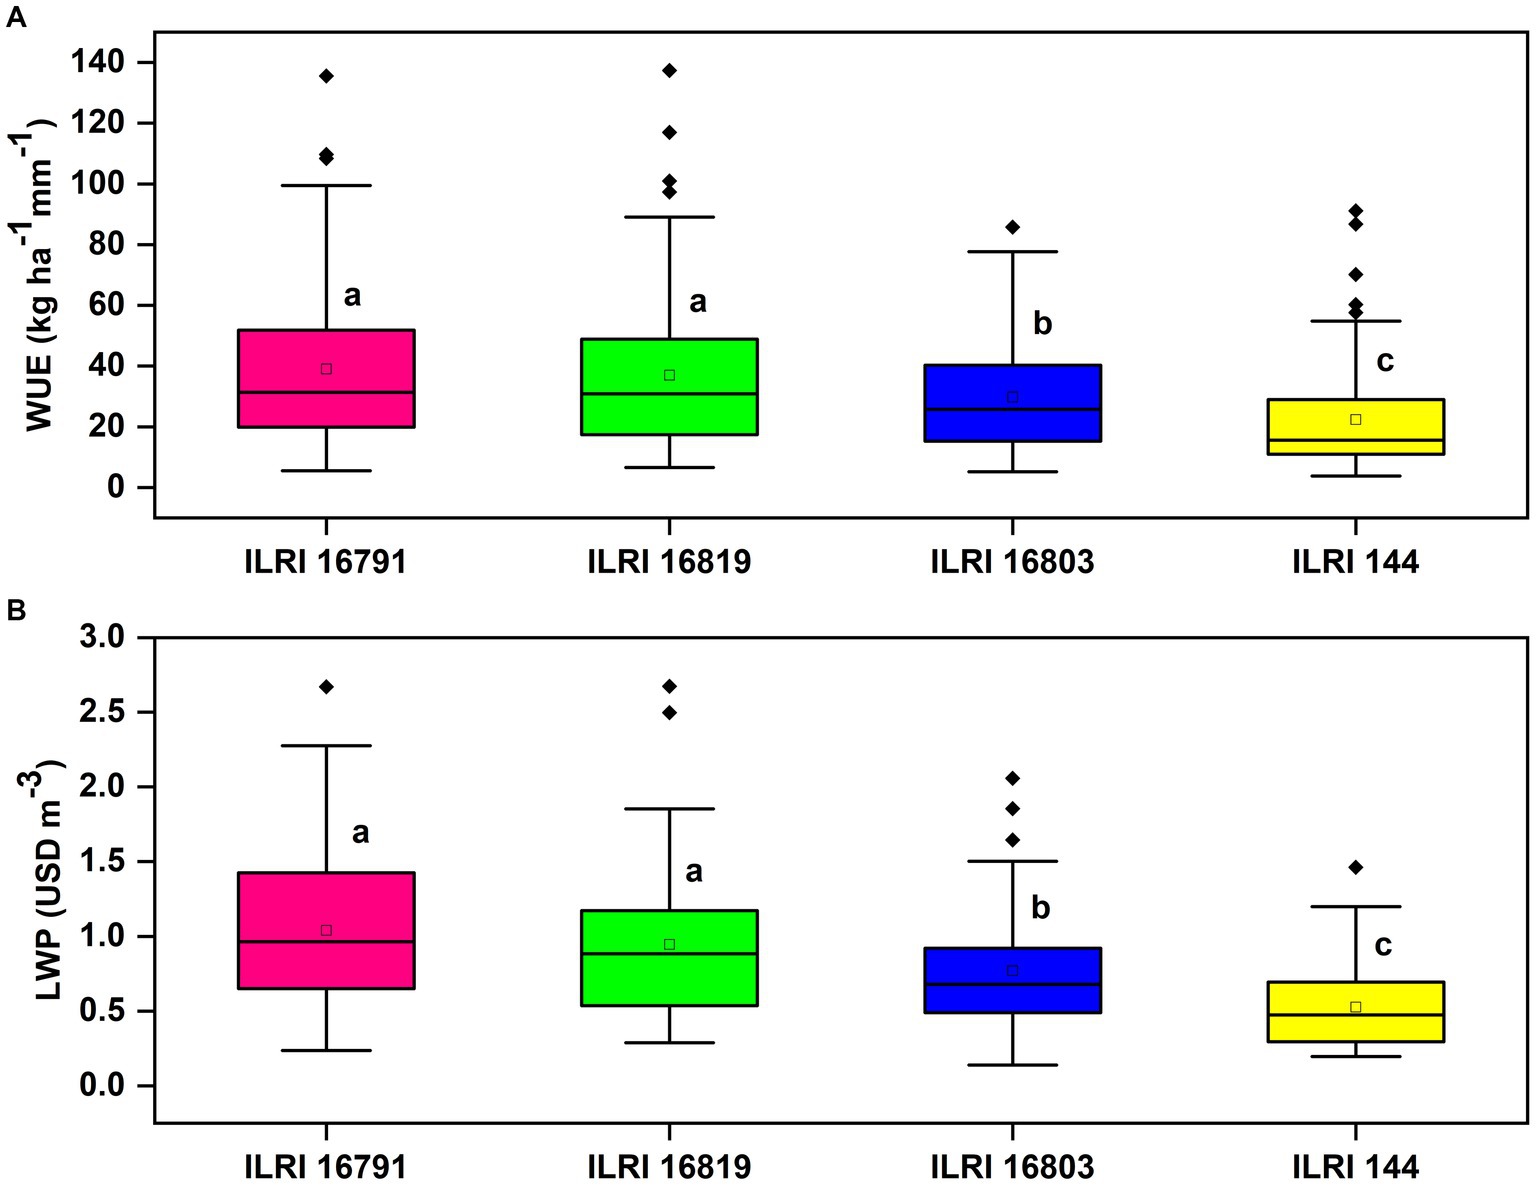
Figure 6. Effect of forage variety on WUE (A) and LWP (B). Letters a, b and c are indicating statistical significan at p = 0.05. Similar letters are indicating insignificance and different letters are significance in difference of measured responce variables becasue of the factors.
Among the three irrigation treatments (Supplementary Figure S3A), the deficit irrigation (IR60) has the highest water use efficiency as expected while IR100 has the lowest water use efficiency.
Applying UREA at a rate of 300 kgha−1 improved the WUE by 13.3 and 12.6% compared to UREA at a rate of 100 kgha−1 and organic manure respectively, but the differences were non-signicant (p = 0.095) (Table 3). Only 0.8% difference in WUE of manure and UREA at a rate of 100 kgha−1 was observed (Supplementary Figure S3B).
3.4 Livestock water productivity
The effect of forage type on LWP was statistically significant (p < 0.001) (Figure 6B) while the effect of irrigation and fertilizer treatments on livestock water productivity was not statistically significant (p > 0.05) for both local and crossbred cows (Table 3). ILRI-16791 had the highest LWP (0.28, 1.04 USD m−3) followed by ILRI-16819 (0.25, 0.95 USD m−3), ILRI-16803 (0.18, 0.77 USD m−3), and ILRI-144 (0.11, 0.53 USD m−3) for local and crossbred cows, respectively.
Among the three irrigation treatments, the highest LWP was at the deficit irrigation IR60 while the lowest LWP was at the full irrigation treatment IR100 (Supplementary Figures S4A,B). The highest LWP value was observed for UREA at a rate of 300 kg ha−1 (Supplementary Figures S4C,D). There was a significant difference (p < 0.001) in LWP between local and crossbred cow breeds (Supplementary Figure S4F).
3.5 Impact of forage types, irrigation and fertilizer treatment on economic benefits
Among the three irrigation treatments, the highest net benefit of 549 USD ha−1 was obtained for the deficit irrigation IR80 followed by the full irrigation treatment IR100 487 USD ha−1. The least net benefit observed for the deficit irrigation was IR60 (471 USD ha−1). Among the three fertilizer treatments, the highest net benefit was for UREA at the rate of 300Kg ha−1 (591 USD ha−1) followed by organic manure (463 USD ha−1) and UREA at a rate of 100 Kg ha−1 (453 USD ha−1) during the irrigation season (Supplementary Table S3).
Forage had a significant effect (p < 0.001) on the net benefit but there was no statistically significant difference between the fertilizer and irrigation treatments. A high level of variability in the net benefit was observed among the four forages. The highest net benefit observed was for ILRI-16791 while, the least net benefit was obtained for ILRI-144 (Table 5).
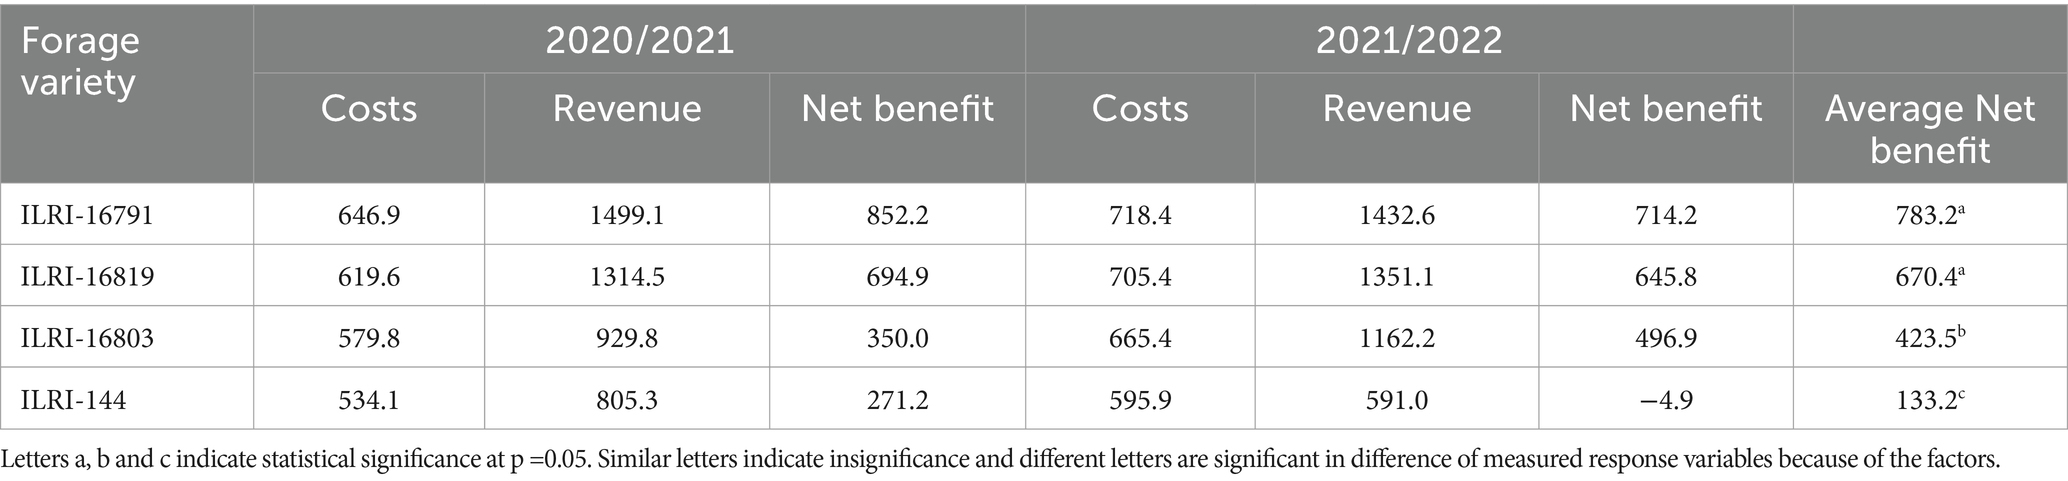
Table 5. Estimated costs, revenue and net benefit (USD ha−1) for each forage variety.
3.6 Relationship between DMY, ET, WUE, and LWP
The relationship between dry matter yield and evapotranspiration was weak (Figure 7). However, there was a strong and positive linear relationship between dry matter yield and water use efficiency (R2 = 0.81 and p < 0.001) as shown in Figure 7. As there is a strong positive relationship between yield and water use efficiency, maximizing yield is necessary to maximize the WUE of any forage. This relationship followed a trend line upto yield less than 15 t ha−1 but above this threshold, it scattered from the line likely because of low WUE from full irrigation application. There was a positive and linear relationship between applied irrigation water and evapotranspiration (Figure 7). There was no relation between total water used (ET) and water use efficiency. The relationship between dry matter yield and livestock water productivity was positive and strong (Figure 7E), while there was no relationship between evapotranspiration and livestock water productivity (Figure 7F).
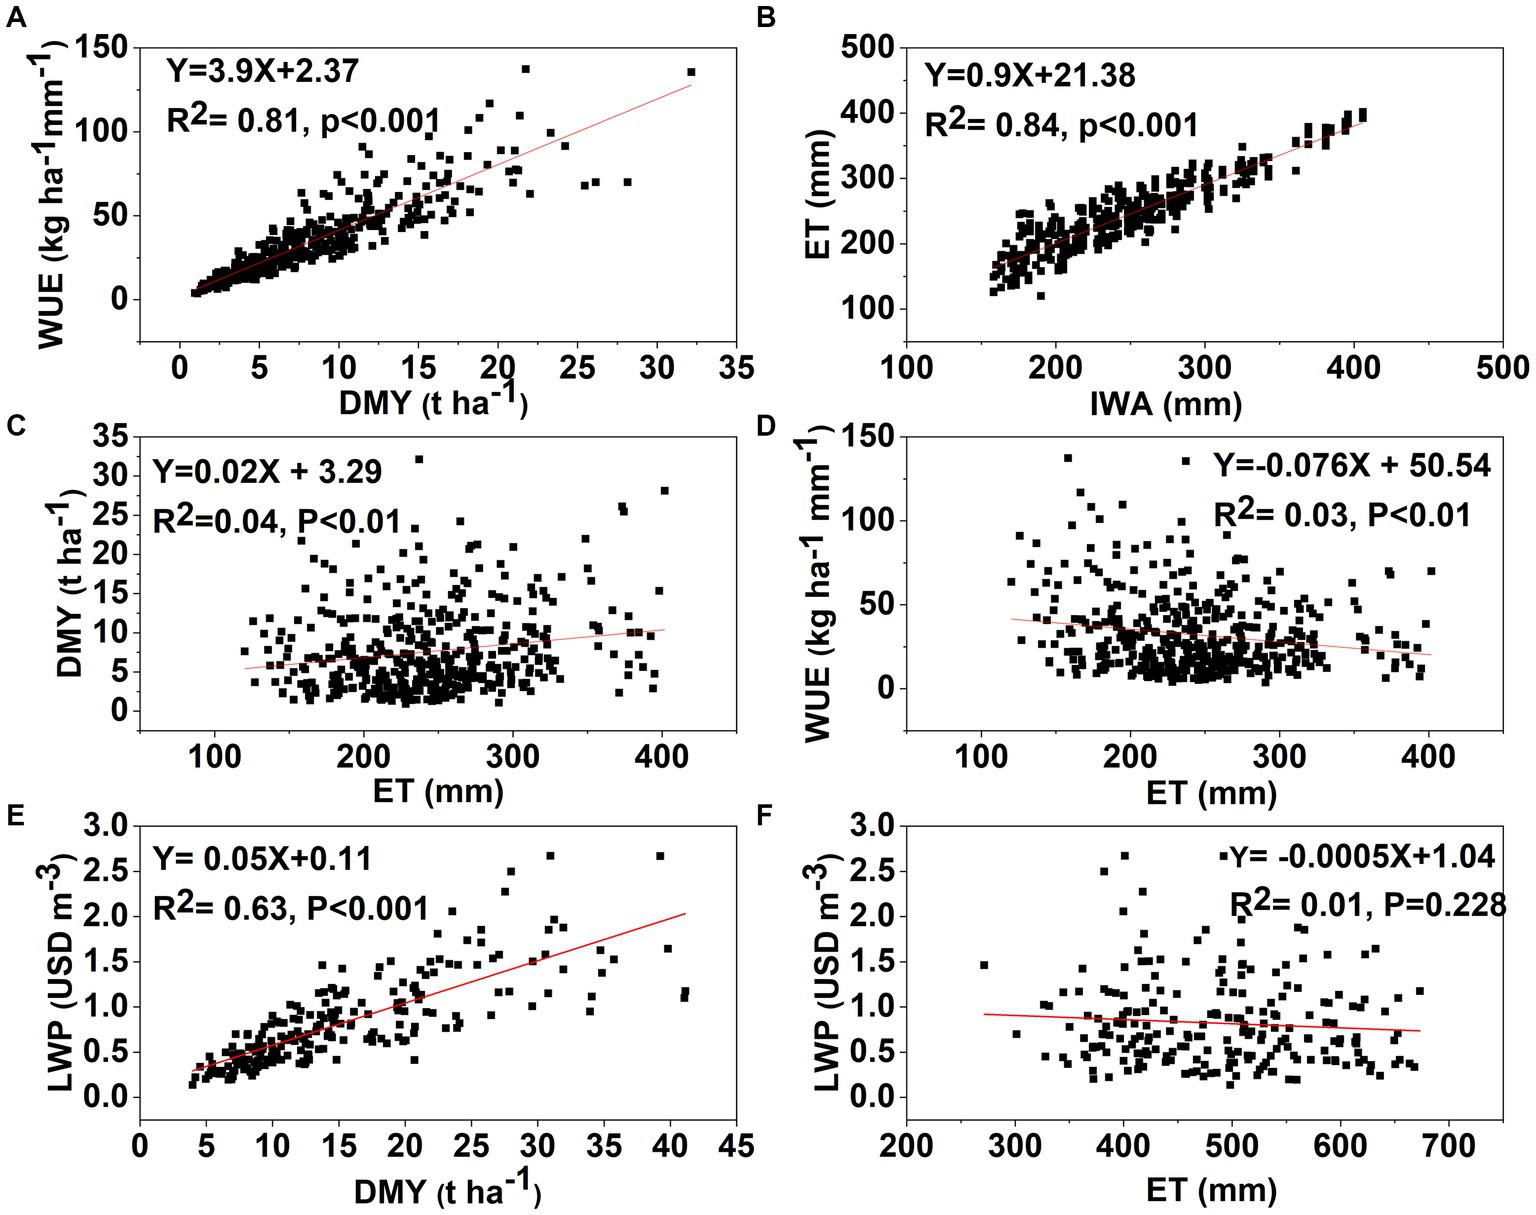
Figure 7. The relationship between (A) dry matter yield and water use efficiency, (B) irrigation water applied and ET, (C) evapotranspiration and DMY, (D) Evapotranspiration and WUE, (E) DMY and livestock water productivity for crossbreed cow, and (F) ET and LWP for crossbred cow.
4 Discussion
4.1 Interaction effect of irrigation, fertilizer, and forage variety
In this study, the three-way as well as the two-way interaction effect of forage variety, fertilizer and irrigation on dry matter yield and water use efficiency was not significant (Supplementary Table S1). Similar to our findings, Gheysari et al. (2009) found that the interaction effect of four irrigation levels and three nitrogen fertilizer rates was not significant on dry matter yield, leaf area index, and plant height of maize for silage in Iran. Similarly, Wang et al. (2017) found an insignificant interaction effect of irrigation and fertilizer on the dry matter yield and water use efficiency of maize. In addition, Ul-Allah et al. (2015) reported that the three-way interaction effect of cropping system, irrigation, and fertilizer was not significant on dry matter yield of forage, although it was significant on water use efficiency in Pakistan.
In contrast, Eisapour Nakhjiri et al. (2021) reported that the three-way interaction effect of rice cultivar., irrigation levels, and fertilizer rates was significant on dry matter yield and water use efficiency in Iran. In China, Zhou et al. (2011) reported that the effect of deficit irrigation coupled with water-saving management practices and nitrogen application rate was significant only for the water use efficiency of maize. Similarly, Ye et al. (2013) found that the effect of alternate drying and wetting irrigation and nitrogen fertilizer was not significant on dry matter yield, grain yield, total N uptake, and nitrogen use efficiency, but the interaction was significant on the water use efficiency of rice. These results show that, the effect of irrigation and fertilizer rates on dry matter yield and water use efficiency is complex and depends on various factors such as crop type, irrigation method, and environmental conditions.
4.2 Effect of irrigation, fertilizer, and forage variety on yield and yield components
In this study, the highest plant height 94.1 cm, highest leaf area index of 8 m2 m−2 and a higher number of tillers (67.4) were observed for the full irrigation. However, the plant height 93.8 cm and LAI of 7.9 m2 m−2 for the deficit irrigation IR80 were not statistically different (Table 3). The lowest agronomic variables were mostly found for the deficit irrigation IR60 (Table 3). The highest plant height for the full irrigation was presumably due to maintaining higher soil moisture throughout the growing period. This result is in agreement with Dingre and Gorantiwar (2021) who found significantly taller plant heights in full irrigation than in water deficit irrigation schedules. Forage variety showed significant variation in plant height, number of tillers as well as LAI (Figure 5). This is due to genetic variation between the forages as well as their adaptability to different water and nutrient inputs and deficit levels (Muktar et al., 2022).
Moreover, full irrigation (IR100) had statistically significant (22.6%) and statistically insignificant (7%) greater dry matter yield than IR60 and IR80, respectively (Figure 5A). The increase in dry matter yield in full irrigation compared to deficit irrigation treatments is attributed to reduced yield losses due to water stress (Clay et al., 2006) or more nutrient uptake and higher photosynthesis rates (Pawar et al., 2014). Norsuwan et al. (2014) reported that full irrigation had a higher biomass yield than deficit irrigation (50%) for Napier grass in the Chiang Mai province of Thailand. The same effect is observed for other crops such as corn, sorghum, and millet where yield was reduced by 28, 13, and 24%, respectively when the amount of irrigation water was reduced by 25% (Jahansouz et al., 2014). The higher dry matter yield is also observed for the application of 300 kg ha−1 UREA (Table 3, Figure 5B), likely due to the enhancement of both shoot and root growth due to the higher nutrient availability (Lynch et al., 2012). A four-year study by Knoll et al. (2013) suggests that a source of fertilizer with nitrogen affects the biomass yield of Napier grass. For instance, when nitrogen application was doubled from 120 to 240 kg N.ha−1, it increased yields from 1,502.5 to 2,063.7 kg DM.ha−1 (Norsuwan et al., 2014).
The dry matter yield was, however, affected by the forage type (Figure 5D). Among the four forage types, ILRI-16791 had the highest DMY (9.8 tonha−1) followed by ILRI-16819 (9 tonha−1) and ILRI-16803 (7 tonha−1). Generally, all of the Napier grass accessions had a higher dry matter yield than ILRI-144 (4.7 tonha−1). The DMY in this study for Napier grass is very low compared to those reported by Ntege et al. (2023) in western tropical Uganda where the total rainfall is much higher than this study area. However, the average DMY in this study is comparable with those reported by Rengsirikul et al. (2011) for eight Napier grass cultivars in tropical central Thailand and much higher than the values reported by Norsuwan et al. (2014) in the Chiang Mai province in Northern Thailand.
The higher dry matter yield reported in this study for ILRI-16791 during full irrigation is because of the higher amount of water application compared to other varieties (refer to Section 3.2). The difference in annual water use between forage varieties is probably due to differences in height, canopy architecture, and ground cover (Allen et al., 1998). In our study, a higher plant height was observed for ILRI-16791, while the shortest plant height observed for ILRI-144. This had the same trend in difference as that of the amount of irrigation water application. However, there was no association between LAI and irrigation water application in our study. For example, as shown in Table 3, ILRI-16791 had a significantly lower LAI than Napier grasses ILRI-16819 and ILRI-16803 but a higher water requirement. This might be because ILRI-16791 invested more energy in height development and stem enlargement than leaf number and area. In a three-year study in the humid subtropical region of Camden, Austria, Neal et al. (2011) found similarly statistically significant differences (p < 0.001) between forages in the amount of irrigation water applied and total water used under the optimal irrigation regime (full irrigation).
Differences in the water requirement by the different forages due to fertilizer were not significant for the full irrigation treatment. However, 4 and 6% more irrigation water applications were observed for UREA at the rate of 300 kg ha−1 compared to organic manure and UREA at the rate of 100 kg ha−1. This result suggests that when soil nutrients are available at a higher rate, the plants need more water to uptake and use the available nutrients as there is a simultaneous uptake of water and nutrients leading to their more effective use when both are at a satisfactory level (Choudhary and Prabhu, 2016). The slightly higher water requirement for UREA at the rate of 300 kg ha−1 might be due to higher nutrient input as nutrient input affects plant water status and its tolerance to drought (Li et al., 2009).
4.3 Effect of irrigation, fertilizer, and forage variety on water use efficiency
In comparison to the full irrigation treatment, the deficit irrigation treatments IR60 and IR80 resulted in higher water use efficiency (WUE), with the maximum WUE observed for IR60 (Table 3). Our result is in agreement with previous studies by Fang et al. (2006) and Zhang et al. (2004) who reported higher WUE values under deficit irrigation compared to full irrigation. Additionally, Fereres and Soriano (2007) reported that deficit irrigation enhanced the water use efficiency of various horticultural and annual crops. Mandal et al. (2006) found that the water use efficiency of Indian mustard decreased with increasing irrigation amounts. Numerous researchers have consistently reported advantageous increases in WUE under conditions of water stress (Seghatoleslami et al., 2008; Nagaz et al., 2009; Asmamaw et al., 2023). The potential explanation for the lower WUE associated with increased irrigation water may be attributed to a greater water loss through evapotranspiration (ET) than the corresponding increase in biomass, as proposed by Mandal et al. (2006).
Among the three treatments involving irrigation, fertilizer, and forage, the highest variability in WUE was observed in the forage type (Table 3). The effect of genotype or cultivar on water use efficiency has been observed for various crops, including cowpea (Hussain et al., 1999), sorghum (Ajeigbe et al., 2018), soybean (Hufstetler et al., 2007), maize (Nagore et al., 2017) and wheat (Siahpoosh et al., 2011). One strategy for increasing water use efficiency involves identifying genotypes with high assimilation rates under conditions of temperature and water-deficit stress (Hatfield and Dold, 2019).
In a study conducted by Neal et al. (2011), fifteen perennial forages were investigated over 3 years at Camden, NSW, Austria, under optimum irrigation and two deficit irrigation treatments. They found that Kikuyu (Pennisetum clandestinum Hochst. ex. chiov.) exhibited the highest mean water use efficiency (27.3 kg ha−1 mm−1) while Birdsfoot trefoil (Lotus corniculatus L.) had the lowest WUE of 14.8 kg ha−1 mm−1 under optimum irrigation treatments. A similar variation in the WUE of forages was observed in our study. For example, over the two-year average, ILRI-16791 (39.2 kg ha−1 mm−1) showed nearly double the water use efficiency of ILRI-144 (21.8 kg ha−1 mm−1).
4.4 Livestock water productivity and net benefit
In line with the water use efficiency, the livestock water productivity (LWP) showed higher values for the deficit irrigations compared to the full irrigation (Table 3). The deficit irrigation IR60 had the highest LWP (0.22, 0.9 USD m−3), while for IR80, LWP was 0.21, 0.83 USD m−3 and for IR100, it was 0.17, 0.74 USD m−3 for local and crossbred cows, respectively. This result is due to the reduced evapotranspiration for the deficit irrigation as opposed to the full irrigation treatment. The higher LWP of 0.23, 0.89 USD m−3 for local and crossbred cows, respectively, observed for the application of 300 kg ha−1 UREA, in comparison to other treatments, is due to the increased production of dry matter yield (Table 3). Despite a slightly higher ET under UREA at a rate of 300 kg ha−1 compared to other treatments, the increased dry matter yield and consequently, the enhanced net benefit obtained from livestock products contributed to a higher LWP. The lowest LWP of 0.2, 0.78 USD m−3 for local and crossbred cows, respectively, was found for the application of manure.
Within the three treatments involving irrigation, fertilizer, and forage, the forage variety showed a more pronounced difference in the LWP (Table 3). The LWP for the four different forages was 0.28, 1.04 USD m−3 for ILRI-16791, and 0.25, 0.95 USD m−3 for ILRI-16819, and 0.18, 0.77 USD m−3 for ILRI-16803 and 0.11, 0.53 USD m−3 for ILRI-144 for local and crossbred cows, respectively. The variations in LWP among the different forage treatments stem from differences in biomass production, evapotranspiration, and digestibility of the various forages. In comparison to all the previously discussed treatments, the cow breeds exerted the highest impact on the variability in LWP. The use of a crossbred cow, as opposed to a local cow, resulted in a nearly fourfold increase in the average LWP value, increasing from 0.2 to 0.8 USD m−3.
In this study, the LWP values for local cows were generally higher than those reported by Mekonnen et al. (2011), comparable to or less than (depending upon farming system) the values reported by Haileslassie et al. (2009b) and less than the values reported by Gebreselassie et al. (2009) and Haileslassie et al. (2009a). Differences in LWP may arise from variations in farming methods and assumptions made during LWP calculations. Notably, many cited papers report gross LWP, whereas the LWP values in this study represent net livestock water productivity. The findings from this experiment demonstrated that the right combination of irrigation, fertilizer, crop variety, and livestock variety enhances livestock water productivity.
Similarly, application of deficit irrigation, use of ILRI-16791 variety and application of higer rate of UREA leads to higer net benefit (Table 3; Table 5). Using UREA at a rate of 300 kg ha−1 resulted in higher net benefit than using UREA at a rate of 100 kg ha−1 or organic manure (Supplementary Table S3). The net benefit for UREA at a rate of 300 kg ha−1 was 23.3 and 21.6% higher than that of UREA at a rate of 100 kg ha−1 and organic manure. This was due to higher biomass production for UREA at a rate of 300 kg ha−1 than the other treatments. Farmers in the study area prefer using manure for forage production due to several reasons. Firstly, there is a high initial cost associated with chemical fertilizers, making manure a more economically viable option (Delate et al., 2017). Additionally, farmers are accustomed to preparing their manure, which aligns with their traditional farming practices and reduces dependency on external inputs (Altieri, 1996). Moreover, there is a perception among farmers that the returns from forage production may not justify the investment in chemical fertilizers, whereas for cereals and vegetables, where higher yields are expected, the preference shifts towards inorganic fertilizers. However, the results from this study suggest, investing in chemical fertilizer for forage production is economically viable. Hence, the choice between inorganic and organic fertilizer may depend on other factors than cost such as availability and environmental factors. The tradeoff in using fertilizer, whether organic or inorganic, for grain and feed production lies in balancing short-term yield gains with long-term sustainability and environmental impacts (Norgaard et al., 2022). Organic fertilizers, such as manure, offer benefits like improved soil health, enhanced nutrient retention, and reduced dependency on synthetic inputs. However, they often require more time and effort for application and may have variable nutrient content (Wang et al., 2024). In contrast, inorganic fertilizers provide readily available nutrients and can boost yields more quickly, but their overuse can lead to soil degradation, water pollution, and adverse effects on biodiversity. Additionally, there’s a financial tradeoff as organic fertilizers may be cheaper initially but require ongoing investment in manure management, while inorganic fertilizers tend to have higher upfront costs but may offer greater precision and control over nutrient application (Lemma and Abewoy, 2021). Striking a balance between these factors is essential for maximizing productivity while minimizing environmental degradation and ensuring the long-term sustainability of agricultural systems (Fang et al., 2021).
Among the three treatments of forage, fertilizer, and irrigation, the forage variety has higher variability than the other treatments in terms of net benefit. On average, the net benefit from ILRI-16791 was 17, 85, and 488% higher than ILRI-16819, ILRI-16803, and ILRI-144, respectively.
In general, the results showed that, a strong and positive linear relationship was observed between crop yield and water use efficiency, indicating that as water efficiency increased, so did the yield. Additionally, there was a positive and linear relationship between the amount of irrigation water applied and evapotranspiration, suggesting that as more water was applied, evapotranspiration increased proportionally. Notably, the study revealed that deficit irrigation particularly IR80 enhanced WUE, LWP and net benefit, while resulting in slightly lower dry matter yields compared to full irrigation. Among the irrigation treatments, IR80 demonstrated the most favorable balance between forage yield, WUE, net benefit, and LWP (Table 3; 5). This underscores the potential benefits of optimizing water use in agriculture and the economic and resource-saving advantages of such water management strategies. These findings emphasize the potential for adopting moderate deficit irrigation as a sustainable approach, particularly in water-scarce regions. Among the fertilizer treatments, UREA 300 kg ha−1 resulted in the highest DMY, WUE, LWP, and net benefit, indicating that sufficient nutrient availability enhances overall crop productivity. Among the four forages ILRI-16791 exhibited the highest DMY, WUE, LWP, and net benefit. These findings indicate the importance of selecting the right variety (cultivar) that can perform well under optimum water and nutrient conditions and water and nutrient stress.
4.5 Implication to policy and scaling
The implementation of findings from such studies promises to have beneficial effects on milk production and yield (Getnet et al., 2016). This has the potential to transform the dairy sector, addressing the issue of feed quality and availability that needs immediate attention (Abera et al., 2022). Cultivated forage crops have the potential to significantly enhance livestock productivity by providing high-quality, year-round feed (Tesfaye and Tessema, 2023). Despite the potential benefits, the adoption of improved forage technologies remains low, with only about 0.15% of farmers utilizing them (Kalsa and Dey, 2022; Tesfaye and Tessema, 2023). This suggests the production of irrigated forage needs attention from the government and other actors such as NGOs and research institutes. To address this, the government and organizations like the International Livestock Research Institute (ILRI) have worked with smallholder farmers to introduce irrigated forage production, particularly of Napier grass.
However, these efforts encounter various challenges, including competition for limited water resources, inadequate farmer awareness and skills, underdeveloped forage seed production and marketing systems, and high costs and limited capacities of irrigation systems (Kalsa and Dey, 2022; Senbeta and Worku, 2023). To effectively address these challenges, concerted efforts are essential. Strengthening extension services and training programs, investing in forage seed system development, and improving water resource management and irrigation system efficiency are critical (Kalsa and Dey, 2022; Senbeta and Worku, 2023). Additionally, targeted policy interventions and financial support are indispensable for incentivizing smallholder farmers to adopt improved forage technologies (Tesfaye and Tessema, 2023).
Furthermore, recognizing irrigated forage as a beneficial agribusiness and supporting initiatives to strengthen the forage value chain from seed to livestock products can significantly contribute to dairy transformation and livelihood improvement (Alvarez Aranguiz and Creemers, 2019; Abera et al., 2022). Continued government and NGO support for irrigated forage production, forage seed systems, and dairy value chain development are crucial for improving livestock productivity and livelihoods in Ethiopia (Dey et al., 2022).
To translate the findings of this study into tangible benefits to smallholder farmers, scaling the methodology beyond the experimental site is necessary with a comprehensive strategy encompassing partnerships with stakeholders, capacity building through training programs, and demonstration of benefits, advocacy for supportive policies, and robust monitoring and evaluation mechanisms. Collaboration with government agencies, NGOs, and communities to facilitate resource leveraging and widespread adoption (Cooley and Linn, 2014; Do, 2019) as well as capacity building to empower stakeholders with the necessary skills (Barker et al., 2015; Do, 2019). Demonstrating benefits and advocating for supportive policies encourage adoption and create an enabling environment (Pfotenhauer et al., 2022). Monitoring and evaluation ensure effectiveness and inform continuous improvement, fostering sustainable scalability (Barker et al., 2015).
In addition to the strategies outlined for scaling the methodology, several specific mechanisms can be employed to further enhance water use efficiency (WUE) and nutrient use efficiency (NUE) beyond the experimental site. Firstly, implementing conservation practices such as reduced tillage, contour plowing, and cover cropping can mitigate soil erosion, thereby conserving soil moisture and nutrients, ultimately improving WUE and NUE (Hobbs et al., 2008). Additionally, adopting precision agriculture techniques, including drip irrigation and site-specific nutrient management, allows for targeted application of water and fertilizers, minimizing losses and optimizing resource utilization (Sadras, 2004). Furthermore, intercropping and organic soil amendments enhance soil structure, water retention, and nutrient cycling, contributing to improved efficiencies in water and nitrogen utilization (Lal, 2004). Lastly, promoting farmer education and extension services to disseminate knowledge on sustainable land management practices and technologies is crucial for widespread adoption and replication of the methodology beyond controlled sites, ensuring long-term resilience and sustainability in erosion-prone environments (Swanson and Rajalahti, 2010).
5 Conclusion
This study investigates the impact of deficit irrigation, fertilizer type, and rate on four distinct forage types. The findings reveal that increased irrigation levels lead to increased dry matter yield but diminish water use efficiency and livestock water productivity. Forage variety also influences both dry matter yield and water use efficiency, with ILRI-16791 emerging as the top performer across tested parameters, showcasing resilience under varying conditions. Regardless of water and nutrient combinations, ILRI-16791 consistently outperforms other forages, demonstrating its suitability for optimizing biomass production and economic returns. The study underscores the importance of strategic forage selection, water, and nutrient management practices, along with appropriate cow breed choice, in enhancing yield and water productivity of irrigated forage in the Ethiopian highlands. To effectively translate these findings into economic and nutritional benefits for smallholder farmers, capacity-building efforts focusing on water and nutrient management, coupled with resilient forage varieties adoption, are crucial. Further research into the long-term impacts on soil health, biodiversity, and the adaptability of diverse forage varieties to local agro-climatic conditions holds significant potential for sustainable productivity enhancement and economic benefits for smallholder communities.
Data availability statement
The raw data supporting the conclusions of this article will be made available by the authors, without undue reservation upon request.
Author contributions
MAH: Conceptualization, Data curation, Formal analysis, Investigation, Methodology, Validation, Visualization, Writing – original draft. AH: Methodology, Supervision, Writing – review & editing. MD: Conceptualization, Funding acquisition, Methodology, Project administration, Resources, Supervision, Writing – review & editing. TTA: Methodology, Supervision, Writing – review & editing. FTR: Data curation, Methodology, Resources, Writing – original draft. AA: Conceptualization, Data curation, Methodology, Resources, Writing – review & editing. AKT: Formal analysis, Investigation, Writing – original draft. CSJ: Funding acquisition, Project administration, Writing – review & editing. SAT: Conceptualization, Formal analysis, Investigation, Methodology, Validation, Visualization, Writing – review & editing.
Funding
The author(s) declare financial support was received for the research, authorship, and/or publication of this article. This work was supported by the U.S. Agency for International Development under the Feed the Future Innovation Lab for Small Scale Irrigation (contract no. AID-OAA-A-13-0055) and the CGIAR Initiative on Sustainable Animal Productivity which is supported by contributors to the CGIAR Trust Fund through International Livestock Research Institute.
Acknowledgments
We are grateful to Bahir Dar University, Bahir Dar Institute of Technology and ANDASA livestock research center for their collaboration to this research work.
Conflict of interest
AT was employed by Lihiket Design and Supervision Corporation.
The remaining authors declare that the research was conducted in the absence of any commercial or financial relationships that could be construed as a potential conflict of interest.
The reviewer BB declared a shared affiliation with the author ST to the handling editor at the time of review.
The author(s) declared that they were an editorial board member of Frontiers, at the time of submission. This had no impact on the peer review process and the final decision.
Publisher's note
All claims expressed in this article are solely those of the authors and do not necessarily represent those of their affiliated organizations, or those of the publisher, the editors and the reviewers. Any product that may be evaluated in this article, or claim that may be made by its manufacturer, is not guaranteed or endorsed by the publisher.
Supplementary material
The Supplementary material for this article can be found online at: https://www.frontiersin.org/articles/10.3389/fsufs.2024.1373698/full#supplementary-material
Footnotes
1. ^https://www.ilri.org/international-platform-rapid-analysis-livestock-feed-quality-nodes-india-ethiopia-nigeria-and
References
Abera, D., Getaneh, S., Jones, C. S., and Bezabih, M., (2022). Economic analysis and trade-offs of irrigated fodder production in Ethiopia: implications for smallholder dairy transformation. ILRI discussion paper 44. Nairobi, Kenya: ILRI patron: Professor Peter C Doherty AC, FAA, FRS animal scientist, Nobel prize laureate for physiology or medicine–1996.
Afshar, R. K., Chaichi, M., Assareh, M., Hashemi, M., and Liaghat, A. (2014). Interactive effect of deficit irrigation and soil organic amendments on seed yield and flavonolignan production of milk thistle (Silybum marianum L. Gaertn.). Ind. Crop. Prod. 58, 166–172. doi: 10.1016/j.indcrop.2014.03.043
Ahmadi-Mirabad, A., Lotfi, M., and Roozban, M. R. (2014). Growth, yield, yield components and water-use efficiency in irrigated cantaloupes under full and deficit irrigation. Electron. J. Biol. 10, 79–84.
Ahmed, M. A., Ehui, S., and Assefa, Y., (2004). Dairy development in Ethiopia. EPTD discussion papers 123. International Food Policy Research Institute: Washington, DC, USA
Ajeigbe, H. A., Akinseye, F. M., Ayuba, K., and Jonah, J. (2018). Productivity and water use efficiency of sorghum [sorghum bicolor (L.) moench] grown under different nitrogen applications in Sudan savanna zone, Nigeria. Int. J. Agron. 2018, 1–11. doi: 10.1155/2018/7676058
Allen, R. G., Pereira, L. S., Raes, D., and Smith, M. J. F. (1998). Crop evapotranspiration-guidelines for computing crop water requirements-FAO irrigation and drainage paper 56, Vol. 300. Rome: FAO, D05109.
Altieri, M. A., (1996). Agroecology: The Science Of Sustainable Agriculture. Second Edition (2nd ed.). CRC Press. doi: 10.1201/9780429495465
Alvarez Aranguiz, A., and Creemers, J., (2019). Quick scan of Ethiopia’s forage sub-sector: Netherlands east African dairy partnership (NEADAP) working paper. Wageningen, Wageningen UR-Livestock Research.
Asmamaw, D. K., Janssens, P., Dessie, M., Tilahun, S. A., Adgo, E., Nyssen, J., et al. (2023). Effect of deficit irrigation and soil fertility management on wheat production and water productivity in the upper Blue Nile Basin, Ethiopia. Agric. Water Manag. 277:108077. doi: 10.1016/j.agwat.2022.108077
Asmamaw, D. K., Janssens, P., Dessie, M., Tilahun, S., Adgo, E., Nyssen, J., et al. (2021). Deficit irrigation as a sustainable option for improving water productivity in sub-Saharan Africa: the case of Ethiopia. A critical review. Environ. Res. Commun. 3:102001. doi: 10.1088/2515-7620/ac2a74
Baranchuluun, S., Bayanjargal, D., and Adiyabadam, G. (2014). A cost benefit analysis of crop production with various irrigation systems. IFEAMA SPSCP 5, 146–156. doi: 10.33545/26648652.2020.v2.i1a.13
Barker, P. M., Reid, A., and Schall, M. W. (2015). A framework for scaling up health interventions: lessons from large-scale improvement initiatives in Africa. Implement. Sci. 11, 12–11. doi: 10.1186/s13012-016-0374-x
Bekele, S., and Tilahun, K. (2007). Regulated deficit irrigation scheduling of onion in a semiarid region of Ethiopia. Agric. Water Manag. 89, 148–152. doi: 10.1016/j.agwat.2007.01.002
Benin, S., Ehui, S., and Pender, J. (2003). Policies for livestock development in the Ethiopian highlands. Environ. Dev. Sustain. 5, 491–510. doi: 10.1023/A:1025737315629
Chakwizira, E., De Ruiter, J., and Maley, S. (2015). Effects of nitrogen fertiliser application rate on nitrogen partitioning, nitrogen use efficiency and nutritive value of forage kale. N. Z. J. Agric. Res. 58, 259–270. doi: 10.1080/00288233.2015.1016538
Choudhary, M., and Prabhu, G. (2016). Response of fodder oat (Avena sativa L.) varieties to irrigation and fertilizer gradient. Range Management and Agroforestry. 37, 201–206.
Clay, D., Kim, K. I., Chang, J., Clay, S., and Dalsted, K. (2006). Characterizing water and nitrogen stress in corn using remote sensing. Agron. J. 98, 579–587. doi: 10.2134/agronj2005.0204
Cooley, L., and Linn, J. F., (2014). Taking innovations to scale: methods, applications and lessons. Washington DC: Results for Development Institute.
CSA (2020). Centreal statistics agency 2020. Central statistical Agency of Ethiopia, agricultural sample survey, 2019/2020, II. Addis Ababa, Ethiopia: Crop and Livestock Product Utilization.
Dadrasan, M., Chaichi, M., Pourbabaee, A., Yazdani, D., and Keshavarz-Afshar, R. (2015). Deficit irrigation and biological fertilizer influence on yield and trigonelline production of fenugreek. Ind. Crop. Prod. 77, 156–162. doi: 10.1016/j.indcrop.2015.08.040
Daneshnia, F., Amini, A., and Chaichi, M. R. (2015). Surfactant effect on forage yield and water use efficiency for berseem clover and basil in intercropping and limited irrigation treatments. Agric. Water Manag. 160, 57–63. doi: 10.1016/j.agwat.2015.06.024
Das, A., Patel, D., Lal, R., Kumar, M., Ramkrushna, G., Layek, J., et al. (2016). Impact of fodder grasses and organic amendments on productivity and soil and crop quality in a subtropical region of eastern Himalayas, India. Agric. Ecosyst. Environ. 216, 274–282. doi: 10.1016/j.agee.2015.10.011
Delate, K., Cambardella, C., Chase, C., and Turnbull, R. (2017). A review of long-term organic comparison trials in the US. Sustain. Dev. Org. Agric. 4, 101–118. doi: 10.1201/9781315365800-6
Descheemaeker, K., Amede, T., Haileslassie, A., and Bossio, D. (2011). Analysis of gaps and possible interventions for improving water productivity in crop livestock systems of Ethiopia. Exp. Agric. 47, 21–38. doi: 10.1017/S0014479710000797
Dey, B., Notenbaert, A., Makkar, H., Mwendia, S., Sahlu, Y., and Peters, M. (2022). Realizing economic and environmental gains from cultivated forages and feed reserves in Ethiopia. CABI Rev. 17 doi: 10.1079/cabireviews202217010
Dingre, S., and Gorantiwar, S. (2021). Soil moisture based deficit irrigation management for sugarcane (Saccharum officinarum L.) in semiarid environment. Agric. Water Manag. 245:106549. doi: 10.1016/j.agwat.2020.106549
Do, T., (2019). A review of scaling concepts: ReSolve scaling workshops project. Available at: https://www.diva-portal.org/smash/get/diva2:1293459/FULLTEXT01.pdf (Accessed March 19, 2024).
Eisapour Nakhjiri, S., Ashouri, M., Sadeghi, S. M., Mohammadian Roshan, N., and Rezaei, M. (2021). The effect of irrigation management and nitrogen fertilizer on grain yield and water-use efficiency of rice cultivars in northern Iran. Gesunde Pflanzen 73, 359–366. doi: 10.1007/s10343-021-00562-6
Fang, P., Abler, D., Lin, G., Sher, A., and Quan, Q. (2021). Substituting organic fertilizer for chemical fertilizer: evidence from apple growers in China. Land 10:858. doi: 10.3390/land10080858
Fenta, H. M., Hussein, M. A., Tilahun, S. A., Nakawuka, P., Steenhuis, T. S., Barron, J., et al. (2022). Berken plow and intercropping with pigeon pea ameliorate degraded soils with a hardpan in the Ethiopian highlands. Geoderma 407:115523. doi: 10.1016/j.geoderma.2021.115523
Fereres, E., and Soriano, M. A. (2007). Deficit irrigation for reducing agricultural water use. J. Exp. Bot. 58, 147–159. doi: 10.1093/jxb/erl165
Feyissa, F., Kebede, G., Geleti, D., Assefa, G., and Mengistu, A. (2022). Improved forage crops research and development in Ethiopia: major achievements, challenges and the way forward. OMO Int. J. Sci. 5, 36–69. doi: 10.59122/135BE51
Gebreselassie, S., Peden, D., Haileslassie, A., and Mpairwe, D. (2009). Factors affecting livestock water productivity: animal scale analysis using previous cattle feeding trials in Ethiopia. Rangeland J. 31, 251–258. doi: 10.1071/RJ09011
Getnet, K., Haileslasseie, A., Dessalegne, Y., Hagos, F., Gebrehaweria, G., and Gebremedhin, B. (2016). On the profitability of irrigated fodder production: comparative evidence from smallholders in Koga irrigation scheme, Ethiopia. Anim. Prod. Sci. 57, 1962–1974. doi: 10.1071/AN15651
Gheysari, M., Mirlatifi, S. M., Bannayan, M., Homaee, M., and Hoogenboom, G. (2009). Interaction of water and nitrogen on maize grown for silage. Agric. Water Manag. 96, 809–821. doi: 10.1016/j.agwat.2008.11.003
Gomez, K. A., and Gomez, A. A. (1984). Statistical procedures for agricultural research. 2nd Edition. John Wiley & Sons, New York. 680
Haileslassie, A., Peden, D., Gebreselassie, S., Amede, T., and Descheemaeker, K. (2009a). Livestock water productivity in mixed crop–livestock farming systems of the Blue Nile basin: assessing variability and prospects for improvement. Agric. Syst. 102, 33–40. doi: 10.1016/j.agsy.2009.06.006
Haileslassie, A., Peden, D., Gebreselassie, S., Amede, T., Wagnew, A., and Taddesse, G. (2009b). Livestock water productivity in the Blue Nile Basin: assessment of farm scale heterogeneity. Rangeland J. 31, 213–222. doi: 10.1071/RJ09006
Hao, B., Xue, Q., Bean, B. W., Rooney, W. L., and Becker, J. D. (2014). Biomass production, water and nitrogen use efficiency in photoperiod-sensitive sorghum in the Texas High Plains. Biomass Bioenergy 62, 108–116. doi: 10.1016/j.biombioe.2014.01.008
Hatfield, J. L., and Dold, C. (2019). Water-use efficiency: advances and challenges in a changing climate. Front. Plant Sci. 10:103. doi: 10.3389/fpls.2019.00103
Hawkins H-J, S. R. (2013). The sustainable dairy handbook: for south African dairy farmers. Bryanston, South Africa: Nestlé Printers.
Hobbs, P. R., Sayre, K., and Gupta, R. (2008). The role of conservation agriculture in sustainable agriculture. Philos. Trans. R. Soc. B Biol. Sci. 363, 543–555. doi: 10.1098/rstb.2007.2169
Hufstetler, E. V., Boerma, H. R., Carter, T. E., and Earl, H. J. (2007). Genotypic variation for three physiological traits affecting drought tolerance in soybean. Crop Sci. 47, 25–35. doi: 10.2135/cropsci2006.04.0243
Hussain, I. A., Prasad, T., Wright, G., Kumar, M. U., and Rao, R. N. (1999). Variation in transpiration efficiency and carbon isotope discrimination in cowpea. Funct. Plant Biol. 26, 503–510. doi: 10.1071/PP98097
Jahansouz, M. R., Afshar, R. K., Heidari, H., and Hashemi, M. (2014). Evaluation of yield and quality of sorghum and millet as alternative forage crops to corn under normal and deficit irrigation regimes. Jordan J. Agric. Sci. 173, 1–17. doi: 10.12816/0031747
Kalsa, K. K., and Dey, B. (2022). Forage seed system performance of Ethiopia: an overview based on key indicators. CABI Rev. 17 doi: 10.1079/cabireviews202217055
Keshavarz Afshar, R., Chaichi, M., Moghadam, H., and Ehteshami, S. (2012). Irrigation, phosphorus fertilizer and phosphorus solubilizing microorganism effects on yield and forage quality of turnip (Brassica rapa L.) in an arid region of Iran. Agric. Res. 1, 370–378. doi: 10.1007/s40003-012-0039-1
Knoll, J. E., Anderson, W. F., Malik, R., Hubbard, R. K., and Strickland, T. C. (2013). Production of napiergrass as a bioenergy feedstock under organic versus inorganic fertilization in the Southeast USA. Bioenergy Res. 6, 974–983. doi: 10.1007/s12155-013-9328-1
Lal, R. J. S. (2004). Soil carbon sequestration impacts on global climate change and food security. Science 304, 1623–1627. doi: 10.1126/science.1097396
Lemma, D. T., and Abewoy, D. (2021). Role of organic and inorganic fertilizers on the performance of some medicinal plants. Int. J. Plant Breed. Crop Sci. 8, 1016–1024.
Li, S.-X., Wang, Z.-H., Malhi, S., Li, S.-Q., Gao, Y.-J., and Tian, X.-H. (2009). Nutrient and water management effects on crop production, and nutrient and water use efficiency in dryland areas of China. Adv. Agron. 102, 223–265. doi: 10.1016/S0065-2113(09)01007-4
Lynch, J., Marschner, P., and Rengel, Z. (2012). Effect of internal and external factors on root growth and development, Marschner's mineral nutrition of higher plants : Elsevier, 331–346. doi: 10.1016/B978-0-12-384905-2.00013-3
Mandal, K. G., Hati, K., Misra, A., and Bandyopadhyay, K. (2006). Assessment of irrigation and nutrient effects on growth, yield and water use efficiency of Indian mustard (Brassica juncea) in Central India. Agric. Water Manag. 85, 279–286. doi: 10.1016/j.agwat.2006.05.004
Mekonnen, S., Descheemaeker, K., Tolera, A., and Amede, T. (2011). Livestock water productivity in a water stressed environment in northern Ethiopia. Exp. Agric. 47, 85–98. doi: 10.1017/S0014479710000852
Mengistu, A., Kebede, G., Feyissa, F., and Assefa, G. (2017). Review on major feed resources in Ethiopia: conditions, challenges and opportunities. Acad. Res. J. Agric. Sci. Res. 5, 176–185. doi: 10.14662/ARJASR2017.013
Muktar, M. S., Habte, E., Teshome, A., Assefa, Y., Negawo, A. T., Lee, K.-W., et al. (2022). Insights into the genetic architecture of complex traits in Napier grass (Cenchrus purpureus) and QTL regions governing forage biomass yield, water use efficiency and feed quality traits. Front. Plant Sci. 12:678862. doi: 10.3389/fpls.2021.678862
Mwendia, S., Wanyoike, M., JGM, N., Wahome, R., and Mwangi, D., (2006). Evaluation of napier grass cultivars for resistance to napier head smut. Avilable at: https://api.semanticscholar.org/CorpusID:82960282 (Accessed March 19, 2024)
Mwinuka, P. R., Mbilinyi, B. P., Mbungu, W. B., Mourice, S. K., Mahoo, H., and Schmitter, P. (2021). The feasibility of hand-held thermal and UAV-based multispectral imaging for canopy water status assessment and yield prediction of irrigated African eggplant (Solanum aethopicum L). Agric. Water Manag. 245:106584. doi: 10.1016/j.agwat.2020.106584
Nagaz, K., Masmoudi, M., and Mechila, N. (2009). Yield and water use-efficiency of pearl millet (Pennisetum glaucum (L.) R. Br.) under deficit irrigation with saline water in arid conditions of southern Tunisia. Res. J. Agron. 3, 9–17.
Nagore, M. L., Della Maggiora, A., Andrade, F. H., and Echarte, L. J. F. C. R. (2017). Water use efficiency for grain yield in an old and two more recent maize hybrids. Field Crops Res. 214, 185–193. doi: 10.1016/j.fcr.2017.09.013
Neal, J., Fulkerson, W., and Sutton, B. (2011). Differences in water-use efficiency among perennial forages used by the dairy industry under optimum and deficit irrigation. Irrig. Sci. 29, 213–232. doi: 10.1007/s00271-010-0229-1
Norgaard, A. E., Lewis, D., Borden, K. A., Krzic, M., Carrillo, J., and Smukler, S. M. (2022). Trade-offs in organic nutrient management strategies across mixed vegetable farms in Southwest British Columbia. Front. Sustain. Food Syst. 6:706271. doi: 10.3389/fsufs.2022.706271
Norsuwan, T., Marohn, C., and Jintrawet, A. (2014). Effects of irrigation treatments and nitrogen applications on Napier grass planted in dry season as energy crop at Chiang Mai province. Khon Kaen Agric. J. 42, 1–7.
Ntege, I., Kiggundu, N., Wanyama, J., and Nakawuka, P. (2023). Napier yield response under different irrigation strategies in a tropical setting. Agric. Water Manag. 287:108403. doi: 10.1016/j.agwat.2023.108403
Pawar, D., Dingre, S., and Durgude, A. (2014). Enhancing nutrient use and sugarcane (Saccharum officinarum) productivity with reduced cost through drip fertigation in western Maharashtra. Indian J. Agric. Sci. 84, 844–849. doi: 10.56093/ijas.v84i7.41997
Peden, D., Tadesse, G., Misra, A., Ahmed, F., Astatke, A., Ayalneh, W., et al. (2007). Water and livestock for human development. International Water Management Institute.
Pfotenhauer, S., Laurent, B., Papageorgiou, K., and Stilgoe, J. (2022). The politics of scaling. Soc. Stud. Sci. 52, 3–34. doi: 10.1177/03063127211048945
Fang, Q-X., Chen, Y-H., Li, Q-Q., Yu, S-Z., Luo, Y., Yu, Q., et al. (2006). Effects of Soil Moisture on Radiation Utilization during Late Growth Stages and Water Use Efficiency of Winter Wheat[J]. Acta Agron. Sin. 32, 861–866.
Rengsirikul, K., Ishii, Y., Kangvansaichol, K., Pripanapong, P., Sripichitt, P., Punsuvon, V., et al. (2011). Effects of inter-cutting interval on biomass yield, growth components and chemical composition of napiergrass (Pennisetum purpureum Schumach) cultivars as bioenergy crops in Thailand. Grassl. Sci. 57, 135–141. doi: 10.1111/j.1744-697X.2011.00220.x
Rostamza, M., Chaichi, M.-R., Jahansouz, M.-R., and Alimadadi, A. (2011). Forage quality, water use and nitrogen utilization efficiencies of pearl millet (Pennisetum americanum L.) grown under different soil moisture and nitrogen levels. Agric. Water Manag. 98, 1607–1614. doi: 10.1016/j.agwat.2011.05.014
Sadras, V. O. (2004). Yield and water-use efficiency of water-and nitrogen-stressed wheat crops increase with degree of co-limitation. Eur. J. Agron. 21, 455–464. doi: 10.1016/j.eja.2004.07.007
Seghatoleslami, M., Kafi, M., and Majidi, E. (2008). Effect of deficit irrigation on yield, WUE and some morphological and phenological traits of three millet species. Pak. J. Bot. 40, 1555–1560.
Senbeta, A. F., and Worku, W. (2023). Ethiopia’s wheat production pathways to self-sufficiency through land area expansion, irrigation advance, and yield gap closure. Heliyon 9:e20720. doi: 10.1016/j.heliyon.2023.e20720
Siahpoosh, M. R., Dehghanian, E., and Kamgar, A. (2011). Drought tolerance evaluation of bread wheat genotypes using water use efficiency, evapotranspiration efficiency, and drought susceptibility index. Crop Sci. 51, 1198–1204. doi: 10.2135/cropsci2010.05.0243
Sime, G., and Aune, J. B. (2014). Maize response to fertilizer dosing at three sites in the central Rift Valley of Ethiopia. Agronomy 4, 436–451. doi: 10.3390/agronomy4030436
Sinclair, T. R., and Rufty, T. W. (2012). Nitrogen and water resources commonly limit crop yield increases, not necessarily plant genetics. Glob. Food Sec. 1, 94–98. doi: 10.1016/j.gfs.2012.07.001
Spiertz, J. (2009). Nitrogen, Sustainable Agriculture and Food Security: A Review. In: Lichtfouse, E., Navarrete, M., Debaeke, P., Véronique, S., Alberola, C. (eds) Sustainable Agriculture. Springer, Dordrecht. 635–651. doi: 10.1007/978-90-481-2666-8_39
Swanson, B. E., and Rajalahti, R., (2010). Strengthening Agricultural Extension and Advisory Systems: Procedures for Assessing, Transforming, and Evaluating Extension Systems. Agriculture and Rural Development Discussion Paper 45, The International Bank for Reconstruction and Development/The World Bank, Washington DC.
Tesfaye, M., and Tessema, L. (2023). An overview of the status, productivity and determinants of improved forage technology adoption in Ethiopia: a review. CABI Agric. Biosci. 4:47. doi: 10.1186/s43170-023-00189-9
Tessema, Z., and Alemayehu, M. (2010). Management of napier grass (Pennisetum Purpureum (L.) Schumach) for high yield and nutritional quality in Ethiopia: a review. Ethiop. J. Anim. Prod. 10, 73–94.
Tilahun, S. A., Yilak, D. L., Schmitter, P., Zimale, F. A., Langan, S., Barron, J., et al. (2020). Establishing irrigation potential of a hillside aquifer in the African highlands. Hydrol. Process. 34, 1741–1753. doi: 10.1002/hyp.13659
Ul-Allah, S., Khan, A. A., Fricke, T., Buerkert, A., and Wachendorf, M. (2015). Effect of fertiliser and irrigation on forage yield and irrigation water use efficiency in semi-arid regions of Pakistan. Exp. Agric. 51, 485–500. doi: 10.1017/S001447971400043X
Wang, Y., Janz, B., Engedal, T., and de Neergaard, A. (2017). Effect of irrigation regimes and nitrogen rates on water use efficiency and nitrogen uptake in maize. Agric. Water Manag. 179, 271–276. doi: 10.1016/j.agwat.2016.06.007
Wang, X., Liu, M., Ciampitti, I. A., Cui, J., Fang, K., Zhao, S., et al. (2024). Benefits and trade-offs of replacing inorganic fertilizer by organic substrate in crop production: a global meta-analysis. Sci. Total Environ. 925:171781. doi: 10.1016/j.scitotenv.2024.171781
Worqlul, A. W., Dile, Y. T., Bezabih, M., Adie, A., Srinivasan, R., Lefore, N., et al. (2022). Identification of suitable areas for fodder production in Ethiopia. Catena 213:106154. doi: 10.1016/j.catena.2022.106154
Ye, Y., Liang, X., Chen, Y., Liu, J., Gu, J., Guo, R., et al. (2013). Alternate wetting and drying irrigation and controlled-release nitrogen fertilizer in late-season rice. Effects on dry matter accumulation, yield, water and nitrogen use. Field Crop Res. 144, 212–224. doi: 10.1016/j.fcr.2012.12.003
Yimam, A. Y., Assefa, T. T., Adane, N. F., Tilahun, S. A., Jha, M. K., and Reyes, M. R. (2020). Experimental evaluation for the impacts of conservation agriculture with drip irrigation on crop coefficient and soil properties in the sub-humid Ethiopian highlands. Water 12:947. doi: 10.3390/w12040947
Zhang, Y., Kendy, E., Qiang, Y., Changming, L., Yanjun, S., and Hongyong, S. (2004). Effect of soil water deficit on evapotranspiration, crop yield, and water use efficiency in the North China plain. Agric. Water Manag. 64, 107–122. doi: 10.1016/S0378-3774(03)00201-4
Zhou, J.-B., Wang, C.-Y., Zhang, H., Dong, F., Zheng, X.-F., Gale, W., et al. (2011). Effect of water saving management practices and nitrogen fertilizer rate on crop yield and water use efficiency in a winter wheat–summer maize cropping system. Field Crop Res. 122, 157–163. doi: 10.1016/j.fcr.2011.03.009
Keywords: animal forage, deficit irrigation, full irrigation, water use efficiency, fertilizer response, livestock water productivity
Citation: Hussein MA, Haileslassie A, Derseh MB, Assefa TT, Riga FT, Adie A, Tebeje AK, Jones CS and Tilahun SA (2024) Enhancing irrigated forage crop production through water and nutrient management in the Ethiopian sub-humid highlands. Front. Sustain. Food Syst. 8:1373698. doi: 10.3389/fsufs.2024.1373698
Edited by:
Mesfin Mergia Mekonnen, University of Alabama, United StatesReviewed by:
Nazir Ahmad Khan, University of Agriculture, Peshawar, PakistanBirhanu Zemadim Birhanu, International Water Management Institute (IWMI), Ghana
Mulatu Berihun, University of Florida, United States
Copyright © 2024 Hussein, Haileslassie, Derseh, Assefa, Riga, Adie, Tebeje, Jones and Tilahun. This is an open-access article distributed under the terms of the Creative Commons Attribution License (CC BY). The use, distribution or reproduction in other forums is permitted, provided the original author(s) and the copyright owner(s) are credited and that the original publication in this journal is cited, in accordance with accepted academic practice. No use, distribution or reproduction is permitted which does not comply with these terms.
*Correspondence: Seifu A. Tilahun, cy50aWxhaHVuQGNnaWFyLm9yZw==