 M. K. Prabhadharshini
 M. Anand
 G. Amuthaselvi2
- 1Department of Vegetable Science, HC&RI, TNAU, Coimbatore, India
- 2Department of Food Process Engineering, TNAU, Coimbatore, India
- 3HC&RI, TNAU, Coimbatore, India
The cultivation of green leafy vegetables is crucial for improving our nation’s nutritional security. Challenges like limited arable land and excessive fertilizer use have become significant concerns on cultivating in open field. To address these issues, vertical farming technology, with a focus on space optimization and hydroponic integration to manage fertilizer use, is gaining attention. This experiment aims to determine the best growing media and nutrient solutions for palak in an A-framed vertical unit. Three growing media were tested: coir pith (M0), Rockwool (M1), and a 1:1 mix of coir pith and vermiculite (M2). Various combinations of water-soluble fertilizers [Ca (NO3)2, MAP, and SOP] were used for each crop’s nutrient recipe preparation. Optimal yields were achieved when palak were grown in a coir pith and vermiculite mix with nutrient concentrations of 60:50:60 ppm. Despite high yields, green leafy vegetables face rapid spoilage and storage challenges. The study examined factors affecting post-harvest quality, including storage conditions (ambient at 35 ± 5°C, refrigerated at 5 ± 5°C), packing substrates (low-density polyethylene, high-density polyethylene covers), and gas compositions with modified atmosphere packaging. Results showed that refrigerated storage with low-density polyethylene packing and a gas composition of 6% O2, 5% CO2, and 89% N2 (G2) resulted in the least deterioration in physiological attributes and overall visual quality. This study highlights the potential of vertical farming technology, precise nutrient management, and advanced post-harvest techniques for sustainable production and preservation of green leafy vegetables to meet our nation’s nutritional security needs.
1 Introduction
The surge in interest and demand for the consumption of green leafy vegetables has garnered considerable attention in recent times. This increased focus is primarily attributed to India’s persistent nutritional requirements, notwithstanding significant developmental advancements. However, the sustainable fulfillment of these nutritional needs faces challenges due to concurrent population growth and the diminishing availability of arable land. Noticeable declines in soil productivity and fertility, coupled with a reduction in per capita land allocation, underscore these challenges (Lambin, 2012; Lal, 2015; Lehman et al., 2015).
To address the aforementioned soil-related challenges, a viable solution lies in the adoption of soilless cultivation methodologies (Ahmed et al., 2021). Furthermore, the global population is projected to reach 8.9 billion by 2050, necessitating a 50% increase in food production. However, obtaining additional arable land to meet this demand is increasingly impractical, due to a noted decrease in cropland area in significant countries such as the United States (−15%) and Russia (−8%) (FAO, 2021). Conversely, in India and China, the cropland area has remained relatively stable or exhibited minimal fluctuations during a study from the period of 1990 to 2019. In the context of Indian agriculture, vertical farming emerges as a promising cultivation method (Davis et al., 2016; Naskoori et al., 2021; Mir et al., 2022). This precision agriculture technology facilitates controlled management of nutrients and water, with sustainability as its primary objective. Research by Cıceklı and Barlas (2014) suggests that one acre of vertical farming can yield the equivalent of 4–6 acres of conventional cultivation, optimizing land utilization.
Leafy vegetables, such as palak, hold significant promise for cultivation within the realm of vertical farming coupled with hydroponics, as highlighted by Velazquez-Gonzalez et al. (2022). These nutritionally rich greens have diverse growth requirements that necessitate meticulous attention (Albadwawi et al., 2022). Establishing appropriate growing media and nutrient profiles not only forms the foundation but also unlocks the potential to cultivate a variety of leafy vegetables using this innovative methodology (Alneyadi et al., 2024).
Despite notable advancements in cultivation techniques, the transpiration process remains a critical factor for leafy vegetables. Furthermore, despite high yields, a significant 30% of India’s fruits and vegetables (equivalent to 40 million tons, valued at around US$ 13 billion) go to waste annually due to cold chain issues, including infrastructure, storage, proximity to farms, and transportation (Maheshwar and Chanakwa, 2006). For instance, lettuce has a maximum allowable water loss of 3% (Paull, 1999; Agüero et al., 2011).
This study has been meticulously designed to comprehensively explore these potentials. Specifically, it involves the rigorous testing of three distinct nutrient combinations for the growth of palak, all in conjunction with three different growth substrates. Additionally, we have investigated influential factors that impact the preservation of the shelf life of this lush green leafy vegetable. Thus, this study is undertaken to enhance the quality of palak cultivation and extend the longevity of the cultivated produce.
2 Materials and methods
2.1 Media and nutrient standardization
The research on the influence of media and nutrient performance on palak growth was carried out at the vertical unit situated in the university orchard of the Department of Vegetable Science, Horticulture College and Research Institute, TNAU, Coimbatore, spanning the academic year from 2022 to 2023. This study took place within an A-framed vertical structure, comprising approximately five pipes on each side, totaling 10 pipes. Each pipe accommodated a spacing plan of 40 plants at 15 cm intervals. The system functioned under non-circulating conditions, facilitating the implementation of diverse nutrient compositions within each pipe. This configuration offered an experimental setting to examine the impact of different nutrient solutions on the growth and development of palak. Once weekly, the entire water content of the unit was drained, and fresh water (RO water) was introduced into the pipes, followed by the application of nutrient solution, divided according to the respective treatments. Initially, the pH and EC of the nutrient solution were adjusted to desired levels. Subsequently, fluctuations in these chemical parameters were monitored throughout the week.
2.1.1 Growing media
In the course of this inquiry, three distinct substrates were utilized: coir pith, Rockwool, and vermiculite. The physical characteristics of these growing media underwent thorough evaluation employing established methodologies outlined by Verdonck and Gabriels (1992), Pire and Pereira (2003), and Caso et al. (2008). Calculations for each property were conducted using specific formulas tailored to individual characteristics, as detailed in the respective references. The corresponding formulas employed for the comprehensive study of the physical parameters are provided in Table 1.
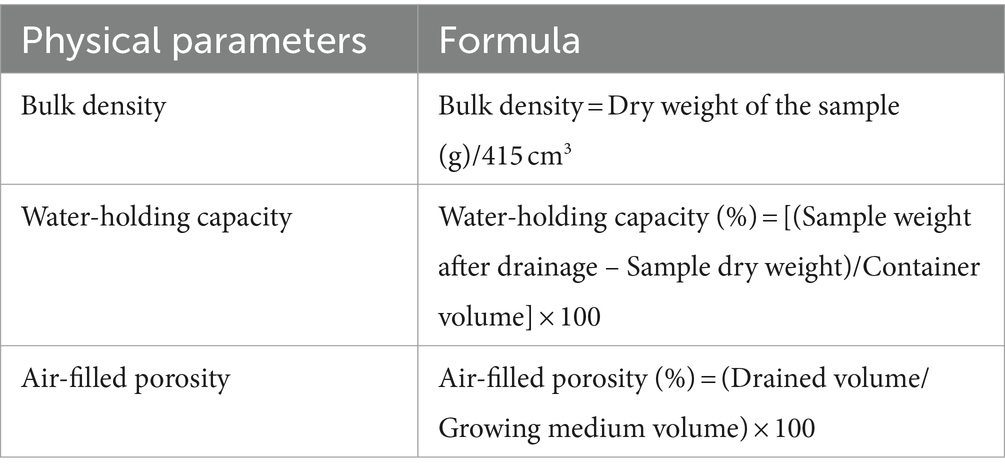
Table 1. Parameters used to estimate the physical and chemical characters of the media.
The chemical parameters, specifically pH and electrical conductivity (EC), of the growing media underwent thorough analysis. For pH determination, a 10 g sample was meticulously diluted in 50 mL of distilled water, agitated for 30 min, and left undisturbed for 24 h. The resulting filtered mixture was then precisely measured using a pH meter. In the case of electrical conductivity (EC) determination, a 40 g sample was carefully mixed with 80 mL of distilled water, subjected to agitation for 15 min, and allowed to stand undisturbed for 60 min. Subsequently, the filtered mixture was accurately measured utilizing an EC meter. These rigorous and meticulous procedures were implemented to ensure the precision of measurements for both pH and EC, as they serve as critical indicators of growing media quality and nutrient availability.
2.1.2 Nutrient solution
In this investigation, nutrient sources from Indian Farm Forestry Development Cooperative (IFFCO), namely Ca(NO3)2, Monoammonium phosphate (MAP), and Potassium sulfate (SOP), were employed to supply essential nutrients to the crops. The composition of these nutrient sources was carefully tailored for each crop treatment. Precisely measured quantities of fertilizers were individually diluted with purified R.O. water. After a 15-min period to ensure complete dissolution, the resulting nutrient solutions were thoughtfully combined into a single reservoir.
Before dilution, the pH, electrical conductivity (EC), and total dissolved solids (TDS) of R.O. water were meticulously measured. Once the fertilizer was appropriately diluted to achieve the desired concentration, pH, EC, and TDS parameters were retested in the diluted solution after a 30-min interval. This detailed procedure ensured the accurate monitoring of pH, EC, and TDS levels, optimizing nutrient delivery to the plants. Portable pH and EC meters, specifically the KONVIO Digital pocket Pen Type pH meter and TDS&EC meter, were employed for these measurements.
In accordance with the FCRD design, treatments were formulated by maintaining two factors (Media-M and Nutrient solution-N) as detailed in Table 2. Each treatment was replicated three times to ensure robustness and reliability in the experimental outcomes.
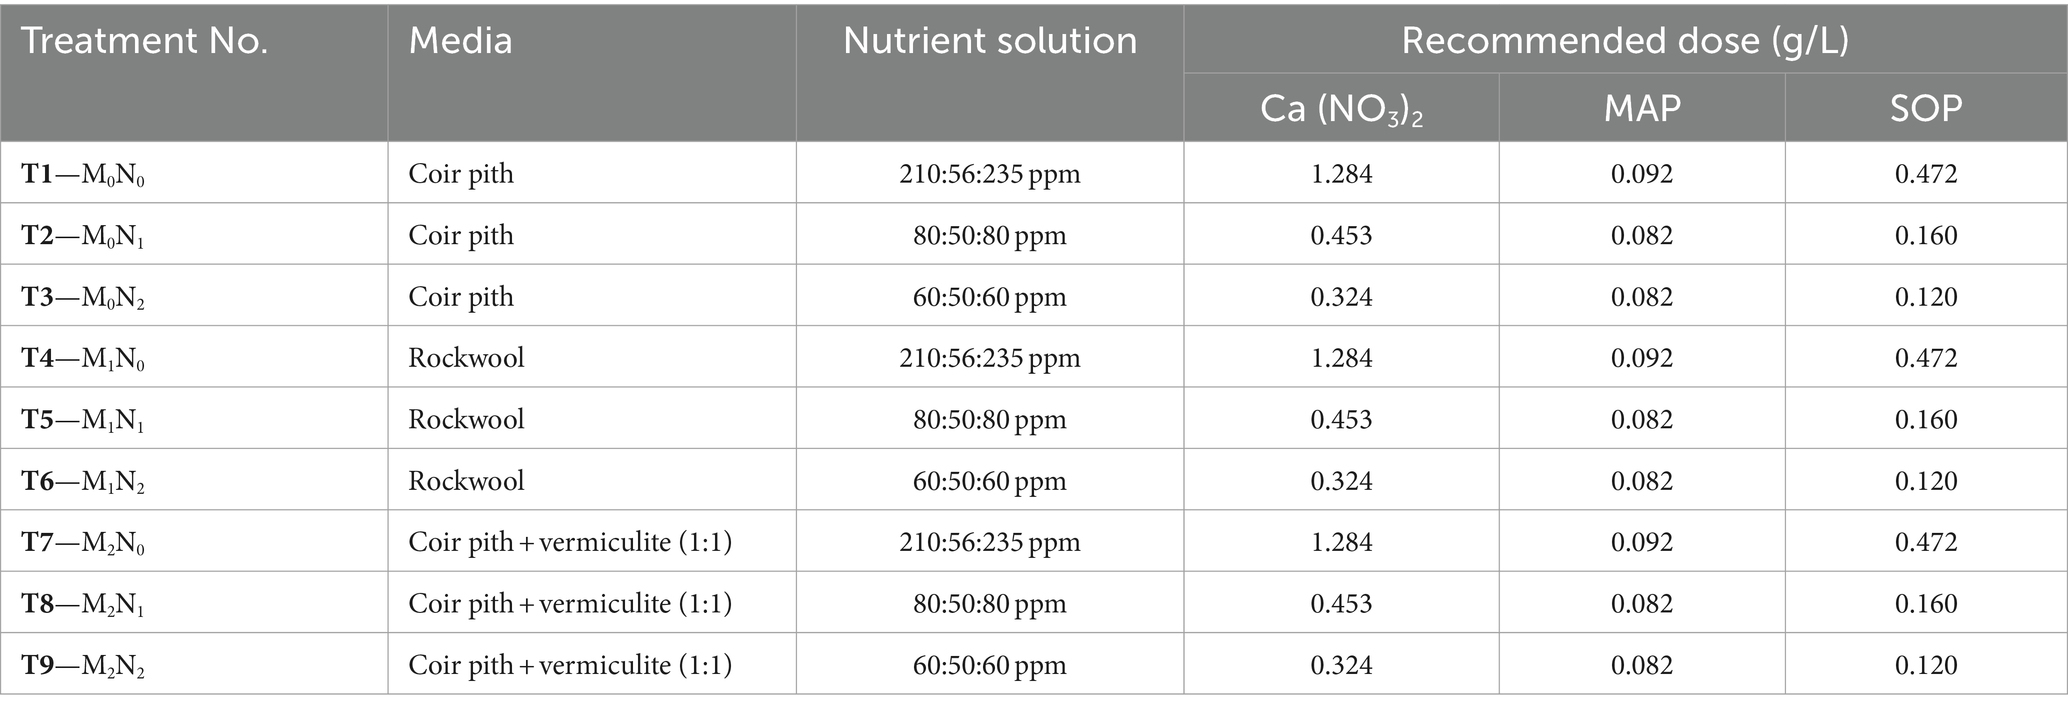
Table 2. Media and nutrient combinations for Palak hydroponic cultivation.
2.1.3 Parameters studied
Palak plants underwent meticulous assessments at two crucial time points—specifically, the 15th and 25th days following the initiation of treatment. A comprehensive array of response variables was rigorously measured to elucidate the growth, development, and physiological aspects of the palak plants. These variables encompassed plant height (cm), number of leaves, yield (g/plant), leaf area index (LAI), leaf area ratio (LAR), leaf area duration (LAD), specific leaf area (SLA), root length (cm), root fresh weight (g), root dry weight (g), shoot length (cm), shoot fresh weight (g), shoot dry weight (g), and leaf chlorophyll content. The determination of chlorophyll content adhered to the Wellburn (1994) technique.
2.2 Modified atmosphere packing
The packaging experiment was conducted at the Department of Food Processing and Engineering, Tamil Nadu Agricultural University. The harvested botanical specimens from the vertical farm underwent a rigorous aqueous washing process for thorough cleansing, adhering to Adams et al. (1989) guidelines. Post-purification, meticulous ablution with a delicate cloth ensured the elimination of residual impurities from the verdant foliage. Precise 250-gram masses of the green leafy vegetables were then thoughtfully allocated for packaging in designated encasements. Scientific rigor was maintained through an intricate Factorial Completely Randomized Design (FCRD) framework, encompassing 12 distinct treatment regimens, each replicated three times for every treatment. Specially crafted encasements made from Low-Density Polyethylene (LDPE) and High-Density Polyethylene (HDPE) with dimensions of 10 × 12 inches and a standardized 100-micron thickness were employed to safeguard the produce. Table 3 illustrates the treatment combinations, emphasizing the systematic and controlled nature of the experimental design.
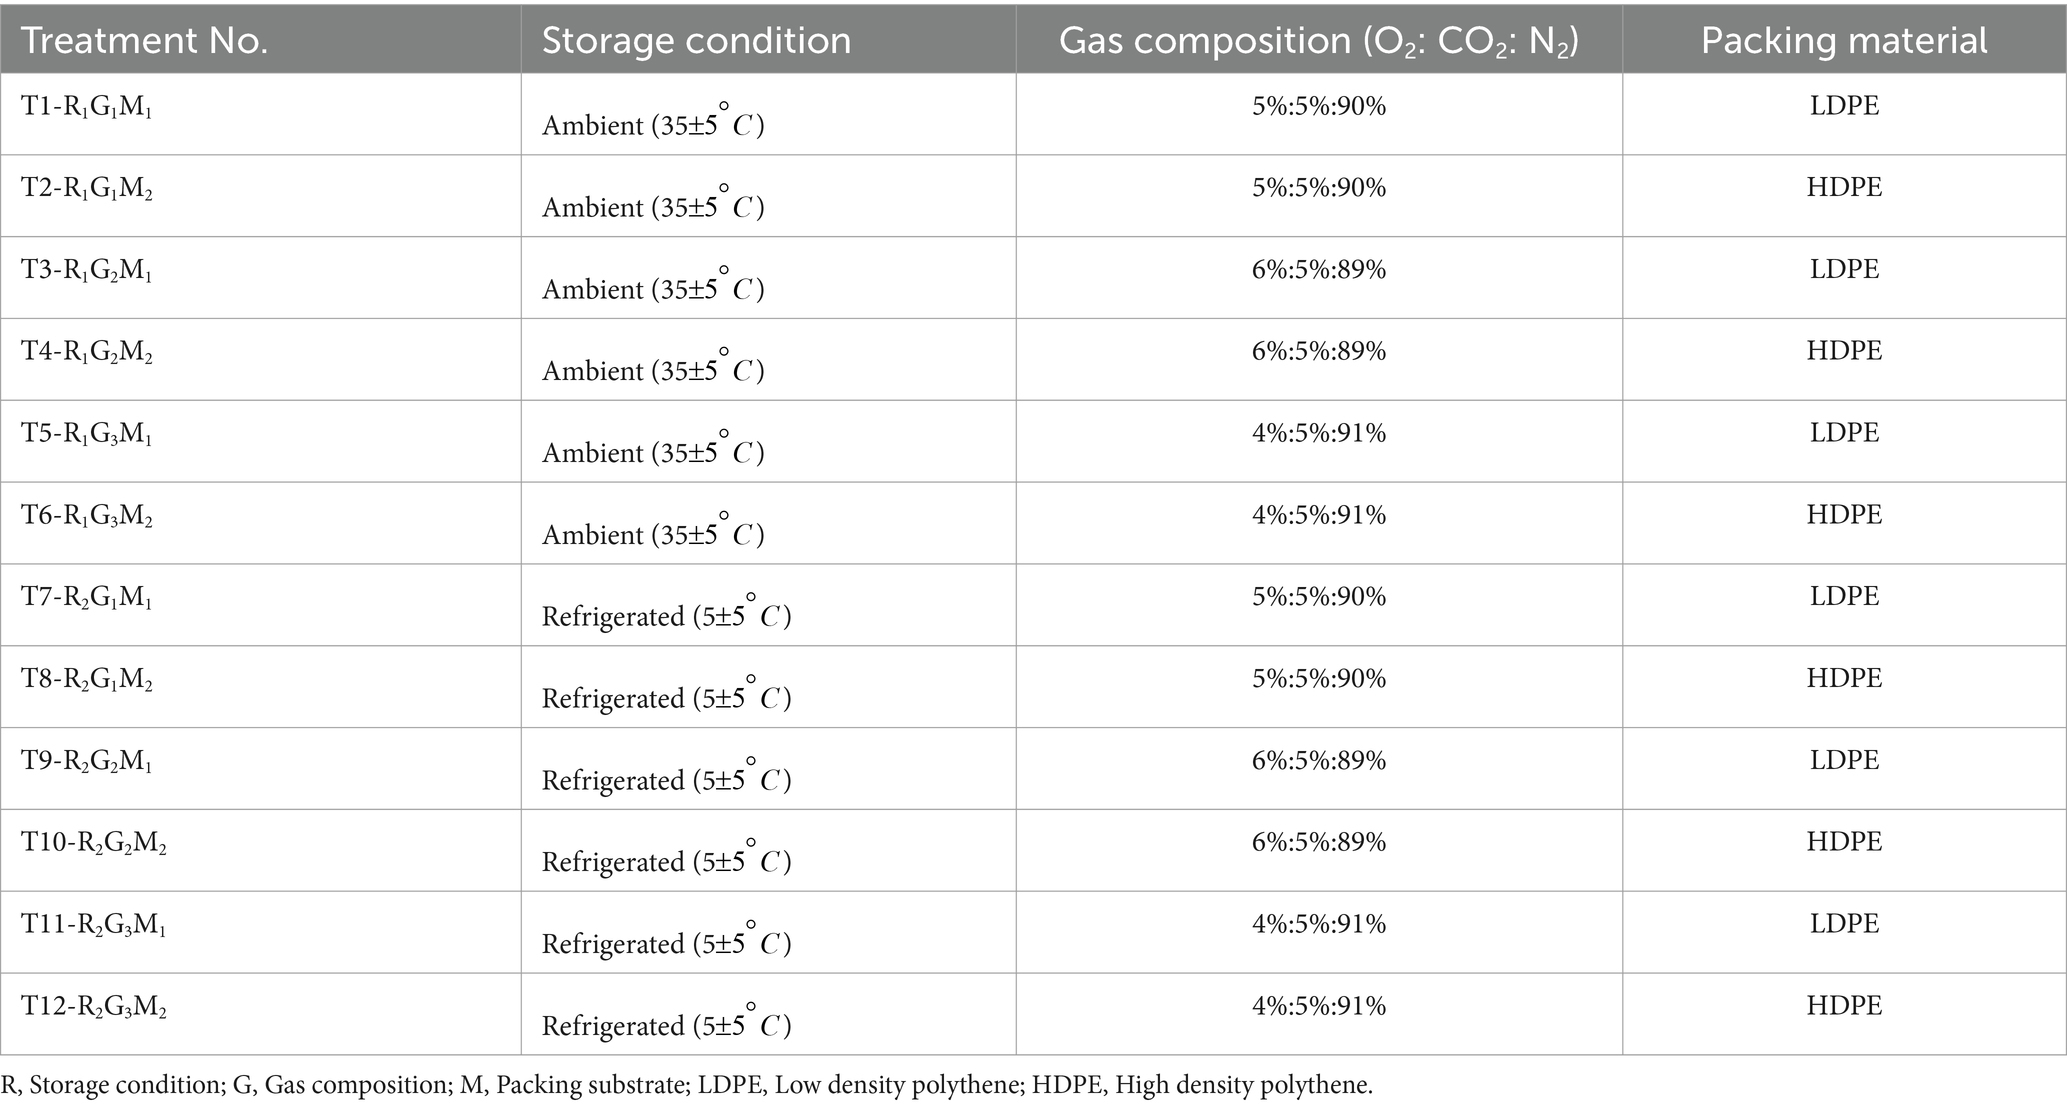
Table 3. Treatment protocol for enhancing postharvest preservation in palak:
The experimental setup involved daily measurements to monitor physiological weight loss, providing continuous assessment, while other factors like moisture loss, firmness, and quality ranking were evaluated at the spoilage period’s conclusion. This methodological approach allowed for nuanced examination of daily weight fluctuations and captured conclusive outcomes for additional parameters, offering a comprehensive understanding of variables throughout the entire experimental duration.
2.2.1 Instrumentation detail and principle
Gas mixing was conducted using a gas mixing unit (MAP mix 8000 EL, PBI Dansensor). This unit comprises gas cylinders for oxygen (black), carbon dioxide (red), and nitrogen (blue), as well as a MAP mix and a buffer or storage tank. Each gas cylinder, containing the required gases, is connected to the gas mixer via separate tubes. The gas mixer maintains a pressure of eight bars, while the storage container is kept at four bars. Initially, the valves of the flow meter were closed. The desired gas composition was set by adjusting the CO2, N2, and O2 knobs sequentially. CO2 levels were set first, followed by N2. Gas at four-bar pressure was then transferred from the mixer to the storage tank, which has a capacity of 10 L. Through a common tube, the desired gas composition was flushed and sealed using a vacuum sealing machine. The vacuum packaging machine operates on the principle of creating a vacuum inside the package. After achieving a vacuum, the desired gas mixture from the storage tank is introduced to break the vacuum. The vacuum level of the machine was set at 760 mmHg. In the machine, the desired vacuum level and gas flushing mode were adjusted. For single gas flushing (where the mixed gas was treated as a single gas), the vacuum level in each flush was maintained equal (e.g., 300 mmHg). Heating and cooling times were set based on the type of packaging materials used.
2.2.2 Parameters studied
For the longevity study of palak when packed using modified atmospheric packing, several key parameters were measured, including physiological loss in weight (%), fiberness, moisture loss, and quality ranking (Table 4). These parameters were selected to comprehensively evaluate the impact of modified atmospheric packing on the palak’s shelf life, considering both physiological and sensory aspects.
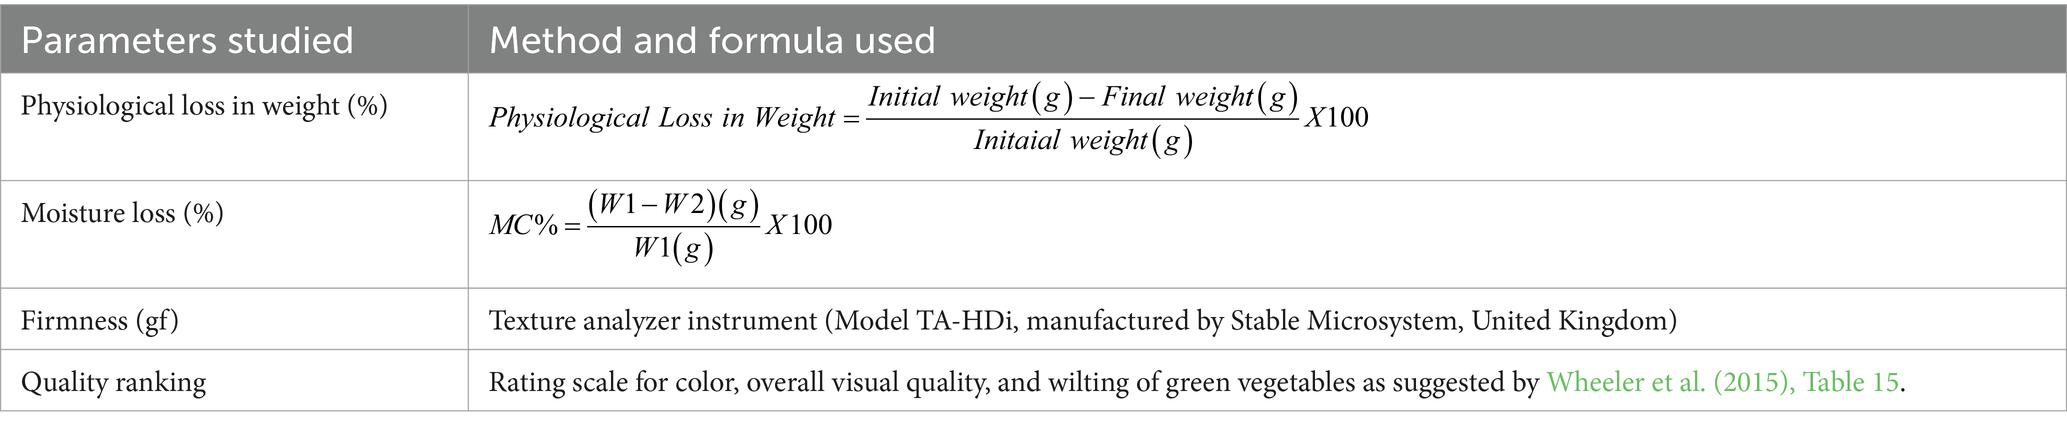
Table 4. Parameter studied to measure the shelf life of palak.
2.3 Statistical analysis
The pooled mean data taken from the study underwent a rigorous process of analysis and interpretation. Initially, Microsoft Excel software was employed for meticulous data processing. Subsequently, to facilitate a more comprehensive and sophisticated examination of the obtained dataset, the statistical software R Studio (agricolae and ggplot2 package) was utilized. To evaluate the significance of the observed differences across various parameters, the ANOVA technique was applied. In this context, a significance level of p = 0.05 was utilized to assess and compare the mean differences between the different treatment groups.
3 Results and discussion
3.1 Physical and chemical properties of the media
Table 5 provides a comprehensive overview of the physical and chemical properties of the growing media. The analysis of bulk density across different growing media reveals that coir pith has the highest density at 0.194 g/cm3, followed by the combination of coir and vermiculite at 0.178 g/cm3, and rock wool at 0.079 g/cm3. In contrast, concerning water-holding capacity and air-filled porosity, the coir pith and vermiculite combination exhibit superior performance with values of 69.4 and 17.1%, respectively. This is closely followed by coir pith alone, which demonstrates values of 57.7% for water-holding capacity and 12.28% for air-filled porosity. On the other hand, rock wool displays values of 41.9% for water-holding capacity and 9.5% for air-filled porosity.
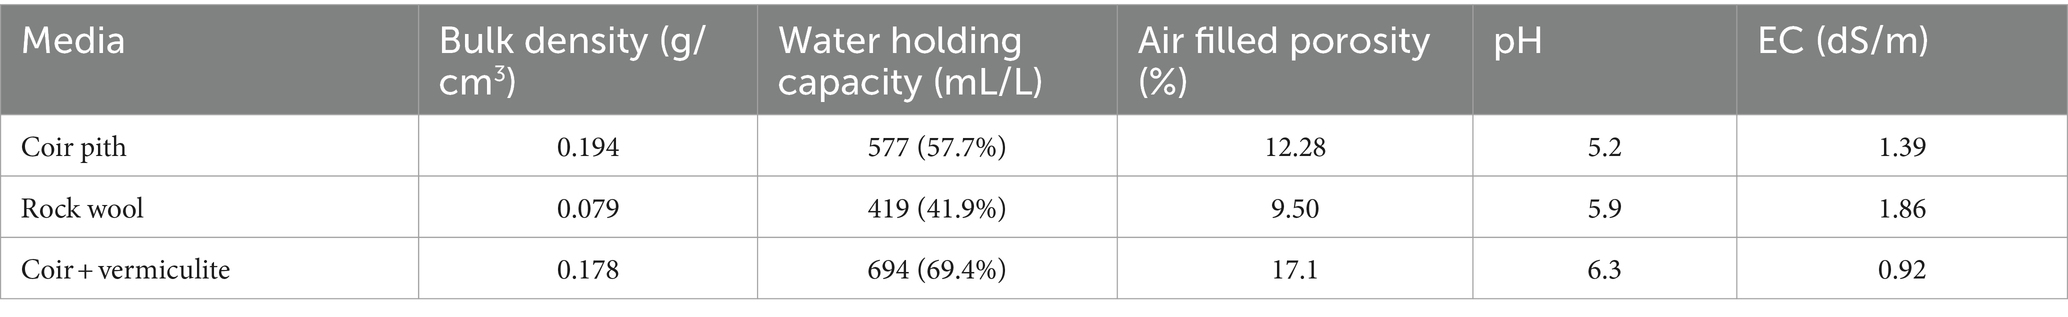
Table 5. Physical and chemical parameters of media.
Regarding pH levels, the coir and vermiculite combination exhibit the highest value at 6.3, followed by rock wool at 5.9, and then coir pith at 5.2. Conversely, the electrical conductivity (EC) value is lowest for the coir pith and vermiculite combination at 0.92 dS/m, followed by coir pith alone at 1.32 dS/m, and then rock wool at 1.86 dS/m. These findings align with the research conducted by Valverde et al. (2013). Additionally, a growing substrate with lower water-holding capacity can potentially hinder plant growth by limiting water availability. This issue is further compounded by restricted root growth, reducing the surface area available for water uptake, as noted by Aghdak et al. (2016).
In a similar context, Kennard et al. (2020) underscore the significance of a growing substrate’s ability to consistently supply water to support crop growth, particularly in Nutrient Film Technique (NFT) systems.
3.2 Chemical properties of the nutrient solution
The pH level plays a pivotal role in shaping the characteristics of the nutrient solution, exerting a significant impact on plant growth, either positively or negatively (Roosta, 2011). Research indicates that as the pH value increases, the uptake of essential micronutrients such as iron, manganese, zinc, and copper, as well as macro-nutrients like phosphorus, can be adversely affected. Conversely, lower pH levels can limit the availability of potassium, sulfur, calcium, and manganese to plants (Marschner, 1995).
Upon a comprehensive analysis of the pH, electrical conductivity (EC), and total dissolved solids (TDS) values for various nutrient solutions collected at weekly intervals, as outlined in Table 6, discernible fluctuations were evident both among different crop varieties and across nutrient combinations within each weekly timeframe. In the analysis of data pertaining to the palak nutrient combination, it is evident that N1 recorded the maximum values across all parameters during the 3rd week, with a pH of 6.3, EC of 0.43 dS/m, and TDS of 275.2 ppm. A similar trend was noted in a study by Whipker et al. (1996), where an increase in pH led to a decrease in leaf area, leaf count, shoot dry weight, and photosynthetic efficiency in lettuce. Additionally, Roosta (2011) found in another study on lettuce that lower pH levels resulted in higher micronutrient concentrations in the crop’s shoots.
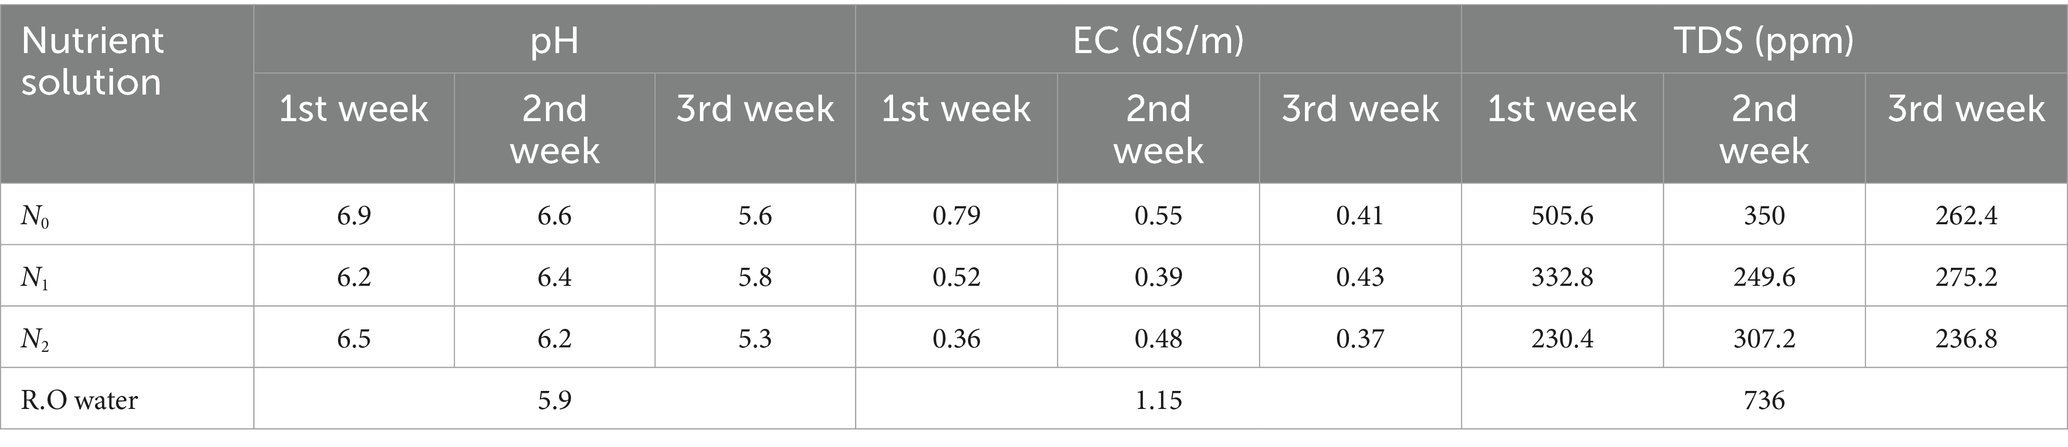
Table 6. Impact of pH and EC across diverse treatment combination of nutrient solution.
Extreme EC values, whether too high or too low, can have detrimental effects on the visual appeal, yield, and phytochemical composition of the produce, resulting in less attractive colors and flavors for consumers. Moreover, such extremes can lead to health concerns due to nitrate accumulation (Yang et al., 2021).
3.3 Growth parameters
The summarized results of the statistical analysis, demonstrating significant differences among all the treatments in palak cultivation for all growth parameters, are presented in Tables 7–11. The analysis revealed that each individual factor contributed equally to the response variable. However, when exploring the interaction effects, variations were observed compared to the effects of individual factors on the response variable. These findings underscore the importance of considering not only individual factors but also their interactions when evaluating and interpreting the outcomes in palak cultivation. The intricate interplay between different factors can have a nuanced impact on the overall response, necessitating a comprehensive understanding for effective cultivation practices and optimal results. Figures 1–3 visually depict the differentiation among the treatments over the palak growth and the graphical representation of the treatment variation is been depicted in Figure 4 (Plant height), Figure 5 (Number of leaves), Figure 6 (Yield), and Figure 7 (Leaf Chlorophyll content, Root length, Shoot length).
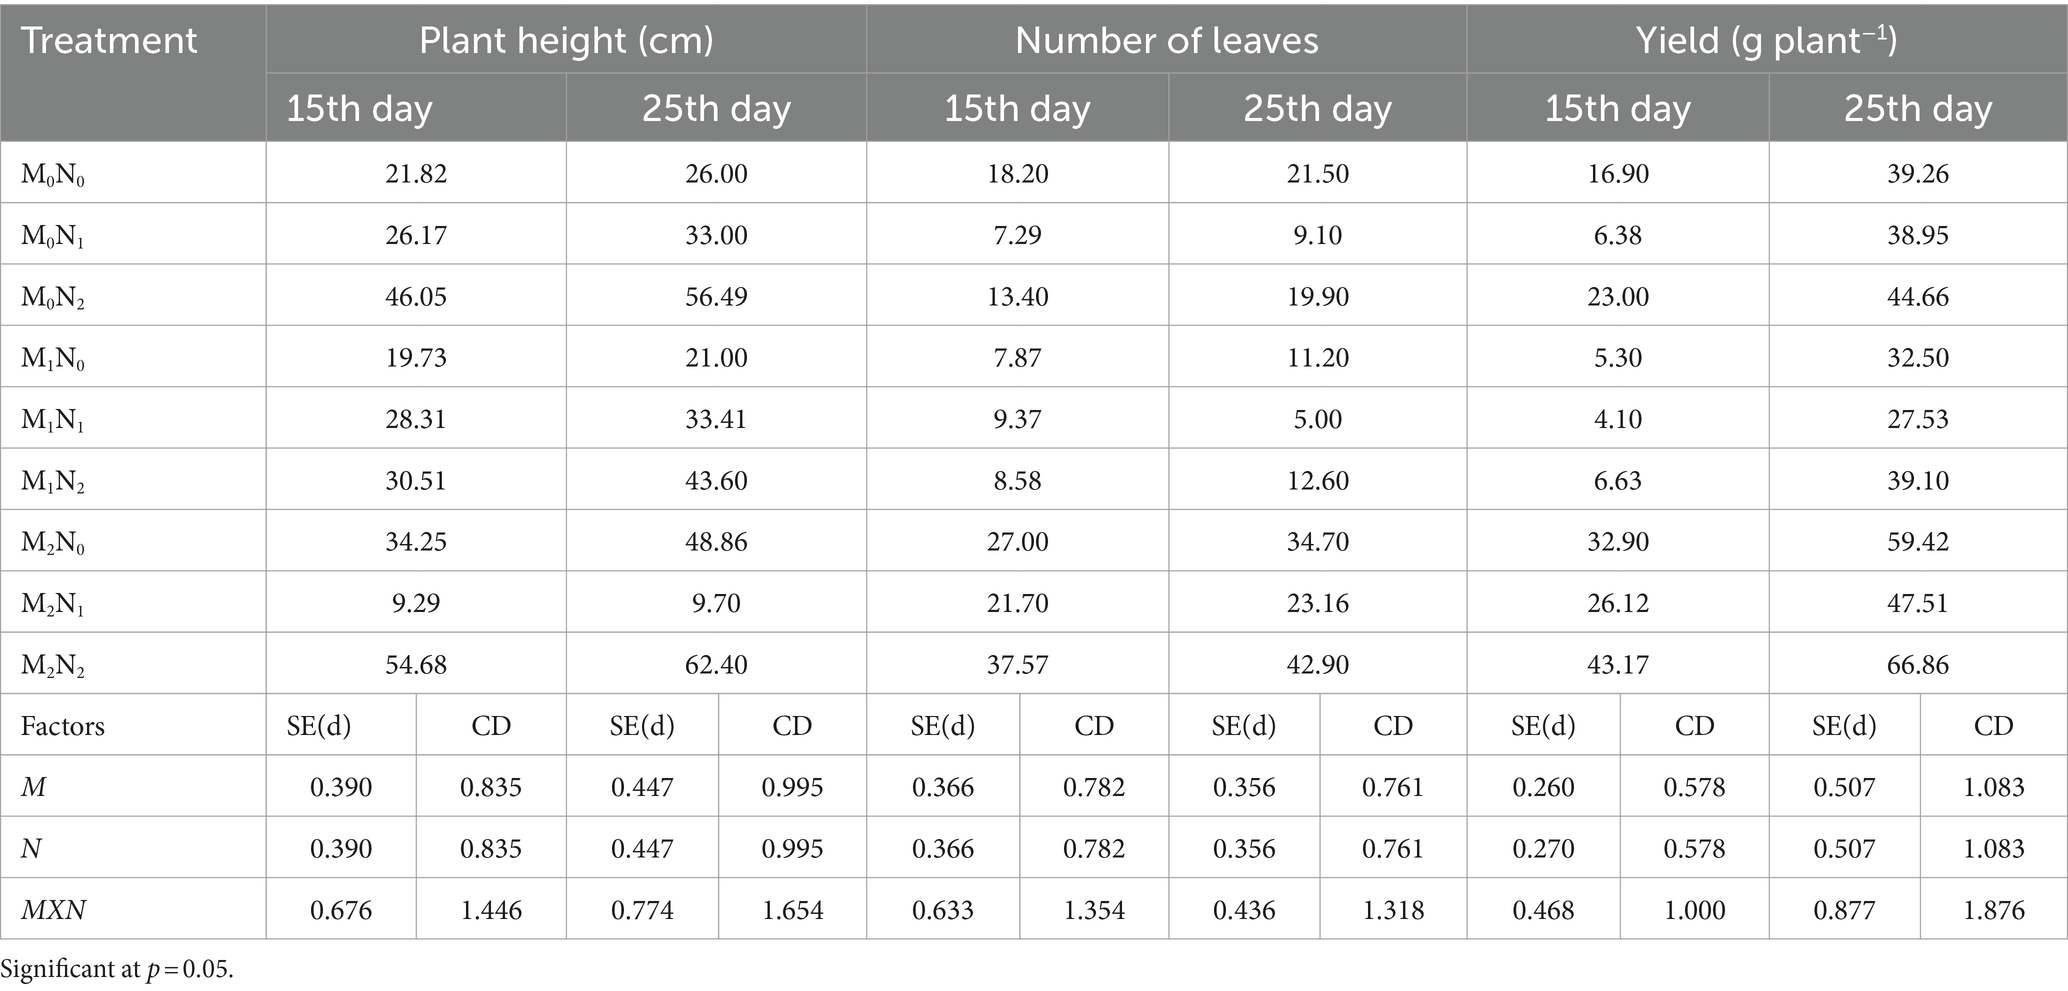
Table 7. Impact of diverse treatment on Plant height (cm), Number of leaves, and yield (g/plant) of palak.
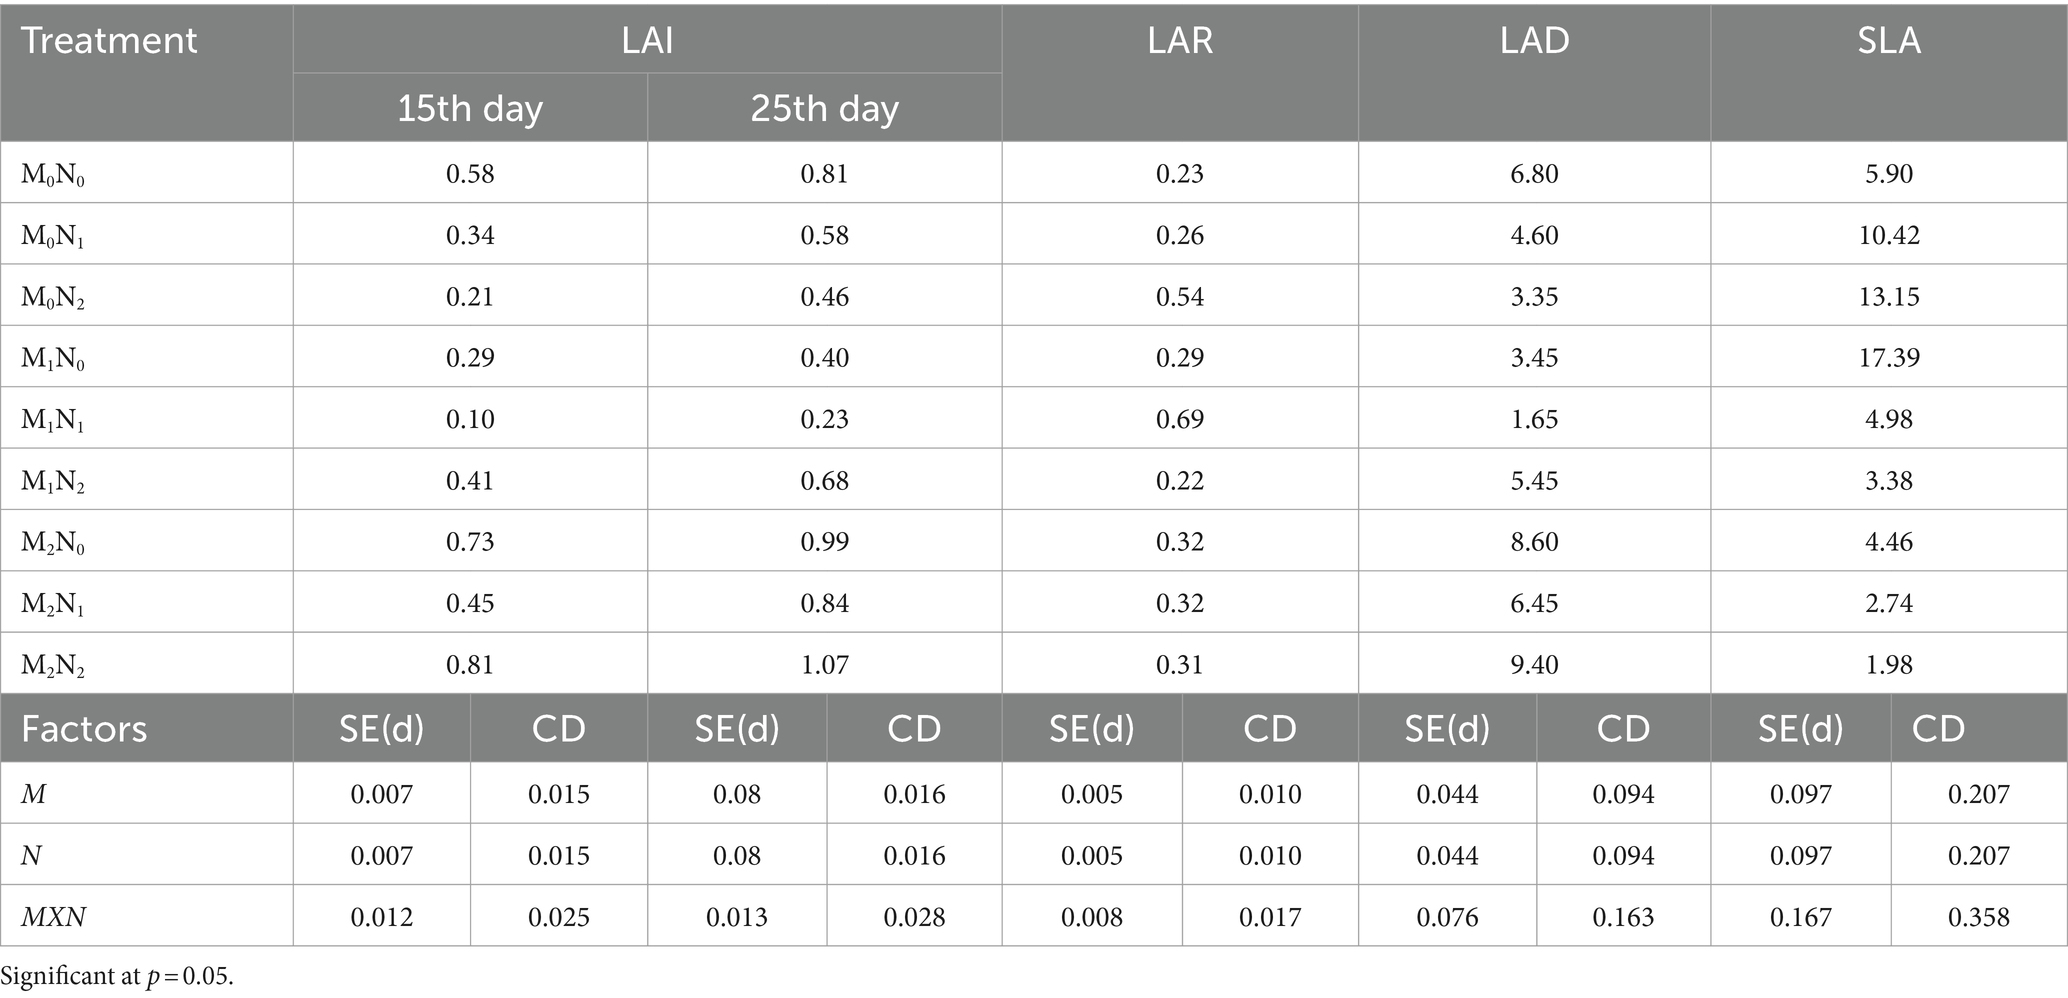
Table 8. Impact of diverse treatment on Leaf Area Index (LAI) (cm−2 g−1), Leaf Area Ratio (LAR), Leaf Area Duration (LAD), and Specific leaf Area (SLA) of palak.
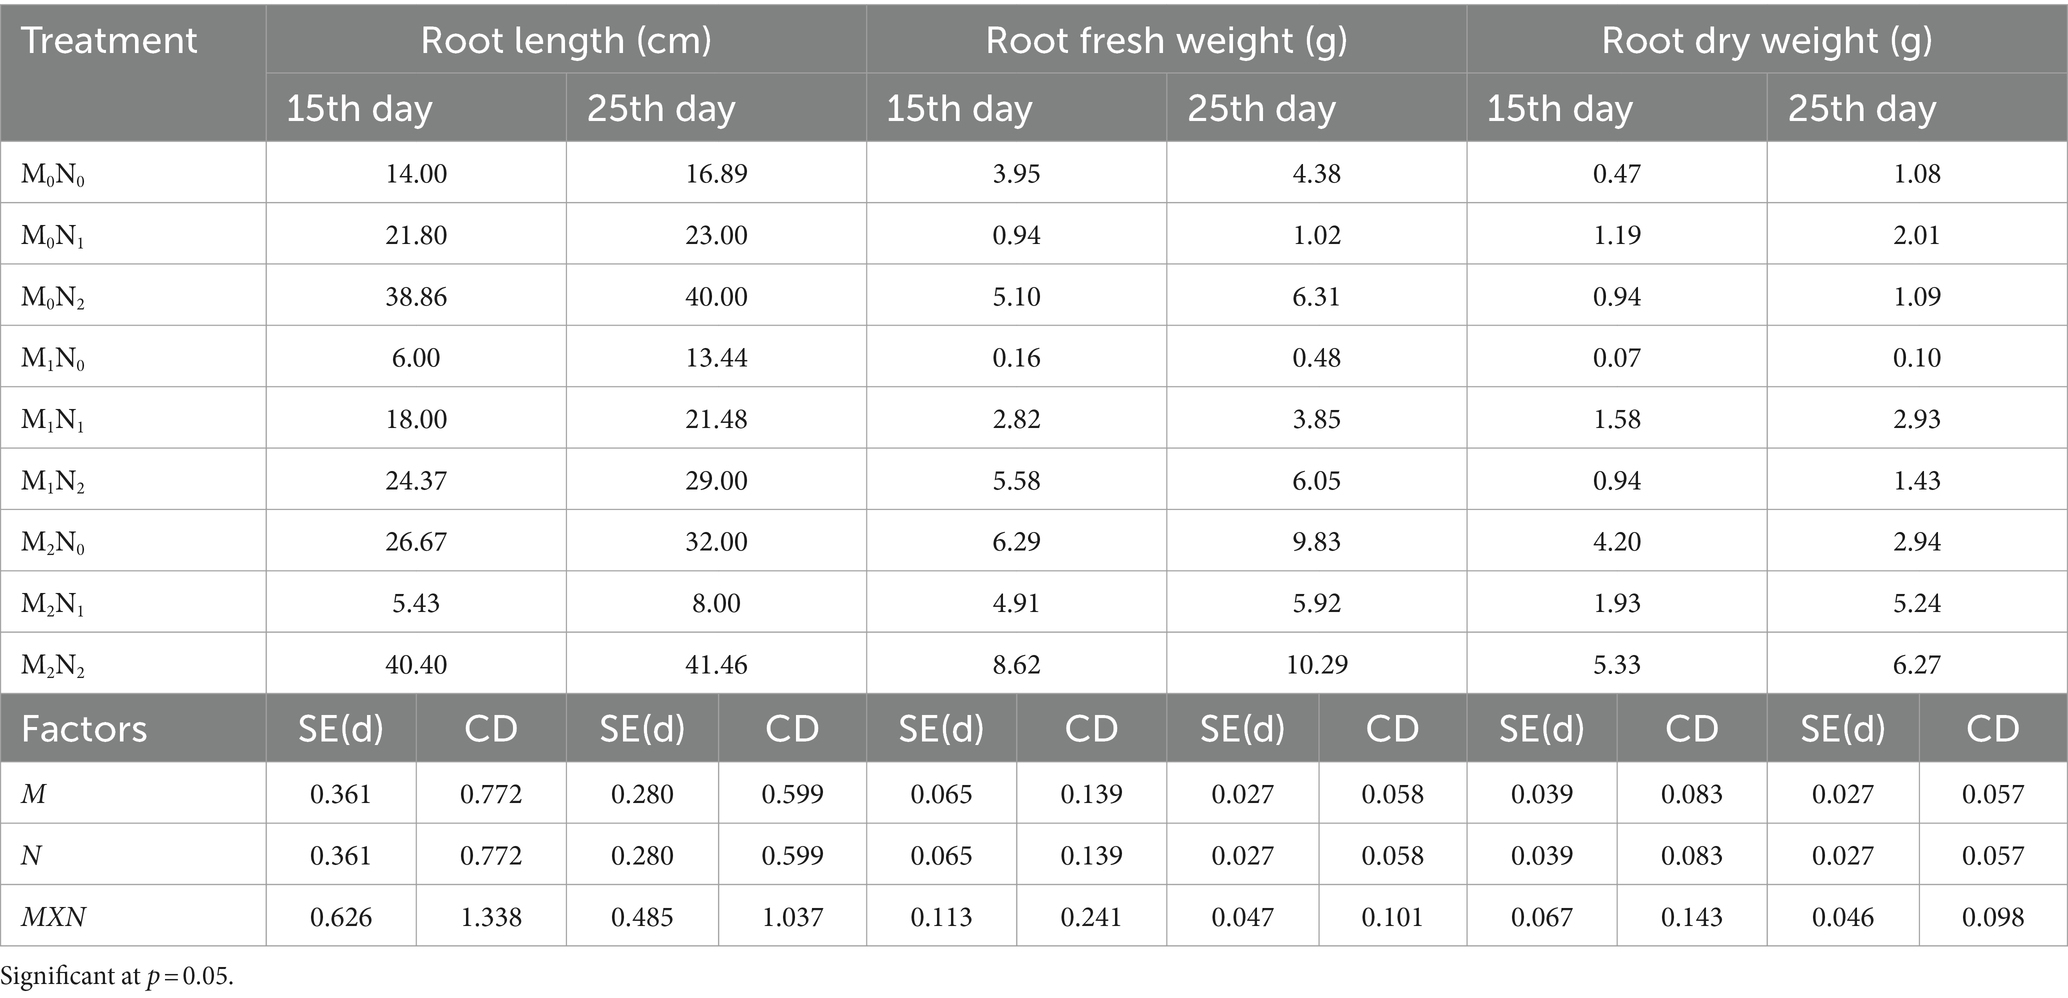
Table 9. Impact of diverse treatment on Root length (cm), Root fresh weight (g), and Root dry weight (g) of palak.
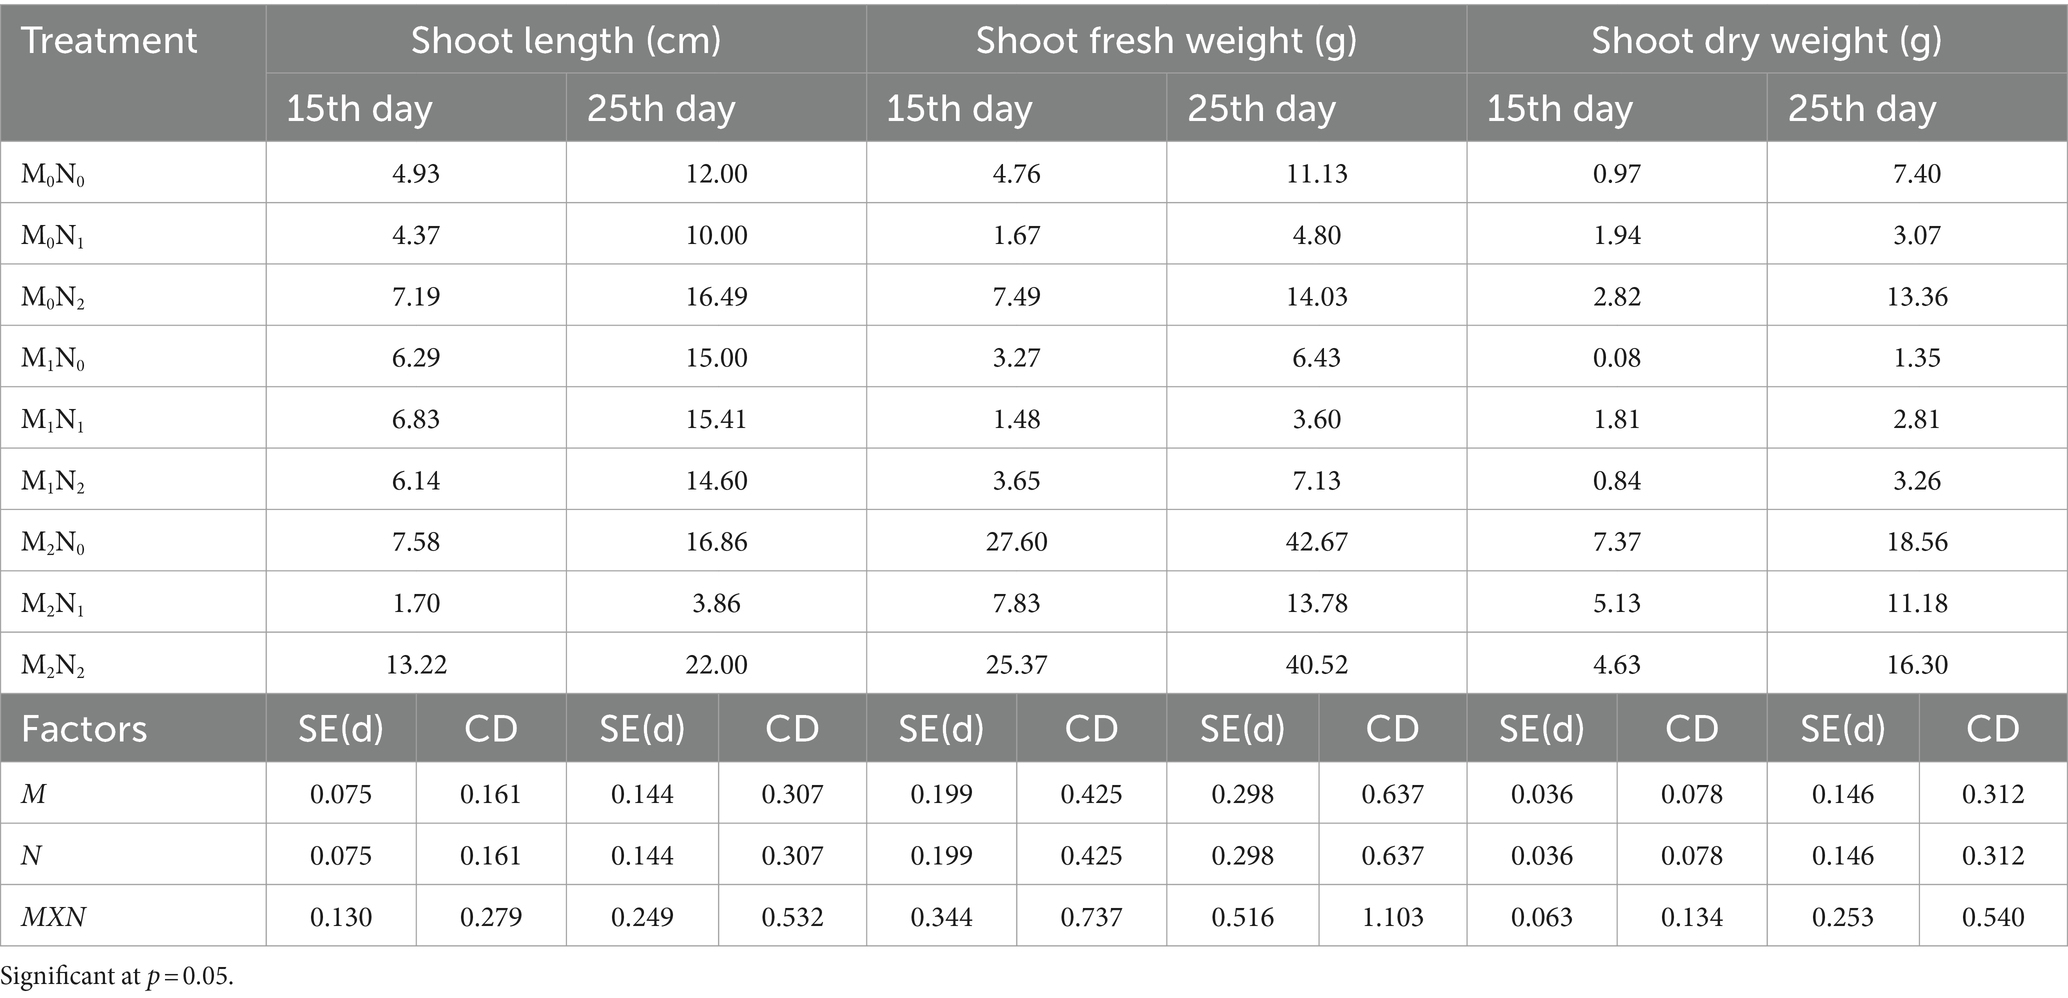
Table 10. Impact of diverse treatment on Shoot length (cm), Shoot fresh weight (g), and Shoot dry weight (g) of palak.
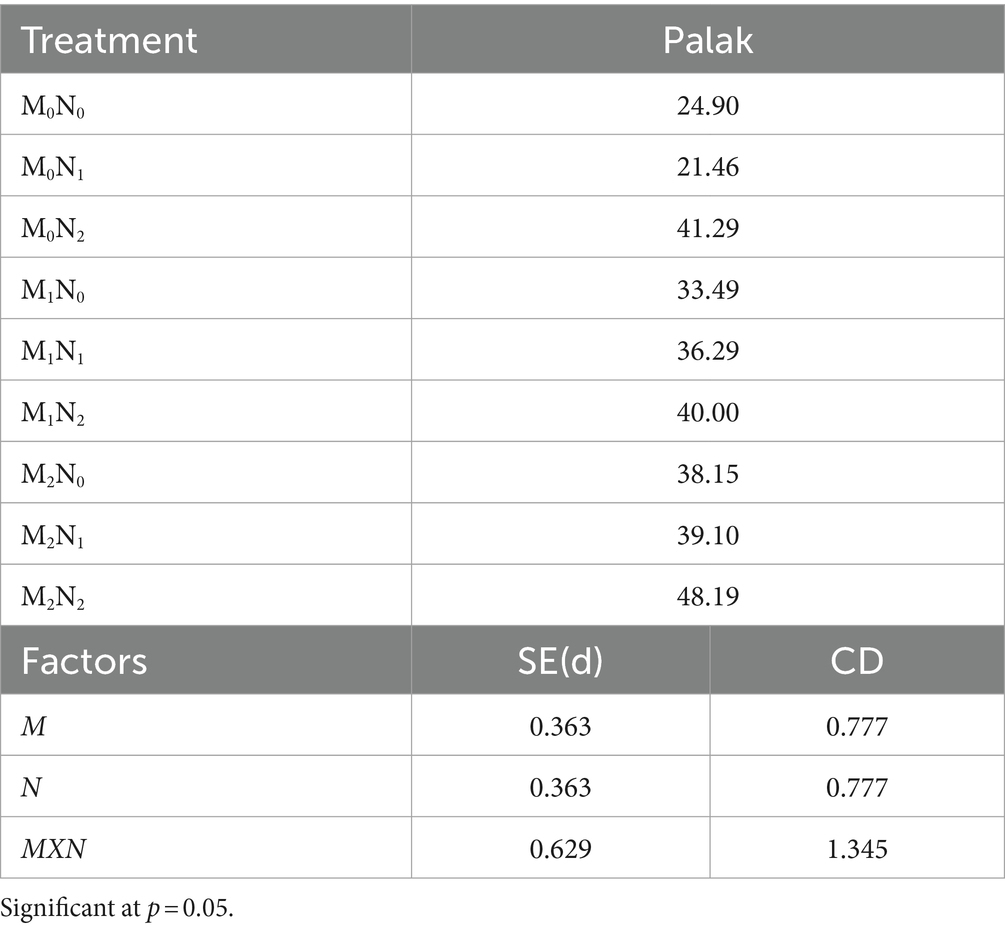
Table 11. Variation in Leaf chlorophyll content under diverse crop treatment on palak.
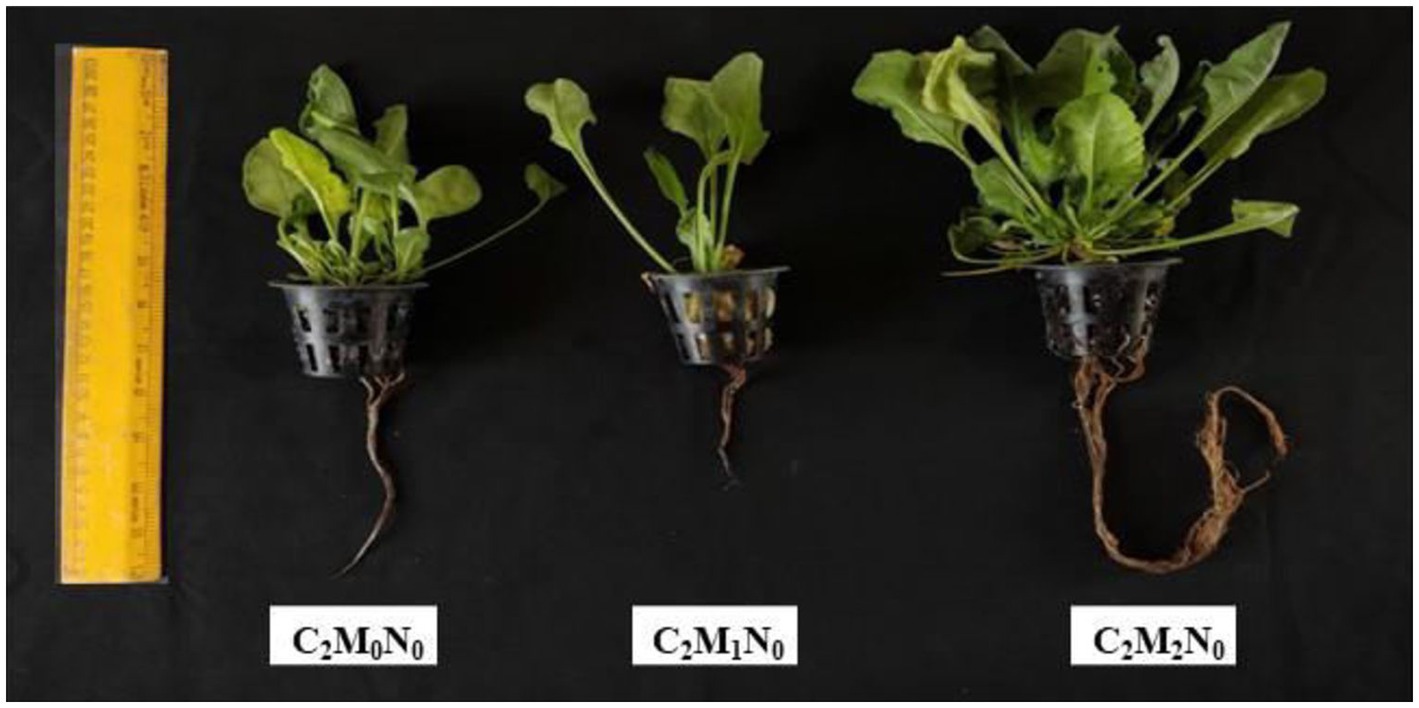
Figure 1. Influence of first nutrient combination (N0) on growth of palak.
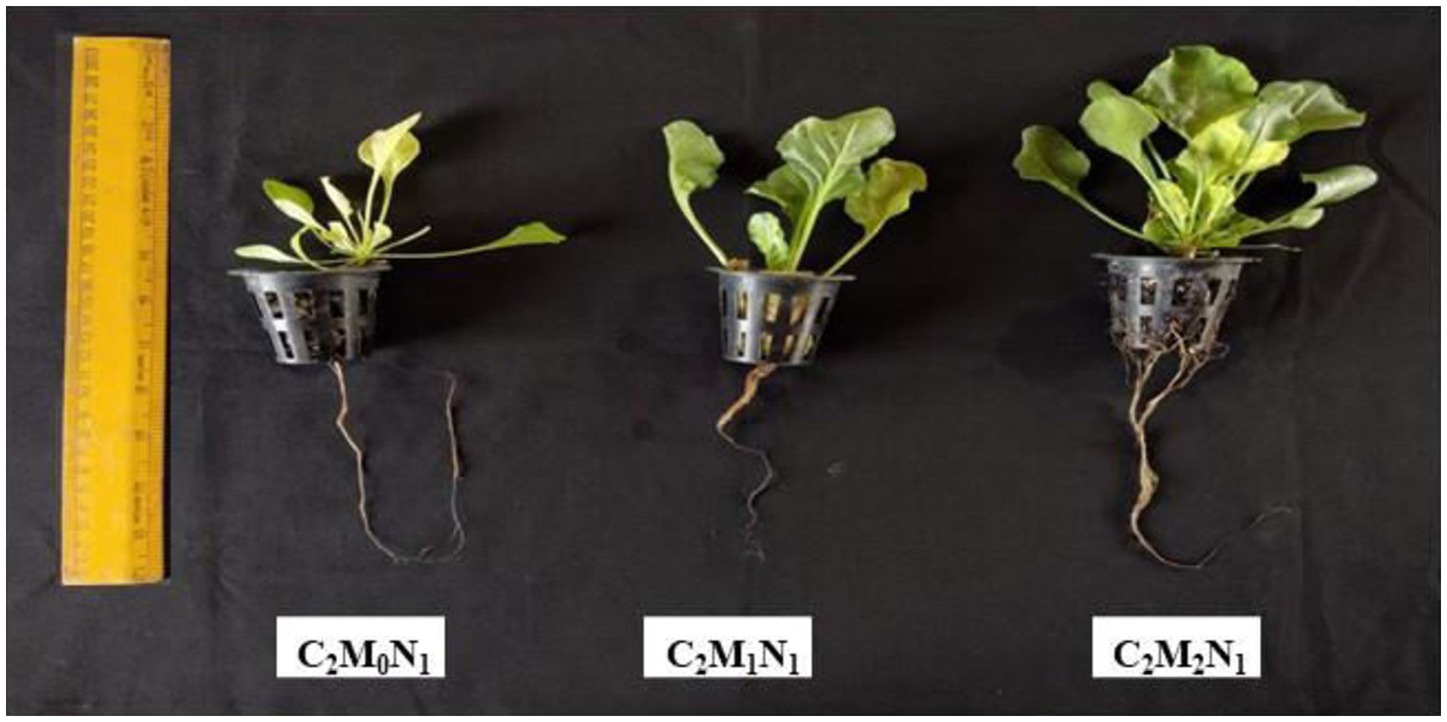
Figure 2. Influence of second nutrient combination (N1) on growth of palak.
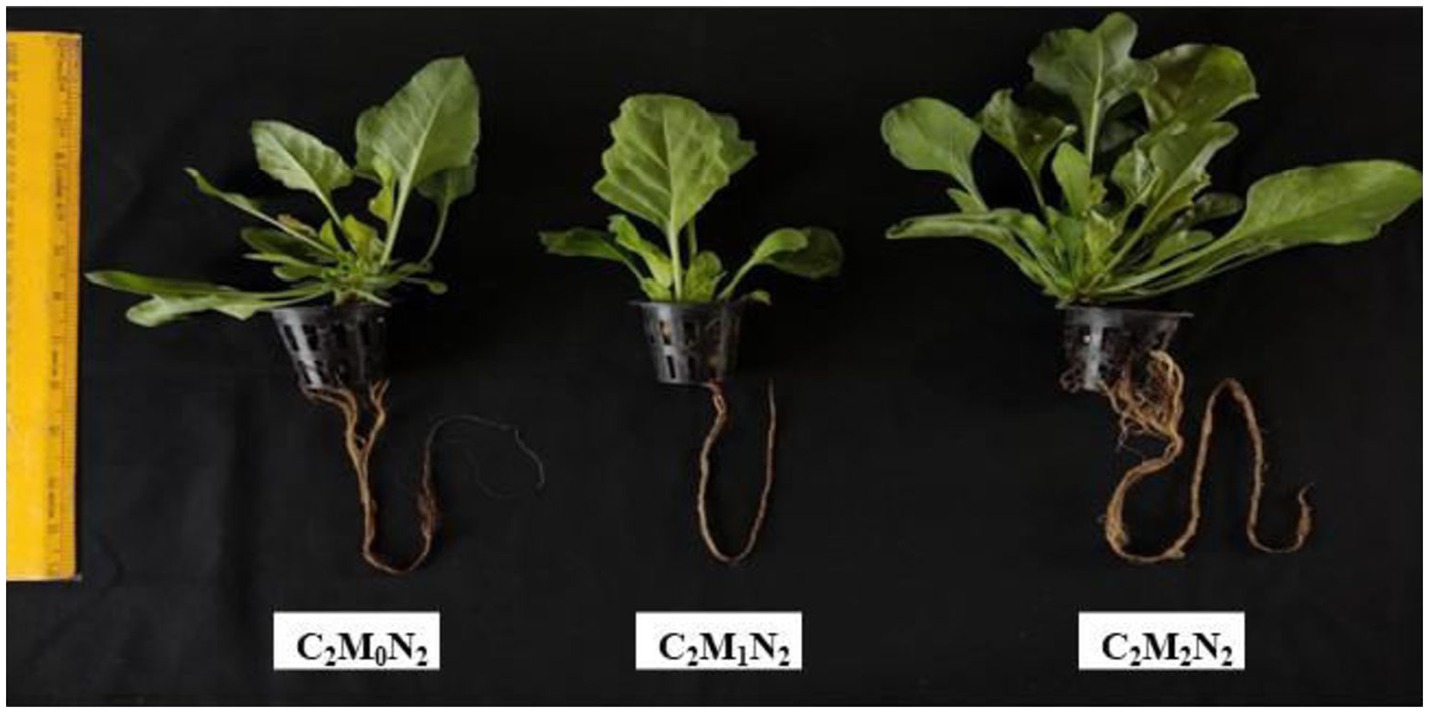
Figure 3. Influence of third nutrient combination (N2) on growth of palak.
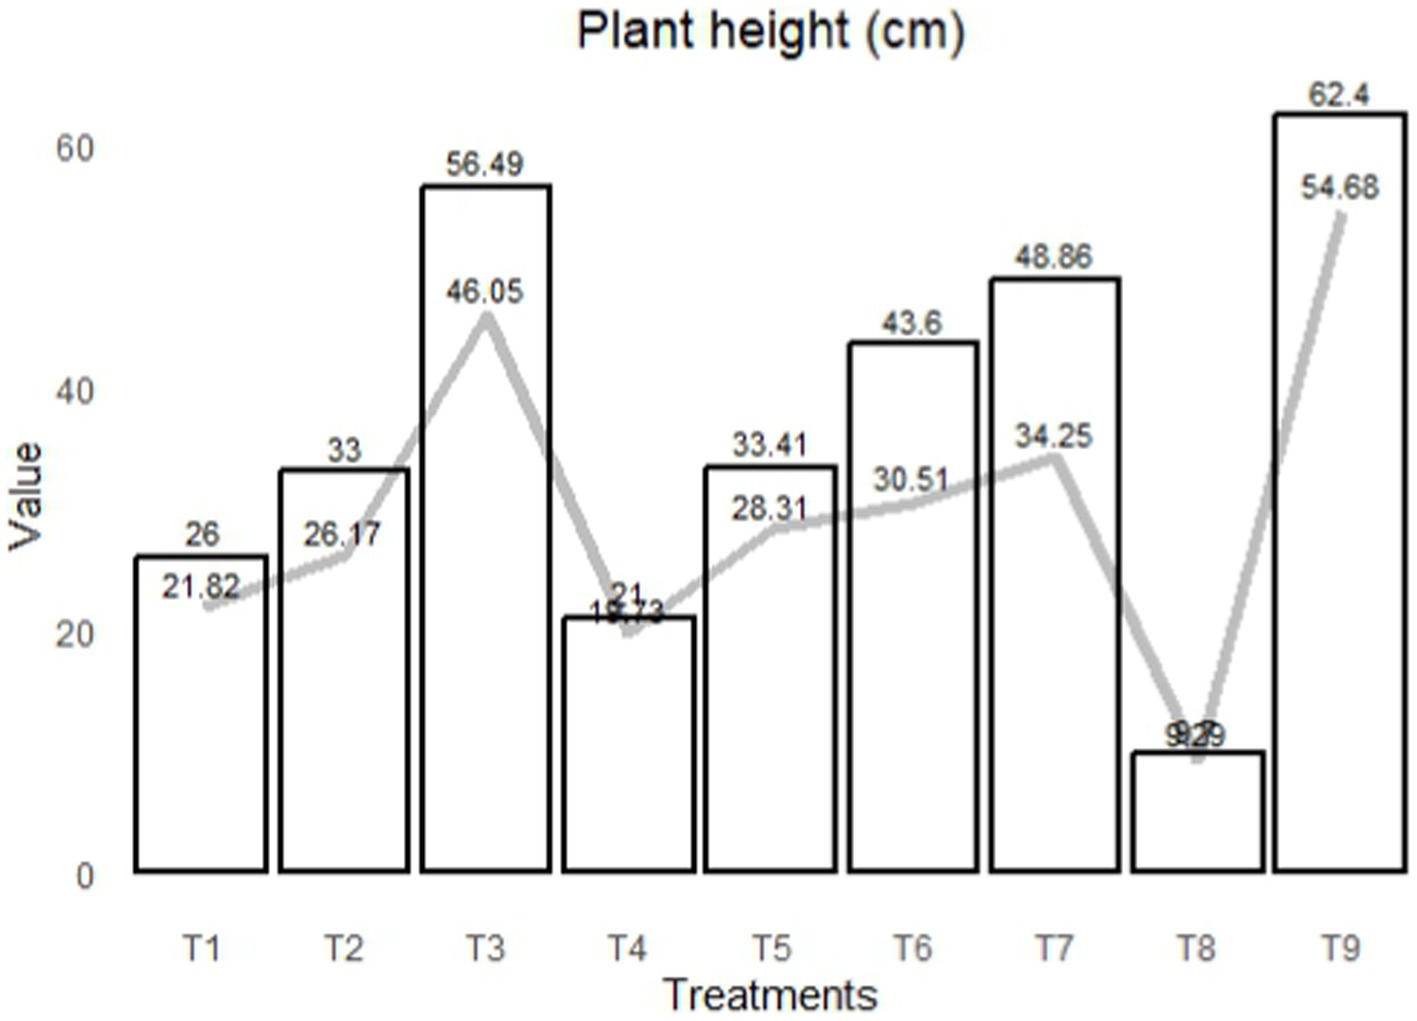
Figure 4. Graphical representation illustrating the variation in plant height across different treatment combinations, presented in centimeters. The line graph corresponds to the plant height readings on the 15th day, while the bar graph corresponds to the readings on the 25th day.
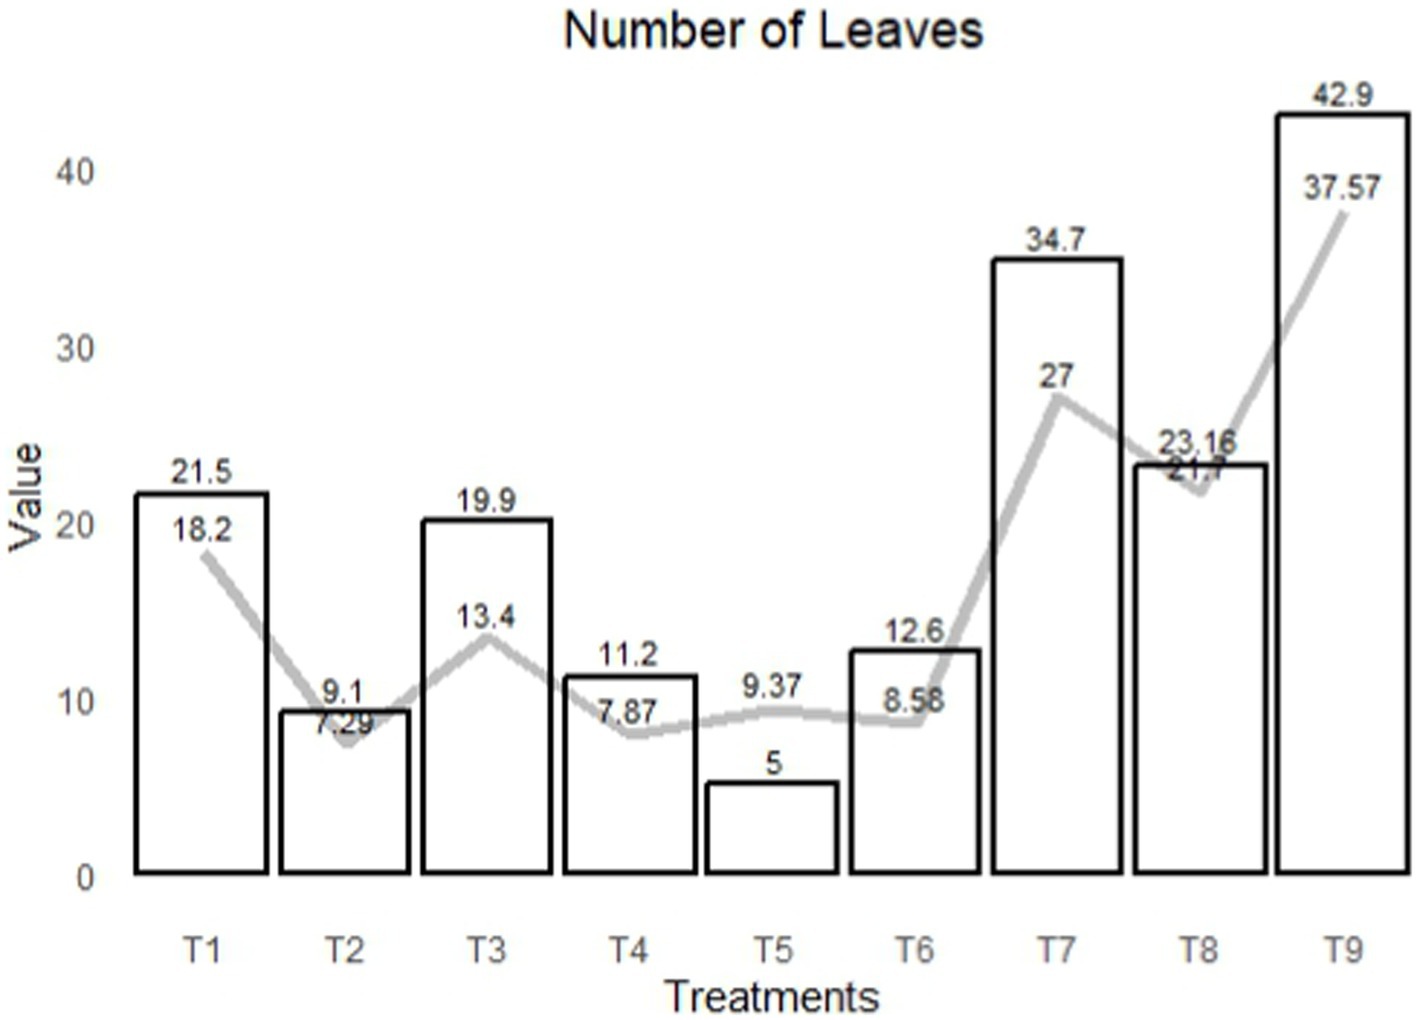
Figure 5. Graphical representation of the Number of leaves variation across the treatment combination. The line graph represents the 15th day reading the bar represents the 25th day reading.
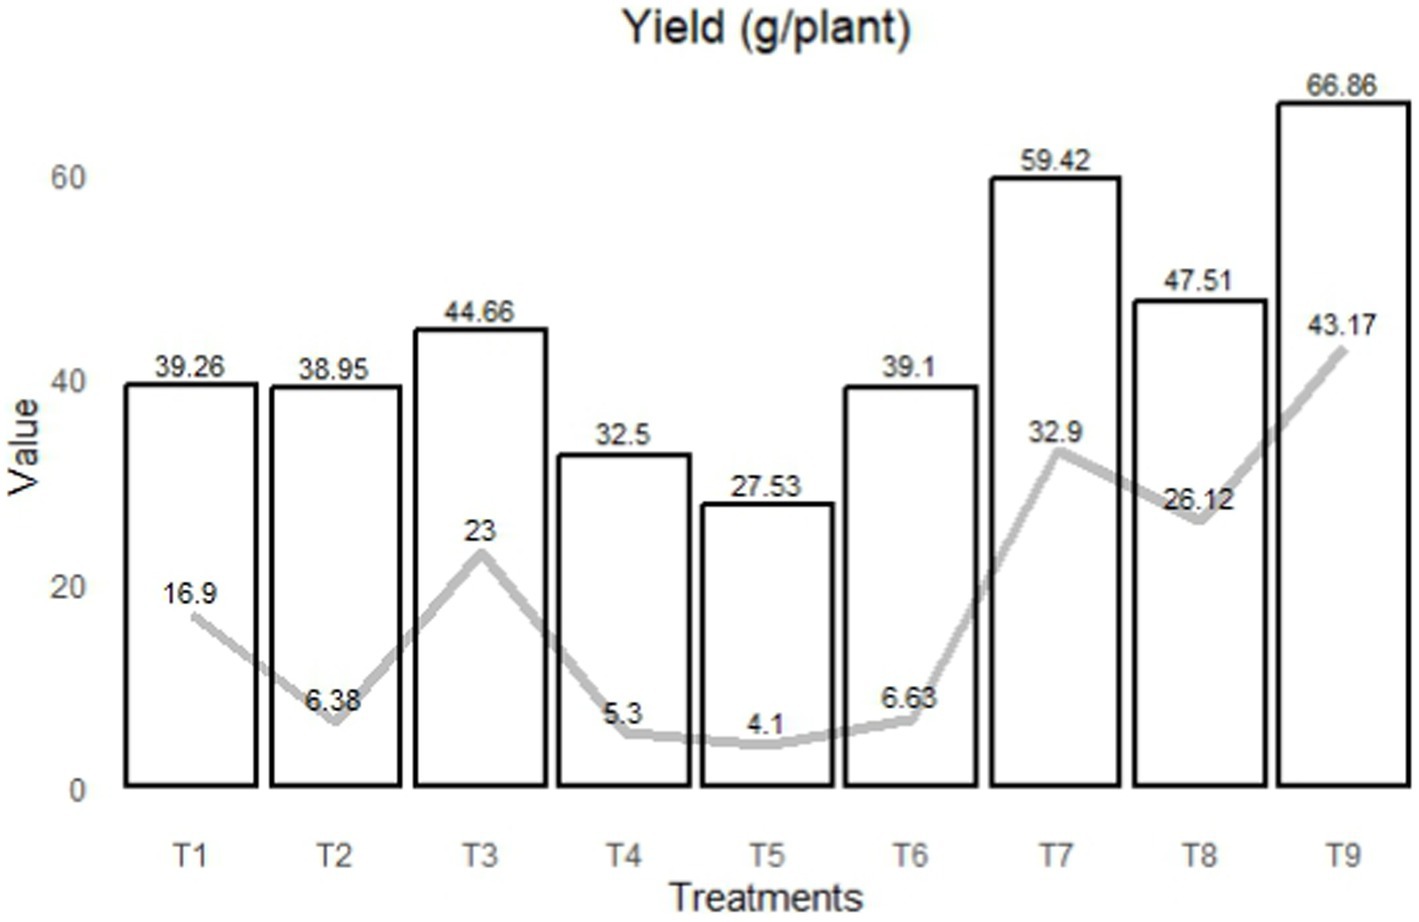
Figure 6. The presented image showcases the fluctuation in plant yield across various treatment combinations, expressed in grams per plant. The line graph reflects the yield on the 15th day, while the bar graph represents the yield on the 25th day.
3.3.1 Plant height (cm)
Jones et al. (2017) reported that plants grown in hydroponics, receiving full and precisely balanced nutrients, exhibit tremendous growth. In the case of palak, the plant height ranged from 9.70 to 62.40 cm. The highest plant height was recorded in the treatment M2N2, measuring 54.68 cm on the 15th DAP and 62.40 cm on the 25th DAP. This was closely followed by M0N2, resulting in the highest plant heights of 46.05 and 56.49 cm on the 15 and 25th DAP, respectively. Conversely, the lowest plant height was observed in M2N1, with a height of 9.29 cm on the 15th DAP and 9.70 cm on the 25th DAP. These findings align with the research conducted by Sutnga et al. (2021), which emphasizes that the ideal nutrient concentration plays a pivotal role in promoting healthy plant growth and yield, particularly when nitrogen levels are applied optimally. Their study found that the nitrogen content remained stable at about 12.5 mL per plant across treatments, without significant increases or decreases. These results also resonate with the findings of Öztekin et al. (2018) in the context of spinach cultivation (Figure 7).
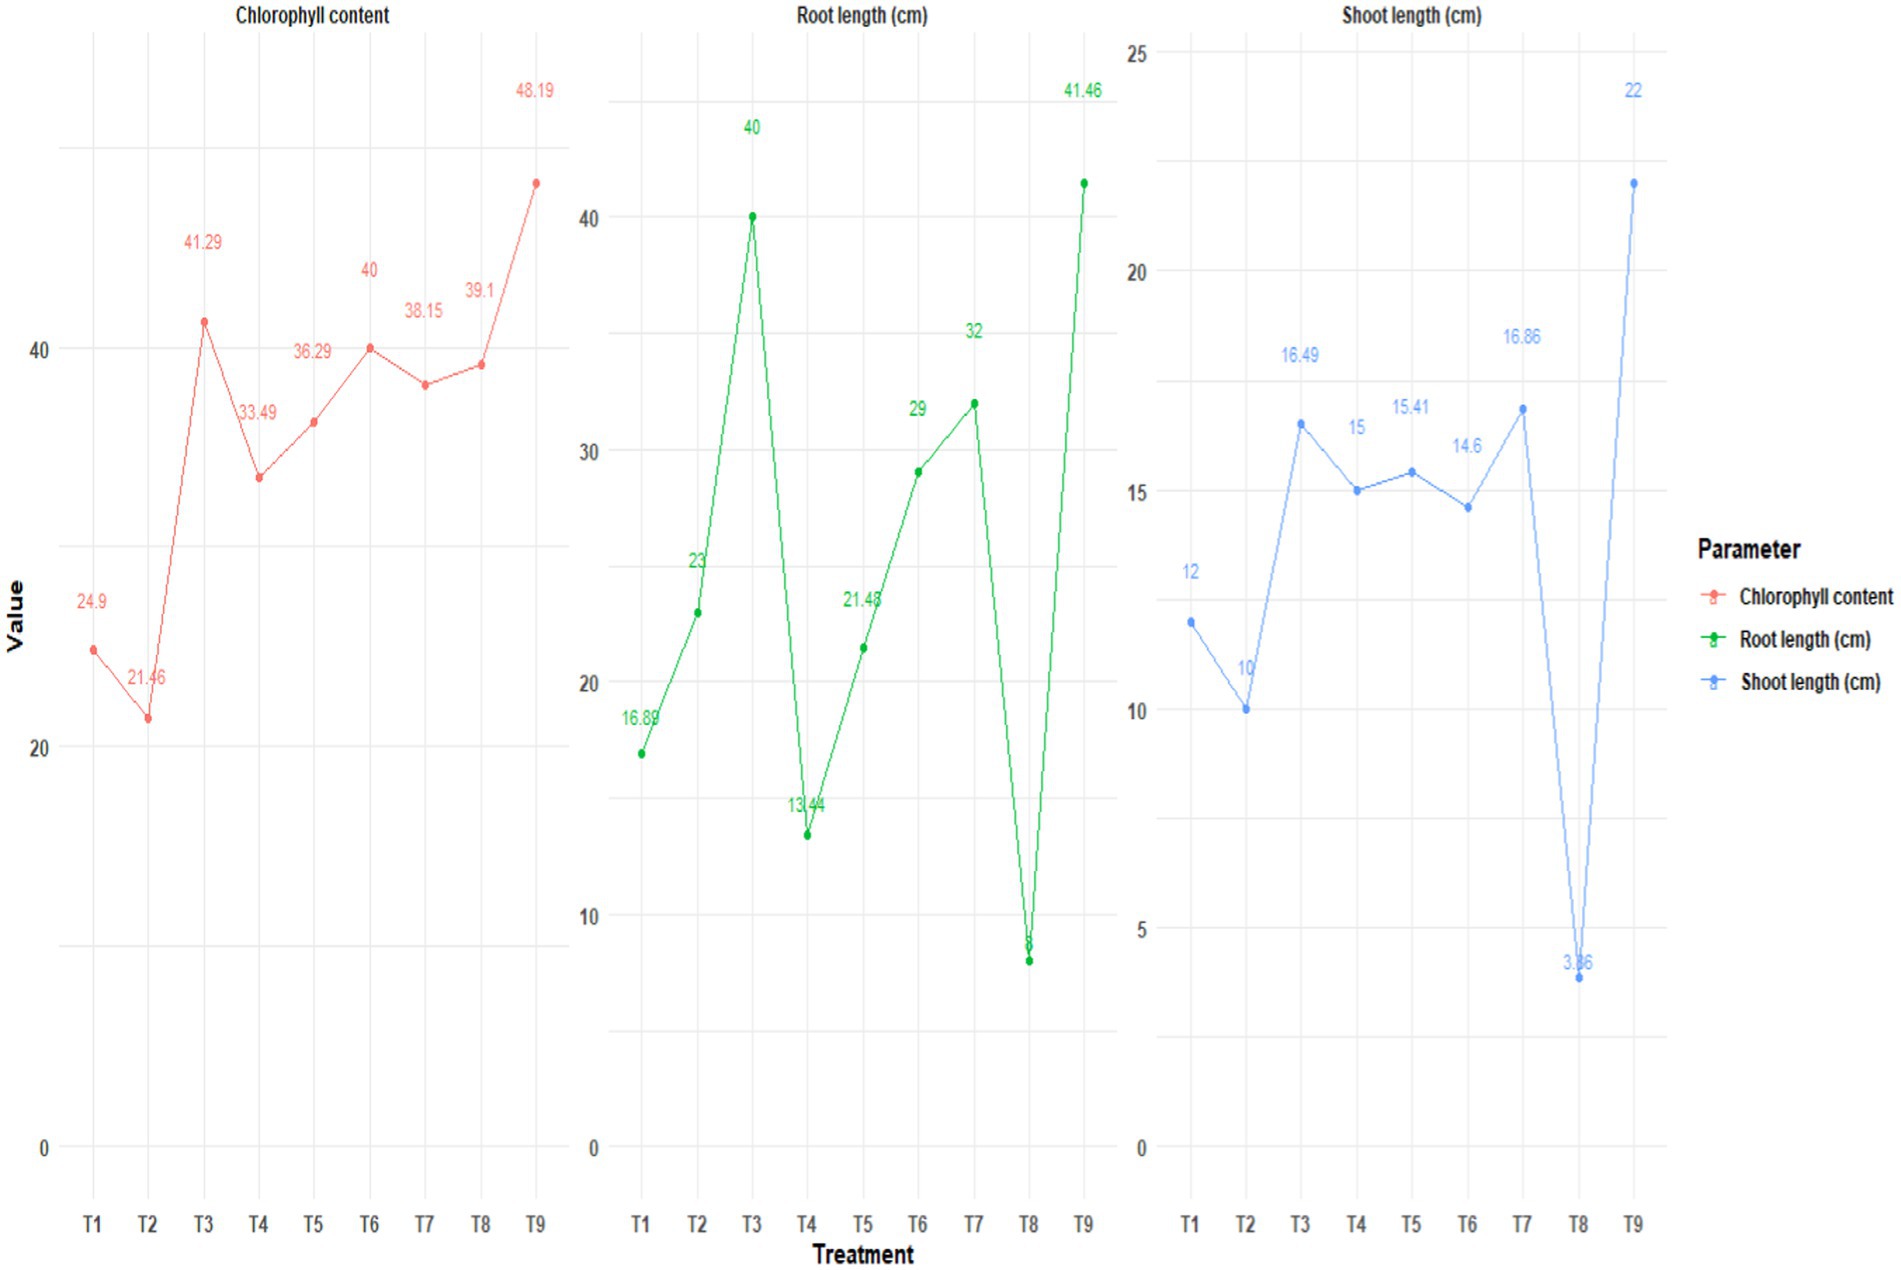
Figure 7. The presented visual representation delineates the dynamic changes in Root length (cm), Shoot length (cm), and Leaf chlorophyll content across diverse treatment combinations, observed on the 25th day post-planting. This presentation offers a comprehensive overview of the key parameters influencing plant growth.
3.3.2 Number of leaves
A notable variation in the number of leaves was observed in cultivated palak, with treatment M2N2 standing out with 42.90 and 37.57 leaves, followed by the M2N0 treatment with 27.00 and 34.70 leaves at the 15 and 25th DAP. The minimum number of leaves was recorded in the M1N1 treatment, with 9.37 and 5 leaves. These findings display some deviation from the suggestions of Petropoulos et al. (2016), yet they align with the findings of Sapkota et al. (2019) in their study on lettuce. Additionally, they are consistent with the research conducted by Adams (2002) on nutritional control in hydroponics.
3.3.3 Yield (g/plant)
The M2N2 treatment exhibited the maximum yield, producing 43.17 and 66.86 g per plant at the 15 and 25th DAP, respectively. Following closely, the M2N0 treatment yielded 32.90 and 59.42 g per plant. The minimum yield was recorded in the M1N1 treatment, with 4.10 and 27.53 g per plant. Li et al. (2018) emphasized that biomass yield from NFT-grown lettuce is comparatively higher than other growth systems. Chhetri et al. (2022) reported that when cultivating lettuce and pokchoi in NFT cultivation, cocopeat as a growing medium outperformed sponge substrate, acting as an efficient method for the supply of nutrient solution, with cocopeat demonstrating better water-holding capacity and air-filled porosity. These results align with the findings of Soundy et al. (2001), who reported that phosphorus concentrations ranging from 35 to 50 mg/L have the potential to produce high-quality lettuce seedlings in hydroponic culture.
3.3.4 Leaf parameters—LAI, LAR, LAD, and SLA
The M2N2 treatment exhibited the highest Leaf Area Index (LAI), with values of 0.81 and 1.07 for palak. Following closely, the M2N0 treatment had LAI values of 0.73 and 0.99 at the 15 and 25th DAP. Conversely, the lowest LAI was observed in the M1N1 treatment, with 0.10 and 0.23 LAI. Regarding Leaf Area Ratio (LAR), the M2N2 treatment produced the most elevated LAR, measuring 9.40, followed by the M2N0 treatment with 8.60. These findings are consistent with the research conducted by Ebelhar and Varsa (2000), who reported that an excessive dose of potassium application resulted in decreased leaf area, leading to the development of smaller-sized leaves. The lowest LAR was noted in the M1N1 treatment, with an LAR of 1.65.
The M1N1 treatment excelled with the highest Leaf Area Duration (LAD), scoring 0.69, followed by M0N2 with 0.53 LAD. The results were in line with the report of Shanmugabhavatharani et al. (2021) in their study on Mint. Spehia et al. (2018) reported that the maximum leaf area per plant was observed in Nutrient Film Technique (NFT) for lettuce cultivation. Conversely, the lowest LAD values were consistently found in the M0N0 treatment, registering 0.23 for palak.
The M0N0 treatment had the highest Specific Leaf Area (SLA) at 17.39, followed by the M0N2 treatment with 13.15 SLA in the case of palak. Conversely, the lowest SLA values were observed in treatment M2N2 for palak (1.98). These findings are in alignment with Wolff and Coltman (1990), who noted that in lettuce, specific leaf area increases as the percentage of shade increases.
3.3.5 Root parameters
The M2N2 treatment exhibited the most substantial root growth, with lengths of approximately 40.40 cm on the 15th DAP and 41.46 cm on the 25th DAP. Following closely, the M0N2 treatment yielded root lengths of 38.86 and 40.00 cm on the 15 and 25th DAP, respectively. The lowest root growth occurred in plants treated with M2N1, with root length reaching 5.43 cm on the 15th DAP and 8 cm on the 25th DAP. These findings align with the results obtained by Acharya et al. (2021) in their study on spinach grown under NFT.
The M2N0 treatment also delivered commendable results with root fresh weights of 6.29 and 9.83 g on the same respective DAP. In contrast, the M1N0 treatment exhibited the lowest root fresh weight for palak, with values of 0.16 and 0.48 g on the 15 and 25th DAP. The maximum dry root weight in palak was observed in the M2N2 treatment, with values of 5.33 and 6.27 g at the 15 and 25th DAP. The M2N1 treatment followed with dry weights of 4.2 and 2.94 g, while the least growth was noted in M1N0, with dry weights of 0.07 and 0.1 g. Chhetri et al. (2022), also reported that the root growth of lettuce was significantly higher in cocopeat media compared to other growing mediums.
3.3.6 Shoot parameters
The maximum shoot length was recorded in the M2N2 treatment, with values of 13.22 and 22.00 g at the 15th and 25th DAP in the case of palak. Following closely, the M2N0 treatment displayed shoot fresh weights of 7.58 and 16.86 g at the 15 and 25th DAP. Conversely, the minimum growth was observed in the M2N1 treatment, with shoot lengths of 1.7 and 3.85 cm at the respective time points. These variations in shoot length may be attributed to fluctuations in temperature, as reported by Abou-Hadid et al. (1995) in leafy vegetables. The precise use of nutrients and water contributes to the accelerated growth of these leafy vegetables (Deekshith et al., 2022).
With respect to palak, the pinnacle of shoot weight was attained in the M2N0 treatment, registering 27.6 and 42.67 of fresh weight at the 15 and 25th DAP. This treatment was noted to be closely trailed by the M2N2 treatment, which recorded 25.37 and 40.52 g of fresh weight on the same DAP. In stark contrast, the M1N1 treatment exhibited the minimum shoot weight, with a mere 1.48 and 3.60 g of fresh weight. These findings align with those reported by Touliatos et al. (2016) in their lettuce study and parallel the observations made by Baranauskienė et al. (2003) in Thyme, where optimal nitrogen fertilizer levels corresponded to increased fresh biomass yields.
Palak recorded the maximum shoot dry weight, which was observed in the M2N0 treatment, with values of 7.37 and 18.56 g at the 15 and 25th DAP after planting. This was followed by the M2N1 treatment, which exhibited dry weights of 5.13 and 11.18 g. In contrast, the minimum dry weight was noted in the M1N0 treatment, with a meager 0.08 and 1.35 g of shoot dry weight.
3.3.7 Leaf chlorophyll content (mg/g−1 FW)
For palak, the M2N0 treatment exhibited the highest leaf chlorophyll content at 48.19 mg/g, followed by the M0N2 treatment with 41.29 mg/g. Conversely, the lowest amounts of leaf chlorophyll content were observed in the M0N1 treatment for palak (21.46 mg/g). These results align with the findings of Rosli et al. (2023), who assessed the impact of potassium on tomatoes and reported that increased potassium content led to a noticeable decrease in chlorophyll content. Additionally, Thakur et al. (2019) supported these findings, emphasizing the positive correlation between increased photosynthesis and higher yields.
3.4 Modified atmosphere packing
Upon conducting a thorough statistical analysis of the obtained data, it became evident that both storage conditions (R) and packing substrate (M) factors had parallel contributions to the response variable (shelf life). However, the influence of gas composition (G) showed varying effects for each treatment combination. Each package were placed for study until the notification of the deterioration in the treatments say, 5 days in case of ambient and 15 days in case of refrigerated condition. The tabulated result for various parameters are been depicted in Tables 12–15. Also the graphical representation of the parameters like physiological loss in weight, firmness and moisture loss are been depicted in Figure 8. Also the pictorial difference of the longevity extension of palak across different treatment over the duration of time is been depicted in Figure 9 (Ambient) and Figure 10 (Refrigerated).
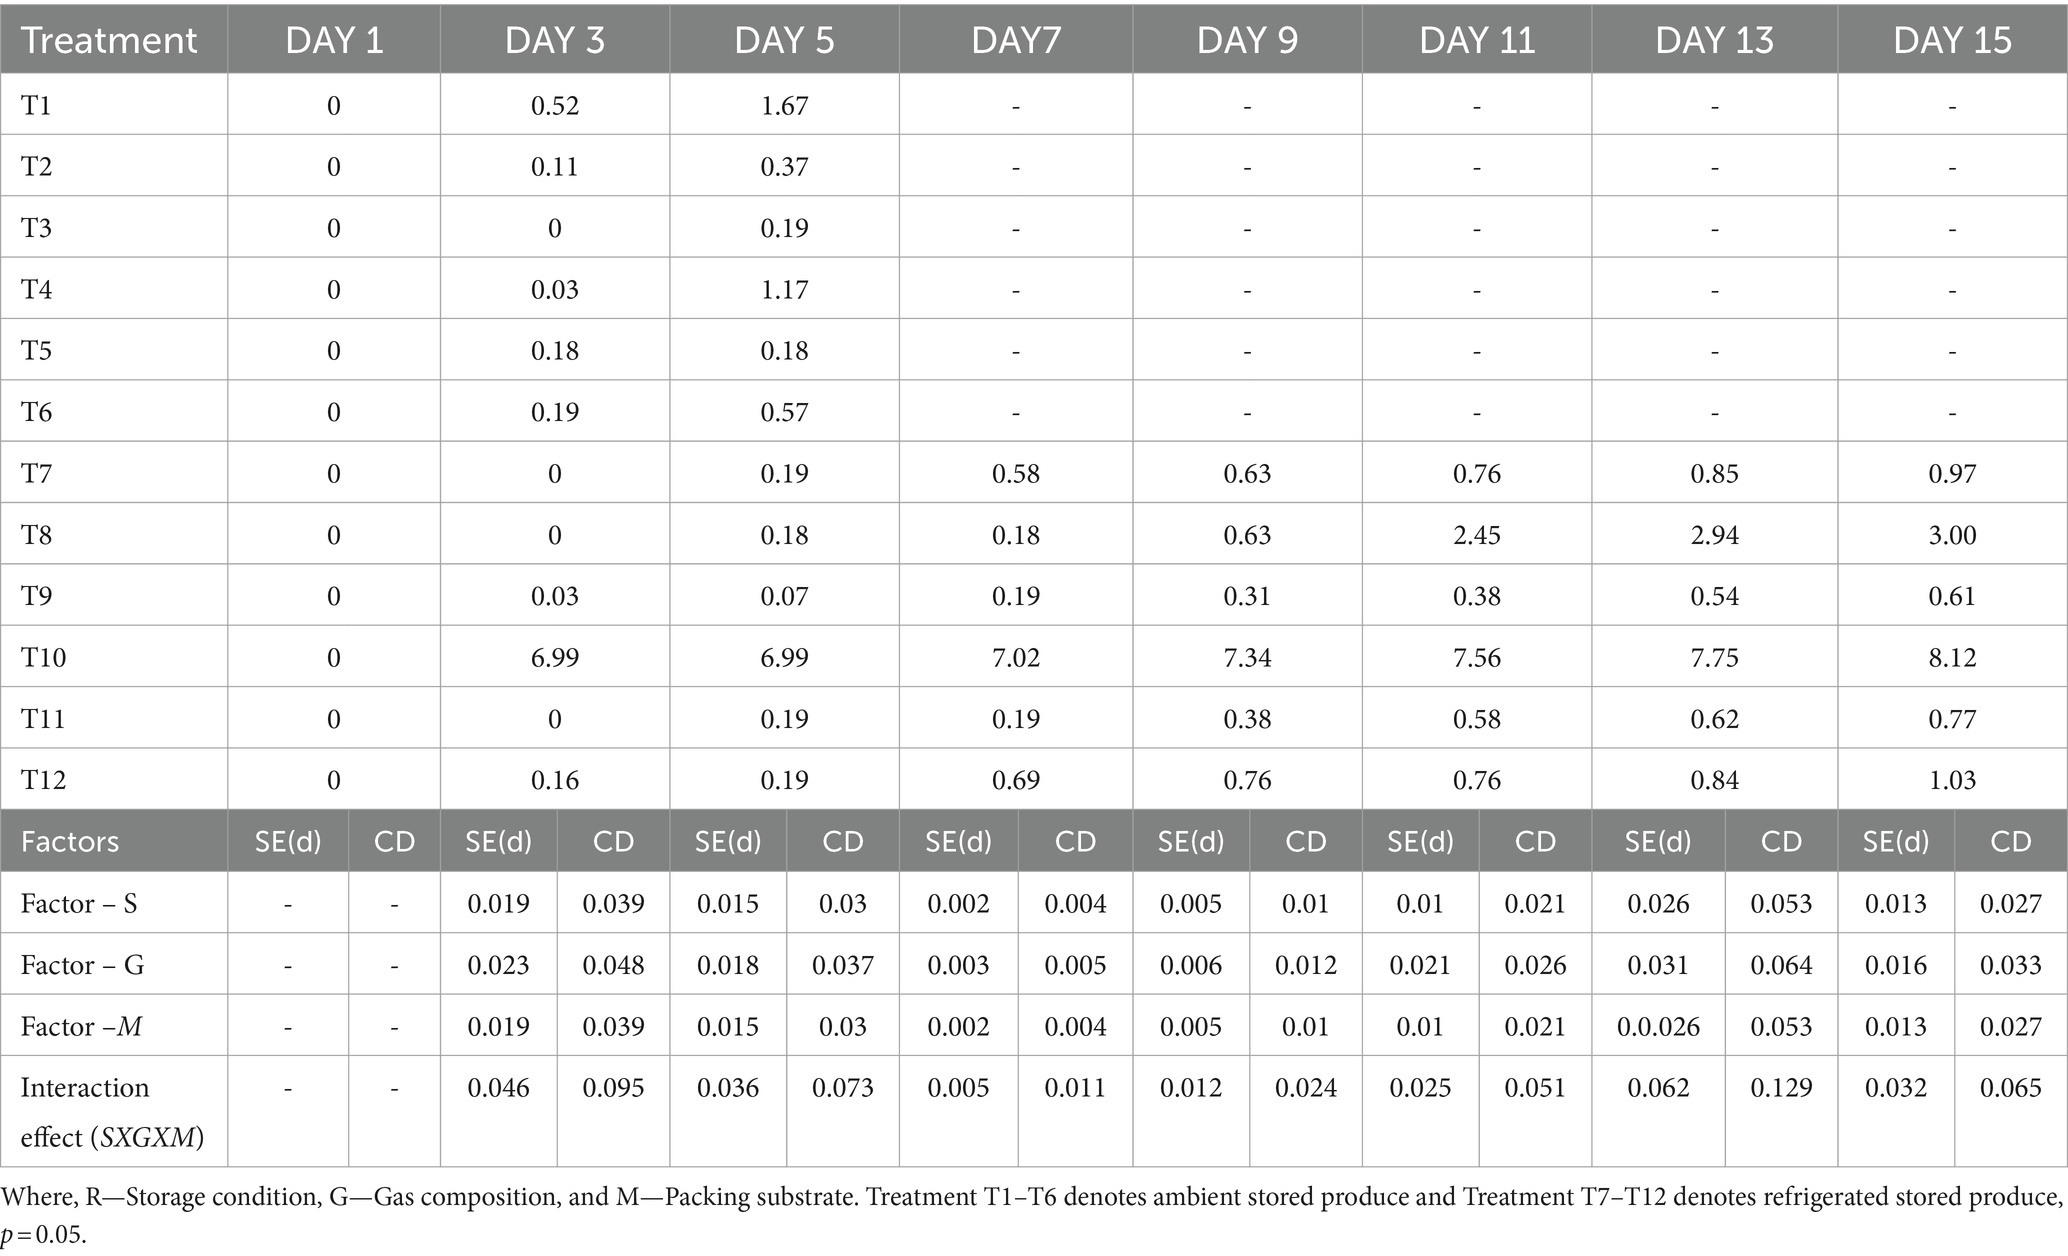
Table 12. Physiological weight loss (%) indices in palak under diverse treatments.
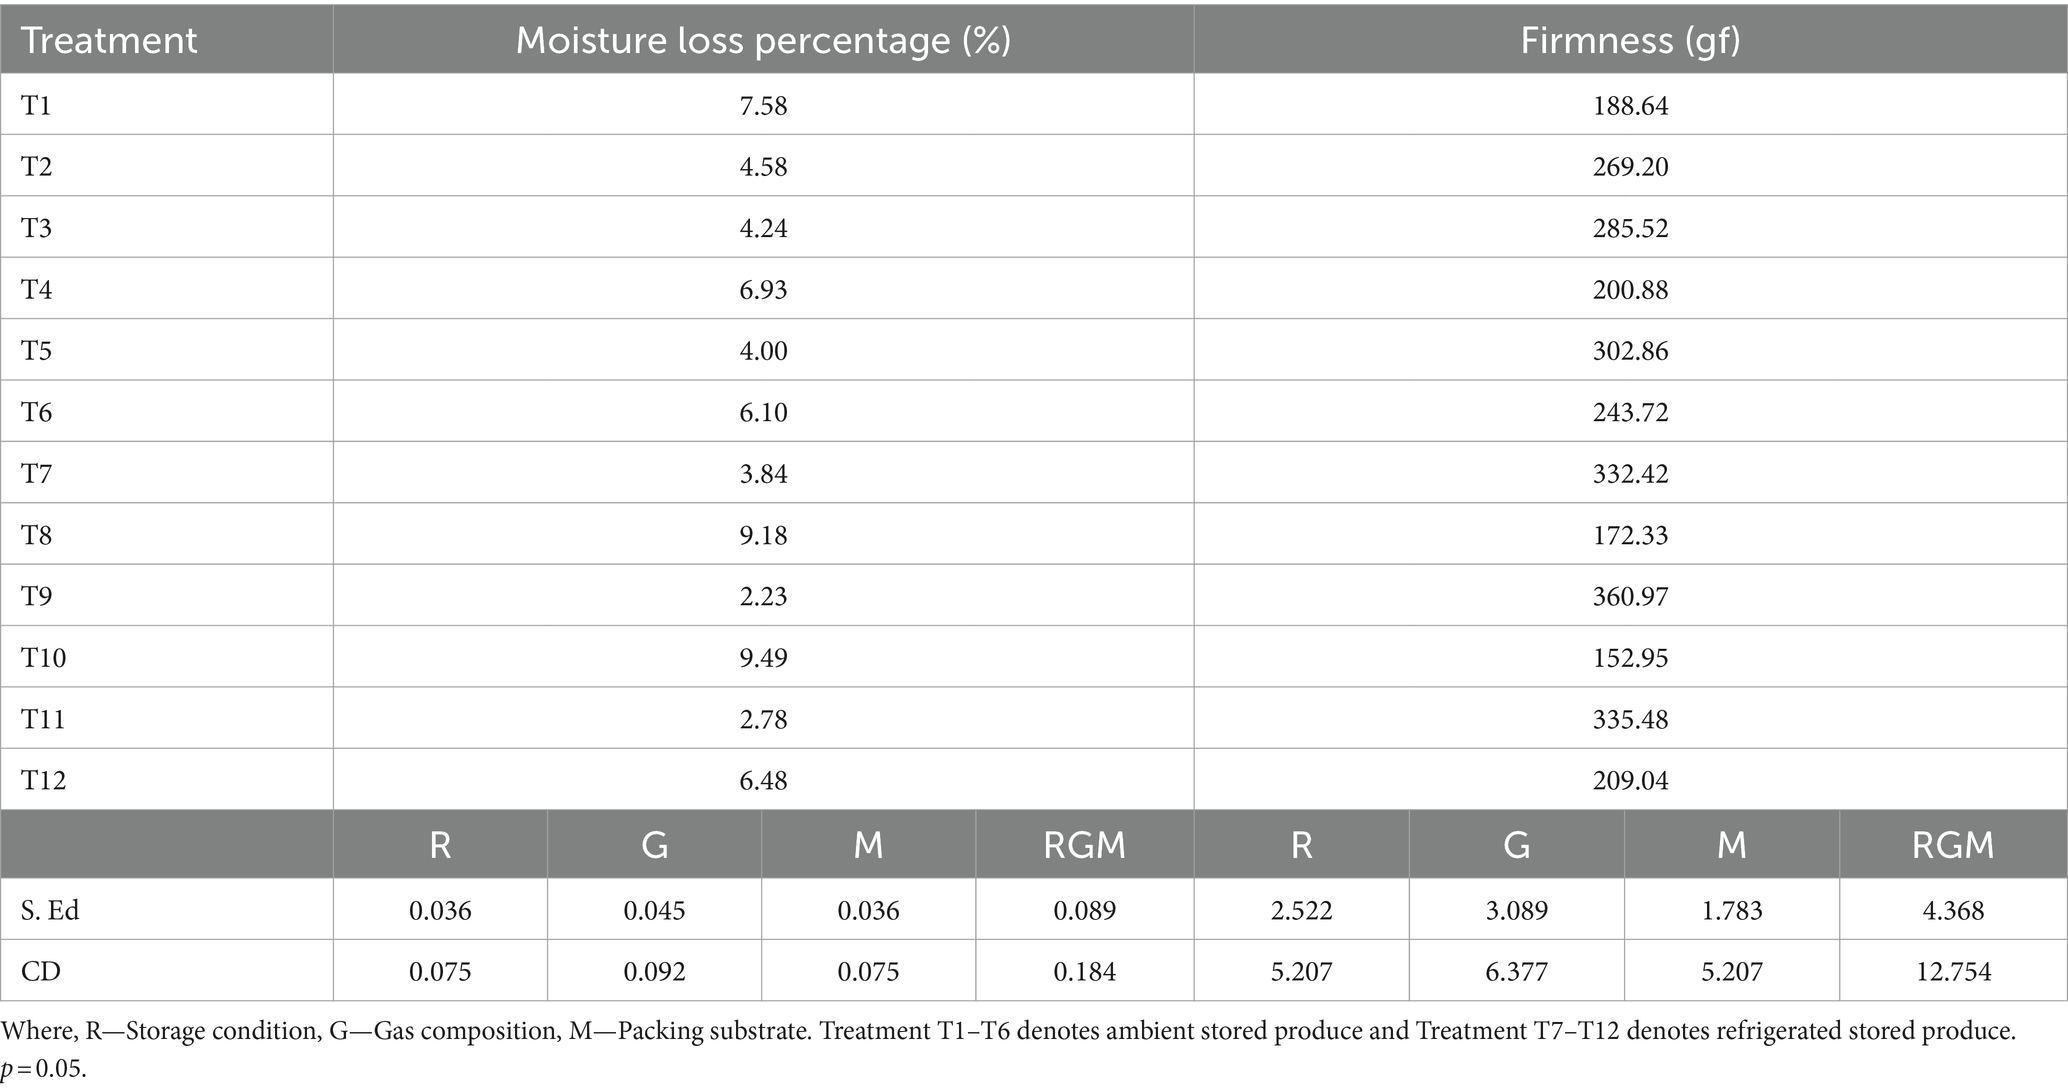
Table 13. Moisture loss percentage (%) and Firmness (gf) in palak under diverse treatments.
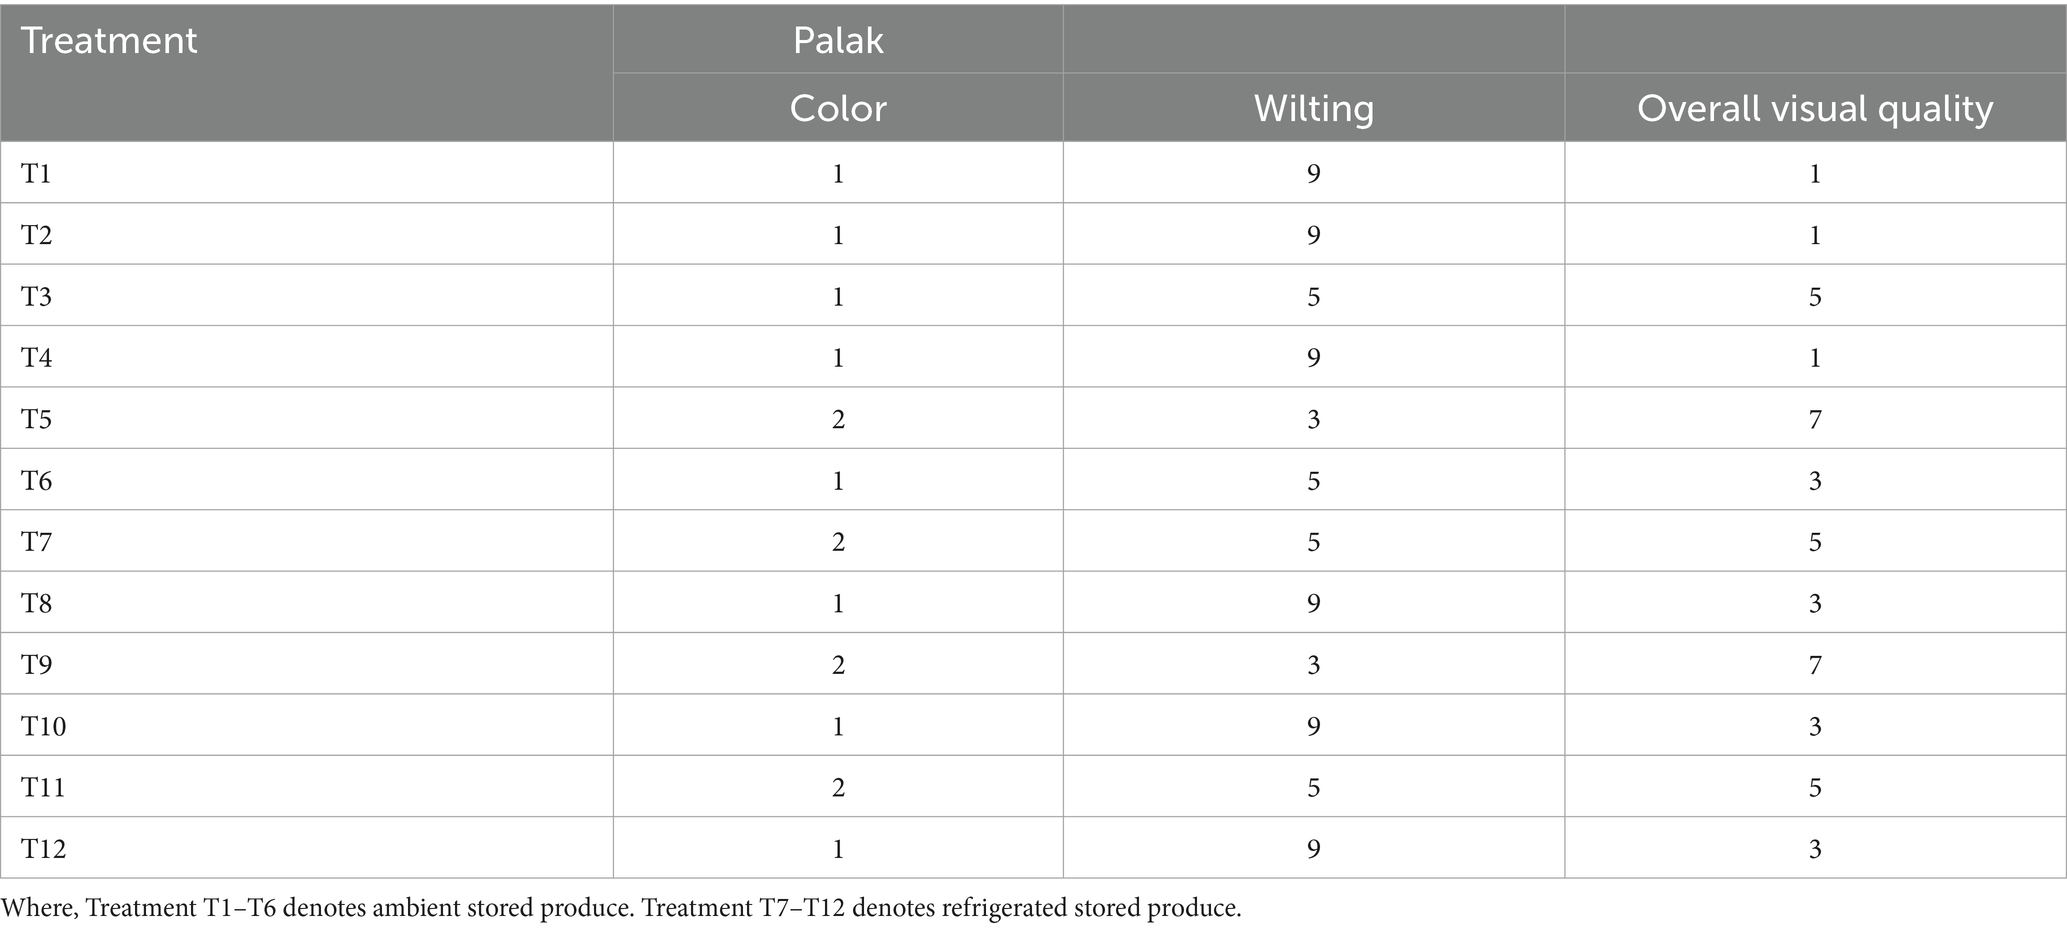
Table 14. Quality measure ranking for palak under diverse treatments:
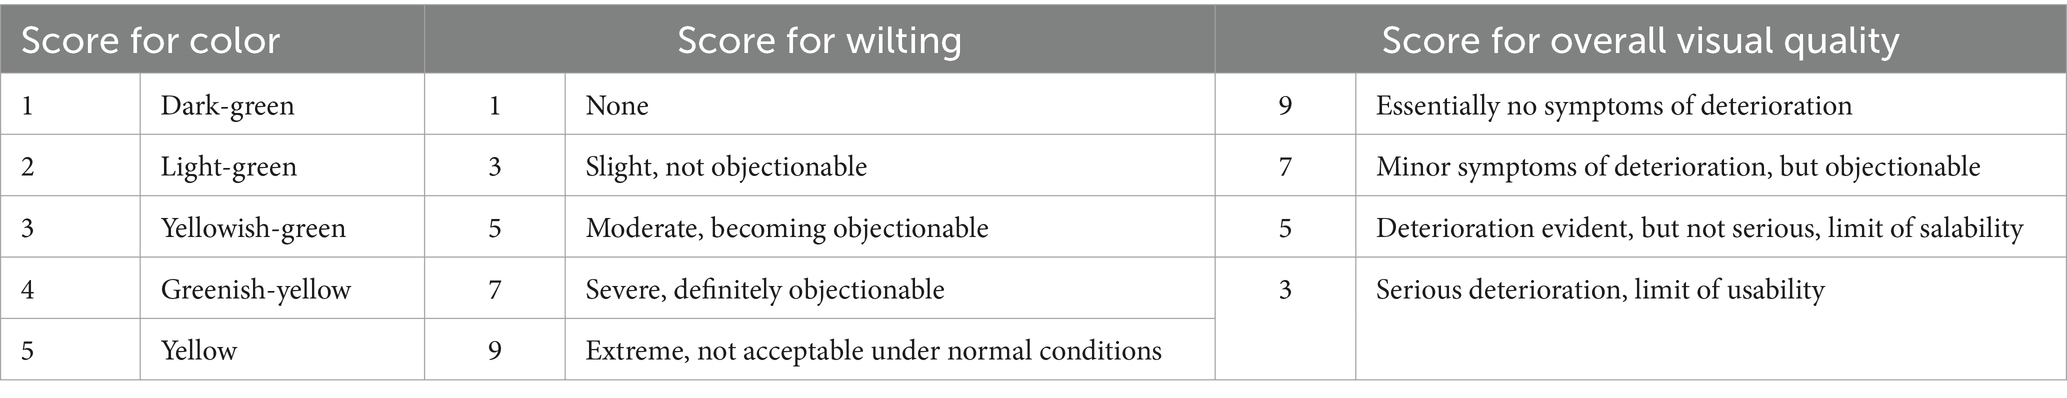
Table 15. Rating scale for the color, overall visual quality and wilting of Green Vegetable, Wheeler et al. (2015).
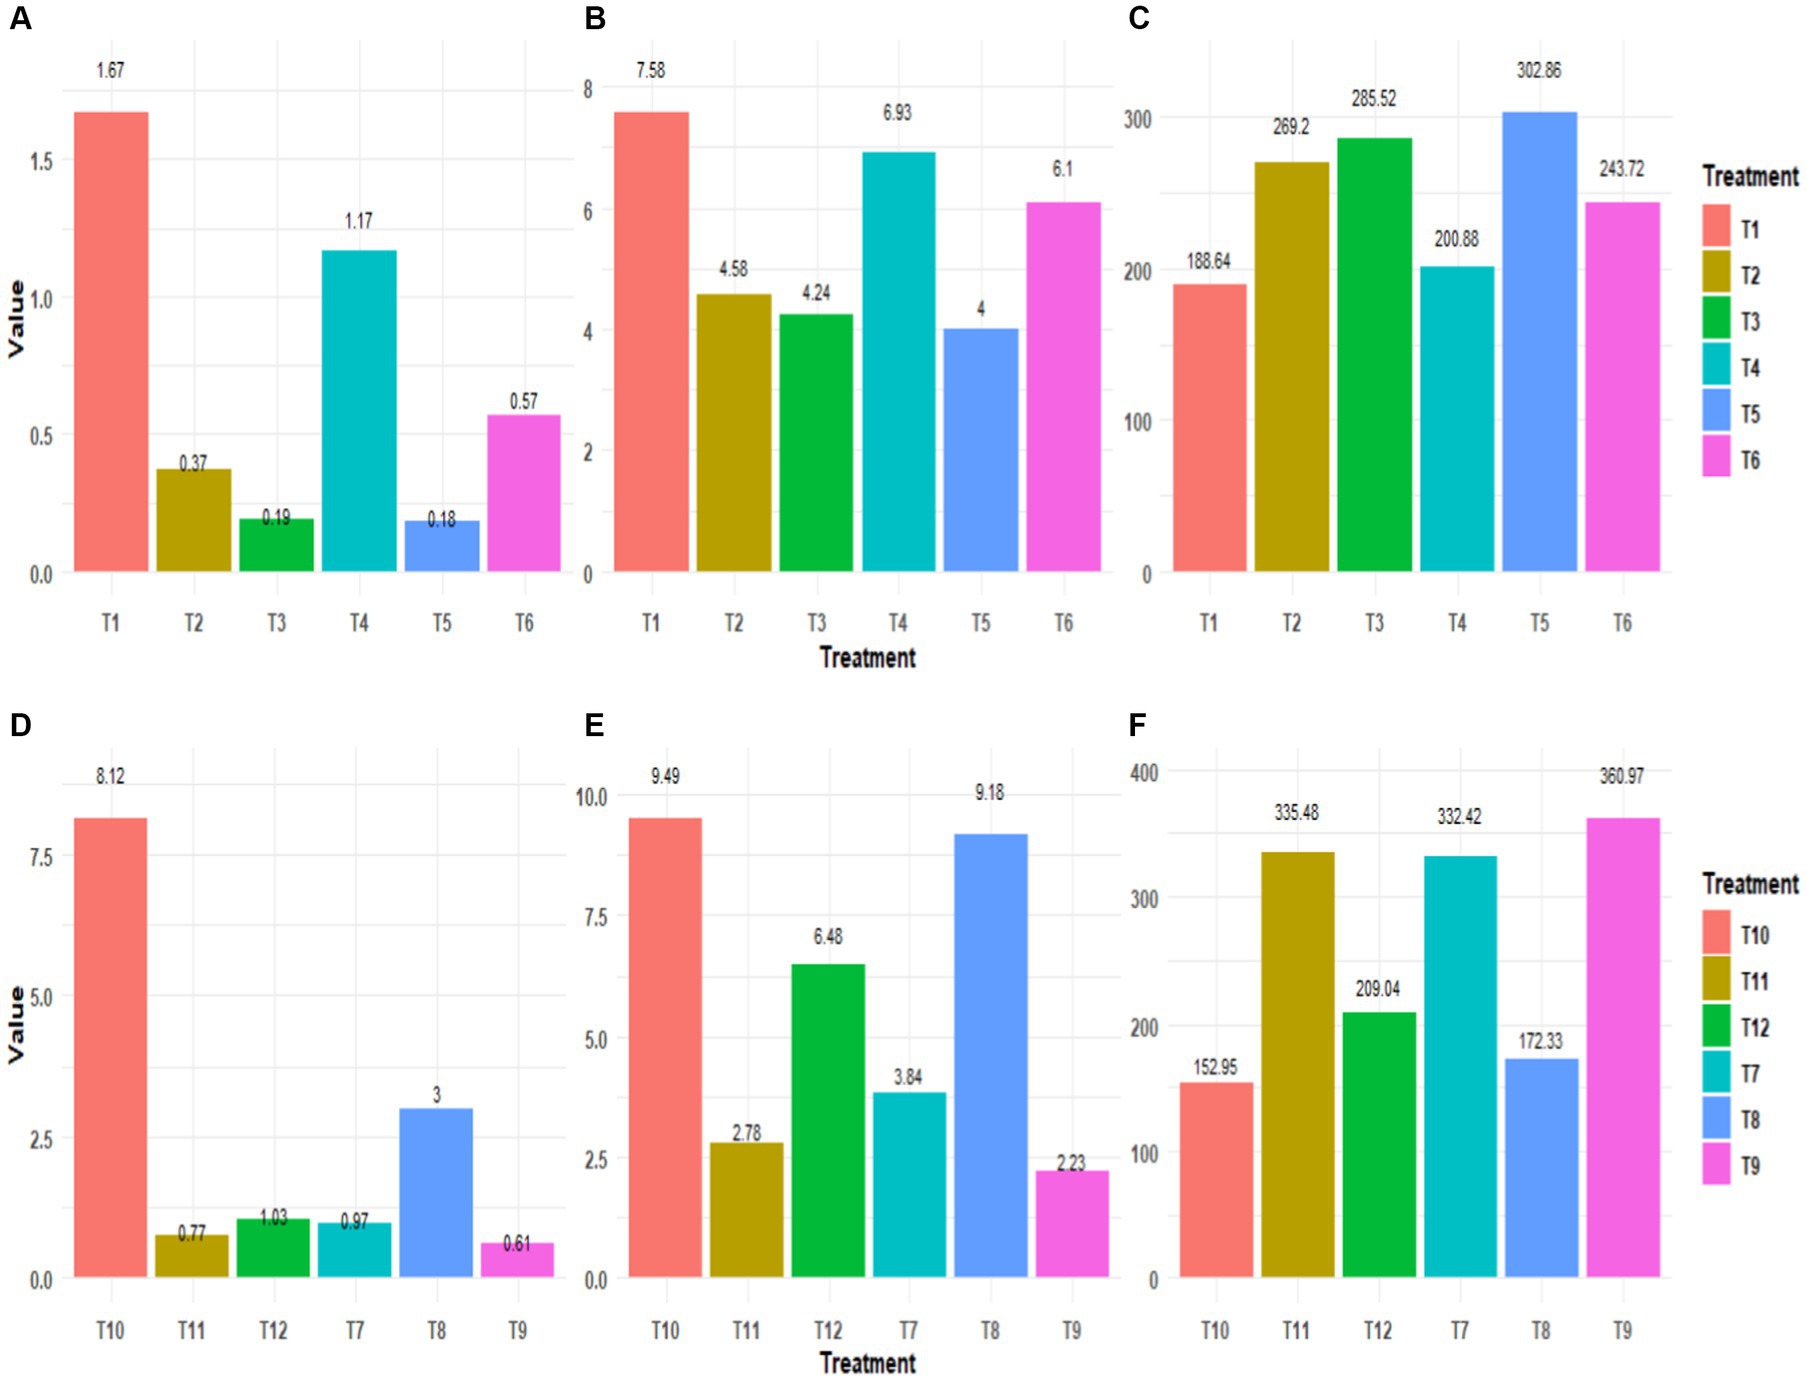
Figure 8. Influence of diverse treatment on Palak, (A) Physiological loss (%) in weight of produce stored under Ambient temperature (35 ± 5°C), (B) Moisture loss (%) of produce stored under Ambient temperature (35 ± 5°C), (C) Firmness (gf) of produce stored under Ambient temperature (35 ± 5°C), (D) Physiological loss in weight (%) of produce stored under Refrigerated temperature (5 ± 5°C), (E) Moisture loss (%) of produce stored under Refrigerated temperature (5 ± 5°C), (F) Firmness (gf) of produce stored under Refrigerated temperature (5 ± 5°C): Values are the mean calculated over three successive replication.
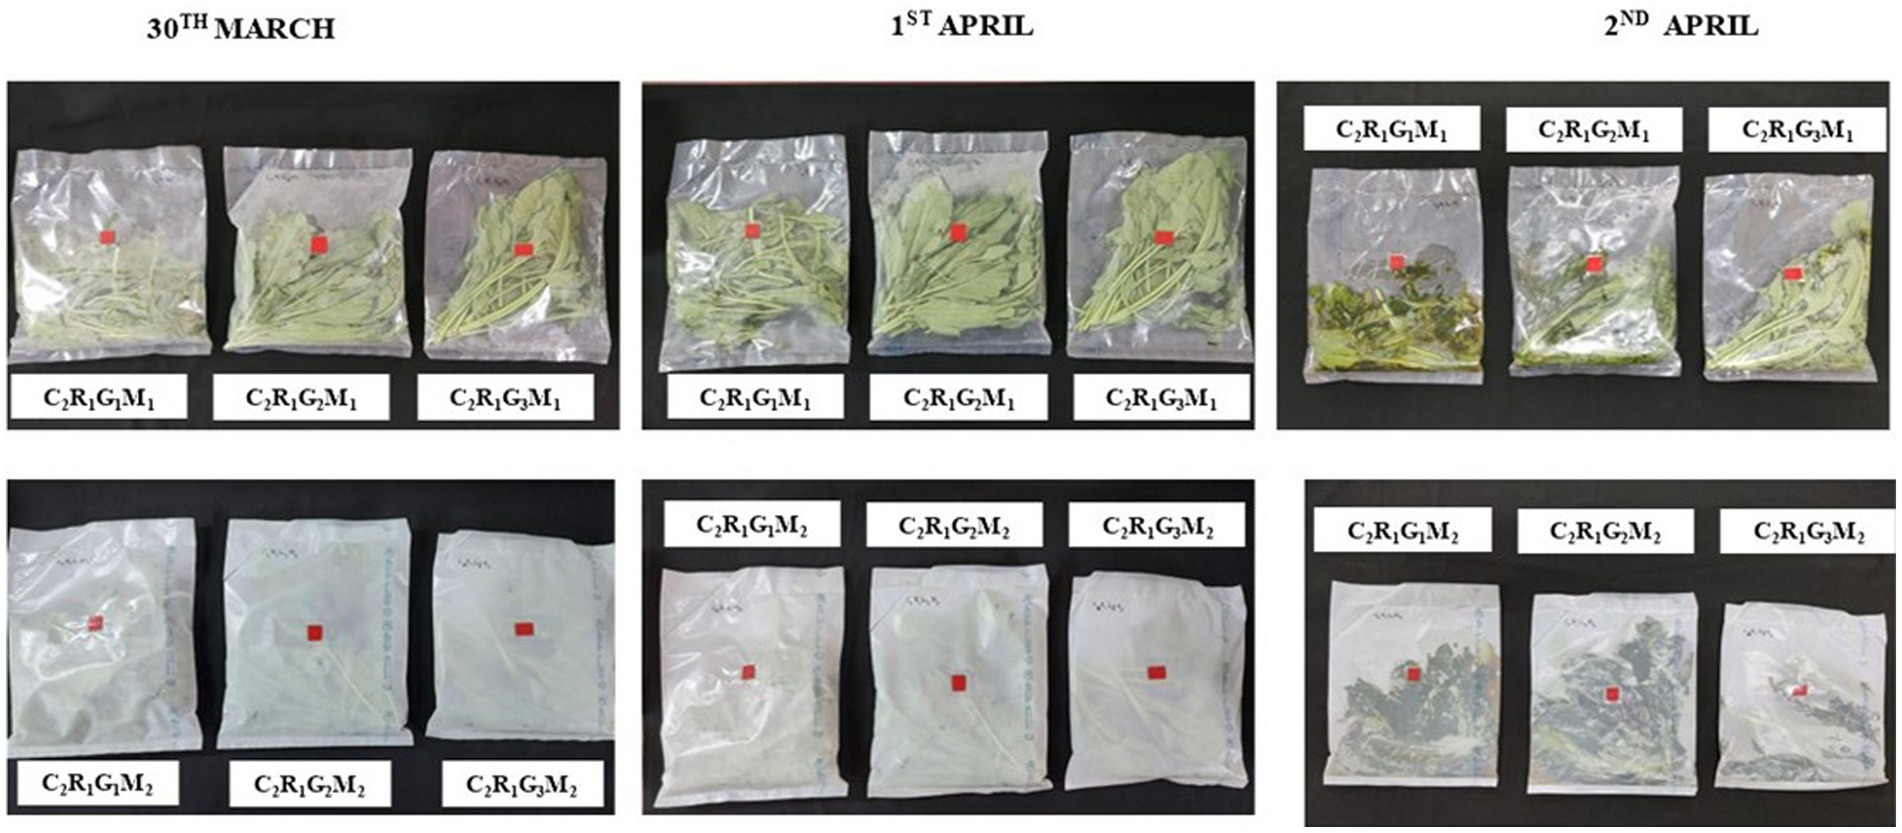
Figure 9. Longevity of palak under Ambient conditions (35 ± 5°C): The shelf life of the ambient-stored produce was noted to be 5 days. The produce was packed on March 29, and its variation over this period is illustrated in the image on alternate days: March 30, April 1, and the final day of observation, April 2.
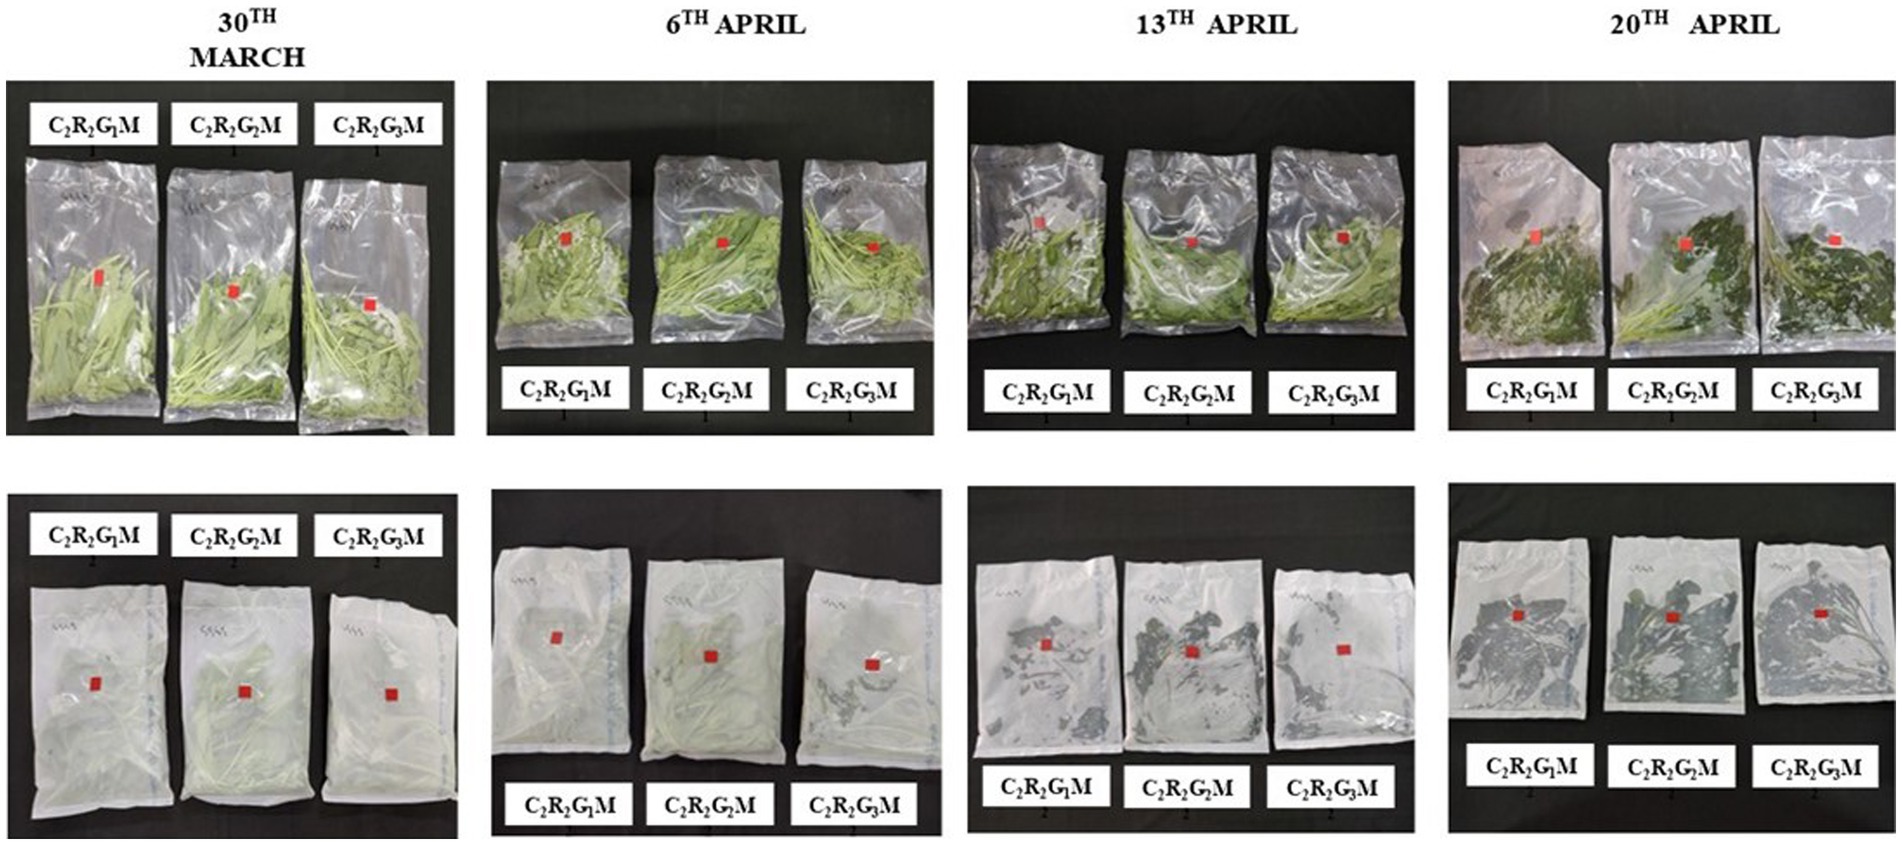
Figure 10. Longevity of palak under Refrigerated conditions (5 ± 5°C): The shelf life of the Refrigerated-stored produce was observed to be 15 days. The produce was packed on March 29, and its variation over this period is illustrated in the image at 7-day intervals: March 30, April 6, April 13, and the final day of observation, April 20.
3.4.1 Physiological loss in weight (%)
Upon examining the storage conditions of palak under ambient settings, noticeable variations in physiological loss in weight were observed. T5 exhibited the most favorable performance, displaying a minimal 0.18% loss, closely followed by T3 at 0.19%, and T2 at 0.37%. Conversely, T1 demonstrated a comparatively poorer performance with a higher physiological loss of 1.67% compared to the other treatments.
In the case of palak stored under refrigerated conditions, T9 showcased the best outcome with a physiological loss of 0.61%, followed by T11 at 0.77%, and T7 at 0.97%. It is noteworthy that the highest physiological loss occurred in T10, utilizing LDPE with a specific gas composition (6, 5, and 89%), experiencing a substantial 8.12% deterioration in weight. This finding aligns with the study conducted by Prasad et al. (2018), which highlighted elevated physiological loss in French beans stored under ambient conditions. The recommendation strongly emphasizes employing a storage temperature of 5°C within a modified atmospheric package, consistent with the suggestions of Nyaura et al. (2014), and Feás et al. (2014).
3.4.2 Moisture loss (%)
When palak was stored under ambient conditions, the moisture loss percentage was found to be the lowest in T5 (4.00%), closely followed by T3 at 4.24%, while T1 registered the highest moisture loss at 7.48%. In the context of refrigerated palak, T9 exhibited the lowest moisture loss at 2.23%, followed by T11 at 2.78%, while T10 showed the highest moisture loss at 9.48%. These findings align with the study conducted by Garande et al. (2019) on minimally processed lettuce, supporting the notion that LDPE covers, specific gas compositions, and refrigeration play pivotal roles in moisture preservation and, consequently, in prolonging the freshness of green leafy vegetables.
3.4.3 Firmness
Upon examining palak stored under ambient conditions, the highest firmness was observed in treatment T5, measuring 302.86 gf. Following closely, T3 displayed a firmness of 285.52 gf, while the lowest firmness reading was associated with T1 at 188.64 gf. However, when considering refrigerated palak, T9 exhibited the highest firmness at 360.97 gf, followed by T11 at 335.48 gf, and the lowest firmness was observed in T10, registering at 152.95 gf. This finding resonates with the study conducted by Yamauchi and Watada (1993), underscoring the positive impact of refrigerated storage, specific packaging materials (LDPE), and gas compositions (G2) on preserving the firmness and texture of green leafy vegetables during storage.
3.4.4 Quality ranking
Initially, the original color of the green leafy vegetables was studied, revealing that palak had a rank of 1 (Dark-green). Over an extended storage period, the color parameters for palak indicated that treatments T1, T2, T3, T4, T6, T8, T10, and T12 exhibited higher color retention, denoting a rank of 1 (Dark-green). Treatments T5, T7, T9, and T11 had a rank of 2 (Light-green).
Comparing different treatment results for wilting nature, showed that treatments T5 and T9 held a rank of 3, indicating slight wilting that is not objectionable, while treatments T3, T6, T7, and T11 had a rank of 5, representing moderate wilting becoming objectionable. The treatments with the highest wilting character were T1, T2, T4, T8, T10, and T12, all with a rank of 9, signifying extreme wilting that is not acceptable under normal conditions. Palak treatments T5 and T9 obtained the highest rank of 7 in terms of overall visual quality. The lowest rankings were for T2 and T4 for palak. These findings align with results reported in studies conducted by Garande et al. (2019), Reddy et al. (2013), Panta and Khanal (2018), and Jin et al. (2021).
4 Conclusion
Addressing the imperative of tackling national hunger and the rising use of soil-polluting fertilizers underscores the crucial need for a sustainable approach to Indian agriculture. In this context, vertical farming emerges as a promising solution. This precision agriculture technique allows meticulous control over nutrient and water management, optimizing land usage by yielding the equivalent of 4–6 acres of conventional cultivation on just one acre.
Palak, cultivated using the T9 treatment—a blend of coir pith and vermiculite (1,1) with a nutrient combination of 60:50:50 ppm—demonstrates optimal yield and leaf count. Coir pith and vermiculite, integral components of the growing medium, play pivotal roles in nutrient management. Coir pith, boasting a high cation exchange capacity (CEC), acts as a reservoir for essential nutrients, retaining them within its structure and gradually releasing them to the plants as needed. This property reduces the risk of nutrient leaching, ensuring sustained availability to the palak plants. Vermiculite complements this nutrient retention function by efficiently absorbing and retaining water and nutrients, preventing their loss through drainage or evaporation. Its porous structure facilitates optimal root penetration and nutrient absorption, further enhancing the plant’s ability to access essential elements for growth. By harnessing the nutrient retention and delivery capabilities of coir pith and vermiculite, farmers can precisely adjust the nutrient solution applied to the hydroponic system. This precision enables a reduction in the overall nutrient dosage needed to support palak growth while maintaining optimal nutrient levels for plant vitality and yield. Treatment 9 compromises all these necessities making it a promising option for the cultivation purposes. Hydroponically grown plants, focusing on higher yields through precise nutrient provision, mark a significant advancement in agriculture, holding promise as a boon to the sector.
Turning to post-harvest preservation, the study emphasizes the effectiveness of Low-Density Polyethylene (LDPE) packing material in mitigating physiological weight loss in palak produce. Additionally, refrigerated storage conditions significantly contribute to an extended shelf life compared to ambient storage conditions. High-Density Polyethylene (HDPE) packing material also exhibits favorable performance, aligning closely with the efficacy of LDPE materials.
In terms of gas composition, the study underscores that the second gas composition, comprising 6% oxygen, 5% carbon dioxide, and 89% nitrogen, demonstrates superior efficacy in prolonging the shelf life of palak. Modified Atmosphere Packaging (MAP) technology, with optimal storage conditions involving low temperatures alongside specific atmospheric compositions (3–8% CO2 and 2–5% O2), provides valuable guidelines for effective storage strategies in the preservation of palak. These insights contribute to ongoing efforts in innovative solutions for post-harvest preservation and food quality enhancement. Additionally, further research could focus on developing advanced packaging materials with improved biodegradability and environmental friendliness, aiming to address concerns related to plastic pollution in the agriculture sector. Moreover, investigating the potential synergies between vertical farming and urban planning to create integrated food production systems within cities could be a promising avenue for future exploration.
Data availability statement
The original contributions presented in the study are included in the article/supplementary material, further inquiries can be directed to the corresponding author.
Author contributions
MP: Conceptualization, Methodology, Formal analysis, Data curation, Writing – original draft. MA: Conceptualization, Methodology, Investigation, Data curation, Software, Visualization, Writing – review & editing. GA: Methodology, Supervision, Software, Validation, Visualization, Writing – original draft. PI: Project administration, Validation, Visualization, Writing – review & editing.
Funding
The author(s) declare that no financial support was received for the research, authorship, and/or publication of this article.
Acknowledgments
The authors thank Department of Vegetable science, TNAU, Coimbatore.
Conflict of interest
The authors declare that the research was conducted in the absence of any commercial or financial relationships that could be construed as a potential conflict of interest.
Publisher’s note
All claims expressed in this article are solely those of the authors and do not necessarily represent those of their affiliated organizations, or those of the publisher, the editors and the reviewers. Any product that may be evaluated in this article, or claim that may be made by its manufacturer, is not guaranteed or endorsed by the publisher.
References
Abou-Hadid, A. F., Abd-Elmoniem, E. M., El-Shinawy, M. Z., and Abou-Elsoud, M. (1995). Electrical conductivity effect on growth and mineral composition of lettuce plants in hydroponic system. Strateg. Market Orient. Greenhouse Product. 434, 59–66.
Acharya, S., Kumar, K., Sharma, N., Tiwari, V. K., and Chaurasia, O. P. (2021). Yield and quality attributes of lettuce and spinach grown in different hydroponic systems. J. Soil Water Conserv. 20, 342–349. doi: 10.5958/2455-7145.2021.00043.6
Adams, P. (2002). “Nutritional control in hydroponics” in Hydroponic Production of Vegetables and Ornamental. eds. D. Savvas and H. C. Passam (Athens: Embryo Publications).
Adams, M. R., Hartley, A. D., and Cox, L. J. (1989). Factors affecting the efficacy of washing procedures used in the production of prepared salads. Food Microbiol. 6, 69–77. doi: 10.1016/S0740-0020(89)80039-5
Aghdak, P., Mobli, M., and Khoshgoftarmanesh, A. H. (2016). Effects of different growing media on vegetative and reproductive growth of bell pepper. J. Plant Nutr. 39, 967–973. doi: 10.1080/01904167.2016.1143494
Agüero, M. V., Ponce, A. G., Moreira, M. R., and Roura, S. I. (2011). Lettuce quality loss under conditions that favor the wilting phenomenon. Postharvest Biol. Technol. 59, 124–131. doi: 10.1016/j.postharvbio.2010.08.018
Ahmed, Z. F. R., Askri, A., Alnuaimi, A. K. H., Altamimi, A. S. H. R., and Alnaqbi, M. M. A. (2021). “Liquid fertilizer as a potential alternative nutrient solution for strawberry production under greenhouse conditions” in III International Symposium on Soilless Culture and Hydroponics: Innovation and Advanced Technology for Circular Horticulture, 1321. pp. 165–172.
Albadwawi, M. A., Ahmed, Z. F., Kurup, S. S., Alyafei, M. A., and Jaleel, A. (2022). A comparative evaluation of aquaponic and soil systems on yield and antioxidant levels in basil, an important food plant in Lamiaceae. Agronomy 12:3007. doi: 10.3390/agronomy12123007
Alneyadi, K. S. S., Almheiri, M. S. B., Tzortzakis, N., Di Gioia, F., and Ahmed, Z. F. R. (2024). Organic-based nutrient solutions for sustainable vegetable production in a zero-runoff soilless growing system. J. Agric. Food Res. 15:101035. doi: 10.1016/j.jafr.2024.101035
Baranauskienė, R., Venskutonis, P. R., Viškelis, P., and Dambrauskienė, E. (2003). Influence of nitrogen fertilizers on the yield and composition of thyme (Thymus vulgaris). J. Agric. Food Chem. 51, 7751–7758. doi: 10.1021/jf0303316
Caso, C., Chang, M., and Rodríguez-Delfín, A. (2008). “Effect of the growing media on the strawberry production in column system” in International Symposium on Soilless Culture and Hydroponics. 843, pp. 373–380.
Chhetri, S., Dulal, S., Subba, S., and Gurung, K. (2022). Effect of different growing media on growth and yield of leafy vegetables in nutrient film technique hydroponics system. Archiv. Agric. Environ. Sci. 7, 12–19. doi: 10.26832/24566632.2022.070103
Cıceklı, M., and Barlas, N. T. (2014). Transformation of today greenhouses into high-technology vertical farming systems for metropolitan regions. J. Environ. Prot. Ecol. 15, 1066–1073.
Davis, M. J. M., Ramirez, F., and Pérez, M. E. (2016). More than just a Green Façade: vertical gardens as active air conditioning units. Procedia Engineering, 145, 1250–1257, doi: 10.1016/j.proeng.2016.04.161
Deekshith, S. S., Janavi, G. J., Rajangam, J., and Muthiah, C. (2022). Performance of leafy and fruit vegetables for growth and yield in vertical structure. Pharm. Innov. J. 11, 885–888.
Ebelhar, S. A., and Varsa, E. C. (2000). Applications in sustainable production: tillage and potassium placement effects on potassium utilization by corn and soybean. Commun. Soil Sci. Plant Anal. 31, 2367–2377. doi: 10.1080/00103620009370591
FAO (2021). FAOSTAT: Land use in FAO.org. Available at: http://www.fao.org/faostat/en/#data/RL
Feás, X., Pacheco, L., Iglesias, A., and Estevinho, L. M. (2014). Use of propolis in the sanitization of lettuce. Int. J. Mol. Sci. 15, 12243–12257. doi: 10.3390/ijms150712243
Garande, V. K., Raut, P. D., Shinde, U. S., Dhumal, S. S., Sonawane, P. N., and Sarvade, S. A. (2019). Studies on storage behavior of primary processed leafy vegetables under different storage conditions. Int. J. Curr. Microbiol. App. Sci. 8, 2249–2272. doi: 10.20546/ijcmas.2019.806.268
Jin, S., Ding, Z., and Xie, J. (2021). Modified atmospheric packaging of fresh-cut amaranth (Amaranthus tricolor l.) for extending shelf life. Agriculture 11:1016. doi: 10.3390/agriculture11101016
Jones, G. D., Droz, B., Greve, P., Gottschalk, P., Poffet, D., McGrath, S. P., et al. (2017). Selenium deficiency risk predicted to increase under future climate change. Proc. Natl. Acad. Sci. 114, 2848–2853. doi: 10.1073/pnas.1611576114
Kennard, N., Stirling, R., Prashar, A., and Lopez-Capel, E. (2020). Evaluation of recycled materials as hydroponic growing media. Agronomy 10:1092. doi: 10.3390/agronomy10081092
Lal, R. (2015). Restoring soil quality to mitigate soil degradation. Sustain. For. 7, 5875–5895. doi: 10.3390/su7055875
Lambin, E. F. (2012). Global land availability: Malthus versus Ricardo. Glob. Food Sec. 1, 83–87. doi: 10.1016/j.gfs.2012.11.002
Lehman, R. M., Cambardella, C. A., Stott, D. E., Acosta-Martinez, V., Manter, D. K., Buyer, J. S., et al. (2015). Understanding and enhancing soil biological health: the solution for reversing soil degradation. Sustain. For. 7, 988–1027. doi: 10.3390/su7010988
Li, Q., Li, X., Tang, B., and Gu, M. (2018). Growth responses and root characteristics of lettuce grown in aeroponics, hydroponics, and substrate culture. Horticulturae 4:35. doi: 10.3390/horticulturae4040035
Maheshwar, C., and Chanakwa, T. (2006). “Postharvest losses due to gaps in cold chain in India-a solution” in IV International Conference on Managing Quality in Chains-The Integrated View on Fruits and Vegetables Quality 712. pp. 777–784.
Mir, M. S., Naikoo, N. B., Kanth, R. H., Bahar, F. A., Bhat, M. A., Nazir, A., et al. (2022). Vertical farming: the future of agriculture: a review. Pharma Innov. J. 11, 1175–1195.
Naskoori, K., Reddy, K. K., Reddy, M. V., and Devi, M. R. (2021). To study the scope of vertical farming in India. Pharm. Innov. J. 11, 158–162.
Nyaura, J. A., Sila, D. N., and Owino, W. O. (2014). Post harvest Stabilityof vegetable Amaranthus (Amaranthus dubius) combined low temperature and modified atmospheric packaging. Food Science and Quality Management 30: 66–72.
Öztekin, G. B., Uludağ, T., and Tüzel, Y. (2018). Growing spinach (Spinacia oleracea L.) in a floating system with different concentrations of nutrient solution. Appl. Ecol. Environ. Res. 16, 3333–3350. doi: 10.15666/aeer/1603_33333350
Panta, R., and Khanal, A. (2018). Effect of modified atmospheric packaging on postharvest storage life of cilantro (Coriandrum sativum L.) stored under different conditions. J. Hortic. 5, 2376–0354.
Paull, R. (1999). Effect of temperature and relative humidity on fresh commodity quality. Postharvest Biol. Technol. 15, 263–277. doi: 10.1016/S0925-5214(98)00090-8
Petropoulos, S. A., Chatzieustratiou, E., Constantopoulou, E., and Kapotis, G. (2016). Yield and quality of lettuce and rocket grown in floating culture system. Notul. Bot. Hortic. Agrobot. Cluj-Napoca 44, 603–612. doi: 10.15835/nbha44210611
Pire, R., and Pereira, A. (2003). Propiedades físicas de componentes de sustratos de uso común en la horticultura del estado Lara. Venez. Propues. Metodol. Bioagro 15, 55–64.
Prasad, B. V. G., Chakravorty, S., Rao, P. G., and Deb, P. (2018). Effect of post-harvest treatments and packaging on spinach beet (Beta vulgaris var bengalensis Hort.) under ambient condition. Int. J. Curr. Microbiol. App. Sci. 7, 711–720. doi: 10.20546/ijcmas.2018.711.085
Reddy, J. B., Bharati, P., Naik, K. R., Chimmad, B. V., Itagi, S. K., and Hasalkar, S. (2013). Effect of packaging materials on shelflife of minimally processed rajagira leaves (Amaranthus paniculatus) Karnataka. J. Agric. Sci. 26: 285–287.
Roosta, H. R. (2011). Interaction between water alkalinity and nutrient solution pH on the vegetative growth, chlorophyll fluorescence and leaf magnesium, iron, manganese, and zinc concentrations in lettuce. J. Plant Nutr. 34, 717–731. doi: 10.1080/01904167.2011.540687
Rosli, N. S. M., Abdullah, R., Yaacob, J. S., and Razali, R. B. R. (2023). Effect of biochar as a hydroponic substrate on growth, colour and nutritional content of red lettuce (Lactuca sativa L.). Bragantia 82:e20220177. doi: 10.1590/1678-4499.20220177
Sapkota, S., Sapkota, S., and Liu, Z. (2019). Effects of nutrient composition and lettuce cultivar on crop production in hydroponic culture. Horticulturae 5:72. doi: 10.3390/horticulturae5040072
Shanmugabhavatharani, R., Priya, R. S., Kaleeswari, R. K., and Sankari, A. (2021). Performance assessment of mint on growth and yield attributes supplied with three nutrient combinations under two modified nutrient film technique (NFT). Pharm. Innov. J. 10, 17–22.
Soundy, P., Cantliffe, D. J., Hochmuth, G. J., and Stoffella, P. J. (2001). Nutrient requirements for lettuce transplants using a floatation irrigation system. I. Phosphorus. Am. Soc. Horticult. Sci. 36, 1066–1070. doi: 10.21273/HORTSCI.36.6.1066
Spehia, R. S., Devi, M., Singh, J., Sharma, S., Negi, A., Singh, S., et al. (2018). Lettuce growth and yield in hoagland solution with an organic concoction. Int. J. Veg. Sci. 24, 557–566. doi: 10.1080/19315260.2018.1452815
Sutnga, B., Bahadur, V., and Kerketta, A. (2021). Influence of nutrient concentration on growth, yield and quality of spinach (Spinacia oleracea L.) in hydroponic system. Int. J. Plant Soil Sci. 33, 36–42. doi: 10.9734/ijpss/2021/v33i2430749
Thakur, K., Partap, M., Kumar, D., and Warghat, A. R. (2019). Enhancement of picrosides content in Picrorhiza kurroa Royle ex Benth. Mediated through nutrient feeding approach under aeroponic and hydroponic system. Ind. Crop. Prod. 133, 160–167. doi: 10.1016/j.indcrop.2019.03.021
Touliatos, D., Dodd, I. C., and McAinsh, M. (2016). Vertical farming increases lettuce yield per unit area compared to conventional horizontal hydroponics. Food Energy Secur. 5, 184–191. doi: 10.1002/fes3.83
Valverde, M., Madrid, R., García, A. L., del Amor Saavedra, F. M., and Sánchez, L. F. R. (2013). Use of almond shell and almond hull as substrates for sweet pepper cultivation. Effects on fruit yield and mineral content. Span. J. Agric. Res. 11, 164–172. doi: 10.5424/sjar/2013111-3566
Velazquez-Gonzalez, R. S., Garcia-Garcia, A. L., Ventura-Zapata, E., Barceinas-Sanchez, J. D. O., and Sosa-Savedra, J. C. (2022). A review on hydroponics and the technologies associated for medium-and small-scale operations. Agriculture 12:646. doi: 10.3390/agriculture12050646
Verdonck, O., and Gabriels, R. (1992). Reference method for the determination of physical properties of plant substrates. II. Reference method for the determination of chemical properties of plant substrates. Acta Hortic. 302, 169–179.
Wellburn, A. R. (1994). The spectral determination of chlorophylls a and b, as well as total carotenoids, using various solvents with spectrophotometers of different resolution. J. Plant Physiol. 144, 307–313. doi: 10.1016/S0176-1617(11)81192-2
Wheeler, L., Kitinoja, L., and Barrett, D. M. (2015). Use of insulated covers over product crates to reduce losses in amaranth during shipping delays. Agriculture 5, 1204–1223. doi: 10.3390/agriculture5041204
Whipker, B. E., Bailey, D. A., Nelson, P. V., Fonteno, W. C., and Hammer, P. A. (1996). A novel approach to calculate acid additions for alkalinity control in greenhouse irrigation water. Commun. Soil Sci. Plant Anal. 27, 959–976. doi: 10.1080/00103629609369610
Wolff, X. Y., and Coltman, R. R. (1990). Productivity of eight leafy vegetable crops grown under shade in Hawaii. J. Am. Soc. Hortic. Sci. 115, 182–188. doi: 10.21273/JASHS.115.1.182
Yamauchi, N., and Watada, A. E. (1993). Pigment changes in parsley leaves during storage in controlled or ethylene containing atmosphere. J. Food Sci. 58, 616–618. doi: 10.1111/j.1365-2621.1993.tb04339.x
Yang, T., Samarakoon, U., Altland, J., and Ling, P. (2021). Photosynthesis, biomass production, nutritional quality, and flavor-related phytochemical properties of hydroponic-grown arugula (Eruca sativa mill.)‘standard’under different electrical conductivities of nutrient solution. Agronomy 11:1340. doi: 10.3390/agronomy11071340
Keywords: vertical farming, palak, growing media, nutrient solution, packing substrate, gas composition
Citation: Prabhadharshini MK, Anand M, Amuthaselvi G and Irene Vethamoni P (2024) Holistic palak cultivation: standardizing media, nutrients in vertical A-frames for extended shelf life efficiency. Front. Sustain. Food Syst. 8:1388231. doi: 10.3389/fsufs.2024.1388231
Edited by:
Maria Inês Dias, Centro de Investigação de Montanha (CIMO), PortugalReviewed by:
Zienab F. R. Ahmed, United Arab Emirates University, United Arab EmiratesThirugnanavel Anbazhagan, Central Citrus Research Institute (ICAR), India
Copyright © 2024 Prabhadharshini, Anand, Amuthaselvi and Irene Vethamoni. This is an open-access article distributed under the terms of the Creative Commons Attribution License (CC BY). The use, distribution or reproduction in other forums is permitted, provided the original author(s) and the copyright owner(s) are credited and that the original publication in this journal is cited, in accordance with accepted academic practice. No use, distribution or reproduction is permitted which does not comply with these terms.
*Correspondence: M. Anand, YW5hbmRob3J0QGdtYWlsLmNvbQ==