 Noel Ndlovu1,2†
 Manje Gowda1*†
 Yoseph Beyene1†
 Vijay Chaikam1†
 Felister M. Nzuve3
 Dan Makumbi1†
 Peter C. McKeown2†
 Charles Spillane2†
 Boddupalli M. Prasanna1†
- 1International Maize and Wheat Improvement Center (CIMMYT), Nairobi, Kenya
- 2Agriculture & Bioeconomy Research Centre, Ryan Institute, University of Galway, Galway, Ireland
- 3Department of Plant Science and Crop Protection, University of Nairobi, Nairobi, Kenya
Smallholder maize farming systems in sub-Saharan Africa (SSA) are vulnerable to drought-induced yield losses, which significantly impact food security and livelihoods within these communities. Mapping and characterizing genomic regions associated with water stress tolerance in tropical maize is essential for future breeding initiatives targeting this region. In this study, three biparental F3 populations composed of 753 families were evaluated in Kenya and Zimbabwe and genotyped with high-density single nucleotide polymorphism (SNP) markers. Quantitative trait loci maping was performed on these genotypes to dissect the genetic architecture for grain yield (GY), plant height (PH), ear height (EH) and anthesis-silking interval (ASI) under well-watered (WW) and water-stressed (WS) conditions. Across the studied maize populations, mean GY exhibited a range of 4.55–8.55 t/ha under WW and 1.29–5.59 t/ha under WS, reflecting a 31–59% reduction range under WS conditions. Genotypic and genotype-by-environment (G × E) variances were significant for all traits except ASI. Overall broad sense heritabilities for GY were low to high (0.25–0.60). For GY, these genetic parameters were decreased under WS conditions. Linkage mapping revealed a significant difference in the number of QTLs detected, with 93 identified under WW conditions and 41 under WS conditions. These QTLs were distributed across all maize chromosomes. For GY, eight and two major effect QTLs (>10% phenotypic variation explained) were detected under WW and WS conditions, respectively. Under WS conditions, Joint Linkage Association Mapping (JLAM) identified several QTLs with minor effects for GY and revealed genomic region overlaps in the studied populations. Across the studied water regimes, five-fold cross-validation showed moderate to high prediction accuracies (−0.15–0.90) for GY and other agronomic traits. Our findings demonstrate the polygenic nature of WS tolerance and highlights the immense potential of using genomic selection in improving genetic gain in maize breeding.
1 Introduction
Across Africa, circa 40% of maize-growing areas are exposed to recurrent drought (Fisher et al., 2015), with a frequency of 10-20% (Tesfaye et al., 2016). These droughts are responsible for substantial grain yield losses exceeding 20% in smallholder farming systems. Previous studies have shown that with each additional degree day above 30°C, maize grain yield under water-stressed (WS) conditions is reduced by 1.7% (Lobell et al., 2011). These drought-induced yield losses can be attributed to several trait-related factors - including reduced kernel size, inhibited ear elongation (Wang et al., 2019) and delayed silking (Sah et al., 2020). Water stress can also have negative effects on the nutritional quality of maize grain (Barutcular et al., 2016; Sehgal et al., 2018), which is a concern for the already malnourished smallholder farmer communities in sub-Saharan Africa (SSA). Over the past decades, the adverse effects of WS have been more pronounced in rainfed (Lunduka et al., 2019) maize-dependent smallholder farming systems in SSA. In this region, maize grain yield [range: 1–3 tonne ha−1 (Prasanna et al., 2020)] and quality losses are further compounded by other limiting factors such as heat stress (Chukwudi et al., 2021), low soil nitrogen stress (Ndlovu et al., 2022; Kimutai et al., 2023), insect pest infestations (Deutsch et al., 2018), disease incidences (Beyene et al., 2017) and limited access to quality seeds among smallholders (Breen et al., 2024).
Despite the widely reported unpredictability of drought (Seleiman et al., 2021), farmers and researchers can adopt a range of strategies to curb yield losses (Muroyiwa et al., 2022). Such strategies include the development, release, and adoption of WS-tolerant maize varieties. On-farm trials conducted in SSA have shown that WS-tolerant varieties of maize can have a 5–40% grain yield advantage over traditional varieties under WS conditions (Tesfaye et al., 2016). Such yield advantage has been reported to generate extra income for maize-dependent households [e.g., up to US$240/ha or > 9 months of food sufficiency in Zimbabwean households (Lunduka et al., 2019)]. Advancing genetic gains for WS-tolerant maize varieties is, therefore, an essential component of the basket of technology options for improving the resilience of smallholder maize farming systems (Habte et al., 2023) in SSA. However, breeding for WS-tolerant maize varieties presents several challenges due to the complex nature of WS and the need to advance genetic gain concurrently for a range of yield-related traits.
Breeding for higher maize grain yields under WS has been limited by genotype-by-environment (G × E) effects and low heritability (Collins et al., 2008). As water stress tolerance is a multigenic trait, investigations of grain yield under WS also involve evaluating a range of secondary traits, including anthesis-silking interval (ASI) (Bolaños and Edmeades, 1996; Gopalakrishna K. et al., 2023), reduced water potential and root development (Thirunavukkarasu et al., 2014), ear height-to-plant height ratio (Zhao et al., 2019) and number of ears per plant (Badu-Apraku et al., 2019). Other studies have also measured high water-holding capacity, enhanced cell wall biosynthesis and stability of photosynthesis (Zhang et al., 2020). Most of these traits have higher heritabilities than grain yield and can be good secondary traits to enhance selection for drought tolerance in maize. Using conventional breeding to improve traits associated with WS tolerance presents a range of challenges, including its laborious and slow nature (Nikolić et al., 2013). However, there is significant potential to overcome some WS-tolerance breeding challenges by incorporating molecular breeding [e.g., quantitative-trait loci (QTL) mapping (Zhao et al., 2019; Hu et al., 2021; Sarkar et al., 2023), genome-wide association studies (GWAS) (Khan et al., 2022; Anilkumar et al., 2023; Chen et al., 2023) and genomic selection (GS) (Beyene et al., 2015; Cerrudo et al., 2018; He et al., 2019; Ndlovu et al., 2022, 2024; Zhang et al., 2022)] and phenomics-assisted breeding [i.e., high-throughput phenotyping (Wu et al., 2021)] approaches. To unravel the genetic architecture of WS tolerance in tropical maize, molecular breeding approaches have become crucial for improving this complex trait.
A range of studies have identified genomic regions associated with the tolerance of maize lines to WS conditions. These studies have shown that WS tolerance is a complex trait governed by many minor QTLs (Choudhary et al., 2023). For instance, Osuman et al. (2022) identified 27 single nucleotide polymorphisms (SNPs), with four SNPs [SNP_138825271 (Chr. 3), SNP_244895453 (Chr. 4), SNP_168561609 (Chr. 5), and SNP_62970998 (Chr. 6)] having pleiotropic effects on anthesis days, silking days and husk cover under terminal drought. Under both WS and well-watered (WW) conditions, Zaidi et al. (2016) identified 37 SNPs for grain yield and shoot biomass. Two of these SNPs (SNPs S1_211520521 and S2_20017716) were associated with shoot biomass and transpiration efficiency under WS. For plant height, 120 SNPs were identified by Wallace et al. (2016) from 15 tropical maize populations grown under WS in SSA. Thirunavukkarasu et al. (2014) identified SNPs associated with functional traits such as stomatal closure, root development, flowering, detoxification, and reduced water potential under drought stress, Yuan et al. (2019) identified 46 differentially expressed candidate genes under both WS and WW conditions. At the seedling stage, Chen et al. (2023) identified 15 candidate genes for water stress tolerance in maize.
Combining QTL mapping with GWAS can enhance the identification of markers associated with various traits of interest (Chen et al., 2016; Zhou et al., 2018; Li et al., 2020; Ndlovu et al., 2022; Sallam et al., 2022). The identified markers can then be utilized in marker-assisted recurrent selection (MARS) for improving WS tolerance in tropical maize (Beyene et al., 2016). GS is also a promising tool for improving polygenic traits (like WS tolerance in maize). Unlike MARS, GS can capture the effects of many small-effect QTLs (Bentley et al., 2014; Cerrudo et al., 2018). Several studies also showed that incorporation of markers linked to major effect QTLs as a fixed effect in genomic prediction model can improve the prediction accuracy as observed for Striga resistance (Gowda et al., 2021) and maize lethal necrosis resistance in maize (Gowda et al., 2015). To understand the effectiveness of QTL mapping and GS in dissecting the genetic basis of WS tolerance, a set of tropical bi-parental maize populations evaluated in Kenya and Zimbabwe were used in this study. The study sought to (i) compare the quantitative genetic parameters (i.e., heritability, variance, and genetic correlation) of grain yield and secondary traits under WW and WS conditions; (ii) identify the genomic regions through linkage mapping and joint linkage association mapping for grain yield and other traits in three F3 populations evaluated in multiple locations; and (iii) assess the potential of GS in improving grain yield and related traits under WW and WS conditions.
2 Materials and methods
2.1 Plant materials, experimental design, and crop management
Three biparental F3 maize populations comprised of 753 families developed by the Global Maize Program of the International Maize and Wheat Improvement Centre (CIMMYT) were evaluated under WW and managed WS conditions. Population 1 comprised 240 F3 families from the cross CML543 × CML444, Population 2 comprised 255 F3 families from the cross CML543 × LaPostaSeqC7-F71 and Population 3 comprised 258 F3 families from the cross CKL5009 × LaPostaSeqC7-F71. CML444 and LaPostaSeqC7-F7 are known WS-tolerant lines; CML543, on the other hand, perform better under WW and is resistant to foliar diseases. CML444 from heterotic group B is extensively used as a drought tolerant donor line in SSA and is adapted to mid-altitude region. It is also known to be tolerant to low soil N stress and resistant to maize streak virus, ear rot, and northern corn leaf blight. CML543 is another promising elite line that was developed from a CML202xCML395 derived population known for being tolerant to foliar diseases like gray leaf spot, northern corn leaf blight and common rust. LapostaSeqC7-F71 and CKL5009 are the other parents used in population development. LapostaSeqC7-F71 was derived from the LapostaSequia germplasm, a known source for developing WS-tolerant elite donors. In addition to WS-tolerance, LapostaSeqC7-F71 also exhibits tolerance to ear rot. CKL5009, developed from Kenya Agricultural and Livestock Research Organization’s germplasm, is known to be moderately tolerant to drought and tolerant to low soil N conditions. All 753 F3 families from the three bi-parental populations were test-crossed to a single cross-tester for phenotypic evaluation. The testcross progenies were evaluated across six sites in Kenya and one site in Zimbabwe (Table 1). Field trials in Kakamega and Kiboko were all evaluated over a two-year period.
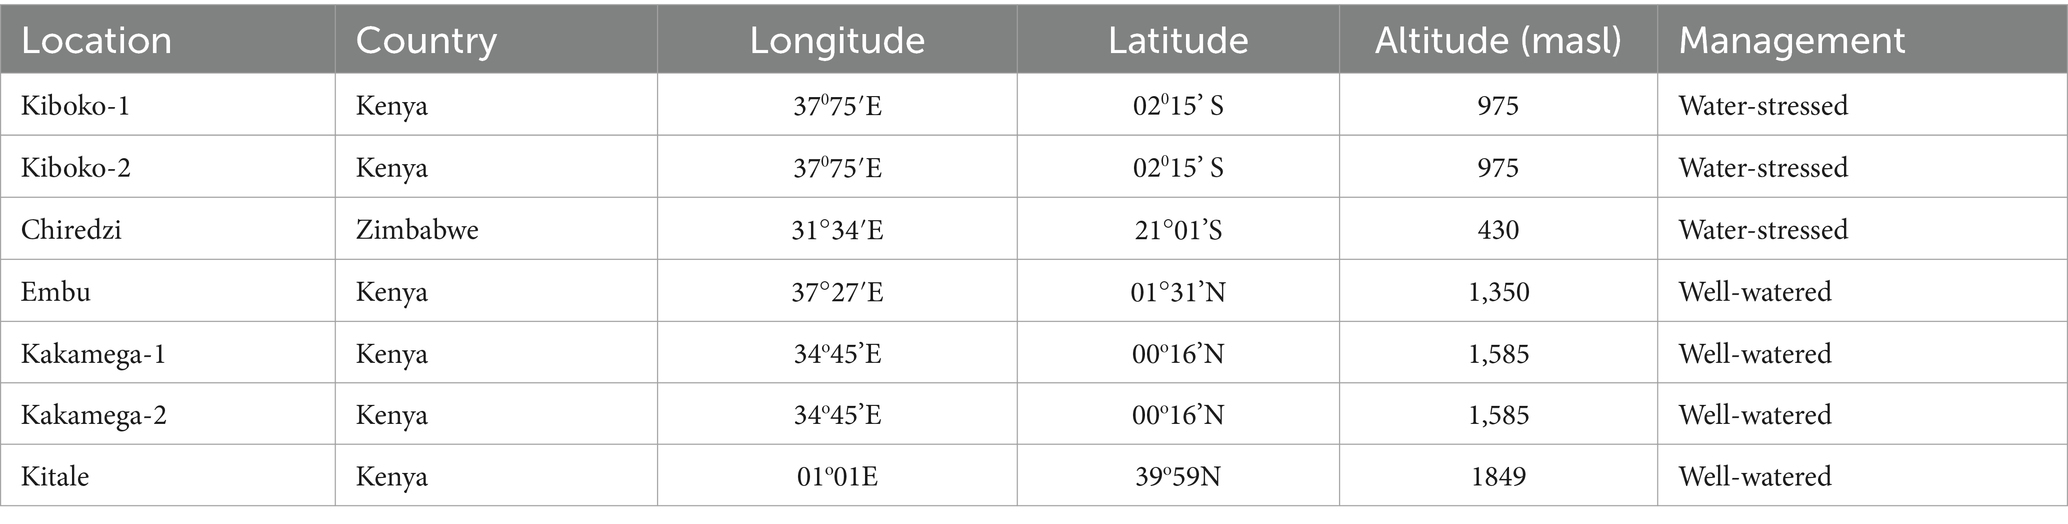
Table 1. Agro-climatic characteristics and management at seven field sites used for the evaluation of the bi-parental populations of tropical maize.
Trials of each test cross were planted in single row (4 m) plots with 2 replications at all locations. The field layout was an alpha (0,1) lattice design. Experiments were laid out in a 40 × 6, 51 × 5 and 43 × 6 alpha lattice design for F3 pop 1, pop 2 and pop 3, respectively. Four commercial checks (DKC8031, H513, WH504 and WH505) and two parents of each population were used so that the total of the experimental genotypes were 240, 255 and 258 for F3 pop 1, pop 2 and pop 3, respectively. Standard agronomic management practices were followed. All populations were planted in the same season in adjacent plots. The genotypes were subjected to WW and WS management conditions. In the WS trial, drought stress was imposed following the CIMMYT-established protocol (Bänziger et al., 2000). Trials for WS evaluations were irrigated once a week until 2 weeks prior to the expected flowering date in each population. Irrigation was withdrawn and the water stress condition was maintained till harvest. For WW trials, planting was done in the main rainy season and whenever needed, irrigation was provided to avoid any stress.
2.2 Phenotypic data collection and analyses
A total of ten traits (i.e., grain yield (GY), anthesis date (AD), silking date (SD), anthesis-silking interval (ASI), plant height (PH), ear height (EH), ear rot (ER), ears per plant (EPP), ear position (EPO) and ear aspect (EA)) were measured for all bi-parental populations under WW and WS regimes. All ears harvested from each plot were shelled and weighed to determine total GY (in kg), then converted to t/ha by dividing the total GY per plot by the plot area. The grain moisture content (MOI) of the shelled grains at harvest was determined using a hand-held moisture meter and recorded in percentages. The ASI was calculated as the difference between SD and AD in days. SD was recorded as the number of days from sowing to at least 50% silk emergence in each plot, while AD was recorded as the number of days from sowing to when 50% of the plants per plot had shed pollen. PH was measured in centimetres (cm) from the base of the plant to the tip of the tassel. EH was measured in cm from the ground to the node bearing the highest ear. Five representative plants were measured at maturity in each plot for both PH and EH. EA was measured on a scale of 1–5, where 1 = nice and uniform cobs with the preferred texture; 5 = cobs with undesirable texture. EPO was calculated as the ratio of EH to PH.
Analyses of variance for each bi-parental population at each and across environments (i.e., WW and WS regimes) were performed using ASREML-R (Gilmour et al., 2009) and META-R (Alvarado et al., 2020). The following statistical mixed model was used to estimate variance components:
where Yijko is the phenotypic performance of the ith genotype at the jth environment in the kth replication of the oth incomplete block, μ is an intercept term, Gi is the genetic effect of the ith genotype, Ej is the effect of the jth environment, (GE)ij is the interaction effect between genotype and environment, R(E)kj is the effect of the kth replication at the jth environment, B(R.E)ojk is the effect of the oth incomplete block in the kth replication at the jth environment, and eijko is the residual. The genotypic effect (Gi), genotype by environment interaction (GEI) and effect of incomplete blocks were treated as random effects to estimate their variances and residual error. Environments and replications were treated as fixed effects. Assuming fixed genotypic effects, a mixed linear model was fitted to obtain the best linear unbiased estimates (BLUEs). Broad-sense heritability (H2) was estimated as the ratio of genotypic to phenotypic ratio from the variance components. META-R software (Alvarado et al., 2015) was used to obtain the best linear unbiased prediction (BLUP) for each genotype across environments. BLUEs and BLUPs across the population were also obtained with the mixed model through META-R software.
2.3 Molecular data analysis
All three bi-parental populations used in this study were also used in earlier QTL mapping studies for maize lethal necrosis (MLN) disease (Gowda et al., 2018). Detailed description of the molecular markers used and the linkage map construction are also described in our earlier study (Gowda et al., 2018). In brief, DNA of all lines of the bi-parental populations was extracted from seedlings at the 3–4 leaf stage and genotyped using the genotype-by-sequencing (GBS) platform at the Institute for Genomic Diversity, Cornell University, Ithaca, USA, using high density markers, as per the protocol described in (Elshire et al., 2011). For SNP calling, raw data in a FASTQ file together with the barcode information and Tags On Physical Map (TOPM) data, which had SNP position information was used. We used TOPM data from AllZeaGBSv2.7 downloaded from Panzea,1 which contained information for 955,690 SNPs mapped with B73 AGPv2 coordinates. The TASSEL-GBS pipeline was used for calling SNPs (Glaubitz et al., 2014). TASSEL ver. 5.2 (Bradbury et al., 2007) was used to exclude SNPs with heterozygosity of >5%, minor allele frequency (MAF) of <0.05, and a minimum count of 90% by filtering from raw GBS SNP markers in all populations. The number of SNPs was further reduced by selecting homozygous and polymorphic markers between the parents in each population. SNPs were further filtered based on the minimum distance between the markers. We used the criteria of minimum distance between adjacent SNPs as ≥200 Kilo base pairs (Kbps) to ensure uniform distribution of markers throughout the genome. For joint linkage association mapping (JLAM), markers from all three bi-parental populations were combined, and markers with <1% missing value and > 5% MAF and Heterozygosity of <5% were retained. Finally, a set of 5,490 SNPs that are uniformly distributed across the genome were used for JLAM analyses.
QTL IciMapping ver. 4.1 (Meng et al., 2015) was used to construct the linkage map based on data from all three biparental populations. QTL IciMapping was used to remove the highly correlated SNPs that do not provide any additional information by using an inbuilt tool BIN. This resulted in the retention of 560, 556 and 555 high-quality SNPs in populations 1, 2 and 3, respectively. These SNPs were used to construct linkage maps using the MAP function, by selecting the most significant markers using stepwise regression. A likelihood ratio test was used to calculate the logarithm of odds (LOD) for each marker at a score of >3 with a 30 cM maximum distance between two loci. The Kosambi mapping function (Kosambi, 1944) was used to transform the recombination frequencies between two linked loci. BLUPs across environments were used to detect QTLs based on Inclusive interval mapping (ICIM) for each population. The phenotypic variation explained by individual QTLs and the total variation explained by QTLs was estimated. QTL naming was done with the letter “q” indicating QTL, followed by an abbreviation of the trait name, the chromosome, and the marker position, respectively.
2.4 Joint linkage association mapping
For JLAM, high-quality and uniformly distributed 5,490 SNPs across three F3 populations were selected. The SNPs were then used to construct a linkage map based on their physical positions. A biometric model (Würschum et al., 2012; Kibe t al., 2020) was used to perform JLAM, with BLUPs across environments and populations being applied for analysis. After testing several biometric models, one which performed well for association studies in multiple segregating biparental populations (Würschum et al., 2012) was used to conduct the JLAM. This model controls the differences in population means by incorporating population effect, and the genetic background by using cofactors and marker effects across populations. This model was explained in detail by Liu et al. (2011) and Würschum et al. (2012). With this model, first-step cofactors were selected based on the Schwarz Bayesian Criterion (Schwarz, 1978) by including a population effect and in the second step, p values were calculated for the F-test by using a full model (including SNP effect) versus a reduced model (without SNP effect). Cofactors were selected by using PROC GLM SELECT from SAS 9.4 (SAS Institute Inc. 2015) and genome-wide scans for QTLs were applied in R (ver. 4.3.1) (R Core Team, 2023).
2.5 Genomic prediction
Genome-wide prediction was applied for GY and all other traits within and across three F3 populations with five-fold cross-validation. BLUEs across locations obtained under WW and WS management were used with a ridge-regression BLUP prediction model (Zhao et al., 2012; Sitonik et al., 2019). For genomic prediction, 4,000 common SNPs for each of the three populations which were distributed uniformly across the genome with no missing values were selected. To understand the effect of different training populations on accuracy, genomic prediction was carried out in three scenarios of cross-validation within and across biparental populations. Scenario 1: both training and testing populations are drawn from within each segregating population. In Scenario 2, the training population is derived from across populations, and the testing population was drawn from within each population whereas, for Scenario 3, both the training and testing population was derived from across populations. For Scenarios 2 and 3, the estimation of marker effects was based on the genotypic variance of the total populations. For Scenario 1, the estimates of the genotypic variance and heritability within segregating populations were used in the rr-BLUP model. The prediction accuracy of GS was calculated as r GS = r MP /h, where h refers to the square root of heritability and r MP is the correlation between observed and predicted phenotypes (Dekkers, 2007). For each trait in each population and each scenario, 100 iterations were done for sampling the training and testing sets.
3 Results
3.1 Effect of water stress on maize grain yield and related traits
The mean GY of the four parents CML543, CML444, LapostasequiaC7-F71 and CKL5009 (used to develop the studied bi-parental maize populations) were 6.97, 6.30, 6.31 and 5.87 t/ha under WW conditions, and 2.32, 2.68, 5.08 and 3.69 t/ha under managed WS conditions, respectively. Across the three bi-parental maize populations, significant variations were observed for GY, EH, PH and ASI in both WW and WS regimes (Figure 1; Tables 2, 3). Mean GY for pop 1 (CML543 × CML444), pop 2 (CML543 × LPSC7-F71) and pop 3 (CKL5009 × LPSC7-F71), and across populations were 6.38, 7.04, 6.04 and 6.41 t/ha under WW and 2.66, 3.72, 4.08 and 3.50 t/ha under WS management, respectively (Figure 1). Across the three bi-parental maize populations, mean GY ranged from 4.55 to 8.55 t/ha and 1.29 to 5.59 t/ha under WW and WS conditions, respectively. Overall analysis showed that under WS environments, GY reductions were 59, 48, and 31% in pop 1, pop 2 and pop 3, respectively. The ranges of ASI values were wider under WS conditions than under WW conditions (Figure 1). Across all populations, we observed ASI, PH and EH means of 1.48 days, 241.65 cm, and 127.76 cm, respectively under WW conditions. Under WS conditions, the recorded means for ASI, PH and EH were 2.12 days, 210.71 cm, and 127.1 cm, respectively. Interestingly, mean ASI across the studied maize populations was 2.6 days longer under WS conditions than under WW conditions. The BLUEs and BLUPs for each and combined populations and markers used in this study are presented in Supplementary Table S1.
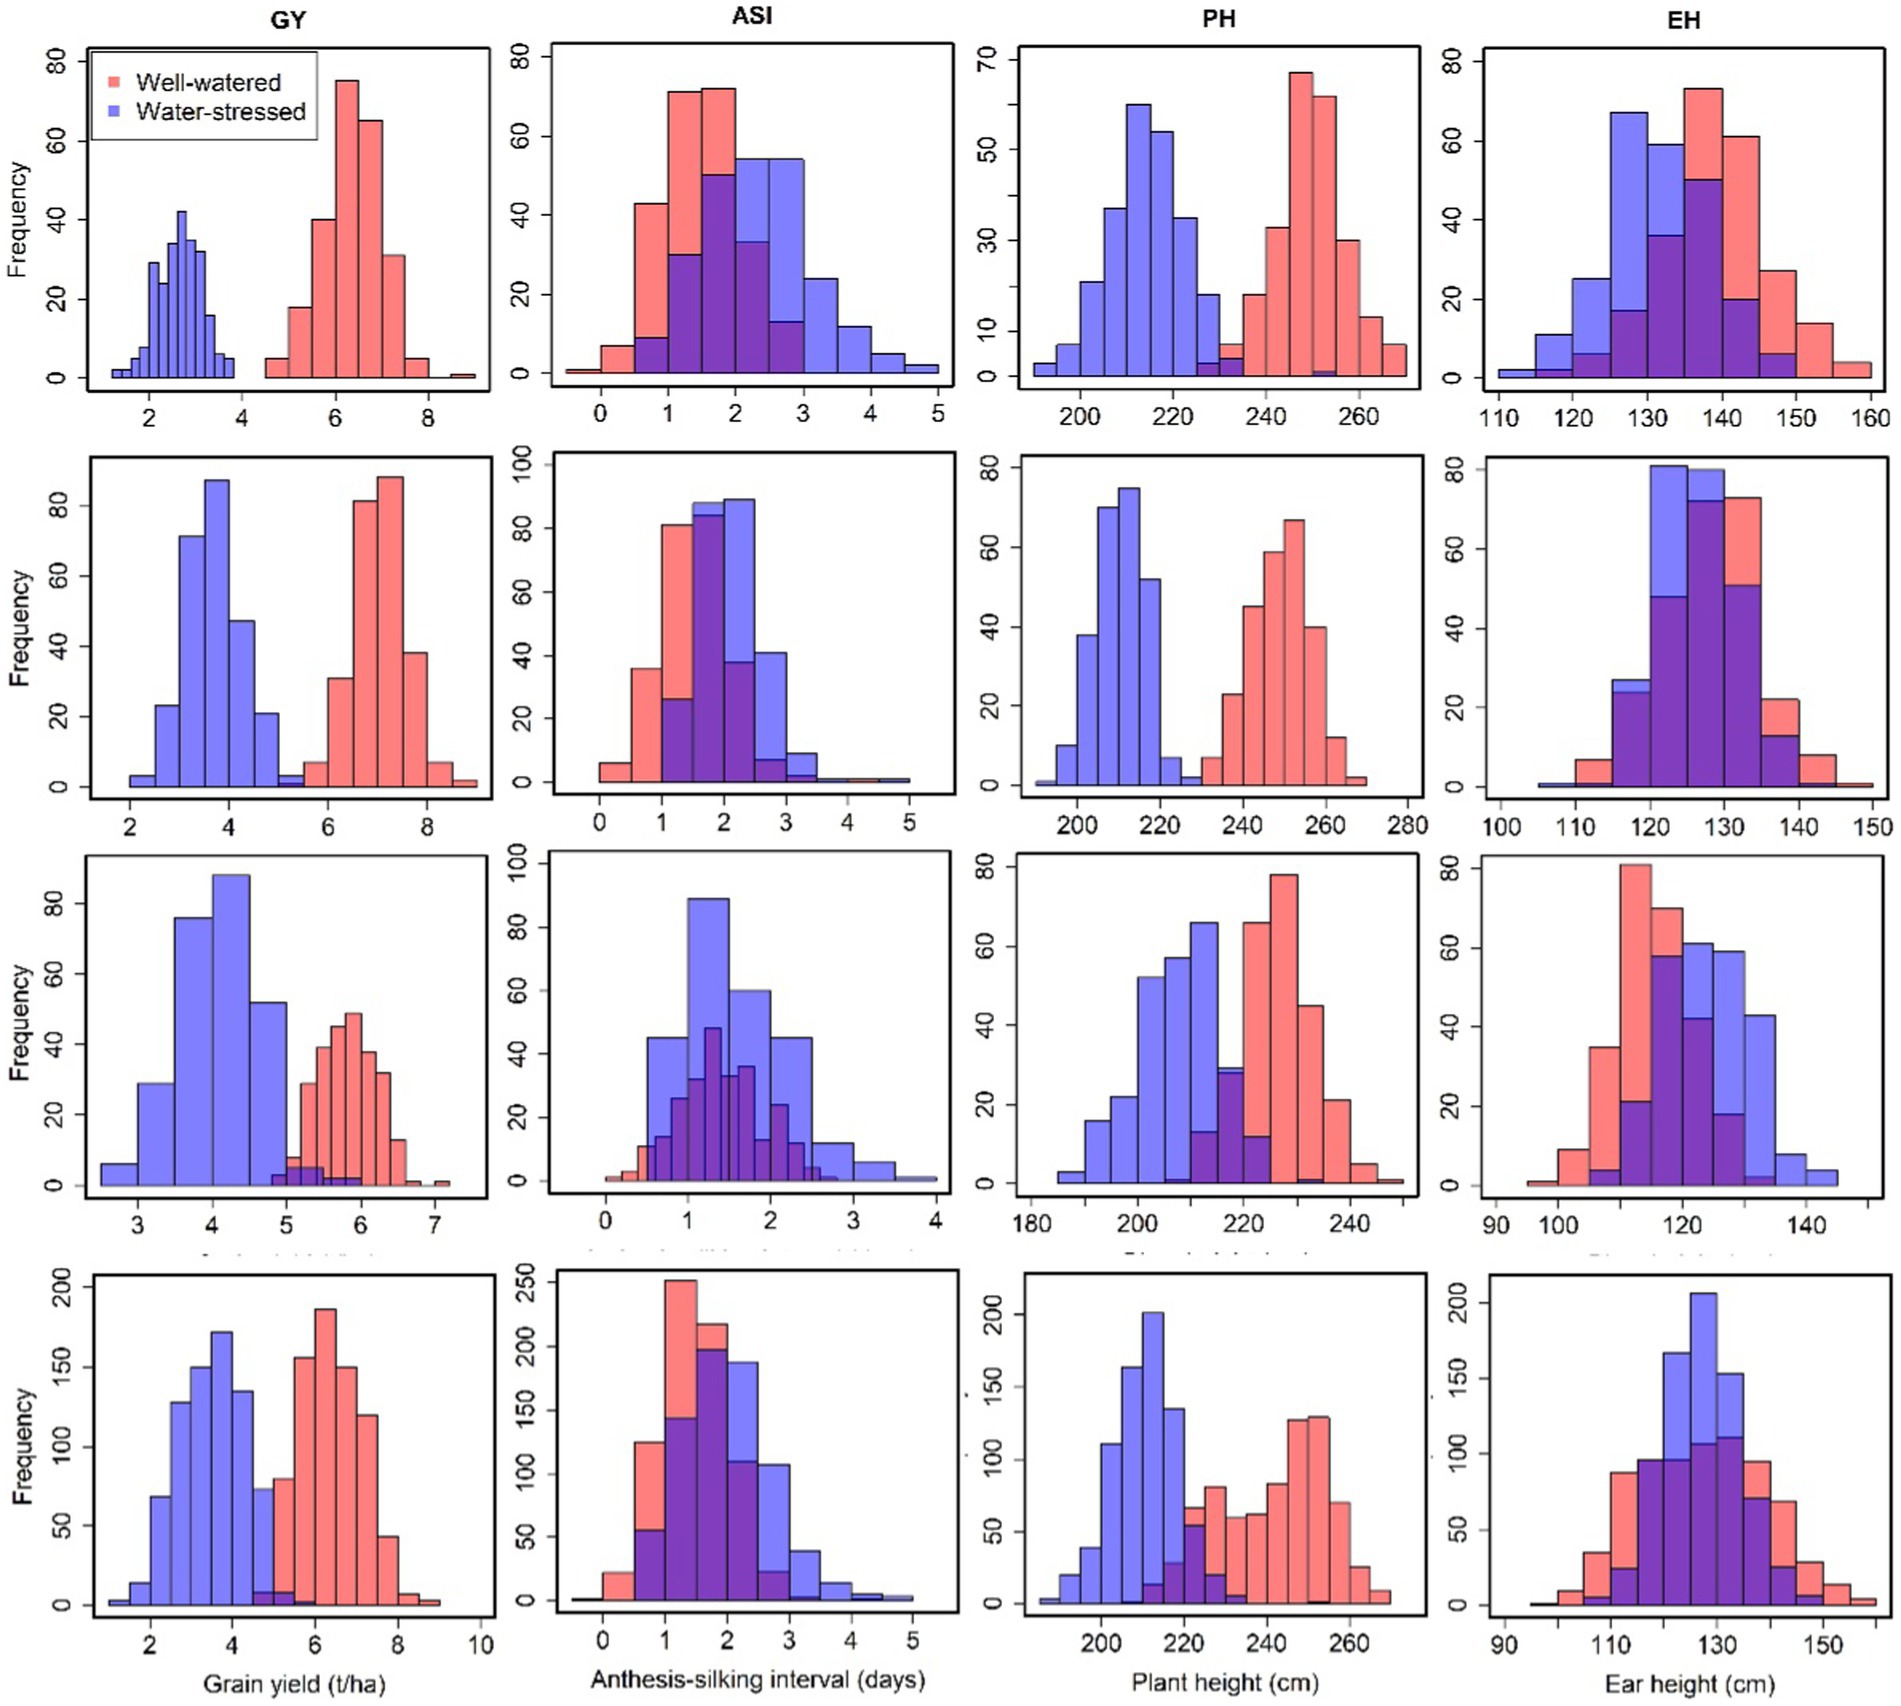
Figure 1. Phenotypic distribution of grain yield and related traits tested under well-watered and water-stressed conditions in Kenya and Zimbabwe. The orange and purple color plots represent the field trials conducted under well-watered and water-stressed conditions, respectively.
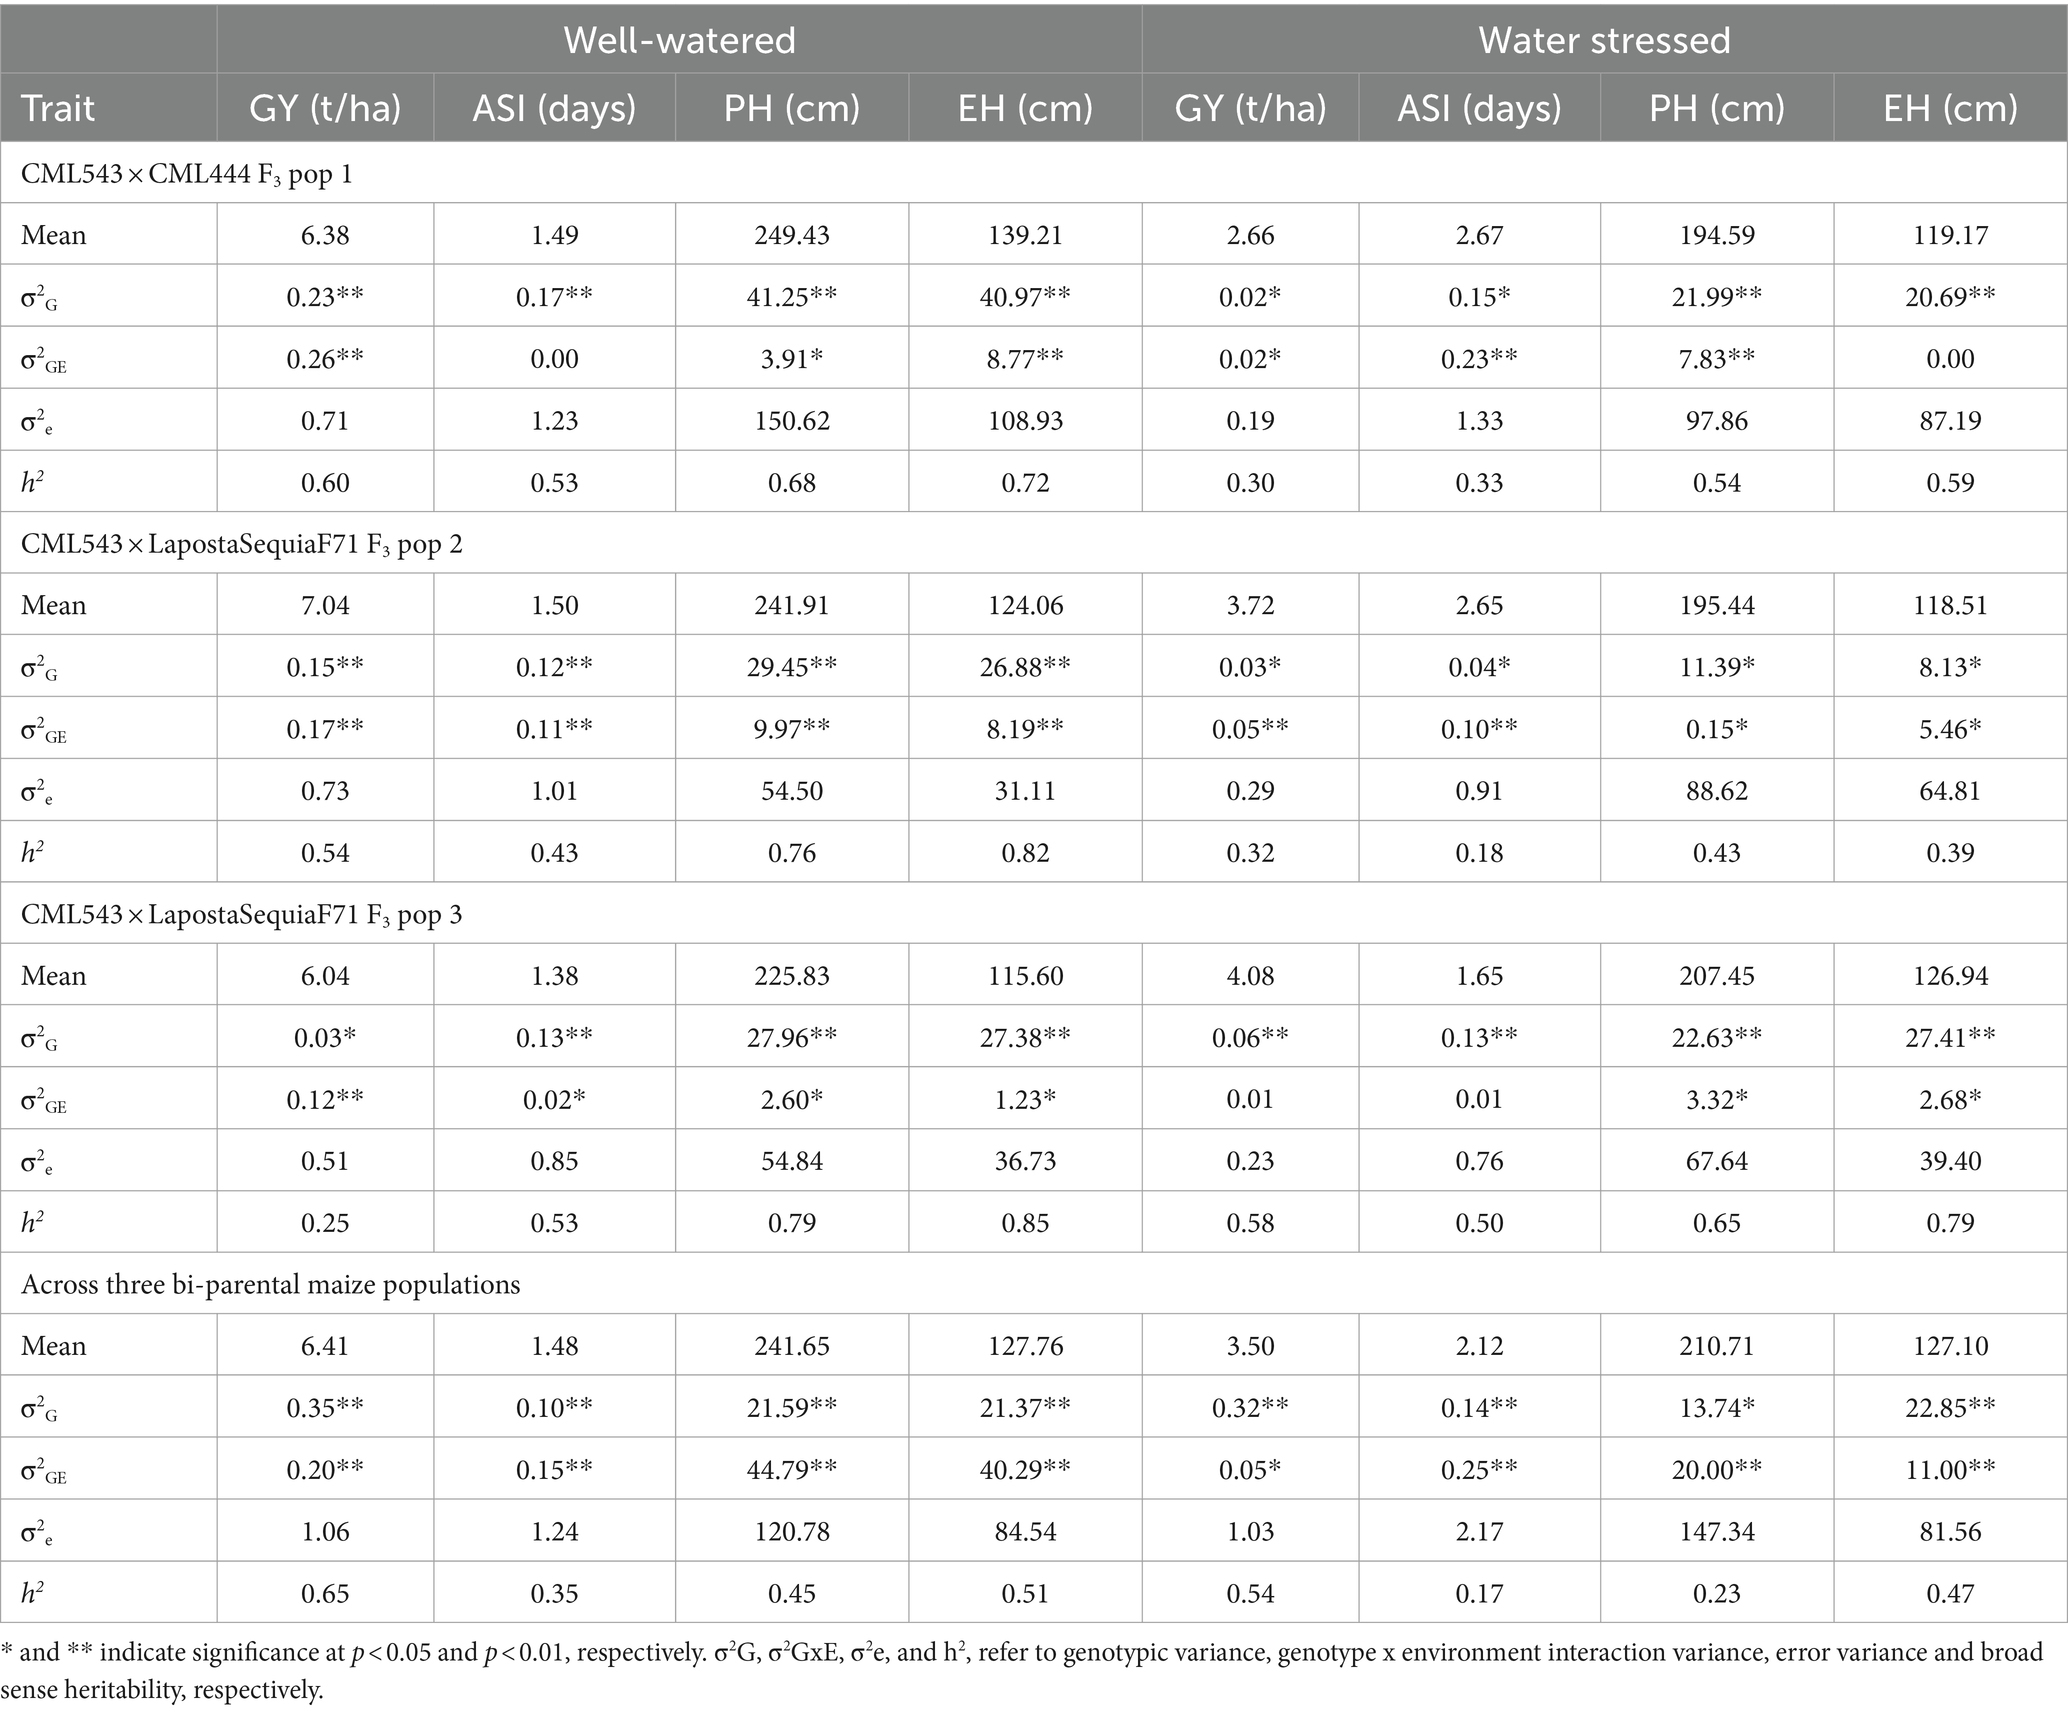
Table 2. Genetic parameters for the individual and combined three bi-parental populations evaluated under well-watered and water-stressed conditions in multiple environments.
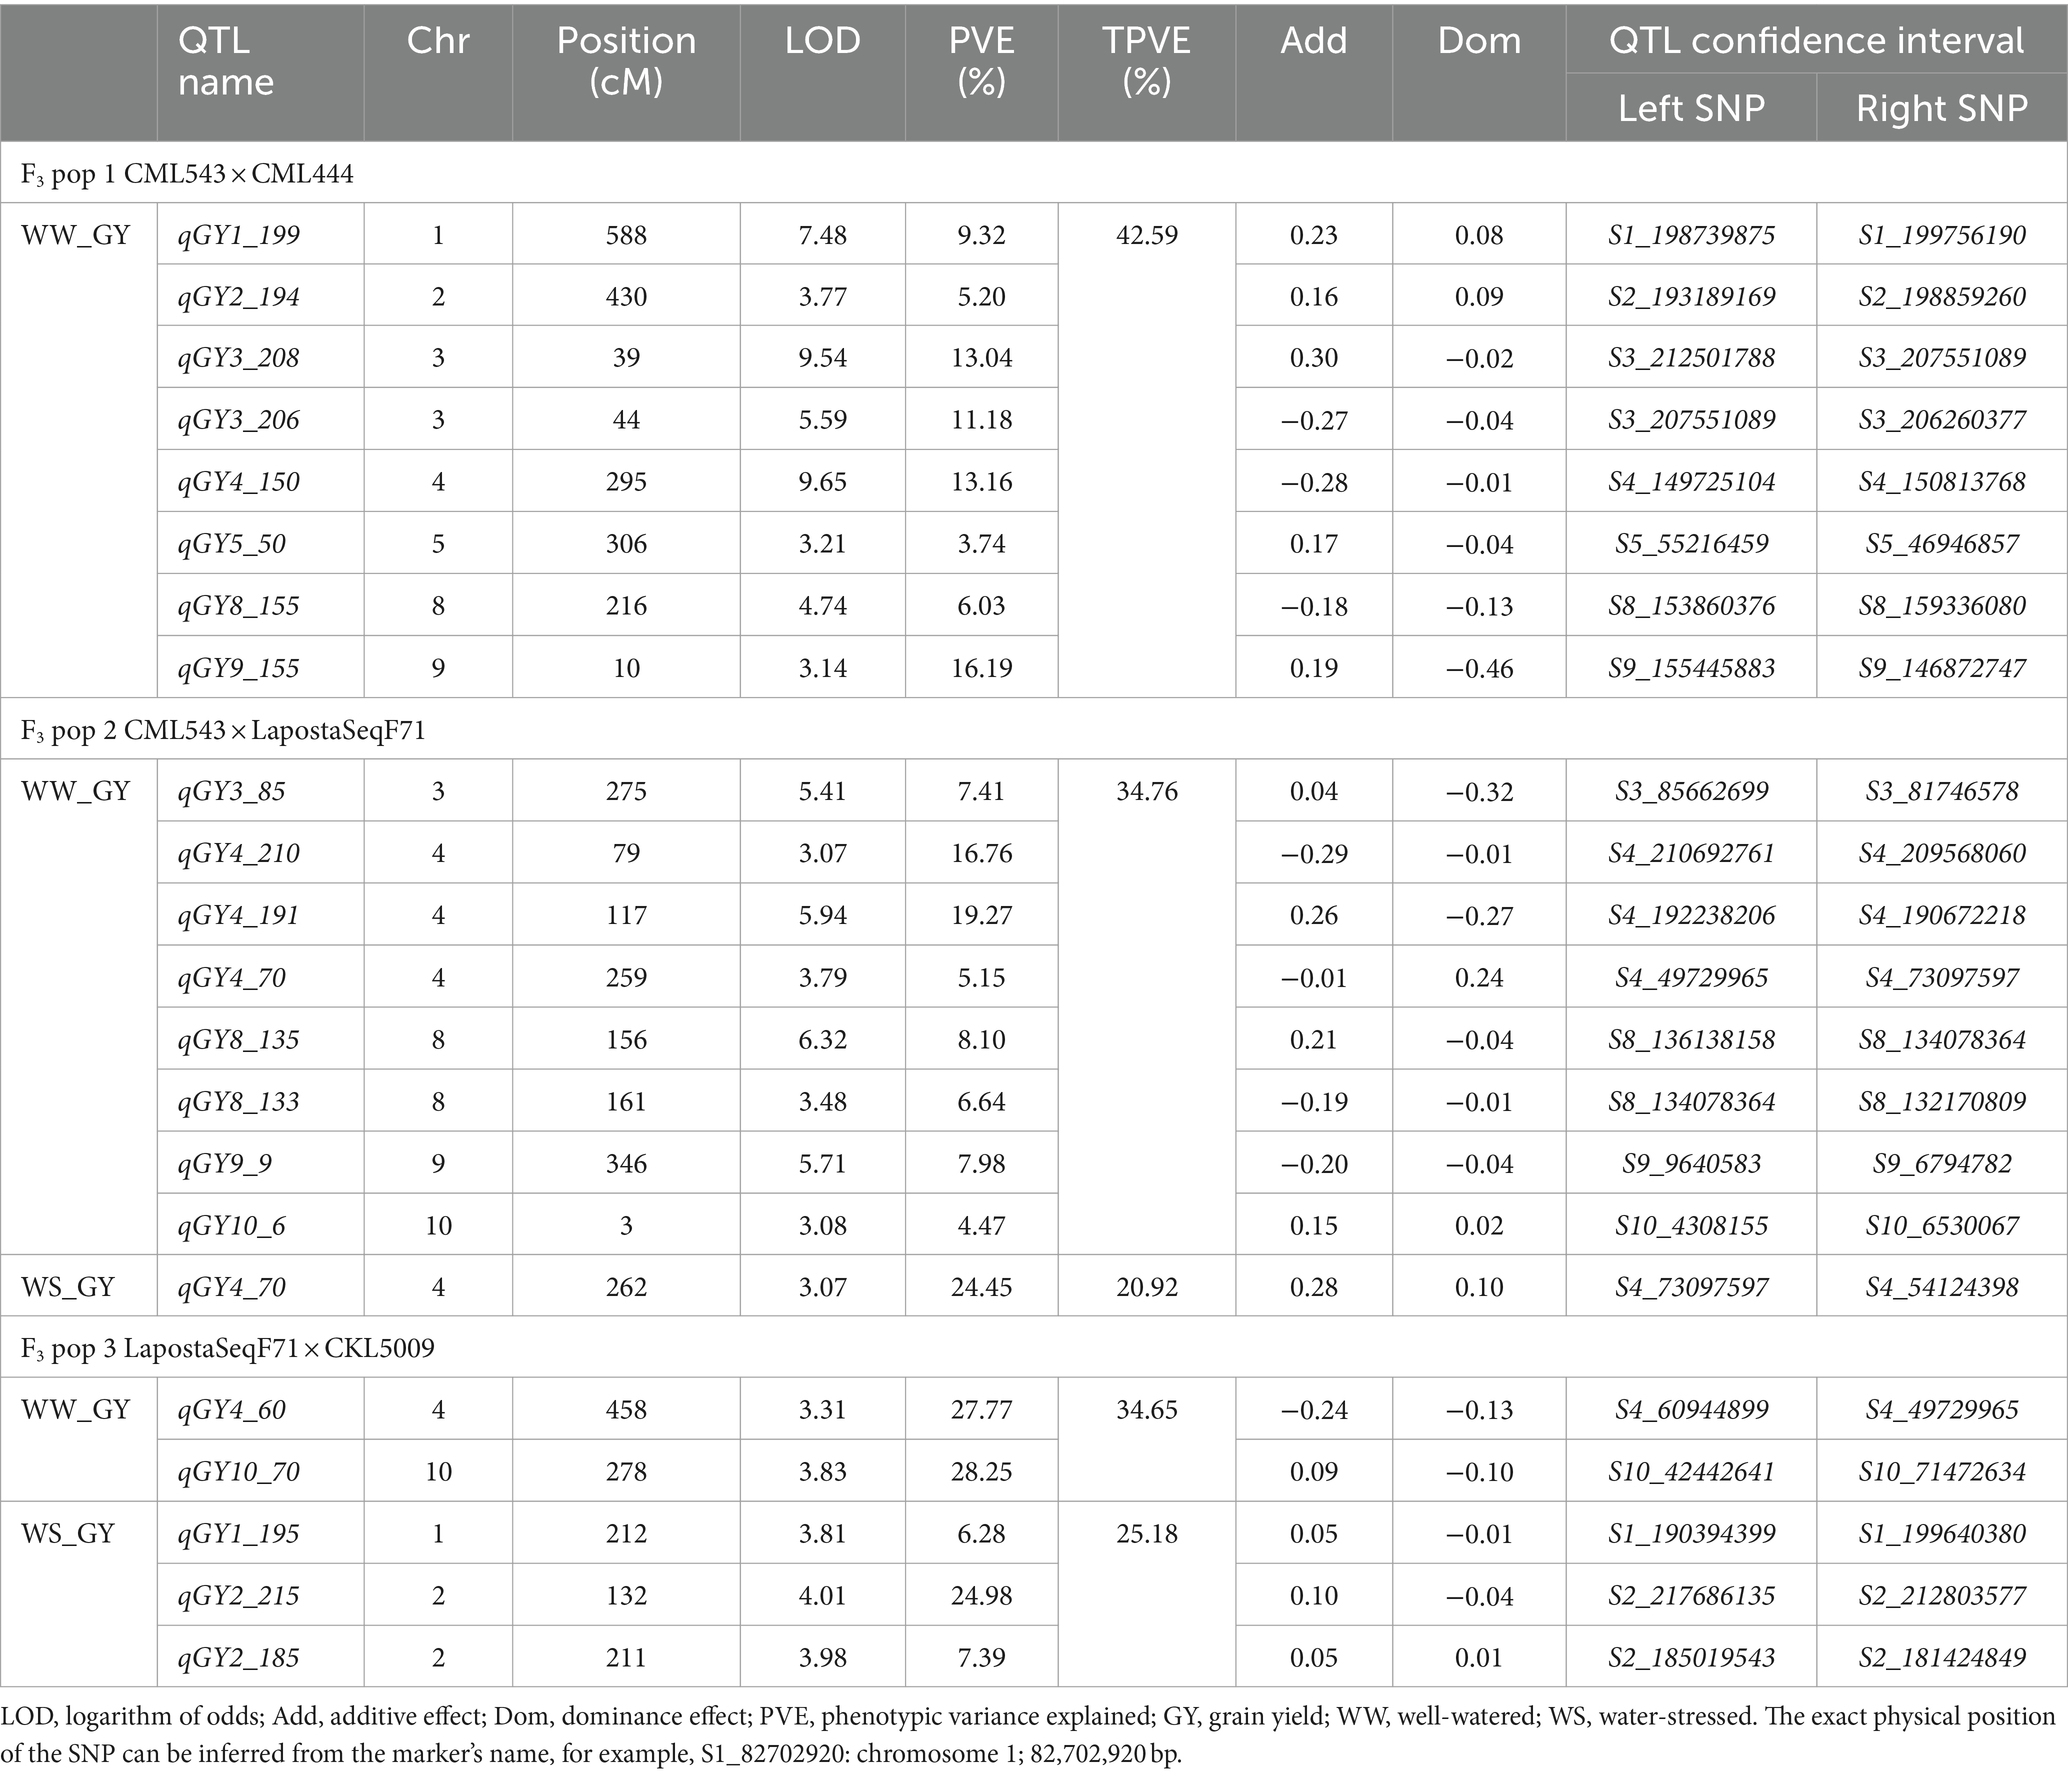
Table 3. Number of QTLs associated with grain yield under well-watered and water-stressed conditions detected in three F3 populations.
Analyses of variance for ‘within’ and ‘across’ environments revealed significant genotypic and genotype by environment (G × E) variances for all traits except for ASI (under WW conditions) and EH (under WS conditions) in pop 1 (Table 2). For GY, we observed low to moderate heritability estimates of 0.60, 0.54, 0.25 and 0.65 under WW conditions and 0.30, 0.32, 0.58 and 0.54 under WS management for pop 1, pop 2, pop 3 and all combined, respectively (Table 2). It is important to highlight that the lowest broad sense heritabilities under WS conditions were greater than the lowest values achieved under WW conditions, yet they remained below the highest values achieved under WW conditions. For individual populations, broad sense heritabilities for ASI ranged from 0.43–0.53 and 0.18–0.50 under WW and WS conditions, respectively. For PH, heritability ranged from 0.68–0.79 (WW) and 0.43–0.65 (WS). The estimates of broad-sense heritability for EH ranged between 0.72–0.85 (WW) and 0.39–0.79 (WS). Under WW conditions and for all studied populations, the broad sense heritability of GY was highest (65%), followed by EH (51%), PH (45%) and ASI (35%). While, under WS environments, broad sense heritabilities were estimated at 54, 47, 23 and 17% for GY, EH, PH and ASI, respectively. Generally, the broad-sense heritability of all studied maize traits was low under WS compared to WW conditions (Table 2).
Correlation analyses showed that GY was significantly and negatively correlated with Turcicum leaf blight (TLB) severity (−0.53), husk cover (−0.24), ear rot (−0.20), and ear aspect (−0.60) under WW conditions. GY was also shown to be positively and significantly correlated with PH (0.60), EH (0.41), anthesis date (0.28), silking date (0.22), and ears per plant (0.40) (Figure 2) under the same conditions. Under WS conditions, GY was significantly and negatively correlated with anthesis date (−0.69), silking date (−0.7), ASI (−0.27), ear rot (−0.4), ear aspect (−0.38) and ear position (−0.25). It was also significantly and positively correlated with ears per plant (0.71).
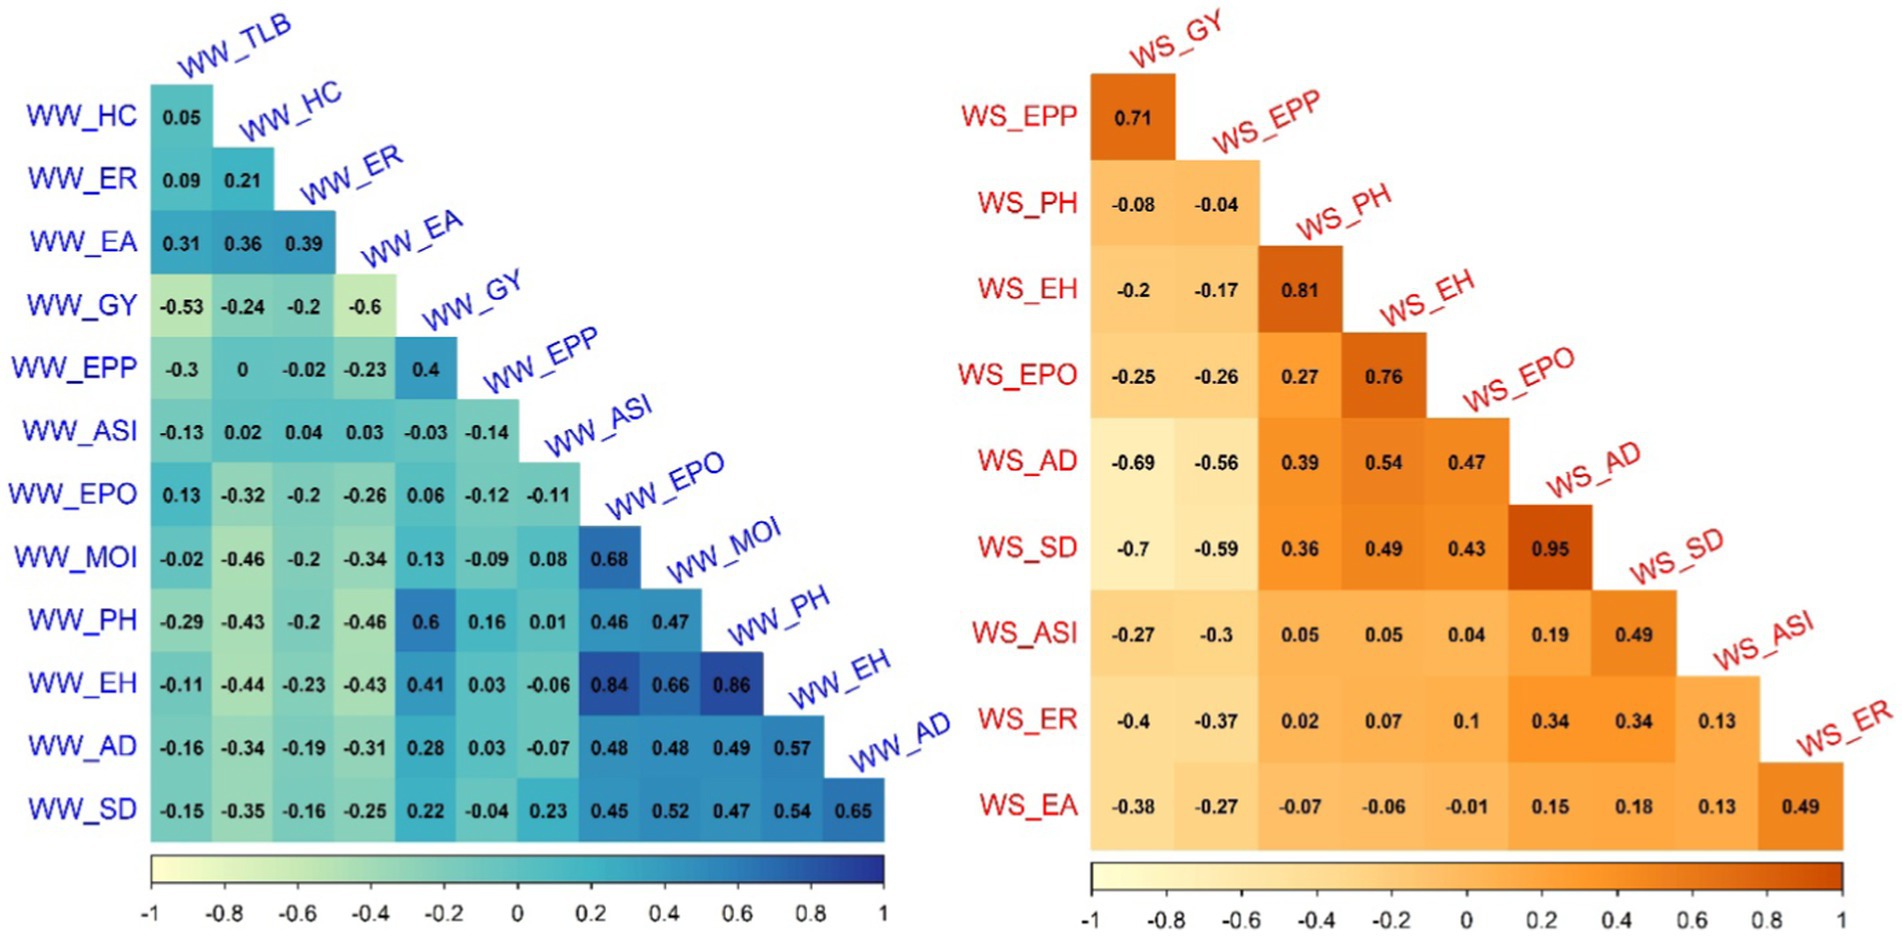
Figure 2. Phenotypic correlations between grain yield and other agronomic traits evaluated under well-watered and water-stressed conditions. The correlation values <0.11 were interpreted as ‘not significant’ at p < 0.05. GY, grain yield; AD, days to anthesis; SD, days to silking; ASI, anthesis silking interval; PH, plant height; EH, ear height; EPO, ear position; EPP, number of ears per plant; HC, husk cover; TLB, Turcicum leaf blight; MOI, grain moisture content; EA, ear aspect; and ER, ear rot.
3.2 QTLs associated with grain yield and related traits under well-watered and water-stressed conditions
The linkage map was constructed for F3 pop 1, pop 2 and pop 3 using 560, 556 and 555 high-quality polymorphic SNPs, respectively. The mean distances between adjacent markers were recorded at 8.07, 7.50 and 8.04 cM for F3 pop 1, pop 2 and pop 3, respectively. The identified QTLs for GY, ASI, PH and EH at WW and WS conditions for each population are presented in Tables 3–6. Our QTL analyses identified totals of 93 and 41 QTLs for GY, ASI, PH and EH, under WW and WS conditions, respectively. For the studied four traits, 23, 39 and 31 QTLs (under WW conditions) and 8, 4, and 29 QTLs (under WS conditions) in pop 1, pop 2 and pop 3 were detected, respectively.
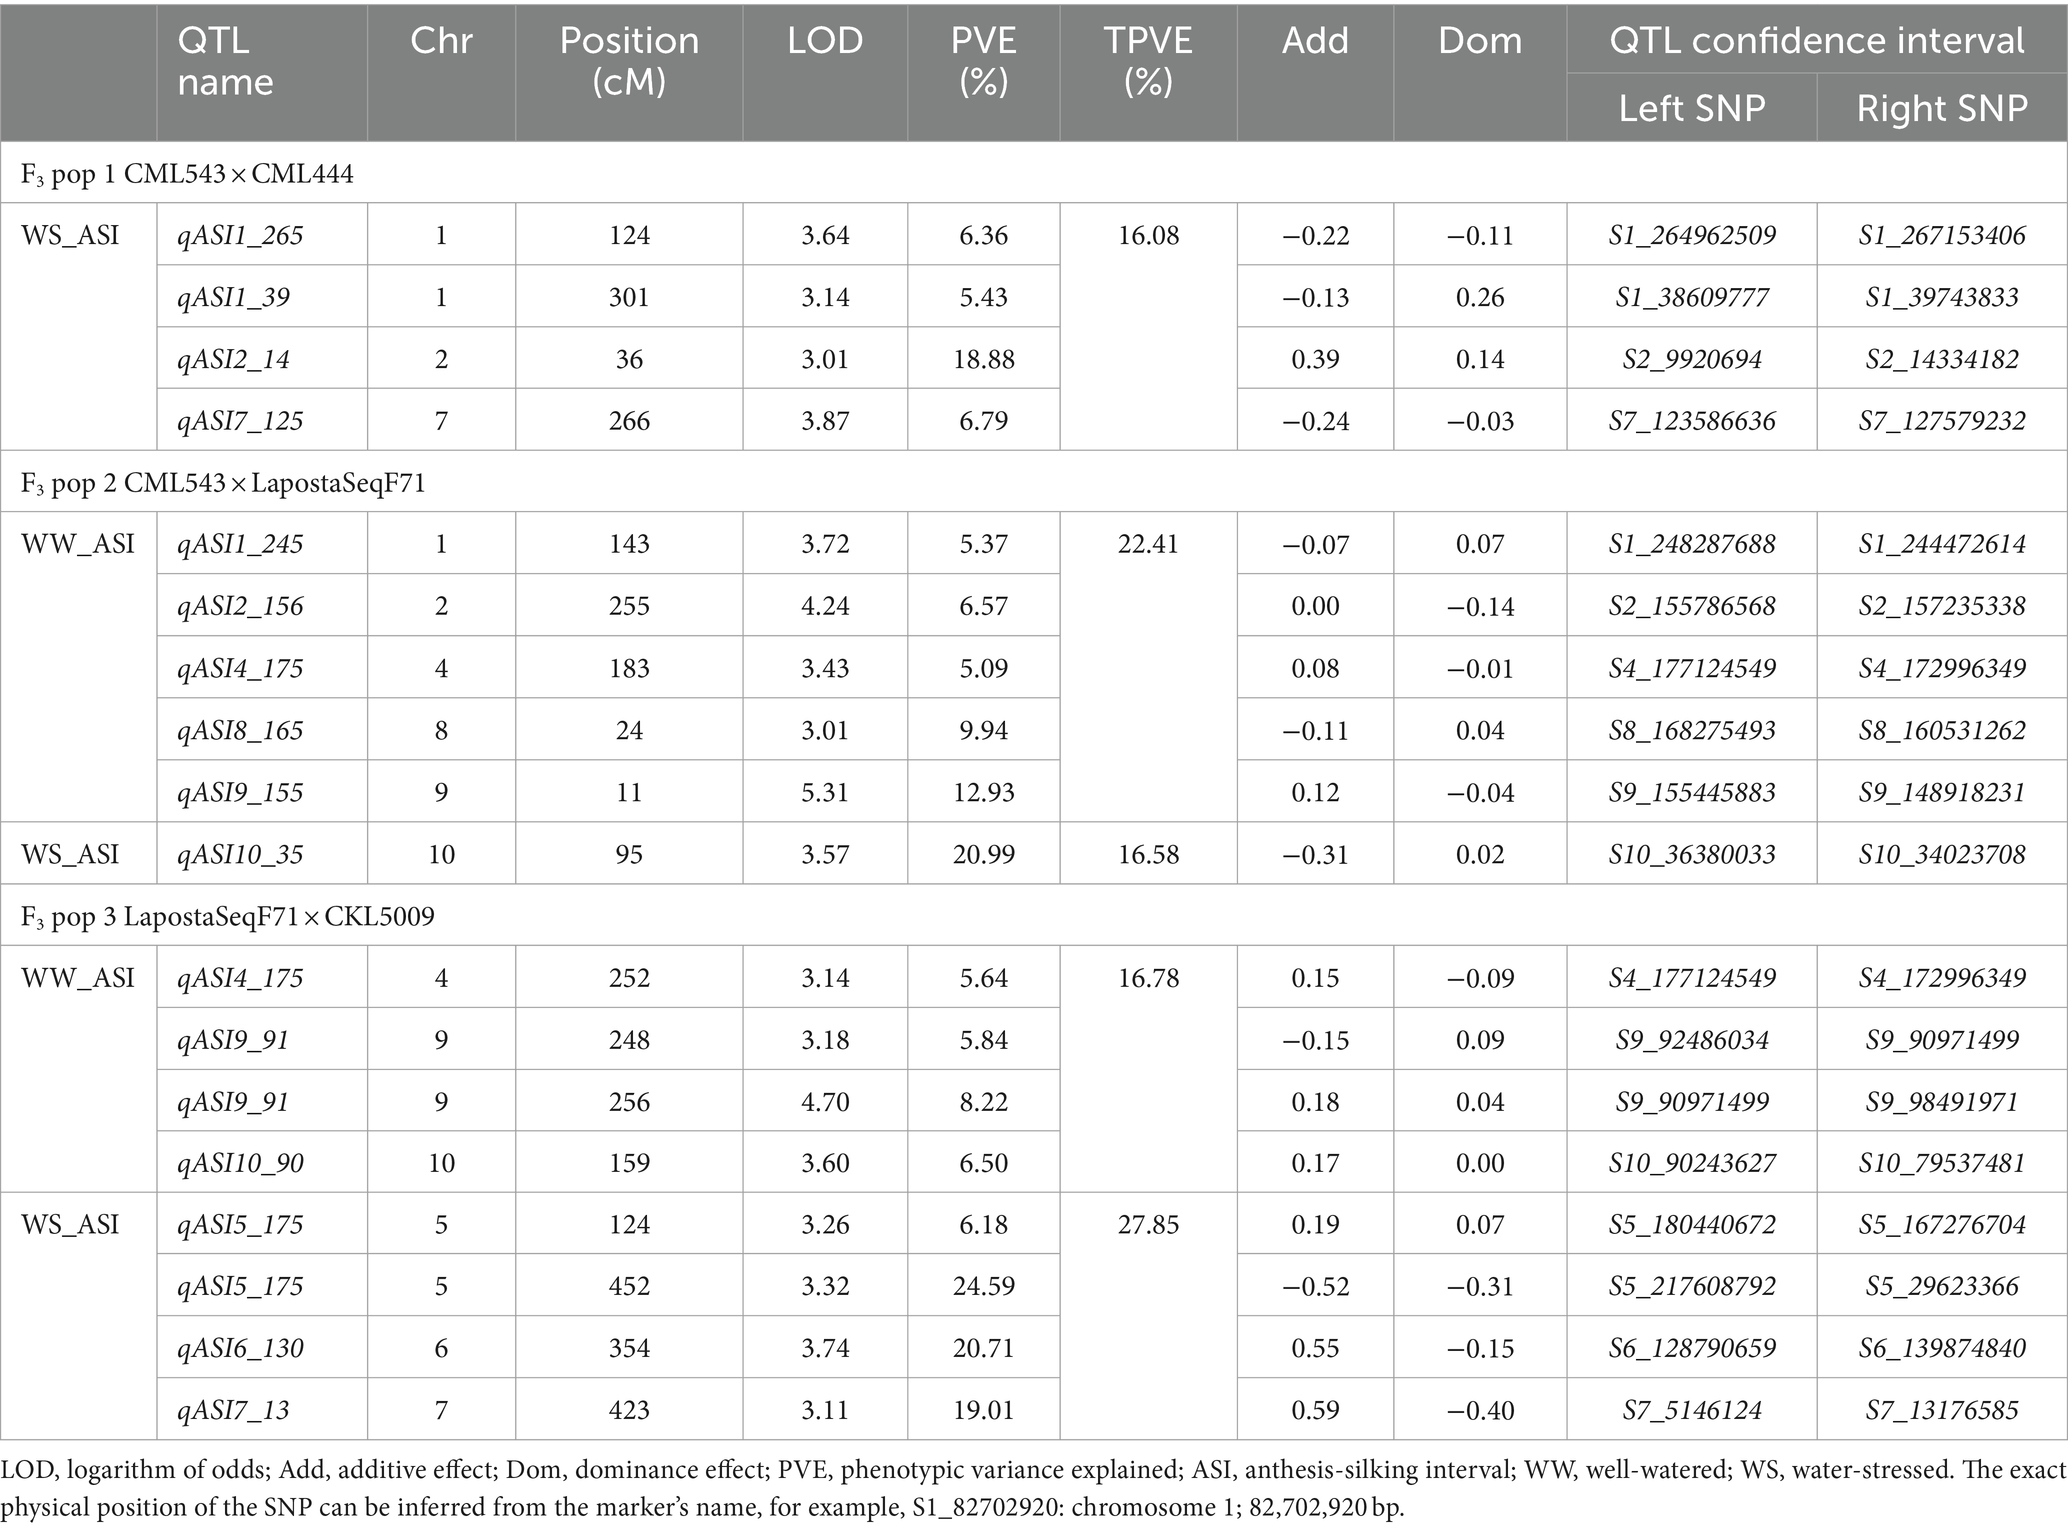
Table 4. Number of QTLs associated with anthesis-to-silking interval under well-watered and water-stressed conditions detected in three F3 populations.
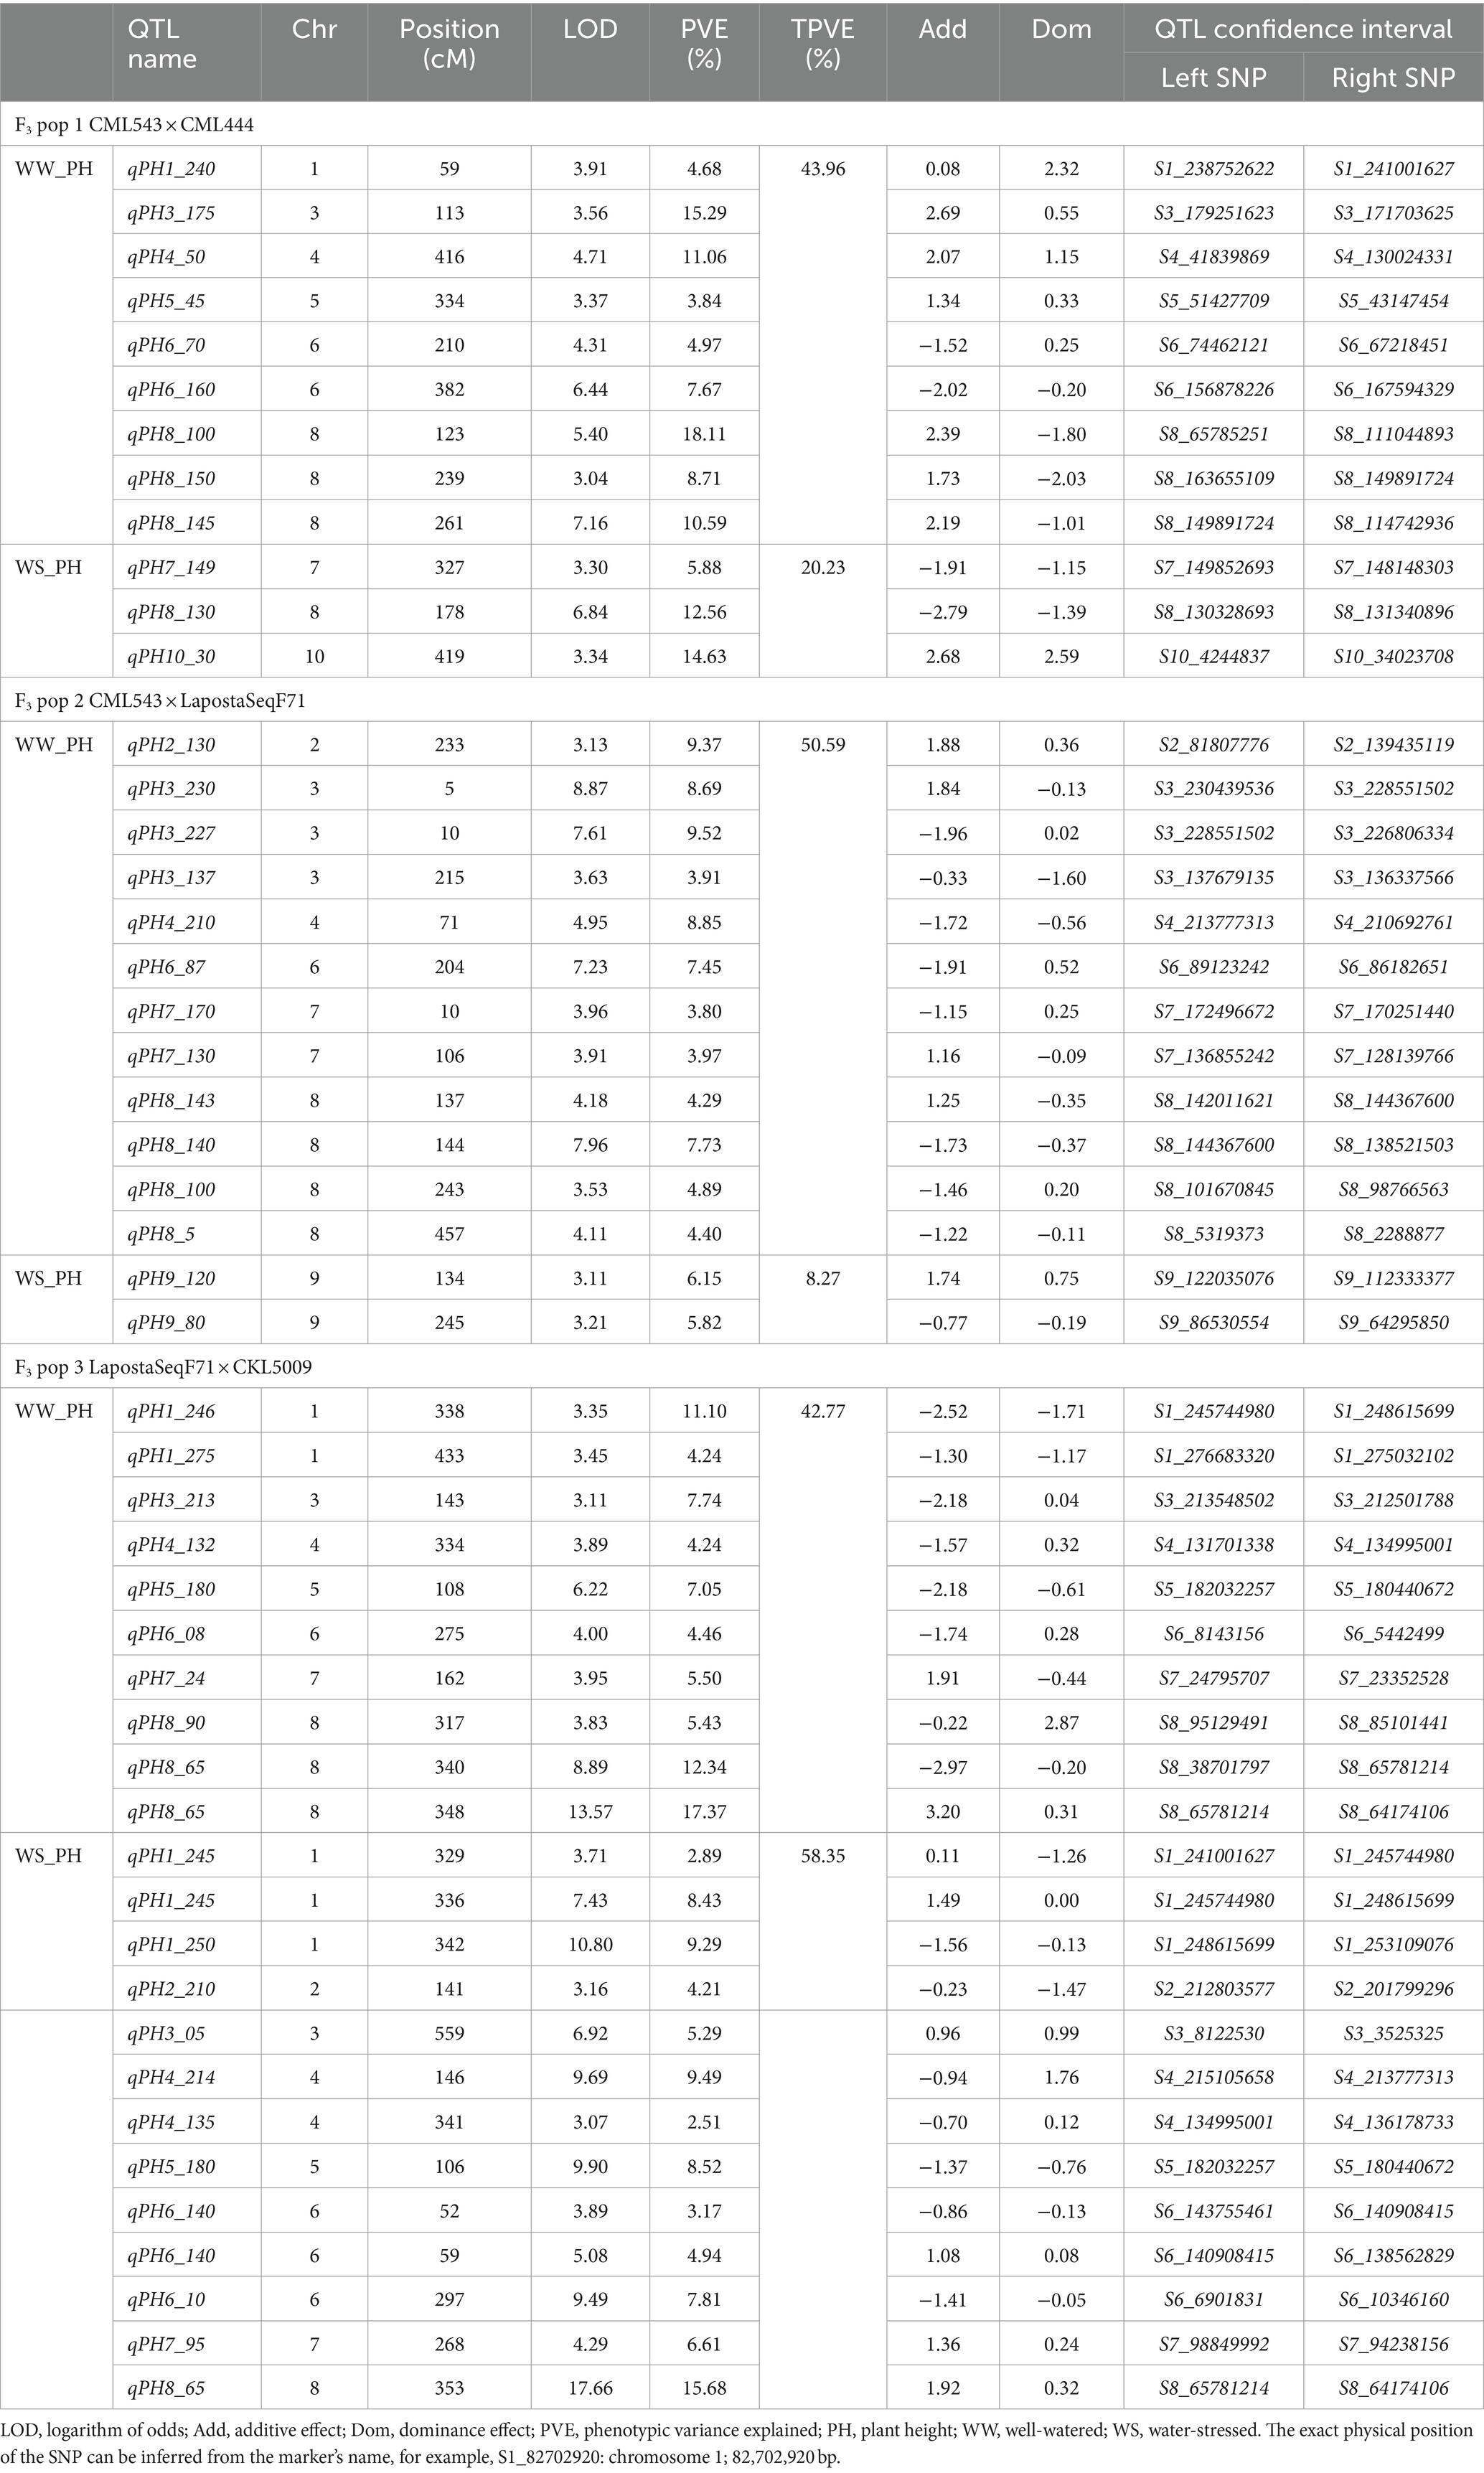
Table 5. Number of QTLs associated with plant height under well-watered and water-stressed conditions detected in three F3 populations.
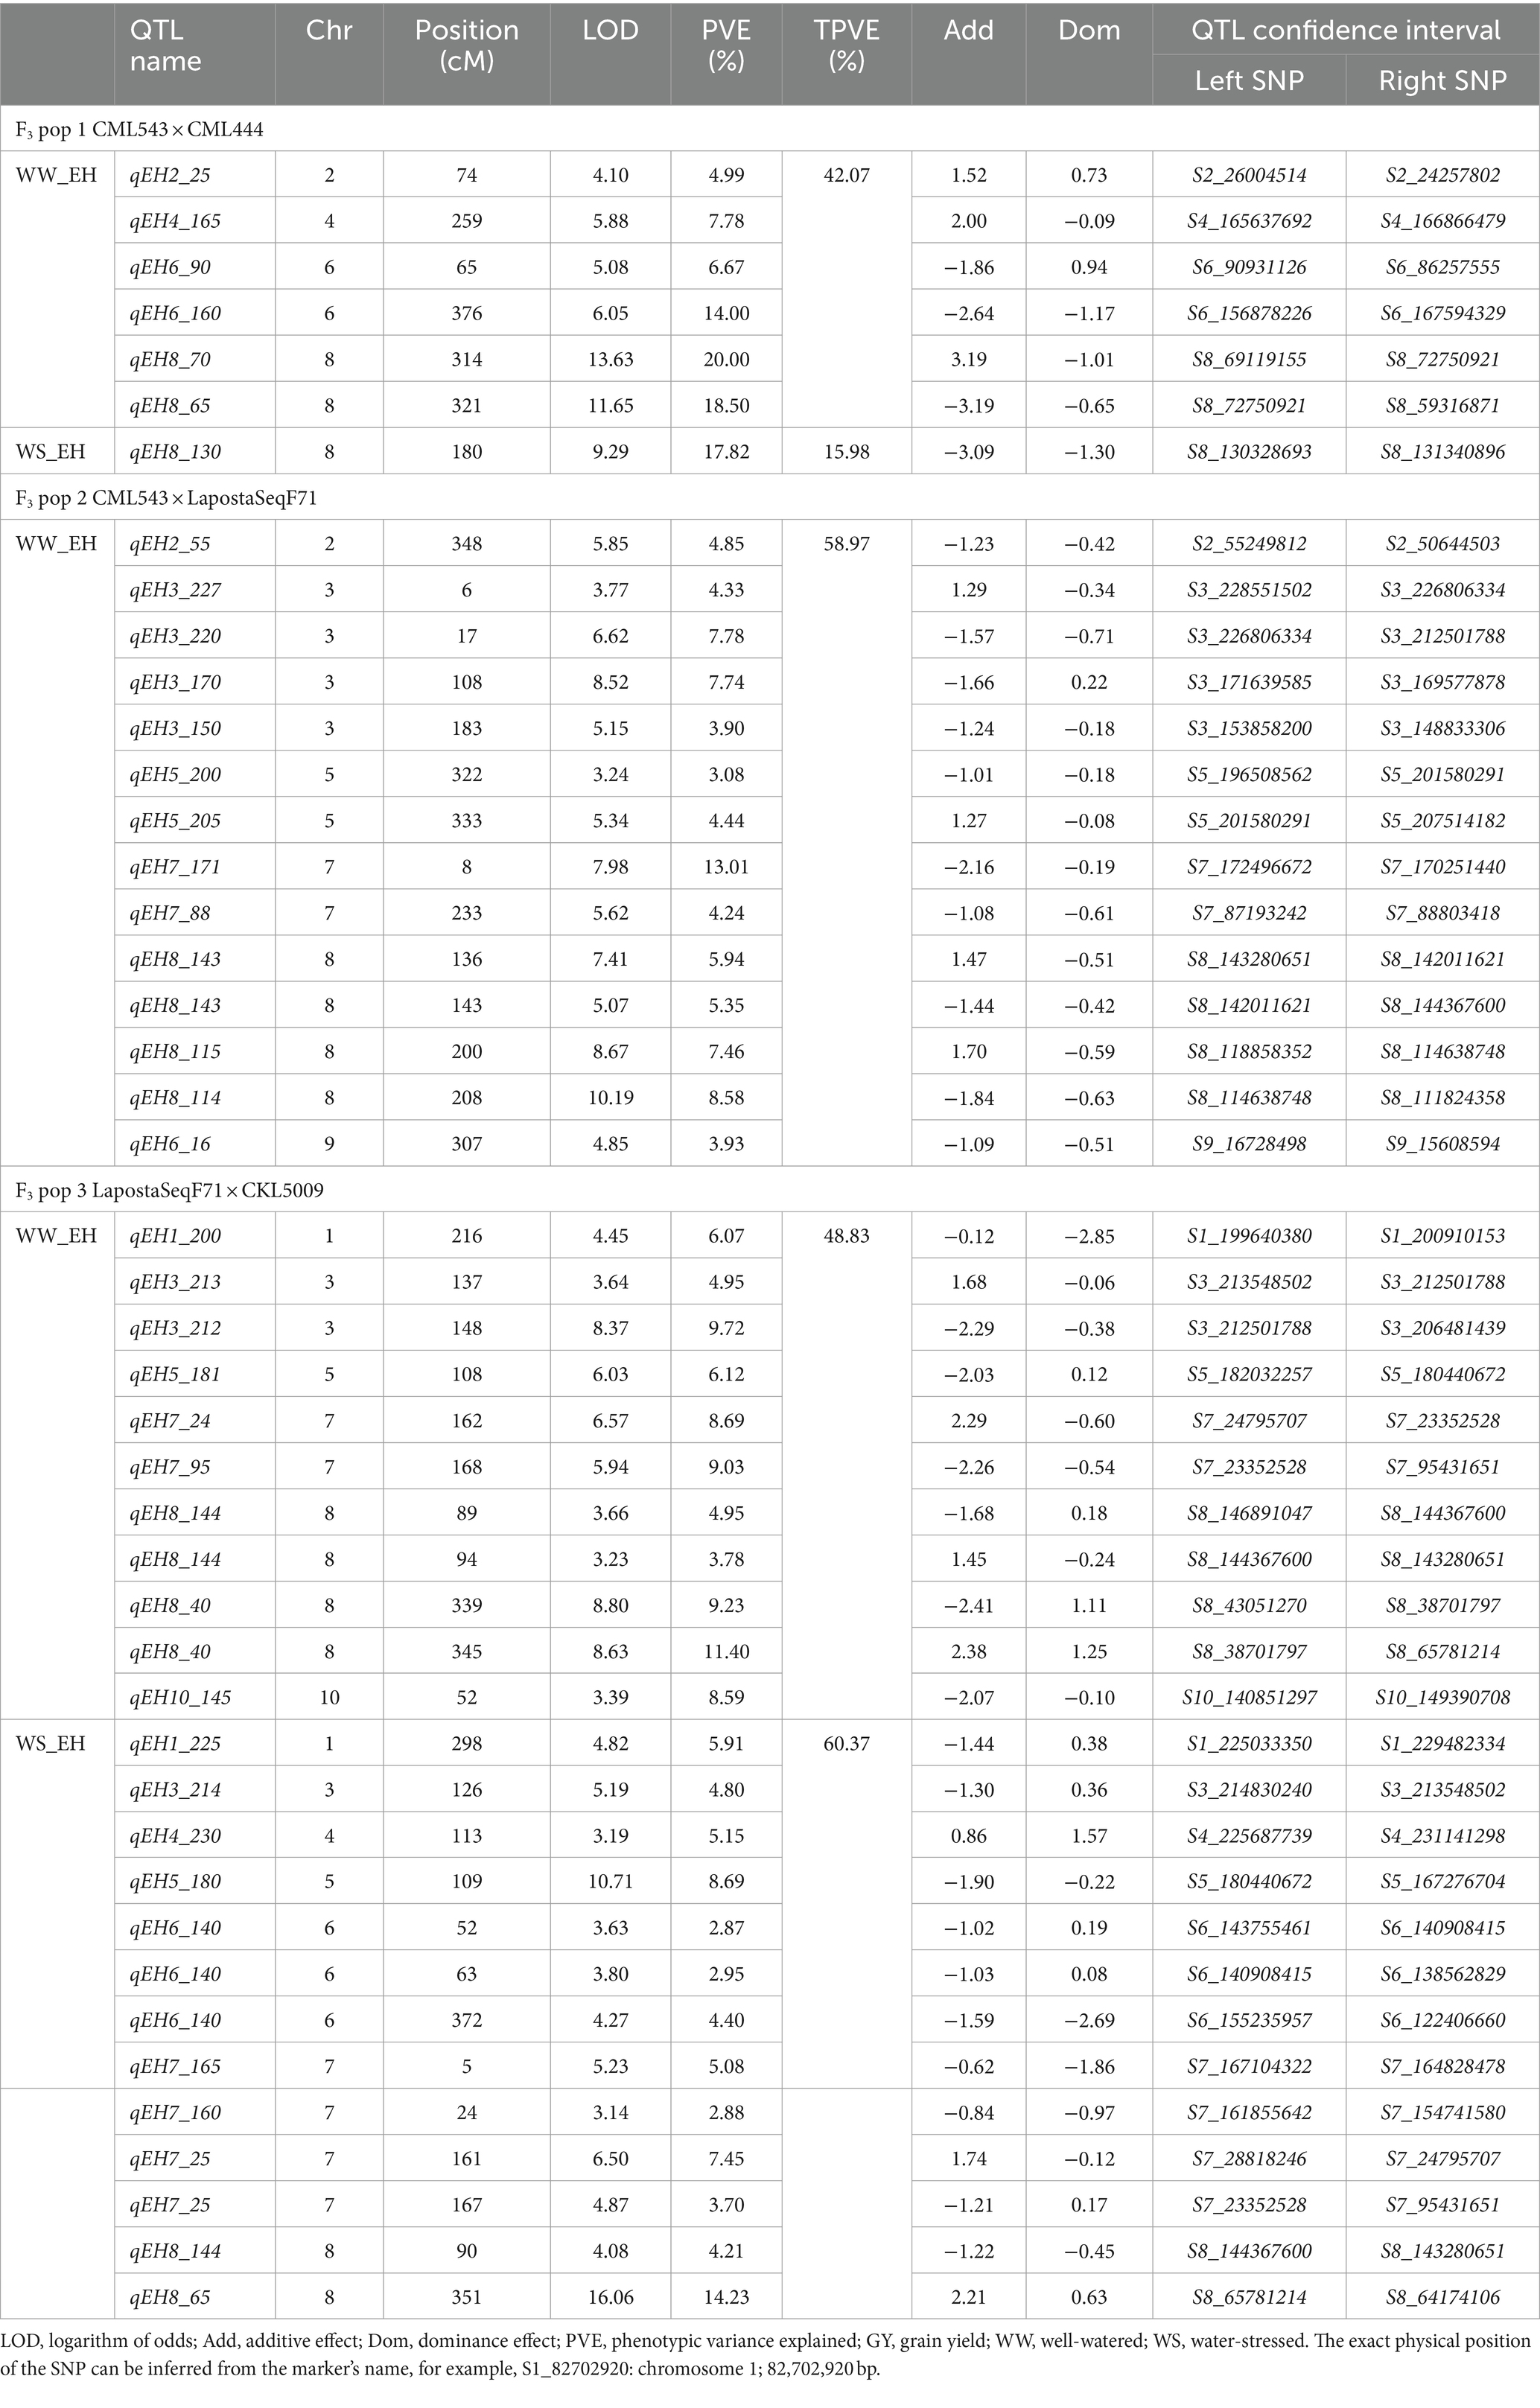
Table 6. Number of QTLs associated with ear height under well-watered and water-stressed conditions detected in three F3 populations.
In F3 pop 1, QTL analysis revealed a total of 23 QTLs for GY (8), PH (9) and EH (6) under WW conditions and 8 QTLs for ASI (4), PH (3) and EH (1) under WS conditions (Supplementary Table S2). For this population, no QTLs were detected for GY under WS conditions (Table 3). In pop 2, QTL analysis revealed 39 QTLs for GY (8), ASI (5), PH (12) and EH (14) under WW conditions and four QTLs for GY (1), ASI (1), and PH (2) under WS conditions. In pop 3, 31 and 29 QTLs were detected for the four traits under WW and WS conditions, respectively. Interestingly, the highest number of QTLs detected in this population were for PH (13) and EH (13) under WS conditions. Furthermore, no QTLs were detected for ASI under WS conditions in this population (Tables 5, 6).
The phenotypic variation explained (PVE) for all the detected QTLs ranged from 2.51 to 27.77%. Interestingly, these two extremes were observed in pop 3 for WS_PH (2.51%) and WW_GY (27.77%). Significant QTLs with major effects, explaining >10% of the PVE, were identified for GY (nine QTLs under WW and two QTLs under WS conditions). Noteworthy, a few significant major effect QTLs were also identified for ASI, PH and EH under both WW and WS conditions (Tables 4–6).
JLAM QTL analysis across the three bi-parental populations identified 25 QTLs for GY under the WW conditions and 4 under the WS (Table 7). For this analysis, PVE ranged from 0.80–3.9% and 1.4–11.8% for WW and WS environments, respectively. For GY, most of the QTLs were identified in chromosomes 4 and 6 (5 QTLs each). For ASI, 16 and 15 QTLs were identified under WW and WS environments, respectively (Table 8). PVE for ASI ranged from 0.1–4.9% and 1.3–10.9% for WW and WS environments, respectively. Interestingly, most of the QTLs associated with ASI were identified in chromosomes 8 (n = 4) and 1 (n = 6) under WW and WS conditions, respectively. However, across the two water regimes, no QTLs were identified for ASI in chromosomes 4 and 10. We also identified 19 QTLs for PH under WW (12) and WS (7) environments (Table 9). Notably, chromosome 1 had no QTLs for PH under both WW and WS conditions. For EH, our analysis identified 20 QTLs under WW (6) and WS (14) environments. Unlike the other traits, chromosomes 9 and 10 had no QTLs for EH across the two studied management conditions. For GY, the QTL on chromosome 6 (qGY6_89) had the largest effect with 11.80% of PVE under WS condition and was found overlapping with QTL for WW_PH (qPH6_87) in F3 pop 2 and with WW_EH (qEH6_90) in F3 pop 1 (Tables 5–7). Another major effect was QTL identified for ASI (qASI1_107) which explained 10.9% of the PVE and did not overlap with any QTL detected in the individual population analyses.
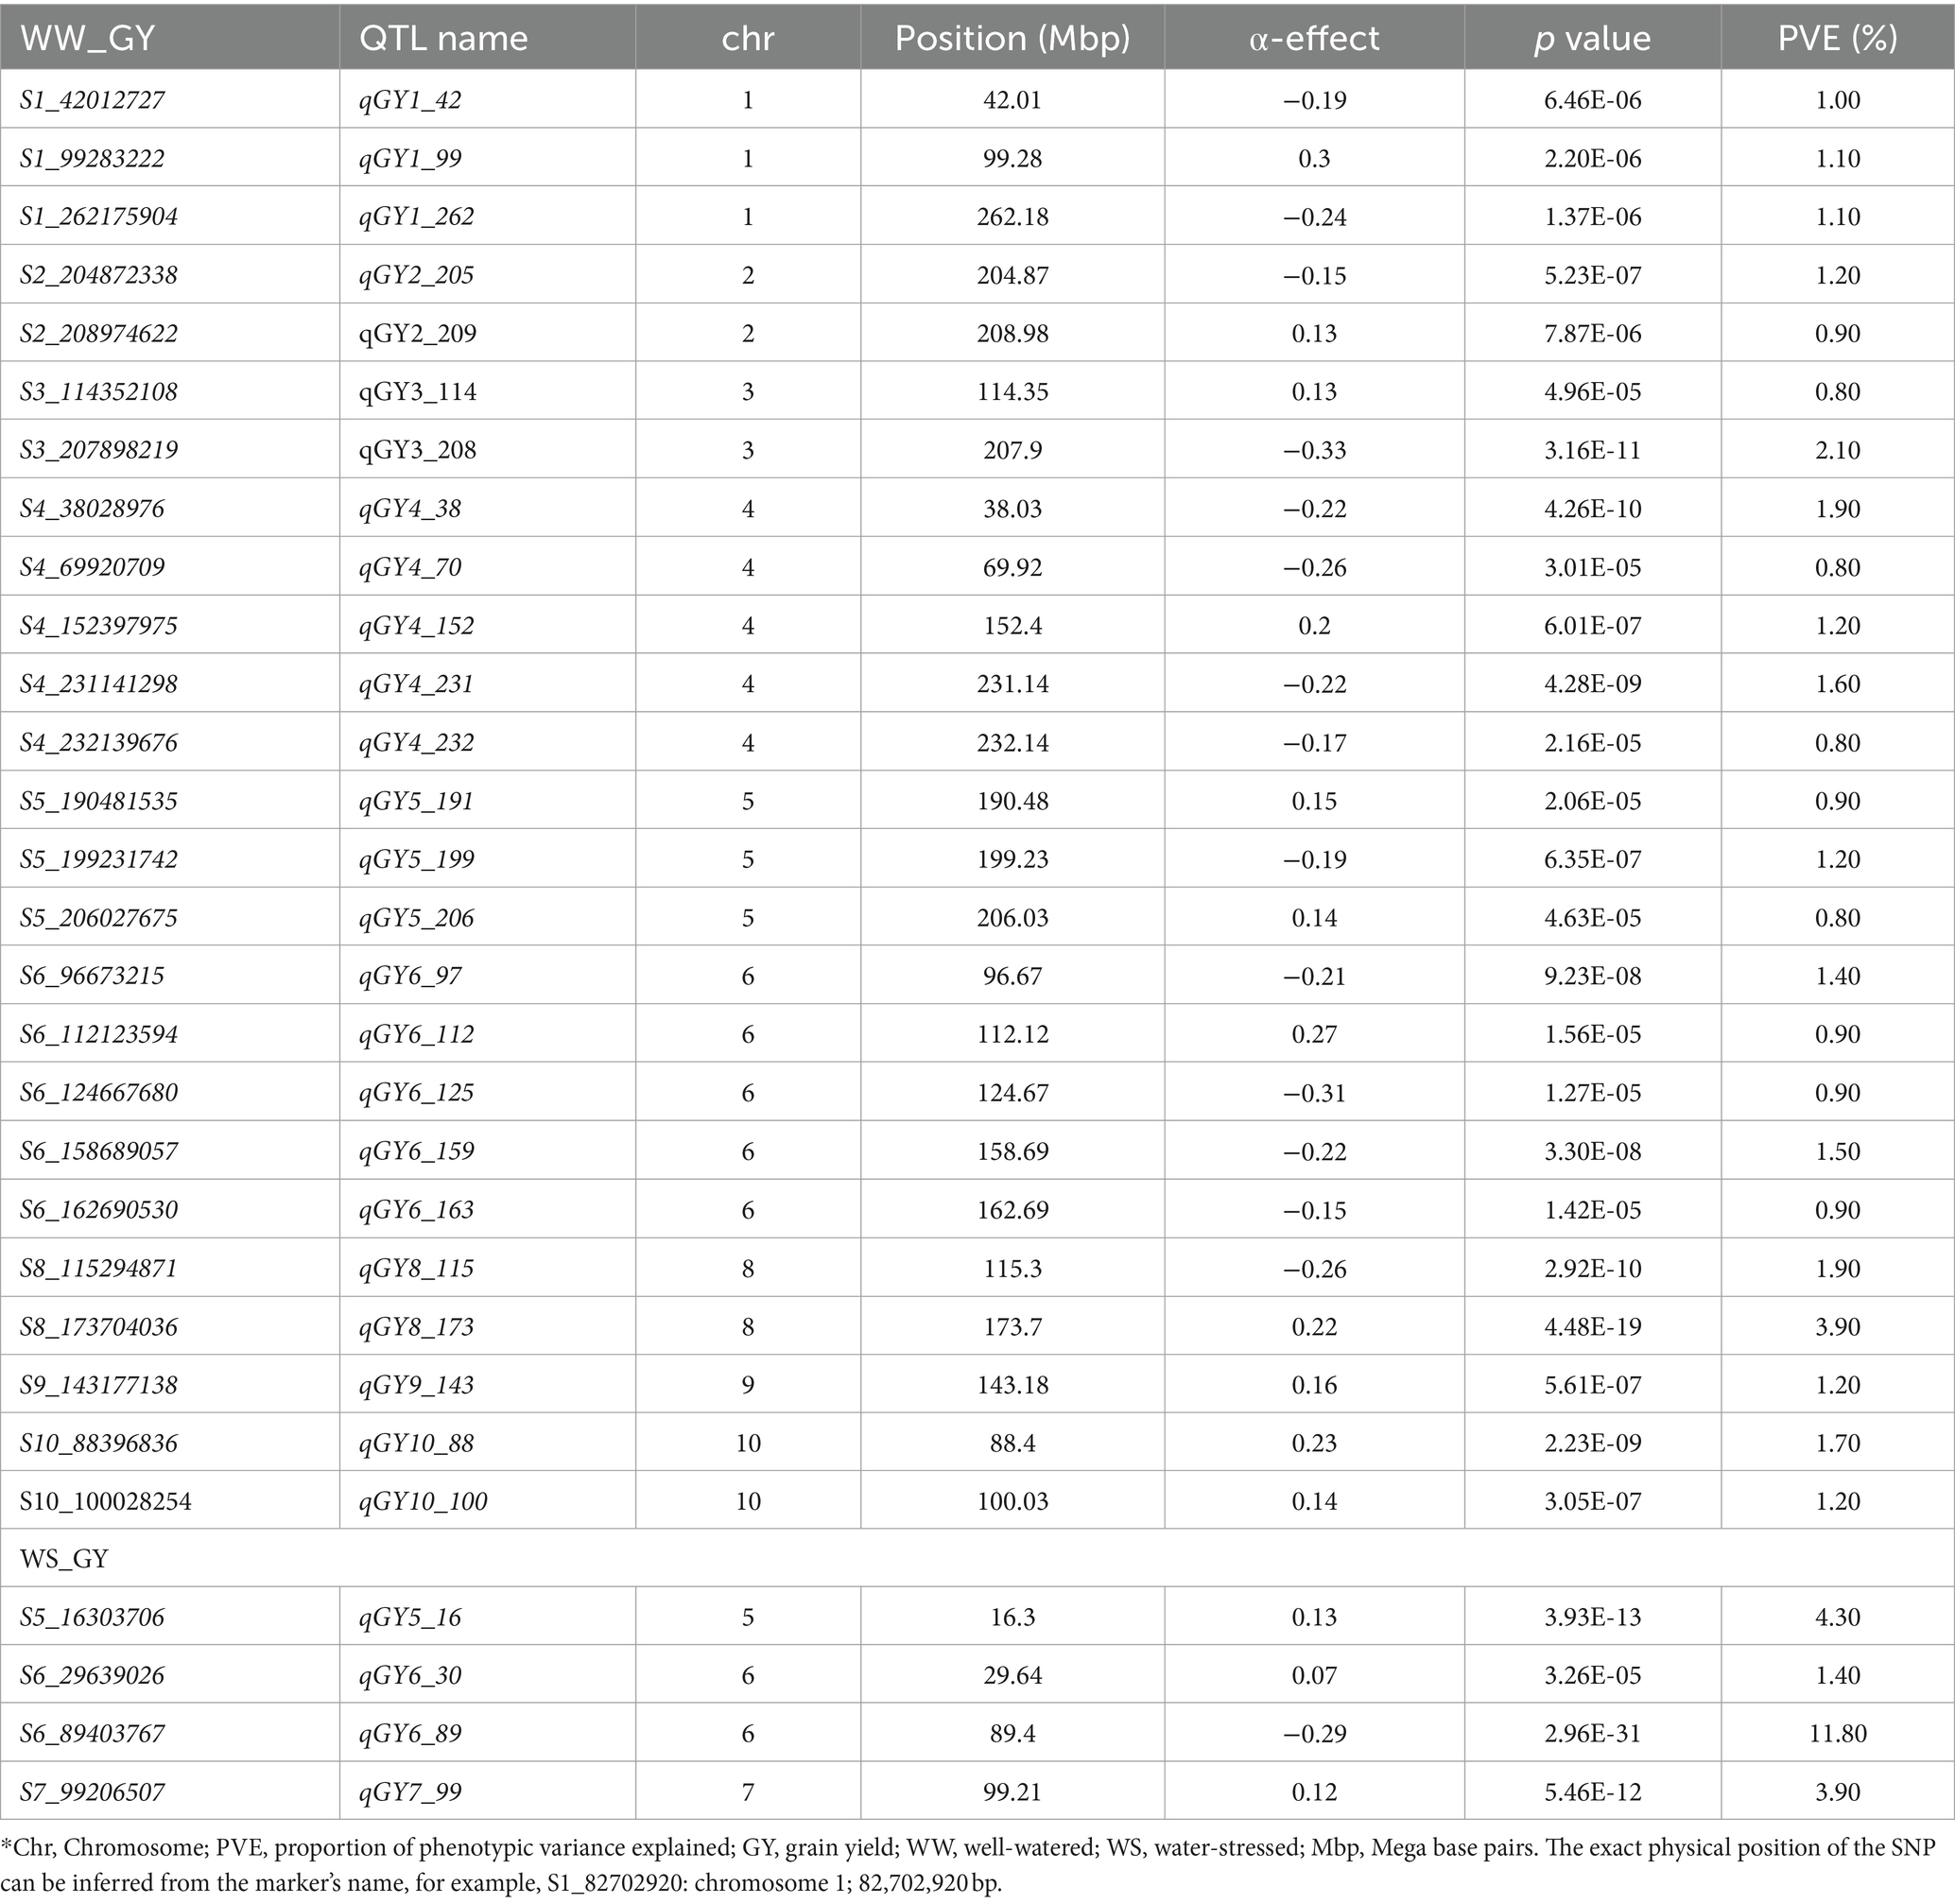
Table 7. Analysis of GY-associated markers under well-watered and water-stressed conditions, allele substitution (α) effects, and the total phenotypic variance (R2) of the joint linkage association mapping based on combined three F3 populations.
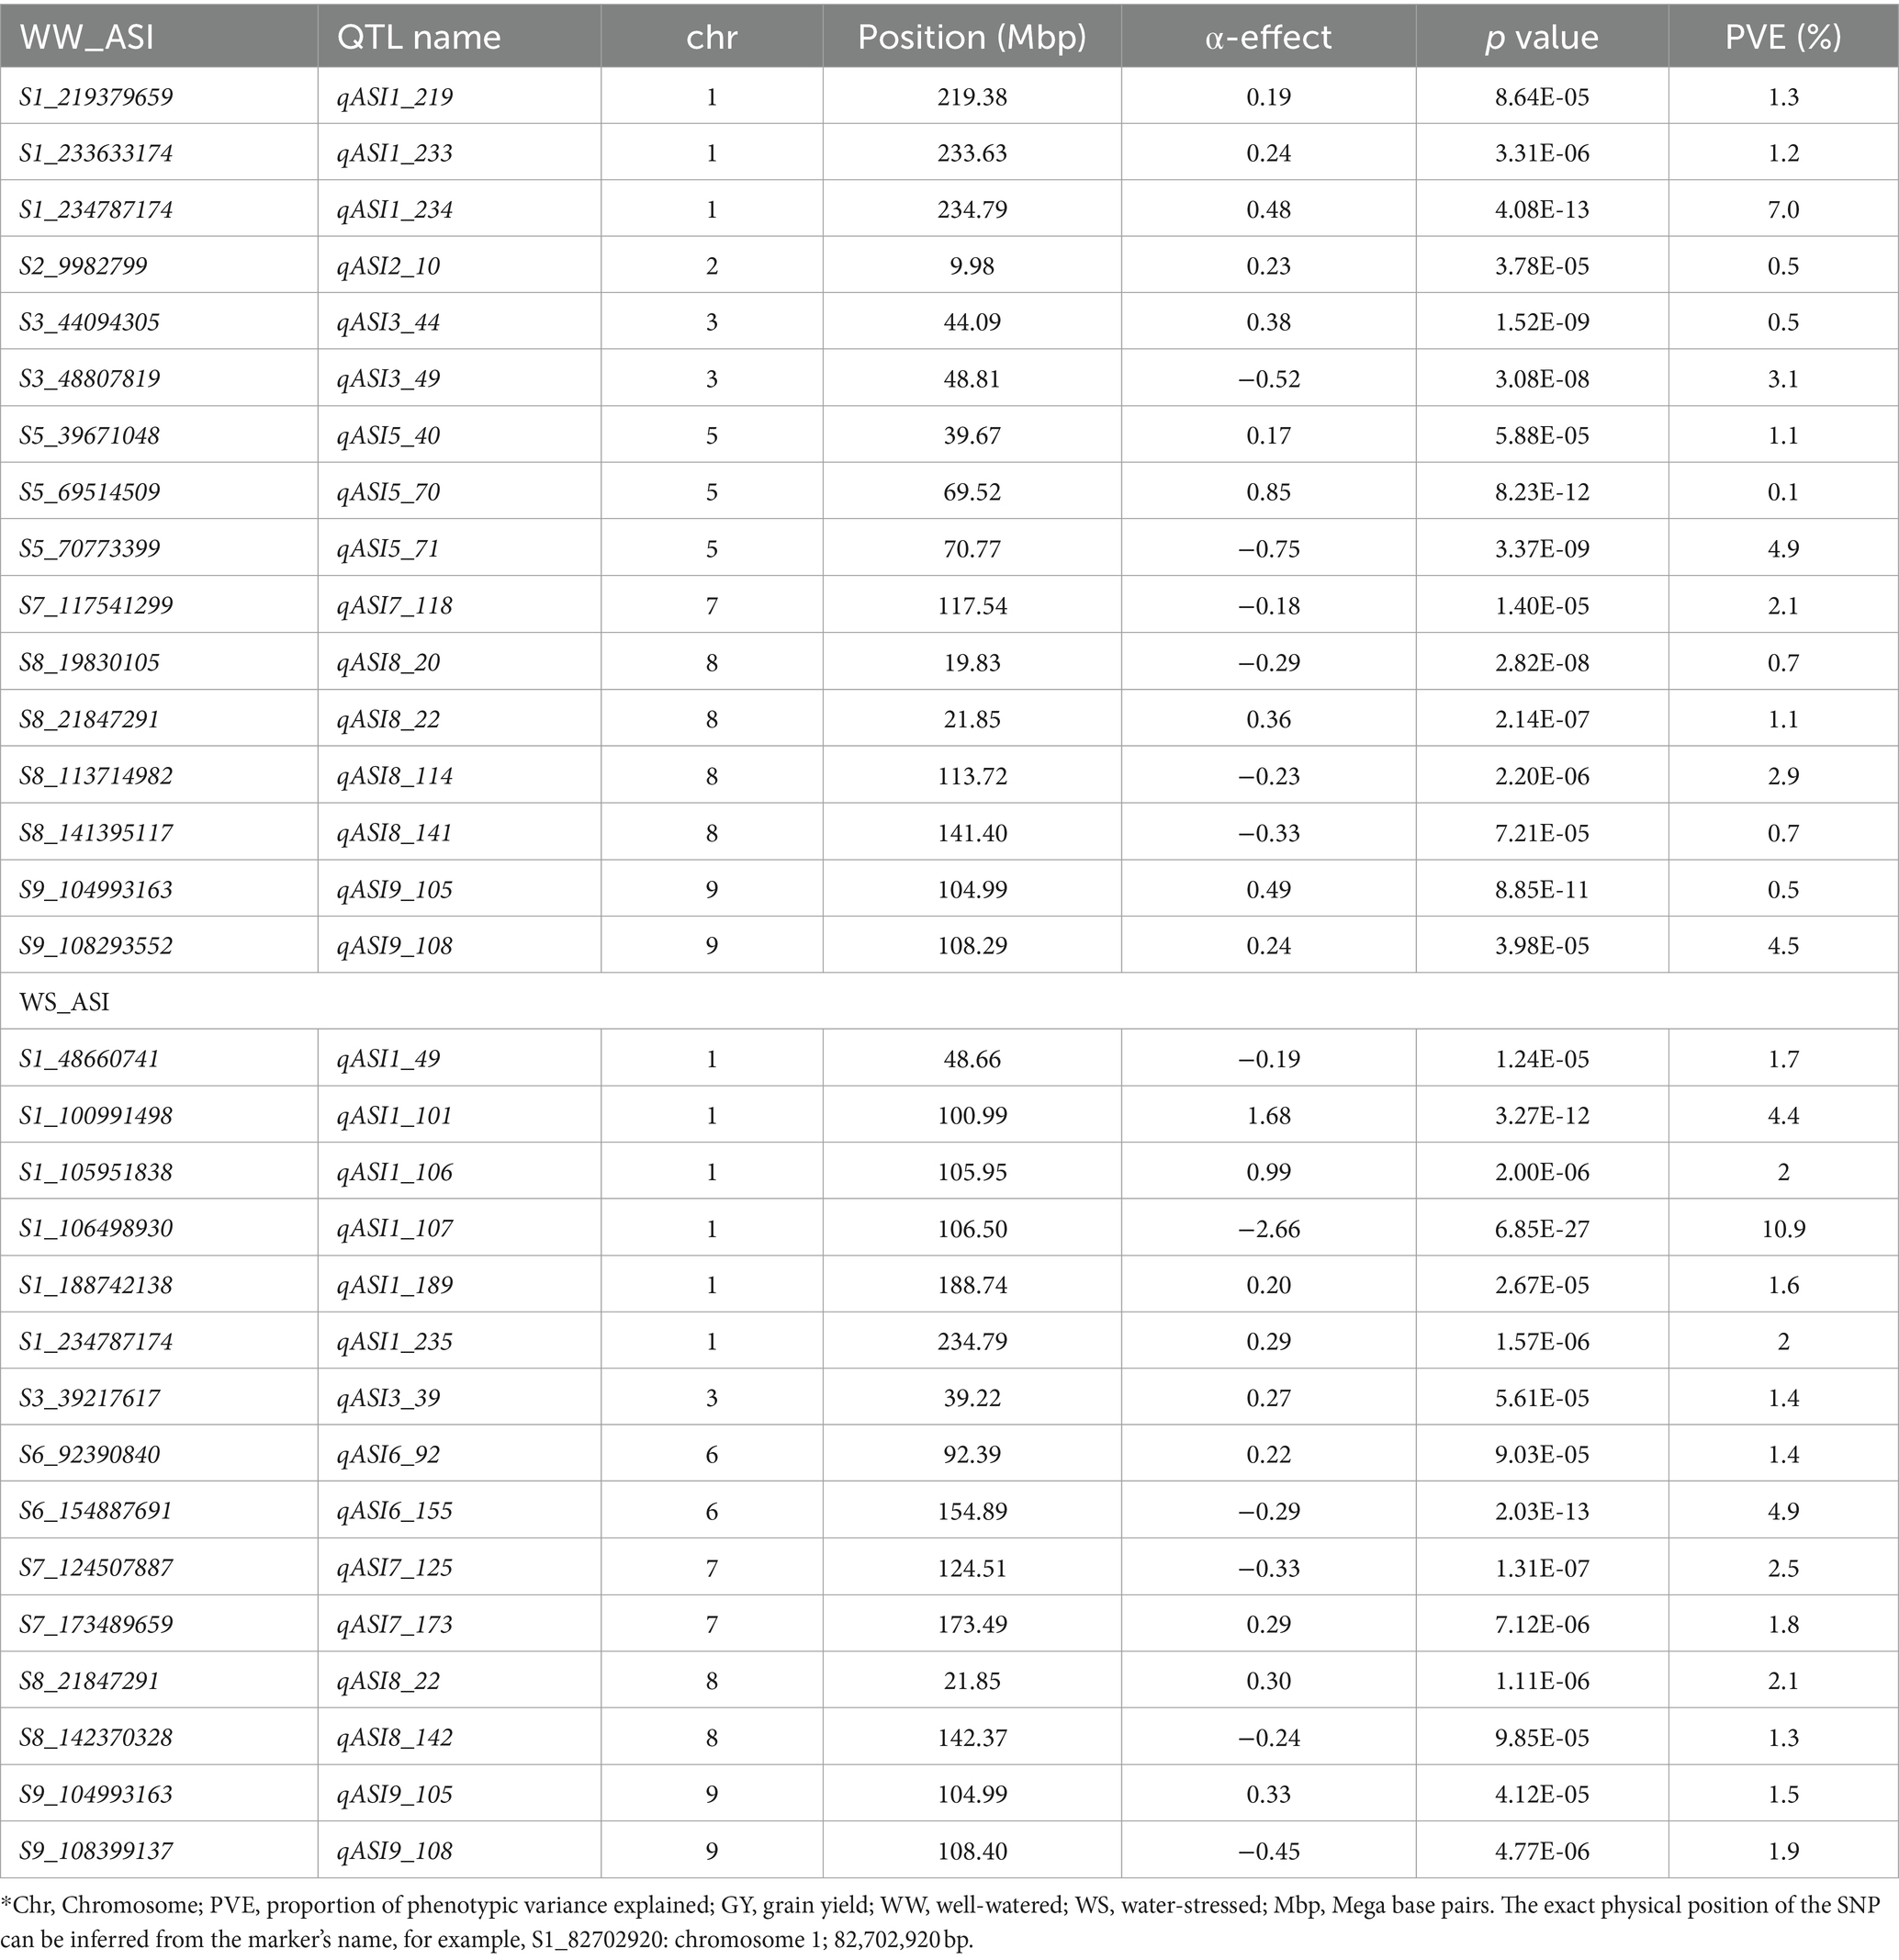
Table 8. Analysis of ASI-associated markers under well-watered and water-stressed conditions, allele substitution (α) effects, and the phenotypic variance (PVE) of the joint linkage association mapping based on combined three F3 populations.
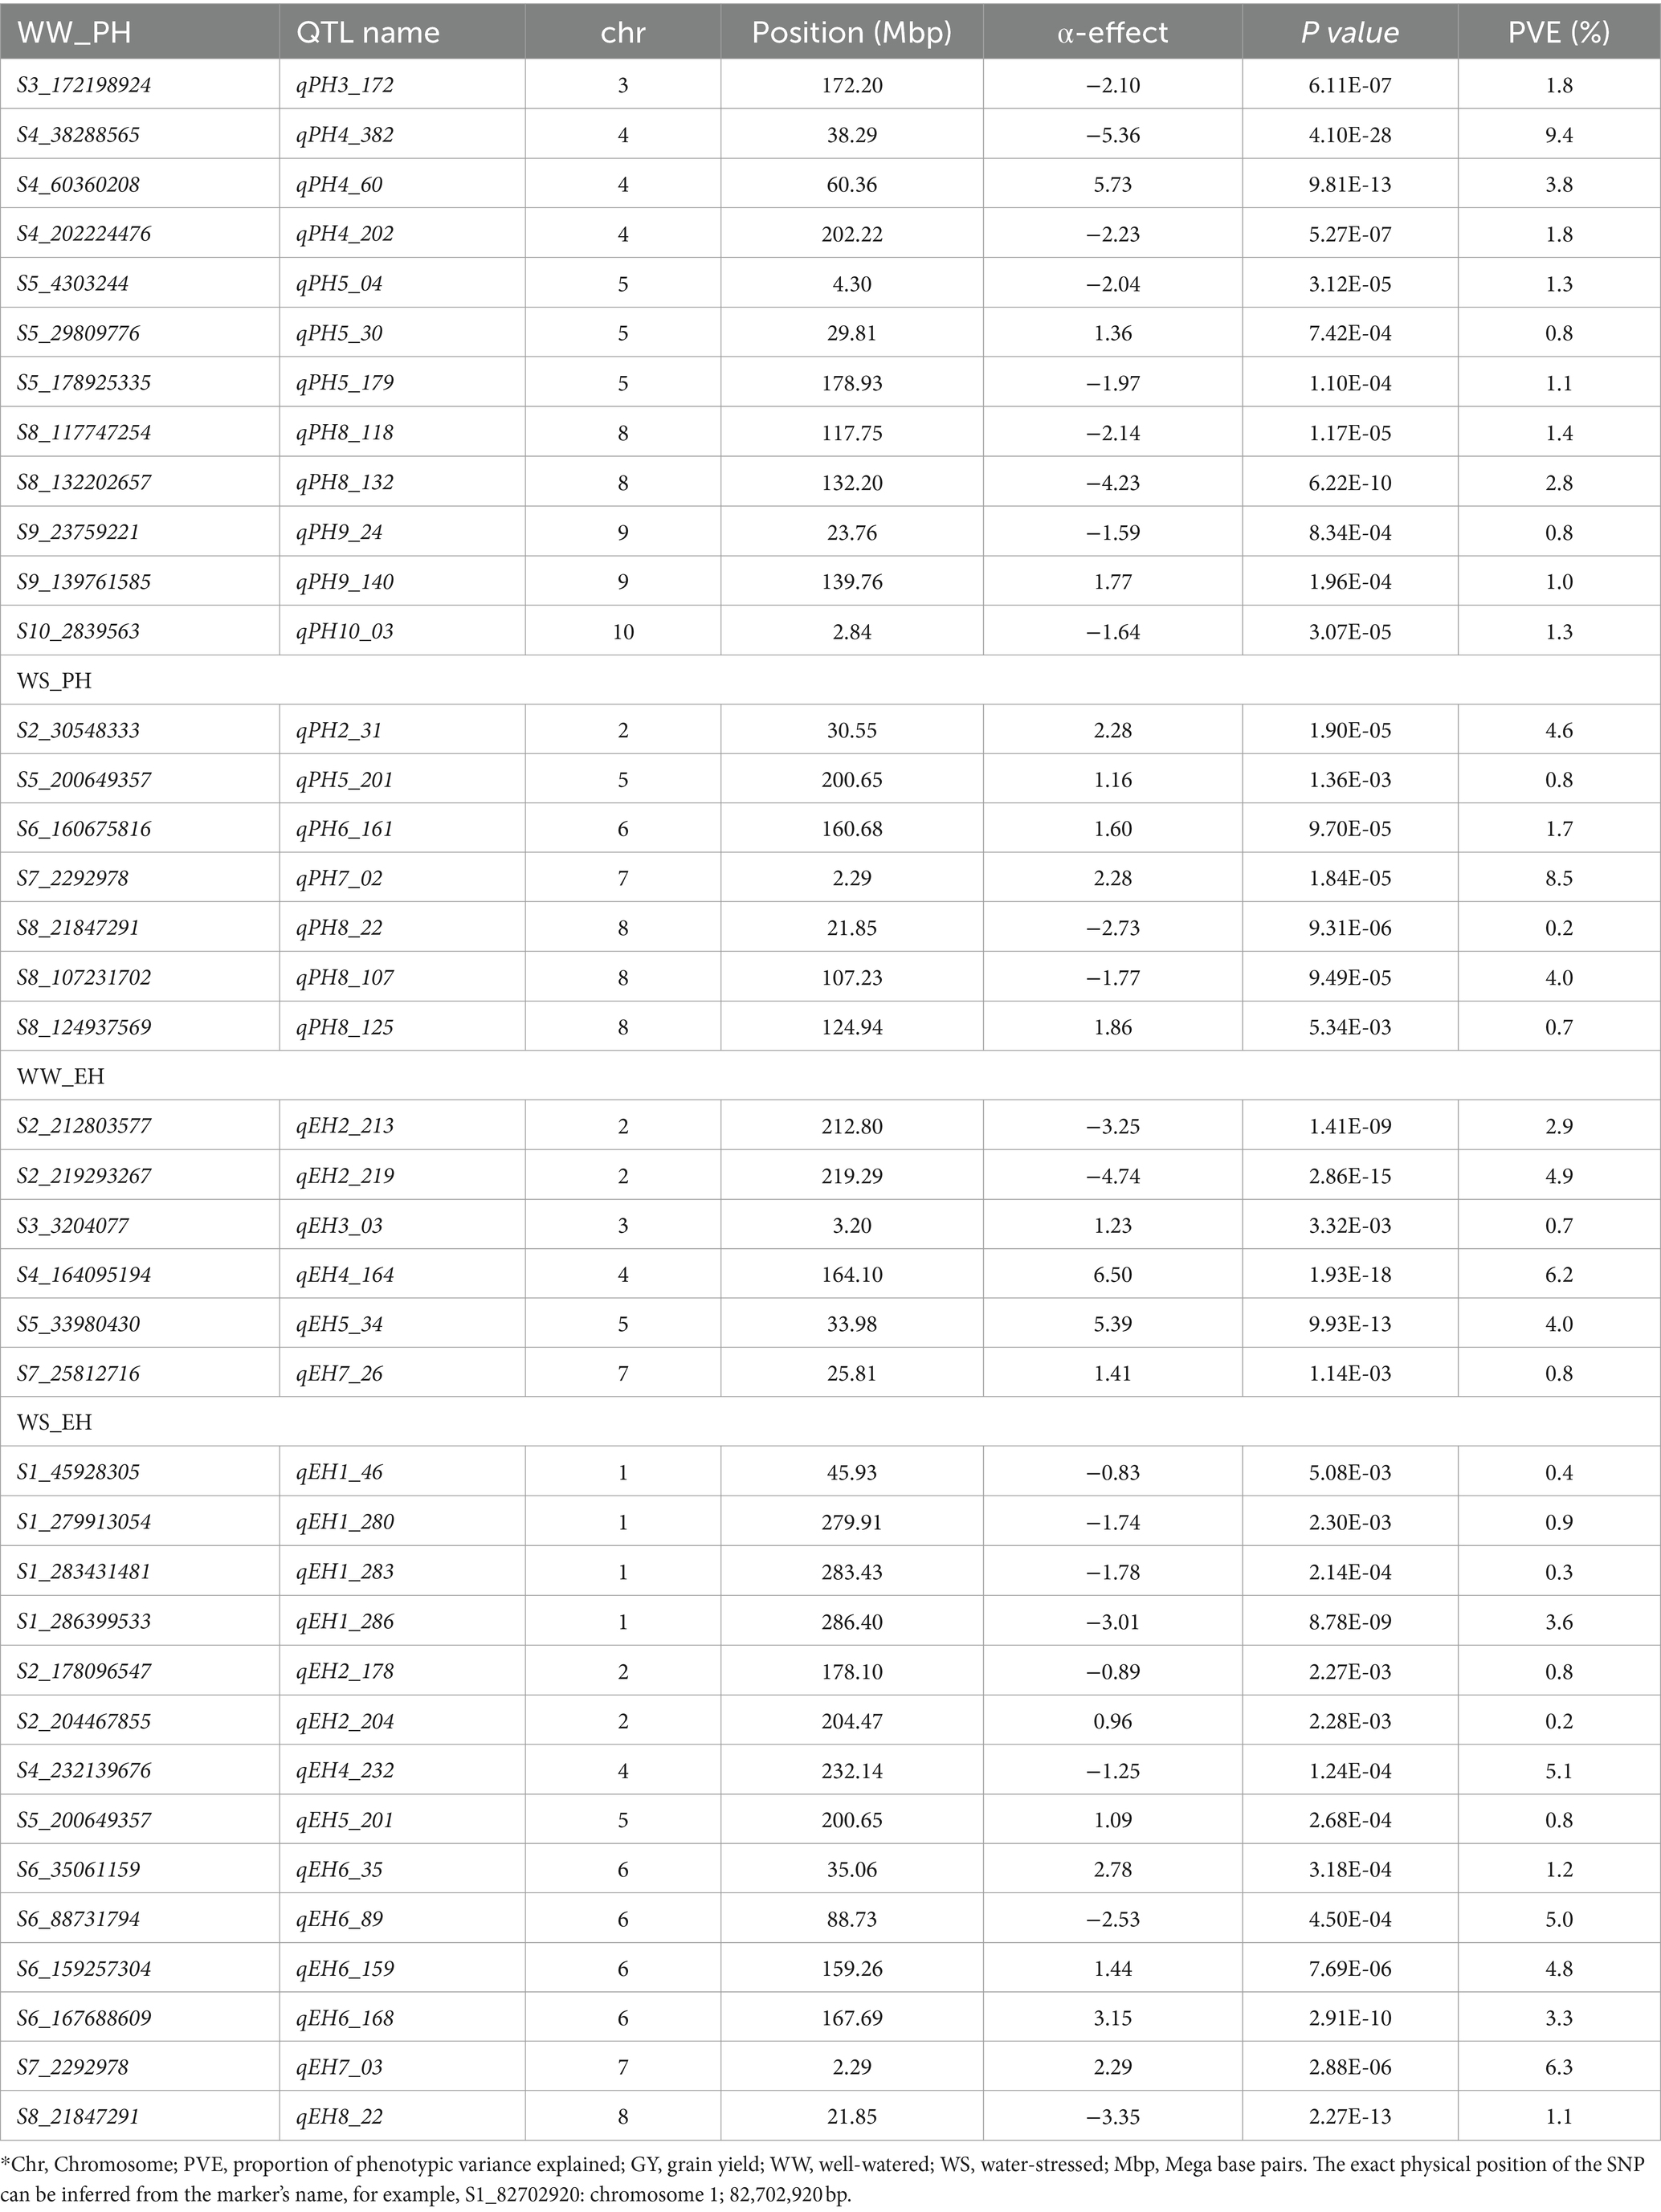
Table 9. Analysis of PH and EH-associated markers under well-watered and water-stressed conditions, allele substitution (α) effects, and the phenotypic variance (PVE) of the joint linkage association mapping based on combined three F3 populations.
3.3 Prediction accuracies of grain yield and related traits under WW and WS conditions
Five-fold cross-validation was used to assess the prediction accuracy for GY, ASI, PH and EH traits by combining data from three populations and within each population. Prediction accuracies for the training and testing within-within (WW scenario 1) populations were 0.67, 0.58 and 0.57 for GY under well-watered conditions and 0.38, −0.15 and 0.20 under water stress conditions for pop 1, pop 2 and pop 3, respectively (Figure 3). For ASI, prediction accuracies for pop 1, pop 2 and pop 3 were 0.55, 0.74 and 0.61 under WW conditions and 0.30, 0.31 and 0.41 under WS conditions, respectively. For PH, prediction accuracies of 0.75 and 0.67, 0.68 under WW conditions and 0.48, 0.30 and 0.62 under WS conditions were recorded for pop 1, pop 2 and pop 3, respectively. For EH, prediction accuracies of 0.38, 0.20 and 0.60 under WW management and 0.67, 0.58 and 0.60 under WS management were recorded for pop 1, pop 2 and pop 3, respectively. For across-within scenario (AW scenario 2) where training population is derived by combining all three populations and testing population is derived from within single population, prediction accuracies for GY were higher under well-watered conditions with 0.56, 0.59 and 0.44 compared to WS conditions (0.25, −0.01 and 0.15) for pop 1, pop 2, and pop 3, respectively. For ASI, PH and EH, the prediction accuracies were varied from 0.58 to 0.70, 0.63 to 0.78 and 0.62 to 0.70 under well-watered conditions, respectively. Whereas under water stress conditions prediction accuracies for ASI, PH and EH were ranged from 0.34 to 0.44, 0.31 to 0.72 and 0.35 to 0.61, respectively. The prediction accuracy across all populations combined showed high values for all traits in both well-watered (0.53–0.90) and water stress (0.41–0.89) conditions (Figure 3).
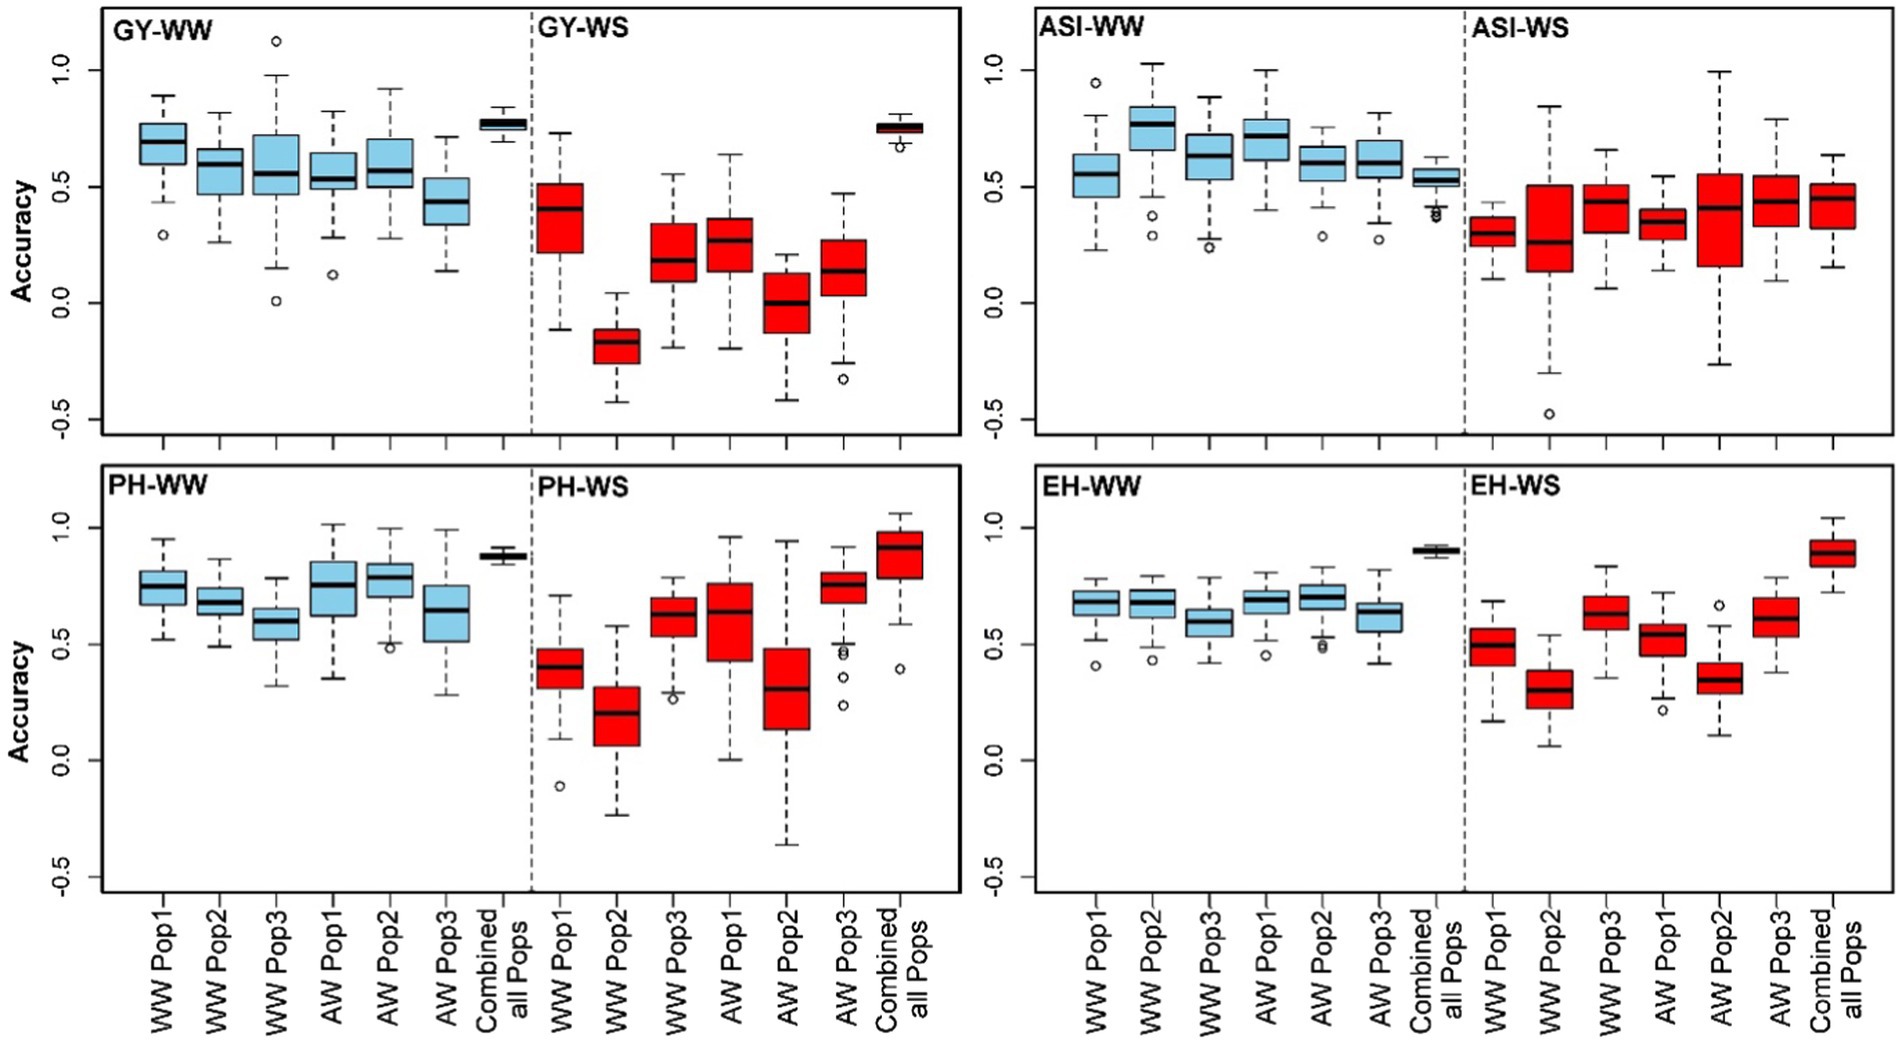
Figure 3. Genome-wide prediction accuracies for GY, ASI, PH and EH in within-within (WW) population, across-within (AW) population and all combined populations scenarios. Blue and red box plots illustrate trait evaluations conducted under well-watered and water-stressed conditions, respectively.
4 Discussion
Water stress is one of the most significant abiotic factors impacting GY and quality in maize-dependent farming systems of SSA. WS-tolerant maize varieties can offer an inexpensive solution to low-input farming systems in drought-prone regions. Improving WS tolerance in maize cultivars using advanced tools such as doubled haploid technology and marker-assisted selection necessitates a deeper knowledge of its genetic basis (Hu et al., 2021). Mapping of QTLs associated with WS tolerance, and its related secondary traits can facilitate the use of molecular markers for improving WS tolerance in tropical maize. In this study, three bi-parental populations were evaluated under WW and WS conditions in Kenya and Zimbabwe. The populations were mapped for QTL associated with GY, PH, EH and ASI. These related complex quantitative traits have been widely used for selection in the development of WS-tolerant maize lines and hybrids (Zhao et al., 2019).
4.1 Well-watered and water-stressed conditions induced significant variations in phenotypic mean, variance, and heritability
Our phenotypic analyses showed that GY, PH and EH were substantially decreased under WS conditions across the studied bi-parental populations. This is consistent with the findings of previous studies (Adebayo and Menkir, 2014; Wang et al., 2019; Balbaa et al., 2022; Gopalakrishna K. et al., 2023; Huang et al., 2023), which demonstrated that WS has an impact on GY and its related traits in maize. In our study, the average GY was highest (4.55–8.55 t/ha) and lowest (1.29–5.59 t/ha) for WW and WS conditions, respectively. The observed discrepancy in GY between those for WW and WS conditions underscores the influence of WS on maize crop productivity in SSA. We also found that, across environments, WS-induced GY reductions were highest for pop 1 (59%) and lowest for pop 3 (31%). Our results indicate that under conditions of WS, all studied bi-parental populations experienced reductions in GY. Notably, among the three tested genotypes, Pop 3 exhibited a comparatively higher level of WS tolerance, as evidenced by its lower GY losses under WS and also the contribution of favourable alleles from known WS tolerant parent (LaPostaSequiaC7-F71).
Like GY, ASI serves as one of the traits utilized in maize breeding initiatives (Silva et al., 2022) for selecting water stress tolerance. In our study, significantly wide ranges (2.6 days longer) were observed for ASI under WS compared to WW conditions across the studied genotypes. A wider ASI in maize under WS indicates an extended duration between the initiation of anthesis and silking – i.e., likely due to slowed reproductive development. This asynchrony can have adverse effects on pollination, potentially leading to low GY. Araus et al. (2012) alluded that maize plants exhibiting a wider ASI during WS conditions tend to either produce no seeds or yield only a limited number of grains per ear. The specific causes of the elongated ASI triggered by WS remain uncertain (Liu et al., 2021). Like GY response across genotypes, the mean values of PH and EH exhibited their lowest points under conditions of WS compared to WW conditions. These findings serve to highlight the adverse influence of WS on these GY-related traits and, by extension, maize crop performance in SSA. In this respect, further research into the mechanisms governing the observed GY and related trait variations can provide valuable insights for enhancing the resilience of smallholder maize systems in SSA.
Earlier studies have reported that the slow rate of genetic gain in breeding for WS tolerance can be attributed to high GxE interaction and low heritability and the polygenic nature of this trait (Mathew et al., 2019; Sallam et al., 2019; Zhang et al., 2022). Across the studied bi-parental populations and field conditions, broad-sense heritabilities were low (0.17) to high (0.85) for the studied traits. Most importantly, heritability estimates for GY and EH were low to high for both WW and WS conditions. High heritability estimates indicate the potential for traits to be improved through recurrent selection processes (Gowda et al., 2021; Ndlovu et al., 2022). High broad-sense heritability estimates hint at the possibility of even greater narrow-sense heritability, suggesting the feasibility of achieving substantial genetic advancement for these traits. We also found that the broad sense heritabilities of all studied maize traits at individual population levels decreased under WS conditions compared to WW conditions. This was consistent with studies by Chen et al. (2023) and Zhao et al. (2019), who also presented lower heritabilities for traits under WS conditions.
For genotypic variance, statistical significance at p ≤ 0.05 was observed for all traits (Table 2). Genotypic variance decreased for GY and PH under WS. A study by Badu-Apraku et al. (2017) on early white maize in Nigeria also reported a decreased GY heritability and magnitude of genotypic variance under WS conditions. G × E interaction variance was also significant (p ≤ 0.05) for all traits in pop 1 and pop 2 indicating the substantial variation observed in terms of the performance of genotypes in different environments. We also observed significant negative correlations between GY and other yield-related traits in both WW and WS conditions (Figure 2). This suggests adopting a cautious approach when trying to improve multiple traits simultaneously under both WW and WS conditions.
4.2 Multiple QTLs identified for well-watered and water-stressed environments
Linkage mapping in three bi-parental maize populations identified multiple QTLs for GY, PH, EH and ASI under WW (93) and WS (41) conditions. Previous studies have also found multiple QTLs for WS-related traits and GY in maize (Sanguineti et al., 1999; Li et al., 2016; Zhao et al., 2018; Abdelghany et al., 2019; Zhao et al., 2019; Hu et al., 2021; Sarkar et al., 2023). Although previous studies have identified QTLs and genes associated with improved GY and related traits, untapped maize populations probably harbour additional genetic variations. In our study, QTL analyses in individual bi-parental populations identified 22, 18, 49 and 45 QTLs for GY, ASI, PH and EH, respectively. The highest number of QTLs was identified in pop 3 (n = 60) and pop 2 (n = 43) under WW and WS conditions, respectively. Notably, four QTLs were identified for GY under WS (qGY4_70 (Chr. 4), qGY2_215, qGY2_185 (Chr. 2), and qGY1_195 (Chr. 1)). Under both WW and WS environments, GY-associated QTLs were distributed across all chromosomes except chr 6 and 7 (Table 3). Agrama et al. (1999) found genomic regions associated with WS tolerance on chromosomes 1, 3, 5, 6 and 8. Hu et al. (2021) reported QTLs on chromosomes 3, 5, 7 and 10 for yield-related traits under different water regimes. Comparison of QTL detected across populations revealed several common genomic regions across populations, like two QTLs, qGY1_199 in pop 1 and qGY1_195 on pop 3 were overlapped at 190–200 Mbp on chromosome 1 (Table 3). Another QTL for GY on chromosome 4 (qGY4_70) detected on pop 2 overlapped with QTL (qGY4_60) detected on pop 3. For ASI, one QTL (qASI4_175) was detected in both pop 2 and pop 3 under WW conditions (Table 4). For PH, one QTL (qPH8_130) detected under WS was located within the region of the QTL (qPH8_145) detected under WW management (Table 5). These genomic regions are most interesting to know their role in trait improvement and bring most of these favourable alleles into elite lines through marker-assisted selection. In the case of ASI, nine QTLs each were identified under WW and WS conditions. In both water regimes, chromosome 3 did not harbour any QTLs for ASI. Significant QTLs with major effects (explaining more than 10% of the phenotypic variance) were identified for GY (qGY6_89) and ASI (qASI1_107) under WS conditions.
The absence of QTLs associated with GY and related traits on certain chromosomes in our analysis, compared to previous studies, highlights the complex interplay of genes and environmental pressures that significantly shape QTL identification in tropical maize. The observed disparities can be attributed to distinct maize populations and growing/management conditions employed (Ndlovu et al., 2024). This further emphasizes the need to consider these prevailing interactions when investigating genetic influences on maize traits under WS conditions.
Linkage mapping uses variation within a population whereas JLAM is known to explore variations both within and across populations. This allows JLAM to detect new QTLs which are not detected through individual linkage mapping. In our study, among the 25 QTLs detected for GY under WW conditions, only two QTLs (qGY3_208 and qGY4_70) overlapped with QTLs detected through linkage mapping. JLAM analyses revealed 25 and 4 QTLs under WW and WS conditions for GY, respectively, which were distributed across all chromosomes and individually explained 0.8–11.8% of the phenotypic variance (Table 7). JLAM results indicated that GY is controlled by many minor effect genes, as shown in low PVE for each QTL (Table 7). However, we found one major effect QTL on chromosome 6 (qGY6-89) which explained 11.8% of phenotypic variation and was found overlapping with the PH QTL (qPH6-87) on pop 2 (Tables 5, 7). Because of limited recombination events during population development, linkage mapping identifies the genomic region with 10-20 cM intervals. On the contrary, JLAM identifies the single marker which is closely linked to the causative gene for the trait of interest. Two QTLs (qGY3_208 and qGY4_70) detected through JLAM overlapped with the QTL detected in linkage mapping helped to reduce the confidence interval of the QTLs and may even be closer to the causal variant responsible for GY. On the other hand, a comparison of QTLs detected across WW and WS conditions revealed no common QTL for GY, PH and EH. On the contrary, we found four QTLs for ASI (qASI1_234, qASI8_22, qASI9_105 and qASI9_108) were consistently detected across WW and WS regimes. ASI is critical in hybrid breeding, specifically in commercial seed production and also in drought-prone regions for good seed setting. Therefore, these genomic regions are important to achieve synchrony in flowering time in diverse management.
4.3 Genomic prediction accuracies under different water regimes
Genomic prediction demonstrated its usefulness in maize breeding by facilitating the rapid selection of superior genotypes. This was achieved by using molecular markers which help to capture maximum favourable alleles for various traits of interest. Breeding for drought tolerance is resource and time-intensive. Genomic prediction offers an alternative and complementary tool to achieve high selection efficiency with optimum resources (Beyene et al., 2015, 2019, 2021; Atanda et al., 2021). Several studies reported that genomic-prediction-based models are effective in identifying better-performing genotypes for GY and other agronomic and disease resistance traits (Crossa et al., 2017; Sitonik et al., 2019; Ertiro et al., 2020; Kibe et al., 2020a; Gowda et al., 2021; Ndlovu et al., 2022; Kimutai et al., 2023; Ndlovu et al., 2024). The effectiveness of GS compared to traditional phenotypic selection plays a significant role in determining its likelihood of adoption in breeding programs (Beyene et al., 2019; Kibe et al., 2020b). In our study, the moderate to high levels of prediction accuracy observed across the bi-parental populations hold the potential for enhancing breeding efforts to improve WS tolerance in tropical maize germplasm. The same trends were observed in previous studies which reported moderate to high accuracies for GY and related traits under WS (Dias et al., 2018; Zhang et al., 2022). The moderate to high prediction accuracy we report here indicates that the methodology used is reliable in predicting the performance of GY and related traits in bi-parental maize populations under different water regimes. This reliability enhances the effectiveness of breeding for WS tolerance programs by enabling the selection of genotypes for desired traits more efficiently.
Combining the three populations and forming the training set and testing set from the total populations resulted in substantial improvement in the prediction accuracy (Figure 3). This was due to the increase in the population size of the training set and the high relatedness between training and testing sets. Unlike other traits, GY exhibited a negative prediction accuracy for drought tolerance in population 2 under within-within and across-within prediction scenarios (Figure 3). Similar results were also reported for prediction among biparental populations of maize (Riedelsheimer and Melchinger, 2013; Sitonik et al., 2019) and sugar beet (Würschum et al., 2013). Mismatched alleles between markers linked with WS tolerance in pop 2 could explain the negative prediction accuracy. Moreover, low genotypic variation and heritability for GY response to WS conditions might have also contributed.
Under WW management, the prediction accuracy for GY was 0.67, 0.58 and 0.57 in the within-within scenario for pop 1, pop 2 and pop 3, respectively (Figure 3). In scenario 2, a training population combining individuals from three populations achieved prediction accuracies of 0.56, 0.59 and 0.44 for pop 1, pop 2 and pop 3, respectively (Figure 3). Though there is a reduction in accuracy for scenario 2, the recorded accuracies are still comparable to those of phenotypic selection. The recorded moderate to high prediction accuracies likely stems from the shared parentage between the studied maize populations. Breeding for WS tolerance remains a challenging task. While the reported prediction accuracies indicate some success in achieving this goal, they still fall short of those achievable through phenotypic selection. However, since it’s possible to fit three maize cycles per agricultural calendar (Beyene et al., 2019), GS is expected to get a similar or higher genetic gain over phenotypic selection in the coming years. For ASI, PH and EH, accuracies are relatively high which clearly supports the usefulness of GS in their improvement under both WW and WS conditions.
5 Conclusion
The negative impact of drought on maize production has been profound, significantly impairing the livelihoods and food security of millions of people in SSA. Drought tolerance, an important trait, can play a vital role in mitigating the yield losses caused by drought in smallholder maize farming systems. Here, we investigated the genetic parameters (i.e., heritabilities and genetic-based variances), mapped QTLs for WS tolerance and assessed the potential of using GS in bi-parental maize populations evaluated under WW and WS conditions in Kenya and Zimbabwe. For these genotypes, broad sense heritabilities were low to high and genetic variances were significant for the studied traits. For GY, these parameters were decreased under WS. According to our QTL mapping results, WS tolerance in maize is controlled by multiple genes with small effects. Several QTLs identified in this study were found to be overlapping across different analyses and with earlier studies. The genomic regions consistently detected more than one population and/or traits that are promising and need to be prioritised for inclusion in marker-assisted recurrent selection. This is vital in our efforts to increase favourable alleles in selected elite maize germplasm. The specific genomic loci identified in this study can also be used in selecting for improved GY and related trait performances under WS conditions. Additionally, our results demonstrated that incorporating GS into maize breeding for WS tolerance can effectively complement traditional phenotypic selection. In addition, future research should also prioritize the validation of the QTLs identified in this study to further improve the efficiency of WS-tolerance maize breeding efforts in SSA.
Data availability statement
The datasets presented in this study can be found in online repositories. The names of the repository/repositories and accession number(s) can be found in the article/Supplementary material.
Author contributions
NN: Conceptualization, Data curation, Formal analysis, Methodology, Validation, Writing – original draft, Writing – review & editing. MG: Conceptualization, Data curation, Funding acquisition, Investigation, Project administration, Software, Supervision, Writing – original draft, Writing – review & editing. YB: Conceptualization, Investigation, Project administration, Validation, Visualization, Writing – review & editing. VC: Data curation, Formal analysis, Methodology, Visualization, Writing – review & editing. FN: Conceptualization, Project administration, Supervision, Validation, Writing – review & editing. DM: Conceptualization, Resources, Validation, Visualization, Writing – review & editing. PM: Resources, Supervision, Validation, Visualization, Writing – review & editing. CS: Investigation, Project administration, Resources, Supervision, Validation, Writing – review & editing. BP: Conceptualization, Funding acquisition, Investigation, Project administration, Resources, Supervision, Writing – review & editing.
Funding
The author(s) declare that financial support was received for the research, authorship, and/or publication of this article. The success of this paper is highly attributed to the mother projects which include DTMA, WEMA, and IMAS projects. The research was supported by the Bill and Melinda Gates Foundation (B&MGF), Foundation for Food and Agriculture Research (FFAR) and the United States Agency for International Development (USAID) through AGG (Accelerating Genetic Gains in Maize and Wheat for Improved Livelihoods; B&MGF Investment ID INV-003439). NN, PM and CS acknowledge funding from the European Commission DESIRA funded LEG4DEV Project [FOOD/2020/418–901] and the Science Foundation Ireland Principal Investigator Grant [13/IA/1820].
Acknowledgments
The authors thank the CIMMYT field technicians for phenotypic evaluations and Laboratory technicians for sample preparation for genotyping. More gratitude to Dr. Kassa Semagn, for his excellent and noble guidance throughout the processes of this research. We also thank Dr. Edward S Buckler and the Institute of Genomic Diversity, Cornell University, for the high-density genotyping (GBS) and imputation service.
Conflict of interest
The authors declare that the research was conducted in the absence of any commercial or financial relationships that could be construed as a potential conflict of interest.
Publisher’s note
All claims expressed in this article are solely those of the authors and do not necessarily represent those of their affiliated organizations, or those of the publisher, the editors and the reviewers. Any product that may be evaluated in this article, or claim that may be made by its manufacturer, is not guaranteed or endorsed by the publisher.
Supplementary material
The Supplementary material for this article can be found online at: https://www.frontiersin.org/articles/10.3389/fsufs.2024.1391989/full#supplementary-material
Footnotes
References
Abdelghany, M., Liu, X., Hao, L., Gao, C., Kou, S., Su, E., et al. (2019). QTL analysis for yield-related traits under different water regimes in maize. Maydica. 64:10. Available at: https://core.ac.uk/reader/270269270.
Adebayo, M. A., and Menkir, A. (2014). Assessment of hybrids of drought tolerant maize (Zea mays L.) inbred lines for grain yield and other traits under stress managed conditions. Niger. J. Genet. 28, 19–23. doi: 10.1016/j.nigjg.2015.06.004
Agrama, H., Zakaria, A., Said, F., and Tuinstra, M. (1999). Identification of quantitative trait loci for nitrogen use efficiency in maize. Mol. Breed. 5, 187–195. doi: 10.1023/A:1009669507144
Alvarado, G., López, M., Vargas, M., Pacheco, Á., Rodríguez, F., Burgueño, J., et al. (2015). META-R (multi Environment Trail analysis with R for windows) version 6.04 : CIMMYT Research Data & Software Repository Network, V23. Available at: https://hdl.handle.net/11529/10201
Alvarado, G., Rodríguez, F. M., Pacheco, A., Burgueño, J., Crossa, J., Vargas, M., et al. (2020). META-R: A software to analyze data from multi-environment plant breeding trials. Crop J. 8, 745–756. doi: 10.1016/j.cj.2020.03.010
Anilkumar, C., Muhammed Azharudheen, T. P., Sah, R. P., Sunitha, N. C., Devanna, B. N., Marndi, B. C., et al. (2023). Gene based markers improve precision of genome-wide association studies and accuracy of genomic predictions in rice breeding. Heredity 130, 335–345. doi: 10.1038/s41437-023-00599-5
Araus, J. L., Serret, M. D., and Edmeades, G. O. (2012). Phenotyping maize for adaptation to drought. Front. Physiol. 3:305. doi: 10.3389/fphys.2012.00305
Atanda, S. A., Olsen, M., Burgueño, J., Crossa, J., Dzidzienyo, D., Beyene, Y., et al. (2021). Maximizing efficiency of genomic selection in CIMMYT’s tropical maize breeding program. Theor. Appl. Genet. 134, 279–294. doi: 10.1007/s00122-020-03696-9
Badu-Apraku, B., Oyekunle, M., Talabi, A., Annor, B., and Akaogu, I. (2017). Changes in genetic variances and heritabilities in an early white maize population following S1 selection for grain yield, Striga resistance and drought tolerance. J. Agric. Sci. 155, 629–642. doi: 10.1017/S0021859616000770
Badu-Apraku, B., Talabi, A., Fakorede, M., Fasanmade, Y., Gedil, M., Magorokosho, C., et al. (2019). Yield gains and associated changes in an early yellow bi-parental maize population following genomic selection for Striga resistance and drought tolerance. BMC Plant Biol. 19, 1–17. doi: 10.1186/s12870-019-1740-z
Balbaa, M. G., Osman, H. T., Kandil, E. E., Javed, T., Lamlom, S. F., Ali, H. M., et al. (2022). Determination of morpho-physiological and yield traits of maize inbred lines (Zea mays L.) under optimal and drought stress conditions. Front. Plant Sci. 13:959203. doi: 10.3389/fpls.2022.959203
Bänziger, M., Edmeades, G., Beck, D., and Bellon, M. (2000). Breeding for drought and nitrogen stress tolerance in maize: From theory to practice. Mexico, D.F.: CIMMYT. Available at: http://hdl.handle.net/10883/765.
Barutcular, C., Dizlek, H., el-Sabagh, A., Sahin, T., Elsabagh, M., and Islam, S. (2016). Nutritional quality of maize in response to drought stress during grain-filling stages in Mediterranean climate condition. J. Exp. Biol. Agric. Sci. 4, 644–652. doi: 10.18006/2016.4(Issue6).644.652
Bentley, A. R., Scutari, M., Gosman, N., Faure, S., Bedford, F., Howell, P., et al. (2014). Applying association mapping and genomic selection to the dissection of key traits in elite European wheat. Theor. Appl. Genet. 127, 2619–2633. doi: 10.1007/s00122-014-2403-y
Beyene, Y., Gowda, M., Olsen, M., Robbins, K. R., Pérez-Rodríguez, P., Alvarado, G., et al. (2019). Empirical comparison of tropical maize hybrids selected through genomic and phenotypic selections. Front. Plant Sci. 10:1502. doi: 10.3389/fpls.2019.01502
Beyene, Y., Gowda, M., Pérez-Rodríguez, P., Olsen, M., Robbins, K. R., Burgueño, J., et al. (2021). Application of genomic selection at the early stage of breeding pipeline in tropical maize. Front. Plant Sci. 12:685488. doi: 10.3389/fpls.2021.685488
Beyene, Y., Gowda, M., Suresh, L. M., Mugo, S., Olsen, M., Oikeh, S. O., et al. (2017). Genetic analysis of tropical maize inbred lines for resistance to maize lethal necrosis disease. Euphytica 213:224. doi: 10.1007/s10681-017-2012-3
Beyene, Y., Semagn, K., Crossa, J., Mugo, S., Atlin, G. N., Tarekegne, A., et al. (2016). Improving maize grain yield under drought stress and non-stress environments in sub-saharan africa using marker-assisted recurrent selection. Crop Sci. 56, 344–353. doi: 10.2135/cropsci2015.02.0135
Beyene, Y., Semagn, K., Mugo, S., Tarekegne, A., Babu, R., Meisel, B., et al. (2015). Genetic gains in grain yield through genomic selection in eight bi-parental maize populations under drought stress. Crop Sci. 55, 154–163. doi: 10.2135/cropsci2014.07.0460
Bolaños, J., and Edmeades, G. (1996). The importance of the anthesis-silking interval in breeding for drought tolerance in tropical maize. Field Crop Res. 48, 65–80. doi: 10.1016/0378-4290(96)00036-6
Bradbury, P. J., Zhang, Z., Kroon, D. E., Casstevens, T. M., Ramdoss, Y., and Buckler, E. S. (2007). TASSEL: software for association mapping of complex traits in diverse samples. Bioinformatics 23, 2633–2635. doi: 10.1093/bioinformatics/btm308
Breen, C., Ndlovu, N., McKeown, P. C., and Spillane, C. (2024). Legume seed system performance in sub-Saharan Africa: barriers, opportunities, and scaling options. A review. Agron. Sustain. Dev. 44:20. doi: 10.1007/s13593-024-00956-6
Cerrudo, D., Cao, S., Yuan, Y., Martinez, C., Suarez, E. A., Babu, R., et al. (2018). Genomic selection outperforms marker assisted selection for grain yield and physiological traits in a maize doubled haploid population across water treatments. Front. Plant Sci. 9:366. doi: 10.3389/fpls.2018.00366
Chen, S., Dang, D., Liu, Y., Ji, S., Zheng, H., Zhao, C., et al. (2023). Genome-wide association study presents insights into the genetic architecture of drought tolerance in maize seedlings under field water-deficit conditions. Front. Plant Sci. 14:1165582. doi: 10.3389/fpls.2023.1165582
Chen, J., Shrestha, R., Ding, J., Zheng, H., Mu, C., Wu, J., et al. (2016). Genome-wide association study and QTL mapping reveal genomic loci associated with fusarium ear rot resistance in tropical maize germplasm. G3 6, 3803–3815. doi: 10.1534/g3.116.034561
Choudhary, M., Kumar, P., Kumar, P., Sheoran, S., Zunjare, R. U., and Jat, B. S. (2023). “Molecular breeding for drought and heat stress in maize: revisiting the progress and achievements” in QTL mapping in crop improvement (Elsevier), 57–74.
Chukwudi, U. P., Kutu, F. R., and Mavengahama, S. (2021). Maize response to combined heat and water stresses under varying growth conditions. Agron. J. 113, 4672–4689. doi: 10.1002/agj2.20820
Collins, N. C., Tardieu, F., and Tuberosa, R. (2008). Quantitative trait loci and crop performance under abiotic stress: where do we stand? Plant Physiol. 147, 469–486. doi: 10.1104/pp.108.118117
Crossa, J., Pérez-Rodríguez, P., Cuevas, J., Montesinos-López, O., Jarquín, D., De Los Campos, G., et al. (2017). Genomic selection in plant breeding: methods, models, and perspectives. Trends Plant Sci. 22, 961–975. doi: 10.1016/j.tplants.2017.08.011
Dekkers, J. (2007). Prediction of response to marker-assisted and genomic selection using selection index theory. J. Anim. Breed. Genet. 124, 331–341. doi: 10.1111/j.1439-0388.2007.00701.x
Deutsch, C. A., Tewksbury, J. J., Tigchelaar, M., Battisti, D. S., Merrill, S. C., Huey, R. B., et al. (2018). Increase in crop losses to insect pests in a warming climate. Science 361, 916–919. doi: 10.1126/science.aat3466
Dias, K. O. D. G., Gezan, S. A., Guimarães, C. T., Nazarian, A., da Costa e Silva, L., Parentoni, S. N., et al. (2018). Improving accuracies of genomic predictions for drought tolerance in maize by joint modeling of additive and dominance effects in multi-environment trials. Heredity 121, 24–37. doi: 10.1038/s41437-018-0053-6
Elshire, R. J., Glaubitz, J. C., Sun, Q., Poland, J. A., Kawamoto, K., Buckler, E. S., et al. (2011). A robust, simple genotyping-by-sequencing (GBS) approach for high diversity species. PLoS One 6:e19379. doi: 10.1371/journal.pone.0019379
Ertiro, B. T., Labuschagne, M., Olsen, M., Das, B., Prasanna, B. M., and Gowda, M. (2020). Genetic dissection of nitrogen use efficiency in tropical maize through genome-wide association and genomic prediction. Front. Plant Sci. 11:474. doi: 10.3389/fpls.2020.00474
Fisher, M., Abate, T., Lunduka, R. W., Asnake, W., Alemayehu, Y., and Madulu, R. B. (2015). Drought tolerant maize for farmer adaptation to drought in sub-Saharan Africa: determinants of adoption in eastern and southern Africa. Clim. Chang. 133, 283–299. doi: 10.1007/s10584-015-1459-2
Gilmour, A. R., Gogel, B. J., Cullis, B. R., and Thompson, R. (2009). ASReml User Guide Release 3.0 VSN International Ltd, Hemel Hempstead, HP1 1ES, UK. Available at: https://vsni.co.uk/
Glaubitz, J. C., Casstevens, T. M., Lu, F., Harriman, J., Elshire, R. J., Sun, Q., et al. (2014). TASSEL-GBS: a high capacity genotyping by sequencing analysis pipeline. PLoS One 9:e90346. doi: 10.1371/journal.pone.0090346
Gopalakrishna, K. N., Hugar, R., Rajashekar, M. K., Jayant, S. B., Talekar, S. C., and Virupaxi, P. C. (2023). Simulated drought stress unravels differential response and different mechanisms of drought tolerance in newly developed tropical field corn inbreds. PLoS One 18:e0283528. doi: 10.1371/journal.pone.0283528
Gowda, M., Beyene, Y., Makumbi, D., Semagn, K., Olsen, M. S., Bright, J. M., et al. (2018). Discovery and validation of genomic regions associated with resistance to maize lethal necrosis in four biparental populations. Mol. Breed. 38, 1–16. doi: 10.1007/s11032-018-0829-7
Gowda, M., Das, B., Makumbi, D., Babu, R., Semagn, K., Mahuku, G., et al. (2015). Genome-wide association and genomic prediction of resistance to maize lethal necrosis disease in tropical maize germplasm. Theor. Appl. Genet. 128, 1957–1968. doi: 10.1007/s00122-015-2559-0
Gowda, M., Makumbi, D., Das, B., Nyaga, C., Kosgei, T., Crossa, J., et al. (2021). Genetic dissection of Striga hermonthica (Del.) Benth. Resistance via genome-wide association and genomic prediction in tropical maize germplasm. Theor. Appl. Genet. 134, 941–958. doi: 10.1007/s00122-020-03744-4
Habte, E., Marenya, P., Beyene, F., and Bekele, A. (2023). Reducing susceptibility to drought under growing conditions as set by farmers: the impact of new generation drought tolerant maize varieties in Uganda. Front. Sustain. Food Syst. 6:854856. doi: 10.3389/fsufs.2022.854856
He, L., Xiao, J., Rashid, K. Y., Jia, G., Li, P., Yao, Z., et al. (2019). Evaluation of genomic prediction for pasmo resistance in flax. Int. J. Mol. Sci. 20:359. doi: 10.3390/ijms20020359
Hu, X., Wang, G., Du, X., Zhang, H., Xu, Z., Wang, J., et al. (2021). QTL analysis across multiple environments reveals promising chromosome regions associated with yield-related traits in maize under drought conditions. Crop J. 9, 759–766. doi: 10.1016/j.cj.2020.10.004
Huang, C., Qin, A., Gao, Y., Ma, S., Liu, Z., Zhao, B., et al. (2023). Effects of water deficit at different stages on growth and ear quality of waxy maize. Front. Plant Sci. 14:1069551. doi: 10.3389/fpls.2023.1069551
Khan, S. U., Zheng, Y., Chachar, Z., Zhang, X., Zhou, G., Zong, N., et al. (2022). Dissection of maize drought tolerance at the flowering stage using genome-wide association studies. Genes 13:564. doi: 10.3390/genes13040564
Kibe, M., Nair, S. K., Das, B., Bright, J. M., Makumbi, D., Kinyua, J., et al. (2020a). Genetic dissection of resistance to gray leaf spot by combining genome-wide association, linkage mapping, and genomic prediction in tropical maize germplasm. Front. Plant Sci. 11:572027. doi: 10.3389/fpls.2020.572027
Kibe, M., Nyaga, C., Nair, S. K., Beyene, Y., Das, B., Bright, J. M., et al. (2020b). Combination of linkage mapping, GWAS, and GP to dissect the genetic basis of common rust resistance in tropical maize germplasm. Int. J. Mol. Sci. 21:6518. doi: 10.3390/ijms21186518
Kimutai, C., Ndlovu, N., Chaikam, V., Ertiro, B. T., Das, B., Beyene, Y., et al. (2023). Discovery of genomic regions associated with grain yield and agronomic traits in bi-parental populations of maize (Zea mays. L) under optimum and low nitrogen conditions. Front. Genet. 14:1266402. doi: 10.3389/fgene.2023.1266402
Kosambi, D. D. (1944). The estimation of map distance from recombination values. Ann. Eugenics 12, 172–175,
Li, C., Sun, B., Li, Y., Liu, C., Wu, X., Zhang, D., et al. (2016). Numerous genetic loci identified for drought tolerance in the maize nested association mapping populations. BMC Genomics 17, 1–11. doi: 10.1186/s12864-016-3170-8
Li, S., Zhang, C., Lu, M., Yang, D., Qian, Y., Yue, Y., et al. (2020). QTL mapping and GWAS for field kernel water content and kernel dehydration rate before physiological maturity in maize. Sci. Rep. 10:13114. doi: 10.1038/s41598-020-69890-3
Liu, W., Gowda, M., Steinhoff, J., Maurer, H. P., Würschum, T., Longin, C. F. H., et al. (2011). Association mapping in an elite maize breeding population. Theor. Appl. Genet. 123, 847–858. doi: 10.1007/s00122-011-1631-7
Liu, B., Zhang, B., Yang, Z., Liu, Y., Yang, S., Shi, Y., et al. (2021). Manipulating ZmEXPA4 expression ameliorates the drought-induced prolonged anthesis and silking interval in maize. Plant Cell 33, 2058–2071. doi: 10.1093/plcell/koab083
Lobell, D. B., Schlenker, W., and Costa-Roberts, J. (2011). Climate trends and global crop production since 1980. Science 333, 616–620. doi: 10.1126/science.1204531
Lunduka, R. W., Mateva, K. I., Magorokosho, C., and Manjeru, P. (2019). Impact of adoption of drought-tolerant maize varieties on total maize production in south eastern Zimbabwe. Clim. Dev. 11, 35–46. doi: 10.1080/17565529.2017.1372269
Mathew, I., Shimelis, H., Shayanowako, A. I. T., Laing, M., and Chaplot, V. (2019). Genome-wide association study of drought tolerance and biomass allocation in wheat. PLoS One 14:e0225383. doi: 10.1371/journal.pone.0225383
Meng, L., Li, H., Zhang, L., and Wang, J. (2015). QTL IciMapping: integrated software for genetic linkage map construction and quantitative trait locus mapping in biparental populations. Crop J. 3, 269–283. doi: 10.1016/j.cj.2015.01.001
Muroyiwa, B., Masinda, N., and Mushunje, A. (2022). Smallholder farmers’ adaptation strategies to mitigate the effect of drought on maize production in OR Tambo District municipality. Afr. J. Sci. Technol. Innov. Dev. 14, 459–471. doi: 10.1080/20421338.2020.1847385
Ndlovu, N., Kachapur, R. M., Beyene, Y., Das, B., Makumbi, D., Spillane, C., et al. (2024). Linkage mapping and genomic prediction of grain quality traits in tropical maize (Zea mays L.). Front. Genet. 15:1353289. doi: 10.3389/fgene.2024.1353289
Ndlovu, N., Spillane, C., McKeown, P. C., Cairns, J. E., Das, B., and Gowda, M. (2022). Genome-wide association studies of grain yield and quality traits under optimum and low-nitrogen stress in tropical maize (Zea mays L.). Theor. Appl. Genet. 135:4351. doi: 10.1007/s00122-022-04224-7
Nikolić, A., Anđelković, V., Dodig, D., Mladenović-Drinić, S., Kravić, N., and Ignjatović-Micić, D. (2013). Identification of QTL-s for drought tolerance in maize, II: yield and yield components. Genetika 45, 341–350. doi: 10.2298/GENSR1302341N
Osuman, A. S., Badu-Apraku, B., Karikari, B., Ifie, B. E., Tongoona, P., and Danquah, E. Y. (2022). Genome-wide association study reveals genetic architecture and candidate genes for yield and related traits under terminal drought, combined heat and drought in tropical maize germplasm. Genes 13:349. doi: 10.3390/genes13020349
Prasanna, B., Nair, S. K., Babu, R., Gowda, M., Zhang, X., Xu, Y., et al. (2020). “Increasing genetic gains in maize in stress-prone environments of the tropics” in Genomic designing of climate-smart cereal crops. Springer, Cham, 97–132. doi: 10.1007/978-3-319-93381-8_397–132
R Core Team (2023). R: A language and environment for statistical computing. Vienna, Austria: R Foundation for Statistical Computing.
Riedelsheimer, C., and Melchinger, A. E. (2013). Optimizing the allocation of resources for genomic selection in one breeding cycle. Theor. Appl. Genet. 126, 2835–2848. doi: 10.1007/s00122-013-2175-9
Sah, R., Chakraborty, M., Prasad, K., Pandit, M., Tudu, V., Chakravarty, M., et al. (2020). Impact of water deficit stress in maize: phenology and yield components. Sci. Rep. 10:2944. doi: 10.1038/s41598-020-59689-7
Sallam, A., Alqudah, A. M., Dawood, M. F., Baenziger, P. S., and Börner, A. (2019). Drought stress tolerance in wheat and barley: advances in physiology, breeding and genetics research. Int. J. Mol. Sci. 20:3137. doi: 10.3390/ijms20133137
Sallam, A., Eltaher, S., Alqudah, A. M., Belamkar, V., and Baenziger, P. S. (2022). Combined GWAS and QTL mapping revealed candidate genes and SNP network controlling recovery and tolerance traits associated with drought tolerance in seedling winter wheat. Genomics 114:110358. doi: 10.1016/j.ygeno.2022.110358
Sanguineti, M., Tuberosa, R., Landi, P., Salvi, S., Maccaferri, M., Casarini, E., et al. (1999). QTL analysis of drought-related traits and grain yield in relation to genetic variation for leaf abscisic acid concentration in field-grown maize. J. Exp. Bot. 50, 1289–1297. doi: 10.1093/jxb/50.337.1289
Sarkar, B., Varalaxmi, Y., Vanaja, M., RaviKumar, N., Prabhakar, M., Yadav, S. K., et al. (2023). Mapping of QTLs for morphophysiological and yield traits under water-deficit stress and well-watered conditions in maize. Front. Plant Sci. 14:1124619. doi: 10.3389/fpls.2023.1124619
Schwarz, G. (1978). Estimating the dimension of a model. Ann. Stat., 6, 461–464. doi: 10.1214/aos/1176344136
Sehgal, A., Sita, K., Siddique, K. H., Kumar, R., Bhogireddy, S., Varshney, R. K., et al. (2018). Drought or/and heat-stress effects on seed filling in food crops: impacts on functional biochemistry, seed yields, and nutritional quality. Front. Plant Sci. 9:1705. doi: 10.3389/fpls.2018.01705
Seleiman, M. F., Al-Suhaibani, N., Ali, N., Akmal, M., Alotaibi, M., Refay, Y., et al. (2021). Drought stress impacts on plants and different approaches to alleviate its adverse effects. Plan. Theory 10:259. doi: 10.3390/plants10020259
Silva, P. C., Sánchez, A. C., Opazo, M. A., Mardones, L. A., and Acevedo, E. A. (2022). Grain yield, anthesis-silking interval, and phenotypic plasticity in response to changing environments: evaluation in temperate maize hybrids. Field Crop Res. 285:108583. doi: 10.1016/j.fcr.2022.108583
Sitonik, C., Suresh, L. M., Beyene, Y., Olsen, M. S., Makumbi, D., Oliver, K., et al. (2019). Genetic architecture of maize chlorotic mottle virus and maize lethal necrosis through GWAS, linkage analysis and genomic prediction in tropical maize germplasm. Theor. Appl. Genet. 132, 2381–2399. doi: 10.1007/s00122-019-03360-x
Tesfaye, K., Sonder, K., Caims, J., Magorokosho, C., Tarekegn, A., Kassie, G. T., et al. (2016). Targeting drought-tolerant maize varieties in southern Africa: A geospatial crop modeling approach using big data. International Food and Agribusiness Management Review. 19, 1–18. Available at: https://hdl.handle.net/10568/76332
Thirunavukkarasu, N., Hossain, F., Arora, K., Sharma, R., Shiriga, K., Mittal, S., et al. (2014). Functional mechanisms of drought tolerance in subtropical maize (Zea mays L.) identified using genome-wide association mapping. BMC Genomics 15, 1–12. doi: 10.1186/1471-2164-15-1182
Wallace, J. G., Zhang, X., Beyene, Y., Semagn, K., Olsen, M., Prasanna, B. M., et al. (2016). Genome-wide association for plant height and flowering time across 15 tropical maize populations under managed drought stress and well-watered conditions in sub-Saharan Africa. Crop Sci. 56, 2365–2378. doi: 10.2135/cropsci2015.10.0632
Wang, B., Liu, C., Zhang, D., He, C., Zhang, J., and Li, Z. (2019). Effects of maize organ-specific drought stress response on yields from transcriptome analysis. BMC Plant Biol. 19, 1–19. doi: 10.1186/s12870-019-1941-5
Wu, X., Feng, H., Wu, D., Yan, S., Zhang, P., Wang, W., et al. (2021). Using high-throughput multiple optical phenotyping to decipher the genetic architecture of maize drought tolerance. Genome Biol. 22, 1–26. doi: 10.1186/s13059-021-02377-0
Würschum, T., Liu, W., Gowda, M., Maurer, H., Fischer, S., Schechert, A., et al. (2012). Comparison of biometrical models for joint linkage association mapping. Heredity 108, 332–340. doi: 10.1038/hdy.2011.78
Würschum, T., Reif, J. C., Kraft, T., Janssen, G., and Zhao, Y. (2013). Genomic selection in sugar beet breeding populations. BMC Genet. 14, 1–8. doi: 10.1186/1471-2156-14-85
Yuan, Y., Cairns, J. E., Babu, R., Gowda, M., Makumbi, D., Magorokosho, C., et al. (2019). Genome-wide association mapping and genomic prediction analyses reveal the genetic architecture of grain yield and flowering time under drought and heat stress conditions in maize. Front. Plant Sci. 9:1919. doi: 10.3389/fpls.2018.01919
Zaidi, P., Seetharam, K., Krishna, G., Krishnamurthy, L., Gajanan, S., Babu, R., et al. (2016). Genomic regions associated with root traits under drought stress in tropical maize (Zea mays L.). PLoS One 11:e0164340. doi: 10.1371/journal.pone.0164340
Zhang, A., Chen, S., Cui, Z., Liu, Y., Guan, Y., Yang, S., et al. (2022). Genomic prediction of drought tolerance during seedling stage in maize using low-cost molecular markers. Euphytica 218:154. doi: 10.1007/s10681-022-03103-y
Zhang, Q., Liu, H., Wu, X., and Wang, W. (2020). Identification of drought tolerant mechanisms in a drought-tolerant maize mutant based on physiological, biochemical and transcriptomic analyses. BMC Plant Biol. 20: 315. doi: 10.1186/s12870-020-02526-w
Zhao, Y., Gowda, M., Liu, W., Würschum, T., Maurer, H. P., Longin, F. H., et al. (2012). Accuracy of genomic selection in European maize elite breeding populations. Theor. Appl. Genet. 124, 769–776. doi: 10.1007/s00122-011-1745-y
Zhao, X., Peng, Y., Zhang, J., Fang, P., and Wu, B. (2018). Identification of QTLs and meta-QTLs for seven agronomic traits in multiple maize populations under well-watered and water-stressed conditions. Crop Sci. 58, 507–520. doi: 10.2135/cropsci2016.12.0991
Zhao, X., Zhang, J., Fang, P., and Peng, Y. (2019). Comparative QTL analysis for yield components and morphological traits in maize (Zea mays L.) under water-stressed and well-watered conditions. Breed. Sci. 69, 621–632. doi: 10.1270/jsbbs.18021
Keywords: water stress, maize, sub-Saharan Africa, QTL mapping, grain yield, genomic selection
Citation: Ndlovu N, Gowda M, Beyene Y, Chaikam V, Nzuve FM, Makumbi D, McKeown PC, Spillane C and Prasanna BM (2024) Genomic loci associated with grain yield under well-watered and water-stressed conditions in multiple bi-parental maize populations. Front. Sustain. Food Syst. 8:1391989. doi: 10.3389/fsufs.2024.1391989
Edited by:
Aliza Pradhan, National Institute of Abiotic Stress Management (ICAR), IndiaReviewed by:
Anilkumar C, National Rice Research Institute (ICAR), IndiaBharadwaj Chellapilla, Indian Agricultural Research Institute (ICAR), India
Copyright © 2024 Ndlovu, Gowda, Beyene, Chaikam, Nzuve, Makumbi, McKeown, Spillane and Prasanna. This is an open-access article distributed under the terms of the Creative Commons Attribution License (CC BY). The use, distribution or reproduction in other forums is permitted, provided the original author(s) and the copyright owner(s) are credited and that the original publication in this journal is cited, in accordance with accepted academic practice. No use, distribution or reproduction is permitted which does not comply with these terms.
*Correspondence: Manje Gowda, bS5nb3dkYUBjZ2lhci5vcmc=
†ORCID: Noel Ndlovu, https://orcid.org/0000-0002-1832-0251
Manje Gowda, https://orcid.org/0000-0003-4434-6364
Yoseph Beyene, https://orcid.org/0000-0001-7221-2617
Vijay Chaikam, https://orcid.org/0000-0002-5046-1097
Dan Makumbi, https://orcid.org/0000-0002-1801-5986
Peter C. McKeown, https://orcid.org/0000-0002-7255-6062
Charles Spillane, https://orcid.org/0000-0003-3318-323X
Boddupalli M. Prasanna, https://orcid.org/0000-0002-5761-2273