 Sijia He1,2,3
 Juying Huang2
 Xiaofan Na4
 Shengyi Huang1
 Zhao Fang2,5Shuoxin Zhang3Zhichun Zhou1
 Bin Wang1*
- 1Research Institute of Subtropical Forestry, Chinese Academy of Forestry, Fuyang, China
- 2School of Ecology and Environment, Ningxia University, Yinchuan, China
- 3College of Forestry, Northwest A & F University, Yangling, China
- 4School of Life Science, Lanzhou University, Lanzhou, China
- 5Institute of Soil and Water Conservation, Northwest A & F University, Yangling, China
Researches on the ecological stoichiometry of forest vegetation at different growth stages under long-term human management activities and its driving factors will help to clarify how the limited nutrient resources are allocated at different growth stages of forests, providing a basis and suggestions for scientific cultivation of artificial forests. In subtropical China, the C:N:P stoichiometry of an ancient Torreya grandis ‘Merrillii’ community was measured in leaves, twigs, roots, soils, and soil microbes with age gradients of 0–50, 50–100, 100–300, 300–500, and more than 500 years. The results showed that the nutrient use varied with tree ages. The N and P concentrations in the leaves, twigs, and roots of T. grandis had the similar increasing trends with the increasing tree age, and the N concentrations in leaves in 0-50-year-old forests were significantly lower than those forests of other ages. Particularly, the N:P ratio of different organs was always below 10, reflecting limited N supply of plants. The soil C content increased with the increasing T. grandis forest ages while the soil microbe C showed a fluctuated trend. There was a higher correlation among the C, N and P contents and their ratios in leaves, twigs and roots of 0-50-year-old forests than that in soil microbes, but inversely at more than 500-year-old forests. The homeostasis analysis results showed that the roots and soil microbes are more indicative of soil nutrient availability. The results of redundancy analysis showed that acid phosphatase activity had the highest impact on soil microbes in 0–10 and 10–20 cm soil layers, confirming that the decomposition and transformation of P in soils is very active. Moreover, soil enzyme activity mediates the influence of soil microbes on soil N and P limitation. In summary, tree age can effect the plant–microbe–soil C:N:P stoichiometry of T. grandis forests. The growth of T. grandis is mainly restricted by N, and reasonable application of N fertilizer is needed to promote its growth.
1 Introduction
Ecological stoichiometry considers the nutrient requirements of organisms in relation to their body production and relates these requirements to nutrient cycling in food webs and ecosystems (Reich and Oleksyn, 2004; Ashton et al., 2005; He and Han, 2010; Gao et al., 2017). This approach has been widely used in the study of plant growth and nutrient limitation of various organisms in a biogeochemical context (Camenzind et al., 2018). Understanding the potential effects of forest vegetation at different growth stages in the context of long-term artificial management activities can help to clarify how to allocate the limited nutrient resources in different growth stages of forest scientists, develop effective strategies for balancing the forest conservation and economic benefits, and provide basis and suggestion for scientific cultivation of artificial forest.
Studies have shown that the distribution of nutrient elements in different organs by plants is inconsistent, and the ecological stoichiometry of plants change with seasons, annual and inter-annual due to the absorption and utilization of nutrient elements at different stages (Sardans and Peñuelas, 2015). Plants distribute limited nutrient resources to different organs in specific proportions to adapt to the environment at different growth stages (Cui et al., 2014). Therefore, plants have formed certain growth characteristics and distribution rules of nutrient elements. Zeng et al. (2016) demonstrated that C:N, C:P, and N:P ratios in leaves and roots decreased with increasing stand age, and C:N:P ratios dramatically varied among plant tissues (Zeng et al., 2017). As stand age increases, the composition of forests and soil properties changes, and this change also affects the distribution pattern of nutrient elements (Chen et al., 2018). How C, N, and P stoichiometry in soils regulates vegetation growth has been studied (Bui and Henderson, 2013; Zhang et al., 2019a). According to Liu and Li (2003), the absorption of soil nutrients by forests increases with tree age (Zhang et al., 2021), but the growth rate of forests varies with growth stage. Soil microbial biomass, as an important part of soils, its C, N, and P content increases with tree age (Deng et al., 2019; Wang et al., 2022). At present, people have a certain understanding of how plant nutrient elements are distributed in different organs and how they change with the growth stage and soil environment. However, few studies have examined the ecological stoichiometry of forests with different ages, especially economic forest, affected by long-term artificial management and how this relates to the soil environment in which the plants are located. Researches on ecological stoichiometry of plantations of different ages can provide important indicators for nutrient cycling and limitation (Filipiak and Filipiak, 2022; Zhang et al., 2022; Jeyasingh et al., 2023).
Torreya grandis ‘Merrillii’ is a long-lived tree species with a wide range of ages, from a few years old to a thousand years old (Wang et al., 2013). Our study focues on ancient Torreya grandis ‘Merrillii’ community in Kuaiji Mountain, Zhejiang Province, and discussed old tree-microbe-soil ecological stoichiometry, the interaction between T. grandis and environmental factors, and the physiological and ecological response of T. grandis to nutrient element addition. The oldest T. grandis in the heritage site has a history of more than 1,500 years. Due to the high edible value of roasted T. grandis seeds, it was the main income of local people (Chen and Niu, 2020). For thousands of years, local farmers engaged in forest management activities such as scarifying and fertilizing the ancient T. grandis forests. However, long-term and high-intensity artificial cultivation has gradually produced some problems, such as the decline of soil and water conservation, nutrient cycling capacity and destruction of microbial community structure (Chen and Jin, 2019; Zhang et al., 2019b; Han et al., 2021). The alteration of the nutrient composition of plantation soil by long-term fertilization can affect the N and P absorption mechanism of T. grandis and change the stoichiometry characteristics of nutrient elements in plant organs. Ancient T. grandis forests with the huge age span and continuous human activities, provide valuable materials for studying the effects of long-term human activities on the ecological stoichiometry of forest vegetation and its driving factors. Meanwhile, research on the ecological stoichiometry of plant-microbe-soil system of T. grandis forests of different ages can increase understanding of the nutrient limitation of ancient T. grandis forests and can thus provide evidence and suggestions for the scientific cultivation of T. grandis and soil nutrient management. Given that the stand age of T. grandis forests contributes to the variations of the plant–microbe–soil C:N:P stoichiometry, we hypothesized that (1) tree age is an important factor to determine the stoichiometric characteristics of T. grandis organs and differences of soil microbial communities; (2) the stoichiometric characteristics of plant and soil microbial carbon, nitrogen and phosphorus of T. grandis forest are positively correlated with soil stoichiometric characteristics.
To confirm these hypotheses, in this study, we investigated the C:N:P ecological stoichiometry in plant-microbe-soil systems of T. grandis plantations in south China under different tree ages and their relationships, and then identified the factors influencing the variability and determined which of them can be used in management. We set out to respond to the following questions: Under long-term artificial management activities, (1) How does the nutrient use efficiency of T. grandis plantations evolve with tree age? (2) Are the stoichiometric relationships between plants, soil, and microbes connected with tree age? (3) How does the age of the trees in T. grandis plantations affect the stoichiometric homeostasis?
2 Materials and methods
2.1 Study area profile
This study was conducted in Zhuji City, Zhejiang Province, China (120°14′E, 29°43′N). The 3,869 hectare research region features a subtropical monsoon environment with four distinct seasons, plenty of sunshine, and copious amounts of rainfall. With an average sunshine length of 1888 h per year and an average annual precipitation of 1,374 mm, the average annual temperature is roughly 16.3°C. Ultisol is the type of soil (Wang et al., 2022).
This area is famous for the biggest ancient T. grandis gathering place in China. All ancient T. grandis trees were independent. Because the T. grandis were planted in different years, the soil conditions and nutrient status will be different when planting (It is also difficult to keep the same). However, the soil management measures and intensity (turning the soil, weeding, and fertilizing) were basically the same after planting. Chemical fertilizer (N: P2O5: K2O = 15%:15%:15%, ~30 kg per plant) was applied to the surface in March, and organic fertilizer (livestock manure, ~250 kg per plant) was applied to the surface with chemical fertilizer in September. The total amount of chemical fertilizer per unit area was 0.7 kg·m−2, the total amount of organic fertilizer per unit area was 7.5 kg·m−2, and the application depth was 30 cm (Yuan, 2020; Wang et al., 2022). Before the application of fertilizers, farmers were in the habit of planting green manure crops under the trees, but now nothing is planted under the trees in order to save labor.
2.2 Experimental design and tree age determination
In early September 2019, two independent sampling sites with basically the same site conditions and management measures were selected (Figure 1), namely, Zhaojiazhen (120° 30′ E, 29° 41′ N) and Dongbaihu (120° 29′ E, 29° 33′ N), which are both situated in the Torreya National Forest Park in Zhejiang, China (Wang et al., 2022). Zhaojia town is the main producing area of Torreya in Zhuji City (Meng et al., 2004). Dongbaihu is the main distribution area of Torreya in Zhuji City (Min et al., 2009).
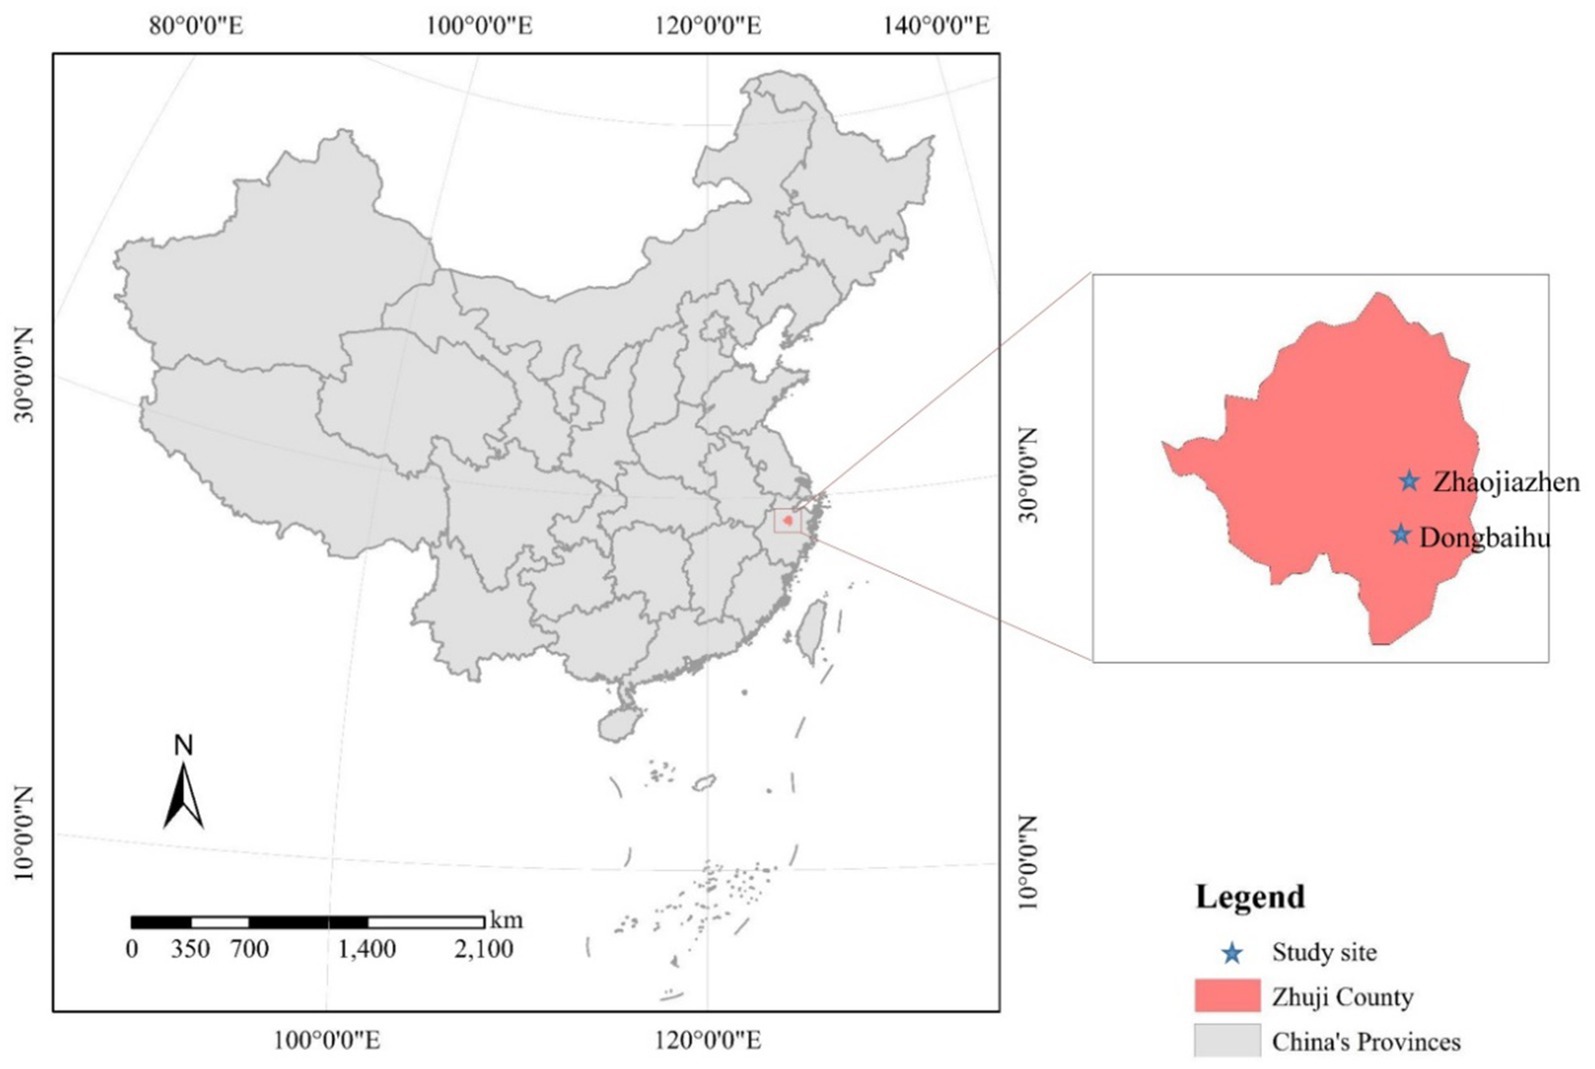
Figure 1. Location of the study site.
According to the results of the local ancient tree census and the planting time of the new T. grandis forest provided by farmers, the sample trees with the same management measures were selected according to five tree age gradients (0–50, 50–100, 100–300, 300–500, and more than 500 year). The sample area of each age gradient depends on the number of T. grandis trees surveyed in corresponding age gradient. There are at least 13 and a maximum of 30 plants, with an average of about 19 plants per age gradient.
The growth cone method was used in determining the age of T. grandis. Tree cores were collected from the trunk or lateral branches of T. grandis, and the number of tree cores extracted was determined with a Leica LINTAMTM6 tree ring analyzer. Given that T. grandis is a grafting tree, the trunk and lateral branches were significantly eccentric. The eccentricity rate was calculated from the cross-section of T. grandis, and tree age was estimated according to the average tree ring width calibrated by eccentricity (Neri et al., 2005). Supplementary Table S1 provides detailed information about the trees and sampling sites.
2.3 Sample collection
An appropriate amount of branches (diameter 0.7 ~ 1 cm) and needles (at least 1,000 g fresh samples each) were collected from the east, south, west, north and upper, middle, and lower parts of the crown of each selected plant. The plant samples of each tree were mixed and placed in bags based on different organs. Plant roots (diameter less than 2 cm) were collected in the 0–60 cm deep soil profile in four directions. The leaves, twigs, and roots were dried in an oven at 65°C for 48 h. After being finely powdered to fit through a 40-mesh screen, the dried plant tissues were kept at a temperature of −80°C until the total carbon, nitrogen, and phosphorus contents were determined.
To gather soil from the 0–10, 10–20, 20–40, and 40–60 cm soil layers, 60 cm-deep soil profiles were dug in the east, south, west, and north directions, each one 1 m from the sample trees’ trunks (Yuan, 2020). The soil was then mixed and passed through a 2 mm standard sieve. A portion of a soil sample was utilized to measure the water content, and the remaining portion was divided into two parts. One part was kept in a refrigerator at 4°C for the determination of microbial biomass (C, N, and P), enzyme activity, nitrate N (NO3−-N), ammonium N (NH4+-N), and available P. The other part was air-dried, passed through a 20-mesh sieve for the measurement of pH and electrical conductivity and then passed through a 100-mesh sieve for the determination of soil organic C, total N, and total P content.
2.4 Laboratory test analysis
The potassium dichromate volumetric method and the outside heating method were used to determine the C concentration in each plant sample (Mebius, 1960). The Kjeldahl method was used to determine total N (Moraghan et al., 1983). Molybdenum antimony colorimetry was used to determine the total P (Yuen and Pollard, 1954).
Soil organic C content was determined in the same manner as that of a plant sample (Mebius, 1960), the total N content was evaluated using the Kjeldahl method (Moraghan et al., 1983), and the total P content was measured using molybdenum antimony colorimetry (Yuen and Pollard, 1954). According to Tel and Heseltine (2008), the concentrations of NO3--N and NH4+-N were measured using an Auto Analyzer3 continuous flow analyzer, and the concentration of available P was estimated using the 0.5 mol·L−1 sodium bicarbonate method (Olsen, 1954). A pH and conductivity meter was used in measuring the pH and conductivity of the soil and water (1,5, W/V) suspensions. Fresh soil was dried for 24 h at 105°C, and the weight moisture content of bulk soil was calculated.
The content of microbial biomass C and N was determined through chloroform fumigation-potassium sulfate extraction with a total organic carbon and total nitrogen analyzer (multi N/C 3100 TOC/TN), and the content of P was determined using the chloroform fumigation-potassium sulfate extraction-phosphoric acid determination plus correction method (Brookes et al., 1984, 1985; Vance et al., 1987). Chloroform fumigant is used to lyse the microbial cells in moist soil, followed by fumigant removal. Method for estimating soil microbial biomass by determining the total amount of organic matter that can be extracted from fresh soil microorganisms (Rainer et al., 2011).
The activities of dehydrogenase and urease were evaluated using triphenyltetrazolium chloride colorimetry and indophenol colorimetry (Małachowska-Jutsz and Matyja, 2019). P-nitrophenol-phosphate disodium colorimetry was used to evaluate the activity of the acid phosphatase (Dick, 2011). The 3,5-dinitro-salicylic acid colorimetry method was used to evaluate the activities of sucrase and cellulase (Frankeberger and Johanson, 1983; Deng and Tabatabai, 1994).
2.5 Data analysis
All data were analyzed using SPSS 26 (SPSS Inc., Chicago, United States), and normality and homogeneity variances were examined. Multiple comparisons and analysis of variance (ANOVA) were used in determining differences in C, N, and P content in T. grandis, microbes, and soils, and the least significant difference test was used for multiple comparisons. In all tests, statistical significance was accepted at p < 0.05. Pearson correlation analysis was used in measuring the correlation of C:N:P ecological stoichiometry among T. grandis leaves, twigs, roots, and microbes (0–20 cm). The relationships of C:N:P ecological stoichiometry in each component (leaves, twigs, roots, and microbes) with soil environmental factors were investigated through redundancy analysis (RDA), which was performed on Canoco 5.0. Soil and T. grandis leaves, twigs, roots, or soil and 0–10 and 10–20 cm soil microbial biomass at five tree age gradients were further examined using a linear regression model (ordinary least squares). All count data were transformed to their logarithmic base 10 (log) values.
The stoichiometric homeostasis of T. grandis leaves; twigs; roots; and C, N, P ecological stoichiometry or 0–10 and 10–20 cm soil microbial biomass C, N, P ecological stoichiometry at different tree ages were determined by Sterner and Elser (2002). The homeostasis model was proposed as follows:
where y represents the C, N, P content and stoichiometry of T. grandis leaves, twigs, roots or 0–10 and 10–20 cm soil microbial biomass; x represents soil C, N, and P content and stoichiometry; c is a constant, and H is the homeostatic regulation coefficient. The values of H and c were obtained through linear regression analysis. All datasets with significant regressions and 0 < 1/H < 1 were classified as 0 < 1/H < 0.25 “H-homeostatic,” 0.25 < 1/H < 0.5 “WH-weakly homeostatic,” 0.5 < 1/H < 0.75 “WP-weakly plastic,” or 1/H > 0.75 “P-plastic.” When p > 0.05, 1/H was set at zero, and the organism was regarded as “SH-strictly homeostatic.” Origin 2021 (Origin Lab Corp, Northampton, United States) was used to draw Figures 2–7. Data were shown as mean + SE. Table 1 provides definitions for each abbreviation.
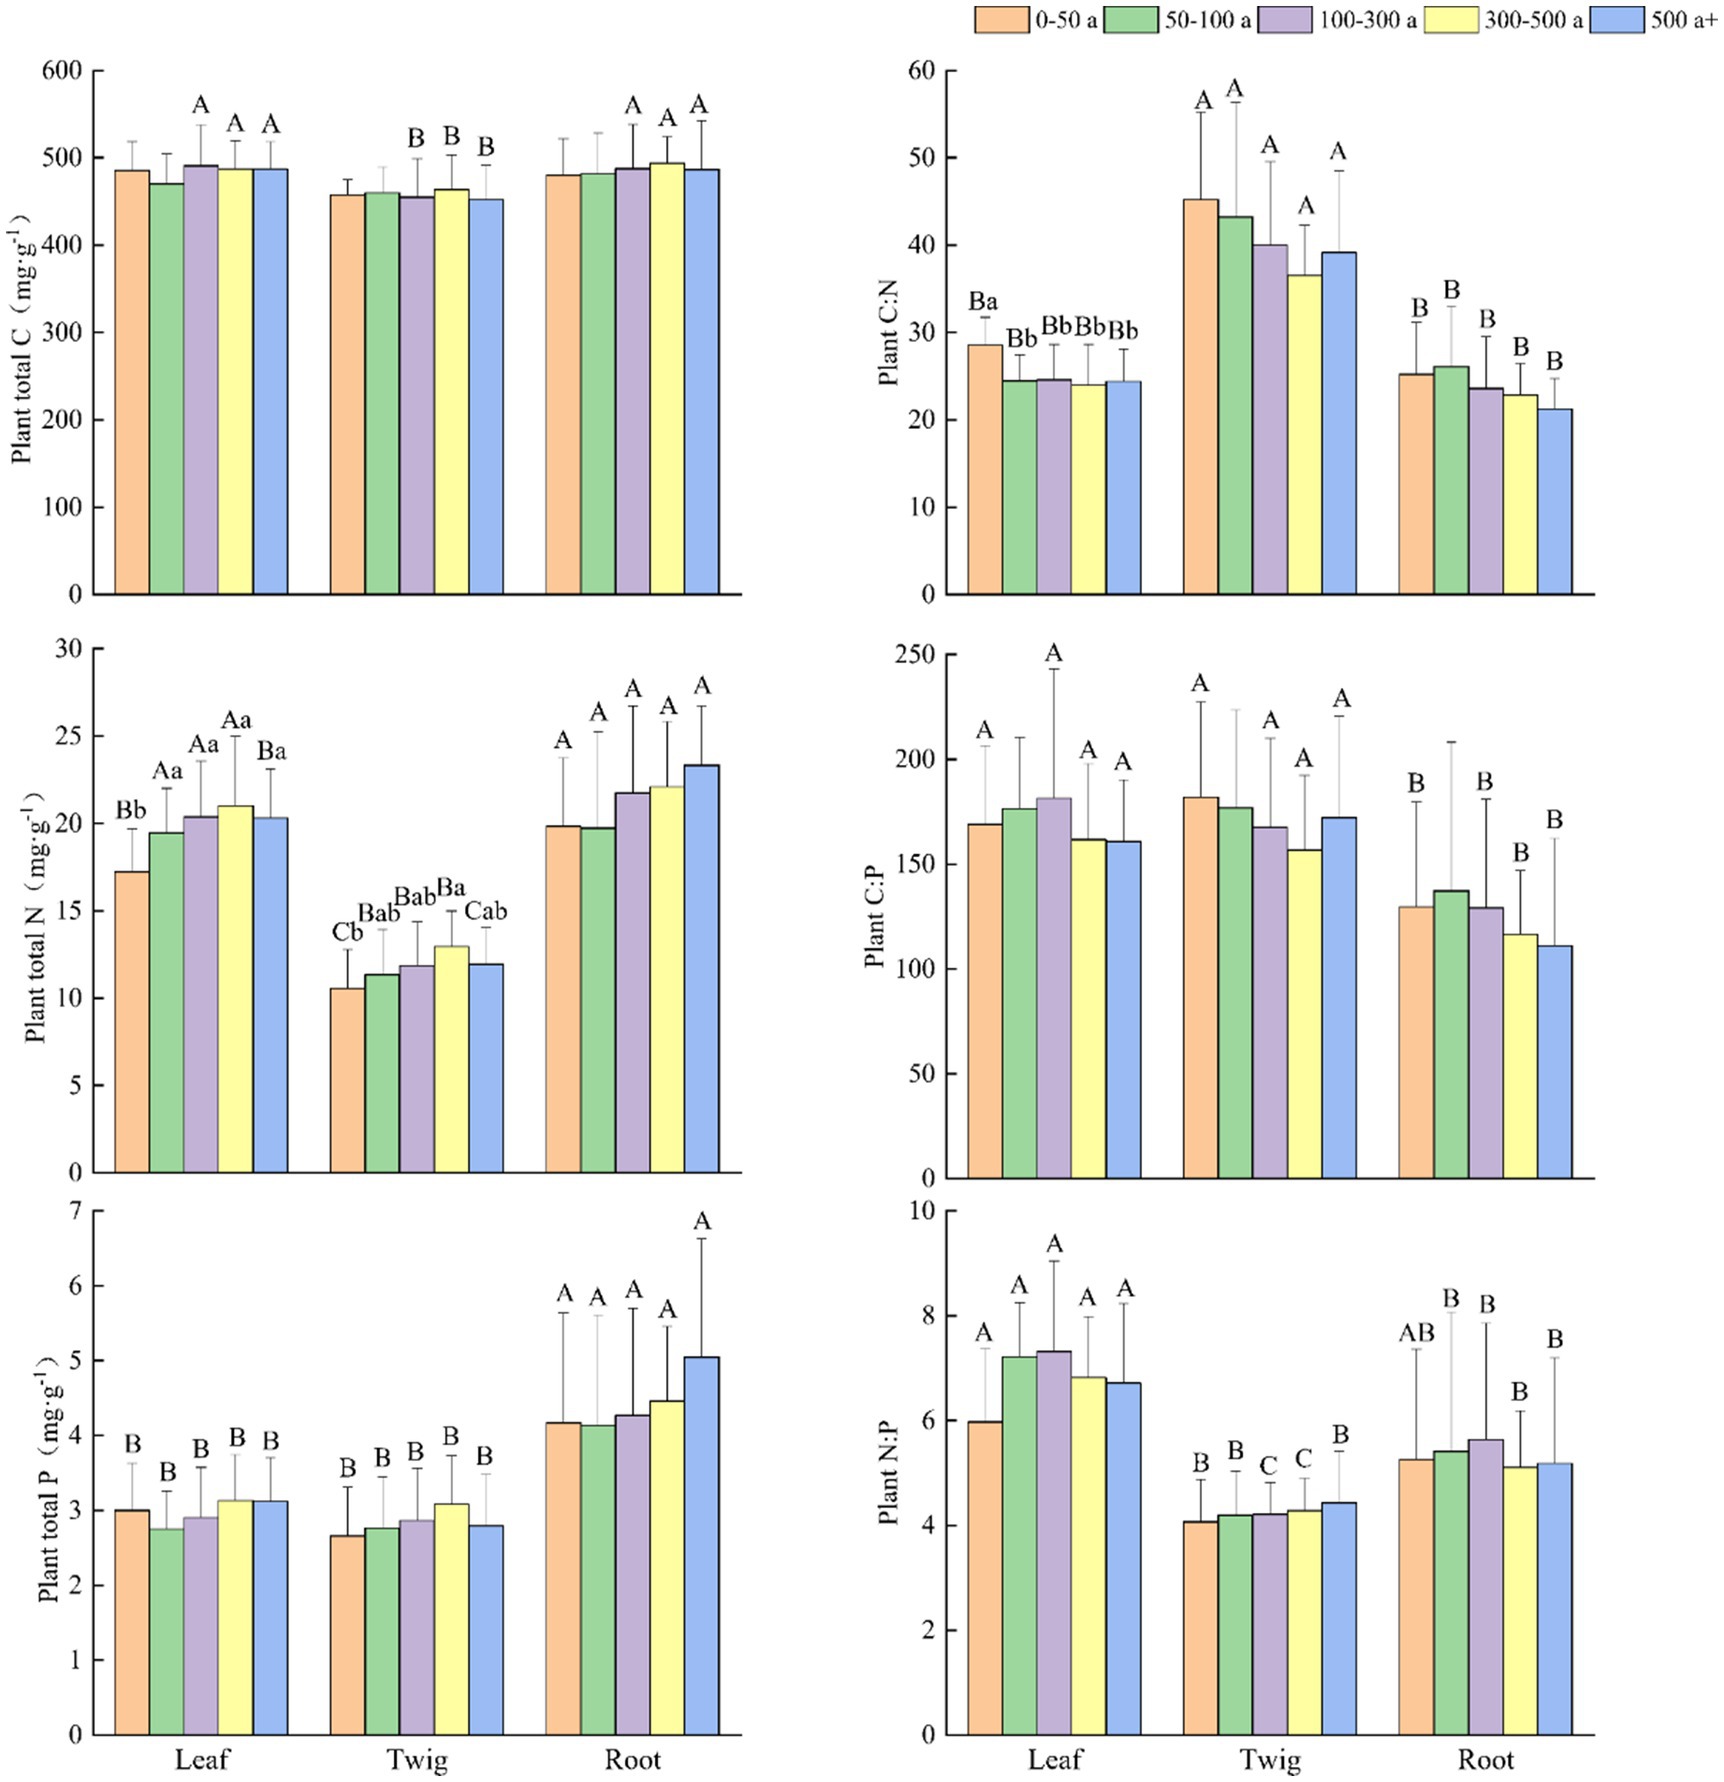
Figure 2. Changes and differences in C:N:P ecological stoichiometry in each organ of Torrya grandis among differently aged trees. Within the same plant organ, different lowercase letters indicate significant differences in each index between the different age gradients of Torrya grandis (p < 0.05). Within the same age gradient, different uppercase letters indicate significant differences in each index between the different plant organs (p < 0.05). Data without significant differences were not specifically labeled.
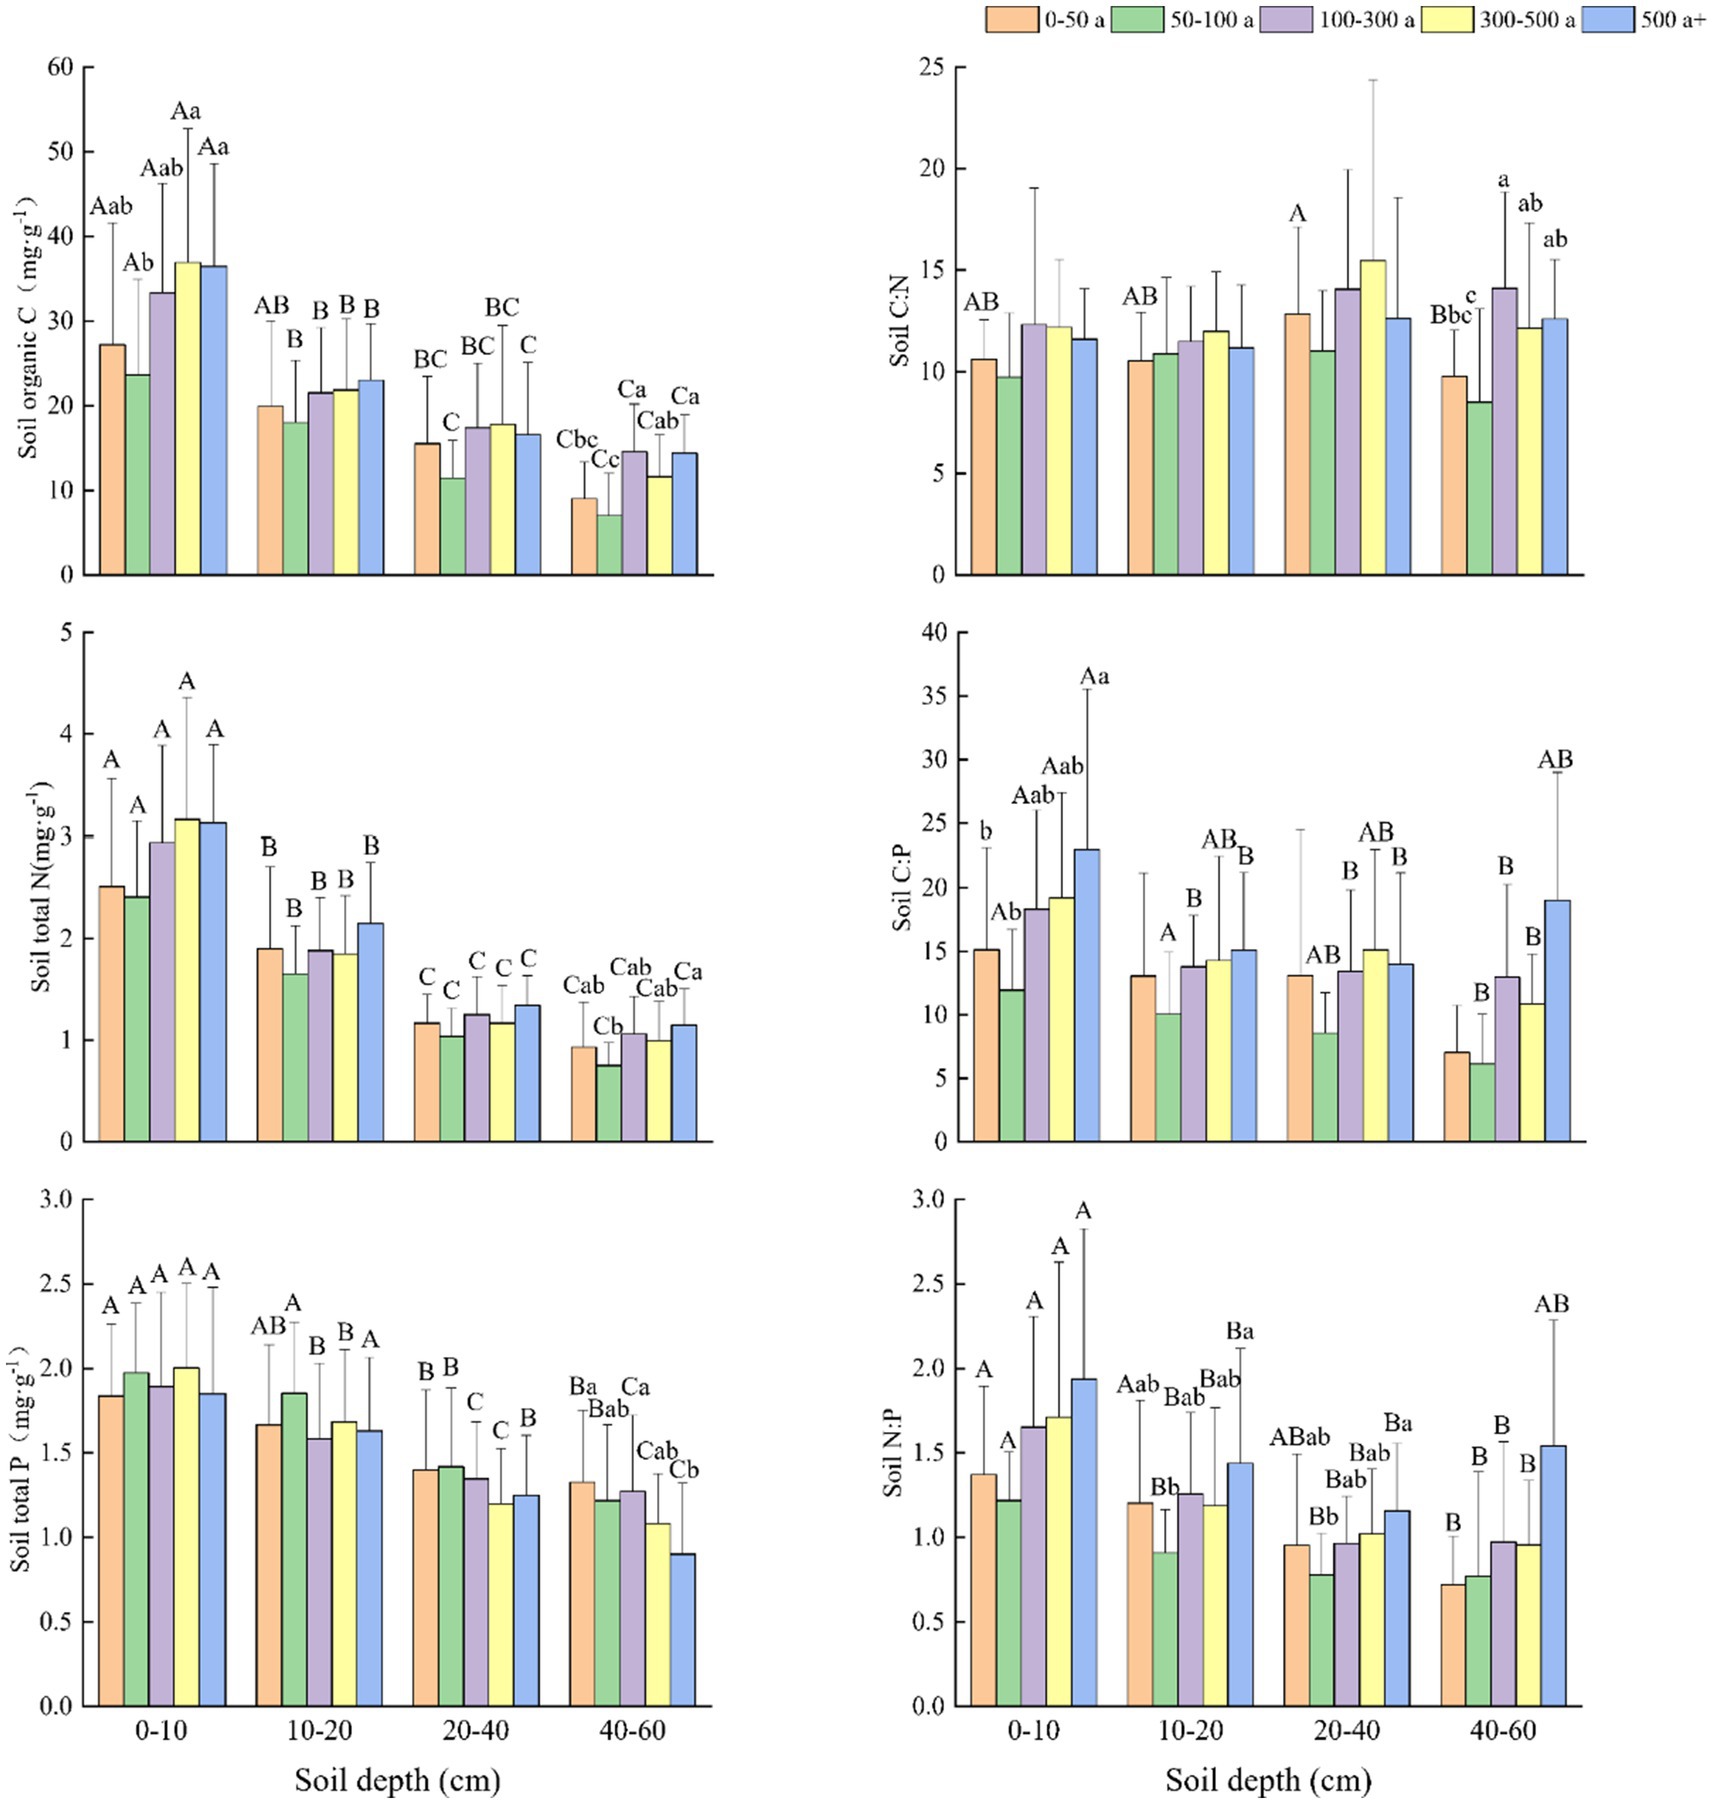
Figure 3. Changes and differences in C:N:P ecological stoichiometry in the 0–10, 10–20, 20–40, and 40–60 cm soil layers between the different age gradients of Torrya grandis. Within the same soil layer, different lowercase letters indicate significant differences among age gradients (p < 0.05). Within the same age gradient, different uppercase letters indicate significant differences among soil layers (p < 0.05). Data without significant differences were not specifically labeled.
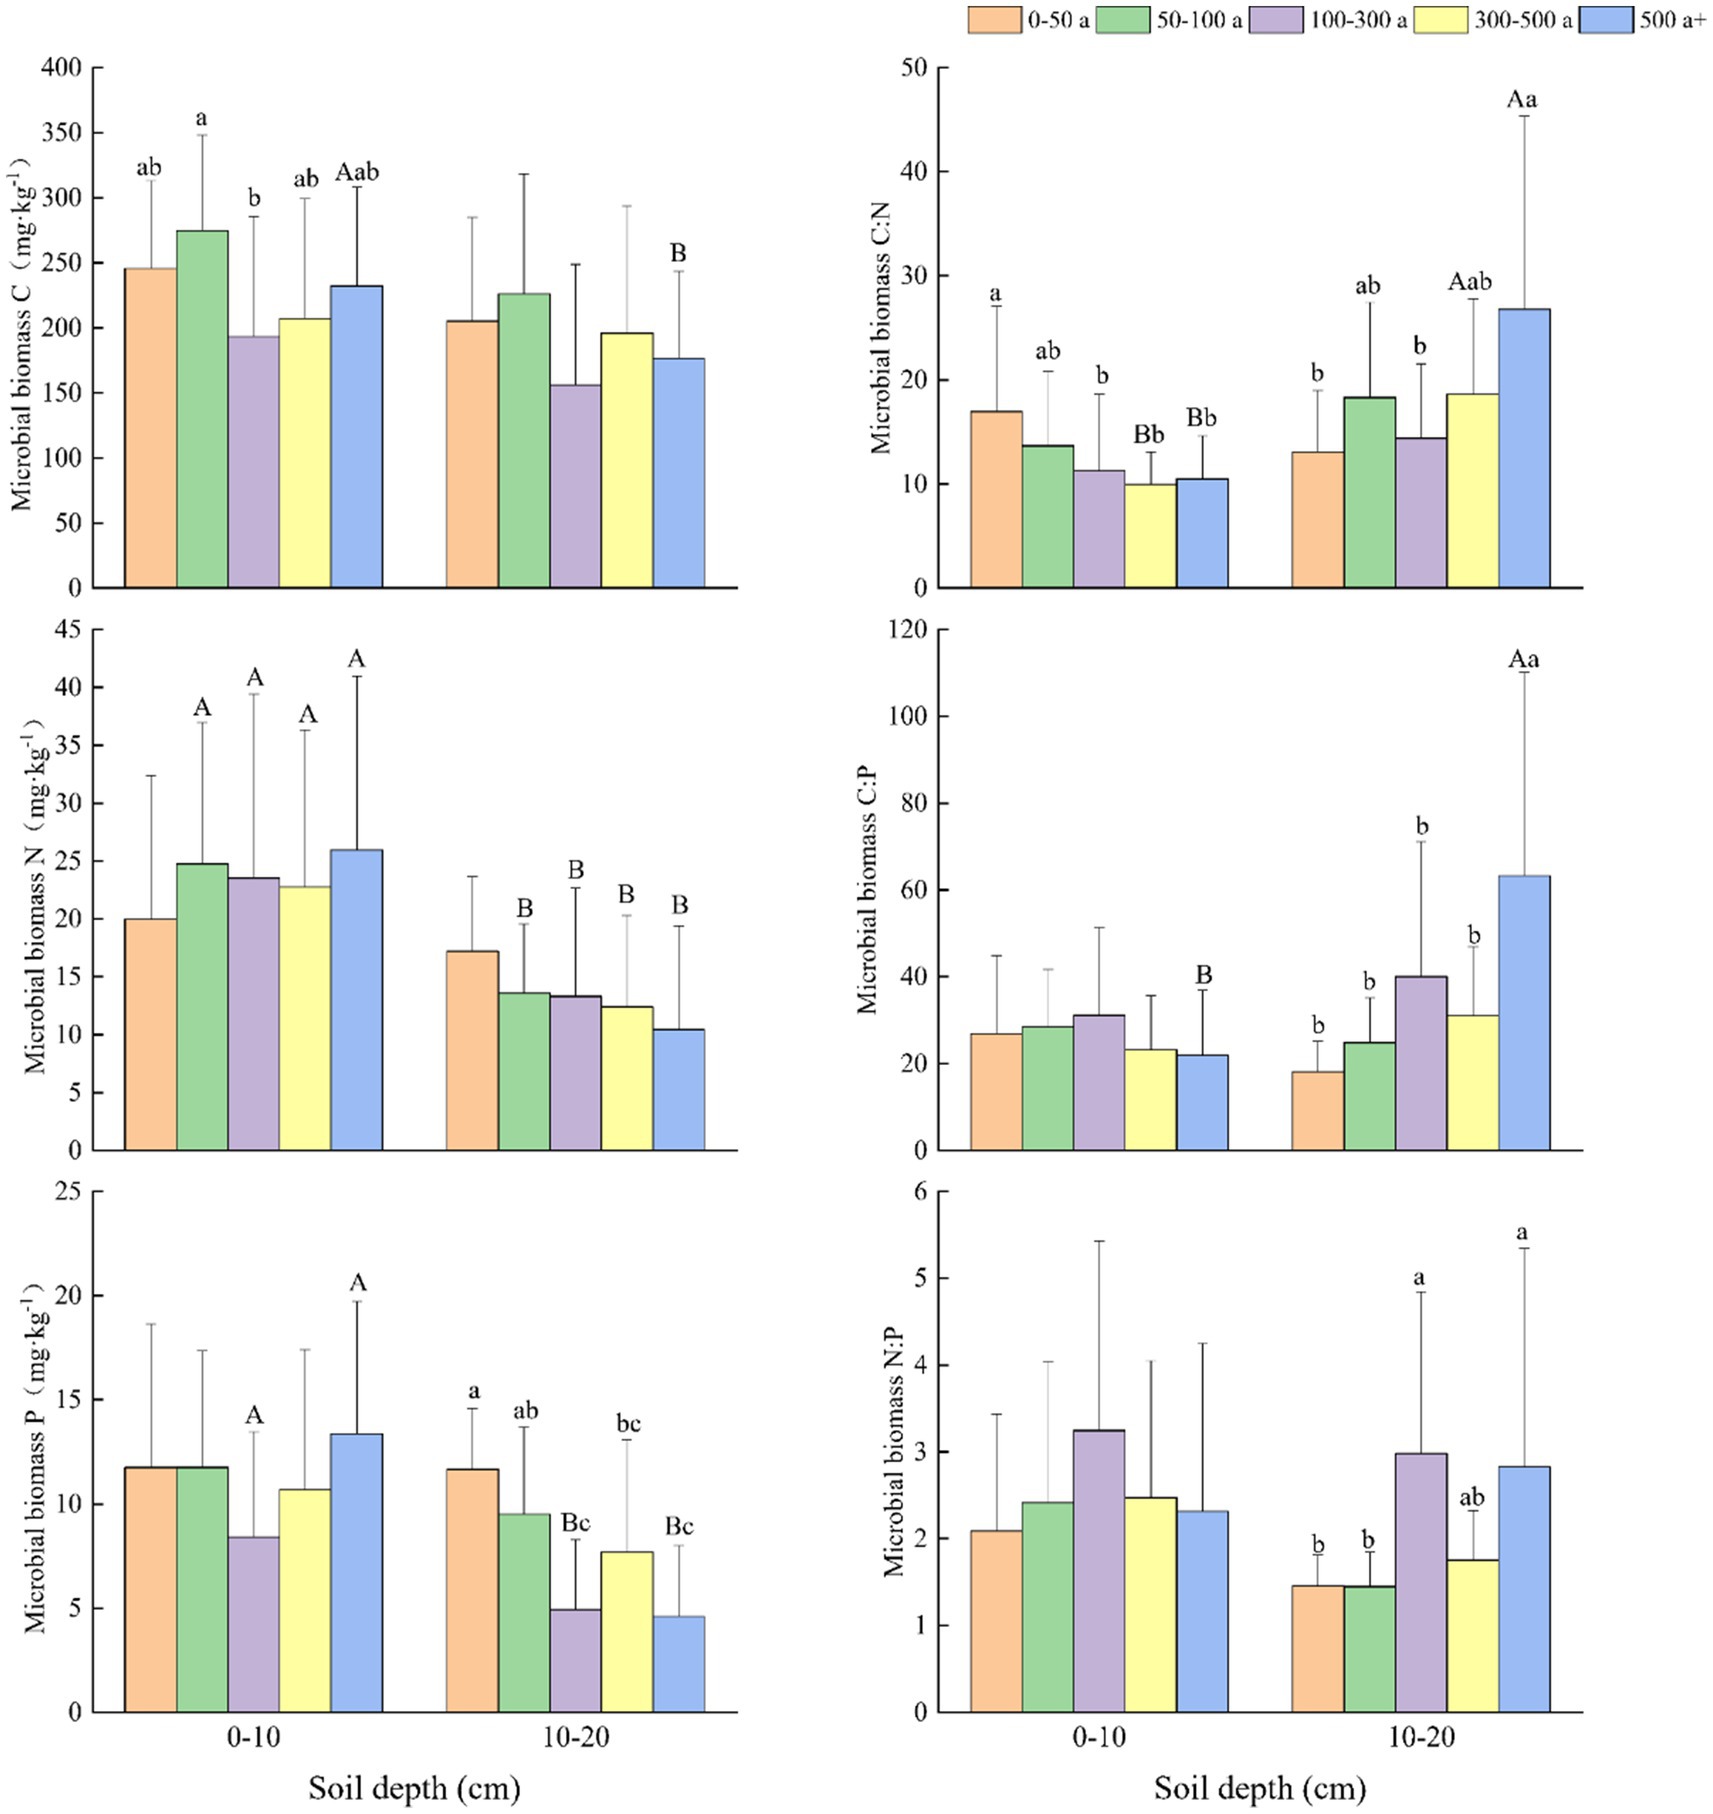
Figure 4. Changes and differences in C:N:P ecological stoichiometry in soil microbial biomass in the 0–10 and 10–20 cm soil layers among the age gradients of Torrya grandis. Within the same soil layer, different lowercase letters indicate significant differences among age gradients (p < 0.05). Within the same age gradient, different uppercase letters indicate significant differences among soil layers (p < 0.05). Data without significant differences were not specifically labeled.
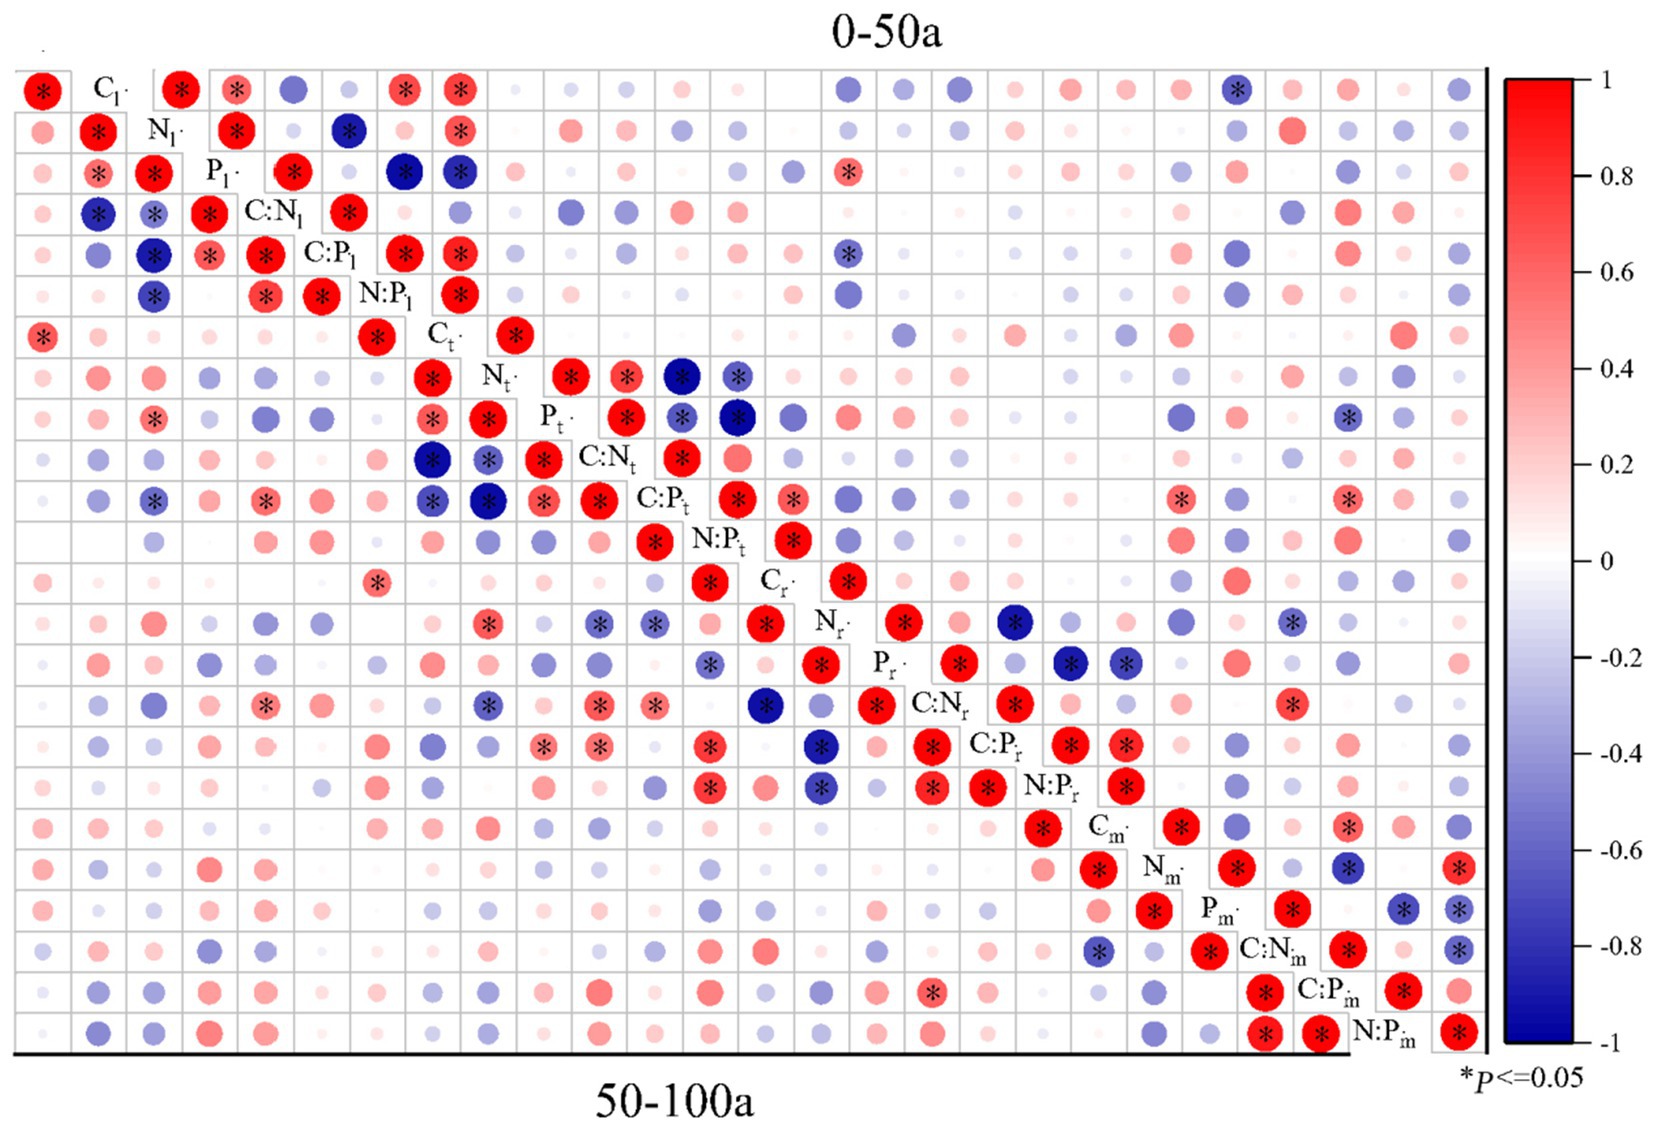
Figure 5. Pearson correlations of C:N:P ecological stoichiometry among the leaves, twigs, roots, and microbes (0-20 cm) of Torrya grandis under 0–50 and 50–100 years. The red color indicates positive correlations, whereas the blue color indicates negative correlations. Correlation coefficients are represented by the scale to the right. Table 1 lists the indicators to which each abbreviation refers.
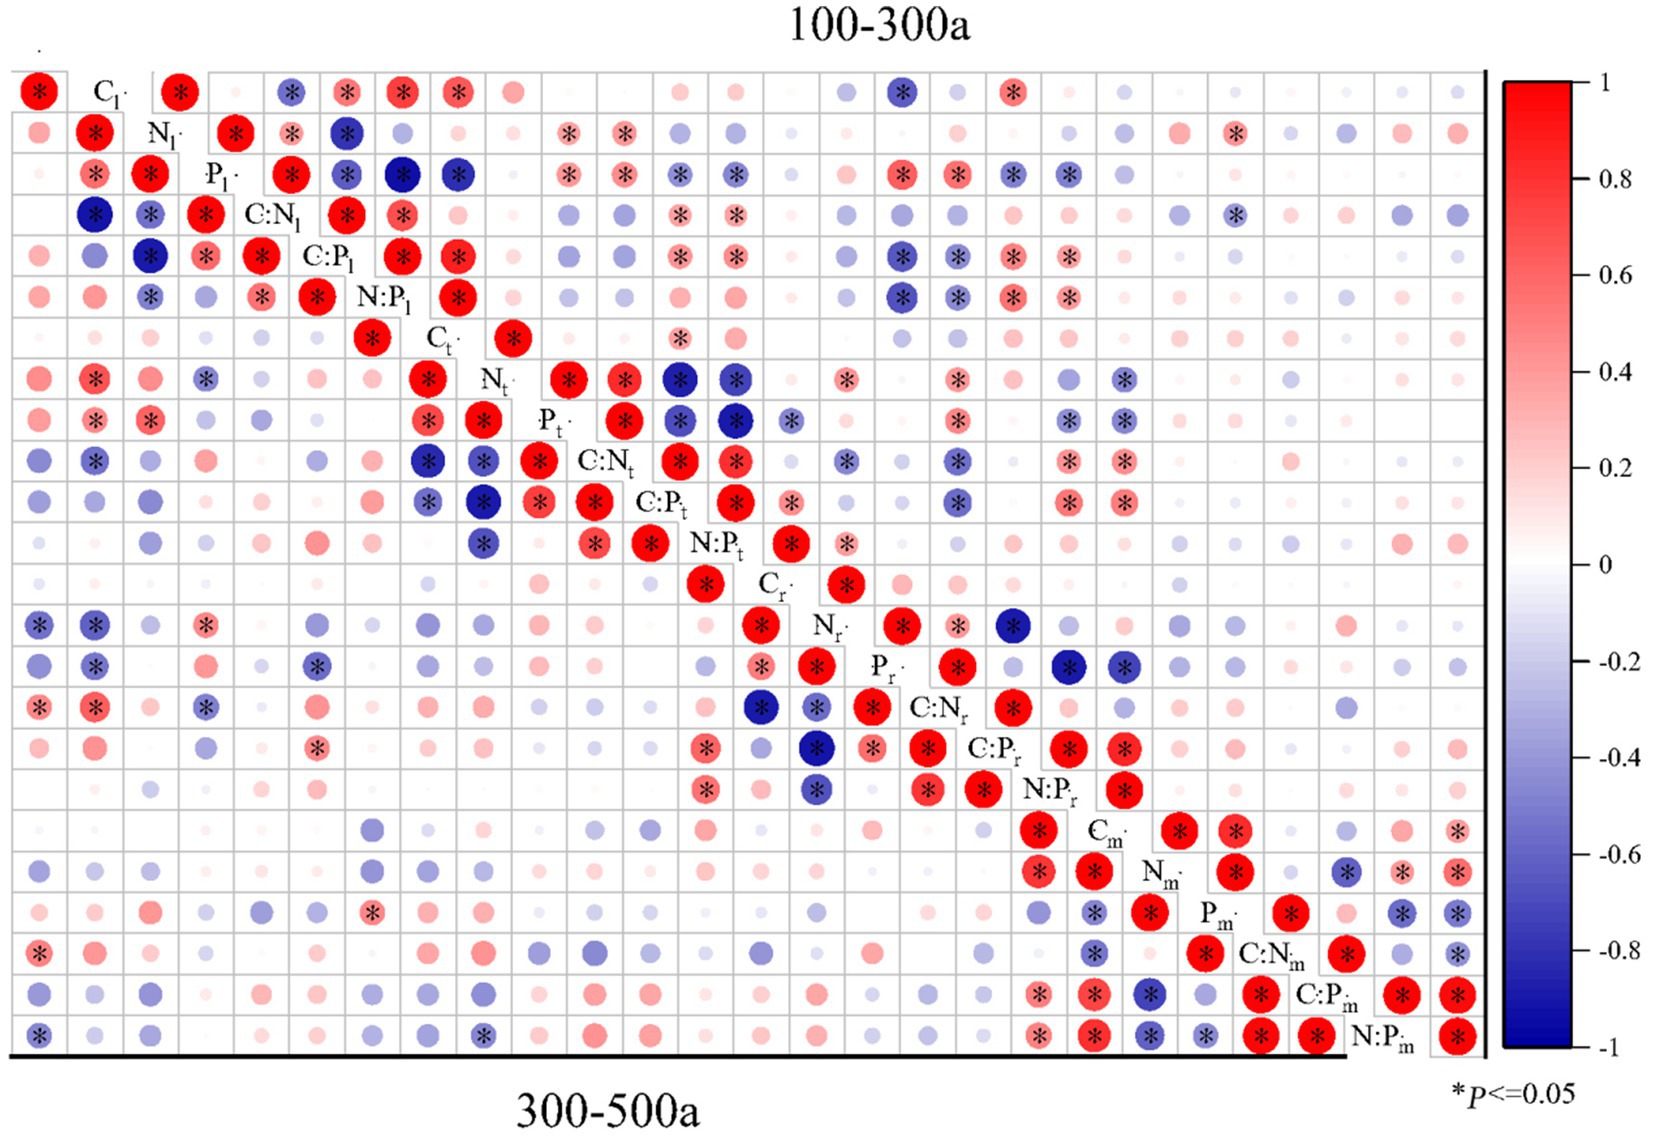
Figure 6. Pearson correlations of C:N:P ecological stoichiometry among the leaves, twigs, roots, and microbes (0–20 cm) of Torrya grandis under 100–300 and 300–500 years. The red color indicates positive correlations, while the blue color indicates negative correlations. Correlation coefficients are represented by the scale to the right. Table 1 lists the indicators to which each abbreviation refers.
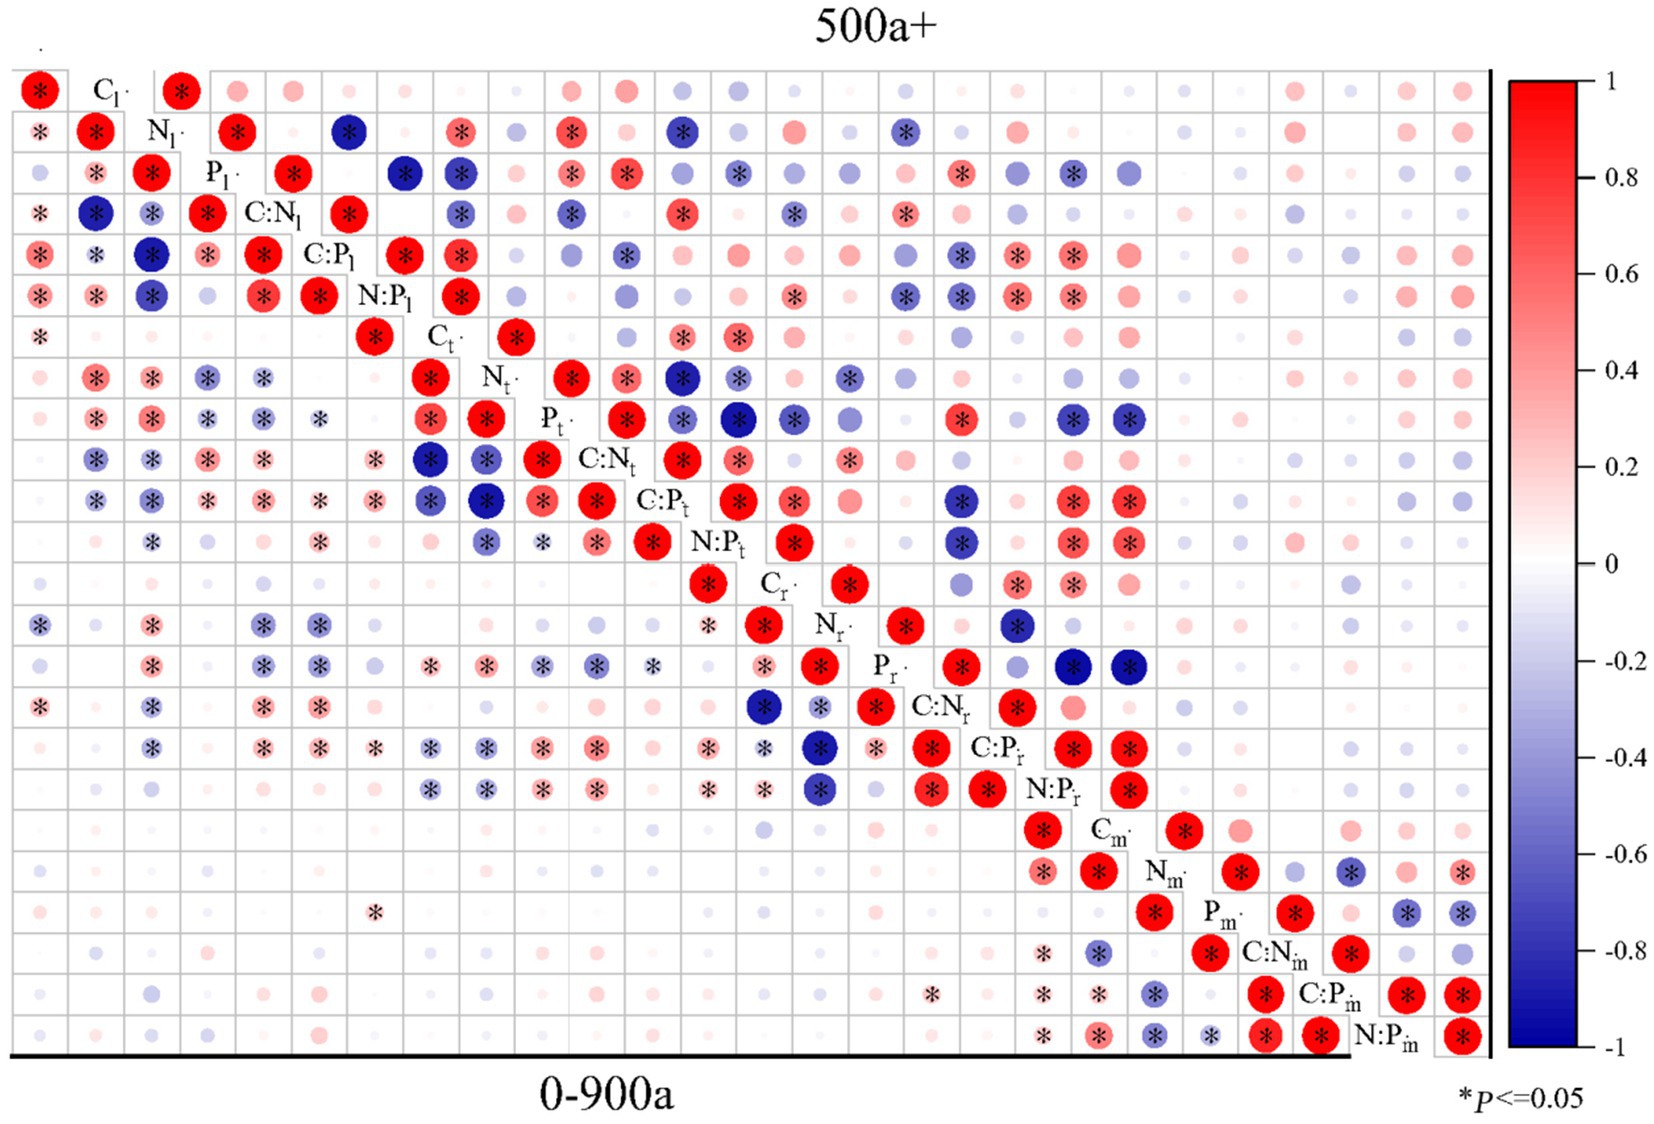
Figure 7. Pearson correlations of C:N:P ecological stoichiometry among the leaves, twigs, roots, and microbes (0–20 cm) of Torrya grandis over 500 years and 0–900 years. The red color indicates positive correlations, whereas the blue color indicates negative correlations. Correlation coefficients are represented by the scale to the right. Table 1 lists the indicators to which each abbreviation refers.
3 Results
3.1 Differences in C:N:P ecological stoichiometry in the leaf-twig-root system of Torreya grandis among age gradients
At various age gradients (Figure 2), N and P concentrations had similar increasing tendencies in the leaves, twigs and roots, and N concentrations in the leaves of 0-50-year-old trees were significantly lower than other age gradients. The P concentration in the roots was significantly higher than those of the leaves and twigs at all age gradients. When the trees were more than 500 years old, the concentrations of N and P decreased in the leaves and twigs but remained at a high level in the roots.
The C:N ratios in the twigs were significantly higher than that in the leaves and roots at all age gradients. The C:P ratios in the roots were significantly lower than those in the leaves and twigs, except for the age gradient of 50–100 years. The N:P ratios were ranked as follows: leaves > roots > twigs, and N:P ratios in the leaves were significantly higher than that in the twigs, and higher than that in the roots when the forest age was over 50 years. The C:N ratios in the leaves, twigs, and roots all showed a declining tendency, and C:N ratios in the leaves of trees between 0 and 50 years old were significantly higher than those of other age gradients. The variation tendency of the C:P ratios was similar to the C:N ratios in the twigs and roots. The C:P ratios in the leaves increased and subsequently decreased with tree age, and the N:P ratios in the leaves and roots showed similar trends. A slight increase in N:P ratio was observed in the twigs with increasing tree age.
3.2 Soil and soil microbe ecological stoichiometry at different tree ages
The C and N content in the four soil layers all exhibited similar increasing trends (Figure 3). At depths of 0–10 and 40–60 cm, the 50–100 year old T. grandis forests had significantly lower soil organic C (SOC) content than forests that were 300–500 and above 500 years old. The variations in soil N at different tree ages and soil depths were nearly identical to variations in soil C. At all four depths, the SOC and soil total N (STN) content increased with the age of T. grandis, but the soil total P (STP) content decreased (Figure 3). The SOC, STN, and STP content were significantly higher in the 0–10 cm depth than those in the 20–40 and 40–60 cm soil layers. In the 50-100-year-old forests, the soil had lower C:N, C:P, and N:P ratios than the other forests did. The C:N ratio did not drastically change with soil depth, whereas it did marginally rise with tree age. Soil P fluctuated with tree age but declined with soil depth, whereas C:P and N:P ratios generally increased, and the growing tendency is similar to that of C and N content.
At different age gradients (Figure 4), the N and P content of microbial biomass in the 0–10 and 10–20 cm soil layers showed similar trends. Microbial biomass N (MBN) content increased with tree age in the 0–10 cm soil layer but declined in the 10–20 cm soil layer. In the 10–20 cm soil depths, the microbial biomass P (MBP) content of the 0-50-year-old forests was significantly higher than the MBP content in the age gradients of 100–300, 300–500, and above 500 years old. Except the age gradient of 0–50 years, MBN of different age gradients in the 0–10 cm soil layer were significantly higher than that in the 10–20 cm soil layer. The MBC content in the 0–10 cm soil layers were generally higher than that in 10–20 cm soil layers at different age gradients, and the MBC contents in the 0–10 cm soil layers at the age gradient of 50–100 year were significantly higher than that at the age gradient of 100–300 year. In the 0–10 cm soil layers, MBC:N ratios showed a downward trend as tree age increased, and the MBC:N ratios at the age gradient of 0–50 year were significantly greater than that at the age gradient of 100–300, 300–500, and above 500 years. At the 10–20 cm soil depths, the MBC:P and MBN:P ratios followed the same change patterns as MBC:N.
3.3 Correlations among leaf-twig-root-microbe C:N:P ecological stoichiometry in five tree age gradients
The correlations of C:N:P ecological stoichiometry of T. grandis leaves, twigs, roots, and microbe in five age gradients are discussed in Figures 5–7. As T. grandis grew older, the correlation between the concentrations of C, N and P and their ratios in leaves indicated a declining trend, while that of twigs and roots showed little change. The correlations of soil microbe C, N and P contents and their ratios gradually got stronger as trees get older, and the correlations were highest at the age gradient of 300–500 year. There was little correlation between the C, N and P concentrations and their ratios of leaves, twigs and roots along the 0–50 year gradient. With the increase of tree age, the correlations among leaves, twigs and roots of T. grandis forests steadily increased, and the correlations reached the highest at 100–300 year gradient. Furthermore, the C, N and P concentrations and their ratios in different organs at 0–50 year gradient have a high correlation with that in soil microbe, while there had a significantly decreased at above 500 year gradient. Overall (0–900), there was a strong positive correlation existed between C, N, P, C:N, C:P and N:P of different organs, although the correlation of those indexes between microbe and T. grandis was weak.
3.4 Effects of soil properties on leaf-twig-root-microbe C:N:P ecological stoichiometry
The RDA results highlight how the influence of C:N:P stoichiometry of T. grandis is mediated by soil properties. For instance, soil C, N content and leaves C, N concentrations were negatively correlated, while soil C, N content and roots C, N concentrations were positively correlated. P concentrations in leaves, twigs and roots were positively correlated with soil P content (Figures 8A–C). In the soil, NO3− or NH4+ contents were negatively correlated with the N concentrations and N:P ratios in the leaves (Figure 8A) but positively correlated with the N concentrations in the roots (Figure 8C). The first two axes can explain a total of 23.66, 21.65, and 23.58% variations of C, N, and P concentrations and its ratios in T. grandis leaves (F = 1.5, p ≤ 0.05, Table 2), twigs (F = 1.4, p > 0.05, Table 2) and roots (F = 1.6, p ≤ 0.05, Table 2) with 96 cases. The factors of NO3−, EC, APA, NH4+, Ns, WC, and pH were significant in Figure 8A, and the factors of URE, APA, pH, and DHA were significant in Figure 8C. No significant factors were found in Figure 8B (Table 3). The strength of five enzymatic activity were ranked as follows: APA > DHA > CEL > SUC > URE (Figures 8A), URE>APA > DHA > SUC > CEL (Figures 8C). A more detailed analysis by age is provided in Supplementary Tables S2–S4.
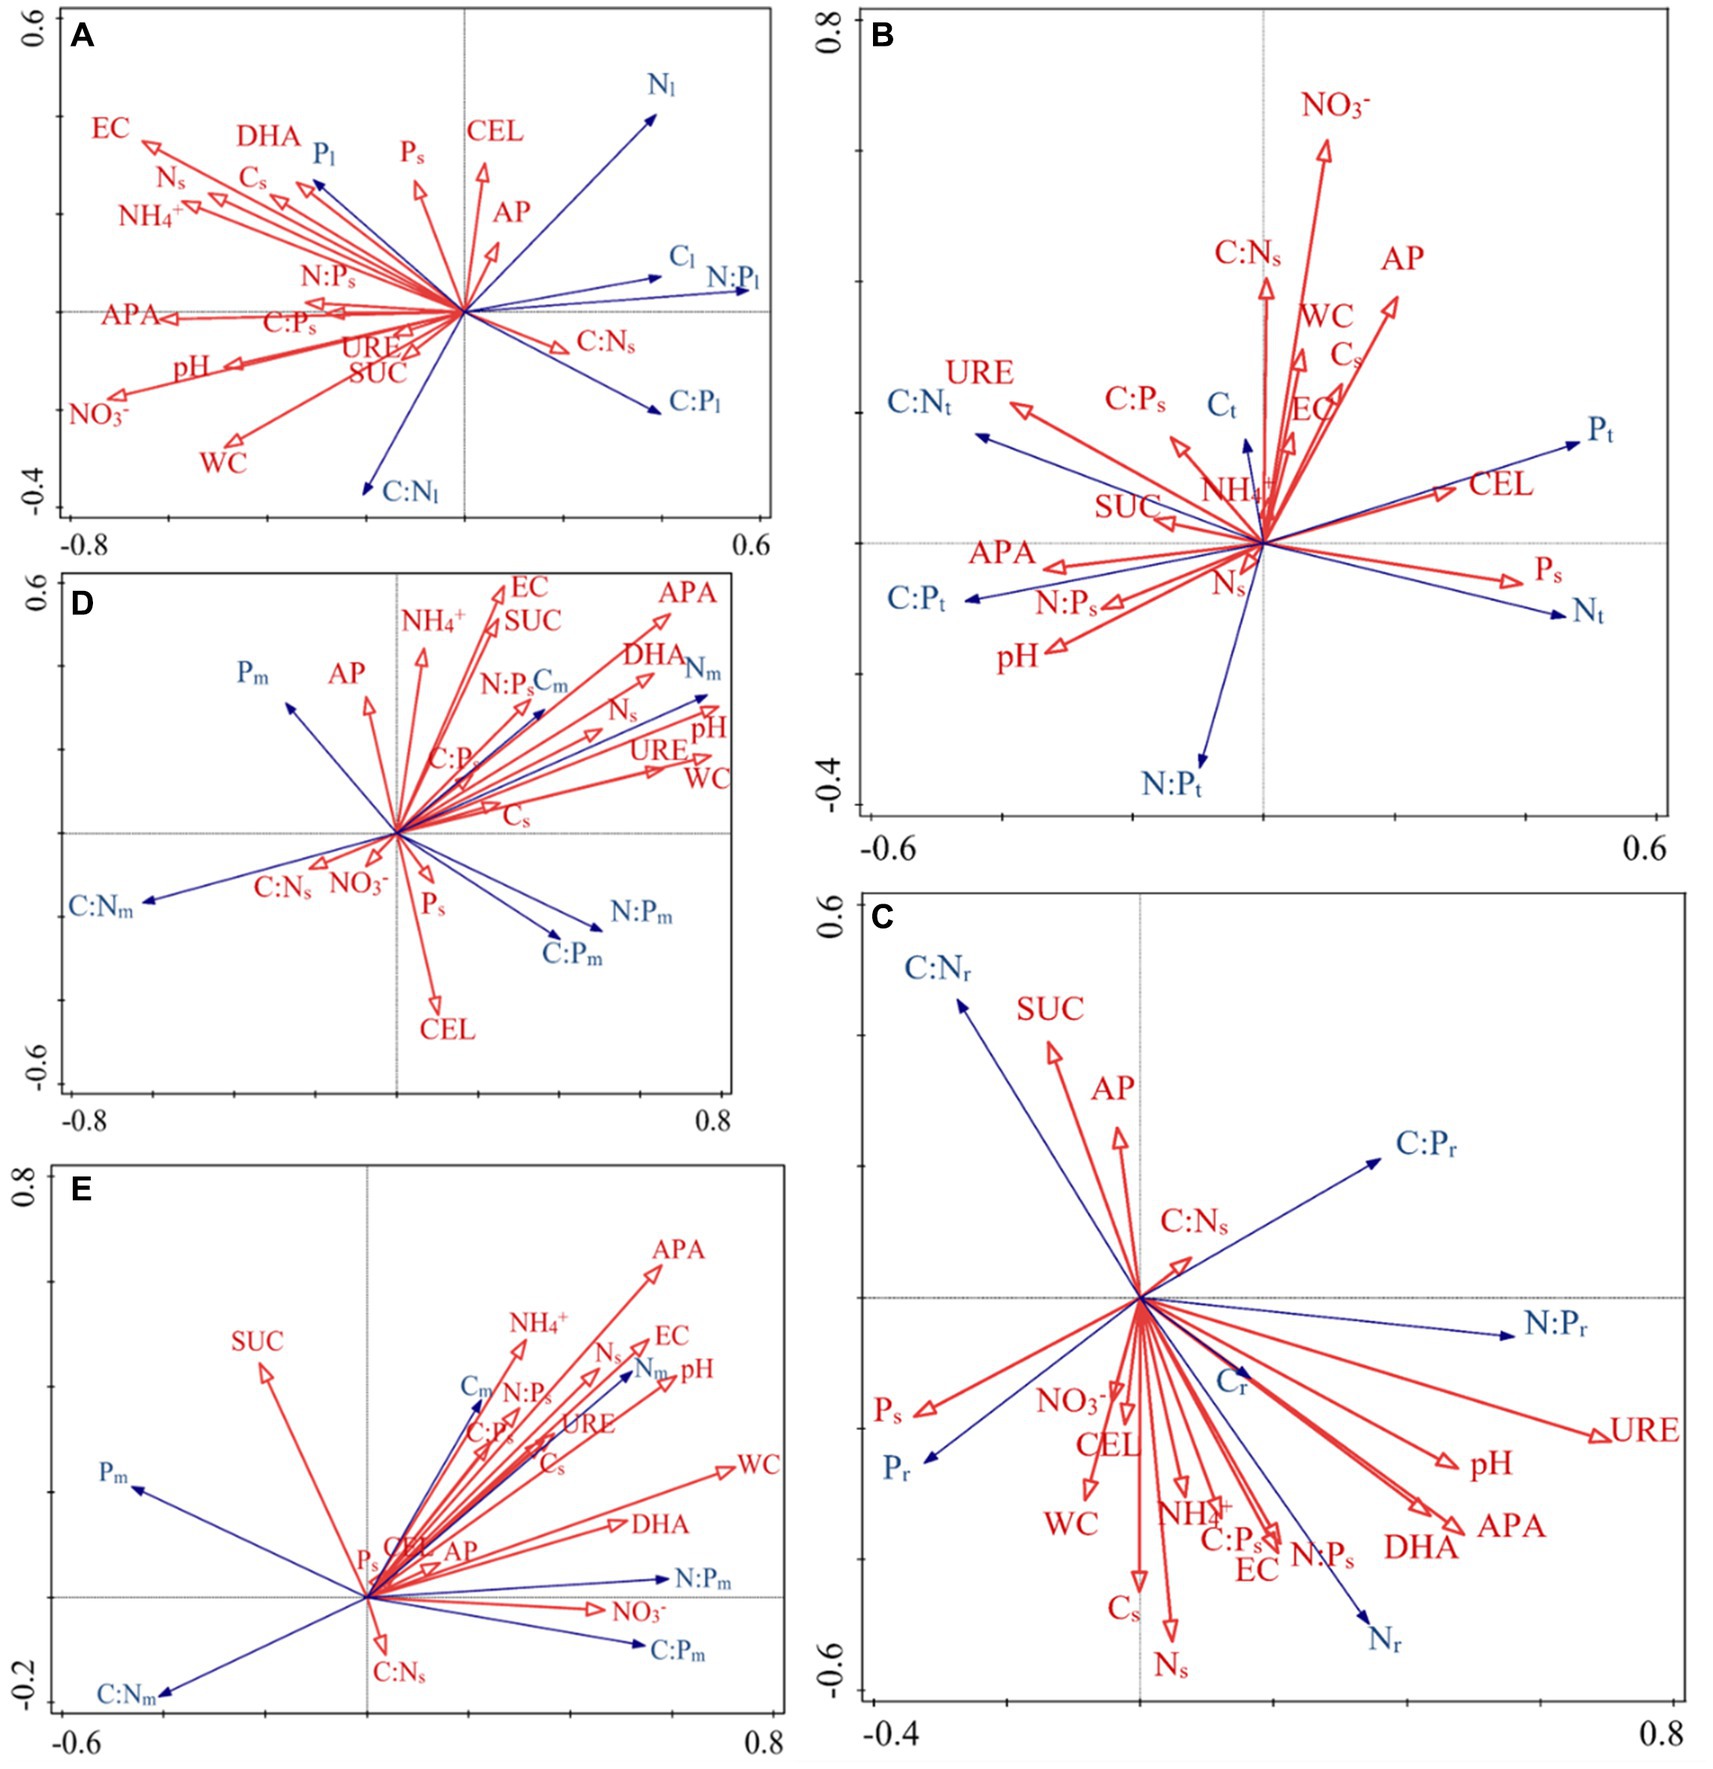
Figure 8. Redundancy analysis (RDA) was used to identify the relationships of the C:N:P ecological stoichiometry of each component (A: leaves, B: twigs, C: roots, D: microbes 0–10 cm, E: microbes 10–20 cm) with soil environmental factors. All soil environmental factors were obtained from the 0–60 cm soil layer, exception microbes, which were collected from the 0–10 and 10–20 cm soil layers. The arrows indicate the behavior of the variables. The arrow direction indicates the steepest increase in the variable, and the length indicates the strength relative to that of the other variables. Table 1 lists the indicators to which each abbreviation refers.
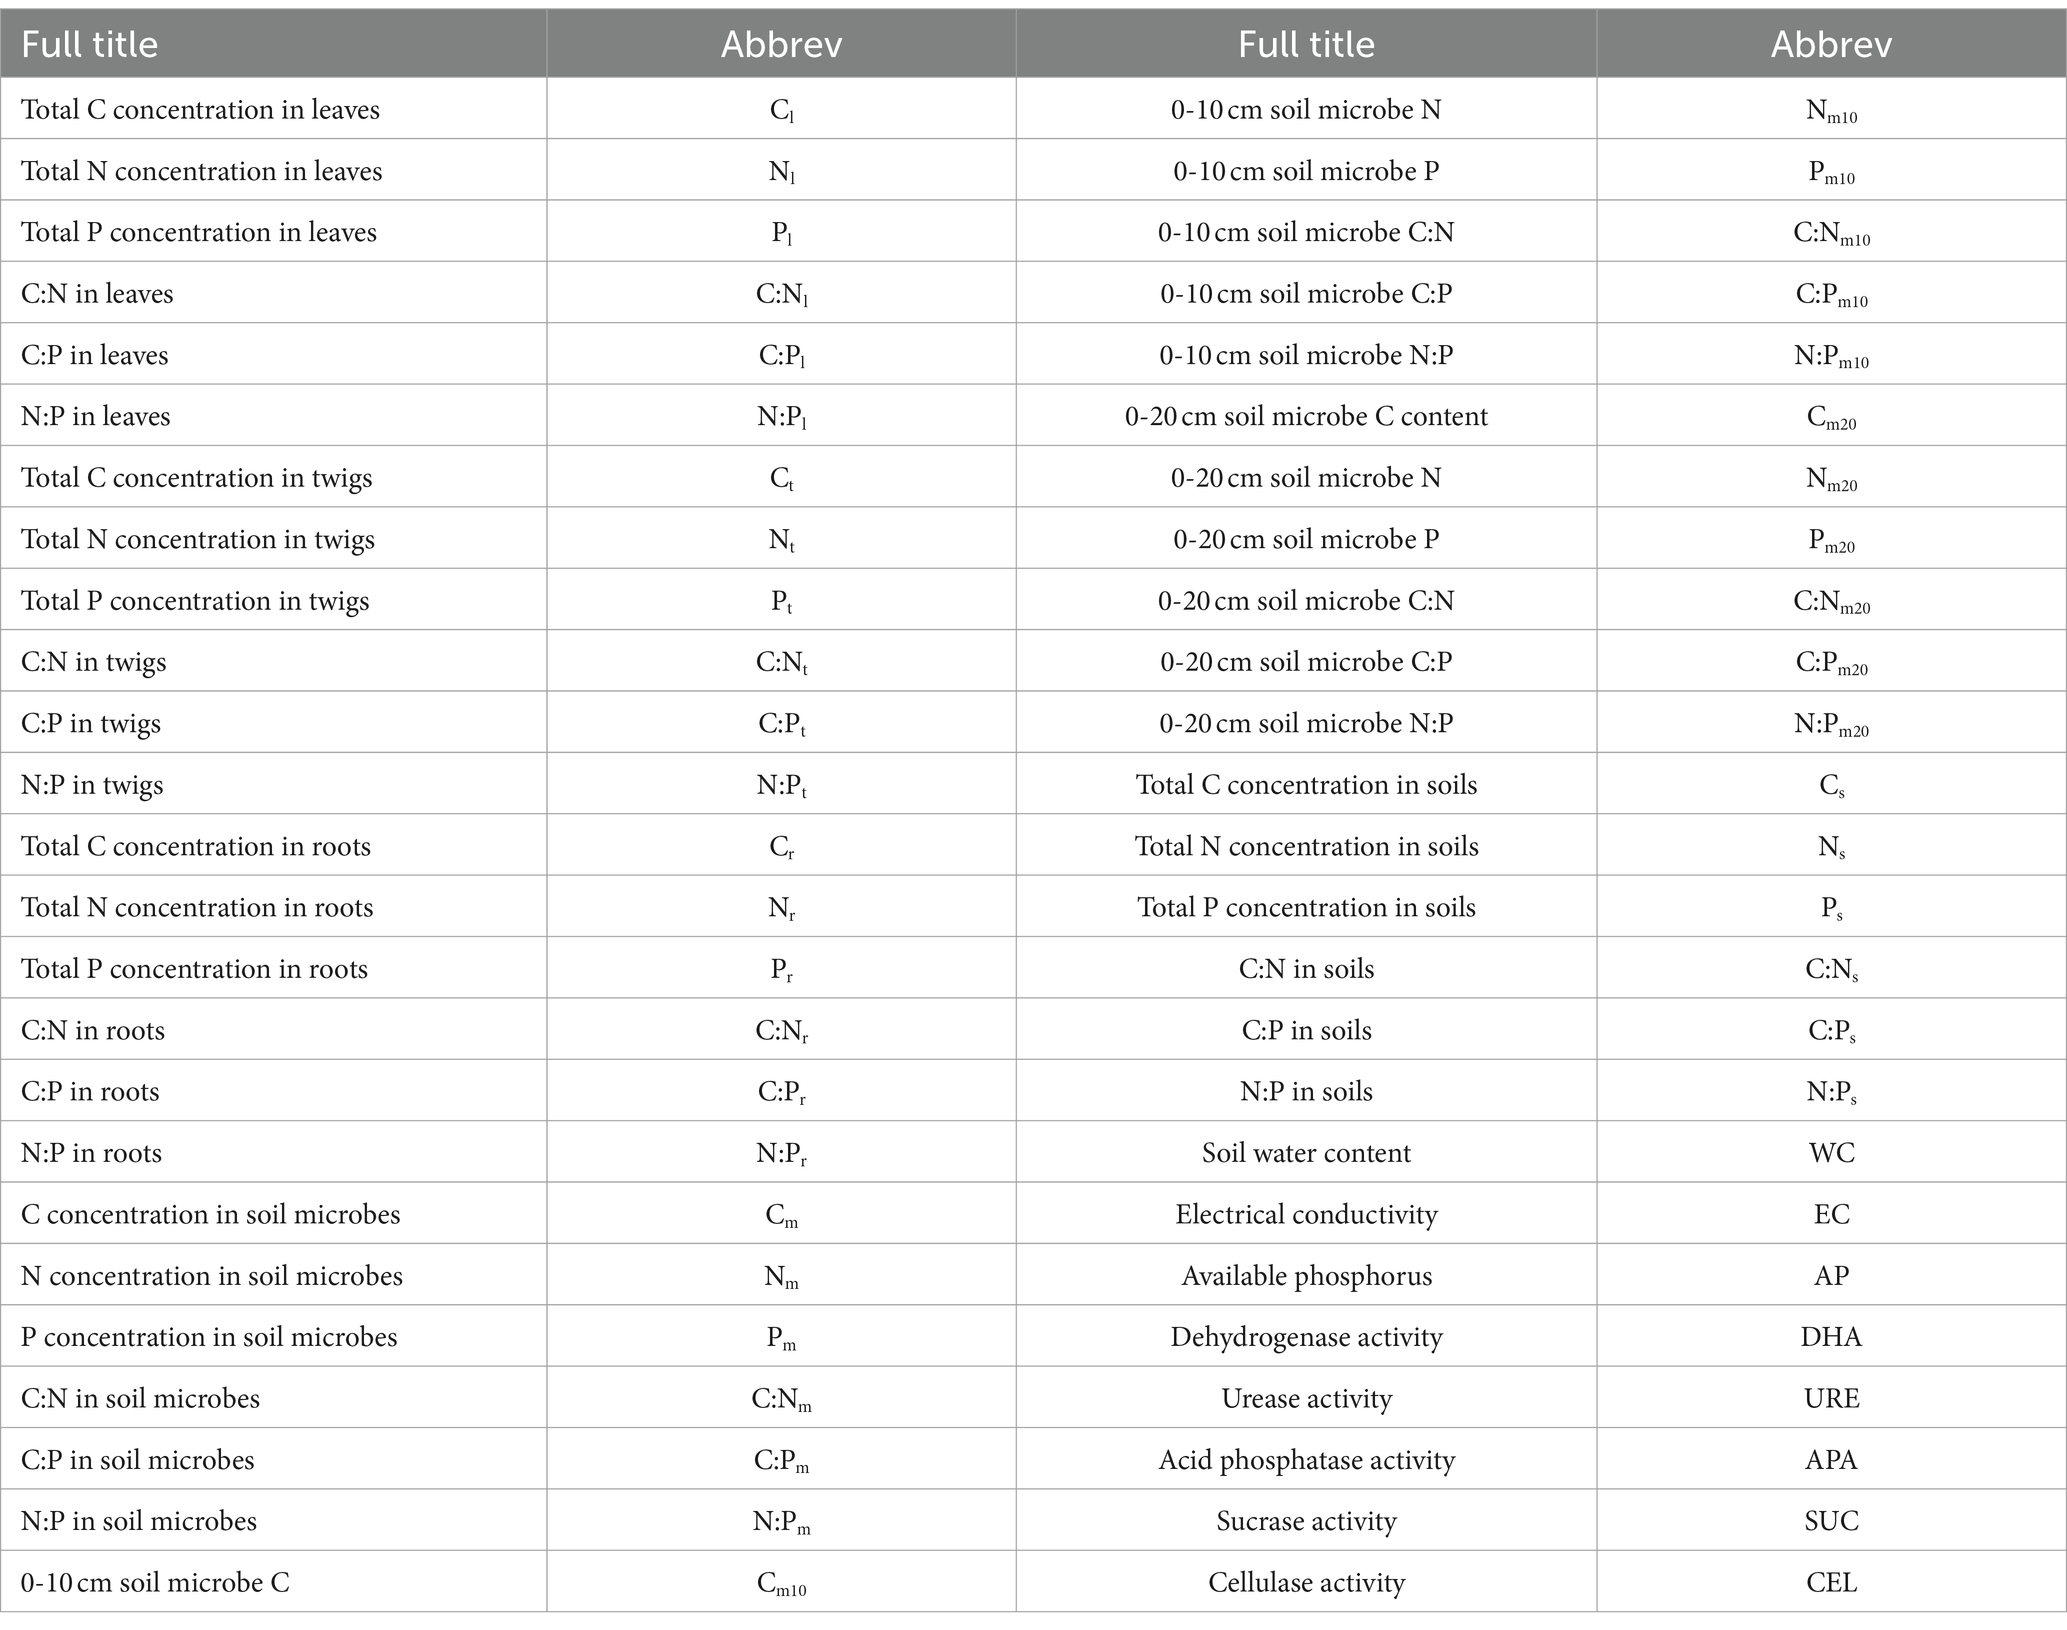
Table 1. English abbreviation checklist of this paper.
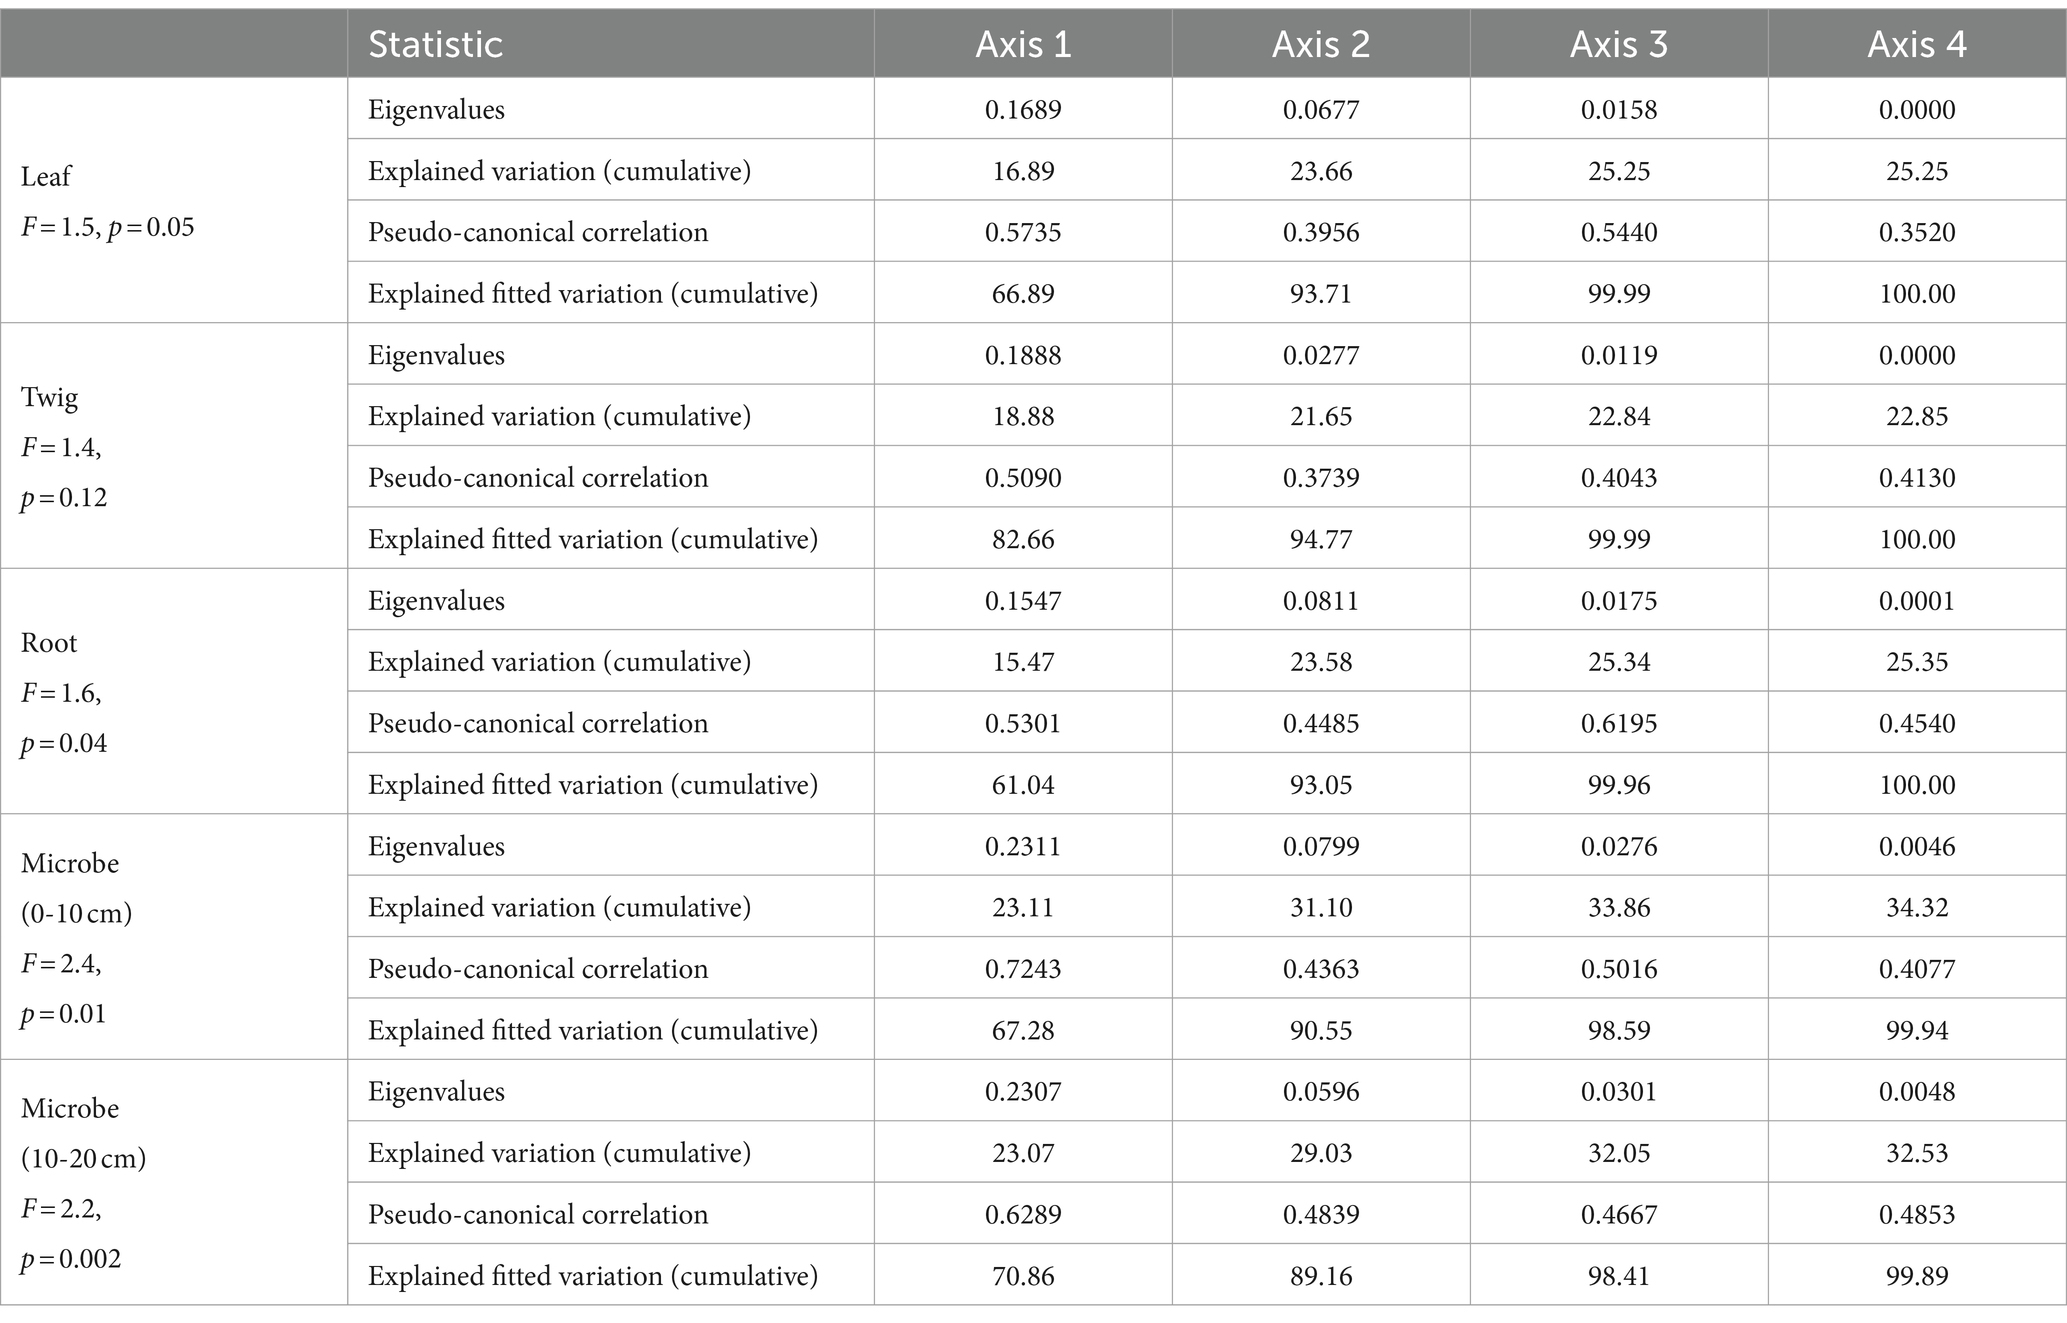
Table 2. Redundancy analysis (RDA) of Torrya grandis leaves, twigs, roots, and soil microbial biomass (0–10 and 10–20 cm) C:N:P ecological stoichiometry and soil properties.
The ecological stoichiometry of microbes can be determined according to the RDA results (Figures 8D,E). For instance, in the 0–10 and 10–20 cm soil layers the soil N and NH4+ content were positively correlated with microbial biomass N, while the soil enzyme activity URE and APA were positively correlated with microbial biomass C and N. The 0–10 and 10–20 cm soil layers’ microbial biomass benefited greatly with APA. Available P was positively correlated with microbial biomass P in 0–10 cm soil layer. A total of 31.10 and 29.03% variance of C, N, and P content and its ratios of soil microbial biomass in the 0–10 cm (F = 2.4, p ≤ 0.01, Table 2) and 10–20 cm (F = 2.2, p ≤ 0.01, Table 2) soil layers can be explained by the same environmental variables with 96 cases. The factors of pH, WC, APA, DHA, URE, Ns, EC, SUC, N:Ps, and CEL were significant, as shown in Figure 8D, and the factors of WC, APA, pH, EC, DHA, Ns, NO3−, URE, NH4+, and Cs were significant in Figure 8E (Table 3). The strength of five enzymatic activity were ranked as follows: APA > DHA > URE>SUC > CEL (Figures 8D), APA > SUC > DHA > URE>CEL (Figures 8E). A more detailed analysis is provided in Supplementary Tables S5, S6. Many similarities between Figures 8D,E were found, indicating that microbes in the 0–10 and 10–20 cm soil layers were closely related.
3.5 Homeostasis of plant leaf, twig, root, and microbial biomass stoichiometry
The homeostases of T. grandis leaf, twig, root, and soil microbe were analyzed based on the homeostasis model (Table 4). The results showed that Cl, Nl, and C:Pl displayed homeostasis or weakly homeostasis at low age gradients (0–50 and 50–100 years), N:Pl, Nr, Pr, N:Pm10, Cm20 and Nm20 displayed plasticity or weakly plasticity at low and high age gradients, and other nutrients and stoichiometry displayed strict homeostasis. The 1/H values of C content in the leaf and soil microbe in the 10–20 cm soil layer ranged from 0.022 to 0.089 and 0 to 0.574, respectively. The 1/H values of N content in the leaf, root, and soil microbe ranged from 0.070 to 0.289, 0.060 to 0.703, and 0.041 to 1.463, respectively. The 1/H values of P concentrations in the twig and root ranged from 0.066 to 0.490 and 0.132 to 0.981, respectively. The plasticity of P concentrations in the root was relatively high.
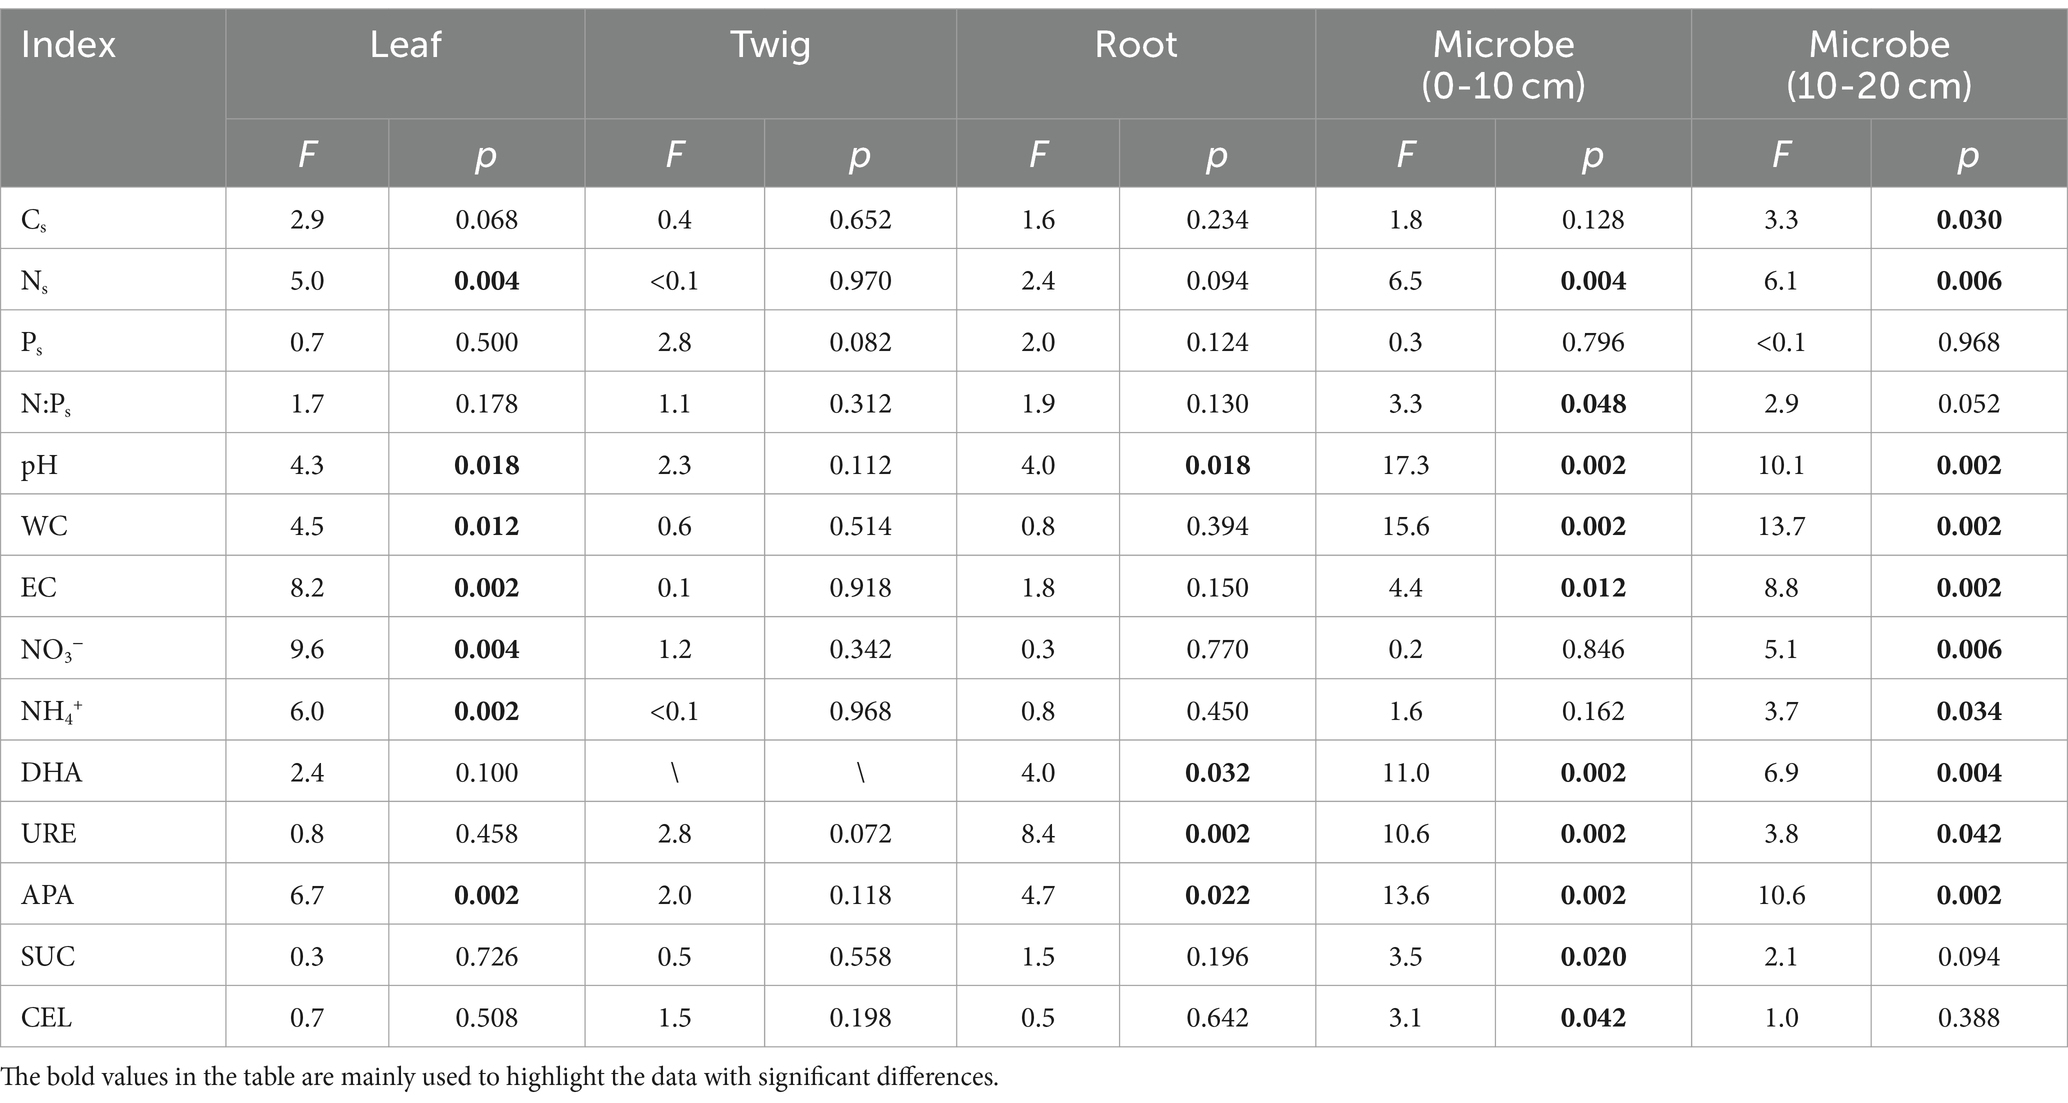
Table 3. Significance test of each soil property in the redundancy analysis of Torrya grandis leaf, twig, root, and soil microbial biomass (0–10 and 10–20 cm) C:N:P ecological stoichiometry and soil properties.
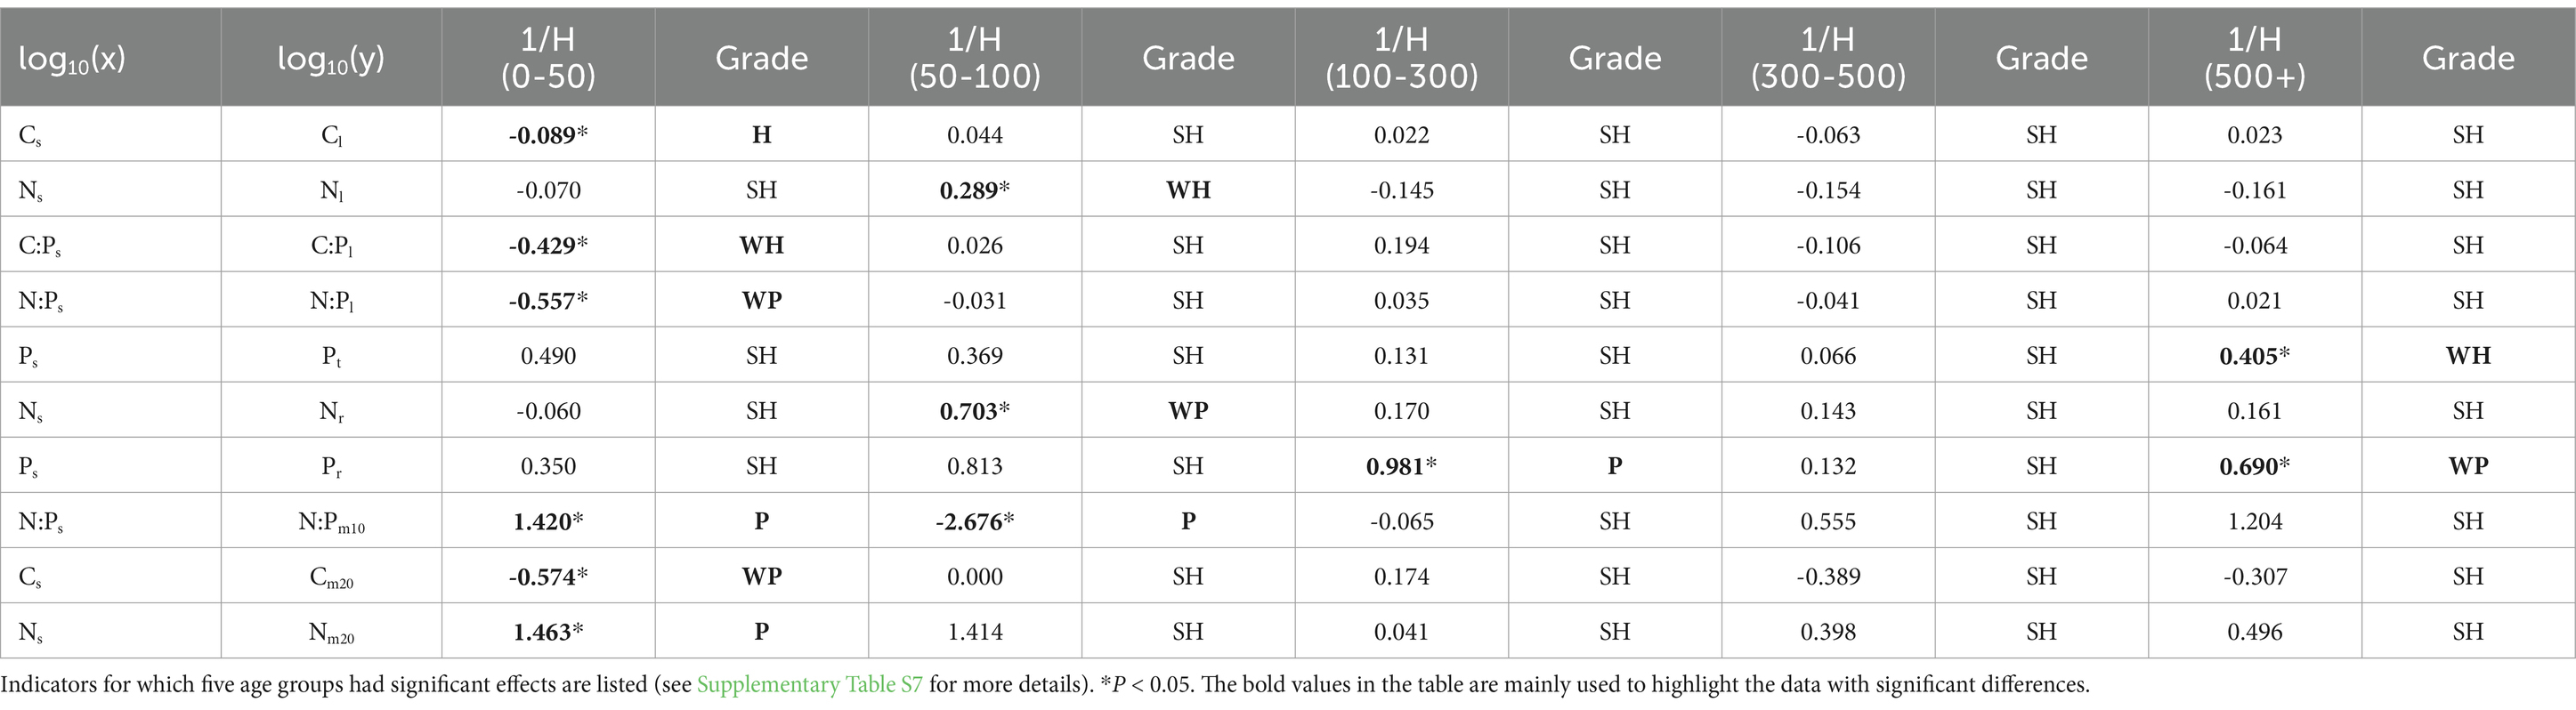
Table 4. Inverse of the homeostatic coefficient (1/H) values to describe the relationships between nutrients and stoichiometry in soil (x) and leaf, twig, root, and microbe (y).
4 Discussion
4.1 Ecological stoichiometry of Torreya grandis at different ages
Plants of different ages have different nutrient utilization efficiency (Weih et al., 2018). In our study, N concentration in T. grandis was low during the early growth stages (Figure 2). With the increase of tree age, T. grandis rapidly grows, various physiological metabolic pathways became active and absorbs large amounts of N and P, and the concentrations of N and P in various organs increase (Yuan et al., 2019). As the tree reaches old age and the physiology deteriorates, organic matter accumulation decreases. Plants selectively absorb various nutrient elements in the soil according to their growth needs, and accumulate photosynthates due to enhanced metabolism, thereby promoting N and P dilution and decrease in N and P concentration in the leaves and twigs, while the concentration of N and P in roots remained relatively high because of soil fertilization (Zhang et al., 2019b). It is likely that nutrient concentration in T. grandis decreases at more than 500 year gradient because it acquires a adaptive mechanism for nutrient redistribution and storage during long-term survival competition in nature.
Studies have shown that the C:N ratios of leaves does not show significant change in the forest development stage, whereas twigs and roots have significant differences (Liang et al., 2018). In our study, little difference in N content was found in the roots, but significant variations in N content and C:N ratios in the leaves were found among different tree ages. The reason may be that trees disturbed by long time fertilization had sufficient nutrients in the soil, which destroyed the stability of N and P concentrations in the roots, so plant root absorption is not limited by nutrients, and the N content in the roots was significantly higher than that in the leaves and twigs.
4.2 Ecological stoichiometry of forest soil at different ages
Soil C content increases with tree age (Figure 3). Although subtropical regions generally have higher rates of organic matter decomposition and lower rates of organic matter accumulation (Vitousek et al., 2010), our study demonstrated that organic matter accumulated over a long time frame. The C:N ratio of soil organic matter increased slightly with tree age, indicating that the decomposition rate of soil organic matter slowed down in a long time range. During a 900-year timescale, little change in soil N contents in the 0–40 cm soil layers and P contents in the 0–10 cm soil layers was found. A possible explanation is that the soil N and P nutrients have been controlled by artificial fertilization in this area.
Soil permeability and porosity of plantations decreased dramatically with age and fertilizer use (Huang and Wen, 2007), and these decreases can be indirect reasons for the decline in plantation soil microbial biomass. In forests, N fertilization enhances microbial biomass immediately after application (Zhang and Zak, 1998; Hart and Stark, 2016), but microbial biomass declines in the long run (Wallenstein et al., 2006). These changes may be the reason that the N or P content in soil microbial biomass increased in the 0–10 cm soil layer and decreased in the deep soil layer (Figure 4). Soil microbial C:N ratio is higher than 10:1 (Figure 4), microbes cannot get enough nitrogen to form their bodies, thus affecting their reproduction rate. Figures 8C–E also showed that the strength of cellulase, a significant predictor of soil carbon cycling rate, was at its lowest. The accumulation of soil C in the T. grandis forest may be explained by the rate of C accumulation in litters and rhizosphere deposits exceeding the rate of C decomposition by soil microbes (Vesterdal et al., 2002).
4.3 Correlation of ecological stoichiometry among components
Plants, soil, and soil microbes have complex interactions (Wardle et al., 2004). Plants provide C sources and energy for soil microbes in the form of root exudates, and soil microbes provide mineralized nutrients for plant communities (Liu and Wang, 2021; Shi et al., 2021; Ali et al., 2022). Soil C, N, and P content provide energy and nutrients for soil microbes (Elser and Hamilton, 2007; Gusewell and Gessner, 2009), and soil C:N:P ratios regulate microbial community composition to maintain stability between element absorption and release in plant-microbe-soil systems (Makino et al., 2003). Several studies have revealed strong correlations between C, N, and P in soils and plants (McGroddy et al., 2004; Yang and Luo, 2011; Liao et al., 2014). Our results showed the correlations among leaves, twigs and roots of T. grandis forests gradually increased with tree age, and the correlation was the highest at the 100–300 year gradient. Given that the land has been fertilized-managed and the soil nutrient supply is not deficient, we hypothesized that T. grandis over 100 years old has a high degree of N and P coupling in the leaves and twigs (Figures 5–7). Plant physiology usually assumes that N and P are active in young trees. The supply of aboveground plant nutrients are constrained by the availability of belowground nutrients (Townsend et al., 2007; Bui and Henderson, 2013; Wang and Zheng, 2020). For example, in tropical and subtropical forests where available P is scarce, the dynamics of plant C, N, and P are mainly influenced by the supply of soil P (Hedin, 2004; Morris and Blackwood, 2007; Chen et al., 2021). As a economic forest with long-term human activities, T. grandis may change the availability and utilization efficiency of N and P nutrient through physiological and biochemical mechanisms, such as resorption, to improve their adaptation.
In general, N and P concentration in the leaves have a strong coupling relationship (Reich et al., 2010). Photosynthesis, respiration rate, and productivity are positively correlated with N concentration in the leaves (Evans, 1989; Wright et al., 2004; Reich et al., 2009). The P concentration in the leaves regulates the relationship between plant physiological processes (especially growth rate) and leaf N-productivity (Reich et al., 2009; Wang and Zheng, 2020). In our study, the correlations between the concentrations of C, N and P in leaves and their ratios showed a general trend of decline with the increase of T. grandis forest age, while the changes of twigs and roots were not significant. These results are consistent with the growth-rate hypothesis, indicated that ancient T. grandis trees with long-term human interference have passed the life stage characterized by high growth rate and do not need large amounts of P transport from roots to leaves to support protein synthesis (Sardans et al., 2021).
4.4 Nutrient limitations of Torreya grandis-soil-microbe and its influencing factors
The leaf N:P ratio is used to indicate the N limitation or P limitation in an ecosystem, that is, an N:P ratio < 14 indicates N limitation, and N:P ratio > 16 is the P limitation (Reich, 2005). In our study, the N:P ratio was always lower than 10, indicating that the plants had a limited N supply. This result is inconsistent with the fact that subtropical areas are usually limited by P (Chen et al., 2021), and also lower than the leaf N:P ratio (11.4) of seeded male T. grandis in this area (Yuan et al., 2019). Male T. grandis trees mainly provide pollen for female T. grandis trees, and they are fruitless and rarely managed by local farmers. The reason for this may be related to the long-term fertilization that has changed the inherent N and P cycles and processes of T. grandis forest ecosystem. Given that the fruits of T. grandis is primarily harvested by farmers who managed the ancient T. grandis trees, it is likely that the use of P fertilizer is more important than N fertilizer in order to promote higher yields, which can induce a shift from P to N limitation in plant production (Yuan and Chen, 2015). In our study, the P concentrations in the leaves and roots were positively correlated with the P content in the soil, also showing no P deficiency in the soil (Figures 8A–C).
Soil N deficiency showed in RDA is that N contents in soil microbes are more strongly correlated with its availability in soil than that of P contents (Figures 8D,E). This is because that in contrast to soil P, N is particularly low in soil and microbes may absorb N from soil when it is available. In Figures 8A,D,E, APA enzyme activity was much higher than URE, indicating that the decomposition, transformation and availability of organophosphorus in soil were much higher than the nitrogen supply capacity of soil. Soil extracellular enzymes are the main media of soil organic matter decomposition, and their activities are often related to the biochemical cycle of nutrients. Through the nutrient elements and energy material transfer established between extracellular enzymes, microbes complete material and energy cycles between soil and T. grandis during metabolic process (Carrasco et al., 2012; Ali et al., 2022).
4.5 Stoichiometric homeostasis of plant tissues and microbes
Stoichiometric homeostasis reflects the physiological, biochemical, and growth adaptation of organisms to environmental changes (Hessen et al., 2004; Elser et al., 2010; Xing et al., 2016). Studies on the correlation and homeostasis between different plant organs, soil and microbial stoichiometry can facilitate study of plant nutrient allocation and utilization strategies (Bardgett and Wardle, 2010) and plant responses and adaptation mechanisms to the environment. In our research, ancient T. grandis has formed a stable homeostasis mechanism during its long-term growth (Table 4; Supplementary Table S7). Our results showed that roots and soil microorganisms are more sensitive to changes in soil environments than leaves and twigs. Studies on eucalyptus (Olsen and Bell, 1990), figs (Garrish et al., 2010), and lowland tropical forests in the Republic of Panama (Schreeg et al., 2014) have indicated that the N:P ratios of stems and roots are stronger indicators of soil nutrient availability than leaves. However, these studies were limited to seedlings, and the extent to which the stems, old leaves, and roots of mature trees can follow similar patterns remains to be determined. Our study showed that even 900-year-old mature trees also follow this hypothesis. There is evidence that metabolically active elements in tissues with higher metabolic activity (such as leaves) are less sensitive to environmental gradients than that with lower activity (Tang et al., 2018). Although microbial biomass comprises only a small proportion of soil organic matter, it is sensitive to environmental change and can thus be used as an indicator to some degree (Liu and Wang, 2021; Shi et al., 2021). The N:P ratio of soil microorganisms responds more strongly to nutrient availability than the N:P ratio of leaves, and is a better indicator of soil nutrient availability than that of leaves in our study.
5 Conclusion
The plant–microbe–soil C:N:P stoichiometry characteristics of ancient T. grandis forests were affected by the tree ages. Our research revealed the nutrient utilization efficiency varied with T. grandis tree ages, and the dynamics of N and P concentrations in T. grandis were mostly influenced by soil P contents. Moreover, roots and microbes were more sensitive indicators of soil nutrient availability than leaves, even in the 900-year-old trees. With the increase of tree age, the soil C content in T. grandis increased, indicating that the time range of soil organic matter accumulation in subtropical area was longer. It is worth noting that the N:P ratio of ancient T. grandis forest in this study was consistently lower than 10, indicating that the N supply of the plant was limited. Reasonable application of nitrogen fertilizer is needed to promote the growth of T. grandis. In order to reduce the use of fertilizer and raise the soil nitrogen content, it is adviced to properly restore the planting of nitrogen fixing plants beneath T. grandis trees in this area.
Data availability statement
The datasets presented in this article are not readily available because NO. Requests to access the datasets should be directed to eWx3YW5nYmluQHNpbmEuY29t.
Author contributions
SiH: Writing – original draft. JH: Formal analysis, Writing – review & editing. XN: Writing – review & editing. ShH: Investigation, Writing – review & editing. ZF: Data curation, Writing – original draft. SZ: Writing – review & editing. ZZ: Writing – review & editing. BW: Funding acquisition, Investigation, Writing – review & editing.
Funding
The author(s) declare that financial support was received for the research, authorship, and/or publication of this article. This research was supported by grants from the Key Scientific and Technological Grant of Zhejiang for Breeding New Agricultural Varieties (No. 2021C02070-9).
Conflict of interest
The authors declare that they have no known competing financial interests or personal relationships that could have appeared to influence the work reported in this paper.
Publisher’s note
All claims expressed in this article are solely those of the authors and do not necessarily represent those of their affiliated organizations, or those of the publisher, the editors and the reviewers. Any product that may be evaluated in this article, or claim that may be made by its manufacturer, is not guaranteed or endorsed by the publisher.
Supplementary material
The Supplementary material for this article can be found online at: https://www.frontiersin.org/articles/10.3389/fsufs.2024.1397393/full#supplementary-material
References
Ali, A., Hussain, M., Ali, S., Akhtar, K., Muhammad, M. W., Zamir, A., et al. (2022). Ecological stoichiometry in Pinus massoniana L. plantation: increasing nutrient limitation in a 48-year chronosequence. Forests 13:469. doi: 10.3390/f13030469
Ashton, I. W., Hyatt, L. A., Howe, K. M., Gurevitch, J., and Lerdau, M. T. (2005). Invasive species accelerate decomposition and litter nitrogen loss in a mixed deciduous forest. Ecol. Appl. 15, 1263–1272. doi: 10.1890/04-0741
Bardgett, R., and Wardle, D. A. (2010). Aboveground-belowground linkages: Biotic interactions, ecosystem processes, and global change. New York: Oxford University Press.
Brookes, P. C., Landman, A., Pruden, G., and Jenkinson, D. S. (1985). Chloroform fumigation and the release of soil nitrogen: a rapid direct extraction method for measuring microbial biomass nitrogen in soil. Soil Biol. Biochem. 17, 837–842. doi: 10.1016/0038-0717(85)90144-0
Brookes, P. C., Powlson, D., and Jenkinson, D. (1984). Phosphorus in the soil microbial biomass. Soil Biol. Biochem. 16, 169–175. doi: 10.1016/0038-0717(84)90108-1
Bui, E. N., and Henderson, B. L. (2013). C:N:P stoichiometry in Australian soils with respect to vegetation and environmental factors. Plant Soil 373, 553–568. doi: 10.1007/s11104-013-1823-9
Camenzind, T., Hattenschwiler, S., Treseder, K. K., Lehmann, A., and Rillig, M. C. (2018). Nutrient limitation of soil microbial processes in tropical forests. Ecol. Monogr. 88, 4–21. doi: 10.1002/ecm.1279
Carrasco, M., Rozas, J. M., Barahona, S., Alcaíno, J., Cifuentes, V., and Baeza, M. (2012). Diversity and extracellular enzymatic activities of yeasts isolated from King George Island, the sub-Antarctic region. BMC Microbiol. 12:251. doi: 10.1186/1471-2180-12-251
Chen, X., and Jin, H. (2019). Review of cultivation and development of Chinese Torreya in China. For. Trees Livelihoods 28, 68–78. doi: 10.1080/14728028.2018.1553690
Chen, X., and Niu, J. (2020). Evaluating the adaptation of Chinese Torreya plantations to climate change. Atmos. 11:176. doi: 10.3390/atmos11020176
Chen, L., Qiang, D., Yuan, Z., Mu, X., and Kallenbach, R. L. (2018). Age-related C:N:P stoichiometry in two plantation forests in the loess plateau of China. Ecol. Eng. 120, 14–22. doi: 10.1016/j.ecoleng.2018.05.021
Chen, H., Reed, S. C., Lu, X. T., Xiao, K. C., Wang, K. L., and Li, D. J. (2021). Coexistence of multiple leaf nutrient resorption strategies in a single ecosystem. Sci. Total Environ. 772:144951. doi: 10.1016/j.scitotenv.2021.144951
Cui, N., Liu, X., Zhang, D., Zhang, J., Liu, Y., Deng, C., et al. (2014). The distribution pattern of carbon, nitrogen and phosphorus and the stoichiometry characteristics of Pinus massoniana plantation in different ages. Ecol. Environ. 23, 188–195. doi: 10.16258/j.cnki.1674-5906.2014.02.023
Deng, S. P., and Tabatabai, M. A. (1994). Cellulase activity of soils. Soil Biol. Biochem. 26, 1347–1354. doi: 10.1016/0038-0717(94)90216-X
Deng, J., Zhang, D., Zhang, W., Ren, C., Hao, W., Liu, C., et al. (2019). Carbon, nitrogen, and phosphorus stoichiometry and homeostasis characteristics of leaves, soil, and microbial biomass of Robinia pseudoacacia forests in the loess hilly region of China. Acta Ecol. Sin. 39, 5527–5535. doi: 10.5846/stxb201808281845
Elser, J. J., Fagan, W. F., Kerkhoff, A. J., Swenson, N. G., and Enquist, B. J. (2010). Biological stoichiometry of plant production: metabolism, scaling and ecological response to global change. New Phytol. 186, 593–608. doi: 10.1111/j.1469-8137.2010.03214.x
Elser, J. J., and Hamilton, A. (2007). Stoichiometry and the new biology - the future is now. PLoS Biol. 5, 1403–1405. doi: 10.1371/journal.pbio.0050181
Evans, J. R. (1989). Photosynthesis and nitrogen relationships in leaves of C3 plants. Oecologia 78, 9–19. doi: 10.1007/BF00377192
Filipiak, M., and Filipiak, Z. M. (2022). Application of ionomics and ecological stoichiometry in conservation biology: nutrient demand and supply in a changing environment. Biol. Conserv. 272:109622. doi: 10.1016/j.biocon.2022.109622
Frankeberger, W. T., and Johanson, J. B. (1983). Method of measuring invertase activity in soils. Plant Soil 74, 301–311. doi: 10.1007/BF02181348
Gao, Z. B., Wang, H. Y., Lv, X. T., and Wang, Z. W. (2017). Effects of nitrogen and phosphorus addition on C:N:P stoichiometry in roots and leaves of four dominant plant species in a meadow steppe of Hulunbuir. Chinese J. Ecol. 36, 80–88. doi: 10.13292/j.1000-4890.201701.015
Garrish, V., Cernusak, L. A., Winter, K., and Turner, B. L. (2010). Nitrogen to phosphorus ratio of plant biomass versus soil solution in a tropical pioneer tree, Ficus insipida. J. Exp. Bot. 61, 3735–3748. doi: 10.1093/jxb/erq183
Gusewell, S., and Gessner, M. O. (2009). N: P ratios influence litter decomposition and colonization by fungi and bacteria in microcosms. Funct. Ecol. 23, 211–219. doi: 10.1111/j.1365-2435.2008.01478.x
Han, Y., Wang, G. G., Wu, T., Chen, W., Ji, Y., and Jin, S. (2021). Fertilization failed to make positive effects on Torreya grandis in severe N-deposition subtropics. Sustain. For. 13:9736. doi: 10.3390/su13179736
Hart, S. C., and Stark, J. M. (2016). Nitrogen limitation of the microbial biomass in an old-growth forest soil. Écoscience 4, 91–98. doi: 10.1080/11956860.1997.11682382
He, J. S., and Han, X. G. (2010). Ecological stoichiometry: searching for unifying principles from individuals to ecosystems. Chinese J. Plant Ecol. 34, 2–6. doi: 10.3773/j.issn.1005-264x.2010.01.002
Hedin, L. O. (2004). Global organization of terrestrial plant–nutrient interactions. P. Natl. Acad. Sci. USA 101, 10849–10850. doi: 10.1073/pnas.0404222101
Hessen, D. O., Agren, G. I., Anderson, T. R., Elser, J. J., and Ruiter, P. C. (2004). Carbon sequestration in ecosystems: the role of stoichiometry. Ecology 85, 1179–1192. doi: 10.1890/02-0251
Huang, C., and Wen, Y. (2007). Study on the soil hydrology-physical properties of Eucalyptus urophylla × E. grandis continuous plantations. Ecol. Environ. 16, 538–543. doi: 10.16258/j.cnki.1674-5906.2007.02.054
Jeyasingh, P. D., Sherman, R. E., Prater, C., Pulkkinen, K., and Ketola, T. (2023). Adaptation to a limiting element involves mitigation of multiple elemental imbalances. J. R. Soc. Interface 20:20220472. doi: 10.1098/rsif.2022.0472
Liang, X. Y., Liu, S. R., Wang, H., and Wang, J. X. (2018). Variation of carbon and nitrogen stoichiometry along a chronosequence of natural temperate forest in northeastern China. J. Plant Ecol. 11, 339–350. doi: 10.1093/jpe/rtx0008
Liao, Y., McCormack, M. L., Fan, H., Wang, H., Wu, J., Tu, J., et al. (2014). Relation of fine root distribution to soil C in a Cunninghamia lanceolata plantation in subtropical China. Plant Soil 381, 225–234. doi: 10.1007/s11104-014-2114-9
Liu, Z. W., and Li, Y. S. (2003). A study on the efficiency of nutrient utilization in black locust plantation. Acta Ecol. Sin. 23, 444–449. doi: 10.3321/j.issn:1000-0933.2003.03.006
Liu, R. S., and Wang, D. M. (2021). C:N:P stoichiometric characteristics and seasonal dynamics of leaf-root-litter-soil in plantations on the loess plateau. Ecol. Indic. 127:107772. doi: 10.1016/j.ecolind.2021.107772
Makino, W., Cotner, J. B., Sterner, R. W., and Elser, J. J. (2003). Are bacteria more like plants or animals? Growth rate and resource dependence of bacterial C: N:P stoichiometry. Funct. Ecol. 17, 121–130. doi: 10.1046/j.1365-2435.2003.00712.x
Małachowska-Jutsz, A., and Matyja, K. (2019). Discussion on methods of soil dehydrogenase determination. J. Environ. Sci. Technol. 16, 7777–7790. doi: 10.1007/s13762-019-02375-7
McGroddy, M. E., Daufresne, T., and Hedin, L. O. (2004). Scaling of C:N:P stoichiometry in forests worldwide: Implications of terrestrial redfield-type ratios. Ecol. 85, 2390–2401. doi: 10.1890/03-0351
Mebius, L. J. (1960). A rapid method for the determination of organic carbon in soil. Anal. Chim. Acta 22, 120–124. doi: 10.1016/S0003-2670(00)88254-9
Meng, H. F., Zhu, X. D., and Bian, J. Y., (2004). Investigation on resource of ancient Torreya woods of Zhuji City. East China Forest Management. 18, 27–31. doi: 10.3969/j.issn.1004-7743.2004.02.009
Min, H., Cheng, S. M., Kang, Z. X., and Chen, Y. W. (2009). Phenotypic diversity of natural Torreya grandis populations. Jour. of Zhejiang For. Sci. Tech. 29, 24–28. doi: 10.3969/j.issn.1001-3776.2009.02.006
Moraghan, J. T., Rego, T. J., and Sahrawat, K. L. (1983). Effect of water pretreatment on total nitrogen analysis of soils by the Kjeldahl method. Soil Sci. Soc. Am. J. 47, 213–217. doi: 10.2136/sssaj1983.03615995004700020007x
Morris, S. J., and Blackwood, C. B. (2007). The ecology of soil organisms. Cambridge: Academic Press, 195–229.
Neri, D., Urbinati, C., Savini, G., and Sanchioni, A. (2005). Age determination and tree-ring growth dynamics in old trees of Pyrus communis 'Angelica'. Acta Hortic. 671, 623–629. doi: 10.17660/ActaHortic.2005.671.87
Olsen, S. R. (1954). Estimation of available phosphorus in soils by extraction with sodium bicarbonate. Washington: United States Department of Agriculture.
Olsen, J. K., and Bell, L. C. (1990). A glasshouse evaluation of ‘critical’ N and P concentrations and N:P ratios in various plant parts of six eucalypt species. Aust. J. Bot. 38, 281–298. doi: 10.1071/BT9900281
Rainer, G. J., Wu, J. S., and Philip, C. B. (2011). Measuring soil microbial biomass using an automated procedure. Soil Biol. Biochem. 43, 873–876. doi: 10.1016/j.soilbio.2010.09.024
Reich, P. B. (2005). Global biogeography of plant chemistry: filling in the blanks. New Phytol. 168, 263–266. doi: 10.1111/j.1469-8137.2005.01562.x
Reich, P. B., and Oleksyn, J. (2004). Global patterns of plant leaf N and P in relation to temperature and latitude. Proc. Natl. Acad. Sci. USA 101, 11001–11006. doi: 10.1073/pnas.0403588101
Reich, P. B., Oleksyn, J., and Wright, I. J. (2009). Leaf phosphorus influences the photosynthesis-nitrogen relation: a cross-biome analysis of 314 species. Oecologia 160, 207–212. doi: 10.1007/s00442-009-1291-3
Reich, P. B., Oleksyn, J., Wright, I. J., Niklas, K. J., Hedin, L., and Elser, J. J. (2010). Evidence of a general 2/3-power law of scaling leaf nitrogen to phosphorus among major plant groups and biomes. Proc. R. Soc. B Biol. Sci. 277, 877–883. doi: 10.1098/rspb.2009.1818
Sardans, J., Janssens, I. A., Ciais, P., Obersteiner, M., and Peñuelas, J. (2021). Recent advances and future research in ecological stoichiometry. Perspect. Plant Ecol. Evol. Syst. 50:125611. doi: 10.1016/j.ppees.2021.125611
Sardans, J., and Peñuelas, J. (2015). Trees increase their P:N ratio with size. Glob. Ecol. Biogeogr. 24, 147–156. doi: 10.1111/geb.12231
Schreeg, L. A., Santiago, L. S., Wright, S. J., and Turner, B. L. (2014). Stem, root, and older leaf N:P ratios are more responsive indicators of soil nutrient availability than new foliage. Ecology 95:2062. doi: 10.1890/13-1671.1
Shi, L. J., Li, Q. K., Fu, X. L., Kou, L., Dai, X. Q., and Wang, H. M. (2021). Foliar, root and rhizospheric soil C:N:P stoichiometries of overstory and understory species in subtropical plantations. Catena 198:105020. doi: 10.1016/j.catena.2020.105020
Sterner, R. W., and Elser, J. J. (2002). Ecological stoichiometry: the biology of elements from molecules to the biosphere. J. Plankton Res. 25:1183. doi: 10.1515/9781400885695
Tang, Z. Y., Xu, W. T., Zhou, G. Y., Bai, Y. F., Li, J. X., Tang, X. L., et al. (2018). Patterns of plant carbon, nitrogen, and phosphorus concentration in relation to productivity in China’s terrestrial ecosystems. Proc. Natl. Acad. Sci. USA 115, 4033–4038. doi: 10.1073/pnas.1700295114
Tel, D. A., and Heseltine, C. (2008). The analyses of KCL soil extracts for nitrate, nitrite and ammonium using a TRAACS 800 analyzer. Commun. Soil Sci. Plant Anal. 21, 1681–1688. doi: 10.1080/00103629009368331
Townsend, A. R., Cleveland, C. C., Asner, G. P., and Bustamante, M. C. (2007). Controls over foliar N: P ratios in tropical rain forests. Ecology 88, 107–118. doi: 10.1890/0012-9658(2007)88[107:COFNRI]2.0.CO;2
Vance, E. D., Brookes, P. C., and Jenkinson, D. S. (1987). An extraction method for measuring soil microbial biomass C. Soil Biol. Biochem. 19, 703–707. doi: 10.1016/0038-0717(87)90052-6
Vesterdal, L., Ritter, E., and Gundersen, P. (2002). Change in soil organic carbon following afforestation of former arable land. For. Ecol. Manag. 169, 137–147. doi: 10.1016/S0378-1127(02)00304-3
Vitousek, P. M., Porder, S., Houlton, B. Z., and Chadwick, O. A. (2010). Terrestrial phosphorus limitation: mechanisms, implications, and nitrogen-phosphorus interactions. Ecology 20, 5–15. doi: 10.1890/08-0127.1
Wallenstein, M. D., Mcnulty, S., Fernandez, I. J., Boggs, J., and Schlesinger, W. H. (2006). Nitrogen fertilization decreases forest soil fungal and bacterial biomass in three long-term experiments. For. Ecol. Manag. 222, 459–468. doi: 10.1016/j.foreco.2005.11.002
Wang, B., Huang, S. Y., Li, Z. C., Zhou, Z. C., Huang, J. Y., Yu, H. L., et al. (2022). Factors driving the assembly of prokaryotic communities in bulk soil and rhizosphere of Torreya grandis along a 900-year age gradient. Sci. Total Environ. 837:155573. doi: 10.1016/j.scitotenv.2022.155573
Wang, B., Min, Q. W., Du, B., Bai, Y. Y., and Xu, Y. T. (2013). Research on ecosystem services value of ancient Torreya grandis in Kuaiji Mountain. Chin. J. Eco-Agric. 21, 779–785. doi: 10.3724/SP.J.1011.2013.00779
Wang, Z. F., and Zheng, F. L. (2020). Ecological stoichiometry of plant leaves, litter, and soils in a secondary forest on China's loess plateau. PeerJ 8:e10084. doi: 10.7717/peerj.10084
Wardle, D.A., Bardgett, R.D., Klironomos, J.N., Setala, H.van der, Putten, W.H., and Wall, D.H. (2004). Ecological linkages between aboveground and belowground biota. Science 304, 1629–1633, doi: 10.1126/science.1094875
Weih, M., Hamnér, K., and Pourazari, F. (2018). Analyzing plant nutrient uptake and utilization efficiencies: comparison between crops and approaches. Plant Soil 430, 7–21. doi: 10.1007/s11104-018-3738-y
Wright, I. J., Reich, P. B., Westoby, M., Ackerly, D. D., Baruch, Z., Bongers, F., et al. (2004). The worldwide leaf economics spectrum. Nature 428, 821–827. doi: 10.1038/nature02403
Xing, W., Shi, Q., Liu, H., and Liu, G. (2016). Growth rate, protein: RNA ratio and stoichiometric homeostasis of submerged macrophytes under eutrophication stress. Knowl. Manag. Aquat. Ecosyst. 417:25. doi: 10.1051/kmae/2016012
Yang, Y., and Luo, Y. (2011). Carbon: nitrogen stoichiometry in forest ecosystems during stand development. Glob. Ecol. Biogeogr. 20, 354–361. doi: 10.1111/j.1466-8238.2010.00602.x
Yuan, Y. N. (2020). C, N, P contents and their stoichiometric characteristics of Torreya grandis fort. Et Lindl in Kuaiji Mountain. [dissertation/master’s thesis]. Beijing: Chinese Academy of Forestry.
Yuan, Z. Y., and Chen, H. Y. H. (2015). Decoupling of nitrogen and phosphorus in terrestrial plants associated with global changes. Nat. Clim. Chang. 5, 465–469. doi: 10.1038/nclimate2549
Yuan, Y. N., Li, Z. C., Wang, B., Zhang, Y. J., and Huang, S. Y. (2019). Stoichiometric characteristics of C, N and P in different varieties of Torreya grandis. For. Res. 32, 73–79. doi: 10.13275/j.cnki.lykxyj.2019.06.010
Yuen, S. H., and Pollard, A. G. (1954). Determination of nitrogen in agricultural materials by the nessler reagent. II.—Micro-determinations in plant tissue and in soil extracts. J. Sci. Food Agric. 5, 364–369. doi: 10.1002/jsfa.2740050803
Zeng, Q. C., Lal, R., Chen, Y. N., and An, S. S. (2017). Soil, leaf and root ecological stoichiometry of Caragana korshinskii on the loess plateau of China in relation to plantation age. PLoS One 12, 88–90. doi: 10.1371/journal.pone.0168890
Zeng, Q. C., Li, X., Dong, Y. H., An, S. S., and Darboux, F. (2016). Soil and plant components ecological stoichiometry in four steppe communities in the loess plateau of China. Catena 147, 481–488. doi: 10.1016/j.catena.2016.07.047
Zhang, B., Chen, H., Deng, M., Li, X., Chen, T., Liu, L., et al. (2022). Multidimensional stoichiometric mismatch explains differences in detritivore biomass across three forest types. J. Anim. Ecol. 92, 454–465. doi: 10.1111/1365-2656.13859
Zhang, W., Liu, W. C., Xu, M. P., Deng, J., Han, X. H., Yang, G. H., et al. (2019a). Response of forest growth to C:N:P stoichiometry in plants and soils during Robinia pseudoacacia afforestation on the loess plateau. China. Geoderma. 337, 280–289. doi: 10.1016/j.geoderma.2018.09.042
Zhang, B. W., Lu, K. Z., Qi, G. H., and Zhang, X. M. (2021). Effect on growth of Malus Micromalus seedlings and soil properties of apple orchards with different ages. For. Ecol Sci. 36, 434–441. doi: 10.13320/j.cnki.hjfor.2021.0059
Zhang, Y. J., Wang, B., Zheng-Cai, L. I., Huang, S. Y., Yuan, Y. N., and Qin, Y. X. (2019b). Effects of fertilization measures on soil labile organic carbon and nutrient of old Torreya grandis. For. Res. 32, 93–97. doi: 10.13275/j.cnki.lykxyj.2019.02.013
Keywords: ecological stoichiometry, tree age, plant-microbe-soil interaction, ancient Torreya grandis ‘Merrillii’ community, stoichiometric homeostasis
Citation: He S, Huang J, Na X, Huang S, Fang Z, Zhang S, Zhou Z and Wang B (2024) Variations in plant–microbe–soil C:N:P stoichiometry along a 900-year age gradient in Torreya grandis ‘Merrillii’ plantations in Southeast China. Front. Sustain. Food Syst. 8:1397393. doi: 10.3389/fsufs.2024.1397393
Edited by:
Wenjun Jiao, Chinese Academy of Sciences (CAS), ChinaReviewed by:
Hua Liu, Anhui Agricultural University, ChinaWang Yanping, Shandong Agricultural University, China
Copyright © 2024 He, Huang, Na, Huang, Fang, Zhang, Zhou and Wang. This is an open-access article distributed under the terms of the Creative Commons Attribution License (CC BY). The use, distribution or reproduction in other forums is permitted, provided the original author(s) and the copyright owner(s) are credited and that the original publication in this journal is cited, in accordance with accepted academic practice. No use, distribution or reproduction is permitted which does not comply with these terms.
*Correspondence: Bin Wang, eWx3YW5nYmluQHNpbmEuY29t