- 1College of Grassland Science, Key Laboratory of Grassland Ecosystem, Gansu Agricultural University, Ministry of Education/Sino-U.S. Center for Grassland Ecosystem Sustainability, Lanzhou, China
- 2Longxi Animal Husbandry and Veterinary Bureau Technical Service Center, Dingxi, China
- 3Dingxi Technology Innovation Center of Cultivated Grassland Construction in Arid Area of Loess Plateau, Dingxi, China
- 4Longxi Yurun Agriculture and Animal Husbandry Company, Dingxi, China
Medicago ruthenica is a promising leguminous forage crop due to its lack of saponins, which prevents bloat in livestock from excessive consumption. Legume/grass mixed cropping is an effective forage planting method widely used in agricultural and pastoral regions. However, there is a lack of research on using legume-grass mixed cropping to establish perennial, high-yield, and high-quality cultivated grasslands in the Longxi Loess Plateau. This study conducted a legume/grass intercropping experiment in the Longxi Loess Plateau region of northwestern China, using Medicago ruthenica and Bromus inermis. Experimental plots were established in 2021, with field sampling and laboratory analysis starting in 2022 and 2023, respectively. The research aimed to investigate the effects of intercropping Medicago ruthenica with Bromus inermis on forage yield and quality, and to determine the optimal intercropping ratios. The experiment tested various intercropping ratios of Medicago ruthenica and Bromus inermis in the fall (2:8, 3:7, 4:6, 5:5, 6:4, 7:3, 8:2), with sole crops of each species serving as controls. Results showed that, in the second and third years of mixed cropping, the forage yield under mixed cropping treatments was significantly higher than that of Medicago ruthenica and Bromus inermis monoculture, with increases of 40.89–70.88% and 13.97–38.22% in the second year, and 131.91–199.13% and 44.06–85.82% in the third year. When the legume proportion in the mixed cropping system was around 30%, competition between the two forages reached equilibrium, demonstrating the benefits of mixed cropping. The crude protein and ether extract content of mixed forage were significantly higher than those of monoculture, while the neutral detergent fiber and acid detergent fiber contents were significantly lower, indicating a higher feeding value for the mixed forage. The legume proportion was a key factor influencing the yield of mixed forage. In conclusion, a mixed planting ratio of Medicago ruthenica and Bromus inermis at 3:7 resulted in higher yield and nutritional quality, making it an optimal ratio for establishing cultivated forage fields in the Longxi Loess Plateau.
1 Introduction
The Loess Plateau, one of China’s most ecologically challenged regions, is characterized by a dry climate, limited water resources, sparse vegetation, and distinctive mountainous and hilly landscapes. These factors severely restrict the sustainable development of local animal husbandry. Establishing cultivated forage fields can mitigate certain environmental issues and ease the imbalance between grass and livestock. This approach is crucial for advancing high-quality animal husbandry (Gang et al., 2018; Lu et al., 2004; Littlejohn et al., 2019). In the Longxi Loess Plateau, high-quality forage is extremely scarce. To promote high-quality animal husbandry in this region, establishing mixed cultivated grasslands is crucial.
Mixed cropping involves planting two or more different crops together in the same field. Compared to monoculture, mixed cropping enhances land and light utilization, particularly when leguminous plants are grown alongside gramineous plants (Tahir et al., 2022; Lu et al., 2022). This approach increases ecosystem biodiversity, thereby reducing plant disease incidence and pest invasion (Trenbath, 1993). Legume/grass mixed cropping enhances nitrogen utilization through biological nitrogen fixation by rhizobia in legume roots (Burris and Roberts, 1993; Bohlool et al., 1992). This practice gradually reduces the need for nitrogen fertilizers and decreases the reliance on chemical nitrogen fertilizers in agriculture (Herridge et al., 2008). This method has become a preferred approach for enhancing crop productivity and meeting forage supply demands in agricultural fields. Recently, the effectiveness of legume/grass mixed cropping in achieving higher forage yield and quality has been well established in northern China and other regions worldwide, including the Mediterranean (Zielewicz et al., 2021; Darambazar et al., 2022; Lithourgidis et al., 2006; Wu X. et al., 2022). However, documentation on legume and grass mixed planting in the establishment of cultivated grasslands in the Loess Plateau region of northwestern China is limited.
Medicago ruthenica is a high-quality perennial leguminous plant known for its drought tolerance, cold resistance, salt-alkali tolerance, trampling resistance, and lack of saponins, which prevents bloat in livestock when consumed excessively (Wu R. et al., 2022). B. inermis, a palatable, highly nutritious, cold-resistant, and grazing-tolerant perennial grass, is widely cultivated in northern and northwestern China (Li et al., 2022). Due to these distinctive characteristics and the favorable adaptability of both plants, they were chosen for this mixed cropping experiment. Mixed cropping involves interspecific competition, where the growth of one crop can be impacted by the competition from another (Dhima et al., 2007). In legume/grass mixed cropping systems, grasses typically exhibit stronger competitiveness than legumes. For example, in mixed cropping systems in the Loess Plateau region of northwestern China, B. inermis maintains a competitive advantage over M. ruthenica throughout the growing season. Taller grasses can compete more effectively for light, which diminishes the advantage of legumes in mixed cropping (Wei et al., 2022). Consequently, the productivity of mixed cropping systems primarily depends on the competitive interactions for light and other resources, which arise from the morphological differences among crops and their varying spatiotemporal nutrient requirements. Therefore, determining an optimal mixed cropping ratio is essential.
The main objectives of this study are: (a) To assess whether varying ratios of mixed planting of M. ruthenica and B. inermis can enhance the total yield and nutritional value of mixed forage compared to monoculture, and to determine the extent of such effects; (b) To evaluate whether appropriate mixed cropping ratios can mitigate interspecies competition; (c) To identify an optimal mixed cropping ratio that yields high-quality, high-yield forage, providing both theoretical and practical guidance for establishing high-quality, high-yield perennial forage fields in the Loess Plateau region of Longxi.
2 Materials and methods
2.1 Study site overview
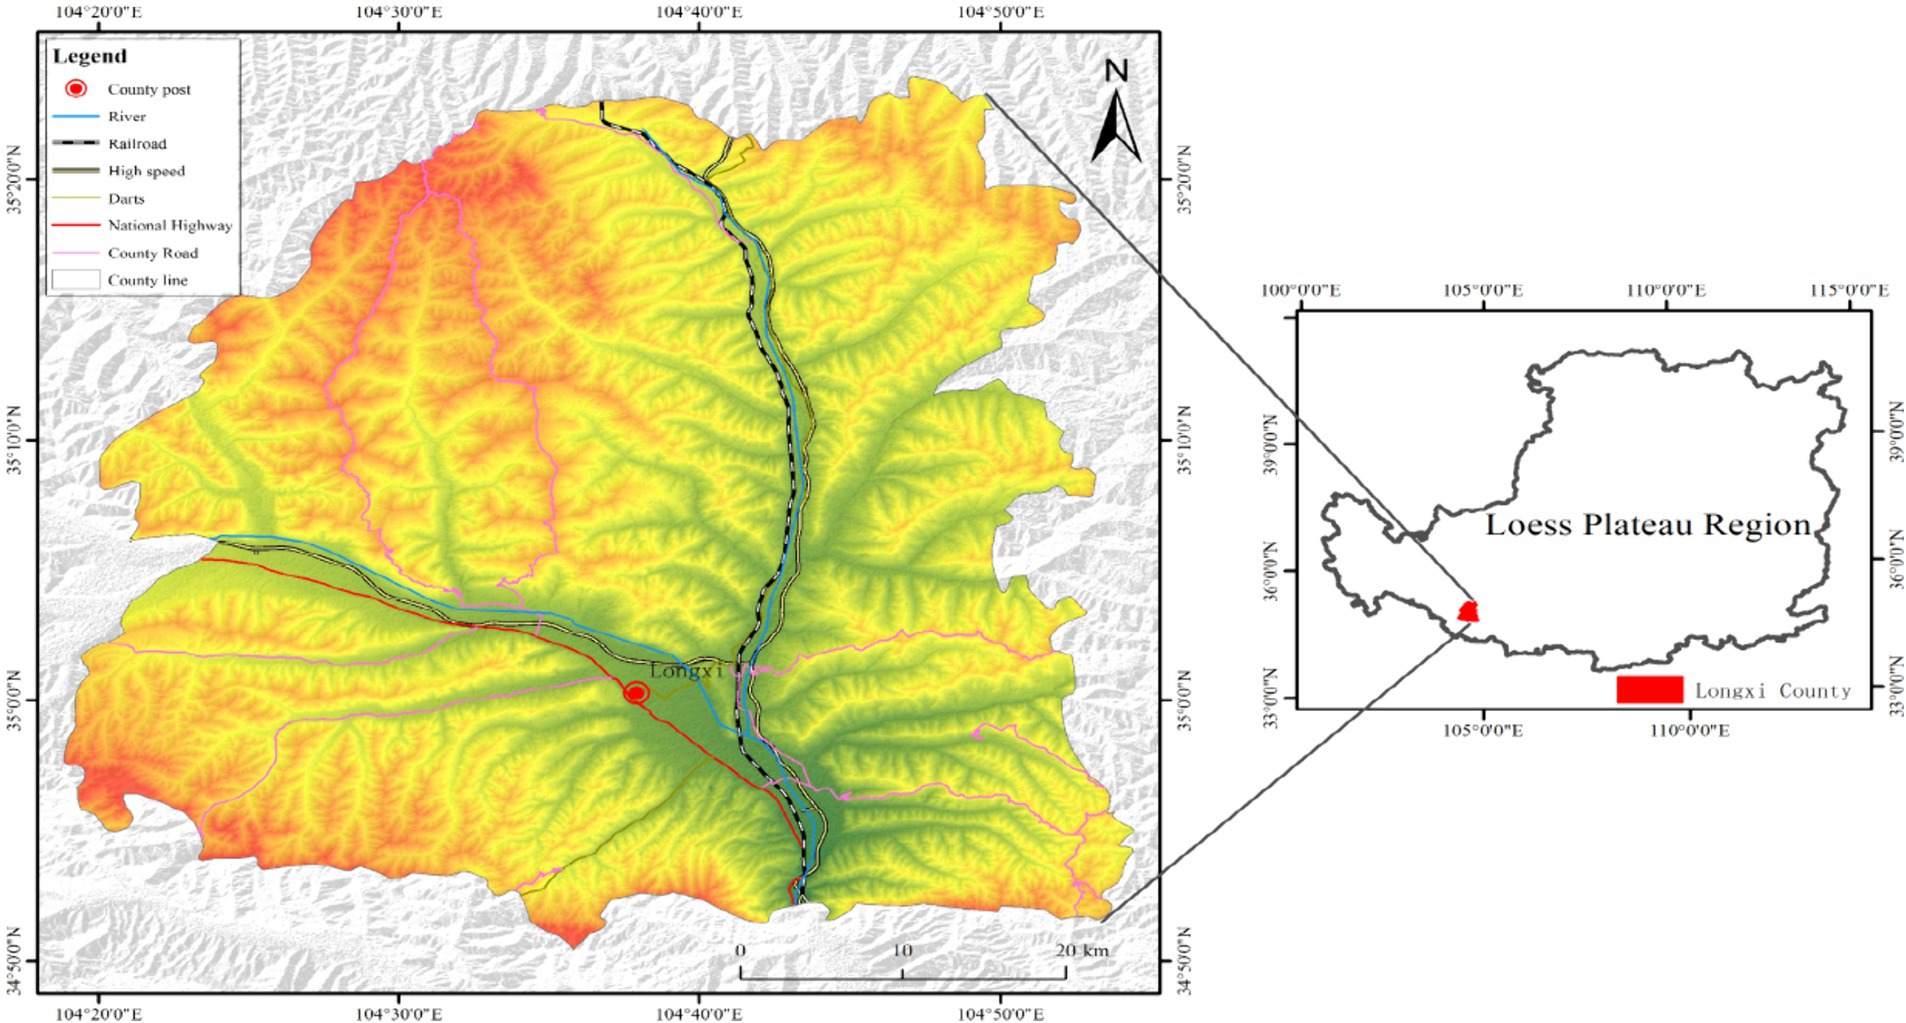
The experimental site was located in Wenfeng Town, Longxi County, Gansu Province (altitude: 1880 m, 35°40′40″N, 104°40′40″E; Figure 1). This site is typical of the mountainous cultivated land in the semi-arid Loess Plateau, characterized by dry and sparse rainfall, poor soil, and a preceding crop of corn. The region experiences a continental monsoon climate, with 2,292 h of sunshine annually, an average frost-free period of 146 days per year, and an average annual rainfall of approximately 450 mm, concentrated mainly from May to September. Evaporation averages about 1,440 mm. The average temperature over the past 30 years has been 6–7°C (Wei et al., 2022). Based on soil texture and characteristics, the soil type at the experimental site was classified as loess soil. Before sowing, the physicochemical properties of the 0–20 cm soil layer in the Wenfeng Town experimental area were analyzed. The soil properties were: total nitrogen 0.93 g·kg−1, alkaline nitrogen 21.23 mg·kg−1, available phosphorus 15.57 mg·kg−1, available potassium 189.72 mg·kg−1, organic matter 8.61 g·kg−1, and pH 8.23. The hydrothermal conditions of the experimental area from 2021 to 2023 are shown in Figure 2.
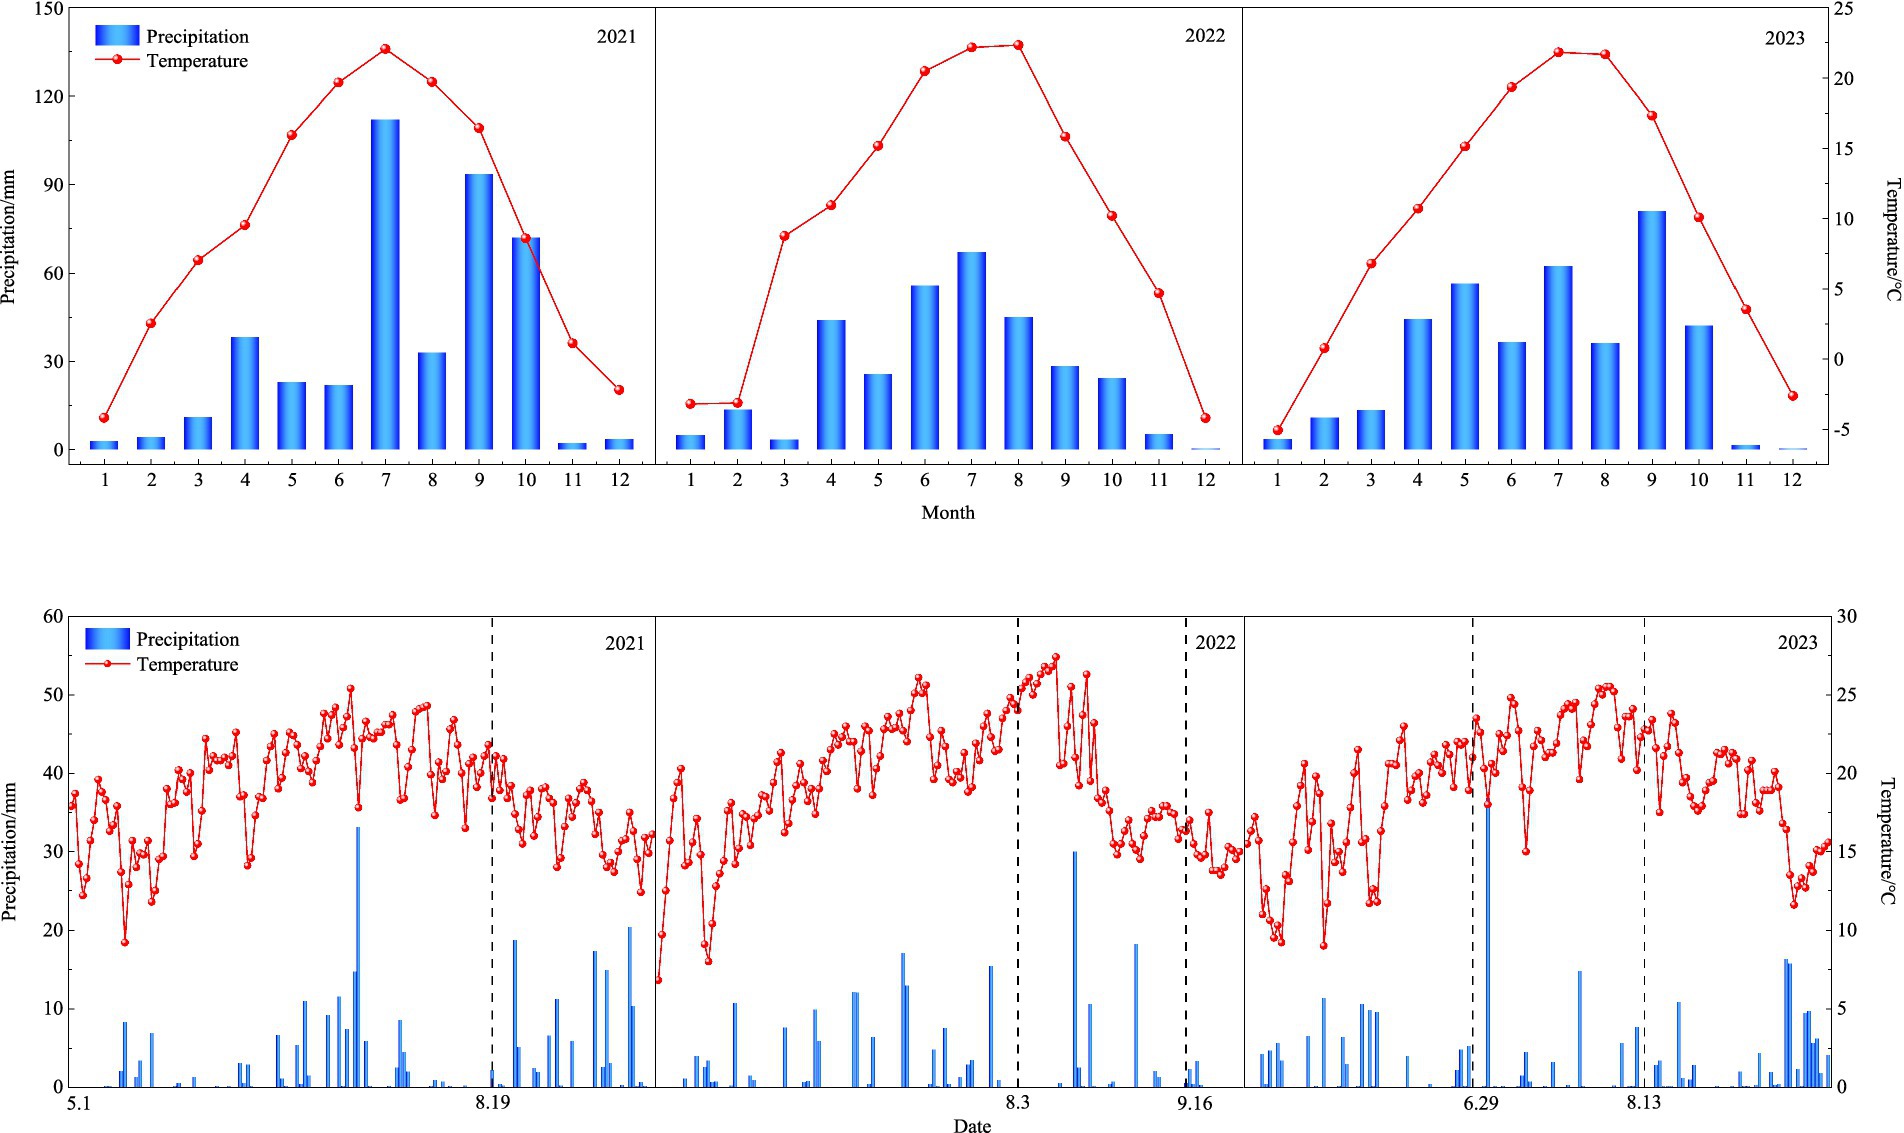
Figure 2. Monthly average temperature and total precipitation for the years 2021, 2022, and 2023, and daily average temperature and precipitation during the forage growing season (May to September). In the Fig., 8.19, 8.3, 9.16, 6.29, and 8.13, respectively, represent the periods of grassland establishment (August 19, 2021), measurement periods in 2022 (August 3 and September 16), and measurement periods in 2023 (June 29 and August 13).
2.2 Field experiment design
Medicago ruthenica used in this study was supplied by the College of Pratacultural Science, Gansu Agricultural University. It is a new variety of Shoulu M. ruthenica. Prior to sowing, the M. ruthenica seeds underwent scarification treatment. B. inermis is an imported variety known as ‘Original Wild,’ originating from Canada. It was purchased from the Agricultural Development Department of Lanzhou Nongfeng Seed Industry. The purity and germination rates of M. ruthenica and B. inermis both met the planting standards.
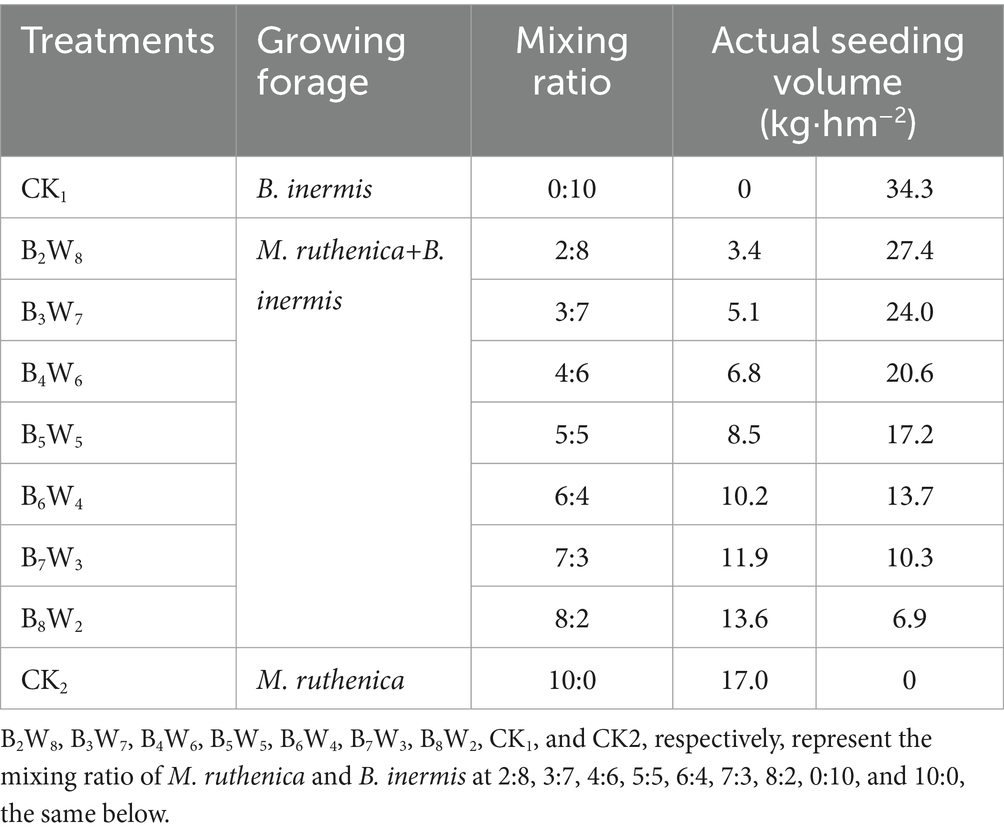
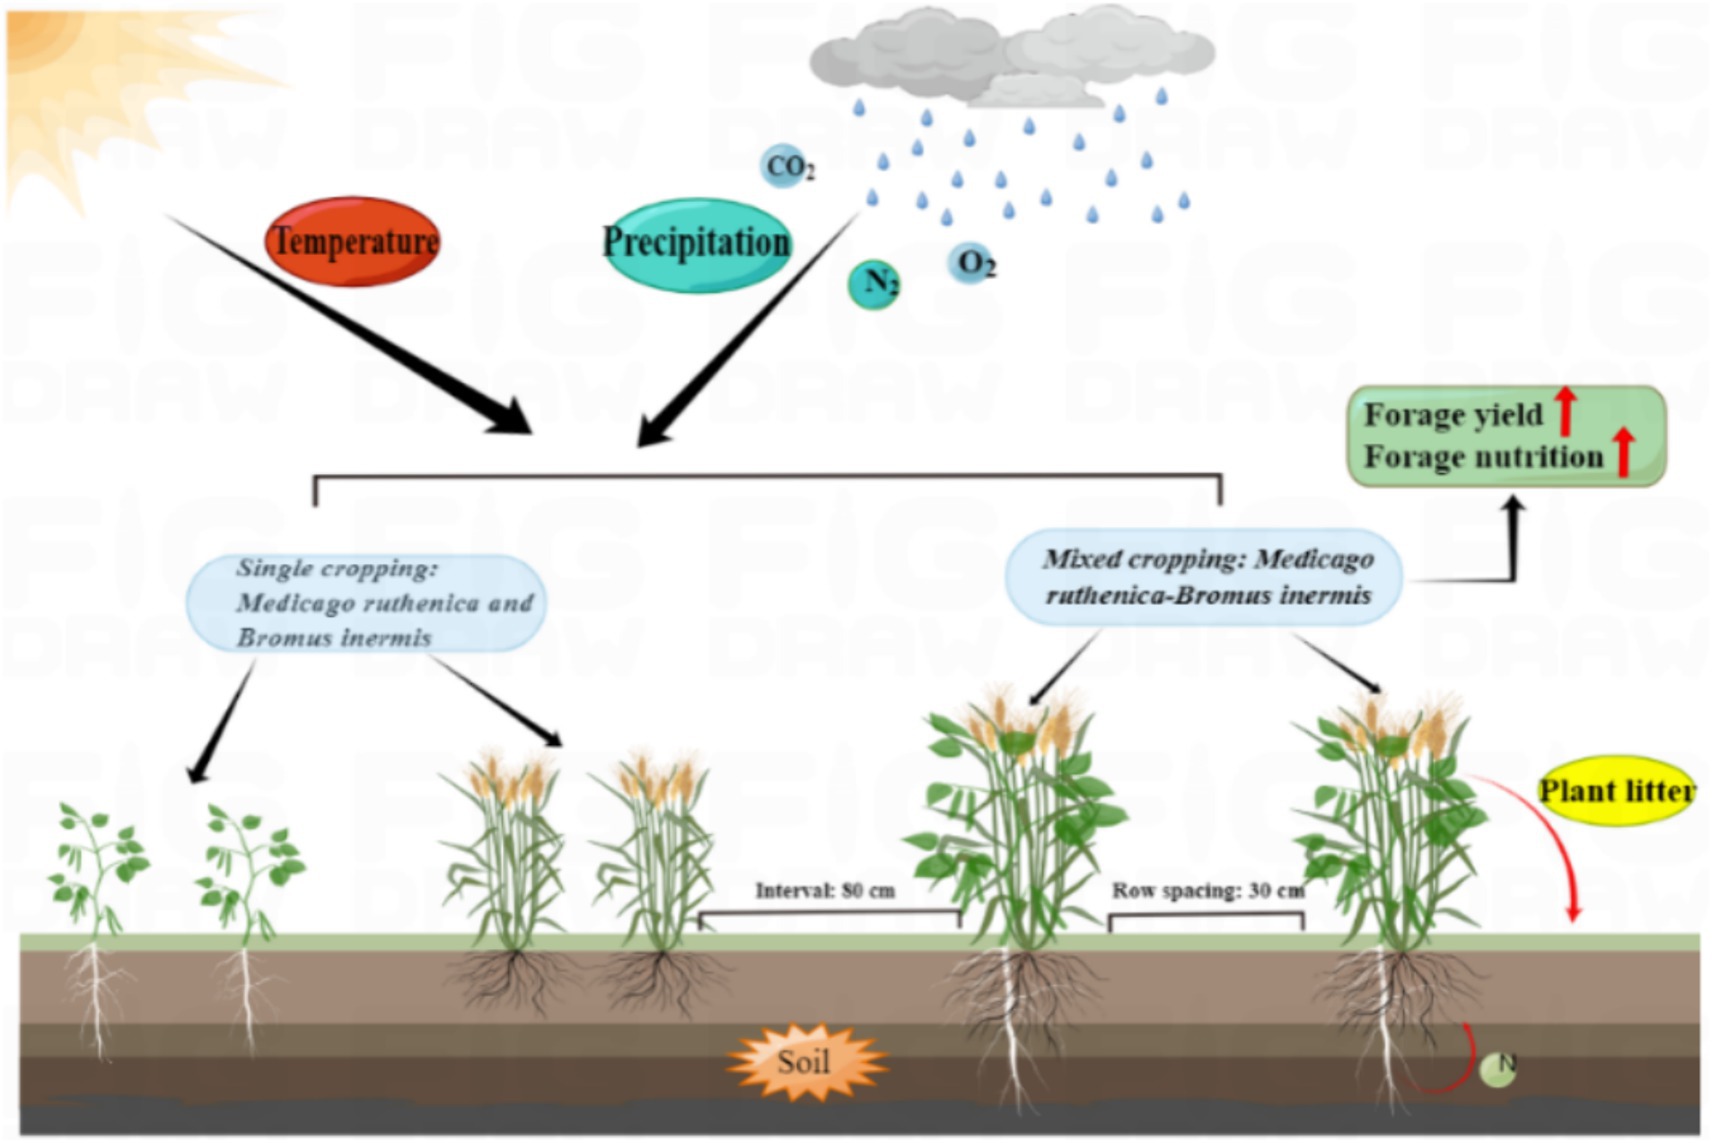
The experiment utilized a randomized complete block design. Seven different ratios of M. ruthenica and B. inermis mixed cropping were tested (2:8, 3:7, 4:6, 5:5, 6:4, 7:3, 8:2), with monocultures of M. ruthenica and B. inermis serving as control groups. The theoretical seeding rates were 12 kg·hm−2 for M. ruthenica and 30 kg·hm−2 for B. inermis. Actual seeding rates were adjusted based on seed value (Seed value of sowing material = Purity × Germination rate × 100%). Seeding rates for mixed cropping were set at 20, 30, 40, 50, 60, 70, and 80% of the actual monoculture seeding rates (Table 1). The experiment comprised nine treatments with three replicates each, totaling 27 plots. Each plot had an area of 15 m2 (3 m × 5 m). In August 2021, considering local arid conditions, soil fertility, and the impact of weed invasion on forage crop competition and growth, autumn sowing (late August) was adopted. Prior to sowing, each plot received a basal application of bagged organic fertilizer at 300 g·m−2 (organic matter ≥45%). The seeds of M. ruthenica and B. inermis for each treatment were then mixed and sown in rows with finely mixed soil (mass ratio 1:15). Seeds were sown at a depth of 2–3 cm, lightly covered with soil, with row spacing of 30 cm and plot spacing of 80 cm. No additional fertilizer was applied, and no irrigation was provided. Plants were grown under natural conditions. Field management included timely interventions after seedling emergence and manual weed removal throughout the growing season. The study’s schematic diagram is shown in Figure 3.
2.3 Sampling and measurement methods
2.3.1 Forage yield
Forage yield was measured at two key growth stages in 2022 and 2023, using legumes as a reference. Observations were made on August 3 and September 16, 2022, and on June 29 and August 13, 2023. These assessment periods corresponded to the beginning-flower and podding stages of M. ruthenica. A 1-meter sample segment was randomly selected from each plot (excluding edge rows and gaps) and cut at ground level with a sickle, leaving a 5 cm stubble. Each treatment included three replicates. The fresh weights of M. ruthenica and B. inermis were recorded after manual separation. Samples were transported to the laboratory, then oven-dried to a constant weight at 65°C after initial drying at 105°C for 30 min. The dry weights were recorded and converted to mixed forage yield per hectare.
2.3.2 Forage nutritional quality
The samples brought from the experimental fields were dried and ground (passed through a 0.25 mm sieve) to determine the nutritional components. Crude protein (CP) was determined using the Kjeldahl method (Bao, 2000). Ether extract (EE) was determined using a FOSS automatic fat analyzer. Acid detergent fiber (ADF) and neutral detergent fiber (NDF) were determined using the method of Goering and Van Soest (1970). Soluble sugar (SS) and starch were determined using the anthrone colorimetric method (Hewitt, 1958). Relative feed value (RFV) = (120/NDF) × (88.9 − 0.779 × ADF)/1.29. Dry matter digestibility (DMD) = 88.9 − 0.779 × ADF (Lithourgidis et al., 2006).
2.3.3 Interspecific competition pattern
2.3.3.1 Relative yield
RY can reflect the competitive advantage of each species in the mixed cropping system.
In the equation, RYB and RYW, respectively, represent the relative yield of M. ruthenica and B. inermis, YHB and YHW, respectively, represent the dry hay yield of M. ruthenica and B. inermis under mixed planting, ZB and ZW represent the proportions of M. ruthenica and B. inermis in the mixed cropping system, YDB and YDW, respectively, represent the dry hay yield of M. ruthenica and B. inermis in monoculture. When 0 < RYB < 1 and 0 < RYW < 1, both M. ruthenica and B. inermis growth are inhibited; when RYB > 1 and RYW > 1, both M. ruthenica and B. inermis benefit; when 0 < RYB < 1 and RYW > 1, B. inermis has a competitive advantage; conversely, M. ruthenica has a competitive advantage. The relationship model of competition between M. ruthenica and B. inermis is depicted in Figure 4, where the forage yield used is the dry hay yield per unit area (Williams and McCarthy, 2001; Caballero et al., 1995), as indicated.
2.3.3.2 Land equivalent ratio
LER reflects the efficiency of land utilization.
In the equation, LERB and LERW represent the land equivalent ratios of M. ruthenica and B. inermis in the mixed cropping system, respectively. When LER > 1, it indicates an advantage in yield for mixed cropping; when LER < 1, it indicates a disadvantage.
2.3.3.3 Aggressiveness
AG is a useful indicator for evaluating the dominant and subordinate species in a two-species mixed cropping system (Dhima et al., 2007).
In the equation, AGB and AGW represent the aggressiveness of M. ruthenica and B. inermis, respectively, in the mixed cropping system. Under the same mixed cropping ratio, when AGB > AGW, it indicates that M. ruthenica competes more strongly than B. inermis; if AGW > AGB, it indicates that B. inermis competes more strongly than M. ruthenica.
2.3.3.4 Competitive rate
CR can measure the interspecific competitiveness of mixed cropping species, evaluating the efficiency of forage resource utilization.
In the equation, CRB and CRW represent the competitive rates of M. ruthenica and B. inermis, respectively. When 0 < CRB < 1 and CRW > 1, it indicates that B. inermis has a competitive advantage; conversely, when CRB < 1 and 0 < CRW < 1, it suggests that M. ruthenica has a competitive advantage (Williams and McCarthy, 2001).
2.4 Statistical analysis
Data processing and analysis were performed using Microsoft Office 2021 and IBM SPSS Statistics 26.0. One-way analysis of variance (ANOVA) with Duncan’s post hoc test was employed for multiple comparisons, with statistical significance set at p < 0.05. Data in figures and tables are presented as “Mean ± standard error.” OriginPro 2022 and R 4.3.1 software were used for data analysis and graphing.
Correlation analysis was performed using the Correlation Plot add-on in OriginPro 2022 software. The matrix data was first imported into the software, with the Correlation Type set to Pearson and the Method set to Color, where red indicates positive correlation and blue indicates negative correlation. The Layout was set to Full, the Label to Significant Mark, and the significance level to 0.05. Finally, the graph was exported.
Principal component analysis was performed using the Principal Component Analysis add-on in OriginPro 2022 software. The organized data was first imported into the software, with the Input Data set to the relevant data columns, Observations and Group designated as data labels, and Plots selected as 2D graphs. All other settings were left at their default values, and the graph was exported.
Linear regression analysis was performed using the Graph Maker add-on in OriginPro 2022 software. Initially, the organized X and Y data columns were imported into the software. After opening Graph Maker, the two data columns were dragged into it. The fitting option was selected, and the formula and R-squared display options were enabled. The confidence and prediction bands were enabled, with the confidence level set to 95%. Finally, the graph was exported.
The comprehensive evaluation is conducted using the TOPSIS model (Hwang and Yoon, 1981). In this study, a comprehensive evaluation model is established for different mixed cropping treatments and measured indicators. Yield and quality indicators (CP, EE, NDF, ADF, SS, Starch, RFV, and DMD) are selected for comprehensive evaluation. The process involves constructing the original evaluation matrix, standardizing the original matrix, determining the weights, calculating the distance from each treatment to the positive ideal solution and the negative ideal solution using Euclidean distance, and finally calculating the fitness degree. The main formulas are as follows:
The original matrix is standardized to obtain the normalized matrix:
The indicators are divided into positive and negative indicators:
In the weight calculation formula for , represents the difference coefficient; which is calculated by determining the contribution degree of the i-th treatment under the j-th index: and the entropy value of the j-th index: , and then obtained; the difference coefficient: .
Calculating distance:
Arrange in order to obtain the ranking of the fitness degree of each treatment, where the fitness degree ranges from 0 to 1, with a higher value indicating better performance.
3 Results
3.1 Forage yield in field experiments
Compared to monoculture, mixed cropping significantly increases yield, with this advantage becoming more pronounced as the growth period progresses. During the beginning-flower stage of forage in 2022, the forage yield of treatments B3W7, B4W6, B5W5, B6W4, and B7W3 significantly increased compared to CK2 (p < 0.05), ranging from 53.48 to 94.18%. During the podding stage, the forage yield of all mixed cropping treatments significantly increased compared to CK2 (p < 0.05), ranging from 40.89 to 70.88%. Treatments B3W7 and B7W3 significantly increased forage yield compared to CK1 (p < 0.05), by 38.22 and 34.40%, respectively. Overall, forage yield in 2022 increased with the growth period, and yield under mixed cropping was significantly higher than in respective monoculture treatments (Figure 5A). During the beginning-flower stage of forage in 2023, treatments B6W4 and B7W3 significantly increased forage yield compared to monoculture (p < 0.05), by 56.79 and 51.21% compared to CK1, and 181.98 and 171.97% compared to CK2, respectively. During the podding stage, all mixed cropping treatments significantly increased forage yields compared to monoculture (p < 0.05), by 44.06 to 85.82% compared to CK1, and 131.91 to 199.13% compared to CK2 (Figure 5B). Overall, forage yield in 2023 increased compared to 2022, but yield under mixed cropping in both years was higher than under monoculture (Figure 5).
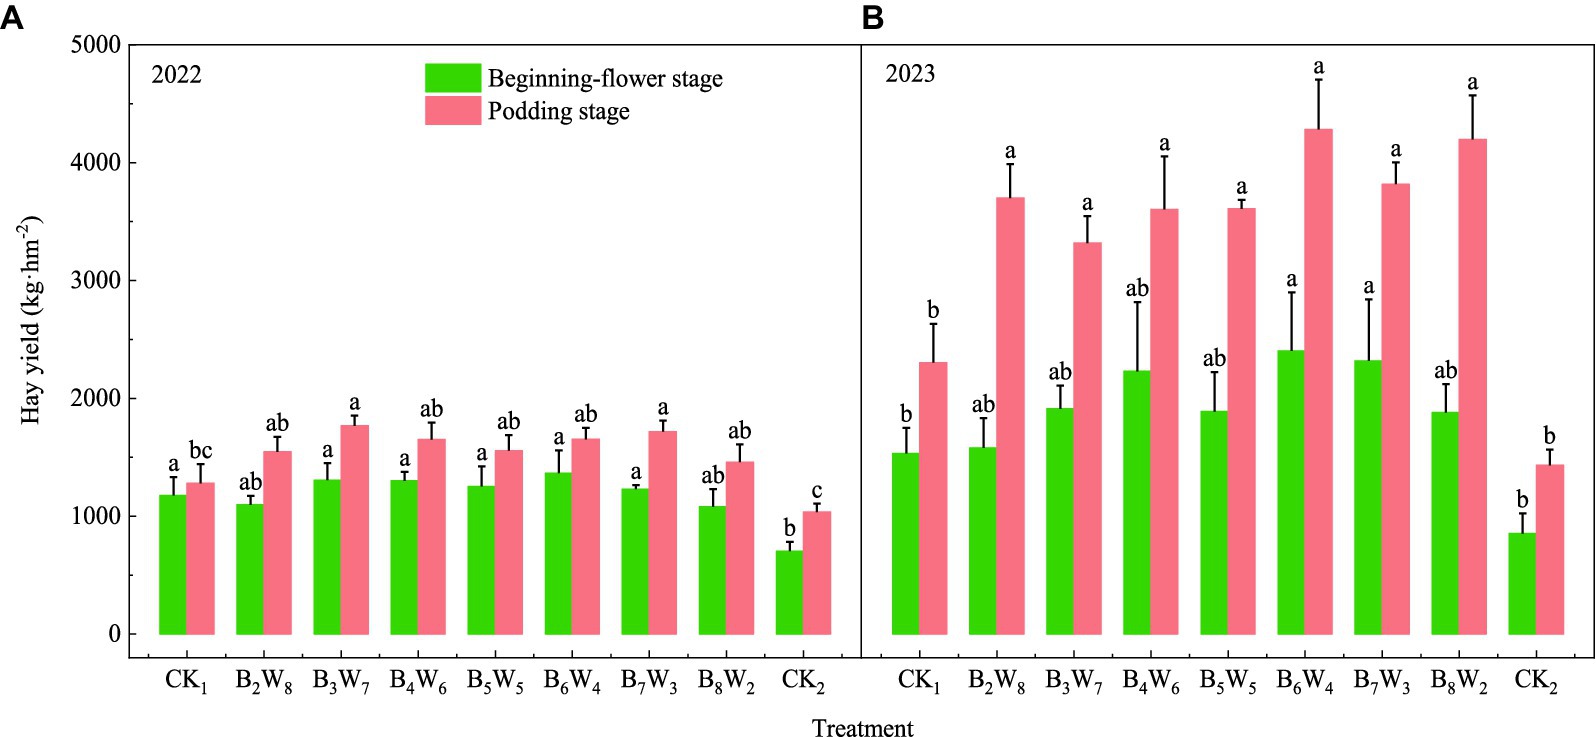
Figure 5. Forage yield under different ratios of M. ruthenica-B. inermis mixed cropping. Different lowercase letters indicate significant differences among the 9 treatments within the same year and growth period at the 0.05 level (p < 0.05), and no significant analysis is performed across different years, and the same applies below. (A, B) represent the forage yields of each treatment in 2022 and 2023, respectively.
3.2 Forage nutritive quality in field experiments
Mixed cropping effectively enhanced the nutritional quality and feeding value of forage crops by increasing crude protein, ether extract, soluble sugar, and starch content, while reducing neutral and acid detergent fiber levels. The relative feed value and dry matter digestibility of the forage were also effectively improved. Nutritional value improvements varied among different mixed cropping ratios (Figures 6, 7).
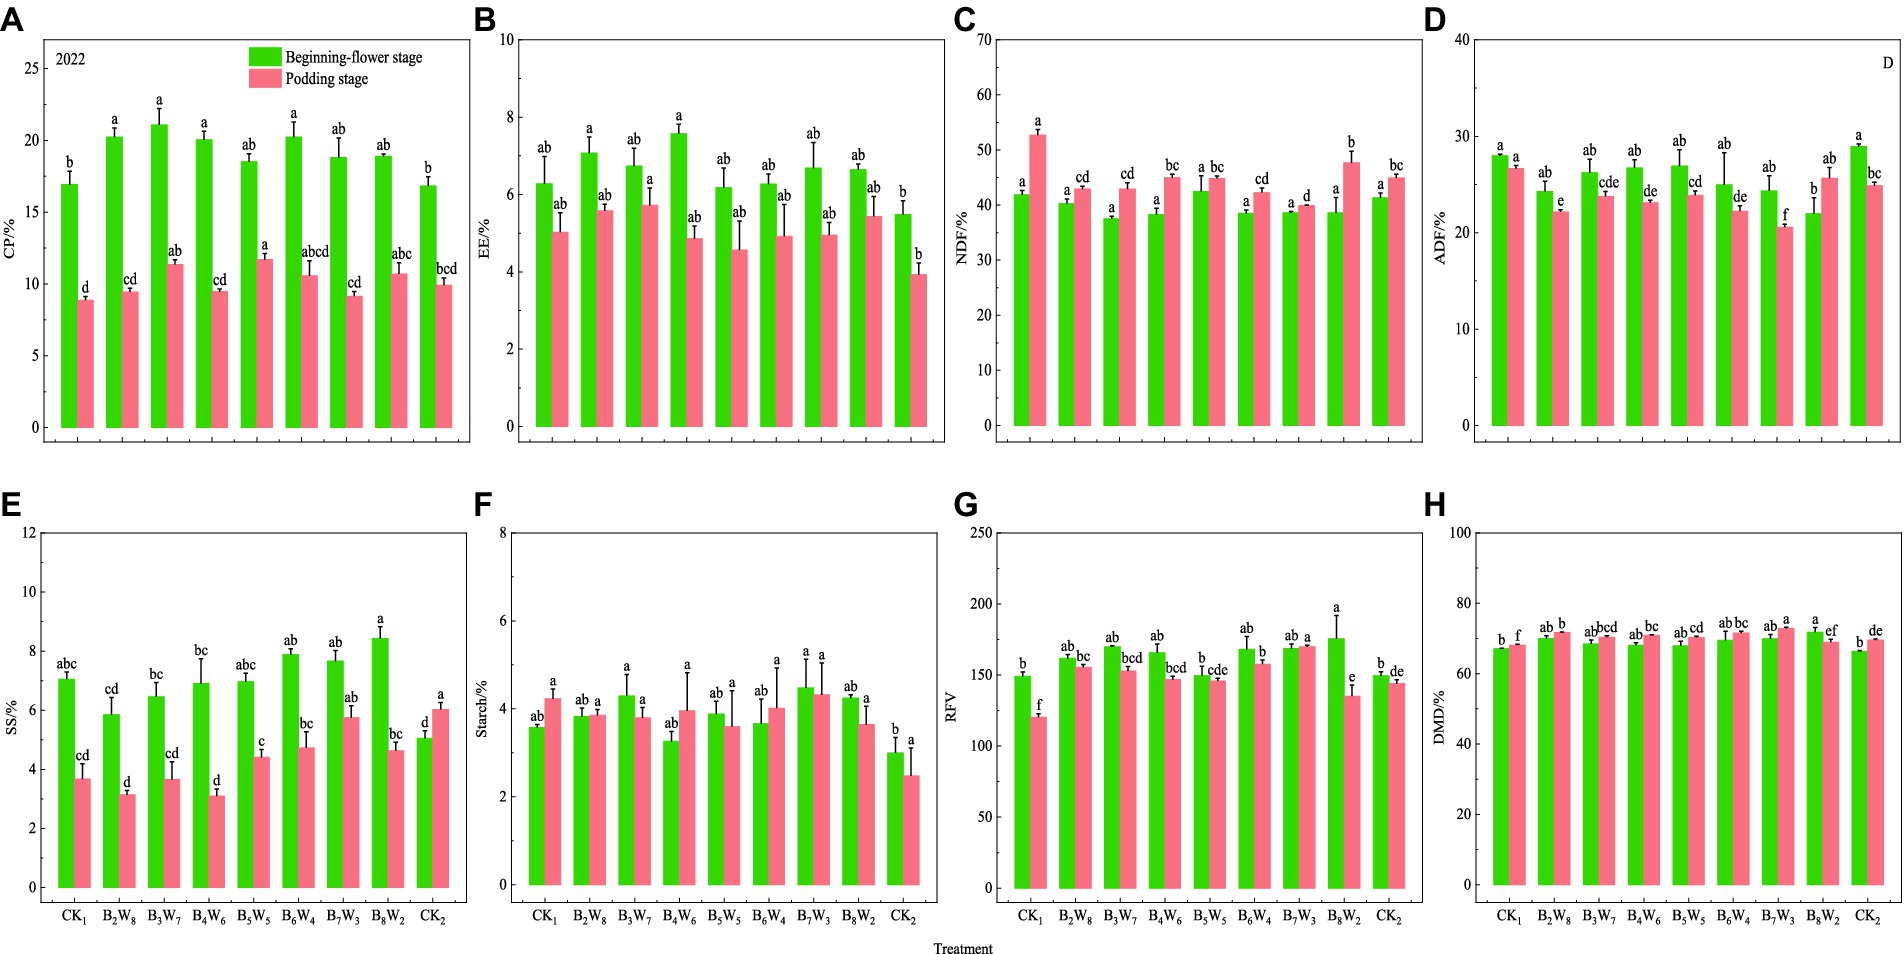
Figure 6. Forage quality under mixed cropping of different proportions of M. ruthenica and B. inermis in 2022. Different lowercase letters indicate significant differences among the 9 treatments within the same year and growth period at the 0.05 level (p < 0.05). (A–H) represent the crude protein content, ether extract content, neutral detergent fiber, acidic detergent fiber, soluble sugar, starch, relative feeding value, and dry matter digestibility of each treatment in 2022.
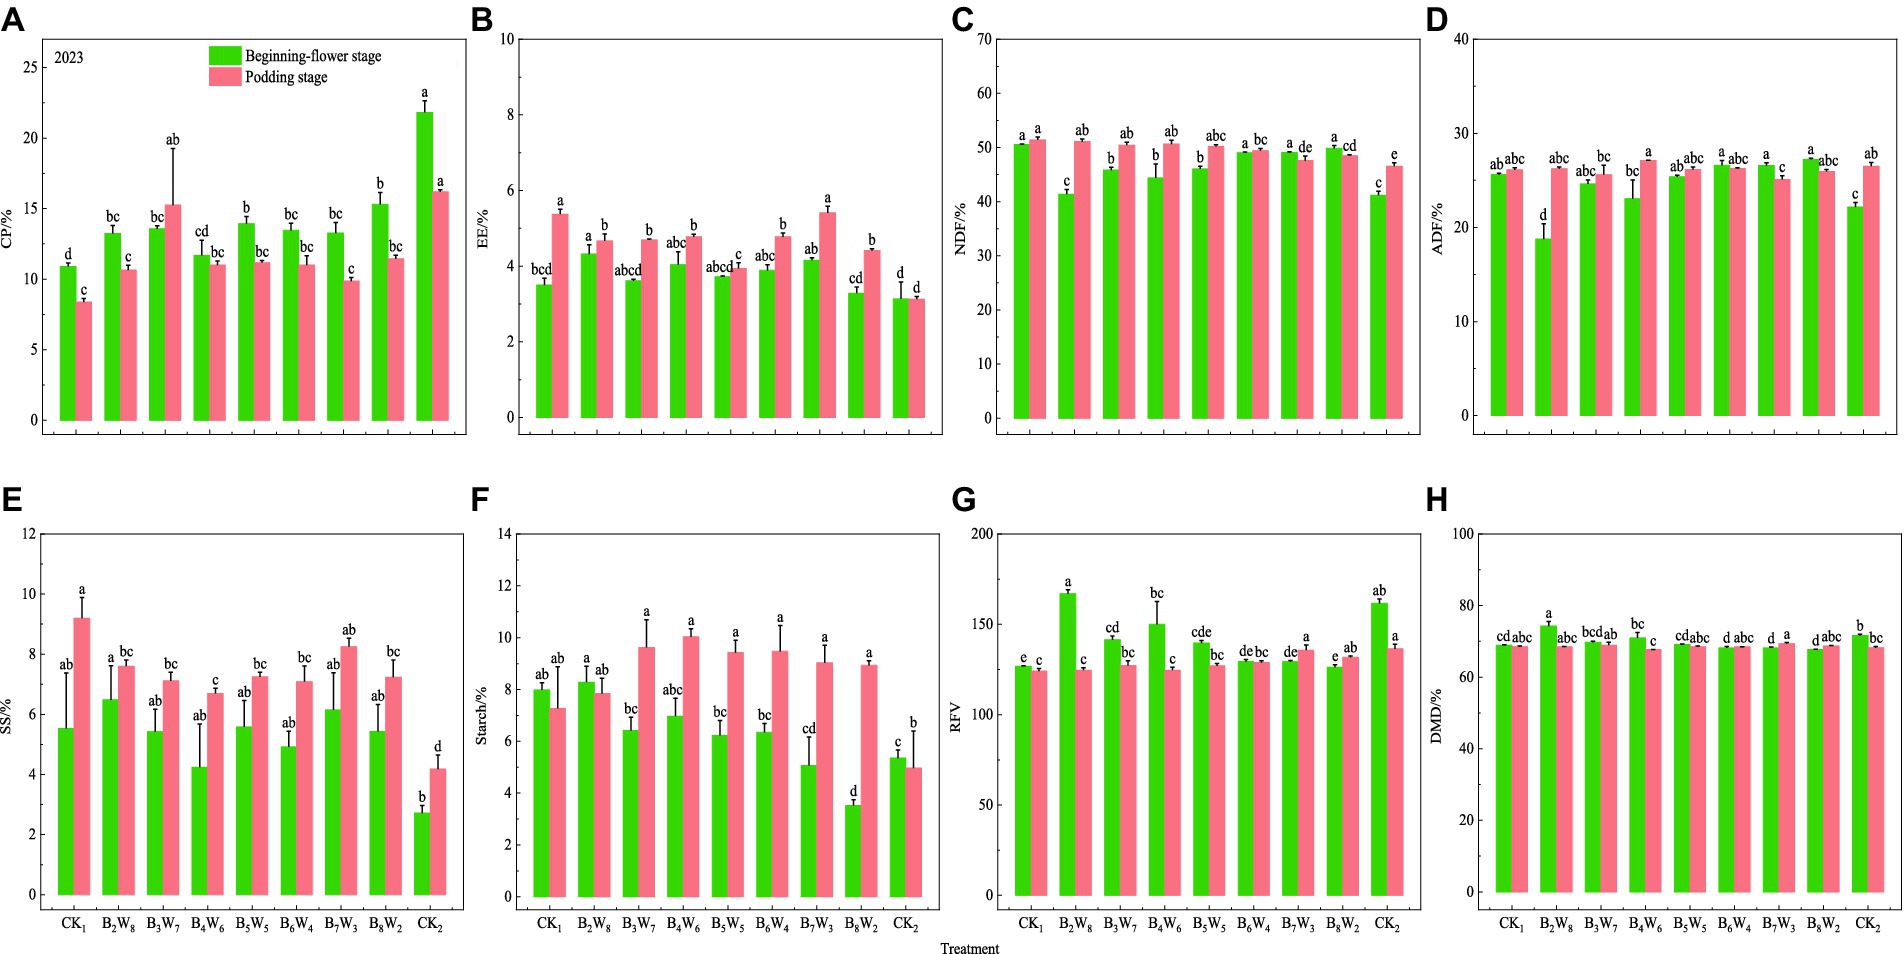
Figure 7. Forage quality under mixed cropping of different proportions of M. ruthenica and B. inermis in 2023. Different lowercase letters indicate significant differences among the 9 treatments within the same year and growth period at the 0.05 level (p < 0.05). (A–H) represent the crude protein content, ether extract content, neutral detergent fiber, acidic detergent fiber, soluble sugar, starch, relative feeding value, and dry matter digestibility of each treatment in 2023.
During the beginning-flower stage of forage in 2022, treatments B2W8, B3W7, B4W6, and B6W4 significantly increased crude protein content compared to monoculture (p < 0.05), with increases of 18.44 to 24.50% compared to CK1 and 19.12 to 25.22% compared to CK2. During the podding stage, treatment B5W5 significantly increased crude protein content compared to monoculture (p < 0.05), by 31.86% compared to CK1 and 17.98% compared to CK2 (Figure 6A).
During the beginning-flower stage, ether extract content was higher in treatments B2W8 and B4W6, with significant increases compared to CK2 (p < 0.05), by 12.70 and 20.72%, respectively. During the podding stage, treatment B3W7 significantly increased ether extract content compared to CK2 (p < 0.05), by 45.67% (Figure 6B).
During the beginning-flower stage, neutral detergent fiber content slightly decreased in the mixed cropping treatments compared to monoculture, but not significantly. During the podding stage, all mixed cropping treatments significantly reduced neutral detergent fiber content compared to CK1 (p < 0.05), by 10.56 to 32.12% (Figure 6C).
During the beginning-flower stage, acid detergent fiber content in treatment B8W2 was significantly lower than in both CK1 and CK2 (p < 0.05), by 27.39 and 31.77%, respectively. During the podding stage, all mixed cropping treatments significantly decreased acid detergent fiber content compared to CK1, by 3.94 to 29.69% (Figure 6D).
During the beginning-flower stage, treatment B8W2 significantly increased soluble sugar content compared to CK2 (p < 0.05), by 19.60% (Figure 6E).
During the beginning-flower stage, treatment B7W3 significantly increased starch content compared to CK2 (p < 0.05), by 25.17%. During the podding stage, starch content did not differ significantly among the treatments (Figure 6F).
In treatment B8W2, relative feed value and dry matter digestibility during the beginning-flower stage were significantly higher compared to monoculture (p < 0.05), with increases of 17.67 and 6.98% compared to CK1, and 17.40 and 8.19% compared to CK2, respectively (Figures 6G,H).
During the beginning-flower stage of 2023, the crude protein content in mixed cropping treatments B2W8, B3W7, B5W5, B6W4, B7W3, and B8W2 significantly increased compared to CK1 (p < 0.05), with increases ranging from 7.15 to 40.29%. The crude protein content in the M. ruthenica monoculture treatment remained relatively high during both the beginning-flower and podding stages, at 21.82 and 16.19%, respectively (Figure 7A).
During both the beginning-flower and podding stages, the ether extract content in mixed cropping treatment B7W3 significantly increased compared to CK2 (p < 0.05), by 32.66 and 73.21%, respectively (Figure 7B).
During the beginning-flower stage, the neutral detergent fiber and acid detergent fiber contents in mixed cropping treatment B2W8 were significantly lower than in CK1 (p < 0.05), by 22.19 and 36.57%, respectively. During the podding stage, the neutral detergent fiber and acid detergent fiber contents in mixed cropping treatment B7W3 were significantly lower than in CK1, by 8.01 and 4.04%, respectively (Figures 7C,D).
During the beginning-flower stage, the soluble sugar and starch contents in mixed cropping treatment B2W8 were significantly higher than in CK2 (p < 0.05), by 17.30 and 3.76%, respectively. During the podding stage, the soluble sugar and starch contents in all mixed cropping treatments were significantly higher than in CK2 (p < 0.05), with increases ranging from 60.29 to 97.37% and 57.64 to 101.74%, respectively (Figures 7E,F).
During the beginning-flower stage, the relative feed value and dry matter digestibility in mixed cropping treatment B2W8 were significantly higher than in CK1 (p < 0.05), by 31.70 and 7.75%, respectively. During the podding stage, the relative feed value of mixed cropping treatment B7W3 was significantly higher than in CK1 (p < 0.05), by 9.31%, and the dry matter digestibility was significantly higher than in CK2 (p < 0.05), by 1.59% (Figures 7G,H).
3.3 Interspecific competition and mixed cropping advantage
3.3.1 Relative yield
During the beginning-flower stage of 2022, both crops benefited from mixed cropping treatments B3W7 and B4W6. During the podding stage, both crops benefited from mixed cropping treatments B2W8, B3W7, B4W6, and B5W5. For treatments B6W4, B7W3, and B8W2, B. inermis was more competitive than M. ruthenica during both the beginning-flower and podding stages. During the beginning-flower and podding stages of 2023, both crops benefited from each mixed cropping treatment, and the advantage of mixed cropping was evident (Figure 8). The required result is calculated using formulas (1), (2)
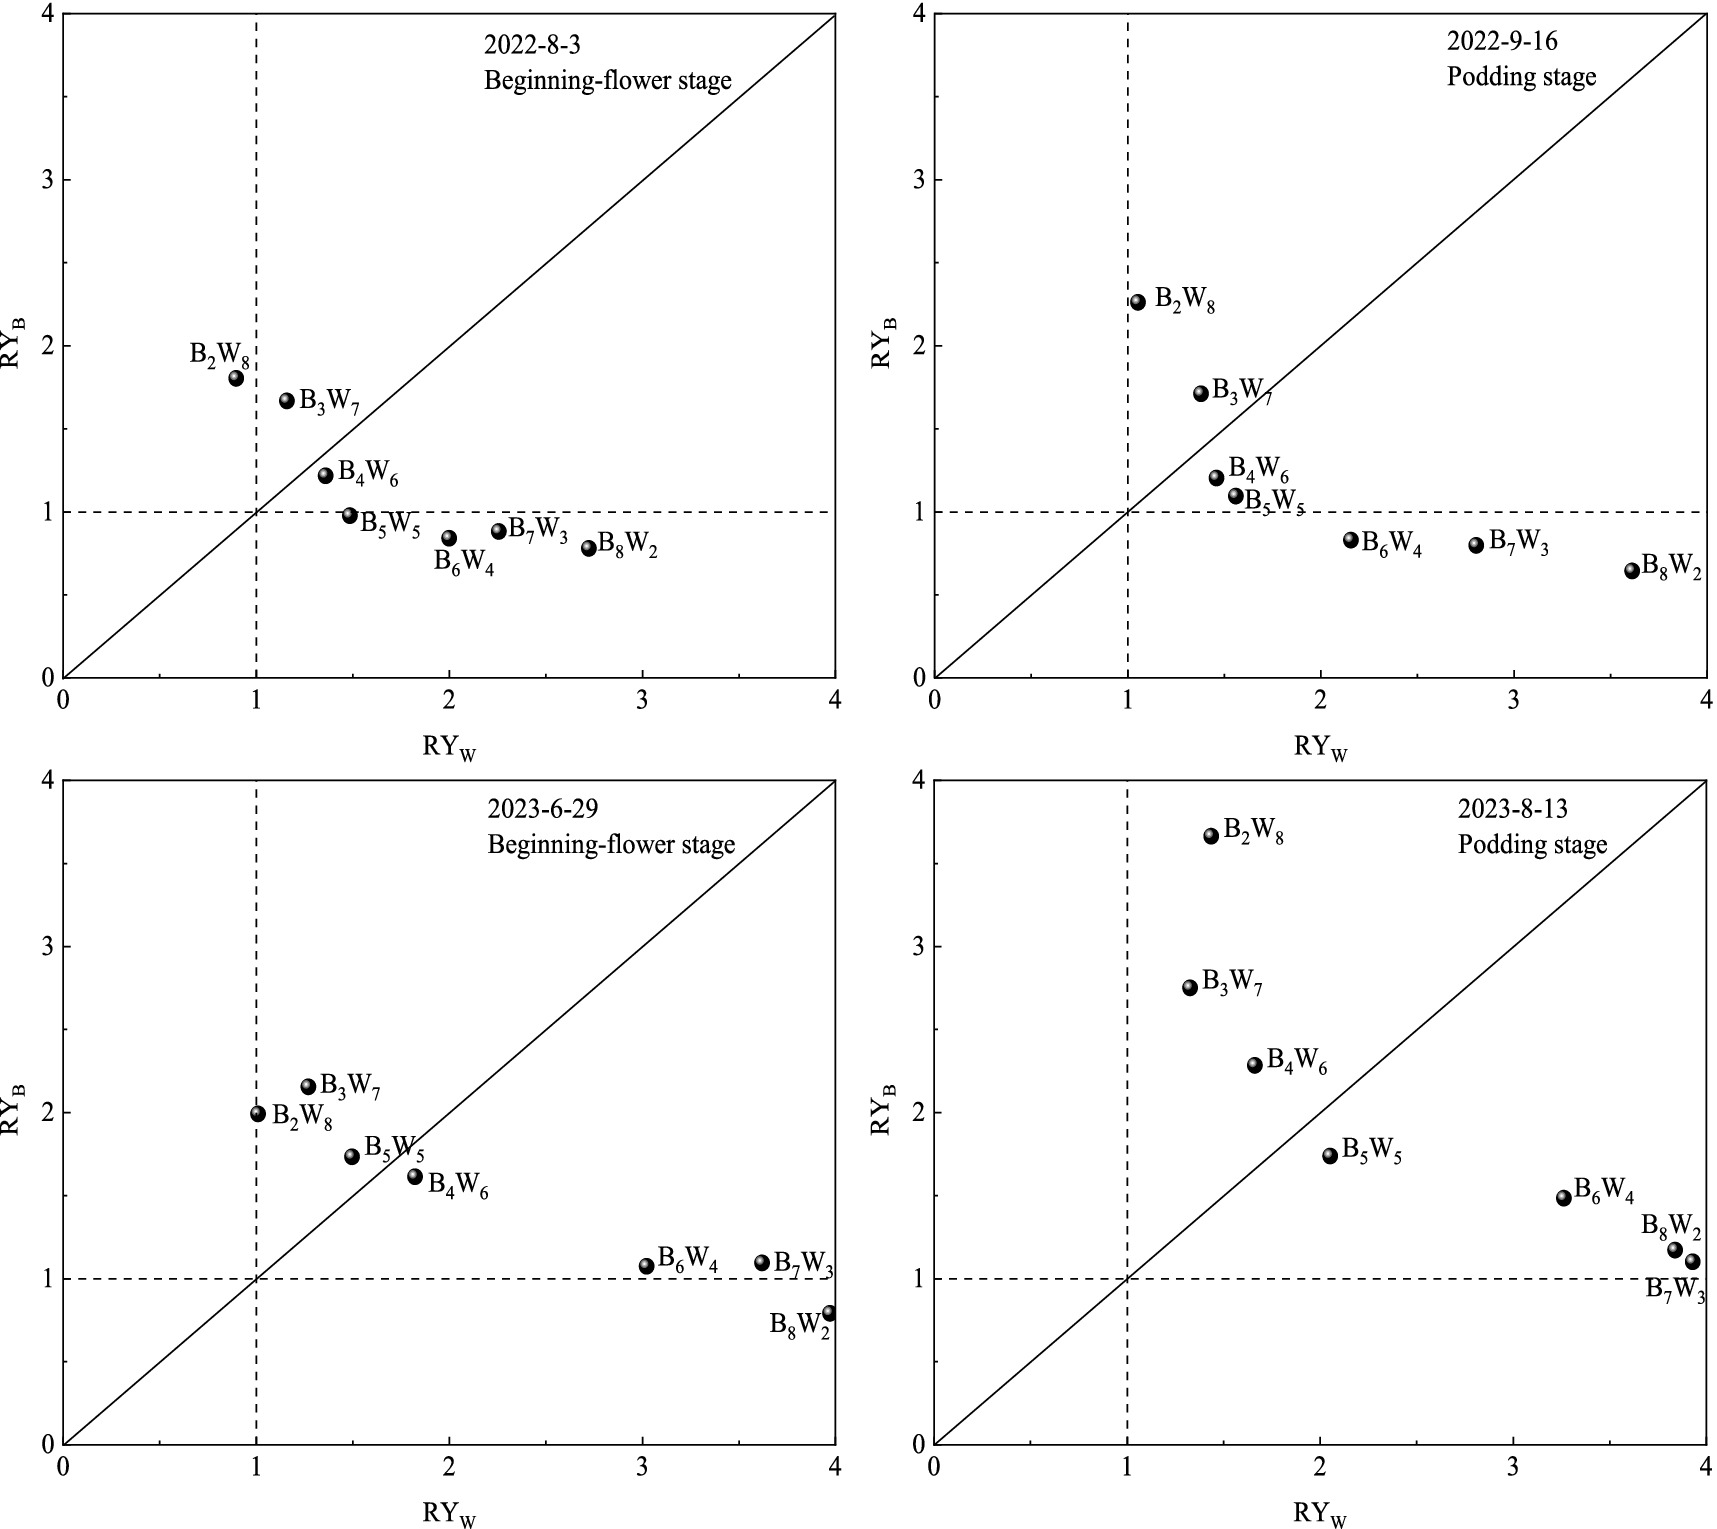
Figure 8. Competitive relationship of mixed cropping of M. ruthenica and B. inermis in different proportions. The data used in the figure represents the relative yield values calculated based on the dry matter yield per unit area of each plant species in the mixed cropping treatment.
3.3.2 Land equivalent ratio, competition rate, and aggressiveness under mixed cropping conditions
As shown in Table 2, the Land Equivalent Ratios (LER) for both 2022 and 2023 exceeded 1, indicating yield advantages of mixed cropping. Furthermore, the LER for all treatments in 2023 was generally higher than in 2022. Specifically, treatments B6W4 and B8W2 showed higher LER values during the podding stage in 2023, at 2.19 and 2.18, respectively. At the same mixed cropping ratio, the competition rate between the two crops exhibited an inverse relationship. Table 2 shows that when the legume ratio was between 20 and 30%, the competition rate of M. ruthenica was high. When the legume ratio was approximately 40%, the competition rate between the two crops was closest, indicating a competitive equilibrium. However, when the legume ratio ranged from 50 to 80%, the competition rate of B. inermis was high. In mixed cropping systems, as the legume ratio increases, the aggressiveness of M. ruthenica gradually decreases, while that of B. inermis gradually increases. In mixed cropping combinations with legume ratios of 20 to 40%, M. ruthenica is more aggressive than B. inermis, and this trend intensifies with growth stages. Conversely, in mixed cropping combinations with legume ratios of 50 to 80%, B. inermis is more aggressive than M. ruthenica, with this trend also intensifying with growth stages. Overall, in mixed cropping systems, M. ruthenica shows greater competitiveness at lower legume ratios, whereas B. inermis shows greater competitiveness at higher legume ratios. The required results in Table 2 are calculated using formulas (3)–(10).
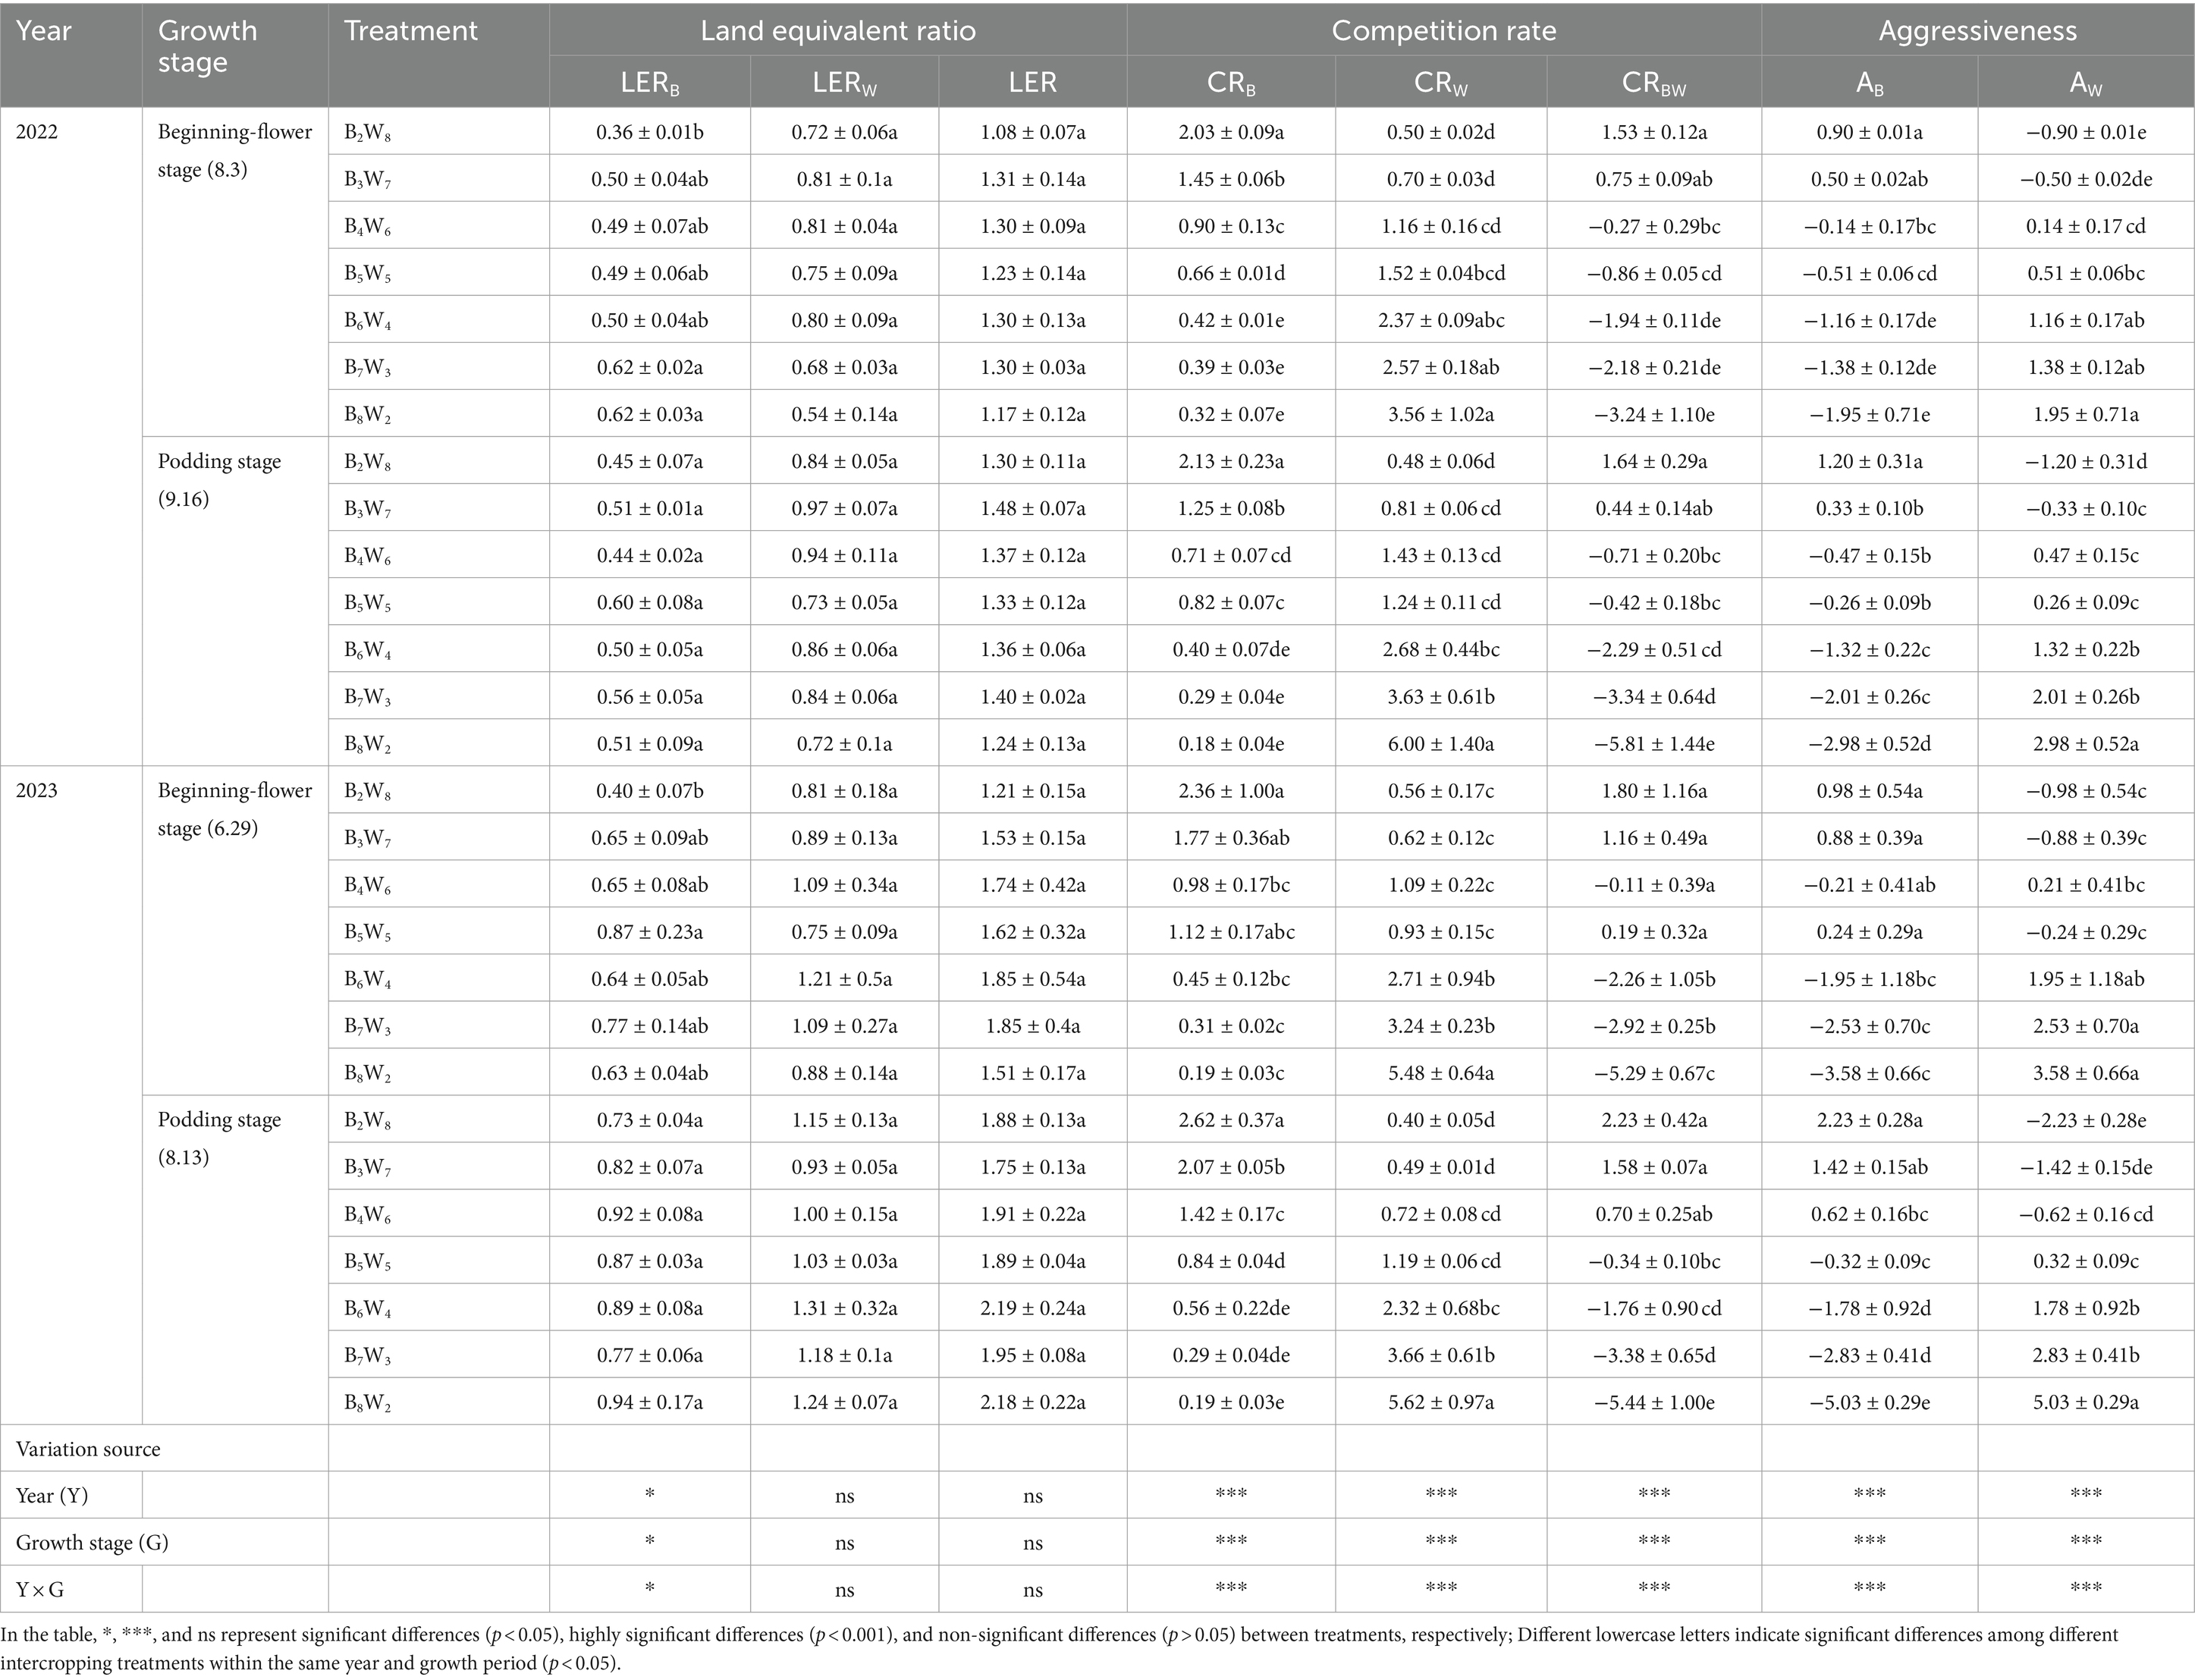
Table 2. Land equivalent ratios, competition rate, and aggressiveness under mixed cropping conditions from 2022 to 2023.
3.4 Interrelationship between forage yield, nutrient quality, and interspecies competition under mixed cropping conditions
3.4.1 Correlation analysis
The correlation heatmap (Figure 9) shows that in 2022, forage yield was significantly positively correlated with crude protein, ether extract, starch, and land equivalent ratio (p < 0.05). Additionally, neutral detergent fiber and acid detergent fiber were significantly negatively correlated with relative feed value and dry matter digestibility (p < 0.05). Crude protein also showed a significant positive correlation with the land equivalent ratio (p < 0.05, Figure 9A). In 2023, forage yield was significantly positively correlated with the land equivalent ratio (p < 0.05). Neutral detergent fiber and acid detergent fiber were significantly negatively correlated with relative feed value and dry matter digestibility (p < 0.05). Ether extract showed a significant positive correlation with soluble sugar and starch (p < 0.05). Crude protein was significantly negatively correlated with neutral detergent fiber (p < 0.05). Lastly, the competition rate was significantly positively correlated with dry matter digestibility and significantly negatively correlated with acid detergent fiber (p < 0.05; Figure 9B).
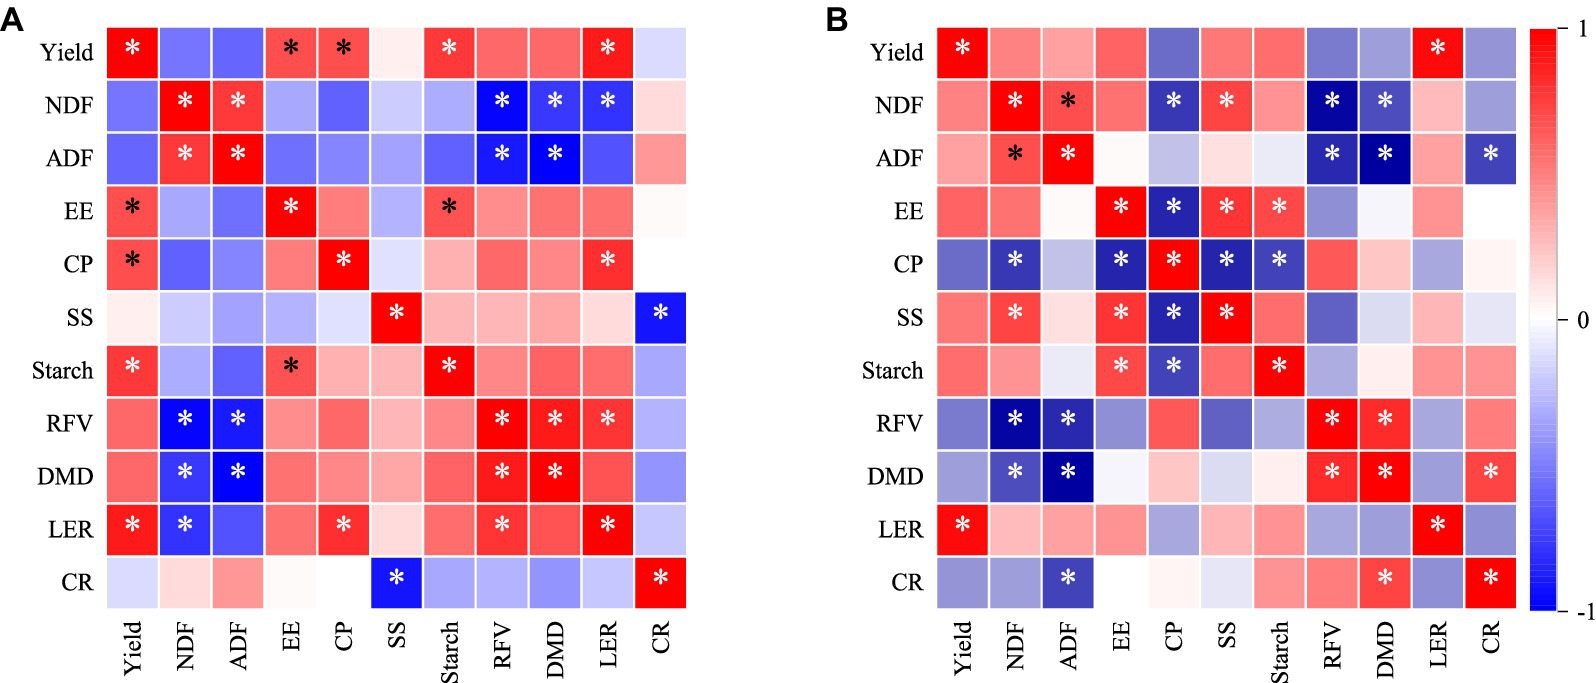
Figure 9. Correlation analysis of forage yield, nutritional quality, and interspecific competition in the mixed cropping system of M. ruthenica and B. inermis. In the figure, *denotes statistical significance (p < 0.05). The figure shows correlation analyses for 2022 (A) and 2023 (B). Data in A represent the average of two measurements for each indicator in 2022, while data in B represent the average of two measurements for each indicator in 2023.
3.4.2 Principal component analysis (PCA)
Principal Component Analysis (PCA) is a multivariate statistical method used to examine correlations among multiple variables. As shown in Figure 10A, the variance contribution rate of PC1 is 57.4% and that of PC2 is 19.5%, with a cumulative contribution of 76.9%. Forage yield, land equivalent ratio, relative feeding value, dry matter digestibility, and starch have high positive loadings on PC1, while neutral detergent fiber and acid detergent fiber have high negative loadings on PC1. The mixed treatment B6W4 is closely positively associated with relative feeding value and dry matter digestibility. As shown in Figure 10B, PC1 accounts for 52.5% of the variance and PC2 for 26.5%, with a cumulative contribution of 79.0%. Forage yield and land equivalent ratio have high positive loadings on PC1, while relative feeding value has a high negative loading on PC2. Dry matter digestibility and competition rate exhibit high positive loadings on PC2. The mixed treatment B7W3 is closely positively related to forage yield, land equivalent ratio, and neutral detergent fiber. Overall, several indicators have high loadings on PC1 and can serve as primary indicators for assessing the mixing effect.
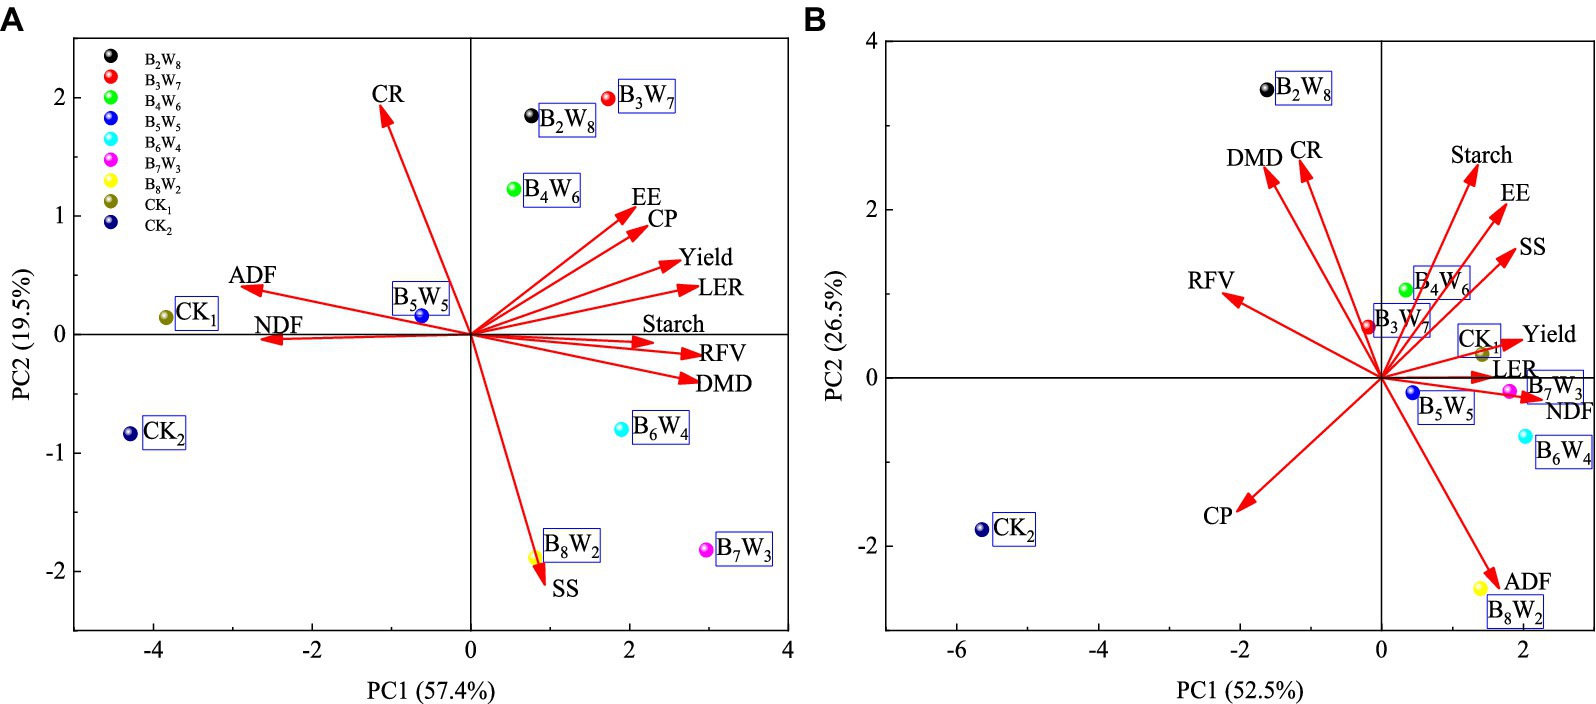
Figure 10. PCA of forage yield, nutritional quality, and interspecific competition in the mixed cropping system of M. ruthenica and B. inermis: The arrows in the figure represent indicators, and the colored dots represent different treatments; the figure represents the principal component analysis for 2022 (A) and for 2023 (B), respectively.
3.4.3 Linear fitting analysis
Linear fitting is a regression analysis method used to identify the linear relationship between input and output variables by constructing a linear model. As shown in Figure 11, a linear fitting model was developed to examine the relationship between legume proportion in a mixed cropping system and both mixed forage yield and nutritional quality. The legume proportion showed a significant positive correlation with both mixed forage yield and soluble sugar content (p < 0.05), indicating that higher legume proportions are linked to increased mixed forage yield and soluble sugar content. Soluble sugar content showed the greatest increase with rising legume proportion, achieving a maximum increment (y = 4.57991 + 0.0243x, R2 = 0.59485, p < 0.05). Similarly, mixed forage yield exhibited the highest increase with a rising legume proportion, with a maximum increment (y = 1765.35 + 7.50717x, R2 = 0.57849, p < 0.05). Legume proportion showed positive correlations with crude protein content, relative feeding value, and dry matter digestibility, and negative correlations with neutral detergent fiber, acid detergent fiber, ether extract, and starch content, though these correlations were not significant (p > 0.05). Multiple regression analysis indicated that legume proportion significantly contributed to the increase in mixed forage yield and soluble sugar content (R2 > 0.5, p < 0.05), while its impact on reducing neutral detergent fiber content was minimal (y = 46.4497–0.0260897, R2 = 0.001275, p > 0.05). Legume proportion can be considered the primary driving force behind the increase in mixed forage yield and soluble sugar content (Figure 11).
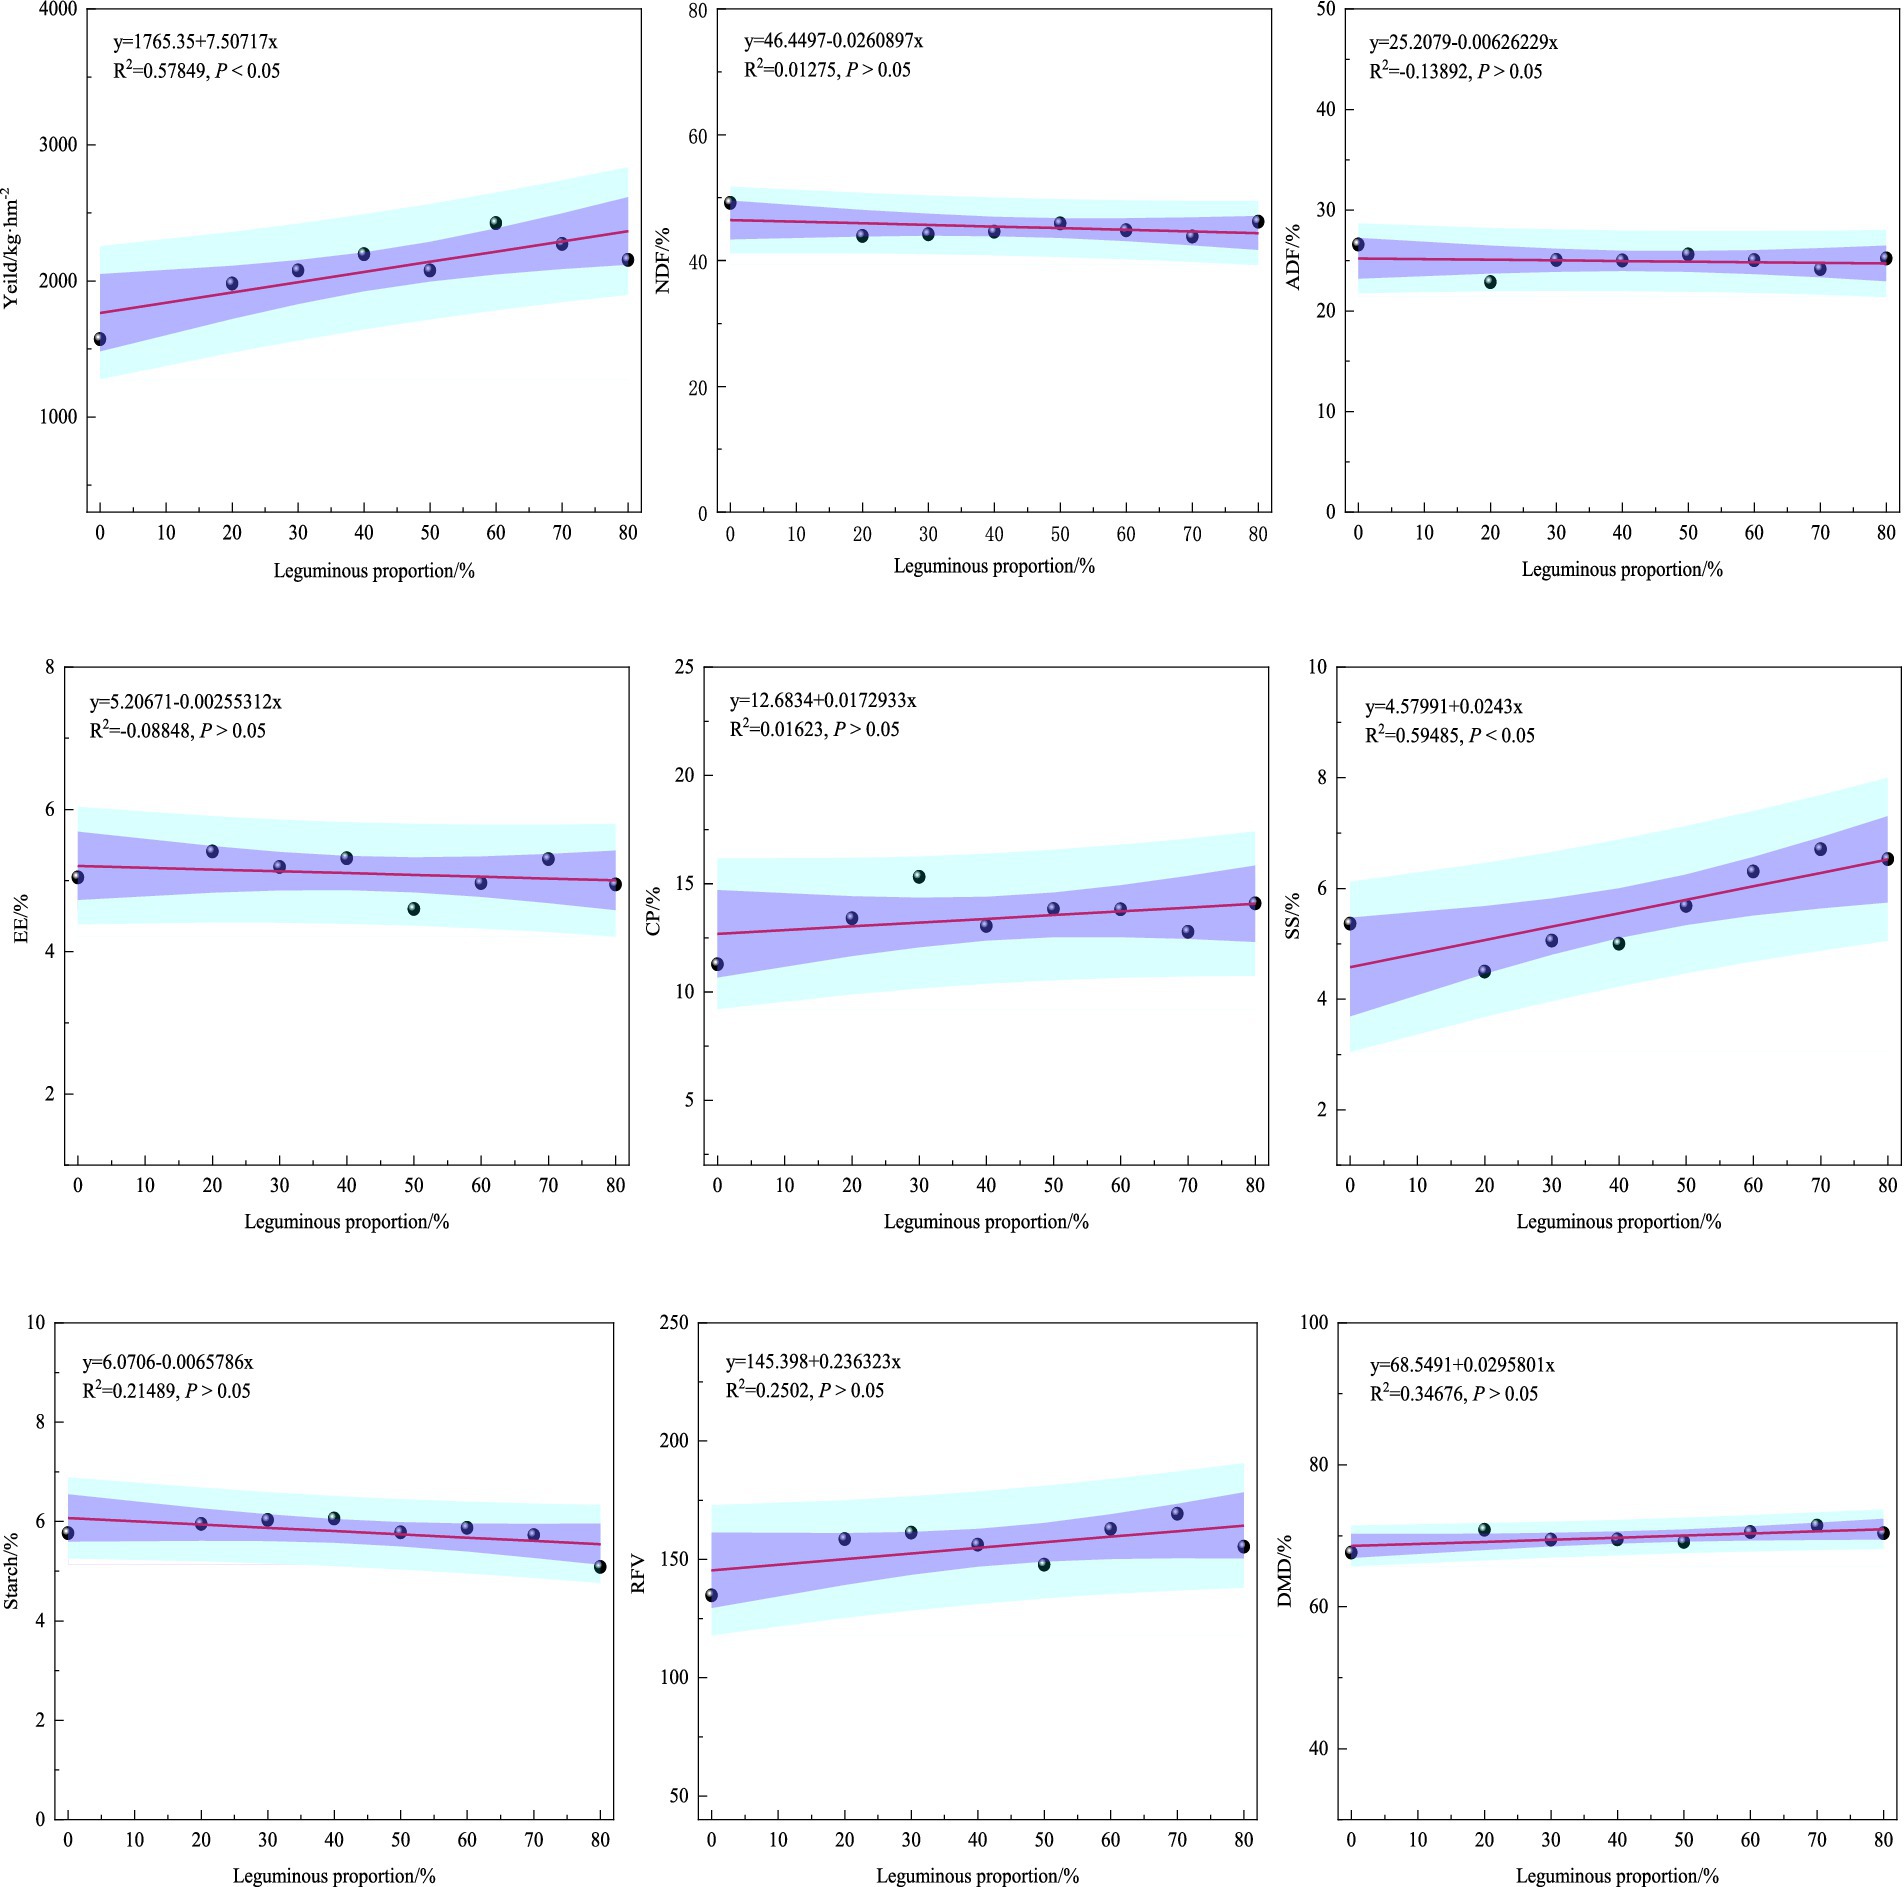
Figure 11. Linear fitting analysis of legume proportion and forage yield, nutritional quality in the mixed cropping system of M. ruthenica and B. inermis. The data used for the vertical axis in the figure is based on the average values of each indicator over two years.
3.5 Comprehensive evaluation
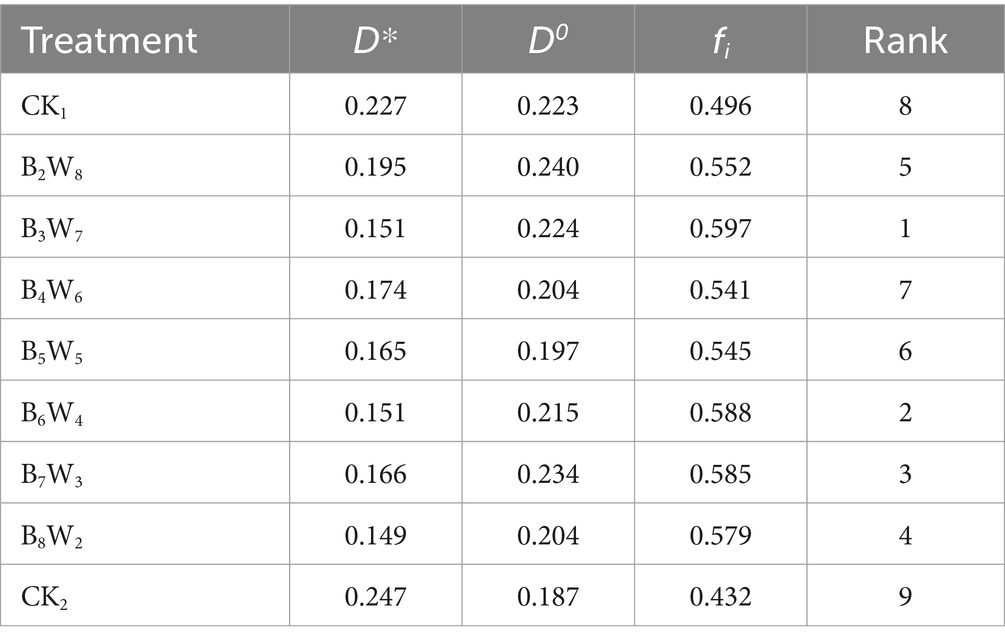
Comprehensive evaluation results indicate that treatment B3W7 has the highest relative fit degree (0.597). This suggests that the 3:7 mixed cropping ratio of M. ruthenica and B. inermis performs best in terms of yield and quality, demonstrating the optimal mixed cropping effect (Table 3). Subsequently, treatments B6W4 and B7W3 exhibit relative fit degrees of 0.588 and 0.585, respectively. The comprehensive scoring system results indicate that the 3:7 ratio of M. ruthenica and B. inermis is the preferred mixed cropping proportion (Figure 12). The required results in Table 3 are calculated using formulas (11)–(16).
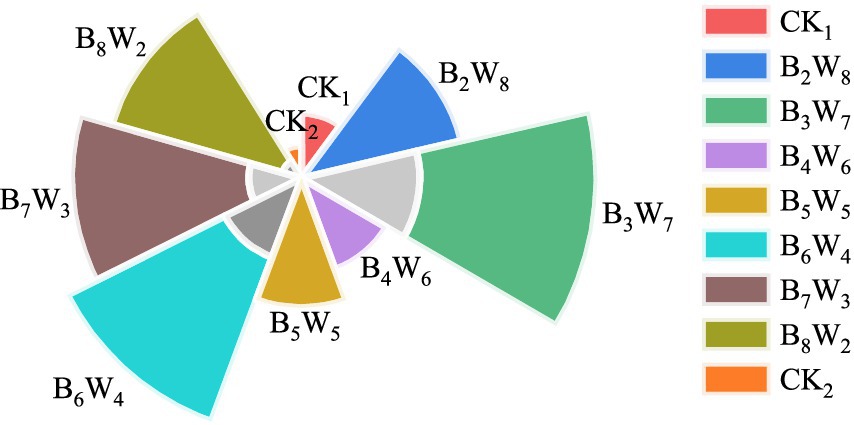
Figure 12. Comprehensive evaluation rose chart Note: The colors of the sectors represent different treatments, and the size of the area represents the ranking of scores for each treatment; for the comprehensive evaluation, we use the average values of data for each indicator over 2 years from different treatments.
4 Discussion
4.1 Positive response of forage yield and nutritional quality to mixed cropping
Forage yield and quality are key indicators for assessing the productivity of cultivated grasslands (Capstaff and Miller, 2018). The mixed cropping of legumes and cereals, practiced for centuries across various regions, is widely recognized for its superior yield benefits (Suyama et al., 2007; Akdeniz et al., 2019; Tahir et al., 2023; Ren et al., 2016). Recently, research on legume-cereal mixed cropping has been initiated in the Loess Plateau of northwestern China (Wang et al., 2021; Bo et al., 2022). This study indicates that in the Longxi Loess Plateau, mixed cropping of M. ruthenica and B. inermis at varying ratios significantly increased forage yield compared to monoculture. The complementary morphological and physiological traits of legumes and grasses allow leguminous plants to supply nitrogen necessary for grass growth, thus enhancing forage development and yield. This suggests that appropriate mixed cropping ratios can result in higher forage yields (Luo et al., 2023). However, the overall forage yield in 2022 was relatively low, likely due to significant variations in temperature and precipitation during the growing season in the Loess Plateau. Total precipitation in 2021 exceeded that of 2022, particularly during the peak forage growth season (July to September), when precipitation in 2022 markedly declined (Figure 2). This likely increased soil aridity, inhibiting forage growth. Additionally, during the beginning-flower stage in 2022, prolonged high temperatures and sparse rainfall were observed, suggesting that climatic variations could influence forage yield (Figure 2). Research indicates that drought directly impairs leguminous plant growth and reduces their nitrogen fixation capacity, indirectly impacting the companion crop in mixed systems and thereby affecting feed production (Iqbal et al., 2022). In 2023, mixed forage yield significantly increased compared to the previous year, primarily due to the stabilization of the mixed cropping community. Typically, the stability of mixed grassland communities increases with years of cultivation, but does not continue indefinitely (Schulte et al., 2003). Studies have found that mixed grassland yields peak in the third or fourth year, consistent with this study’s findings (Frankow-Lindberg et al., 2009). This study also found that when the legume proportion in the mixed system ranges from 20 to 40%, forage yield is relatively high. However, as the legume proportion in the mix increases, yield shows a downward trend. Excessive legume proportions can cause sprawling, leading to rot and reduced forage yield. This suggests that in agricultural production, legumes and grasses together contribute to nitrogen fixation via rhizobia, enhancing forage protein yield and diversifying the forage system. While legumes are an important protein source for humans and animals, a higher proportion does not necessarily result in greater feed output in mixed cropping systems (Andrews and Andrews, 2017).
The nutritional value of forage is essential for animal husbandry, with crude protein content being a key indicator of its nutritional quality (Reid et al., 2015). In this study, mixed forage exhibited the highest crude protein content, followed by the sole cropping of M. ruthenica. The lowest crude protein content was observed in the monoculture of B. inermis, consistent with Lithourgidis et al. (2006), who also found higher crude protein content in mixed forage compared to monoculture cereal crops. However, increasing the proportion of legumes in the mix did not significantly boost crude protein content, likely because the actual legume growth proportion was lower than the theoretical ratio in the mixed cropping system (Li et al., 2015). The crude protein content of forage initially increased and then decreased during growth, with peak nutritional value at the beginning-flower stage, followed by a decline at the podding stage, mainly due to leaf loss and quality deterioration after maturity. This trend is closely related to plant species and growth environment. Neutral detergent fiber, acid detergent fiber, and sugar content are key quality indicators of forage crops, reflecting their feeding value (Assefa and Ledin, 2001). This study shows that mixed cropping of M. ruthenica and B. inermis resulted in significantly lower neutral detergent fiber and acid detergent fiber content compared to their monocultures. The degree of reduction varied across different mixing ratios, consistent with the trends observed by Lithourgidis et al. (2006). As the growing season progresses, neutral detergent fiber content increases and positively correlates with forage yield. This is likely due to the reduction of tender shoots and leaves and the increase of stems with lower moisture content in the later growth stages, potentially influenced by differences in plant species and growth stages. Soluble sugar and starch are vital nutrients in forage, influencing crop growth and development, as reported by Zhao et al. (2008). In this study, soluble sugar and starch content in mixed forage was not significantly higher than in monocultures. At certain growth stages, monoculture forage even exhibited higher levels of these nutrients than mixed forage. Relative feeding value (RFV) is an index used to predict forage energy value and intake. Studies have shown that an RFV greater than 151 indicates high-quality feed (Hackmann et al., 2008; Horrocks and Valentine, 1999). In this study, the relative feeding value of mixed forage was highest when M. ruthenica and B. inermis were mixed at a 3:7 ratio. Overall, the relative feeding value of forage decreased over time, suggesting that the nutritional quality of forage in cultivated grasslands deteriorates annually, likely due to environmental factors and the self-succession of mixed cropping communities.
The yield and nutritional quality of mixed forage are influenced by environmental factors such as precipitation and temperature, and by field management practices like weed control and harvest timing. Precipitation directly affects water availability for plant growth. Adequate precipitation enhances photosynthesis and nutrient absorption, improving both yield and quality. Conversely, insufficient precipitation can reduce oxygen supply, hindering plant growth and development. Optimal temperatures promote plant metabolism and nutrient transport, leading to higher yield and quality. However, extreme temperatures can adversely affect mixed forage growth, potentially causing plant death. Field management practices also play a crucial role in mixed forage yield and quality. Weed control reduces competition, improving light and nutrient use efficiency. Harvest timing directly impacts yield and quality, with premature or delayed harvesting potentially causing nutrient loss or decreased quality. Therefore, when assessing mixed forage production, it is essential to comprehensively consider factors such as precipitation, temperature, weed control, and harvest timing, and to develop scientifically sound management strategies to optimize yield and quality. Additionally, further research is needed on the impact of grazing on mixed grasslands.
4.2 Response of interspecific competition to mixed cropping ratios and field management measures
Interspecific competition between the two mixed crops involves both aboveground and underground interactions. Aboveground, plants compete for light, while underground, roots compete for soil moisture and nutrients. These interspecies relationships are crucial in determining the structure and dynamics of plant communities in agricultural ecosystems (Li et al., 2016; Li et al., 2001). The study results indicate that grasses in the legume/grass mixed cropping system have a competitive advantage. Wei et al. (2022) found that in the semi-arid Loess Plateau of Longxi, B. inermis consistently outcompetes M. ruthenica throughout the growth period, and its competitiveness strengthens with an increasing legume ratio. Studies have shown that in legume/grain mixed cropping systems, grain crops typically dominate due to extensive leaf shading during early growth stages. This results in stronger competition for light resources, reducing the advantage of legumes (Liu et al., 2017). The interspecies competition relationships measured in 2022 and 2023, after autumn sowing in 2021, indicate that with a legume proportion of 20 to 30%, legumes are more competitive than grasses. At a legume proportion of 30 to 40%, competition is minimized, maximizing mixed cropping benefits. However, with further increases in legume proportion, grass competitiveness strengthens. The dominance of grain crops in mixed cropping systems is likely due to external environmental factors, such as precipitation, temperature, weed invasion, and differences in the growth periods of forage crops (Gong et al., 2020). Over time, interspecific competition in mixed cropping communities stabilizes, benefiting both crops. In the dry, low-rainfall Loess Plateau of northwest China, autumn sowing is usually the optimal choice for planting forage crops, especially perennials. In autumn, lower temperatures and shorter daylight hours reduce soil moisture evaporation, enhance retention, and facilitate root growth and establishment. This strategy effectively suppresses weed growth during the next year’s regreening period, reducing competition from weed intrusion.
4.3 Analysis of the relationship and limitations between forage yield, quality, and interspecific competition
A close relationship exists between forage yield, quality, and interspecies competition. Interspecies competition refers to the competition among different plant populations for essential growth resources such as light, water, and nutrients (Bi et al., 2019). In ecosystems, interspecies competition often impacts forage yield and quality (Vlachostergios et al., 2015). In highly competitive environments, plant populations face pressure to acquire limited resources, reducing forage yield or quality. In contrast, in less competitive environments, this pressure is lower, often resulting in higher forage yield and quality (Wang et al., 2022; Tejera et al., 2016). This study found a significant positive correlation between forage yield and land equivalent ratio. Neutral detergent fiber and acid detergent fiber are significantly negatively correlated with relative feeding value and dry matter digestibility (Figure 9). Additionally, when evaluating mixed forage yield and nutritional quality, legume proportion emerged as the main driving force (Figure 11), highlighting its crucial role in forage production potential (Bacchi et al., 2021).
However, this study has several limitations. Due to time and experimental constraints, the data obtained are limited, which is a common limitation of field experiments. Field experiments are often constrained by limited resources and space, which can prevent covering all possible conditions and may result in incomplete or inaccurate conclusions. Forage crop yield is influenced by environmental factors and community succession. Future studies should further investigate this using comprehensive multi-year data to more clearly identify the yield-limiting factors. Species interactions are influenced by plant succession and external environmental disturbances, which evolve over time. Mixed cropping systems involve many unstable factors. Continuous observation in future studies is necessary to explore the development of competitive and facilitative relationships in forage crop growth over time. The nutritional value of forage is affected by factors such as nutrient absorption and circulation within plants, as well as external environmental conditions. This study only examines the influence of leguminous plants on the proportions in mixed cropping systems. Subsequent studies should refine the specific factors affecting nutritional value to provide a more comprehensive research basis.
5 Conclusion
In the Loess Plateau region of northwest China, mixed cropping of M. ruthenica and B. inermis offers advantages in yield and quality over monoculture planting. In mixed cropping systems, lower proportions of legumes often result in higher yields. B. inermis remains more competitive than M. ruthenica throughout its growth, thus becoming the dominant species in mixed cropping. The proportion of legumes is a key factor in determining the yield of mixed fodder crops. A two-year comprehensive evaluation indicates that a 30% mixture ratio of M. ruthenica and B. inermis provides optimal mixed cropping effects, making it ideal for establishing cultivated forage fields in the semi-arid regions of the Longxi Loess Plateau.
Data availability statement
The original contributions presented in the study are included in the article/supplementary material, further inquiries can be directed to the corresponding author.
Author contributions
KW: Conceptualization, Data curation, Investigation, Software, Validation, Visualization, Writing – original draft, Writing – review & editing. HX: Data curation, Investigation, Writing – review & editing. YL: Investigation, Resources, Writing – review & editing. XZ: Investigation, Resources, Writing – review & editing. XY: Conceptualization, Funding acquisition, Project administration, Supervision, Writing – review & editing.
Funding
The author(s) declare that financial support was received for the research, authorship, and/or publication of this article. This work was supported in part by the National Forage Industry Technology System of China (CARS-34-01A).
Acknowledgments
The authors gratefully acknowledge their support and thank Editage (www.editage.cn) for English language editing.
Conflict of interest
The authors declare that the research was conducted in the absence of any commercial or financial relationships that could be construed as a potential conflict of interest.
Publisher’s note
All claims expressed in this article are solely those of the authors and do not necessarily represent those of their affiliated organizations, or those of the publisher, the editors and the reviewers. Any product that may be evaluated in this article, or claim that may be made by its manufacturer, is not guaranteed or endorsed by the publisher.
References
Akdeniz, H., Hosaflioglu, I., Koç, A., Hossain, A., Islam, M. S., Iqbal, M. A., et al. (2019). Evaluation of herbage yield and nutritive value of eight forage crop species. Appl. Ecol. Env. Res. 17, 5571–5581. doi: 10.15666/aeer/1703_55715581
Andrews, M., and Andrews, M. E. (2017). Specificity in legume-rhizobia symbioses. Int. J. Mol. Sci. 18:705. doi: 10.3390/ijms18040705
Assefa, G., and Ledin, I. (2001). Effect of variety, soil type and fertiliser on the establishment, growth, forage yield, quality and voluntary intake by cattle of oats and vetches cultivated in pure stands and mixtures. Anim. Feed. Sci. Tech. 92, 95–111. doi: 10.1016/s0377-8401(01)00242-5
Bacchi, M., Monti, M., Calvi, A., Presti, E. L., Pellicanò, A., and Preiti, G. (2021). Forage potential of cereal/legume intercrops: agronomic performances, yield, quality forage and LER in two harvesting times in a mediterranean environment. Agronomy-Basel. 11:121. doi: 10.3390/agronomy11010121
Bi, Y., Zhou, P., Li, S., Wei, Y., Xiong, X., Shi, Y., et al. (2019). Interspecific interactions contribute to higher forage yield and are affected by phosphorus application in a fully-mixed perennial legume and grass intercropping system. Field Crop Res. 244:107636. doi: 10.1016/j.fcr.2019.107636
Bo, P. T., Bai, Y., Dong, Y., Shi, H., Htet, M. N. S., Samoon, H. A., et al. (2022). Influence of different harvesting stages and cereals–legume mixture on forage biomass yield, nutritional compositions, and quality under loess plateau region. Plants Basel 11:2801. doi: 10.3390/plants11202801
Bohlool, B. B., Ladha, J. K., Garrity, D. P., and George, T. (1992). Biological nitrogen fixation for sustainable agriculture: a perspective. Plant Soil 141, 1–11. doi: 10.1007/bf00011307
Burris, R. H., and Roberts, G. P. (1993). Biological nitrogen fixation. Annu. Rev. Nutr. 13, 317–335. doi: 10.1146/annurev.nu.13.070193.001533
Caballero, R., Goicoechea, E. L., and Hernaiz, P. J. (1995). Forage yields and quality of common vetch and oat sown at varying seeding ratios and seeding rates of vetch. Field Crop Res. 41, 135–140. doi: 10.1016/0378-4290(94)00114-r
Capstaff, N. M., and Miller, A. J. (2018). Improving the yield and nutritional quality of forage crops. Front. Plant Sci. 9:338501. doi: 10.3389/fpls.2018.00535
Darambazar, E., Larson, K., Schoenau, J., Wang, G., Biligetu, B., Damiran, D., et al. (2022). Evaluation of alfalfa and grass species in binary and complex mixtures on performance under soil salinity conditions. Agronomy Basel 12:1672. doi: 10.3390/agronomy12071672
Dhima, K. V., Lithourgidis, A. S., Vasilakoglou, I. B., and Dordas, C. A. (2007). Competition indices of common vetch and cereal intercrops in two seeding ratio. Field Crop Res. 100, 249–256. doi: 10.1016/j.fcr.2006.07.008
Frankow-Lindberg, B. E., Halling, M., Höglind, M., and Forkman, J. (2009). Yield and stability of yield of single-and multi-clover grass-clover swards in two contrasting temperate environments. Grass Forage Sci. 64, 236–245. doi: 10.1111/j.1365-2494.2009.00689.x
Gang, C., Zhao, W., Zhao, T., Zhang, Y., Gao, X., and Wen, Z. (2018). The impacts of land conversion and management measures on the grassland net primary productivity over the loess plateau, northern China. Sci. Total Environ. 645, 827–836. doi: 10.1016/j.scitotenv.2018.07.161
Goering, H. K., and Van Soest, P. J. (1970). Forage fiber analyses (apparatus, reagents, procedures, and some applications). Maryland, USates: US Agricultural Research Service.
Gong, X., Dang, K., Lv, S., Zhao, G., Tian, L., Luo, Y., et al. (2020). Interspecific root interactions and water-use efficiency of intercropped proso millet and mung bean. Eur. J. Agron. 115:126034. doi: 10.1016/j.eja.2020.126034
Hackmann, T. J., Sampson, J. D., and Spain, J. N. (2008). Comparing relative feed value with degradation parameters of grass and legume forages. J. Anim. Sci. 86, 2344–2356. doi: 10.2527/jas.2007-0545
Herridge, D. F., Peoples, M. B., and Boddey, R. M. (2008). Global inputs of biological nitrogen fixation in agricultural systems. Plant Soil 311, 1–18. doi: 10.1007/s11104-008-9668-3
Hewitt, B. R. (1958). Spectrophotometric determination of total carbohydrate. Nature 182, 246–247. doi: 10.1038/182246b0
Hwang, C. L., and Yoon, K. (1981). “Methods for multiple attribute decision making” in Multiple attribute decision making: methods and applications a state-of-the-art survey, vol. 186 (Berlin: Springer).
Iqbal, N., Sadras, V. O., Denison, R. F., Zhou, Y., and Denton, M. D. (2022). Clade-dependent effects of drought on nitrogen fixation and its components–number, size, and activity of nodules in legumes. Field Crop Res. 284:108586. doi: 10.1016/j.fcr.2022.108586
Li, B., Li, Y., Wu, H., Zhang, F., Li, C., Li, X., et al. (2016). Root exudates drive interspecific facilitation by enhancing nodulation and N2 fixation. Proc. Natl. Acad. Sci. U. S. A. 113, 6496–6501. doi: 10.1073/pnas.1523580113
Li, Q., Song, Y., Li, G., Yu, P., Wang, P., and Zhou, D. (2015). Grass-legume mixtures impact soil N, species recruitment, and productivity in temperate steppe grassland. Plant Soil 394, 271–285. doi: 10.1007/s11104-015-2525-2
Li, Q., Song, J., Zhou, Y., Chen, Y., Zhang, L., Pang, Y., et al. (2022). Full-length transcriptomics reveals complex molecular mechanism of salt tolerance in Bromus inermis L. Front. Plant Sci. 13:917338. doi: 10.3389/fpls.2022.917338
Li, L., Sun, J., Zhang, F., Li, X., Yang, S., and Rengel, Z. (2001). Wheat/maize or wheat/soybean strip intercropping: I. Yield advantage and interspecific interactions on nutrients. Field Crop Res. 71, 123–137. doi: 10.1016/S0378-4290(01)00156-3
Lithourgidis, A. S., Vasilakoglou, I. B., Dhima, K. V., Dordas, C. A., and Yiakoulaki, M. D. (2006). Forage yield and quality of common vetch mixtures with oat and triticale in two seeding ratios. Field Crop Res. 99, 106–113. doi: 10.1016/j.fcr.2006.03.008
Littlejohn, C. P., Hofmann, R. W., and Wratten, S. D. (2019). Delivery of multiple ecosystem services in pasture by shelter created from the hybrid sterile bioenergy grass Miscanthus x giganteus. Sci. Rep. U. K. 9:5575. doi: 10.1038/s41598-019-40696-2
Liu, X., Rahman, T., Song, C., Su, B., Yang, F., Yong, T., et al. (2017). Changes in light environment, morphology, growth and yield of soybean in maize-soybean intercropping systems. Field Crop Res. 200, 38–46. doi: 10.1016/j.fcr.2016.10.003
Lu, Y., Mu, L., Yang, M., and Yang, H. (2022). Lucerne proportion regulates competitive uptake for nitrogen and phosphorus in lucerne and grass mixtures on the loess plateau of China. Agronomy Basel 12:1258. doi: 10.3390/agronomy12061258
Lu, C. H., van Ittersum, M. K., and Rabbinge, R. (2004). A scenario exploration of strategic land use options for the loess plateau in northern China. Agric. Syst. 79, 145–170. doi: 10.1016/s0308-521x(03)00069-6
Luo, F., Liu, W., Mi, W., Ma, X., Liu, K., Ju, Z., et al. (2023). Legume-grass mixtures increase forage yield by improving soil quality in different ecological regions of the Qinghai-Tibet plateau. Front. Plant Sci. 14:1280771. doi: 10.3389/fpls.2023.1280771
Reid, M., O’Donovan, M., Elliott, C. T., and Bailey, J. S. (2015). The effect of dietary crude protein and phosphorus on grass-fed dairy cow production, nutrient status, and milk heat stability. J. Dairy Sci. 98, 517–531. doi: 10.3168/jds.2014-8437
Ren, H., Han, G., Schönbach, P., Gierus, M., and Taube, F. (2016). Forage nutritional characteristics and yield dynamics in a grazed semiarid steppe ecosystem of Inner Mongolia, China. Ecol. Indic. 60, 460–469. doi: 10.1016/j.ecolind.2015.07.027
Schulte, R. P. O., Lantinga, E. A., and Struik, P. C. (2003). Analysis of the production stability of mixed grasslands: I: a conceptual framework for the qualification of production stability in grassland ecosystems. Ecol. Model. 159, 43–69. doi: 10.1016/S0304-3800(02)00261-2
Suyama, H., Benes, S. E., Robinson, P. H., Getachew, G., Grattan, S. R., and Grieve, C. M. (2007). Biomass yield and nutritional quality of forage species under long-term irrigation with saline-sodic drainage water: field evaluation. Anim. Feed. Sci. Technol. 135, 329–345. doi: 10.1016/j.anifeedsci.2006.08.010
Tahir, M., Li, C., Zeng, T., Xin, Y., Chen, C., Javed, H. H., et al. (2022). Mixture composition influenced the biomass yield and nutritional quality of legume–grass pastures. Agronomy Basel 12:1449. doi: 10.3390/agronomy12061449
Tahir, M., Wei, X., Li, J., Li, J., Zhou, J., Kang, B., et al. (2023). Mixed legume–grass seeding and nitrogen fertilizer input enhance forage yield and nutritional quality by improving the soil enzyme activities in Sichuan, China. Front. Plant Sci. 14:1176150. doi: 10.3389/fpls.2023.1176150
Tejera, M., Speranza, P., Astigarraga, L., and Picasso, V. (2016). Forage biomass, soil cover, stability and competition in perennial grass–legume pastures with different Paspalum species. Grass Forage Sci. 71, 575–583. doi: 10.1111/gfs.12208
Trenbath, B. R. (1993). Intercropping for the management of pests and diseases. Field Crop Res. 34, 381–405. doi: 10.1016/0378-4290(93)90123-5
Vlachostergios, D. N., Dordas, C. A., and Lithourgidis, A. S. (2015). Forage yield, protein concentration and interspecific competition in red pea-cereal intercrops. Exp. Agric. 51, 635–650. doi: 10.1017/S0014479714000519
Wang, B., Deng, J., Wang, T., Wang, N., Feng, Q., and Lan, J. (2022). Effect of seeding options on interspecific competition in oat (Avena sativa L.)–common vetch (Vicia sativa L.) forage crops. Agronomy Basel 12:3119. doi: 10.3390/agronomy12123119
Wang, L., Xie, J., Luo, Z., Niu, Y., Coulter, J., Zhang, R., et al. (2021). Forage yield, water use efficiency, and soil fertility response to alfalfa growing age in the semiarid loess plateau of China. Agric. Water Manage. 243:106415. doi: 10.1016/j.agwat.2020.106415
Wei, K., Yu, X., Bai, M., Ma, K., Liu, Y., and Zhang, X. (2022). Effect of mixed sowing ratio on the forage yield and quality of grazing mixed sowing grassland in semi-arid area. Chinese J. Grassl. 44, 56–65. doi: 10.16742/j.zgcdxb.20220069
Williams, A. C., and McCarthy, B. C. (2001). A new index of interspecific competition for replacement and additive designs. Ecol. Res. 16, 29–40. doi: 10.1046/j.1440-1703.2001.00368.x
Wu, X., Wu, W., and Yang, H. (2022). Effects of legume–grass ratio on C and nutrients of root and soil in common vetch-oat mixture under fertilization. Agronomy Basel 12:1936. doi: 10.3390/agronomy12081936
Wu, R., Xu, B., and Shi, F. (2022). Leaf transcriptome analysis of Medicago ruthenica revealed its response and adaptive strategy to drought and drought recovery. BMC Plant Biol. 22:562. doi: 10.1186/s12870-022-03918-w
Zhao, D., MacKown, C. T., Starks, P. J., and Kindiger, B. K. (2008). Interspecies variation of forage nutritive value and nonstructural carbohydrates in perennial cool-season grasses. Agron. J. 100, 837–844. doi: 10.2134/agronj2007.0178
Zielewicz, W., Swędrzyński, A., Dobrzyński, J., Swędrzyńska, D., Kulkova, I., Wierzchowski, P. S., et al. (2021). Effect of forage plant mixture and biostimulants application on the yield, changes of botanical composition, and microbiological soil activity. Agronomy Basel 11:1786. doi: 10.3390/agronomy11091786
Keywords: loess plateau, mixed cropping, grass yield, nutritional quality, intercropping competition, Medicago ruthenica
Citation: Wei K, Xiang H, Liu Y, Zhang X and Yu X (2024) Mixed cropping of Medicago ruthenica-Bromus inermis exhibits higher yield and quality advantages in the Longxi loess plateau region of Northwest China. Front. Sustain. Food Syst. 8:1411687. doi: 10.3389/fsufs.2024.1411687
Edited by:
Veerasamy Sejian, Indian Council of Agricultural Research, IndiaReviewed by:
Giuseppe Di Miceli, University of Palermo, ItalyMeijuan Li, Guangdong Academy of Agricultural Sciences, China
Dariusz Malinowski, Texas A&M AgriLife Extension Service, United States
Copyright © 2024 Wei, Xiang, Liu, Zhang and Yu. This is an open-access article distributed under the terms of the Creative Commons Attribution License (CC BY). The use, distribution or reproduction in other forums is permitted, provided the original author(s) and the copyright owner(s) are credited and that the original publication in this journal is cited, in accordance with accepted academic practice. No use, distribution or reproduction is permitted which does not comply with these terms.
*Correspondence: Xiaojun Yu, eXV4akBnc2F1LmVkdS5jbg==
†These authors share first authorship
 Kongtao Wei
 Hang Xiang
 Yaofeng Liu2,3
 Xiaojun Yu