 Johana Marcela Castillo1
 Carlos Eduardo González1
 Anja Lienert1,2
 Jesús Fernando Flórez1Aura María Bravo Parra1Natalia Triana Ángel1
 Stefan Burkart1*
- 1International Center for Tropical Agriculture (CIAT), Cali, Colombia
- 2Department of Production Theory and Resource Economics, University of Hohenheim, Stuttgart, Germany
Beef production is a major contributor to greenhouse gas (GHG) emissions and has therefore been placed at the center of global policy and research agendas on climate change mitigation and adaptation. However, detailed quantification of the intensity of beef’s contribution to emissions has mostly focused on the farm level. This research uses the calculation of a food miles emissions indicator to analyze the Colombian beef supply network from slaughterhouses to national consumption centers and its emissions between 2019 and 2022, including a network analysis and weighted average source distance (WASD) estimation. The results were compared with emissions from the transport of alternative animal proteins, specifically chicken and pork. The results show that the beef miles emissions indicator in Colombia is equivalent to 0.055330 kg CO2eq/ton of beef/km, which is higher than pork and chicken. These findings highlight the need to develop comprehensive approaches and strategies to reduce emissions from beef production, recognizing the critical role that the beef supply network, transport distances, infrastructure, and technology play in beef-related emissions.
Introduction
Meat consumption in emerging and developing countries has seen steady growth rates over the last few decades, outpacing growth rates in developed countries (U.S. Department of Agriculture, 2015). A growing middle class and associated higher household incomes have increased the preference for meat as a protein source, with many consumers considering it a superior choice to other protein sources. In many countries, meat is not only a food, but also a symbol of well-being and a fundamental pillar of nutrition and health (Cervantes et al., 2016; Blanco-Murcia and Ramos-Mejía, 2019). Globally, poultry is the meat consumed in largest quantities, accounting for 40% of the total meat consumption, closely followed by pork (34%), beef (21%), and sheep and goat (5%) (Statista, 2023). In Colombia, while there has been a recent increase in the consumption of poultry, pork, and fish, the consumption of beef has not followed the same trend. Nevertheless, beef remains the second most consumed meat in the country, with an average of 17.1 kilograms per capita (709,599 metric tons) in 2022, while poultry is the undisputed leader with 36.3 kilograms per capita (Fedegan, 2023). Overall, the upward trend in meat consumption in Colombia is expected to continue, potentially increasing by an impressive 58% by the year 2050 (FINAGRO, 2014).
At the same time, the beef value chain faces several challenges that prevent it from becoming more sustainable. These include economic challenges related to increased demand and production costs, social challenges related to issues such as consumer health and animal welfare (Maia de Souza et al., 2017), and environmental challenges mainly related to the expansion of cattle farming through deforestation, with associated environmental impacts such as degradation of natural habitats, loss of biodiversity and ecosystem services, land degradation, soil erosion, water pollution and greenhouse gas (GHG) emissions (Areas Venegas, 2004). In terms of the latter, the Latin America and Caribbean (LAC) region emits 1.9 gigatons of carbon dioxide equivalents (CO2 eq) per year, which is the highest emission level in the world (FAO, 2022). In Colombia, 60% of deforestation has been associated with livestock farming (García, 2014) and if this trend is not halted, cattle farming will be a major obstacle to achieving international and national development goals, such as Colombia’s Nationally Determined Contributions (NDCs) under the Paris Agreement, specifically the unconditional target of reducing GHG emissions by 51% below business as usual in 2030 (Ministerio de Ambiente Desarrollo Sostenible, 2022; United Nations, 2015; International Energy Agency, 2022).
To reduce the environmental footprint of the Colombian beef value chain and contribute to climate change mitigation and adaptation, several public policy instruments and multi-sectoral initiatives have been developed in recent years. These include, for example, the Green Growth Policy (DNP, 2018), the Sustainable Bovine Livestock Policy 2022–2050 (MARD, 2022), and the Sustainable Livestock Roundtable (Agrosavia, 2023). In addition, Colombia has developed its own national GHG inventory (IDEAM, 2015). Following the guidelines of the Intergovernmental Panel on Climate Change (IPCC, 2023), this inventory classifies GHG emissions into four key sectors: (1) energy, (2) industrial processes and product use (IPPU), (3) agriculture, forestry and other land use (AFOLU), and (4) waste. While emissions associated with livestock farming are included in the AFOLU sector, transport, another emission generating activity in the beef value chain, is included in the energy sector GHG inventory.
To date, numerous studies have been carried out to analyze the life cycle, GHG emissions and carbon footprint (CF) of cattle and livestock production in general (Aluwong and Wuyep, 2011; Barthelmie, 2022; Buratti et al., 2017; Caro et al., 2014; da SILVA et al., 2023; Desjardins et al., 2012; Dick et al., 2015; Garrido et al., 2022; Gaviria-Uribe et al., 2020; González-Quintero et al., 2021, 2022; Ogino et al., 2016; Place and Mitloehner, 2012; Ruviaro et al., 2015; Sandoval et al., 2023). There are also several studies on GHG emissions from food transport (Ballingall and Winchester, 2010; Bigaran Aliotte and Ramos De Oliveira, 2022; Boarnet, 2010; Caputo et al., 2013; Coley et al., 2009, 2011; Striebig et al., 2019). It has, for example, been found that food transport in general accounts for 19% of food emissions and 6% of total emissions, and that emissions from food transport account for almost half of the direct emissions from road vehicles (University of Sydney, 2022). However, beef transport emissions have been studied only marginally (Kannan et al., 2016; Soysal et al., 2014; Velazco-Bedoya et al., 2013) and most studies on this topic focus mainly on animal welfare (Huertas et al., 2010; Romero-Peñuela et al., 2010). As a result, strategies to sustainably transform the cattle sector focus almost exclusively on reducing deforestation and mitigating enteric methane emissions from ruminants (FAO, 2023), while transport-related emissions are largely ignored.
In Colombia, too, there is little information on emissions from cattle transport, and existing regulations focus mainly on animal welfare and sanitary conditions (ICA, 2016; Ministerio de Transporte, 2022; Burkart et al., 2020). To narrow this knowledge gap, this study aims to quantify the GHG emissions and the CF of beef transport in the Colombian supply network and to analyze its environmental footprint compared to two alternative animal proteins, chicken and pork. To achieve this, a network analysis of the Colombian meat supply system was carried out. Based on this analysis, the weighted average source distance (WASD) was calculated, and the direct GHG emissions and CF of meat transport were quantified based on the fuel consumption of vehicles. Finally, beef was compared with two alternative animal protein sources, chicken and pork, using the CF criteria.
The paper is structured as follows, section 2 presents a literature review on food miles, focusing in particular on beef transport emissions. Section 3 describes the methodology of quantitative analysis. Section 4 presents the research findings and sections 5 and 6 focus on discussion and conclusions.
Food and beef miles emissions
In 2020, global emissions from agrifood systems amounted to 16 billion tons of CO2 eq, an increase of 9% since 2000. Studies on the CF of food products around the world suggest that beef, with emissions of 60 kg CO2 eq/kg, has by far the highest CF of any food product (Ritchie, 2020). While it is known that farming practices and land use change are important contributors to GHG emissions in the beef supply chain, less is known about GHG emissions from beef transport, which is why this study aims to quantify these emissions for Colombia. In the following, an overview of the most recent research on GHG emissions associated with food transport in general, as well as with the emissions associated with beef transport is presented.
GHG emissions and CF from food transport are generally analyzed using the food miles emissions concept. Food miles are calculated based on the distance food travels from production to consumption and are measured in tonne-kilometers (tkm), which is the transport of one ton of food over one km, or in other words, the distance travelled multiplied by the mass of the transported food item (European Commission, 2023; Schnell, 2013; Van Passel, 2013). The transport sector contributes approximately one quarter of all energy related GHG emissions. Today’s transport sector is predominantly based on the combustion of fossil fuels, making it one of the largest sources of both urban and regional air pollution (UN Environment Programme, 2024). As food often travels long distances to reach consumers, transport might be expected to be the largest food-related contributor to GHG emissions. However, studies suggest that food transport has a relatively small CF when compared to the rest of the food system (Wakeland et al., 2012). It has been estimated that global food miles emissions correspond to around 3 Gt CO2 eq, which translates into transport accounting for 19% of total food system emissions. In the United States, for example, (Weber and Matthews, 2008) found that although food is generally transported over long distances (1,640 km delivery from retailer to consumer, and 6,760 km from production to consumption on average), transport accounts for only 11% of GHG emissions, and delivery from producer to retailer accounts for only 4%.
However, it is important to note that food miles emissions vary considerably depending on the food product. For example, the transport of fruit and vegetables, which is particularly emission-intensive due to the use of refrigerated vehicles (Kreier, 2022), accounts for 36% of total food miles emissions (European Commission, 2023). The refrigerated food supply chain is an energy-intensive, nutritious, and high-value part of the food system, making it particularly important to consider (Wang et al., 2022). The little data that is available suggests that currently the cold-chain accounts for approximately 1% of CO2 production in the world (James and James, 2010). Food transport refrigeration has a high impact on energy consumption and CO2 emissions. GHG emissions from conventional diesel engine driven vapor compression refrigeration systems commonly employed in food transport refrigeration can be as high as 40% of the GHG gas emissions from the vehicle’s engine (Tassou et al., 2009). Furthermore, large differences exist between the food miles emissions generated in high-income countries and those associated with low- and middle-income countries. High-income countries, with only about 12.5% of the world’s population, account for 52% of international food miles and 46% of associated emissions. On the other hand, low-income countries, home to around half of the world’s population, account for only 20% of international food transport emissions (Kreier, 2022; Li et al., 2022).
Coley et al. (2009) compared the carbon emissions of operating a large-scale vegetable box delivery system with those of a delivery system where customers travel to a local farm shop to collect the produce themselves. The authors found that if a customer travels more than 6.7 km round trip to purchase their organic vegetables, their carbon emissions are likely to be higher than the emissions from the system of cold storage, packaging, transport to a regional hub and final transport to the customer’s doorstep used by large vegetable box suppliers. As a result, the authors conclude that some of the ideas behind localism in the food sector May need to be reconsidered. Striebig et al. (2019) found contrasting results when they assessed what impact getting local food instead of non-local food could make on the overall emissions of the food system. Their results suggest that carbon emissions associated with food from local produce are lower than non-local sources. On the same topic, De Cara et al. (2017) argue that “buying local” does not necessarily reduce transport-related GHG emissions, even if production technologies and yields are homogeneous in space, but that the ideal supply system depends on the rural–urban population distribution in each region. They develop a partial equilibrium model of rural–urban systems where the spatial distribution of food production within and across regions is endogenous. According to De Cara et al. (2017), the optimal spatial distribution of food production does not exclude the possibility that some regions should be self-sufficient, provided that their urban populations sizes are neither too large nor too small. In another study, Coley et al. (2011) tested the effectiveness of the concept of food miles emissions for assessing the sustainability of food products. The findings of the study show that there is only a poor correlation between many food products, distances travelled and emissions, which is why food miles emissions, according to the authors, are not an appropriate tool for influencing consumer behavior.
Ballingall and Winchester (2010) examined the impact of changes in consumer preferences for imported agri-food commodities in several European countries. They simulated food miles emissions shocks in the UK, France, and Germany, as these are the countries where food miles campaigns are most active. The authors found that changes in consumer preferences are largest for agri-food products imported using carbon-intensive transport modes. In the same line of thought, Caputo et al. (2013) estimated the willingness to pay for CO2 and food miles emissions. The authors found that the willingness to pay for CO2 can be high even if the same respondents express a low willingness to pay for food miles emissions, while the reverse pattern was not observed. The results suggest that consumers tend to value the CO2 label at least as much as, and sometimes more than, the food miles emissions label.
Duarte et al. (2019) estimated the environmental impact of the road transport distance and product volume from farms to fresh food distribution centers in different regions of Brazil. The highest CO2 emissions were found for potatoes transported from Paraná, papaya from Bahía and tomatoes from Sao Pablo. The authors suggest that one strategy to reduce the environmental impact would be to use large freight volumes when transporting food over long distances. In a study on fruit export related emissions, du Plessis et al. (2022) described and analyzed the emissions-generating food distribution activities that are undertaken during the international export of fresh fruit from South Africa. Based on these activities, the authors developed a distribution chain diagram tool that describes the structure of fresh fruit distribution stages and associated emissions, and which can be used to facilitate the calculation of the carbon footprint of exported fruit.
In a study by Mosammam et al. (2018) a comparison of Iran’s total import-related food miles and associated direct environmental costs in 1999 and 2013 is presented. Based on a customized model, the import-related “food miles” were calculated for 14 food groups. In 1999, products arriving in Iran’s main cities were typically transported more than 15,456 km. By 2013, however, average food miles had fallen by 47%. In terms of energy use, the authors found that imported products accounted for 130,855 TJ of energy use in 1999, which was 10% less in 2013. These changes account for more than 10 and 9 million tons (Mt) of food miles emissions in 1999 and 2013, respectively. The authors conclude that there is an opportunity to re-legislate and revise policies on both imported and domestic food to continue reducing food miles emissions. Focusing on Canada, Kissinger (2012) presents a one-year snapshot of total import related food miles emissions. The author presents an analysis of the distance that imported food travels from around the world to major consumption points in Canada and documents the CO2 eq emissions associated with these imports. The study highlights that approximately 30% of the agricultural and food products consumed in Canada are imported, resulting in food miles of over 61 billion km and annual emissions of 3.3 million metric tons of CO2 eq. Of the various agricultural and food commodities studied, fruits and vegetables had the highest food miles related emissions.
Soysal et al. (2014) conducted one of the few existing studies on beef transport related emissions. The authors developed a multi-objective linear programming (MOLP) model for a generic beef logistics network problem. The objectives of the model are to minimize the total logistics cost as well as the total amount of GHG emissions from transport operations. The authors present computational results based on an application of the model to an existing beef export supply chain with primary production in Nova Andradina, Mato Grosso do Sul, Brazil, and consumers in the European Union. The results suggest that poor infrastructure leads to lower fuel efficiency, which in turn has a negative impact on emissions. The authors also conclude that green tax incentives such as a carbon tax can lead to improving the supply chain’s economic performance while reducing its environmental footprint.
In another study from Brazil, Velazco-Bedoya et al. (2013) calculated the CO2 emissions from the transport of Brazilian meat to Europe, comparing commonly used transport routes with less polluting alternative routes for the transport of meat from slaughterhouses to export harbors. They considered four scenarios: (i) farm to slaughterhouse; (ii) slaughterhouse to harbor; (iii) maritime transport from Brazil to Europe and (iv) distribution from European harbors to consumers. The average emission of the common transport routes was 8.8 tons of CO2 per container (26 tons) at an average distance of 11,633.4 km. The alternatives emitted on average 7.6 ton of CO2 per container, at a mean distance of 11,644.2 km. Comparing the two CO2 emissions, an average reduction of 20.47% can be achieved for transport in Brazil, and 13.85% for the entire route.
GHG emissions from beef transport are also addressed in a study by Kannan et al. (2016), which describes the development and application of a model to estimates energy consumption and GHG emissions from beef transport. The animal transport model is based on the weight and number of animals, type of trailer, vehicle, and fuel used. The results show that beef is transported on average 326 km in the study region. Fuel consumption amounts to 24 L of fossil fuel per 1,000 kg of boneless beef and the corresponding GHG emission is 83 kg. The authors point out that switching from conventional fuel to biofuel could significantly reduce energy consumption and GHG emissions.
Methods and data
The objective of this study is to quantify the GHG emissions and the CF of beef transport in the Colombian beef supply network and to evaluate its environmental efficiency compared to two alternative animal proteins, chicken and pork, using principally the meat and beef miles emissions indicator. It refers to transport emissions intensity (emissions/ton/km). To achieve this, a four-step methodological process is proposed (see Figure 1): (i) analysis of the beef supply network at the municipal level, (ii) assessment of geographical accessibility in the supply network, with distance as a key element, (iii) estimation of GHG emissions and CF from beef transport and beef miles emissions (BME), and (iv) comparison of GHG emissions, CF and food miles emissions from transport of beef, pork and chicken.

Figure 1. Four-step methodology for analyzing GHG emissions and CF from beef transport.
As a first step, information on the volume of pork, poultry, and beef supply in the largest Colombian cities (Bogotá, Barranquilla, Cali, Cartagena, Cucuta, and Medellín) for the time period 2019–2022 was extracted from the Price and Supply Information System of the Agricultural Sector (SIPSA) (DANE, 2022). These years were chosen due to the availability of data collected by the Colombian government through the SIPSA database managed by DANE. Additionally, during this period, data collection and recording were improved, including more cities and more market centers, which enhanced the analysis of this study.
The next step was to analyze the transport routes of carcass beef from the wholesale markets in the municipalities of origin to the final markets. To this end, beef-supplying municipalities of the prioritized cities were identified and road distances between them were estimated using information from DANE (2022) and Google Maps. The information corresponding to the volume of beef transported is based on information from 16 wholesale markets in 11 cities and from 23 toll stations in 5 cities. In each of these places, traders and transporters are asked for information on the daily volume of beef (DANE, 2022). To choice of vehicle type and reference fuel was based on information from the Ministry of Transport (Ministerio de Transporte, 2005), which estimates that 80% of the vehicles in Colombia are rigid motor vehicles with two and three axles, and that the fuel used for the transport of goods is mainly diesel (around 70%), according to Colombia’s Mining and Energy Planning Unit (UPME) (Amell-Arrieta et al., 2016). Starting in 2022, the legally mandated fuel mixture is 90% diesel and 10% biodiesel (Ministerio de Agricultura Desarrollo Rural and Ministerio de Minas Energía, 2023); however, at the time of the calculations for this study, the methodology proposed by Nutresa and GAIA (2013) used a mixture of 93% diesel and 7% biodiesel.
A Social Network Analysis (SNA) was carried out to map and analyze intermunicipal beef supply networks in Colombia (Akhtar, 2014; Asres et al., 2012; Barlow et al., 2011; Sharma and Surolia, 2013). This methodology provides metrics and a visual representation of data to analyze, among other things, the linkages between different actors (e.g., institutions and traders), products and regions. SNA helps to reveal local patterns (number of contacts (degree), position in the network, influence, and other statistics per network member-node) and global patterns (level of network compaction, density, level of centrality, association patterns, among others) in the beef supply chain (Sanz Menéndez, 2003). An example of this type of analysis is found on the platform PlaSA Colombia, which is used by different stakeholders in Colombia. This platform uses network analysis to map the flow of food, considering nodes (territories) and edges (connections and movements of food) (PlaSA Colombia, 2024). The above helps to determine the general structure of the network, the level of interaction, the local performance of each node, and the fragility between metrics. The following analytical criteria have been defined for the implementation of the SNA:
I. The network nodes are the municipalities of Colombia.
II. The network relationships analyzed, which are visualized as lines connecting the nodes, are beef supply relationships, with certain municipalities sending beef and others receiving beef.
The WASD was calculated as an indicator to estimate the distance that food travels from its origin to its final destination, taking into account the volume mobilized (Blanke and Burdick, 2005; Pirog and Benjamin, 2005). The WASD is computed by multiplying the quantity of each food product transported by the distance it travels from its origin to its destination and dividing the sum of these products by the total quantity transported (see Equation 1).
where:
= Weighted average distance for the food group
= Total quantity of the product transported from the place of origin
= Distance traveled from the place of origin to the destination for the product
= Specific food group
= Place of origin of the product
= Food product that belongs to the food group
Next, the GHG emissions associated with the fuel used to transport beef were estimated. The following three GHGs associated with using diesel were prioritized: Carbon dioxide (CO2), Nitrous oxide (N2O), and Methane (CH4). Table 1 shows the GHG emission factors used. The estimation of the diesel CO2 emission factor (see Equation 2) was based on Nutresa and GAIA (2013) and UPME (2003).
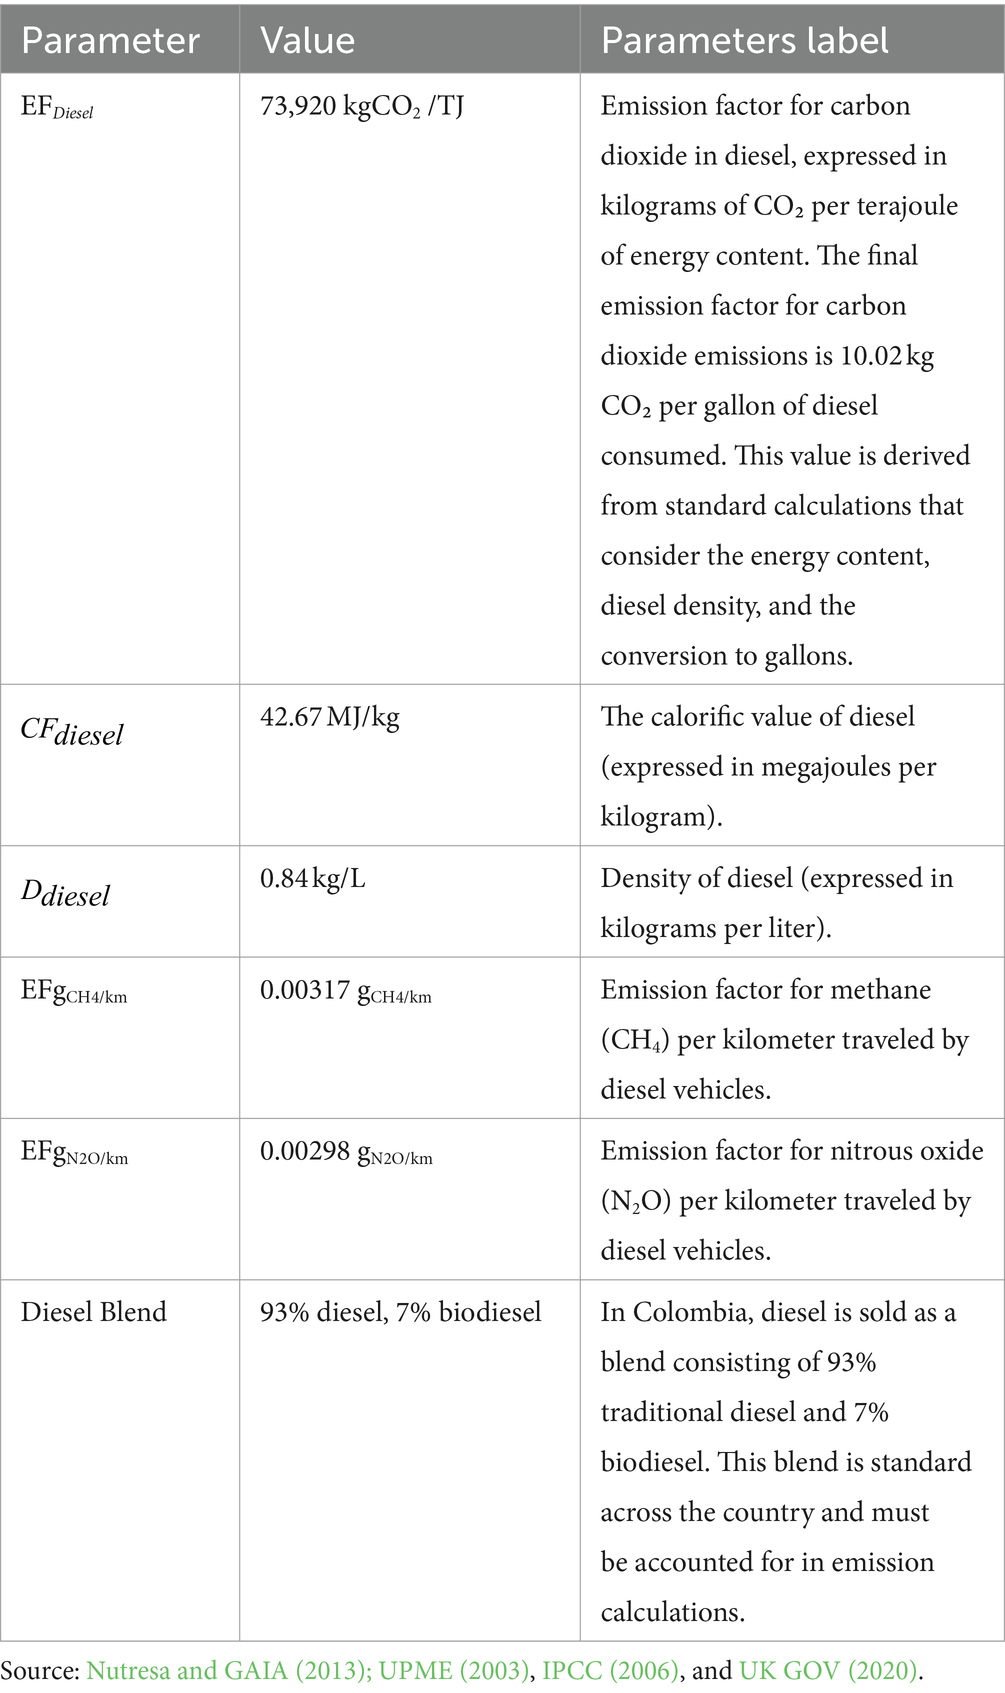
Table 1. Emission factors from diesel.
where:
: Diesel carbon dioxide emission factor
: Gallons of diesel consumed (Note: In Colombia, a gallon is a volume measurement equivalent to 3.78 liters, and this metric should be maintained for local reference)
= Diesel emission factor in Colombia
: Diesel caloric factor
: Diesel density
The estimations of the N2O and CH4 emission factors, which are associated with the types of vehicles are based on UK GOV (2020) (see Equations 3, 4):
where:
EFCH4 -Diesel = Methane emissions based on the distance traveled by vehicles
EFN2O- Diesel = Nitrous oxide emissions based on the distance traveled by vehicles
DistanceKm = Distance traveled in kilometers from city of origin/source to city of destination
EFgCH4/km = Emission factors for methane in diesel cargo vehicles
EFgN2O/km = Emission factors for nitrous oxide in diesel cargo vehicles
This information was taken to estimate the total CO2, N2O, and CH4 emissions from beef transport in Colombia (see Equation 5), using the global warming potential over 100 years for CO2 (1 ton CO2 eq), N2O (298 ton CO2 eq) and CH4 (25 ton CO2 eq) (Nutresa and GAIA, 2013). The parameters and metrics used have been validated by several studies in Colombia (Amell-Arrieta et al., 2016; Rodriguez et al., 2020; UPME, 2003).
Finally, the CF from beef transport (CFbt) and beef miles (BM) were calculated based on the GHG emissions, the quantity of beef transported (BQ) and the distance traveled (km) (see Equations 6, 7).
This process was repeated to estimate the GHG emissions, CF and food miles of pork and chicken for the purpose of comparison.
A limitation of this study is that there is no data on the distances traveled between the farm and the beef, chicken, or pork collection centers. Therefore, the estimates of GHG emissions, CF, and BF correspond to the transport of beef, chicken, and pork from the collection centers to the destination cities. Another limitation is that fuel consumption is different according to topography, type of roads, and height above sea level. There is not enough information to incorporate these variables in the study, for this reason a representative standard diesel consumption is assumed. To determine the consumption of gallons of diesel, the performance in kilometers per gallon in mountainous terrain is considered, according to the specifications of the Ministerio de Transporte (2012). This performance is 4.6 km/gallon for 2-axle trucks, 4.9 km/gallon for 3-axle trucks and 2.8 km/gallon for 4-axle trucks.
Results
Beef was the second most transported meat between 2019–2022. During this period, 189,000 tons of beef were transported by road in Colombia, an average of 47,000 tons per year. Beef is surpassed by chicken, with 201,000 tons transported in the period 2019–2022, which corresponds to an average quantity of 50,000 tons per year. Over the same period, 108,000 tons of pork were transported, an average of 27,000 tons per year. As can be seen in Figure 2, the quantity of chicken transported in Colombia surpassed beef in 2022. Furthermore, a decrease in the mobilized volume of the three types of meat can be observed between 2020 and 2021, which May be a consequence of the COVID-19 crisis.
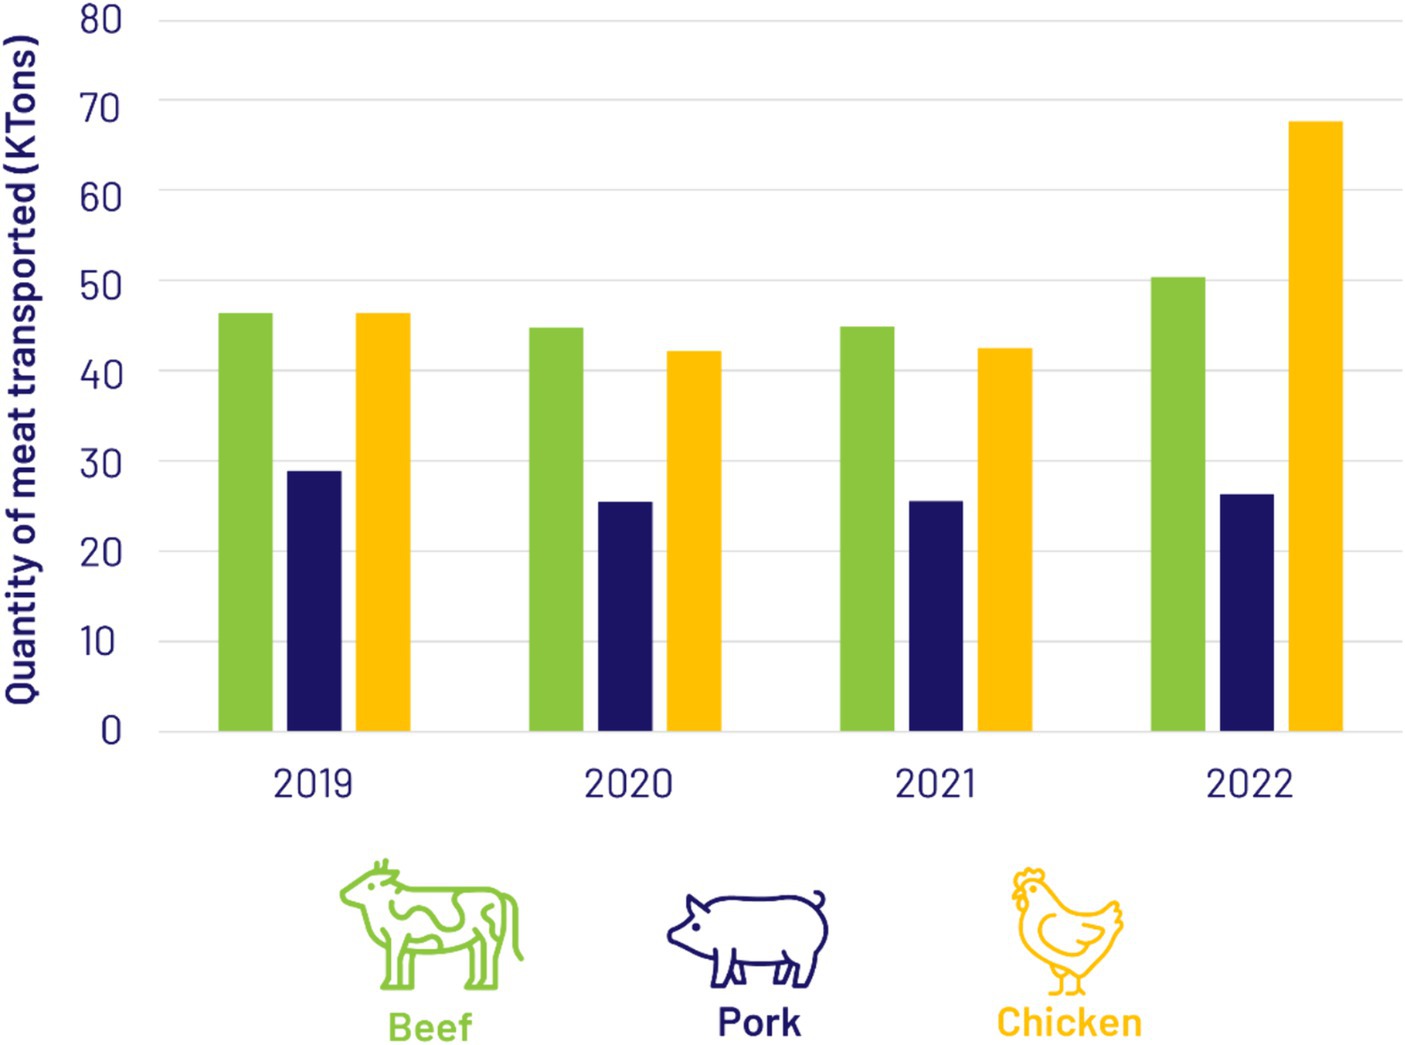
Figure 2. Tons of meat moved within Colombia 2019–2022.
The Colombian beef supply network is characterized by a fat-tail pattern, which refers to multiple supplying regions (grey circles) sending beef to a small group of trading partners (red circles). There is also a high degree of network centrality, with a few nodes, such as Bogotá, Barranquilla, Cali, Medellín, Cucuta, and Cartagena, concentrating most of the supply links (see Figures 3–5).
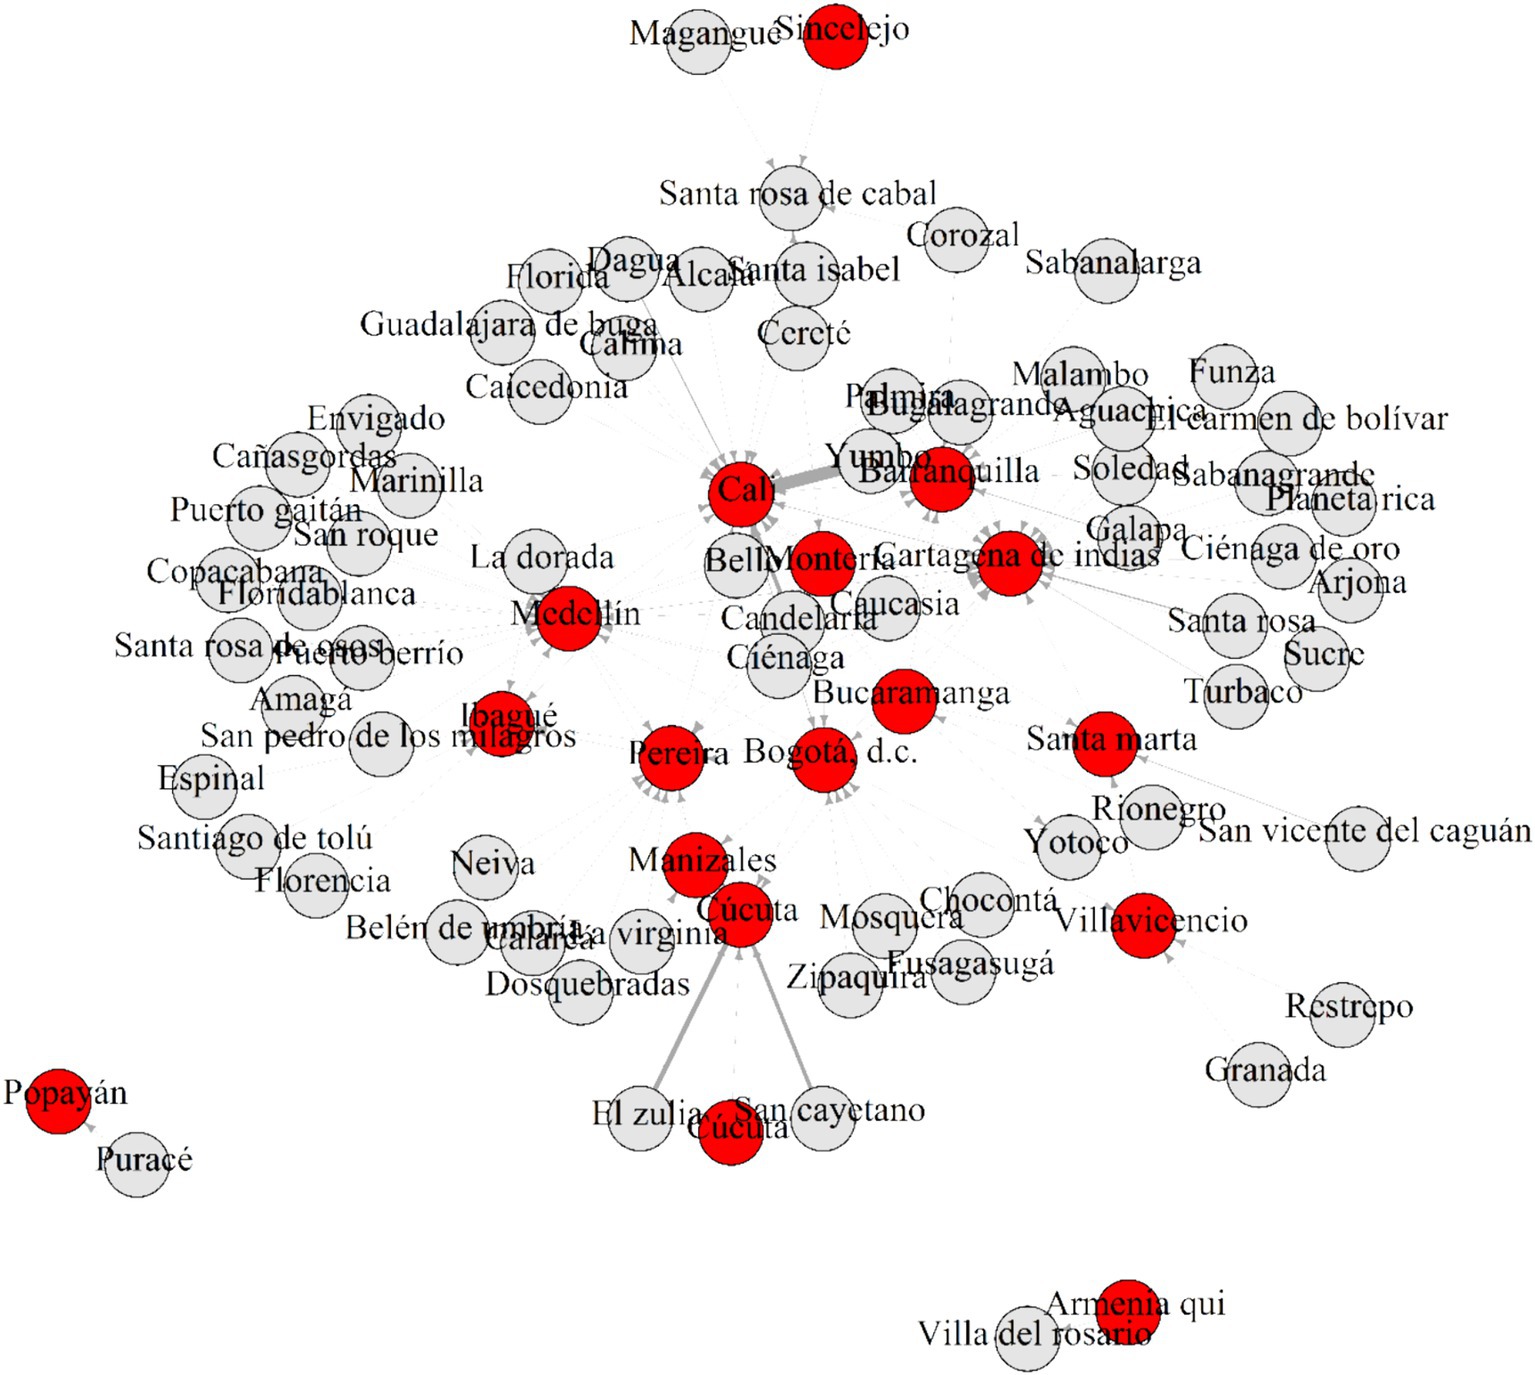
Figure 3. Beef supply network in Colombia in the year 2022.
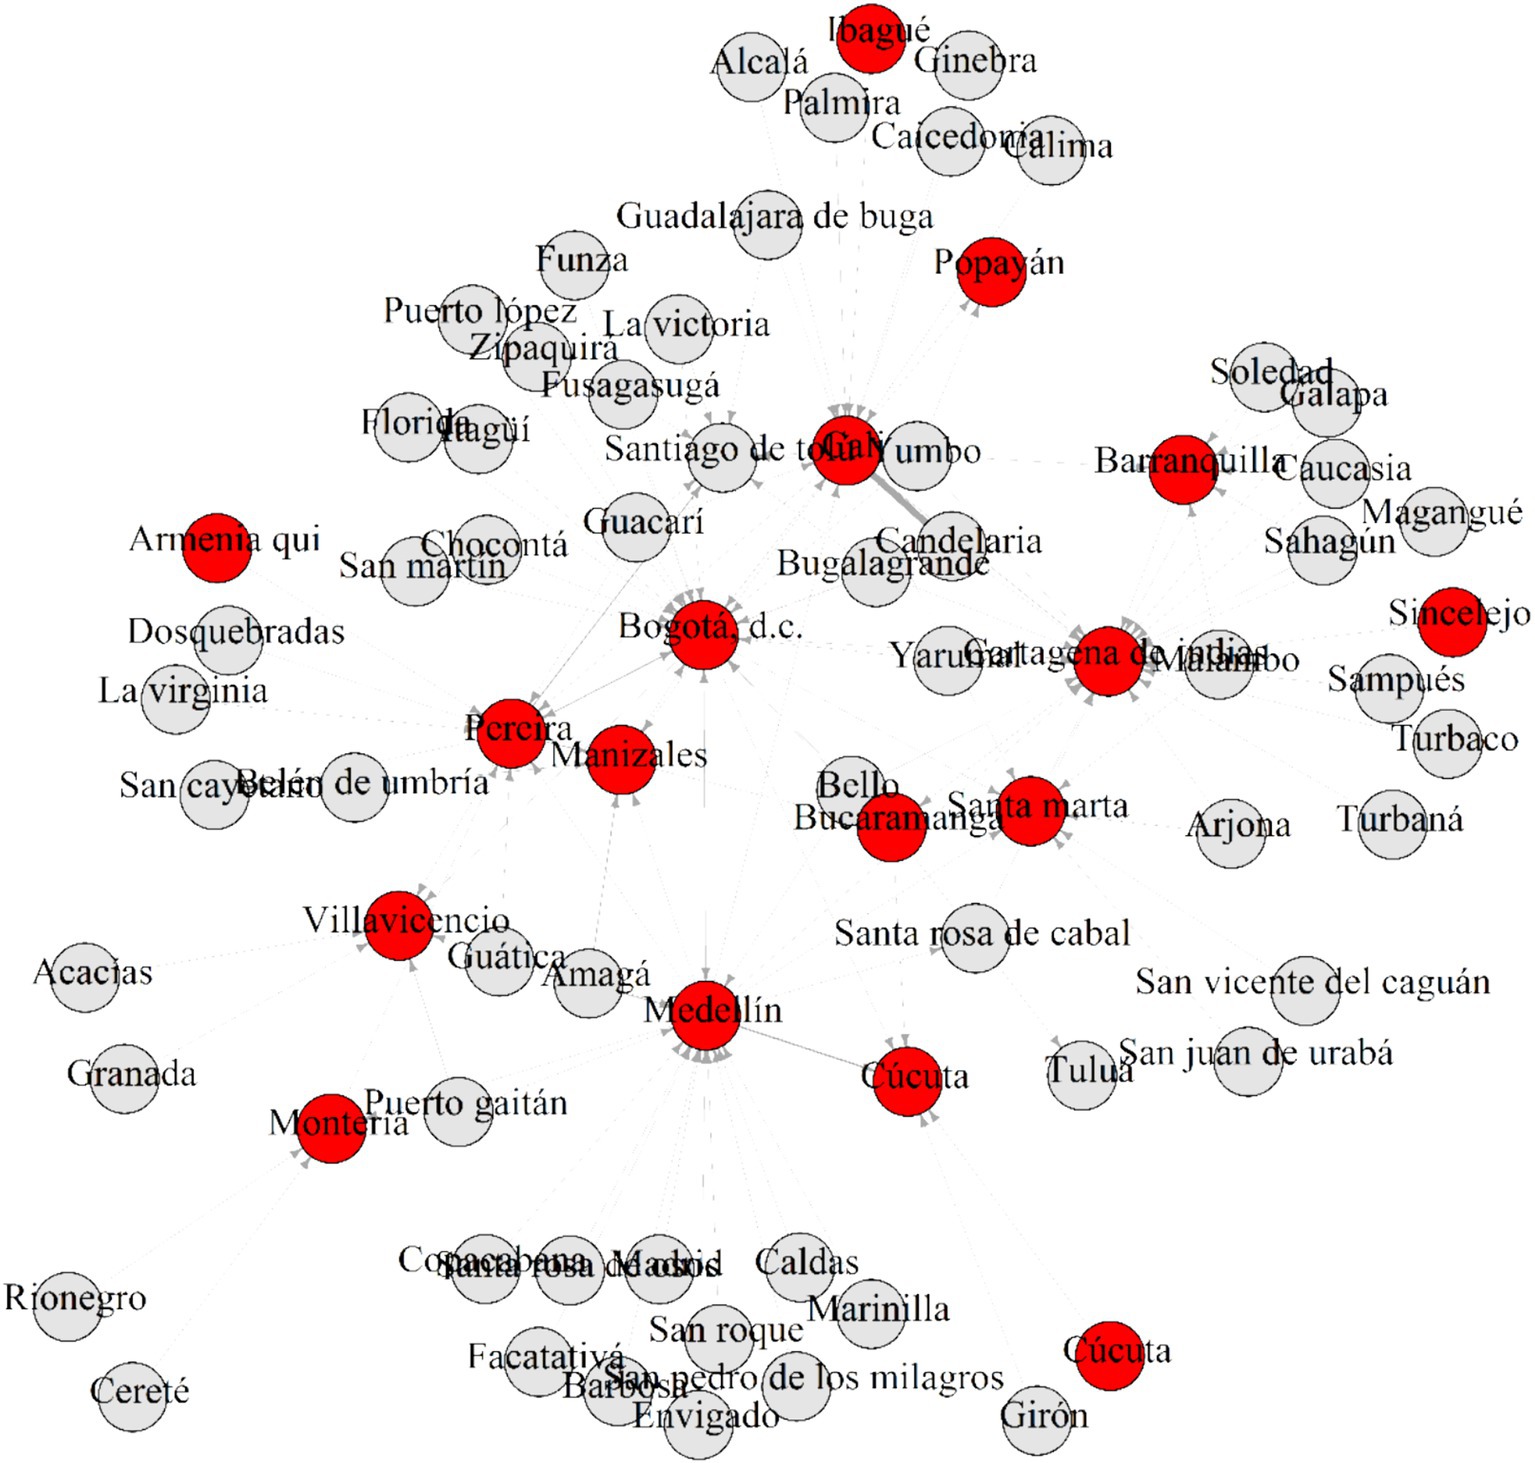
Figure 4. Pork supply network in Colombia in the year 2022.
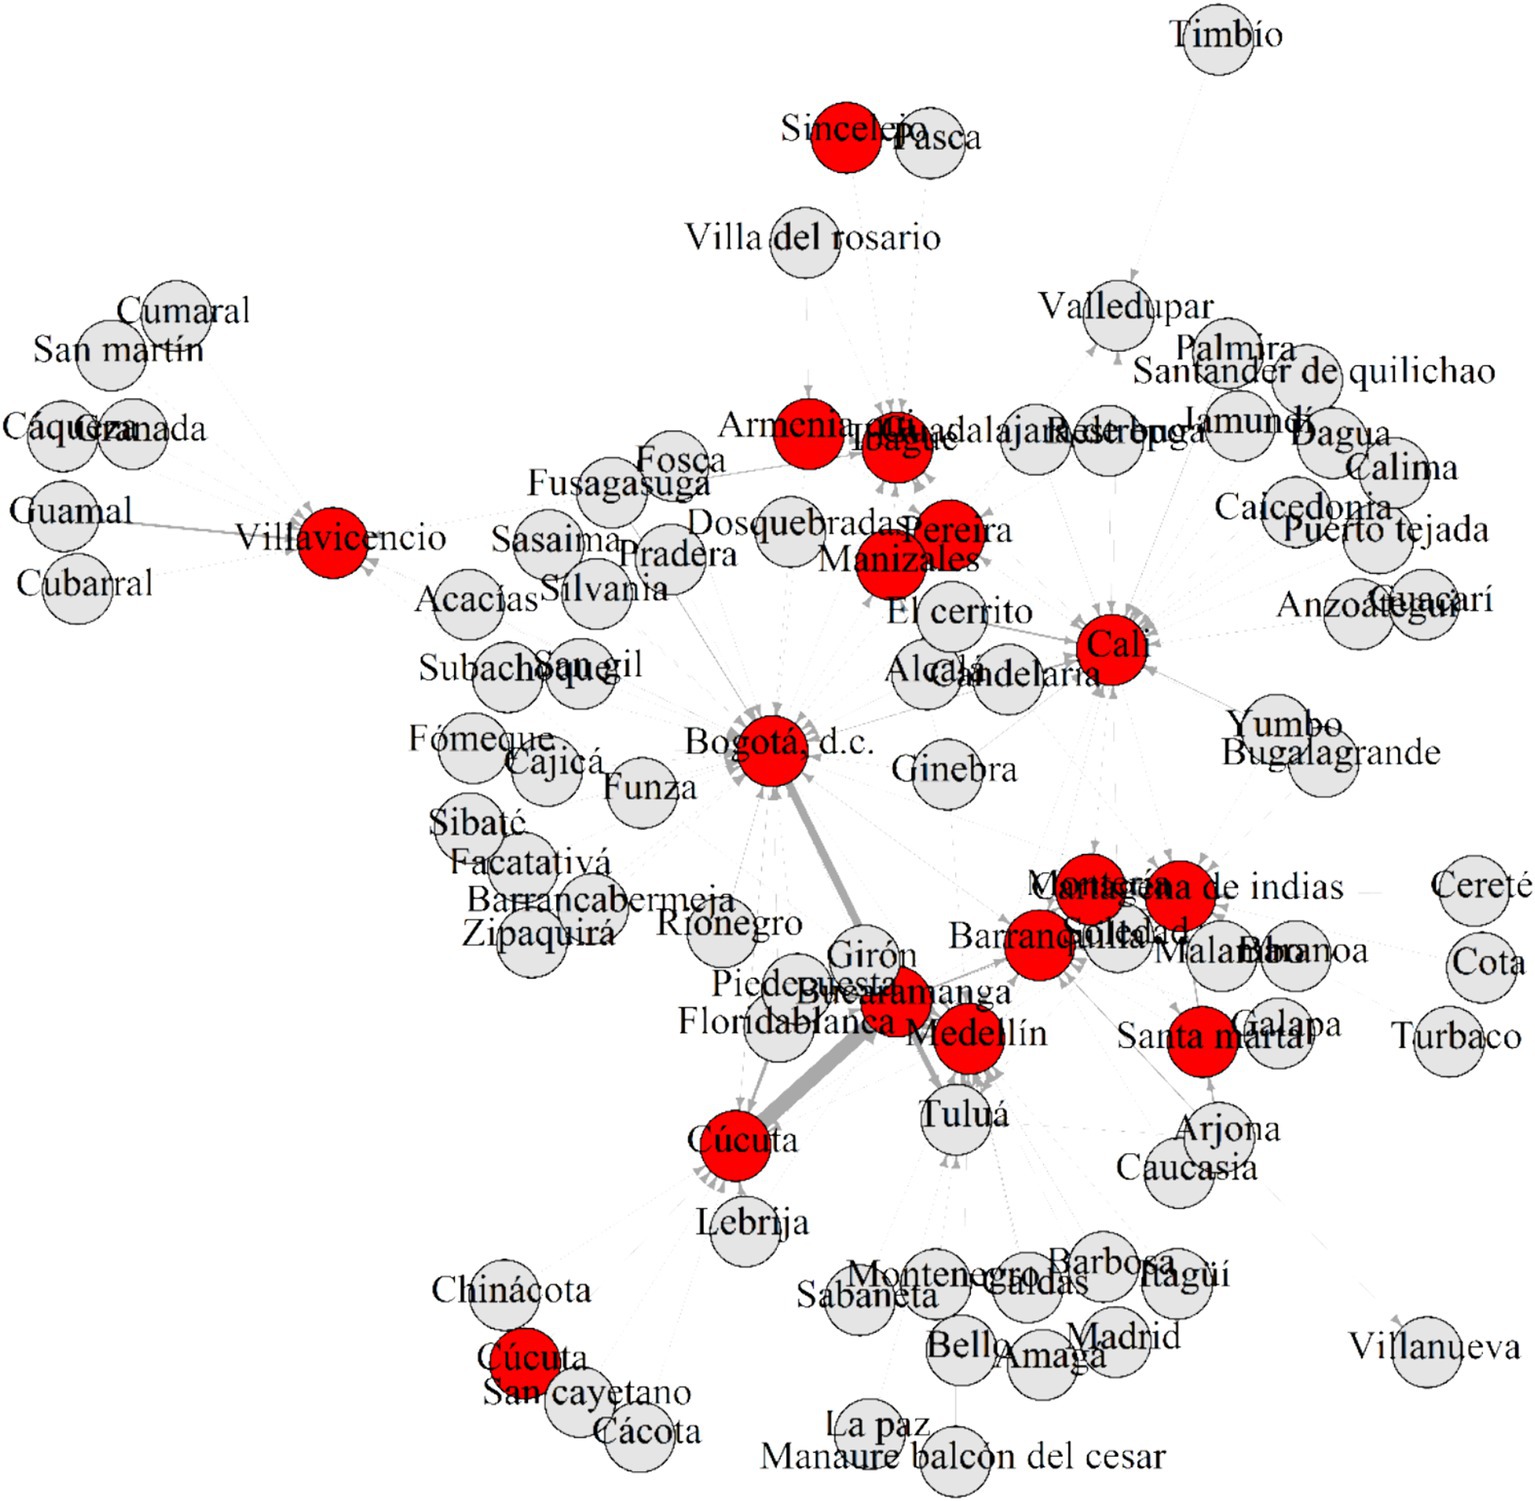
Figure 5. Chicken supply network in Colombia in the year 2022.
Bogota stands out for its high connectivity with numerous production areas, reflecting its central role in the network illustrated in Figure 3. Cali and Medellín are also important nodes due to their capacity to redistribute beef to other regions of the country. Bucaramanga and Villavicencio act as strategic points connecting various production and consumption areas, while Cartagena, being a maritime port, facilitates both the entry and exit of goods.
This centrality is visually represented in Figure 3, where the red nodes concentrate most supply links. The high centrality of these nodes not only ensures efficiency in the distribution of beef but also provides resilience to the network against disruptions. The ability of these nodes to act as key intermediaries facilitates the continuous flow of supplies. The SNA results underscore the importance of these nodes in maintaining a robust and efficient supply chain in Colombia.
Beef is the meat that travels the shortest distance between the market of origin and the end market. The WASD to the main cities that beef travels are 4,294 km, the least compared to chicken, 9,219 km, and pork, 7,023 km. For beef, Bogotá, the largest market in Colombia, is the city with the shortest supply routes. One of the reasons is the spatial contiguity of Bogotá. This city is connected to more than 80 municipalities through different roads and accesses, and many of these municipalities are meat producers. For pork and chicken, the city with the shortest supply routes is Barranquilla. On the other hand, the city with the longest travel distance for beef is Cali, and for pork and chicken it is Cucuta (see Table 2).

Table 2. WASD for meat transport for Colombia’s main cities for the period 2019–2022.
The results of the transport emissions analysis are presented in Table 3, which shows the estimated GHG emissions, CF and meat miles emissions (MME) for beef, pork and chicken. Chicken is the meat with the highest GHG emissions from transport, followed by beef and pork. Although beef is the meat with the highest quantities transported until 2021, it presents the lowest WASD, which explains why beef is not shown as meat with the highest GHG emissions in Table 3. The meat with the highest CF is pork: for every kilogram of pork transported in Colombia between 2019 and 2022, an average of 0.387 kg CO2 eq was emitted. But this ranking changes when the MME indicator is calculated. Beef transport generates the highest emissions in terms of kg transported/km traveled. While Colombia’s beef miles are 0.00005533 kg CO2 eq/kg/km between 2019 and 2022, pork miles emissions are similar with 0.000055164 kg CO2 eq/kg/km, and chicken miles emissions are lower with 0.000037446 kg CO2 eq/kg/km (see Table 3).

Table 3. GHG emissions, CF, and MME of beef, pork and chicken in Colombia for the period 2019–2022.
Discussion
The food miles emissions concept has facilitated an environmental efficiency analysis, estimating food transport emissions per kilogram transported and kilometer traveled (European Commission, 2023; Schnell, 2013; Van Passel, 2013). This is an interesting concept from which recommendations for climate change mitigation in the food transport sector can be derived. In general, food miles emissions studies have focused on international food transport, where the potential for emissions is greatest (Blanke and Burdick, 2005; Kissinger, 2012; Mosammam et al., 2018; Pirog and Benjamin, 2005; Velazco-Bedoya et al., 2013). Most studies on local food miles emissions seek to explore the benefits of local consumption by analyzing whether it can reduce emissions associated with food transport (De Cara et al., 2017; Duarte et al., 2019; Schnell, 2013; Striebig et al., 2019; Weber and Matthews, 2008). Moreover, food miles emissions studies have mainly focused on fruit and vegetables, which are the main contributors to total food miles emissions (Bigaran Aliotte and Ramos De Oliveira, 2022; Blanke and Burdick, 2005; du Plessis et al., 2022).
As the CF of beef is the highest of all food products when considering the whole life cycle, with emissions related to on-farm activities and land use change accounting for more than 90% of the beef CF (Ritchie, 2020), most CF studies of livestock value chains have focused on the farm level (Aluwong and Wuyep, 2011; Barthelmie, 2022; Buratti et al., 2017; Caro et al., 2014; da SILVA et al., 2023; Desjardins et al., 2012; Dick et al., 2015; Garrido et al., 2022; Gaviria-Uribe et al., 2020; González-Quintero et al., 2021, 2022; Ogino et al., 2016; Place and Mitloehner, 2012; Ruviaro et al., 2015; Sandoval et al., 2023) and very few on beef miles emissions (Kannan et al., 2016; Soysal et al., 2014; Velazco-Bedoya et al., 2013). This study therefore contributes to filling this knowledge gap by estimating beef miles emissions in Colombia.
The results show that GHG emissions from the transport of chicken transport are higher than those from the transport of beef and pork. When looking at the CF considering the quantities transported, the highest CF is from pork transport. But when estimating the MME indicator considering quantities transported and distance, the highest MME are from beef transport. This means that the unitary emissions impact of beef production is greater than pork and chicken production not only when considering the whole supply chain (Ritchie, 2020), but also when considering only transport. Ritchie (2020) estimates that the average global CF of beef is 60 kg CO2 eq/kg beef, of which only 0.3 kg CO2 eq/kg beef is attributable to transport. The results of this study suggest that the BME for Colombia is 0.238 kg CO2 eq/kg beef, which is lower but similar to this world average.
A few studies have also analyzed beef miles emissions, but mostly focused on export supply chains. Soysal et al. (2014) developed a multi-objective linear programming (MOLP) model for a generic beef logistics network problem. They estimated that the GHG emissions from transport associated with beef exports from Nova Andradina, Mato Grosso do Sul, Brazil to Europe. The authors found that GHG emissions amount to 127 tons CO2 eq when logistic costs are minimized and to 113 tons CO2 eq when emissions are minimized. Velazco-Bedoya et al. (2013) also studied the GHG emissions from the transport of beef from Brazil to Europe, but their study has a broader scope as it includes more regions of origin of the meat and estimates the indicator of CF from transport. The authors calculated that beef has to travel 11,633 km to get from Brazil to Europe, generating a CF equal to 0.3382 kg CO2 eq/kg of beef, with 11.8% of this CF corresponding to road transport within Brazil. For comparison with this study, the CF indicator associated with national beef transport was calculated to be 0.0399 kg CO2 eq/ kg of beef, which is higher than the CF estimated in for the national transport in Colombia for this study, 0.000238 kg CO2 eq/kg of beef. Kannan et al. (2016) applied a model to estimate energy consumption and GHG emissions from beef transport in the Southern Great Plains region, United States. Their results indicate that a truckload of beef in the study region travels on average 326 km. Fuel consumption amounts to 24 liters of fossil fuel per 1,000 kg of boneless beef, resulting in GHG emissions of 83 kg CO2 eq. The BME indicator calculated for the Southern Great Plains region is 0.00025 kg CO2 eq/kg of beef/km transported, which is higher than the BME indicator estimated for Colombia. These studies are presented for illustrative purposes. As can be seen, there are large differences between the results because of the particularities of each study. Among the most important differences are (a) the emission factors – our study uses emission factors calculated specifically for Colombia; and (b) the level of information – our study is more limited in terms of information; we estimate emissions from slaughterhouses to national consumption centers. Other studies with more complete information estimate emissions from farms to slaughterhouses and from slaughterhouses to national consumption centers, even to collection points for exports such as seaports and airports.
The high intensity and dependence of the beef supply structure reveal potential risks and vulnerabilities in the system by facing external shocks. An intermediation of 40% shows that out of 100 cargo trips, 40 return to the same producing municipalities. This situation can be explained by the effects of public health regulations for slaughterhouses and beef markets (Ministerio de Protección Social, 2007) that led to the closure of numerous establishments. In Colombia, in order to guarantee the sanitary quality of meat production, large slaughterhouses only operate in the main cities, which implies that the animals have to travel from the municipalities to the cities to be slaughtered and that the meat has to return to the municipalities to be commercialized. This issue is currently re-emerging in the political arena, as the government is planning to issue a new amendment to the regulation decree to allow the operation of municipal slaughterhouses as a complementary strategy to reduce beef prices, which could have an impact on the transport CF. This amended decree would reduce the number of trips required to deliver meat to the commercial centers in the municipalities, but requires a strict surveillance and control process to ensure that small municipal slaughterhouses comply with all health regulations. The above policy measure aims to promote local food consumption, as recommended, for example, by Coley et al. (2009) and Striebig et al. (2019). Colombia is a country with a complicated geography, which increases travel distances and with it fuel consumption and GHG emissions. Additionally, there is a significant delay in the development of the country’s road network. For food transportation, it is necessary for the National Government to prioritize investments to complete and improve Colombia’s road network, thereby reducing distances and increasing the speed at which vehicles can travel, two factors fundamental to reducing fuel consumption and GHG emissions.
Conclusion
This study is a first approximation to the estimation of the BME indicator for national meat transport in Colombia. In Colombia the MME indicator for beef is larger than for pork and chicken. Despite the comparatively small contribution to overall GHG emissions, it is important to develop comprehensive approaches and strategies to reduce beef transport emissions, recognizing the role of the beef supply network, transport distances, infrastructure, and technology beyond emissions related to on-farm practices and land use change. The beef supply network in Colombia is characterized by the existence of several supplying regions that send beef to a small group of trading partners. In terms of supply distance, Bogotá, the largest market in Colombia, requires transport over the shortest distance to source beef. On the other hand, Cali, a city located in the southwest of the country, requires transport over the longest distance to source beef. In addition, chicken is found to generate the highest amount of GHG emissions due to transport, followed by beef and pork. These findings highlight the importance of considering supply patterns and associated GHG emissions when planning sustainability strategies for the meat industry in Colombia.
Comparing the results of this study with studies from Brazil and the United States, it appears that BME in Colombia have a lower environmental impact than in these countries. However, this study is limited to the transport of beef from the slaughterhouse to the end markets, which means that the indicator is underestimated. For future BME studies in Colombia, it would be important to also estimate emissions from transport from the farm to the slaughterhouse. Moreover, it would also be interesting to estimate the CF and BME of beef exports, as has been done in Brazil. Reducing emissions from beef transport in Colombia will require efforts from different stakeholders. The Government, particularly the Ministry of Transport, must commit to expanding and improving the country’s road infrastructure to reduce the distances traveled. Stakeholders in the beef sector should, furthermore, work on strategies to bring production and consumption centers closer together, encouraging local consumption and improving the use of vehicles by utilizing all available loading capacity. These strategies would not only generate environmental benefits by reducing emissions, but also economic benefits by reducing transport costs.
To expand this work, future studies are required that include information on travel distance from the farms to the collection centers, which was a limitation of our study. It would also be interesting to initiate causal inference studies that allow to identify specific points in the meat transportation chain with potential for improvement to reduce emissions.
Data availability statement
The raw data supporting the conclusions of this article will be made available by the authors, without undue reservation.
Author contributions
JC: Conceptualization, Data curation, Formal analysis, Methodology, Resources, Software, Writing – original draft, Writing – review & editing. CG: Conceptualization, Funding acquisition, Methodology, Resources, Supervision, Writing – original draft, Writing – review & editing. AL: Writing – original draft, Writing – review & editing. JF: Writing – original draft, Writing – review & editing. AB: Writing – original draft, Writing – review & editing. NT: Writing – original draft, Writing – review & editing. SB: Conceptualization, Funding acquisition, Project administration, Resources, Supervision, Writing – original draft, Writing – review & editing.
Funding
The author(s) declare that financial support was received for the research, authorship, and/or publication of this article. This work was funded by the One CGIAR Initiatives on National Policies and Strategies and Livestock & Climate (L&C). The funders had no role in the design of the study in the collection, analyses, or interpretation of data; in the writing of the manuscript, or in the decision to publish the results.
Acknowledgments
This work was undertaken as part of the One CGIAR Initiatives on National Policies and Strategies and Livestock & Climate (L&C). Under the National Policies and Strategies Initiative, it contributes especially to PlaSA Colombia, which integrates information on Colombia’s food systems. We thank all donors who globally support our work through their contributions to the CGIAR System. CGIAR is a global research partnership for a food-secure future. Its science is carried out by 15 Research Centres in close collaboration with hundreds of partners across the globe.
Conflict of interest
The authors declare that the research was conducted in the absence of any commercial or financial relationships that could be construed as a potential conflict of interest.
Publisher’s note
All claims expressed in this article are solely those of the authors and do not necessarily represent those of their affiliated organizations, or those of the publisher, the editors and the reviewers. Any product that may be evaluated in this article, or claim that may be made by its manufacturer, is not guaranteed or endorsed by the publisher.
Author disclaimer
The views expressed in this document may not be taken as the official views of these organizations.
Supplementary material
The Supplementary material for this article can be found online at: https://www.frontiersin.org/articles/10.3389/fsufs.2024.1416629/full#supplementary-material
References
Agrosavia. (2023). Mesa de Ganadería Sostenible. Available online at: https://www.agrosavia.co/noticias/agrosavia-sede-florencia-asume-secretar%C3%ADa-t%C3%A9cnica-de-la-mesa-de-ganader%C3%ADa-sostenible (Accessed September 18, 2024).
Akhtar, N. (2014). Social network analysis tools. Fourth International Conference on Communication Systems and Network Technologies, 388–392.
Aluwong, T., and Wuyep, P. A. (2011). Livestock-environment interactions: methane emissions from ruminants. Afr. J. Biotechnol. 10, 1265–1269. doi: 10.5897/AJB10.1117
Amell-Arrieta, A., Chejne-Janna, F., López-López, D., Forero, C., Herrera, B., Alvarado-Torres, P., et al. (2016). Consultoría técnica para el fortalecimiento y mejora de la base de datos de factores de emisión de los combistobles colombianos-FECOC. Available online at: http://www.upme.gov.co/calculadora_emisiones/aplicacion/Informe_Final_FECOC.pdf (Accessed September 18, 2024).
Areas Venegas, J. (2004). Ganadería, paisaje y región: una historia ecológica y social de la orinoquía. Available online at: https://www.researchgate.net/publication/315709137 (Accessed September 18, 2024).
Asres, A., Sölkner, J., Puskur, R., and Wurzinger, M. (2012). The impact of social networks on dairy technology adoption in north-West Ethiopia. Paper presented at the Tropentag 2012, Göttingen, Germany, 19–21.
Ballingall, J., and Winchester, N. (2010). Food miles: starving the poor? World Econ. 33, 1201–1217. doi: 10.1111/j.1467-9701.2010.01270.x
Barlow, J., Ewers, R. M., Anderson, L., Aragao, L. E. O. C., Baker, T. R., Boyd, E., et al. (2011). Using learning networks to understand complex systems: a case study of biological, geophysical and social research in the Amazon. Biol. Rev. 86, 457–474. doi: 10.1111/j.1469-185X.2010.00155.x
Barthelmie, R. J. (2022). Impact of dietary meat and animal products on GHG footprints: the UK and the US. Climate 10:43. doi: 10.3390/cli10030043
Bigaran Aliotte, J. T., and Ramos De Oliveira, A. L. (2022). Multicriteria decision analysis for fruits and vegetables routes based on the food miles concept Análisis de decisiones multicriterio para rutas de frutas y verduras basado en el concepto de millas de alimentos. FCA UNCuyo 54, 97–108. doi: 10.48162/rev.39.069
Blanco-Murcia, L., and Ramos-Mejía, M. (2019). Sustainable Diets and Meat Consumption Reduction in Emerging Economies: Evidence from Colombia. Sustainability. 11:6595. doi: 10.3390/su11236595
Blanke, M., and Burdick, B. (2005). Food (miles) for thought - energy balance for locally-grown versus imported apple fruit (3 pp). Environ. Sci. Pollut. Res. Int. 12, 125–127. doi: 10.1065/espr2005.05.252
Boarnet, M. G. (2010). “Planning, climate change, and transportation: thoughts on policy analysis” in Transportation research part a: Policy and practice, vol. 44 (Amsterdam: Elsevier Ltd.), 587–595.
Buratti, C., Fantozzi, F., Barbanera, M., Lascaro, E., Chiorri, M., and Cecchini, L. (2017). Carbon footprint of conventional and organic beef production systems: an Italian case study. Sci. Total Environ. 576, 129–137. doi: 10.1016/j.scitotenv.2016.10.075
Burkart, S., Díaz, M. F., Enciso-Valencia, K., Urrea, J. L., Charry-Camacho, A., and Triana-Ángel, N. (2020). COVID-19 and the bovine livestock sector in Colombia: current and potential developments, impacts and mitigation options. CIAT. Publica 498, 1–36. hdl.handle.net/10568/108354
Caputo, V., Nayga, R. M., and Scarpa, R. (2013). Food miles or carbon emissions? Exploring labelling preference for food transport footprint with a stated choice study. Aust. J. Agric. Resour. Econ. 57, 465–482. doi: 10.1111/1467-8489.12014
Caro, D., Davis, S. J., Bastianoni, S., and Caldeira, K. (2014). Global and regional trends in greenhouse gas emissions from livestock. Clim. Chang. 126, 203–216. doi: 10.1007/s10584-014-1197-x
Cervantes, L., Caro, A., Baca, Pérez, Alzamora, F., and Vela, S. (2016). Fundamentos de microeconomía Teoría y práctica.
Coley, D., Howard, M., and Winter, M. (2009). Local food, food miles and carbon emissions: a comparison of farm shop and mass distribution approaches. Food Policy 34, 150–155. doi: 10.1016/j.foodpol.2008.11.001
Coley, D., Howard, M., and Winter, M. (2011). Food miles: time for a re-think? Br. Food J. 113, 919–934. doi: 10.1108/00070701111148432
da Silva, A. A., Elabras-Veiga, L. B., de Souza, S. L. Q., and Araújo, M. G. (2023). Life cycle assessment of minas frescal cheese and cured minas cheese: a comparative analysis. Food Sci. Technol. 43:109522. doi: 10.1590/fst.109522
DANE. (2022). SIPSA. Available online at: https://www.dane.gov.co/index.php/servicios-al-ciudadano/servicios-informacion/sipsa (Accessed September 18, 2024).
De Cara, S., Fournier, A., and Gaigné, C. (2017). Local food, urbanization, and transport-related greenhouse gas emissions. J. Reg. Sci. 57, 75–108. doi: 10.1111/jors.12299
Desjardins, R. L., Worth, D. E., Vergé, X. P. C., Maxime, D., Dyer, J., and Cerkowniak, D. (2012). Carbon footprint of beef cattle. Sustain. For. 4, 3279–3301. doi: 10.3390/su4123279
Dick, M., Da Silva, M. A., and Dewes, H. (2015). Mitigation of environmental impacts of beef cattle production in southern Brazil - evaluation using farm-based life cycle assessment. J. Clean. Prod. 87, 58–67. doi: 10.1016/j.jclepro.2014.10.087
DNP. (2018). Política de Crecimiento Verde. Available online at: https://colaboracion.dnp.gov.co/cdt/conpes/econ%C3%B3micos/3934.pdf (Accessed September 18, 2024).
du Plessis, M. J., van Eeden, J., and Goedhals-Gerber, L. L. (2022). Distribution chain diagrams for fresh fruit supply chains: a baseline for emission assessment. J. Transport Supply Chain Manag. 16:769. doi: 10.4102/jtscm.v16i0.769
Duarte, G. T., de Alencar Nääs, I., Innocencio, C. M., da Silva Cordeiro, A. F., and da Silva, R. B. T. R. (2019). Environmental impact of the on-road transportation distance and product volume from farm to a fresh food distribution center: a case study in Brazil. Environ. Sci. Pollut. Res. 26, 33694–33701. doi: 10.1007/s11356-019-06461-8
European Commission. (2023). Field to fork: global food miles generate nearly 20% of all CO2 emissions from food. Field to fork: global food miles generate nearly 20% of all CO2 emissions from food. Available online at: https://environment.ec.europa.eu/news/field-fork-global-food-miles-generate-nearly-20-all-co2-emissions-food-2023-01-25_en (Accessed September 18, 2024).
FAO. (2022). Modelo de Evaluación Ambiental de la Ganadería Mundial (GLEAM). Available online at: https://www.fao.org/gleam/results/es (Accessed September 18, 2024).
FAO. (2023). Livestock and the environment. Livestock and the Environment. Available online at: https://www.fao.org/livestock-environment/en (Accessed September 18, 2024).
Fedegan. (2023). Cifras del sector ganadero. Cifras Del Sector Ganadero. Available online at: https://www.fedegan.org.co/estadisticas/general (Accessed September 18, 2024).
García, H. (2014). Deforestación en Colombia: Retos y perspectivas. Bogotá, Colombia: FEDESARROLLO. Available online at: https://pdfs.semanticscholar.org/64e3/e658271cb0c008a87ab3176079b7e9a51b66.pdf (Accessed September 18, 2024)
Garrido, A. P., Tovar Bernal, F., Fontanilla, J. D., Camargo Caicedo, Y., and Vélez-Pereira, A. M. (2022). Assessment of livestock greenhouse gases in Colombia between 1995 and 2015. Heliyon 8:e12262. doi: 10.1016/j.heliyon.2022.e12262
Gaviria-Uribe, X., Bolivar, D. M., Rosenstock, T. S., Molina-Botero, I. C., Chirinda, N., Barahona, R., et al. (2020). Nutritional quality, voluntary intake and enteric methane emissions of diets based on novel Cayman grass and its associations with two Leucaena shrub legumes. Front. Vet. Sci. 7:579189. doi: 10.3389/fvets.2020.579189
González-Quintero, R., Bolívar-Vergara, D. M., Chirinda, N., Arango, J., Pantevez, H., Barahona-Rosales, R., et al. (2021). Environmental impact of primary beef production chain in Colombia: carbon footprint, non-renewable energy and land use using life cycle assessment. Sci. Total Environ. 773:145573. doi: 10.1016/j.scitotenv.2021.145573
González-Quintero, R., van Wijk, M. T., Ruden, A., Gómez, M., Pantevez, H., Castro-Llanos, F., et al. (2022). Yield gap analysis to identify attainable milk and meat productivities and the potential for greenhouse gas emissions mitigation in cattle systems of Colombia. Agric. Syst. 195:103303. doi: 10.1016/j.agsy.2021.103303
Huertas, S., Gil, A., Piaggio, J., and van Eerdenburg, F. (2010). Transportation of beef cattle to slaughterhouses and how this relates to animal welfare and carcase bruising in an extensive production system. Anim. Welf. 19, 281–285. doi: 10.1017/S0962728600001664
ICA. (2016). La Guía Sanitaria de Movilización de Animales único documento para movilizar el ganado. La Guía Sanitaria de Movilización de Animales Único Documento Para Movilizar El Ganado. Available online at: https://www.ica.gov.co/noticias/pecuaria/2016/la-guia-sanitaria-de-movilizacion-de-animales-unic (Accessed September 18, 2024).
IDEAM. (2015). Inventario Nacional de Gases de Efecto Invernadero. Available online at: http://www.cambioclimatico.gov.co/inventario-nacional-de-gases-efecto-invernadero (Accessed September 18, 2024).
International Energy Agency. (2022). Nationally determined contribution (NDC) to the Paris agreement: Colombia. Nationally determined contribution (NDC) to the Paris agreement: Colombia. Available online at: https://www.iea.org/policies/13461-nationally-determined-contribution-ndc-to-the-paris-agreement-colombia (Accessed September 18, 2024).
IPCC. (2006). Intergovernmental panel on climate change. Introduction to the 2006 IPCC guidelines for National Greenhouse gas Inventories. Available online at: https://www.ipcc-nggip.iges.or.jp/public/2006gl/pdf/2_Volume2/V2_1_Ch1_Introduction.pdf (Accessed September 18, 2024).
IPCC. (2023). Intergovernmental panel on climate change. Available online at: https://www.ipcc.ch/languages-2/spanish/ (Accessed September 18, 2024).
James, S. J., and James, C. (2010). The food cold-chain and climate change. Food Res. Int. 43, 1944–1956. doi: 10.1016/j.foodres.2010.02.001
Kannan, N., Saleh, A., and Osei, E. (2016). Estimation of energy consumption and greenhouse gas emissions of transportation in beef cattle production. Energies 9:960. doi: 10.3390/en9110960
Kissinger, M. (2012). International trade related food miles - the case of Canada. Food Policy 37, 171–178. doi: 10.1016/j.foodpol.2012.01.002
Kreier, F. (2022). Transporting food generates whopping amounts of carbon dioxide. Nature. doi: 10.1038/d41586-022-01766-0
Li, M., Jia, N., Lenzen, M., Malik, A., Wei, L., Jin, Y., et al. (2022). Global food-miles account for nearly 20% of total food-systems emissions. Nature Food 3, 445–453. doi: 10.1038/s43016-022-00531-w
Maia de Souza, D., Petre, R., Jackson, F., Hadarits, M., Pogue, S., Carlyle, C., et al. (2017). A review of sustainability enhancements in the beef value chain: state-of-the-art and recommendations for future improvements. Animals 7:26. doi: 10.3390/ani7030026
MARD. (2022). RESOLUCIÓN NO. 000126 DE 2022. Lineamientos de Política de Gnadería Bovina Sostenible - GBS 2022-2050. Available online at: https://www.minagricultura.gov.co/Normatividad/Resoluciones/RESOLUCI%C3%93N%20NO.%20000126%20DE%202022.pdf (Accessed September 18, 2024).
Ministerio de Agricultura Desarrollo Rural and Ministerio de Minas Energía. (2023). Contenido de alcohol carburante en la mezcla con gasolina motor corriente y extra, el contenido de biocombustible - biodiesel en la mezcla con diésel fósil en el territorio nacional. Available online at: https://www.minenergia.gov.co/documents/7299/Proyecto_resoluci%C3%B3n_estabilizaci%C3%B3n_mezclas_para_comentarios.pdf (Accessed September 18, 2024).
Ministerio de Ambiente Desarrollo Sostenible. (2022). Cambio Climático. Available online at: http://www.cambioclimatico.gov.co/ (Accessed September 18, 2024).
Ministerio de Protección Social. (2007). DECRETO NÚMERO 1500 DE 2007. Available online at: https://corponarino.gov.co/expedientes/juridica/2007decreto1500.pdf (Accessed September 18, 2024).
Ministerio de Transporte. (2005). Caracterización del Transporte en Colombia Diagnostico y Proyectos de Transporte e Infraestructura. Bogotá, Colombia: Ministerio de Transporte.
Ministerio de Transporte. (2012). Modelo para la determinación de costos de referencia. Bogotá, Colombia: Ministerio de Transporte.
Ministerio de Transporte. (2022). Nuevas reglas para el transporte, manejo y movilización de animales en pie. Nuevas Reglas Para El Transporte, Manejo y Movilización de Animales En Pie. Available online at: https://www.mintransporte.gov.co/publicaciones/10700/nuevas-reglas-para-el-transporte-manejo-y-movilizacion-de-animales-en-pie/
Mosammam, H. M., Sarrafi, M., Nia, J. T., and Mosammam, A. M. (2018). Analyzing the international trade-related food miles in Iran. Outlook on Agriculture 47, 36–43. doi: 10.1177/0030727018761691
Nutresa and GAIA. (2013). Manual de trsnporte limpio. Enfoque Huella de Carbono para el Subsector Transporte Terrestre Automotor de Carga (Grupo Nutresa, Ed.; 1st ed., Vol. 1). Grupo Nutresa. https://www.andi.com.co/Uploads/manual-transporte-limpio.pdf (Accessed September 18, 2024).
Ogino, A., Sommart, K., Subepang, S., Mitsumori, M., Hayashi, K., Yamashita, T., et al. (2016). Environmental impacts of extensive and intensive beef production systems in Thailand evaluated by life cycle assessment. J. Clean. Prod. 112, 22–31. doi: 10.1016/j.jclepro.2015.08.110
Pirog, R., and Benjamin, A. (2005). Calculating food miles for a multiple ingredient food product. Available online at: https://www.leopold.iastate.edu/files/pubs-and-papers/2005-03-calculating-food-miles-multiple-ingredient-food-product.pdf (Accessed September 18, 2024).
Place, S. E., and Mitloehner, F. M. (2012). Beef production in balance: considerations for life cycle analyses. Meat Sci. 92, 179–181. doi: 10.1016/j.meatsci.2012.04.013
PlaSA Colombia. (2024). Explora PlaSA. Available online at: https://plasacolombia.com/sistema-alimentario/ (Accessed September 18, 2024).
Ritchie, H. (2020). You want to reduce the carbon footprint of your food? Focus on what you eat, not whether your food is local. Our World in Data. Available online at: https://ourworldindata.org/food-choice-vs-eating-local#article-citation (Accessed September 18, 2024).
Rodriguez, J. P., Ruiz-Ochoa, M. A., and Meneses, A. (2020). Revisión de los factores de emisión en las metodologías de huella de carbono en Colombia. Espacios 41, 74–84. doi: 10.48082/espacios-a20v41n47p06
Romero-Peñuela, M. H., Uribe-Velásquez, L. F., and Sánchez-Valencia, J. A. (2010). El Transporte Terrestre de bovinos y sus implicaciones en el Bienestar animal: Revisión. Biosalud 9, 67–82.
Ruviaro, C. F., De Léis, C. M., Lampert, V. D. N., Barcellos, J. O. J., and Dewes, H. (2015). Carbon footprint in different beef production systems on a southern Brazilian farm: a case study. J. Clean. Prod. 96, 435–443. doi: 10.1016/j.jclepro.2014.01.037
Sandoval, D. F., Florez, J. F., Enciso Valencia, K. J., Sotelo Cabrera, M. E., and Stefan, B. (2023). Economic-environmental assessment of silvo-pastoral systems in Colombia: an ecosystem service perspective. Heliyon 9:e19082. doi: 10.1016/j.heliyon.2023.e19082
Sanz Menéndez, L. (2003). Análisis de redes sociales: o cómo representar las estructuras sociales subyacentes. Documento de Trabajo IPP, 07-2003. Apuntes de Ciencia y Tecnología. 7, 21–29. Available online at: http://hdl.handle.net/10261/1569 (Accessed September 18, 2024).
Schnell, S. M. (2013). Food miles, local eating, and community supported agriculture: putting local food in its place. Agric. Hum. Values 30, 615–628. doi: 10.1007/s10460-013-9436-8
Sharma, D., and Surolia, A. (2013). “Degree centrality” in Encyclopedia of systems biology (New York: Springer), 558.
Soysal, M., Bloemhof-Ruwaard, J. M., and van der Vorst, J. G. A. J. (2014). Modelling food logistics networks with emission considerations: the case of an international beef supply chain. Int. J. Prod. Econ. 152, 57–70. doi: 10.1016/j.ijpe.2013.12.012
Statista. (2023). Volumen de Carne Consumida a Nivel Mundial de 1990 a 2022, Por Tipo de Carne. Available online at: https://es.statista.com/estadisticas/1330024/consumo-de-carne-a-nivel-mundial-por-tipo/#:~:text=El%20consumo%20mundial%20de%20carne,de%20134%20millones20en202022 (Accessed September 18, 2024).
Striebig, B., Smitts, E., and Morton, S. (2019). Impact of transportation on carbon dioxide emissions from locally vs. Non-locally sourced food. Emerg. Sci. J. 3, 222–234. doi: 10.28991/esj-2019-01184
Tassou, S. A., De-Lille, G., and Ge, Y. T. (2009). Food transport refrigeration – approaches to reduce energy consumption and environmental impacts of road transport. Appl. Therm. Eng. 29, 1467–1477. doi: 10.1016/j.applthermaleng.2008.06.027
U.S. Department of Agriculture. (2015). Growth in meat consumption for developing and emerging economies surpasses that for the developed world. Growth in meat consumption for developing and emerging economies surpasses that for the developed world. Available online at: https://www.ers.usda.gov/amber-waves/2015/july/growth-in-meat-consumption-for-developing-and-emerging-economies-surpasses-that-for-the-developed-world/ (Accessed September 18, 2024).
UK GOV. (2020). Greenhouse gas reporting: conversion factors 2020. Available online at: https://www.gov.uk/government/publications/greenhouse-gas-reporting-conversion-factors-2020
UN Environment Programme. (2024). Transport. We promote sustainable, low-emission transport and work to reduce the Sector’s contribution to air pollution and climate change. Available online at: https://www.unep.org/explore-topics/energy/what-we-do/transport (Accessed September 18, 2024).
United Nations. (2015). Sustainable development goals. Sustainable Development Goals. Available online at: https://sdgs.un.org/goals (Accessed September 18, 2024).
University of Sydney. (2022). Fifth of global food-related emissions due to transport. Fifth of Global Food-Related Emissions Due to Transport. Available online at: https://www.sydney.edu.au/news-opinion/news/2022/06/21/fifth-of-global-food-related-emissions-due-to-transport.html (Accessed September 18, 2024).
UPME. (2003). Factores de emisión de los combustibles colombianos. Available online at: https://bdigital.upme.gov.co/bitstream/handle/001/1285/17%20Factores%20de%20emision%20de%20combustibles.pdf;jsessionid=3D9A06A84F6C56F3046FAE2C63F01CEA?sequence=18 (Accessed September 18, 2024).
Van Passel, S. (2013). Food miles to assess sustainability: a revision. Sustain. Dev. 21, 1–17. doi: 10.1002/sd.485
Velazco-Bedoya, M. D., Campos, P. M., De Zen, S., and Deblitz, C. (2013). Transport and CO2 emission: beef logistics from Brazil to Europe crop market view project sustainability analysis in dairy production: an study in the main Brazil’s dairy region. View project. Available online at: https://www.researchgate.net/publication/279199448 (Accessed September 18, 2024).
Wakeland, W., Cholette, S., and Venkat, K. (2012). “Food transportation issues and reducing carbon footprint” in Green Technologies in Food Production and Processing. eds. J. Boye and Y. Arcand (Berlin: Springer), 211–236.
Wang, J., Karakoc, D. B., and Konar, M. (2022). The carbon footprint of cold chain food flows in the United States. Environ. Res. 2:021002. doi: 10.1088/2634-4505/ac676d
Keywords: beef miles emissions, greenhouse gases emissions, carbon footprint, sustainability, food systems
Citation: Castillo JM, González CE, Lienert A, Flórez JF, Bravo Parra AM, Triana Ángel N and Burkart S (2024) The carbon footprint of beef transport in Colombia: market connections and distribution networks. Front. Sustain. Food Syst. 8:1416629. doi: 10.3389/fsufs.2024.1416629
Edited by:
Erasmus zu Ermgassen, Université Catholique de Louvain, BelgiumReviewed by:
Felipe Barcellos E. Silva, Instituto de Energia e Meio Ambiente - IEMA, BrazilJunren Wang, University of Illinois at Urbana-Champaign, United States
Deniz Berfin Karakoc, Arizona State University, United States
Copyright © 2024 Castillo, González, Lienert, Flórez, Bravo Parra, Triana Ángel and Burkart. This is an open-access article distributed under the terms of the Creative Commons Attribution License (CC BY). The use, distribution or reproduction in other forums is permitted, provided the original author(s) and the copyright owner(s) are credited and that the original publication in this journal is cited, in accordance with accepted academic practice. No use, distribution or reproduction is permitted which does not comply with these terms.
*Correspondence: Stefan Burkart, cy5idXJrYXJ0QGNnaWFyLm9yZw==