 Natalie Sandlin
 Jiu Lee1
 Marco Zaccaria
 Babak Momeni
- 1Department of Biology, Boston College, Chestnut Hill, MA, United States
- 2Mass Spectrometry Core Facility, Vice Provost for Research, Boston College, Chestnut Hill, MA, United States
Aflatoxins (AFs) are fungal metabolites that ubiquitously contaminate many common food crops and contribute to major foodborne diseases in humans and animals. Known chemical strategies have used strong acids and bases to remove contaminating AF, but these methods often lead to undesired ecological waste issues downstream. In this study, the application of weaker acidic and alkaline conditions to removes two types of AFs, AFB1 and AFG2, is investigated. The results showed that an environment buffered at a pH of 9 reduced AFB1 and AFG2 by more than 50 and 95%, respectively, within 24 h, while acidic conditions did not influence AF levels. The AF degradation was shown to occur through lactone ring opening, a known cause of AF toxicity. Further analysis also provided a putative structure of the AFG2 degradation byproduct. The results confirmed that incubation at a pH of 9 reduced the genotoxicity of AFB1 and found that it was a successful strategy for removing both AFs from artificially contaminated cornmeal. The findings indicated that a weakly alkaline environment had the potential to adequately detoxify AF-contaminated food or feed without the need to apply stronger or harsher basic conditions.
1 Introduction
Aflatoxins (AFs) are fungal secondary metabolites produced by some Aspergillus species, which ubiquitously contaminate common food crops, such as corn, wheat, barley, and oats (Bennett and Klich, 2003; Fernández-Cruz et al., 2010). There are four major types of AFs: AFB1, AFB2, AFG1, and AFG2. The most common and toxic of the AFs is AFB1, which is classified as a Group 1 carcinogen and known to cause major health and economic crises worldwide (Bakirdere et al., 2012). The other major types have reduced toxicity compared to AFB1 but still remain a risk to health outcomes (Adebo et al., 2017). Consumption of AF-contaminated (any type) products leads to serious health effects in both animals and humans, including immunodepression, liver cancer, hormone disorders, and congenital malformation (Mahato et al., 2019).
To prevent the harmful effects of AF contamination, strategies to remove them from food and feed must be implemented. Current decontamination strategies are classified as physical, chemical, and biological methods. Physical methods include sorting, milling, washing, and irradiation steps that have low reproducibility and high cost (Samarajeewa et al., 1990; Grenier et al., 2014; Pankaj et al., 2018); conversely, biological methods consist of using living organisms and/or their products (e.g., microbial enzymes) to remove the toxins, where limitations lie in accurate determination of mechanisms and optimal working conditions (Singh et al., 2014; Abatenh et al., 2017). Alternatively, current chemical methods involve the conversion of AF through applications such as ammonization, ozonation, and peroxidation (Grenier et al., 2014; Freitas-Silva et al., 2021).
A known chemical strategy for AF removal is through the application of strong alkaline or acidic conditions (Samarajeewa et al., 1990; Benkerroum, 2020). For example, Méndez-Albores et al. (2005) found that the addition of 1N aqueous citric acid converted AFB1 into less toxic byproducts. Alternatively, KOH treatment (at a pH of 12) by Vidal et al. (2018) significantly reduced the four major types of AFs to below the limits of detection; however, the study did not detect byproducts or investigate the toxicity of the degradation products. Additionally, in the context of alkaline conditions to eliminate AF from foodstuffs, there are current treatment practices such as alkaline electrolyzed water, alkaline cooking, and nixtamalization (Pérez-Flores et al., 2011; Fan et al., 2013; Zavala-Franco et al., 2020). Nixtamalization is a common and long-used processing technique used in the preparation of masa from corn. This process involves cooking the corn in boiling water containing lime (Ca(OH)2) to alkalinize the environment to a pH value higher than 10 (Guzmán-de-Peña, 2010). While some chemical processing methods can reduce the availability of nutrients in food, the process of nixtamalization can actually increase them. Nixtamalization effectively reduces the levels of AF as well as prepares the maize for downstream use; however, on the industrial scale, it produces large quantities of wastewater, polluted with organic matter and high in pH, that is difficult to dispose of (Pérez-Flores et al., 2011). These examples support the removal of AFs from foods by employing strong alkaline and acidic conditions. However, to deploy these methods, one needs to ensure that the chemicals are fully removed after processing, the nutritional value of the food is not diminished, and the ecological waste is kept to a minimum. These are the factors that limit the use of strong acids or alkalis to remove AF contamination in foods.
In this study, the effects of weaker acidic and alkaline environments on the elimination of AFs, particularly AFB1 and AFG2, is investigated. AFB1 is chosen for its significance in terms of prevalence and toxicity. AFG2, with higher detection sensitivity in our assays, is chosen as a representative of other AF types to explore toxin-specific properties when compared with AFB1. The degradation levels are examined in buffered media with pH values in the range of 4.0–9.0 using the native fluorescence of AFs and mass spectrometry as detection methods. The fluorescence of AF is strongly linked to its lactone ring moiety, also the main actor in AF’s toxicity (Lee et al., 1981). It has been shown that opening of the lactone ring significantly reduces toxicity and fluorescence, making this a reliable proxy for AF detoxification (Lee et al., 1981). Here the degradation products and toxicity of a medium buffered at a pH of 9 is investigated and a weakly alkaline environment is proposed as a means to remove AF from foods during processing.
2 Materials and methods
2.1 Reagents
AFB1 (Cayman Chemical, >98% purity) and AFG2 (Cayman Chemical, >98% purity) were dissolved in methanol (Fisher Chemical, HPLC grade, Cat. No.: A452SK1) to a final concentration of 1 mg/mL for stock solutions.
2.2 Medium and pH buffering
Defined medium was used as the base for all pH testing: KH2PO4 (1.5 g/L; Sigma-Aldrich, >99.0% purity), K2HPO4•3H2O (3.8 g/L; Fisher Scientific, >99.0% purity), (NH4)2SO4 (1.3 g/L; Sigma-Aldrich, >99.0% purity), sodium citrate dihydrate (3.0 g/L; Sigma-Aldrich, >99.0% purity), FeSO4 (1.1 mg/L; Sigma-Aldrich, >99.0% purity), 100× vitamin solution [2 mg/L of biotin (Fisher Scientific, >99.0% purity), 2 mg/L of folic acid (Fisher Scientific, 97% purity), 10 mg/L of pyridoxine-HCl (Sigma-Aldrich, 98% purity), 5 mg/L of thiamine-HCl•2H2O (Sigma-Aldrich, >99.0% purity), 5 mg/L of riboflavin (Sigma-Aldrich, >98% purity), 5 mg/L of nicotinic acid (Thermo Scientific, 99.5% purity), 5 mg/L of D-Ca-pantothenate (Thermo Scientific, >98% purity), 0.1 mg/L of vitamin B12 (Sigma-Aldrich, >98% purity), 5 mg/L of p-aminobenzoic acid (Sigma-Aldrich, >99% purity), and 5 mg/L of lipoic acid (TCI America, >98% purity)] (1 mL), SL-10 trace elements solution [10 mL/L of HCl (25%; 7.7 M), 1.5 g/L of FeCl2•4H2O, 70 mg/L of ZnCl2, 0.1 g/L of MnCl2•4H2O, 6 mg/L of H3BO3, 0.19 g/L of CoCl2•6H2O, 2 mg/L of CuCl2•2H2O, 24 mg/L of NiCl2•6H2O, and 36 mg/L of Na2MoO4•2H2O] (1 mL), 1 M MgCl2 (5 mL), 1 M CaCl2 (1 mL), 100× amino acid stock (see Dedrick et al., 2023 for composition, 10 mL), and glucose (Dextrose, Sigma-Aldrich, 97.5–102.0% anhydrous basis, 4.0 g/L).
Stock solutions of sodium citrate (Sigma-Aldrich, ≥ 99.0% purity), MOPS (3-(N-morpholino)propanesulfonic acid) (Fisher Bioreagents, >97% purity), and Tris–HCl (Sigma-Aldrich, ≥99.0% purity) were made at a concentration of 1 M prior to addition to the base minimal medium at a final concentration of 0.1 M. Media at a pH value of 4.0 were buffered in 0.1 M citrate buffer, at a pH value of 7.0 were buffered in 0.1 M MOPS, and at a pH value of 9.0 were buffered in 0.1 M Tris–HCl.
2.3 Aflatoxin extraction
For each indicated time point, liquid–liquid extraction was used to stop the reaction and extract aflatoxin and putative byproducts. Ethyl acetate (Fisher Chemical, NF grade, Cat. No.: E12420) was added (v/v) to each sample in polypropylene microcentrifuge tubes (Fisherbrand, Cat. No. 14–666-315) and vortexed vigorously for 2 min. Samples were centrifuged at 11,000 × g for 2 min to separate the phases. The top organic layer was transferred to a new microcentrifuge tube. This extraction was repeated twice per sample to increase efficiency. Ethyl acetate was left to evaporate at 65°C. The aflatoxin precipitate was resuspended in 100–200 μL of methanol (Fisher Chemical, HPLC grade, Cat. No.: A452SK1).
2.4 Liquid chromatography–mass spectrometry (LC–MS) assay
In the LC–MS assay, internal calibration was implemented by including reference samples of AFB1 and AFG2 at a known concentration within each run. The area under the curve for the relevant toxin peak (AFB1 or AFG2) of all other samples were normalized to this reference to estimate the concentration of the corresponding toxin.
For the analysis, a Kinetex 2.6 μm EVO C18 column (100 × 2.1 mm) was employed. Mobile phase A: water, 5 mM ammonium acetate (Sigma-Aldrich, 98% purity), 0.5% acetic acid (Fisher Chemical, 99.7% purity). Mobile phase B: Methanol, 5 mM ammonium acetate, 0.5% acetic acid. Flow rate was 350 μL/min. UV detection wavelength was set at 354 and 360 nm. The following gradient method was used in all runs (Table 1).

Table 1. Gradient method used for LC–MS analysis.
The eluent from the column was directed into the electrospray source of an Agilent 6,230 TOF mass spectrometer operated in positive ionization mode. Data was converted into the mzML file format and analyzed using the MZMine software.
Spectral accuracy was measured using MassWorks software (Cernos Bioscience), with the extracted ion isotope pattern from experimental analysis as the control. The predicted structure and exact mass were used for the theoretical spectrum.
2.5 Fluorescence degradation assay
For the fluorescence assay for estimating aflatoxin levels the protocol reported in a previous publication (Zaccaria et al., 2023) was followed. Briefly, buffered medium was aliquoted into sterile microcentrifuge tubes and aflatoxin was added according to desired final concentration (typically 15 μg/mL) per well. Samples were arrayed in black glass-bottom 96-well plates (Nunc™ #165305 96-Well Optical Bottom) at a final volume of 150 μL per well. Standard control of no toxin (medium alone) was used. A BioTek Synergy Mx multi-mode microplate reader was used to monitor optical density at 600 nm (to account for contamination) and fluorescence of aflatoxin at an excitation of 380 nm and emission of 440 nm with a gain of 50 for AFG2 and a gain of 65 for AFB1. Reads were taken at 5 min intervals over 48 h (unless otherwise noted) at 28°C. Output was exported as a text file for downstream analysis and visualization. In the analysis, fluorescence readout in RFU was converted to AFB1 or AFG2 concentrations using a calibration curve, similar to Zaccaria et al., 2023 (Zaccaria et al., 2023). Three replicates were used per condition. Sterile water was placed at the peripheral wells of the 96-well plate to contain evaporation.
For experiments testing fluorescence after extraction, a similar protocol was followed but with single point reads taken in triplicate.
2.6 Genotoxicity assay
The genotoxicity assay was performed, with metabolic activation using S9 rat liver extract, according to the protocol for SOS-ChromoTest™ kit from Environmental Bio-detection Products (Mississauga, ON, Canada). Reagents other than aflatoxin and buffered medium were kit-provided. For the assay, the negative control was composed of a 10% dimethyl sulfoxide (DMSO) solution in sterile water, and the positive control was 2-aminoanthracene (2-AA). Toxin samples were prepared by adding AFB1 to medium buffered at a pH of 9 at a concentration of 15 μg/mL and incubating at 28°C for 48 h. A control of AFB1 in a medium buffered at a pH of 7 (no degradation) incubated under the same conditions was used. A single replicate per condition was used. After incubation, samples underwent extraction via the above described method prior to serial 2-fold dilutions, per the assay protocol. Kit-provided bacterial suspension (Escherichia coli) was added to the toxin samples and incubated at 37°C for 2 h with shaking. Color development was quantified on a BioTek Synergy Mx multi-mode microplate reader with readings at 420 nm to measure cell survival through alkaline phosphatase and at 600 nm to measure SOS system induction via β-galactosidase activity. Readings were taken in three technical replicates. SOS-induction factor (IF) was then calculated according to the provided analysis protocol.
2.7 Cornmeal AF degradation assay
Cornmeal (Indian Head Stone Ground Yellow Cornmeal) was weighed at 300 mg per condition and transferred to 1.5 mL microcentrifuge tubes for sterilization by autoclave. Sterile cornmeal was artificially contaminated with 1 mL of 15 μg/mL AFB1 or AFG2 in sterile water. Dry conditions were immediately dried down overnight on a heat block set to 65°C. Wash conditions were incubated in the AF solution overnight at room temperature, then cornmeal was centrifuged at 5,000 × g for 5 min and supernatant removed. Cornmeal was washed in sterile water three times, then dried down overnight on a heat block set to 65°C. Then, contaminated cornmeal was treated with 1 mL of a medium buffered at a pH of 9 for 48 h at 28°C. After incubation, cornmeal was dried down overnight on a heat block set to 65°C. Uncontaminated cornmeal and contaminated cornmeal without incubation at a pH of 9 were used as controls. All conditions were performed in duplicate.
All cornmeal conditions underwent AF extraction using ethyl acetate. Ethyl acetate (750 μL) was added to each sample in microcentrifuge tubes and vortexed vigorously for 2 min. Samples were centrifuged at 11,000 × g for 2 min. to separate the phases. The top organic layer was transferred to a new microcentrifuge tube. This extraction was repeated twice per sample to increase efficiency. Ethyl acetate was left to evaporate at 65°C. The aflatoxin precipitate was resuspended in 500 μL of LC–MS grade methanol. Fluorescence of the extractions was read according to Fluorescence degradation assay (see section 2.5) with single point reads taken in triplicate and converted to the AFB1 or AFG2 concentrations using a corresponding calibration curve (Zaccaria et al., 2023).
2.8 Statistical analysis and visualization
Analyses were performed in triplicate, with values expressed as the mean ± standard deviation (SD; error bars). Figure 1 shows mean values across time points without SD, as all replicates showed consistent trends. For mass spectrometry data in Figure 2, a representative of the three replicates, all expressing consistent trends, is shown. Figure 3 was generated using Inkscape software [version 1.2.1 (9c6d41e410, 2022-07-14), The Inkscape Project, Boston, MA, United States]. Figures 1 –5 and Supplementary Figures S1–S3, S5 were generated using Matlab software (version R2021a, MathWorks Inc., Natick, MA, United States). Supplementary Figure S4 was generated using MassWorks software (version 6.0, Cerno Biosciences, Las Vegas, NV, United States).
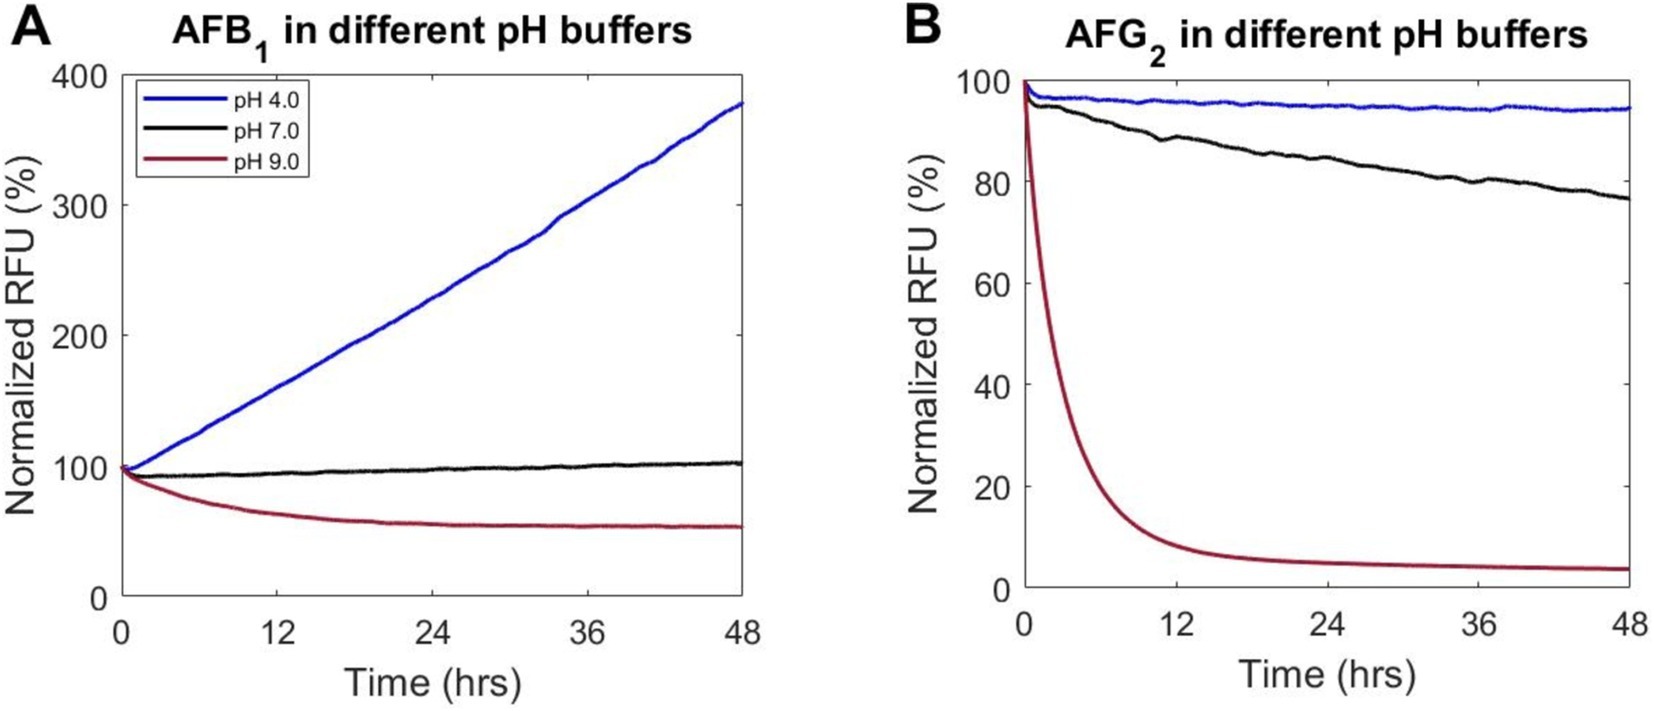
Figure 1. The pH in a buffered medium influences fluorescence readout in AF degradation assay. (A) AFB1 and (B) AFG2 were incubated with buffered medium at three pH values (4.0, 7.0, and 9.0) over 48 h at 28°C with readings for fluorescence of AF taken periodically over the incubation period. Data are the mean of three replicates and all replicates showed consistent trends. Relative Fluorescence Unit (RFU) has been normalized to initial fluorescence.
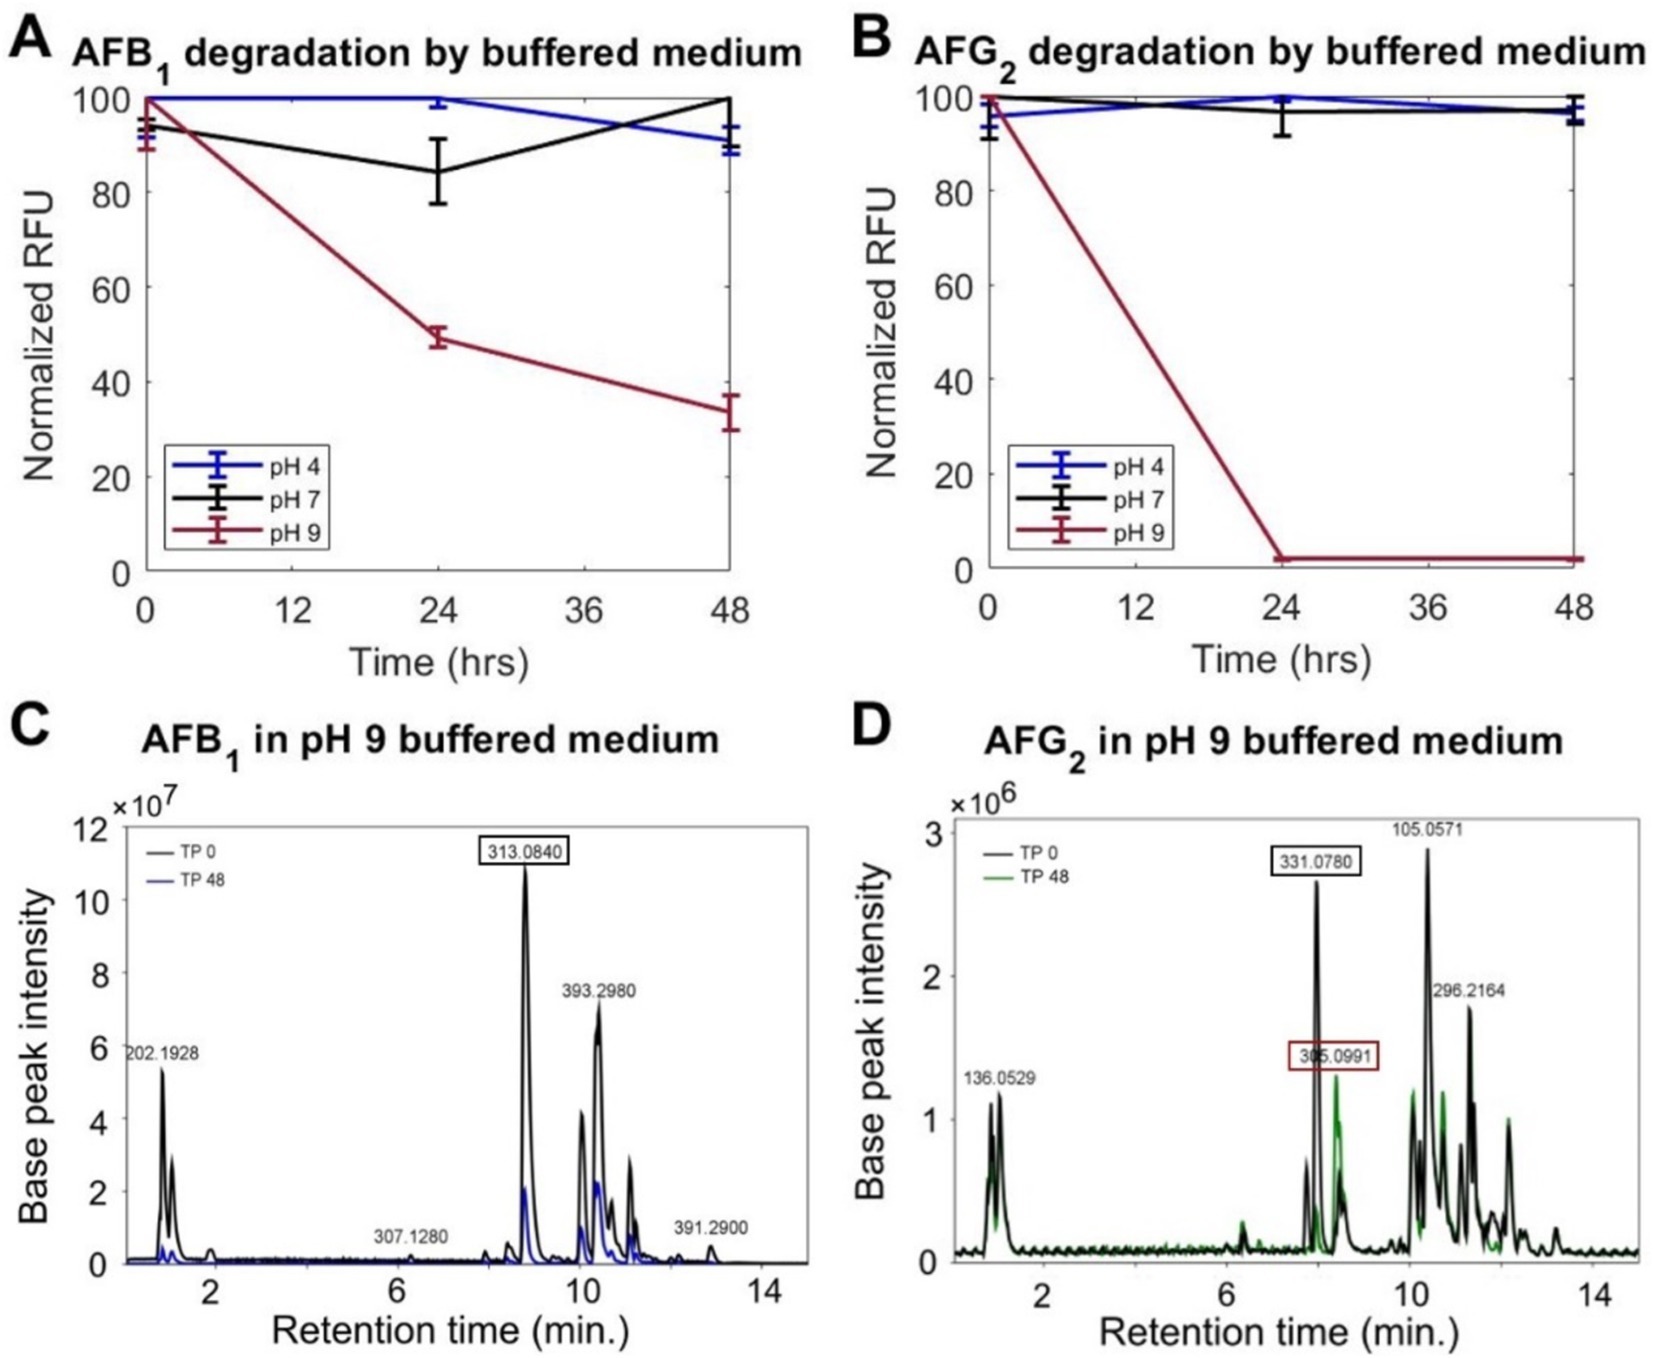
Figure 2. A medium buffered at a pH of 9 degrades AFs. Normalized fluorescence of (A) AFB1 and (B) AFG2 from ethyl acetate extraction after incubation in buffered medium at time points (TP) 0, 24, and 48 h, shows a decrease at a pH of 9, but not at a pH of 4. Data are the mean of three replicates. Error-bar shows the standard deviation. Representative LC–MS analyses at TP 0 and 48 h of incubation in media buffered at a pH of 9 of (C) AFB1 (at an m/z value of 313) and (D) AFG2 (at an m/z value of 331) corroborates the extraction/fluorescence results. The corresponding m/z value is shown for major identified peaks.
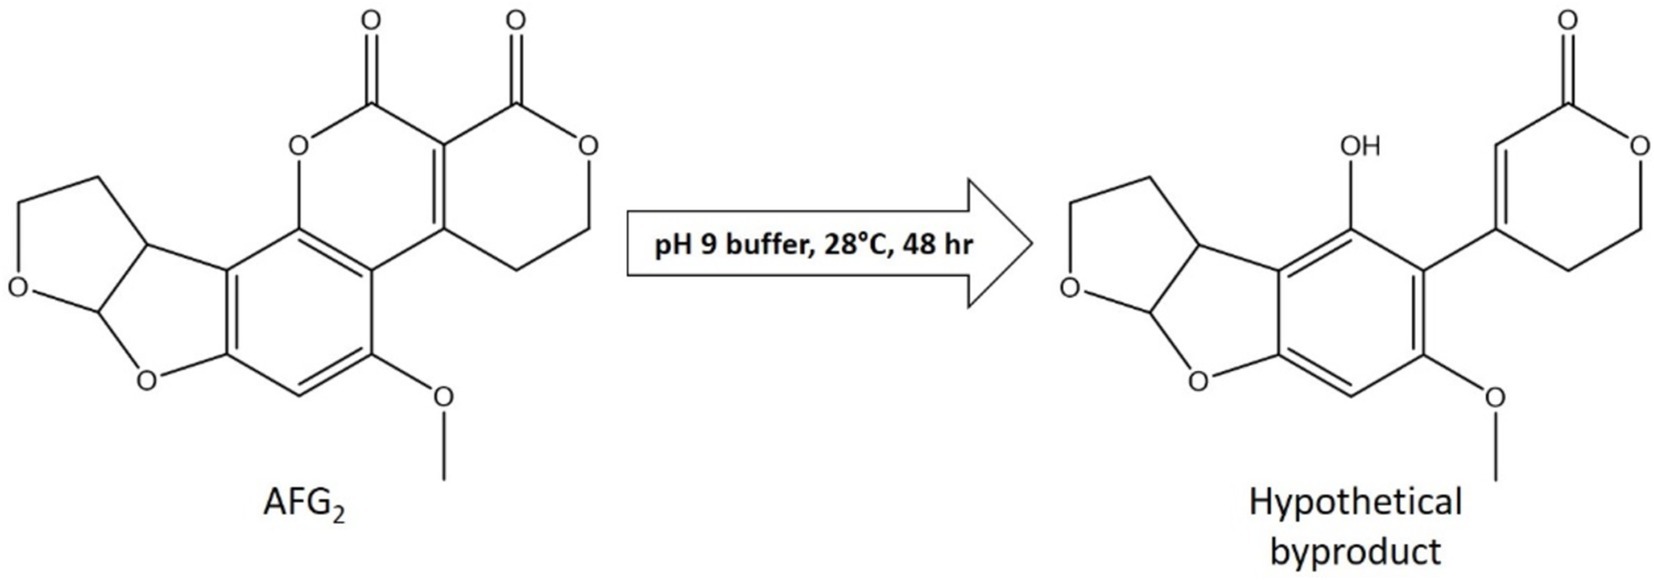
Figure 3. LC–MS analysis of AFG2 after incubation in a medium buffered at a pH of 9 reveals putative byproducts of degradation. Extracted ion chromatograms for time points (TP) 0 and 48 h of incubation of AFG2 in a buffered medium at a pH of 9 (Figure 2D) highlights an m/z value of 331 (AFG2) and an m/z value of 305 (putative byproduct). Structures of AFG2 and the putative structure of the byproduct are shown.
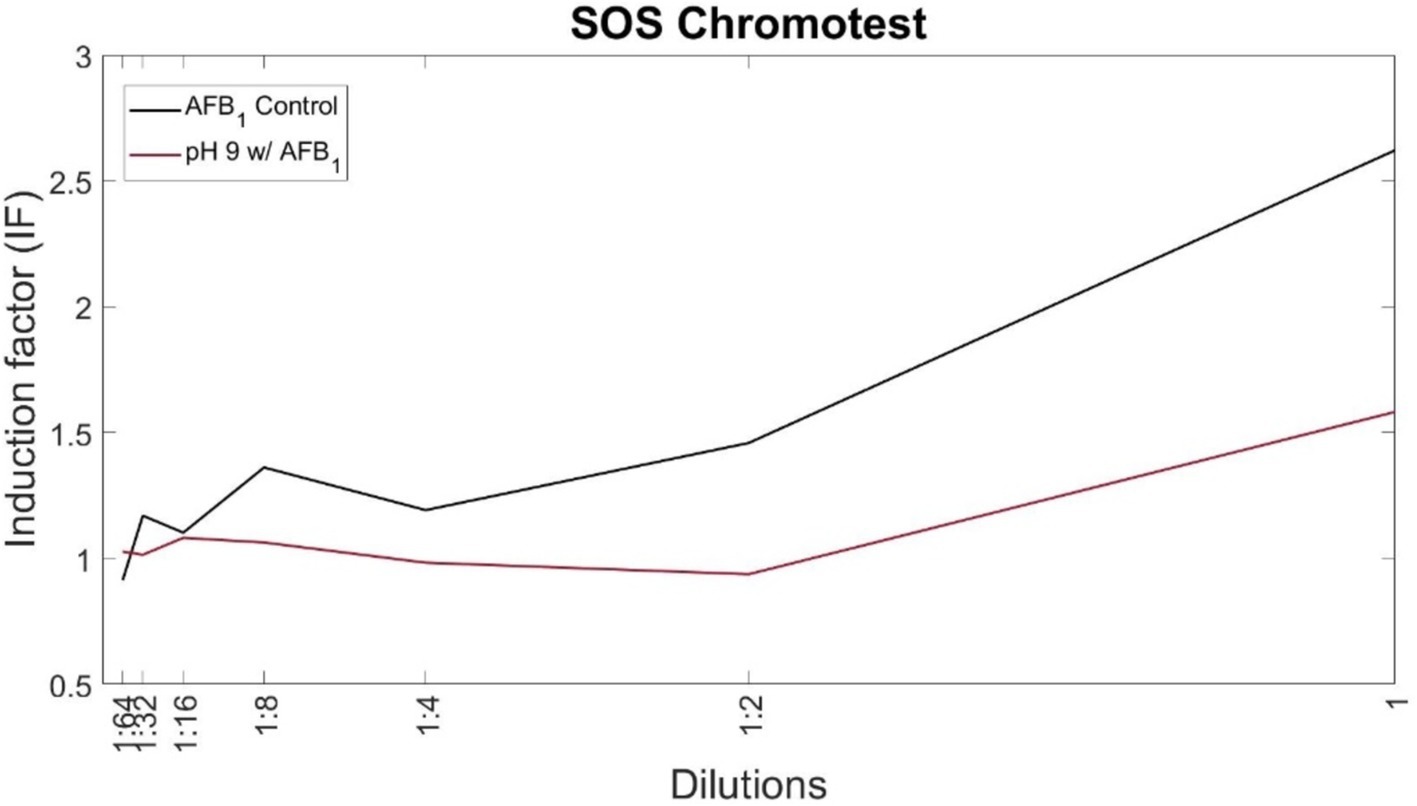
Figure 4. Degradation of AFB1 in a medium buffered at a pH of 9 leads to reduced toxicity. SOS-ChromoTest kit for genotoxicity was used at serial 2-fold dilutions to obtain a trend line. AFB1 incubated in a medium at a pH of 7 was used as a control (no degradation). Values of IF over 1.5 are interpreted as genotoxic.
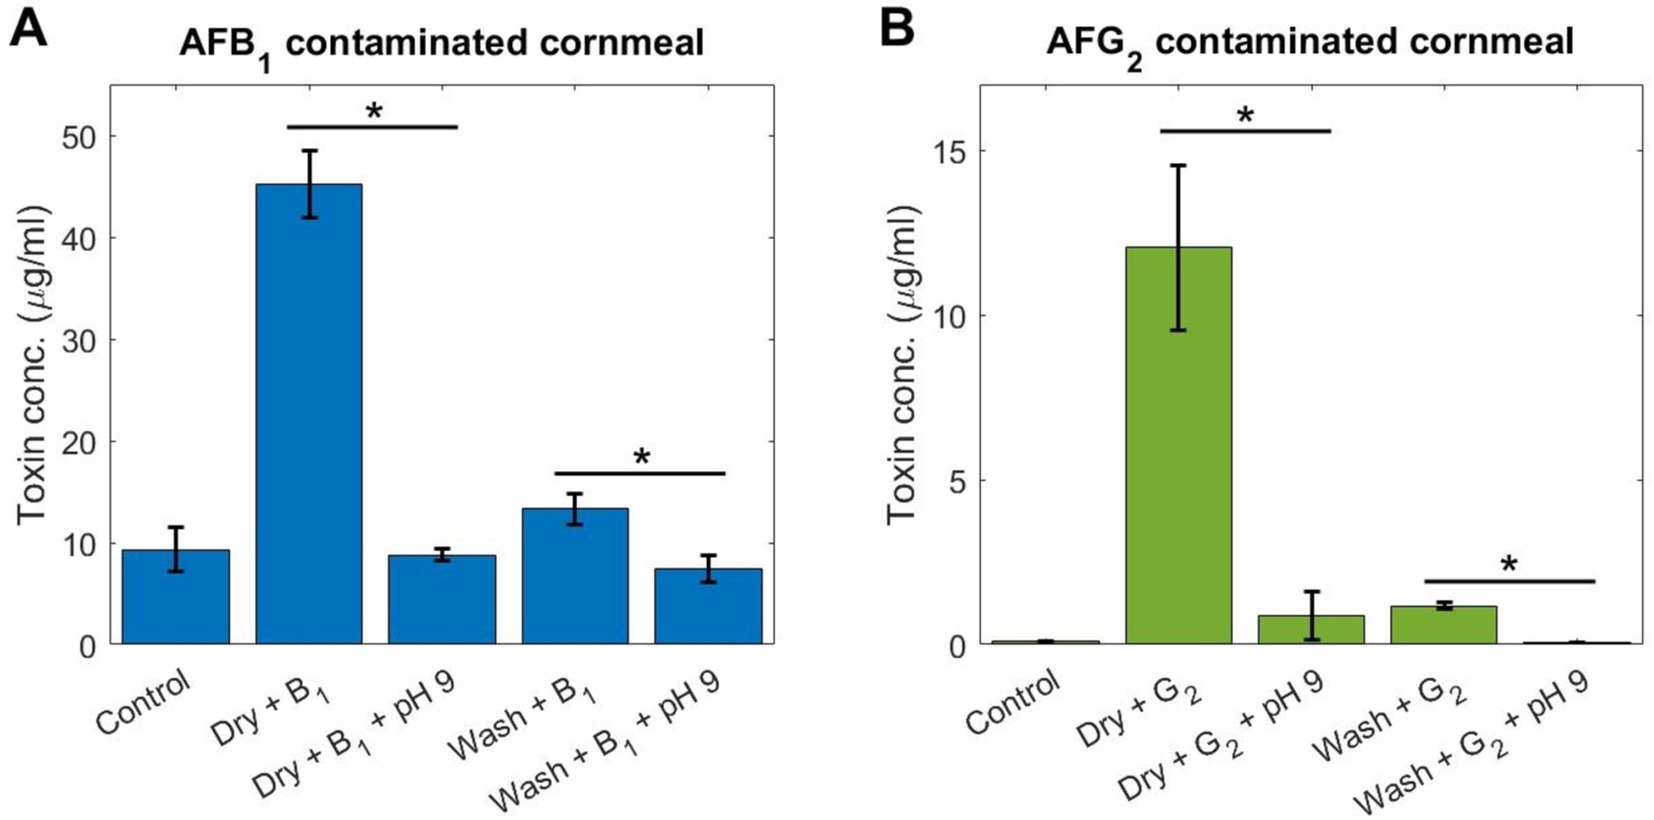
Figure 5. A medium buffered at a pH of 9 can degrade AF in a food matrix. Cornmeal was artificially contaminated with (A) AFB1 and (B) AFG2 prior to degradation testing using incubation for 48 h in a buffered medium at a pH of 9. Controls are uncontaminated cornmeal. Dry: AF suspended in water was dried down on the cornmeal. Wash: AF was incubated with cornmeal, then washed in water and dried. All samples underwent AF extraction and FL reading for toxin concentration. Data are the mean of three replicates. Error-bar shows the standard deviation. * = p < 0.005, Student t-test.
The data for Figure 5 were further analyzed to compare the reduction in toxin concentration between cornmeal treatment conditions using Student t-test. These tests were carried out using Matlab software (version R2021a, MathWorks Inc., Natick, MA, United States) and through the function t-test. Differences were considered significant when p < 0.05.
3 Results
3.1 Increasing the pH of the medium leads to loss of aflatoxin fluorescence
First, how different pH values affected the fluorescence of AF (see section 2.5) was quantified. A standard defined culture medium was buffered to a pH of 4–6 in 0.1 M citrate buffer, a pH of 7–8 in 0.1 M MOPS buffer, and a pH of 8–9 in 0.1 M Tris–HCl. Buffered medium was then supplemented with AFB1 or AFG2 (at an initial concentration of 15 μg/mL) and degradation measured using our fluorescence assay. The fluorescence of AF in these buffered media was monitored during 48 h of incubation time at 28°C. The results for the full range of pH tested are shown in Supplementary Figure S1. Here, the extremes of the pH range were explored, as well as a neutral pH for comparison. A neutral pH of 7 had little effect on the fluorescence of AFB1, while the extremes of the pH range showed increased fluorescence at acidic conditions and decreased fluorescence at basic conditions (Figure 1). Particularly, a medium buffered at a pH of 4 displayed a rapid increase in the fluorescence of AFB1, but not AFG2 (Figure 1). However, a medium buffered at a pH of 9 decreased fluorescence by ~50% for AFB1 and by ~95% for AFG2 (Figure 1), suggesting a loss of toxin concentration. Additionally, to ensure that the effect was independent of the buffer used in the experiment, media buffered at a pH of 9 using 4 different buffers were tested and showed consistent results of decreased AF fluorescence over the testing period (Supplementary Figure S2).
3.2 Loss of fluorescence in a medium at a pH of 9 is proportional to loss of toxin concentration
To test if the trends seen via our fluorescence assay represented AF degradation, the changes in AF concentrations (initial concentrations set at 15 μg/mL) for pH values of 4 and 9 were examined using an extraction/fluorescence method and LC–MS. The extraction method (see section 2.3) uses an ethyl acetate liquid/liquid extraction protocol to remove AF from the surrounding aqueous environment. Such extraction essentially eliminates any transient effects of the pH on the toxin. Pairing this extraction with fluorescence analysis allowed for an accurate reading of AF levels independent of the short-term effects of the environmental pH. After extraction at three time points, 0, 24, and 48 h, samples at a pH of 4 showed <10% change to the AF levels for both AFB1 and AFG2 (Figures 2A,B), indicating that the increases to the fluorescence in the initial tests (Figure 1) were transient effects of the pH on AFs. In contrast, samples at a pH of 9 displayed sustained degradation of AFB1 and AFG2 by ~50% and >95%, respectively, within 24 h (Figures 2A,B). Additionally, an LC–MS analysis of the conditions at a pH of 9 (see section 2.4) showed similar results in the remaining levels of AFB1 (Figure 2C) and AFG2 (Figure 2D) after 48 h incubation, similar to the extraction/fluorescence method of detection. First, this confirmed that a medium buffered at a pH of 9 degrades AFs. Second, these two methods taken together showed that the loss of AF fluorescence in conditions at a pH of 9 is associated with a decrease in the toxin concentration.
3.3 Degradation of AFs in a condition buffered at a pH of 9 leads to lactone ring opening
Since the buffered medium at a pH of 9 displayed a promising AF degradation, next the putative byproducts of the degradation reaction were investigated. Based on the loss of fluorescence after incubation in a medium buffered at a pH of 9 and because of the link between the lactone ring and the fluorescence of AF (Lee et al., 1981), our hypothesis was that the lactone ring moiety was broken open. The LC–MS assay found that as AFG2 in the sample was removed over the 48-h incubation period, a second peak in the chromatogram increased at an m/z value of 305. Using the exact mass, a putative structure of the degradation byproduct was produced with opening of the lactone ring and a decarboxylation event (Figure 3). To test the spectral accuracy of the predicted structure, the measured spectrum (the entire ion isotope pattern) was compared to the theoretical spectrum of the predicted structure using software from MassWorks (Supplementary Figure S4). It was found that the experimental and predicted spectra aligned with a low mass error (mDa) and high spectral accuracy, indicating that the predicted structure was a strong candidate. A byproduct peak was not found in the AFB1 spectra, despite the decrease in toxin after incubation in the medium buffered at a pH of 9 (Supplementary Figure S5). This indicated that AFB1 was likely degraded to a further extent than what was detectable through our analysis. However, due to the loss of fluorescence in AFB1 after incubation, it was inferred that the lactone ring was targeted in a fashion similar to AFG2.
3.4 Byproducts of degradation in a condition buffered at a pH of 9 have reduced toxicity
While it was confirmed that AF levels were decreased or diminished in the condition buffered at a pH of 9, this alone does not directly confirm that toxicity has also been decreased. To test the toxicity of the byproducts of degradation in this condition, an SOS ChromoTest assay for genotoxicity (Riesenfeld et al., 1985; Krifaton et al., 2010; Campos-Avelar et al., 2021; Csenki et al., 2022) was conducted, using the S9 rat liver enzyme induction (see section 2.6). This assay emulates the post-consumption induction by cytochrome P450 that activates AF toxicity (Guengerich et al., 1998). Aflatoxin B1 was incubated in the condition at a pH of 9 for 48 h prior to testing. Controls of toxin levels in a neutral pH medium (a pH of 7) did not show degradation, according to our fluorescence assay (Figure 1) and LC–MS analysis (Supplementary Figure S3). Standard interpretation of this assay considers an Induction Factor (IF) greater than 1.5 as genotoxic. In our results, the AFB1 control condition had an IF of ~2.6 at the highest concentration tested (15 μg/mL), therefore indicating genotoxicity. The same starting concentration of AFB1 after incubation in the condition at a pH of 9 reduced the IF to below 1.5, suggesting decreased toxicity (Figure 4). Compared to controls, the samples treated at a pH of 9 had reduced toxicity. Likely, the remaining toxicity in this sample came from the residual, undegraded AFB1 seen in fluorescence and LC–MS experiments and not the byproducts of the degradation reaction. The toxicity of AFG2 byproducts was not investigated since the SOS ChromoTest is not sensitive for AFG2, but byproducts of the condition at a pH of 9 showed loss of fluorescence and lactone ring opening, which have been confirmed to correlate to reduced toxicity (Lee et al., 1981).
3.5 Degradation of AF is successful by a medium buffered at a pH of 9 when tested in a food matrix
To test the applicability of this degradation method, a cornmeal sample was subjected to artificial contamination by AF prior to incubation in the environment at a pH of 9. Artificial contamination was achieved through two methods: (1) a liquid suspension of AF was added to the cornmeal and then dried (‘Dry’ in Figure 5), and (2) a liquid suspension of AF was added to the cornmeal, incubated overnight, washed with sterile water, and then dried (‘Wash’ in Figure 5). The first method achieves a higher level of contamination and tests surface-level contamination, while the second ensures contamination penetrates the food matrix. It was found that, compared to controls of uncontaminated cornmeal, both the dry and wash methods resulted in AF contamination, with the dry method showing 4-fold higher toxin concentration than the wash method for AFB1 (Figure 5A) and 12-fold higher concentration for AFG2 (Figure 5B). After incubation in the medium buffered at a pH of 9, AF levels decreased significantly (p < 0.005, Student t-test) for the dry method conditions (Figure 5), indicating that surface-level contamination can be targeted by this method. The wash method conditions also showed a significant decrease (p < 0.005, Student t-test) in AF concentration after incubation at a pH of 9 (Figure 5), highlighting the ability for this method to decontaminate toxin that has penetrated the food matrix.
4 Discussion
In this report, the ability to chemically detoxify prevalent crop contaminants, AFB1 and AFG2, through the application of weakly basic and acidic buffered medium conditions was investigated. It was found that alkaline environments have the potential for AF degradation, consistent with previous literature (Saalia and Phillips, 2010; Jard et al., 2011). An environment buffered at a pH of 9 displayed degradation in our fluorescence assay to levels of 60% for AFB1 and >95% for AFG2 within 48 h. The specific buffer used for conditions at a pH of 9 did not significantly impact the degradation efficiency. Additionally, to our knowledge, this report was the first to identify and test toxicity of degradation byproducts from alkaline conditions for AF degradation. Lastly, it was shown that this method of incubation at a pH of 9 is capable of degrading AF in contaminated cornmeal, a representative food matrix for contamination. This decontamination was more effective for surface contamination compared to contamination penetrated inside the food matrix; nonetheless, incubation at a pH of 9 improved the safety of the food matrix in both cases.
Our findings suggest that the alkaline environment enabled the degradation of AFs through the mechanism of lactone ring opening, potentially a spontaneous hydrolysis event. Alkaline hydrolysis is consistent with the byproducts of AF conversion after incubation at a pH of 9 in our study. Other microbe-produced molecules with lactone rings, such as quorum sensing molecules, are also known to degrade in alkaline environments (Horswill et al., 2007; Gómez-Bombarelli et al., 2013). However, to formally confirm the mechanism, further experimentation needs to be performed.
While our findings highlight the potential of pH manipulation as a method to degrade AFs, it is important to consider the practical implications and limitations of this approach. Chemical methods of AF decontamination have been widely studied and used in the agricultural industry. Yet, they are still limited by the arduous downstream clean up after treatment, especially full removal of chemicals and reduced ecological waste. Also, pH adjustment may not always be feasible in certain food processing or storage conditions, as it can impact the properties of the product or interfere with other desired chemical reactions. Previously used methods that implement alkaline environments have particularly struggled with the waste produced due to the strong bases used at large scales. However, these previous methods established a building block for our proposed strategy. Based on other applications of alkalis to remove AFs, this method of incubation at a pH of 9 could be readily implemented in food processing at the stages of food washing (Tabata et al., 1994). With the opening of the lactone ring by the alkaline conditions, the compound can become more water soluble and the AFs can be removed during washing with water. Since the incubation pH in the method outlined in this study is less harsh than previous alkaline applications, it is expected that this approach will reduce the amount of water waste and other potential ecological pollution from the AF removal process.
Further research is needed to optimize pH manipulation approaches for different food and feed commodities and to evaluate their feasibility and practicality. In this report the potential of this degradation method in a single food matrix, cornmeal, was demonstrated as an example, but other foods will need to be tested on an individual basis for successful decontamination. One of the gaps that was not evaluated in this study was the nutrient content and sensory properties of the food after this degradation approach. Some chemical methods deplete the nutrients in food and change their organoleptic properties (e.g., taste, sight, and smell), which are negative aspects of these approaches. Testing the nutritional properties of the food and exploring changes in its sensory qualities are necessary steps before application of our alkaline treatment method.
Another consideration is combining chemical alkaline methods with emerging biological means for decontamination. It is known that a number of bacterial and fungal species are capable of degrading AFs, for example by enzymatic conversion of AFs to non-toxic byproducts (Guan et al., 2008; Shu et al., 2018; Xie et al., 2019). Some of these species may turn the environment more basic, or achieve higher efficiency in a more alkaline environment. An interesting further study may be in the pursuit of a combined degradation effect utilizing an alkaline medium that supports the growth of such biological degraders to produce an enhanced degradation of AFs.
Our findings also caution future biological studies to use an environment buffered at a neutral pH and document the pH values when screening for biological degradation of AFs to mitigate the effects of pH on AF degradation detection. This is critical for distinguishing the enzymatic degradation from alkaline degradation of AFs by different organisms. The absence of information about the pH values in some of the previous reports of AF degradation makes the interpretation of the degradation mechanism difficult.
5 Conclusion
In conclusion, our study demonstrates that pH manipulation can be an effective strategy for the degradation of AFs. Alkaline conditions promote the hydrolysis of AFs, as seen in the putative degradation product, and render them more susceptible to degradation mechanisms. The efficacy of pH-based degradation may vary depending on the AF type as seen in the differences between AFB1 and AFG2. Nevertheless, treatment in weakly alkaline media is shown in the results to decrease aflatoxin-related toxicity. Our investigation of decontamination in a laboratory model of food contamination reveals that weakly alkaline treatment can degrade aflatoxin and render food safer for consumption. Further research is needed to optimize pH manipulation approaches for different food and feed commodities and to evaluate their feasibility and practicality. The findings from this study contribute to our understanding of AF degradation mechanisms and offer insights for the development of effective strategies to reduce AF contamination in the food and feed industries.
Data availability statement
The datasets presented in this study can be found in online repositories. The names of the repository/repositories and accession number(s) can be found: https://github.com/nsandlin7/pH_aflatoxin.
Author contributions
NS: Conceptualization, Formal analysis, Funding acquisition, Investigation, Methodology, Project administration, Validation, Visualization, Writing – original draft, Writing – review & editing. JL: Investigation, Writing – review & editing. MZ: Methodology, Writing – review & editing. MD: Investigation, Methodology, Visualization, Writing – review & editing. BM: Conceptualization, Funding acquisition, Investigation, Methodology, Supervision, Visualization, Writing – review & editing.
Funding
The author(s) declare that financial support was received for the research, authorship, and/or publication of this article. This work was partially supported by the National Science Foundation (NSF-CBET) under Grant no. 2103545. NS was supported by a NIFA-AFRI Predoctoral Fellowship from the USDA (Award no. 2021–67034-35108).
Acknowledgments
The authors would like to thank Marek Domin and the Boston College Mass Spectroscopy Core for infrastructure and support.
Conflict of interest
The authors declare that the research was conducted in the absence of any commercial or financial relationships that could be construed as a potential conflict of interest.
The author(s) declared that they were an editorial board member of Frontiers, at the time of submission. This had no impact on the peer review process and the final decision.
Publisher’s note
All claims expressed in this article are solely those of the authors and do not necessarily represent those of their affiliated organizations, or those of the publisher, the editors and the reviewers. Any product that may be evaluated in this article, or claim that may be made by its manufacturer, is not guaranteed or endorsed by the publisher.
Supplementary material
The Supplementary material for this article can be found online at: https://www.frontiersin.org/articles/10.3389/fsufs.2024.1445232/full#supplementary-material
References
Abatenh, E., Gizaw, B., Tsegaye, Z., and Wassie, M. (2017). The role of microorganisms in bioremediation-a review. Open J. Environ. Biol. 2, 038–046. doi: 10.17352/ojeb.000007
Adebo, O. A., Njobeh, P. B., Gbashi, S., Nwinyi, O. C., and Mavumengwana, V. (2017). Review on microbial degradation of aflatoxins. Crit. Rev. Food Sci. Nutr. 57, 3208–3217. doi: 10.1080/10408398.2015.1106440
Bakirdere, S., Bora, S., Bakirdere, E. G., Aydın, F., Arslan, Y., Komesli, O. T., et al. (2012). Aflatoxin species: their health effects and determination methods in different foodstuffs. Cent. Eur. J. Chem. 10, 675–685. doi: 10.2478/s11532-012-0009-2
Benkerroum, N. (2020). Aflatoxins: producing-molds, structure, health issues and incidence in southeast Asian and sub-Saharan African countries. Int. J. Environ. Res. Public Health 17:1215. doi: 10.3390/ijerph17041215
Bennett, J. W., and Klich, M. (2003). Mycotoxins. Clin. Microbiol. Rev. 16, 497–516.2003, doi: 10.1128/CMR.16.3.497-516.2003
Campos-Avelar, I., Colas de la Noue, A., Durand, N., Cazals, G., Martinez, V., Strub, C., et al. (2021). Aspergillus flavus growth inhibition and aflatoxin B1 decontamination by Streptomyces isolates and their metabolites. Toxins 13:340. doi: 10.3390/toxins13050340
Csenki, Z., Risa, A., Sárkány, D., Garai, E., Bata-Vidács, I., Baka, E., et al. (2022). Comparison evaluation of the biological effects of Sterigmatocystin and aflatoxin B1 utilizing SOS-Chromotest and a novel zebrafish (Danio rerio) embryo microinjection method. Toxins 14:252. doi: 10.3390/toxins14040252
Dedrick, S., Warrier, V., Lemon, K. P., and Momeni, B. (2023). When does a Lotka-Volterra model represent microbial interactions? Insights from in vitro nasal bacterial communities. mSystems 8:e0075722. doi: 10.1128/msystems.00757-22
Fan, S., Zhang, F., Liu, S., Yu, C., Guan, D., and Pan, C. (2013). Removal of aflatoxin B1 in edible plant oils by oscillating treatment with alkaline electrolysed water. Food Chem. 141, 3118–3123. doi: 10.1016/j.foodchem.2013.06.013
Fernández-Cruz, M. L., Mansilla, M. L., and Tadeo, J. L. (2010). Mycotoxins in fruits and their processed products: analysis, occurrence and health implications. J. Adv. Res. 1, 113–122. doi: 10.1016/j.jare.2010.03.002
Freitas-Silva, O., de Souza Coelho, C. C., Trombete, F. M., da Conceição, R. R. P., and Ribeiro-Santos, R. (2021). “Chemical degradation of aflatoxins” in Aflatoxins in food: a recent perspective. eds. K. R. Hakeem, C. A. F. Oliveira, and A. Ismail (Cham: Springer International Publishing), 233–258.
Gómez-Bombarelli, R., Calle, E., and Casado, J. (2013). Mechanisms of lactone hydrolysis in neutral and alkaline conditions. J. Org. Chem. 78, 6868–6879. doi: 10.1021/jo400258w
Grenier, B., Bracarense, A.-P., Leslie, J. F., and Oswald, I. P. (2014). “Physical and chemical methods for mycotoxin decontamination in maize” in Mycotoxin reduction in grain chains: A Practical Guide. eds. J. F. Leslie and A. F. Logrieco (Hoboken, NJ: Wiley), 116–129.
Guan, S., Ji, C., Zhou, T., Li, J., Ma, Q., and Niu, T. (2008). Aflatoxin B1 degradation by Stenotrophomonas maltophilia and other microbes selected using Coumarin medium. Int. J. Mol. Sci. 9, 1489–1503. doi: 10.3390/ijms9081489
Guengerich, F. P., Johnson, W. W., Shimada, T., Ueng, Y.-F., Yamazaki, H., and Langouët, S. (1998). Activation and detoxication of aflatoxin B1. Mutat. Res. 402, 121–128. doi: 10.1016/S0027-5107(97)00289-3
Guzmán-de-Peña, D. (2010). The destruction of aflatoxins in corn by “Nixtamalización”. Mycotox. Food Feed Bioweapons. 39–49. doi: 10.1007/978-3-642-00725-5_3
Horswill, A. R., Stoodley, P., Stewart, P. S., and Parsek, M. R. (2007). The effect of the chemical, biological, and physical environment on quorum sensing in structured microbial communities. Anal. Bioanal. Chem. 387, 371–380. doi: 10.1007/s00216-006-0720-y
Jard, G., Liboz, T., Mathieu, F., Guyonvarc’h, A., and Lebrihi, A. (2011). Review of mycotoxin reduction in food and feed: from prevention in the field to detoxification by adsorption or transformation. Food Addit. Contam. 28, 1590–1609. doi: 10.1080/19440049.2011.595377
Krifaton, C., Kukolya, J., Szoboszlay, S., Cserháti, M., Szűcs, A., and Kriszt, B. (2010). Adaptation of bacterial biotests for monitoring mycotoxins. WIT Trans. Ecol. Environ. 132, 143–153. doi: 10.2495/ETOX100141
Lee, L. S., Dunn, J. J., DeLucca, A. J., and Ciegler, A. (1981). Role of lactone ring of aflatoxin B1 in toxicity and mutagenicity. Experientia 37, 16–17. doi: 10.1007/BF01965543
Mahato, D. K., Lee, K. E., Kamle, M., Devi, S., Dewangan, K. N., Kumar, P., et al. (2019). Aflatoxins in food and feed: an overview on prevalence, detection and control strategies. Front. Microbiol. 10:2266. doi: 10.3389/fmicb.2019.02266
Méndez-Albores, A., Arámbula-Villa, G., Loarca-Piña, M. G. F., Castaño-Tostado, E., and Moreno-Martínez, E. (2005). Safety and efficacy evaluation of aqueous citric acid to degrade B-aflatoxins in maize. Food Chem. Toxicol. 43, 233–238. doi: 10.1016/j.fct.2004.09.009
Pankaj, S. K., Shi, H., and Keener, K. M. (2018). A review of novel physical and chemical decontamination technologies for aflatoxin in food. Trends Food Sci. Technol. 71, 73–83. doi: 10.1016/j.tifs.2017.11.007
Pérez-Flores, G. C., Moreno-Martínez, E., and Méndez-Albores, A. (2011). Effect of microwave heating during alkaline-cooking of aflatoxin contaminated maize. J. Food Sci. 76, T48–T52. doi: 10.1111/j.1750-3841.2010.01980.x
Riesenfeld, G., Kirsch, I., and Weissman, S. (1985). Detection and quantitation of aflatoxin B1 in orange juice by SOS-Chromotest. Food Addit. Contam. 2, 253–257. doi: 10.1080/02652038509373553
Saalia, F., and Phillips, R. D. (2010). Degradation of aflatoxins in aqueous buffer in the presence of nucleophiles. Food Control 21, 1066–1069. doi: 10.1016/j.foodcont.2009.12.028
Samarajeewa, U., Sen, A. C., Cohen, M. D., and Wei, C. I. (1990). Detoxification of aflatoxins in foods and feeds by physical and chemical Methods1. J. Food Prot. 53, 489–501. doi: 10.4315/0362-028X-53.6.489
Shu, X., Wang, Y., Zhou, Q., Li, M., Hu, H., Ma, Y., et al. (2018). Biological degradation of aflatoxin B1 by cell-free extracts of Bacillus velezensis DY3108 with broad PH stability and excellent thermostability. Toxins 10:330. doi: 10.3390/toxins10080330
Singh, R., Singh, P., and Sharma, R. (2014). Microorganism as a tool of bioremediation technology for cleaning environment: A review. Proc. Int. Acad. Ecol. Environ. Sci. 4, 1–6.
Tabata, S., Kamimura, H., Ibe, A., Hashimoto, H., and Tamura, Y. (1994). Degradation of aflatoxins by food additives. J. Food Prot. 57, 42–47. doi: 10.4315/0362-028X-57.1.42
Vidal, A., Marín, S., Sanchis, V., De Saeger, S., and De Boevre, M. (2018). Hydrolysers of modified mycotoxins in maize: α-amylase and cellulase induce an underestimation of the total aflatoxin content. Food Chem. 248, 86–92. doi: 10.1016/j.foodchem.2017.12.057
Xie, Y., Wang, W., and Zhang, S. (2019). Purification and identification of an aflatoxin B1 degradation enzyme from Pantoea sp. T6. Toxicon 157, 35–42. doi: 10.1016/j.toxicon.2018.11.290
Zaccaria, M., Dawson, W., Russel Kish, D., Reverberi, M., Bonaccorsi di Patti, M. C., Domin, M., et al. (2023). Experimental–theoretical study of laccase as a detoxifier of aflatoxins. Sci. Rep. 13:860. doi: 10.1038/s41598-023-27519-1
Zavala-Franco, A., Arámbula-Villa, G., Ramírez-Noguera, P., Salazar, A. M., Sordo, M., Marroquín-Cardona, A., et al. (2020). Aflatoxin detoxification in tortillas using an infrared radiation thermo-alkaline process: cytotoxic and genotoxic evaluation. Food Control 112:107084. doi: 10.1016/j.foodcont.2019.107084
Keywords: food safety, aflatoxins, mycotoxins, decontamination, detoxification
Citation: Sandlin N, Lee J, Zaccaria M, Domin M and Momeni B (2025) Degradation of aflatoxins in weakly alkaline conditions. Front. Sustain. Food Syst. 8:1445232. doi: 10.3389/fsufs.2024.1445232
Edited by:
Vinayak Ghate, National University of Singapore, SingaporeReviewed by:
Amal Hathout, National Research Centre, EgyptCarlos Augusto Fernandes Oliveira, University of São Paulo, Brazil
Rahat Wadhwa Desai, Syngenta, Canada
Copyright © 2025 Sandlin, Lee, Zaccaria, Domin and Momeni. This is an open-access article distributed under the terms of the Creative Commons Attribution License (CC BY). The use, distribution or reproduction in other forums is permitted, provided the original author(s) and the copyright owner(s) are credited and that the original publication in this journal is cited, in accordance with accepted academic practice. No use, distribution or reproduction is permitted which does not comply with these terms.
*Correspondence: Babak Momeni, bW9tZW5pQGJjLmVkdQ==