 Shuai Shi
 Changyu Liu1
- 1College of Economics and Management, Northeast Agricultural University, Harbin, China
- 2College of Letters and Science, University of California, Davis, Davis, CA, United States
Dairy farming (DF) is a significant source of carbon emissions (CEs) in animal husbandry. How to use taxation and subsidies to promote carbon emission reduction while ensuring industrial economic growth has become a focus of academic attention. This study uses a market equilibrium model to explore the impact of carbon emission tax (CET) and subsidies on carbon abatement and economic growth in dairy farming. It sets up different scenarios to find a win–win ratio between tax and subsidy. The empirical test was carried out in Heilongjiang Province in the global golden milk source belt. The results show that the scenarios significantly suppressed CEs. However, carbon taxes led to a decrease in milk yield, while subsidies led to an increase. If the subsidies are <92% of tax revenue, there is a decrease in milk yield. When the carbon tax revenue is equivalent to the subsidies, a reduction in emissions of 0.02–0.11% can be achieved, accompanied by an increase in milk yield ranging from 0.032% to 0.160%. When the subsidy-to-tax ratio ranges from 1.311 to 2.045, dairy yield growth is most closely aligned with emissions, enabling the government to make decisions based on different policy targets.
1 Introduction
The livestock sector accounts for up to 15% of global CEs (Tubiello et al., 2013). The carbon emission sources of animal husbandry mainly include feed crops, the animals themselves and their excrement, fertilizer production, and other conventional agricultural production activities. Lang et al. (2019) found that cattle, pigs, and sheep are the three species that emit the majority of carbon. The average annual CEs of cattle are more than five times those of sheep. Milk production, processing, and transportation generate nine times more CE than beef cattle (FAO, 2010). Scholars focus on the use of market-incentive environmental regulation tools to promote CE reduction. Among these scholars, carbon emission taxes and subsidies have become widely adopted methods for controlling CEs in countries around the world (Wang et al., 2017; Lyu et al., 2024). By the end of 2018, more than 40 countries and regions had implemented CET, with rates ranging from <$1/ton of CO2 equivalent to $130/ton of CO2 equivalent. The imposition of CET can not only curb emissions but also increase government revenue and promote sustainable agricultural development. Scholars have used the Computable General Equilibrium (CGE) model to study the emission reduction effects (Jiang et al., 2023, 2024). Floros and Vlachou (2004) show that a USD $50/ton CET on manufacturing and other energy-intensive industries in Greece would lead to a 17.6% reduction in emissions compared to the values in 1998. In contrast, Ireland has achieved more effective carbon reduction through methods other than energy taxes (Wissema and Dellink, 2007). Claire et al. (2019) pointed out that a tax rate of €100/ton of CO2 equivalent for French dairy farming resulted in a 4%−15% emission reduction. However, it boosted milk prices by 15%, and the profits fell sharply. Jansson and Säll (2018) imposed a consumption tax on EU animal products using a CET scheme of €16, 60, and 290 per ton. The results show that food products with higher demand elasticity contribute to more significant CE reductions, but the consumption tax is less effective, accounting for only 4.9% of the total agricultural emissions of the 27 EU countries. Tang et al. (2018) modulated the impact of a CET on agricultural emissions and farmers' incomes in Western Australia and found that USD $20/ton could achieve a 13% reduction target.
To circumvent the detrimental impact of the CET on economic growth, scholars have also put forth the proposition of CET rebates or subsidies. In other words, the economic loss caused by the CET can be reduced through the redistribution of CET revenue (Saelim, 2019; Malerba et al., 2021; Klenert et al., 2022). Moreover, the simultaneous advancement of economic growth and CE reduction is feasible, thereby facilitating the “double dividend” of economic and environmental benefits (Na et al., 2023). In a global modeling study, Springmann et al. (2016) showed that the best CET scenario subsidized 88% of fruits and vegetables in middle-income countries. This finding prevented death threats for some low- and middle-income groups in Africa and the Western Pacific. If Australia were to implement a uniform tax rate, commencing with a rate of USD $23 per ton of CO2 and eventually reaching a rate of USD $70 per ton of CO2, then differential tax rebate schemes would serve to reduce CE and increase gross domestic product (GDP) (Mona, 2023).
While previous studies have conducted research on the subject of CET and subsidies, there are still some urgent aspects that require further investigation. The majority of studies concentrate on the impact of CET and subsidies on the social economy and the environment, using a CGE model and input-output data from national macroeconomic perspectives. These studies in this field tend to prioritize industries with high energy intensities, such as manufacturing and the power sector, with less attention given to the agricultural sectors. Additionally, there is a paucity of studies on DF, particularly from a microeconomic perspective. Furthermore, there is a paucity of research examining the relationship between CE reduction, yield, and economic growth. Finally, most of the previous research used parameter estimation to quantify the carbon abatement effect, with relatively few empirical studies conducted, especially in the global golden milk source belt.
Therefore, the CET and subsidy under different scenarios are introduced into DF's market equilibrium model, and cows are divided into high- and low-carbon types. The study selected Heilongjiang Province, which is located in the global golden milk source zone, as the sample region to carry out empirical analysis. The marginal contribution of the research can be summarized as follows: First, from the microeconomic perspective, this study analyzes the impact of CET and subsidies on DF output, carbon emission reduction, and economic growth in the gold milk source belt. Second, it explores the scope for CET and subsidies to coordinate CE reduction and output and economic growth using the decoupling theory. Third, this study discusses the effect of differential and uniform CET rates on high-carbon and low-carbon DF. It helps to promote differentiated CET rates and subsidy policies according to the heterogeneity of CE in other industries.
2 Methods and data
2.1 Problem description
It is assumed that the government has imposed a CET on DF to reduce emissions. Farms are catergorized into scattered mode, small-scale, medium-scale, and large-scale farms based on cow inventories.
Currently, there is a lack of consensus within the academic community regarding the most appropriate method for classifying high-carbon dairy farming (HCDF) and low-carbon dairy farming (LCDF) systems. However, scholars believe that the carbon footprint of dairy cows is positively correlated with milk yield (Huang, 2015). Furthermore, it has been demonstrated that, under a certain level of technology, an increase in farming scale is positively correlated with carbon emissions per cow (Shi et al., 2019). In summary, the mean carbon emissions of dairy cows from low to high are distributed across scattered mode farms, small-scale farms, medium-scale farms, and large-scale farms. This finding takes into account the “diseconomies of scale” phenomenon caused by an overly large farming scale (Liang and Wang, 2012; Hua, 2012), the trend toward appropriate large-scale farming, and the high pollution and emission reduction pressures of large-scale dairy farming. Given the prevailing circumstances in China, including the policy directives about large-scale farming and the withdrawal of scattered mode farms from the market, large-scale farming is designated as high-carbon dairy farming (HCDF). Conversely, scattered mode, small-scale farms, and medium-scale farms are categorized as low-carbon dairy farming (LCDF). The government levies CET according to emissions and only subsidizes LCDF.
Generally, a typical dairy farm consists of 70% adult cows, 10% young cows, and 20% heifer calves. The study regards 350 kg(wnc) as the average weight of non-milking cows. There are ~80% and 60% milking cows in LCDF and HCDF, respectively. Previous studies have shown that the milk carbon footprint of cows is 1.19 ± 0.40 . We assume it to be 0.79 and 1.59 in LCDF and HCDF, respectively. Beef cattle are regarded as non-milking cows, with a coefficient of 10.16 (Huang, 2015). The CEs of milking and non-milking cows are denoted as Ec and ENc, respectively. The emission coefficient (e) is calculated as
Therefore, the CE coefficient of LCDF(e1) and HCDF(e2) is 0.92 and 1.869 , respectively.
The CET is a type of carbon price representing the minimum price that energy users pay for carbon emissions. An analysis of the implementation of CET levies in various countries reveals that, in the last century, the initial CET in some countries was less than CNY ¥10/ton. In the current century, the range of levies has varied from CNY ¥30/ton to CNY ¥1,060/ton. Drawing on the experience of formulating CET policies and practical operations for dairy farming in foreign countries, it is recommended that the CET rate for dairy farming should be set at a minimum of CNY ¥30/ton to achieve a significant emission reduction effect. In this study, a five-tier progressive tax structure is proposed, with rates ranging from CNY ¥30/ton to CNY ¥150/ton. This structure is complemented by four tax rebate rates (25%, 50%, 75%, and 100%), which are designed to provide financial incentives for low-carbon dairy farming practices.
2.2 Model construction
To evaluate the effects of tax and subsidy in DF, there are two steps. First, we obtain the equilibrium price and yield in the market according to the econometric model. Second, the CET and subsidy are introduced into DF to evaluate their effects on the yield, milk price, and emissions in both HCDF and LCDF.
We assume that cow inventory is fixed and that CET and subsidies are applied to cow yields. There are n1 and n2 herds in LCDF and HCDF, respectively. Initially, yield per cow is q0 for all farms, q1 for LCDF, and q2 for HCDF.
The total yield is as follows:
When computing abatement of CET and subsidy, we regard the CO2−eq produced by cows as an indicator to evaluate CEs. Carbon footprint coefficients of milk and meat are used to calculate emissions of milking and non-milking cows, which are uniformly converted into emissions of milk per kilogram. Then, we obtain the CE coefficient e1 and e2. Therefore, total CE (E) is as follows:
2.2.1 Demand function and cost function
We set up the demand function in the milk market according to the price (P) and yield (Q).
where a and b are constants.
The average cost and yield per cow are weighted according to the proportion of each scale, which is shown below.
where mi, ci, αi(i = 1, 2, 3, 4) are the yield, cost per cow, and scale proportion. q represents yield per cow after weighting and C is the cost per cow after weighting.
The cost function per cow is given by tc = Aq2 + Bq + D, where A, B, and D are constants. The total yield of the industry is Q and the total cost is TC. We obtain , and the marginal cost functions are shown below:
mc and MC represent the marginal cost per cow and for the dairy industry, where k and h′ are constants . Then, we set four scenarios including the base model with no tax and subsidy, scenarios of tax only, subsidy only, and both tax and subsidy.
2.2.2 No carbon tax and subsidy
In the base scenario, under the profit maximization condition in a competitive market, MR = MC = P, we could obtain an initial equilibrium state with milk yield (Q0) and price (P0) by solving simultaneous Equations 4, 8. Then, let P0= mc, we can obtain the yield per cow in LCDF (q1) and HCDF (q2). According to Equation 2, we can obtain the emission (E0).
2.2.3 Carbon tax only
In this scenario, a CET is introduced to the base model. We adopt the same fixed tax toward all dairy scales. The tax rate is set as θ, and the marginal cost per cow in LCDF and HCDF is mc1′ and mc2′:
The marginal cost for DF is as follows:
By setting P = MC′, then we could obtain the equilibrium yield of Q1 by solving the simultaneous Equations 3, 13, the price increases from P0 to P1.
With the price of P1, farms actively adjust production strategies to meet the equilibrium conditions. From this condition, we could obtain the LCDF yield and the HCDF yield of q1′ and q2′:
The total CE of DF is E1:
The yield growth rate (ω′) and CE growth rate (γ′) are defined as follows:
Then, we could obtain the coefficients:
2.2.4 Subsidy only
A subsidy affects CE reduction through milk yield. It is necessary to encourage farmers to adopt LCDF production, whose marginal cost will be reduced, while the marginal cost of HCDF remains unchanged. ε is set as the coefficient of subsidies. Cow's marginal cost () with a subsidy is shown below:
Cow's marginal cost () in HCDF without subsidies is as follows:
The marginal cost of DF is as follows:
Under the equilibrium condition of P = MC″, we obtain the new equilibrium point with price (P2) and milk yield (Q2) by solving the simultaneous Equations 3, 28. Compared to the initial equilibrium state with no tax and subsidy, the price is reduced from P0 to P2; thus, we obtain ΔP2.
As the price decreases, the yield increases from Q0 to Q2, we obtain ΔQ″.
With the price of P2, we obtain low-carbon and high-carbon yields ( and ) with subsidies, respectively:
Similarly, to obtain emissions, the growth rates of yield and emissions, and the coefficients of DF were derived using formulas from Equations 18–23.
2.2.5 Carbon tax and subsidy
In the former scenarios, we discussed the impact of CET and subsidy on emissions separately. However, in practice, the two policy instruments may be used at the same time. We will introduce these two factors into the model in this part. Cow yields in LCDF and HCDF are defined as and , which are related to the yields of the former scenarios.
Similarly, we obtain the dairy yield (Q3) and emission (E3),
The growth rates of yield (ω) and CE (γ) are derived as follows:
2.3 Research area and data
The so-called “golden milk source belt” refers to the temperate grassland between ~40° and 50° north and south latitudes. The grasslands in this region are surrounded by a temperate climate all year round and are internationally recognized as a good dairy breeding zone. Heilongjiang Province, located in this category, is also the world-recognized black soil belt and the golden corn planting belt. Compared to the golden milk source belt of the Netherlands, New Zealand, and other countries, Heilongjiang Province of China does not have absolute advantages in the number of dairy cows and unit yield. If carbon tax and subsidy policies can achieve the double effect of emission reduction and economic growth in this region, it will have significant promotion value in the global golden milk source belt and even the global dairy farming industry.
By 2022, Heilongjiang will have 1.1 million dairy cows and 5.01 million tons of raw milk. The number of dairy cattle and milk production are among the top in China. According to the Statistical Yearbook of Heilongjiang Province, there are ~1.02 and 0.34 million cows in LCDF and HCDF on average. According to previous dairy surveys in this area, the proportions of milking cows in the two types of farms are 80% and 65%. Therefore, there are ~82,000 herds (n1) and 220,000 herds (n2) of milking cows, respectively.
Without considering the import of dairy products, this study collects data from the China Dairy Industry Yearbook, China Statistical Yearbook, and China Dairy Industry Statistical Data. These data include the per capita consumption of dairy products in urban and rural areas of the region in the past 10 years, the urban and rural population, the total output and purchase price of raw milk, the costs of dairy cow farming at various scales, and the output of main products (per cow). Based on these data, the demand function and cost function of raw milk are constructed (shown in Table 1). The function fitting yields a satisfactory outcome, with the capacity to reflect the overall characteristics of the data, thus facilitating model analysis.
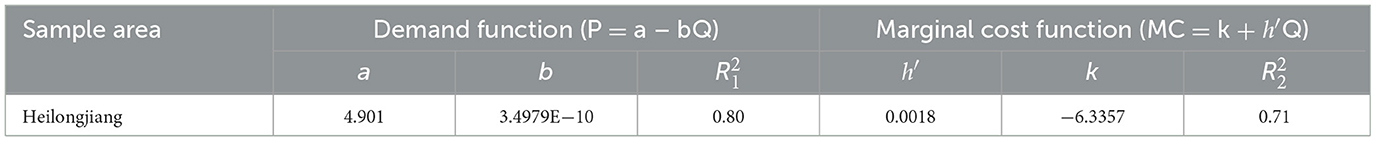
Table 1. Function fitting results.
3 Results
3.1 Carbon tax only
After the implementation of the carbon tax, the changes in CE, output, and economic growth rate of HCDF and LCDF are illustrated in Figures 1, 2.
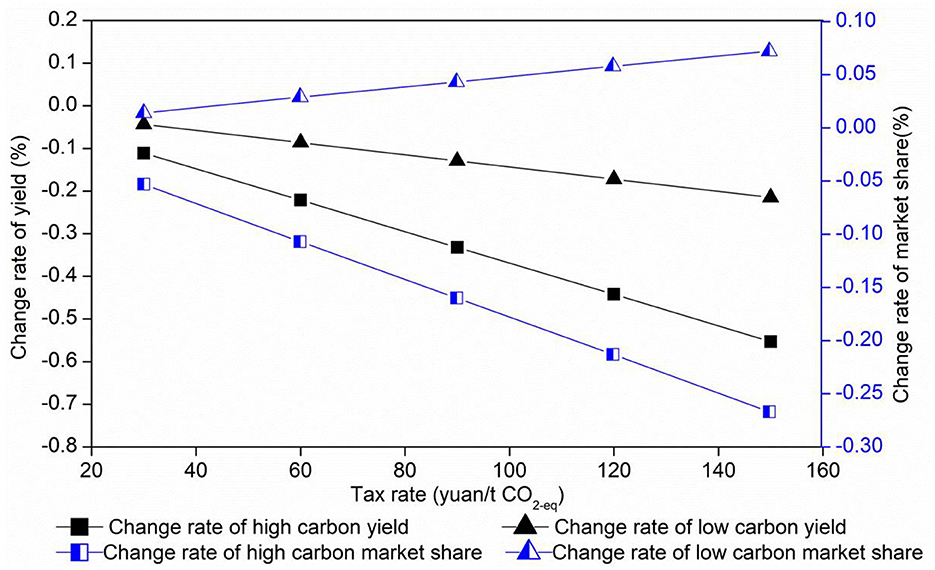
Figure 1. Change rates of yield and market share.
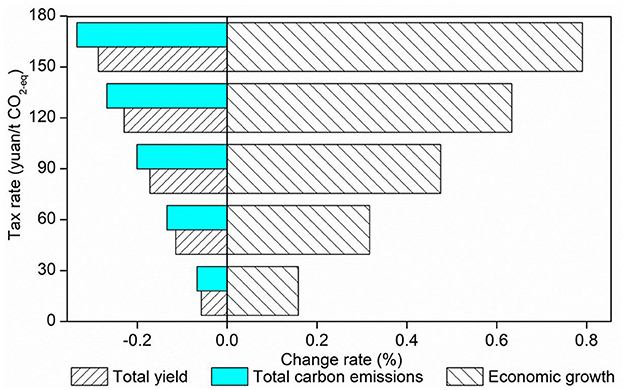
Figure 2. Change rates of CE, total yield, and economic growth.
First, it is evident that the imposition of a CET leads to changes in the market shares of LCDF and HCDF. Specifically, the market share of LCDF will increase, while that of HCDF will decline (see Figure 1). When the tax rates are set at CNY¥ 30/ton and CNY¥ 150/ton, the market share of LCDF increases by 0.08% and 0.42%, respectively, while the market share of HCDF decreases by 0.15% and 0.78%, respectively. It is evident that, as the tax rate increases, the rate of withdrawl from the market for HCDF is greater than that of LCDF. This finding suggests that the implementation of a CET may facilitate the low-carbon transformation of dairy farming.
Second, an analysis of the data reveals a decline in average milk yield per dairy cow in both the HCDF and LCDF systems as the tax rate increases. When the tax rate ranges from CNY¥ 30/ton to CNY¥ 150/ton, the change rates of milk yield per cow in LCDF and HCDF are (−0.35%, −1.75%) and (−0.58%, −2.93%), respectively. HCDF exhibits a heightened sensitivity to alterations in the tax rate, resulting in a more pronounced decline in milk yield and a more substantial rate of emission reduction when compared to LCDF. This finding suggests that the CET exerts a more pronounced inhibitory effect on HCDF.
Third, the CET can effectively reduce the industry's carbon emissions. However, it is important to note that this finding will result in a reduction in raw milk production and economic growth rate (Figure 2). This potential outcome could be considered a “double dividend”. When the tax rate is set at CNY¥ 30–150/ton, the growth rate of industrial carbon emissions is reduced by −0.459%, while the growth rate of raw milk production is decreased by −0.432%. Concurrently, the economic growth rate is diminished by −0.31%, resulting in a net economic effect that is −1.54% lower. For a constant tax rate, the magnitude of the carbon reduction is greater than the magnitude of the production reduction and the magnitude of the economic recession. As the carbon tax increases, production and the economy are less affected. The impact of the tax on the production and the economy is much smaller than the impact of the carbon reduction, suggesting that an appropriate carbon tax has the potential to deliver a “double dividend”. However, a reduction in raw milk production could potentially lead to a disparity between supply and demand in the market. Therefore, a binding carbon tax could be employed in conjunction with incentive-based subsidies to leverage a market-based environmental regulatory instrument and achieve the dual objectives of reducing carbon emissions from industry, promoting low-carbon agriculture, and stabilizing the supply of raw milk.
3.2 The combined effect of a carbon tax and subsidy
When a unified CET is levied and subsidies are provided in the form of different CET rebate ratios, the growth rate of yield, CE, and economy is shown in Figure 3. There are five tax rates and four rebate ratios, as mentioned before.
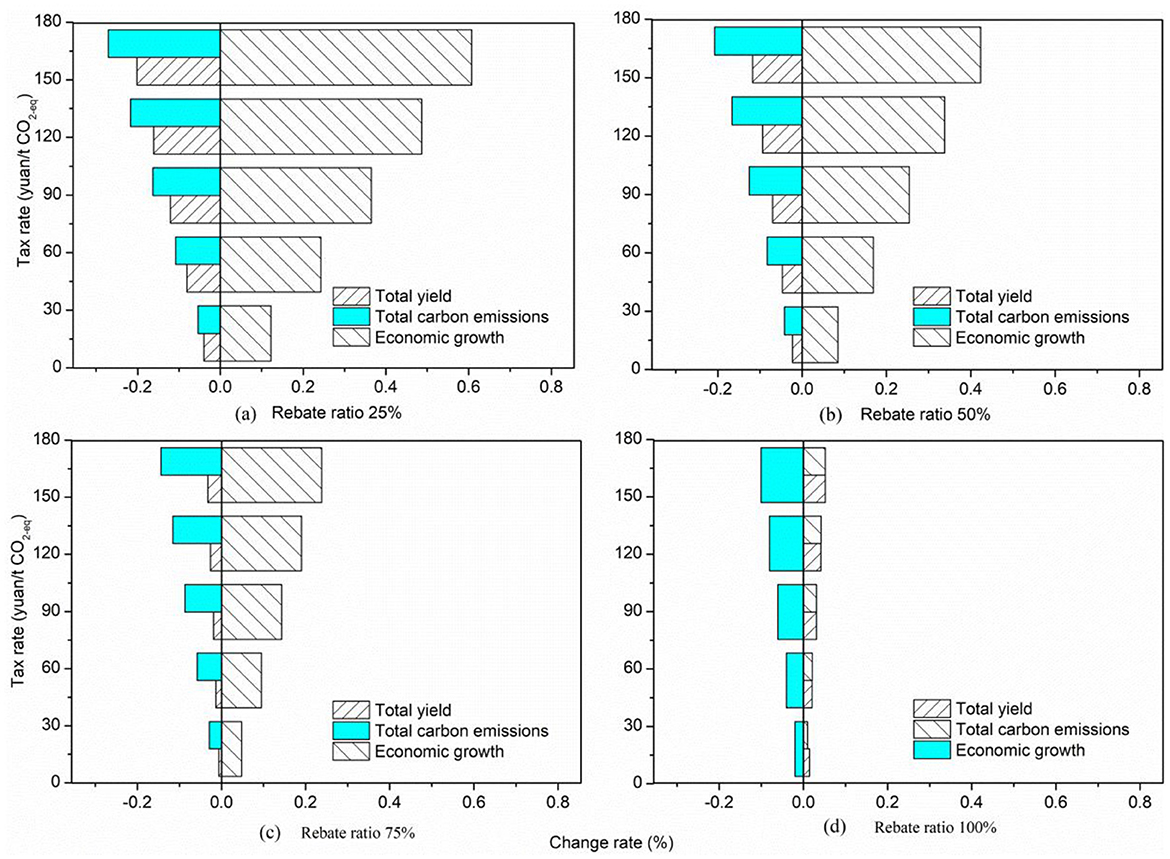
Figure 3. Indicators change rates under different carbon tax rebates.
First, CE reductions increase across all tax rebate scenarios, and the share of tax rebates is inversely proportional to CE reductions at the same tax rate. This finding suggests that CE reductions can still be achieved with a combination of carbon tax and subsidies, but the amount of emission reductions from a tax rebate is lower compared to a carbon tax alone. With a fixed tax rebate rate, CE increases as the tax rate increases.
Second, at the same tax rate, production and economic activity increase with higher rebate rates. If all carbon tax revenues are used to subsidize LCDF, a “double dividend” is achieved in terms of CE reductions from dairy farming. With a fixed tax rebate, CE increases with it, but the yield and economic changes are uncertain. When the rebate rate is 25%, 50%, and 75%, compared to the carbon tax alone, the yield and economic growth rate increase significantly, but they remain negative. When the rebate rate is 100%, the yield and economic growth rate are positive, indicating that the subsidy's role in promoting yield and economic growth is greater than the carbon tax's inhibiting role. We also find the tax rebate ratio boundary is 92%. When it is higher than it, the promoting effect of subsidy on yield is greater than inhibiting effect.
Third, subsidies increase LCDF yields and are positively correlated with tax rates. In other words, as the tax increase, the amount rebated to LCDF is higher, which promotes a significant increase in yields. For example, in the case of the full tax rebate scenario, compared to the carbon tax alone, yields for LCDF turn from negative to positive, and yields for HCDF decrease even more (Figure 4), with yields increasing by 0.6 to 3.4% for LCDF and decreasing by 0.047 to 0.24% for HCDF. At the same time, market share increased by 0.34–1.73% for LCDF and decreased by 0.64–3.21% for HCDF. This finding suggests that carbon tax and subsidies together can significantly promote LCDF and discourage HCDF, both of which have a stronger effect in discouraging HCDF than the carbon tax alone.
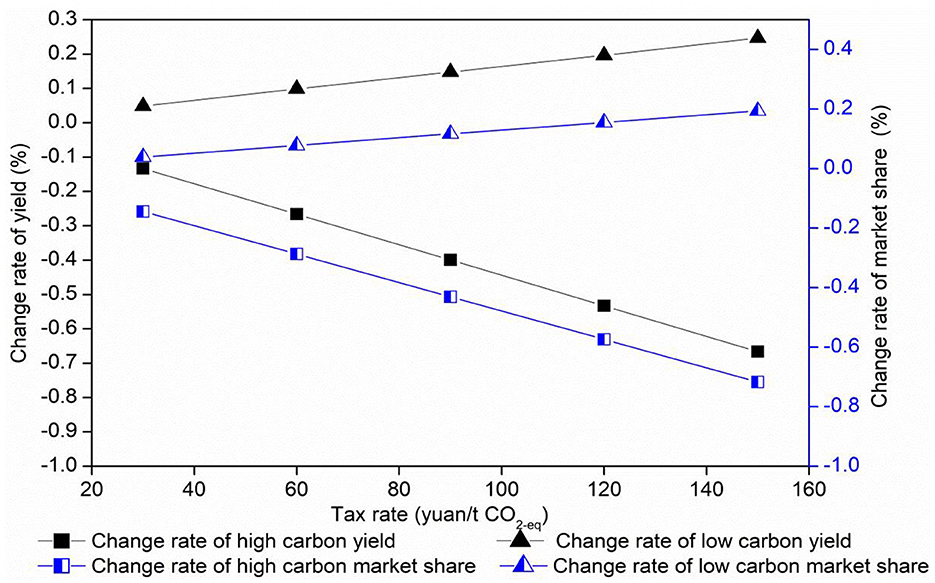
Figure 4. Change rate of yield and market share at different tax rates.
In conclusion, the carbon tax exerts a substantial inhibitory influence on CE, production, and the economy. Although the subsidy does serve to attenuate the abatement capacity of the carbon tax to a certain extent, it concomitantly promotes the production of raw milk and the economic degree of improvement while concomitantly promoting the synergistic development of carbon abatement, the supply of raw milk, and economic growth. When considering the impact of low-carbon subsidies on fiscal pressure and total social welfare, it is evident that carbon tax revenues are generally highlighted to promote the development of LCDF in the form of tax rebates.
3.3 Decoupling results
Many scholars associate CE with economic development. Li (2012); Li et al. (2013) and Chen and Shang (2014), found that economic factors are the main reason for CE in China's animal husbandry. If prices of agricultural products are stable, changes in yield can reflect economic trends. Therefore, we study the decoupling relationship between the yield and CE with the equation below. Let e(E, Q) represent the decoupling elasticity index (shown in Table 2).
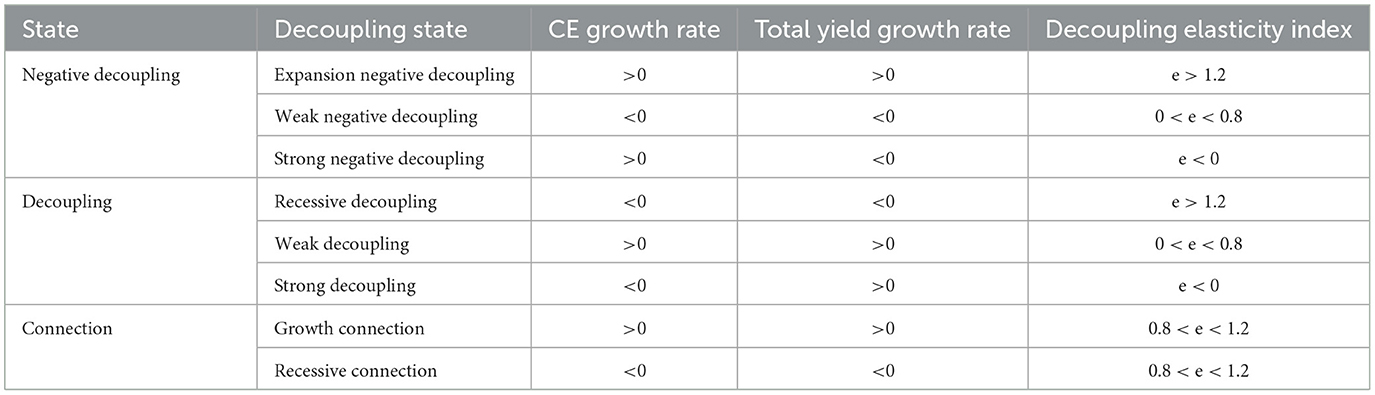
Table 2. Decoupling state and decoupling elasticity index.
Weak decoupling, growth connection, and expansion negative decoupling all represent both an increase in yield and CE. Weak negative decoupling, strong negative decoupling, recessive decoupling, and recessive connection result in increased yield growth. It is only through the implementation of strong decoupling strategies that the overall yield can be enhanced while concurrently reducing CE. We will discuss different decoupling intervals in detail.
(1) ε′/θ ∈ (−∞, −9.364). Weak negative decoupling. The subsidy is less than tax revenue, and both yield and emissions decrease.
(2) ε′/θ ∈ (−9.364, 0.095). Recessive connection. The subsidy is less than tax revenue, and both yield and emissions decrease.
(3) ε′/θ ∈ (0.095, 1.311). Recessive decoupling. The subsidy is less than tax revenue, and both yield and emissions decrease.
(4) ε′/θ ∈ (1.311, 1.550). Strong decoupling. The subsidy is less than tax revenue, yield increases, but emissions decrease.
(5) ε′/θ ∈ (1.550, 2.045). Strong decoupling. The subsidy is higher than tax revenue, while yield increases and emissions decrease.
(6) ε′/θ ∈ (2.045, +∞). Weak decoupling. The subsidy is higher than tax revenue, and both yield and emissions increase.
Considering ε′/θ should be non-negative, decoupling results of the actual model can be obtained in Figure 5.
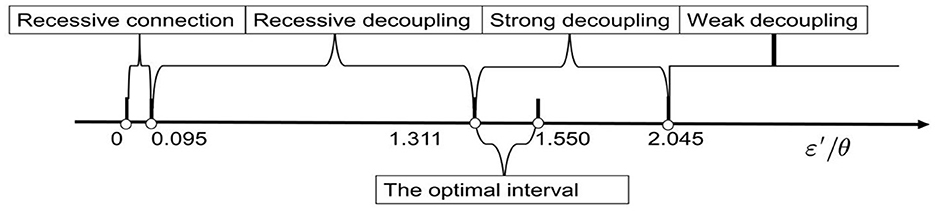
Figure 5. Schematic diagram of decoupling results.
When 1.311 < ε′/θ < 2.045, strong decoupling occurs, with yield growth being most closely aligned with CE. This optimal range represents the condition for implementing the CET-subsidy policy. When ε′/θ = 2.045, a strong decoupling persists, but with the least negative impact. If the subsidies are higher than taxes with the goal of maximizing yield while reducing emissions, the government could also choose this point. When ε′/θ = 1.311, emission reductions are more pronounced. If the subsidies are not higher than taxes with the goal of maximal abatement and stable yield, the government could choose this point.
When ε′/θ equals 1.311, 1.550, and 2.045 with a tax rate ranging from CNY¥ 30/ton to CNY¥ 150/ton, the economic growth rates are shown in Figure 6. For the same tax rate, a small ratio represents a lower subsidy and a higher economic growth rate. When ε′/θ equals 2.045, the economy decreases. When ε′/θ equals 1.311 and 1.55, the economy increases with an increase in tax.
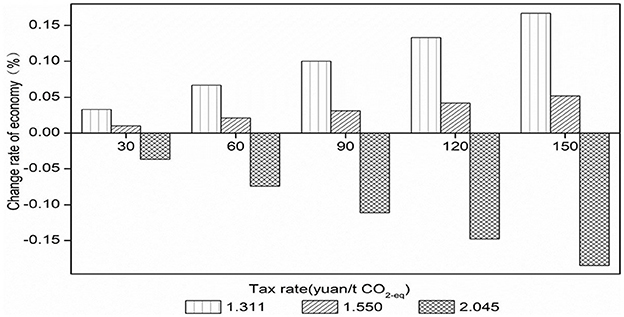
Figure 6. Change rate of the economy.
In summary, strong decoupling represents the optimal harmonization between dairy farming production growth and CE, making this interval the preferred range for the government to implement carbon tax and subsidy regulation. Among them, if the government carries out subsidies only to the limit of carbon tax revenue, the tax-subsidy ratio can be chosen, and the double dividend effect of carbon tax can also be realized. The carbon tax and subsidy regulation have the least negative impact on output and the most obvious emission reduction effect under the strong decoupling effect. However, in the latter case, government expenditure on subsidies is greater than the revenue from carbon tax. Therefore, under carbon tax and subsidy regulation, if the government's objective is raw milk production growth while achieving optimal emission reduction—without allowing fiscal expenditure to exceed tax revenue—it may choose to formulate a policy accordingly. Alternatively, if the government allows subsidy expenditure for CE reduction to be greater than carbon tax revenue and aims to balance emission reduction with maximizing raw milk production, it may formulate a policy accordingly.
4 Discussion
In the carbon tax-only scenario, scholars generally agree that CEs will be reduced. However, there is a divergence of opinion regarding the impact of the price increase resulting from the introduction of the tax. Some studies suggest that this finding will stimulate economic growth, while others maintain that it will have a detrimental effect on economic growth. The concept of the “double dividend” is a source of considerable debate. To illustrate, Lin and Jia (2018) posits that the CET of CNY¥ 70/ton in 2017 could achieve an abatement of 0.224%, which would result in a yield decrease of 0.026%. This finding, in turn, would lead to a reduction in rural unit GDP by 0.007% in comparison to 2016. Ollier and Stéphane (2024) propose that farm income decreased by 6%, 10%, and 19% for emission tax rates of €30, 50, and 100/t CO2, respectively. Jansson and Säll (2018) study the impact of consumption tax on carbon abatement of livestock products in Europe. As a consequence of the inelasticity of demand, the reduction in emissions is only slight. The findings of this study indicate that a carbon tax on dairy farming could reduce milk production, promote CE reductions, and support economic growth. These results are generally consistent with those of other studies in this field. In a study conducted in Brazil, Filho et al. (2008) found that the implementation of a carbon tax (CET) of $9.63/ton would result in a 0.2% reduction in raw milk yield and an increase in emission reduction by the same amount. Nevertheless, the implementation of a carbon tax may potentially exert a detrimental influence on the economy. Consequently, some scholars have put forth the suggestion of implementing compensation measures alongside the tax. Wehner and Yu (2023) highlight that the imposition of a tax on milk would result in a reduction in social welfare, which could be offset by leveraging the climatic and nutritional benefits associated with milk. Mona (2023) put forth the proposition of levying a uniform tax rate for the entire industrial sector in Australia. The initial rate will be set at $23/ton of CO2, increasing to $70/ton of CO2 over time. The implementation of diverse tax rebate schemes has the potential to curtail CEs and stimulate economic growth. Ollier and Stéphane (2024) pointed out that the impact of the income tax can be reduced if it is returned. Furthermore, the findings of this study align with those of previous studies conducted by Claire et al. (2019) and Roach (2021). At present, there is no available research on the decoupling of the carbon tax and subsidy ratio. It is further hoped that the conclusions of this study will prove a useful point of reference for subsequent research.
5 Conclusion and policy implications
5.1 Conclusion
In a competitive market, the study introduces the CET and subsidy as exogenous variables in the cost-benefit analysis of DF and constructs theoretical models in both HCDF and LCDF. With five CET rates and four rebate ratios, it analyzes the responses of carbon abatement, milk yield, and economic growth in Heilongjiang Province, located in the golden milk source belt. We have made the following conclusions:
First, in the scenario of CET only, five tax rates ranging from CNY¥ 30/ton to CNY¥ 150/ton lead to abatement of 0.067%−0.335%, a yield decrease of 0.06%−0.28%, and an economic growth of 0.16%−0.79%. This finding validates the “double dividend” effect of CET on both abatement and economic growth. It effectively reduces the high-carbon share and increases the low-carbon share in the market. A higher tax rate results in more abatement but lower milk yield, which may result in insufficient supply. Therefore, the introduction of a subsidy policy should also be considered.
Second, in the scenario of tax-subsidy policy, if the subsidy works in the form of a tax rebate, four ratios from 25% to 100% will weaken the abatement and promote an increase in milk yield. With the same tax rate, the growth rate of yield increases with the tax rebate ratio, but the abatement reduces. When the tax rebate ratio is 92%, the milk yield is equal to the initial level. If all tax revenue is used for subsidies, the ratio of subsidy to tax is ε′/θ = 1.55, where yield and abatement increase by 0.01–0.052% and 0.02–0.11%, respectively. The market share of LCDF increases and high carbon decreases, indicating that the tax-subsidy policy is more effective in promoting low-carbon development than the tax-only policy.
Finally, decoupling analysis shows that, when 1.311 < ε′/θ < 2.045, strong decoupling and yield growth is most coordinated with CE. When ε′/θ =1.311, there is maximal abatement with less yield growth. When ε′/θ =2.045, there is maximal yield growth with less abatement. If the subsidy is less than tax revenue, the optimal ratio ranges from 1.311 to 1.550, where the government could determine the specific point according to policy targets.
5.2 Policy implications
First, a unified framework and standards for CET and subsidies in dairy farming must be formulated. International organizations should assume the leading role in formulating a unified framework and standards for global livestock CET and subsidies. This framework should include clarifying the scope of CE collection, the principles of tax rate setting, and the objects and methods of subsidies for dairy farming. The aim of this study should be to ensure that all countries have a unified reference standard during implementation and to avoid “carbon leakage” and trade unfairness caused by differences in rules. Recognizing the heterogeneity in economic levels, energy structures, and emission reduction capabilities across countries along the golden milk source belt, countries are permitted to devise specific CE and subsidy policies that align with their respective national contexts, operating within the overarching unified framework. This approach will establish an incentive mechanism that promotes the harmonized advancement of dairy production, CE reduction, and economic growth, thereby fully leveraging the “double dividend” potential inherent in CET.
Second, an international coordination mechanism for CET and subsidies in dairy farming should be established, along with an international CET coordination agency for the dairy farming industry. This mechanism would address potential trade disputes and policy conflicts over dairy products caused by CET and subsidies. Regular meetings should be held to facilitate the exchange of experiences regarding CET subsidies among countries, using the golden milk source belt as an example. In addition, it is recommended that all countries establish a CET information-sharing platform to exchange CE data, CET collection status, subsidy distribution information, and other relevant information. At the same time, there is a necessity to strengthen the supervision of CET collection and subsidy utilization to prevent enterprises from gaining improper benefits through the false reporting of CE or the misuse of subsidies. This will help ensure the fairness and effectiveness of the policies.
Third, the revenues from a CET should be allocated to the research and innovation of low-carbon technologies in dairy farming, the promotion of energy transformation and industrial upgrading, and the support of developing countries and small-scale farming entities. The abatement from dairy farming can be achieved through the implementation of strategies such as the optimization of feed formulas, the improvement of manure management, and the enhancement of energy efficiency. The establishment of special scientific research funds is recommended, to provide subsidies and tax incentives for the research and development of low-carbon dairy farming technologies. Enterprises and scientific research institutions should be encouraged to conduct research, development, and promotion of low-carbon technologies. Concurrently, the funds can be utilized to assist countries with less advanced dairy farming in the development of low-carbon infrastructure and the enhancement of their capacity to respond to climate change. It is also crucial to direct attention toward the vulnerable groups in the dairy farming sector, who are particularly affected by CET. To mitigate the adverse effects of CET, tax exemptions should be considered.
The sample size is relatively small, which may limit the generalization of the results. Future studies with larger sample sizes are needed to further validate our findings. Besides, we have not considered the cost of low-carbon technology and CE reduction by farms, which will be improved in the future.
Data availability statement
The original contributions presented in the study are included in the article/supplementary material, further inquiries can be directed to the corresponding author.
Author contributions
SS: Conceptualization, Supervision, Writing – original draft, Writing – review & editing. CL: Resources, Writing – original draft. JC: Resources, Supervision, Writing – review & editing. YJ: Methodology, Writing – original draft. XW: Data curation, Writing – review & editing.
Funding
The author(s) declare that financial support was received for the research and/or publication of this article. This research was funded by National Social Science Foundation of China (23BGL236).
Conflict of interest
The authors declare that the research was conducted in the absence of any commercial or financial relationships that could be construed as a potential conflict of interest.
Publisher's note
All claims expressed in this article are solely those of the authors and do not necessarily represent those of their affiliated organizations, or those of the publisher, the editors and the reviewers. Any product that may be evaluated in this article, or claim that may be made by its manufacturer, is not guaranteed or endorsed by the publisher.
References
Chen, Y., and Shang, J. (2014). Disconnect analysis and influence factors of animal husbandry in China. China Popul. Resour. Environ. 24, 101–107.
Claire, M., Wolfgang, B., Thomas, J., Stephane, D. C., Pierre-Alain, J., Petr, H., et al. (2019). Greenhouse gas abatement strategies and costs in French dairy production. J. Clean. Prod. 236:117589. doi: 10.1016/j.jclepro.2019.07.064
FAO (2010). Greenhouse Gas Emissions from the Dairy Sector: A Life Cycle Assessment. Available online at: https://www.fao.org/4/k7930e/k7930e00.pdf
Filho, J. B., De, S., and Rocha, M. T. (2008). Economic evaluation of public policies aiming the reduction of greenhouse gas emissions in Brazil. J. Econ. Integr. 23, 709–733. doi: 10.11130/jei.2008.23.3.709
Floros, N., and Vlachou, A. (2004). Energy demand and energy-related CO2 emissions in Greek manufacturing: assessing the impact of a carbon tax. Ener. Econ. 27, 387–413. doi: 10.1016/j.eneco.2004.12.006
Hua, J. G. (2012). Considerations on optimal scale for different types of dairy farms in China. China Dairy Cattle 4, 2–5.
Huang, W. Q. (2015). Carbon Footprint Assessment Methodology of Milk Production in Intensive Dairy Farm and Case Study. Beijing: Chinese Academy of Agricultural Sciences Dissertation.
Jansson, T., and Säll, S. (2018). Environmental consumption taxes on animal food products to mitigate greenhouse gas emissions from the European union. Clim. Change Econ. 9, 1850009.1–1850009.16. doi: 10.1142/S2010007818500094
Jiang, H., Dong, K., Qing, J., and Teng, Q. (2023). The role of technical change in low-carbon transformation and crises in the electricity market: a CGE analysis with RandD investment. Ener. Econ. 125:106897. doi: 10.1016/j.eneco.2023.106897
Jiang, H., Pradhan, B., Dong, K., Yu, Y., and Liang, Q. (2024). An economy-wide impacts of multiple mitigation pathways toward carbon neutrality in China: a CGE-based analysis. Ener. Econ. 129:107220. doi: 10.1016/j.eneco.2023.107220
Klenert, D., Funke, F., and Cai, M. (2022). Would a meat tax in Europe inevitably burden the poor? Electron. J. 429:8405. doi: 10.2139/ssrn.4298405
Lang, H., Xiao, S. S., and Wang, Y. (2019). Decoupling analysis of agricultural carbon emissions and economic development in Sichuan Province. J. Shandong Agricult. Univ. (Social Science Edition) 21, 69–78 +158.
Li, B. (2012). Empirical study on relationship between economic growth and agricultural carbon emissions. Ecol. Environ. Sci. 21, 220–224.
Li, L., Zhou, C., Li, E. L., and Li, X. J. (2013). Decoupling analysis of agricultural carbon emission and economic development from an input perspective: a case study of Huai-Hai Plain. J. Ecol. Rural Environ. 29, 551–558.
Liang, Y. J., and Wang, Y. T. (2012). Determination of optimal scale for dairy cattle farming: a multi-objective programming approach. Chin. J. Anim. Sci. 48, 44–48.
Lin, B. Q., and Jia, Z. (2018). The energy, environmental and economic impacts of carbon tax rate and taxation industry: a CGE based study in China. Energy 159, 558–568. doi: 10.1016/j.energy.2018.06.167
Lyu, H., Ma, C., and Arash, F. (2024). Government innovation subsidies, green technology innovation and carbon intensity of industrial firms. J. Environ. Manage. 369:122274. doi: 10.1016/j.jenvman.2024.122274
Malerba, D., Gaentzsch, A., and Ward, H. (2021). Mitigating poverty: the patterns of multiple carbon tax and recycling regimes for Peru. Energy Policy 149:111961. doi: 10.1016/j.enpol.2020.111961
Mona, M. R. (2023). Carbon tax accompanied by a revenue recycling increases Australia's GDP: a dynamic recursive CGE approach. J. Clean. Prod. 418:138187. doi: 10.1016/j.jclepro.2023.138187
Na, L., Xilong, Y., Fang, W., and Yunfei, H. (2023). Are tax revenue recycling schemes based on industry-differentiated carbon tax conducive to realizing the “double dividend”? Ener. Econ. 124:106814. doi: 10.1016/j.eneco.2023.106814
Ollier, M., and Stéphane, D. C. (2024).Give and take: an analysis of the distributional consequences of emission tax-and-rebate schemes with an application to greenhouse gas emissions from European agriculture. Ecol. Econ. 219:108154. doi: 10.1016/j.ecolecon.2024.108154
Roach, T. (2021).Dynamic carbon dioxide taxation with revenue recycling. J. Clean. Prod. 289:125045. doi: 10.1016/j.jclepro.2020.125045
Saelim, S. (2019). Carbon tax incidence on household demand: effects on welfare, income inequality and poverty incidence in Thailand. J. Clean. Prod. 234, 521–533. doi: 10.1016/j.jclepro.2019.06.218
Shi, S., Jing, Y., and Li, C. (2019). Mitigation effect of carbon emission tax in dairy farming: an empirical study of heilongjiang province in China. Sustainability 11:333. doi: 10.3390/su11020333
Springmann, M., Mason-D'Croz, D., Robinson, S., Wiebe, K., Godfray, H. C. J., Rayner, M., et al. (2016). Mitigation potential and global health impacts from emissions pricing of food commodities. Nat. Clim. Chang. 7, 69–74. doi: 10.1038/nclimate3155
Tang, K., Hailu, A., Kragt, M. E., and Ma, C. (2018). The response of broad acre mixed crop-livestock farmers to agricultural greenhouse gas abatement incentives. Agric. Syst. 160, 11–20. doi: 10.1016/j.agsy.2017.11.001
Tubiello, F. N., Salvatore, M., Rossi, S., Ferrara, A., Fitton, N., Smith, P., et al. (2013). The FAOSTAT database of greenhouse gas emissions from agriculture. Environ. Res. Lett. 8:015009. doi: 10.1088/1748-9326/8/1/015009
Wang, C., Wang, W., and Huang, R. (2017). Supply chain enterprise operations and government carbon tax decisions considering carbon emissions. J. Clean. Prod. 152, 271–280. doi: 10.1016/j.jclepro.2017.03.051
Wehner, J., and Yu, X. (2023). Carbon tax on milk products and the exact consumer welfare measure in emerging economies. Agribusiness 39, 1595–1623. doi: 10.1002/agr.21854
Keywords: carbon tax-subsidy policy, decoupling analysis, market equilibrium, dairy farming, global golden milk source belt
Citation: Shi S, Liu C, Chi J, Jing Y and Wang X (2025) Can carbon taxes and subsidies promote both carbon reduction and economic growth in dairy farming?—A case study from the global golden milk source belt. Front. Sustain. Food Syst. 9:1349340. doi: 10.3389/fsufs.2025.1349340
Received: 04 December 2023; Accepted: 15 April 2025;
Published: 09 May 2025.
Edited by:
Jiekuan Zhang, Guilin Tourism University, ChinaReviewed by:
Hong-Dian Jiang, China University of Geosciences, ChinaJana Soukupová, Czech University of Life Sciences Prague, Czechia
Copyright © 2025 Shi, Liu, Chi, Jing and Wang. This is an open-access article distributed under the terms of the Creative Commons Attribution License (CC BY). The use, distribution or reproduction in other forums is permitted, provided the original author(s) and the copyright owner(s) are credited and that the original publication in this journal is cited, in accordance with accepted academic practice. No use, distribution or reproduction is permitted which does not comply with these terms.
*Correspondence: Jia Chi, dml2aWxpbmFfc2hpQDEyNi5jb20=