 Sheila Serrano-Vincenti1*
 Jessica Guamán-Pozo2†
 Jonathan Chuqui1
 Rodrigo Tufiño3
 Christian Franco-Crespo4*
- 1Grupo de Investigación GIERENA, Centro de Investigación en Modelamiento Ambiental CIMA-UPS, Universidad Politécnica Salesiana, Quito, Ecuador
- 2Universidad Politécnica Salesiana, Quito, Ecuador
- 3Computer Engineering, Research Group IDEIAGEOCA, Universidad Politécnica Salesiana, Quito, Ecuador
- 4Faculty of Food Science and Engineering and Biotechnology, Universidad Técnica de Ambato, Ambato, Ecuador
Studying the climate of the Tropical Central Andes is challenging due to its complex topography, diverse climatic regions shaped by the Andean Mountains, and the scarcity of in-situ meteorological data. This limitation complicates assessments of climate variability and its impact on agriculture. This study evaluates the impact of 2050 climate change scenarios on blackberry, tree tomato, maize, and potato production in Tungurahua, Ecuador, by estimating water availability for rainfed crops. In-situ available meteorological data were collected and analyzed using the ClimDex methodology to assess long-term climatic trends. Additionally, the General Algebraic Modeling System (GAMS) was employed to model agricultural productivity under pessimistic and optimistic climate scenarios. Climate change projections to 2050 were based on data from Ecuador’s Third and Fourth National Communications on Climate Change. The results indicate that, to date, climate change effects in this region have not been significant; higher temperatures have reduced frost occurrence, and no substantial increases in extreme rainfall or droughts have been observed. However, future projections suggest increased precipitation, a higher likelihood of extreme rainfall, and a decline in drought frequency. These expected changes highlight the need for adaptive strategies in agricultural planning and water resource management.
1 Introduction
Climate change (CC) and food security are directly interconnected (Altieri et al., 2015; Ortíz-T and Gerique, 2024), The effects of climate change are considered a major threat to global food security, exerting both direct and indirect impacts across multiple dimensions, including economic, energy, social, and environmental factors (Molotoks et al., 2020). The Sixth Assessment Report (AR6) of the Intergovernmental Panel on Climate Change (IPCC) concluded that there is evidence of future plant health problems related to weather factors and pest-related threats. Additionally, negative effects on ecosystems may lead to significant disruptions in crop cycles, agricultural production, and consequently, food availability and sovereignty (IPCC, 2023).
In addition, the agriculture and livestock sectors are particularly vulnerable and are expected to experience severe impacts (Bocchiola et al., 2019). According to the FAO (2018) increasingly frequent and intense extreme weather events negatively affect food availability, access to food, and market stability in rural areas. Projections indicate that global food prices will rise due to a decline in agricultural production. These consequences may contribute to a rise in malnutrition, as reduced access to nutritious foods could significantly affect household calorie intake (Wossen et al., 2019).
Agriculture is a pillar of food security and a major source of employment in Latin America. Small farms are responsible for providing important diversity to basic food baskets. Small farms, in particular, play a crucial role in ensuring the diversity of staple food baskets, thereby strengthening food sovereignty, availability, and security. However, agricultural sectors in these countries are highly vulnerable to the impacts of climate change, as the adoption of adaptive technologies largely depends on the implementation of effective public policies. Moreover, small-scale farmers often face economic constraints, as their limited income restricts their ability to invest in improved agricultural practices, infrastructure, and climate adaptation strategies. Previous studies (Saxena et al., 2016; Sultan et al., 2013; Tambet and Stopnitzky, 2021) have documented the negative consequences of climate variability on small-scale farms. This variability directly affects agricultural production and farmers’ income, while anthropogenic activities—such as deforestation, water contamination, and land-use changes—exacerbate vulnerabilities in rural areas, where climate change adaptation is constrained by limited infrastructure and investment. Furthermore, climate change poses additional threats, including increased temperatures, altered precipitation patterns, and the emergence of agricultural pests, all of which significantly impact crop yields and food security.
In Andean countries, agriculture significantly contributes to gross domestic product (GDP) accounting for approximately 5% to global GDP in nations such as Colombia, Ecuador, Peru, and Bolivia (Altieri and Koohafkan, 2008), and in 2017, the impact increased to 7.6%. Agricultural labor is primarily concentrated in farming activities, livestock breeding, and diversified crop production. Resource distribution in these countries follows distinctive patterns, particularly regarding water use. In regions where agriculture is a dominant sector, water consumption is allocated as follows: 80% for agriculture, 15% for domestic use, and 5% for industrial activities. Irrigation systems are predominantly based on surface techniques (90%), while advanced irrigation technologies, such as drip, sprinkler, and microsprinkler irrigation, are applied to only 10% of agricultural land. Furthermore, small farms (0.01–5 hectares) account for 70% of fresh food supplied to markets and are characterized by polycultures and diversified production systems. In contrast, large farms (over 100 hectares) primarily engage in monoculture practices and agro-export-oriented production (Tambet and Stopnitzky, 2021).
The average cultivated area and crop production (Figure 1) experienced a significant decline between 1999 and 2020 for several key crops, including potatoes (Ecuador and Colombia), fresh fruits (Ecuador and Bolivia), and tomatoes (Ecuador, Peru, Bolivia, and Colombia). While multiple factors contribute to changes in cultivated area and yield, extreme weather events have been a major driver of the observed variations. Andean countries such as Colombia, Ecuador, Peru, and Bolivia share common environmental characteristics (MAE, 2017). However, the Andes Mountain range and the Pacific coast create diverse climatic conditions, with natural phenomena such as El Niño South Oscillation ENSO generating extreme weather events (Ortíz-T and Gerique, 2024; Vilema-Escudero and Manya Orellana, 2024).
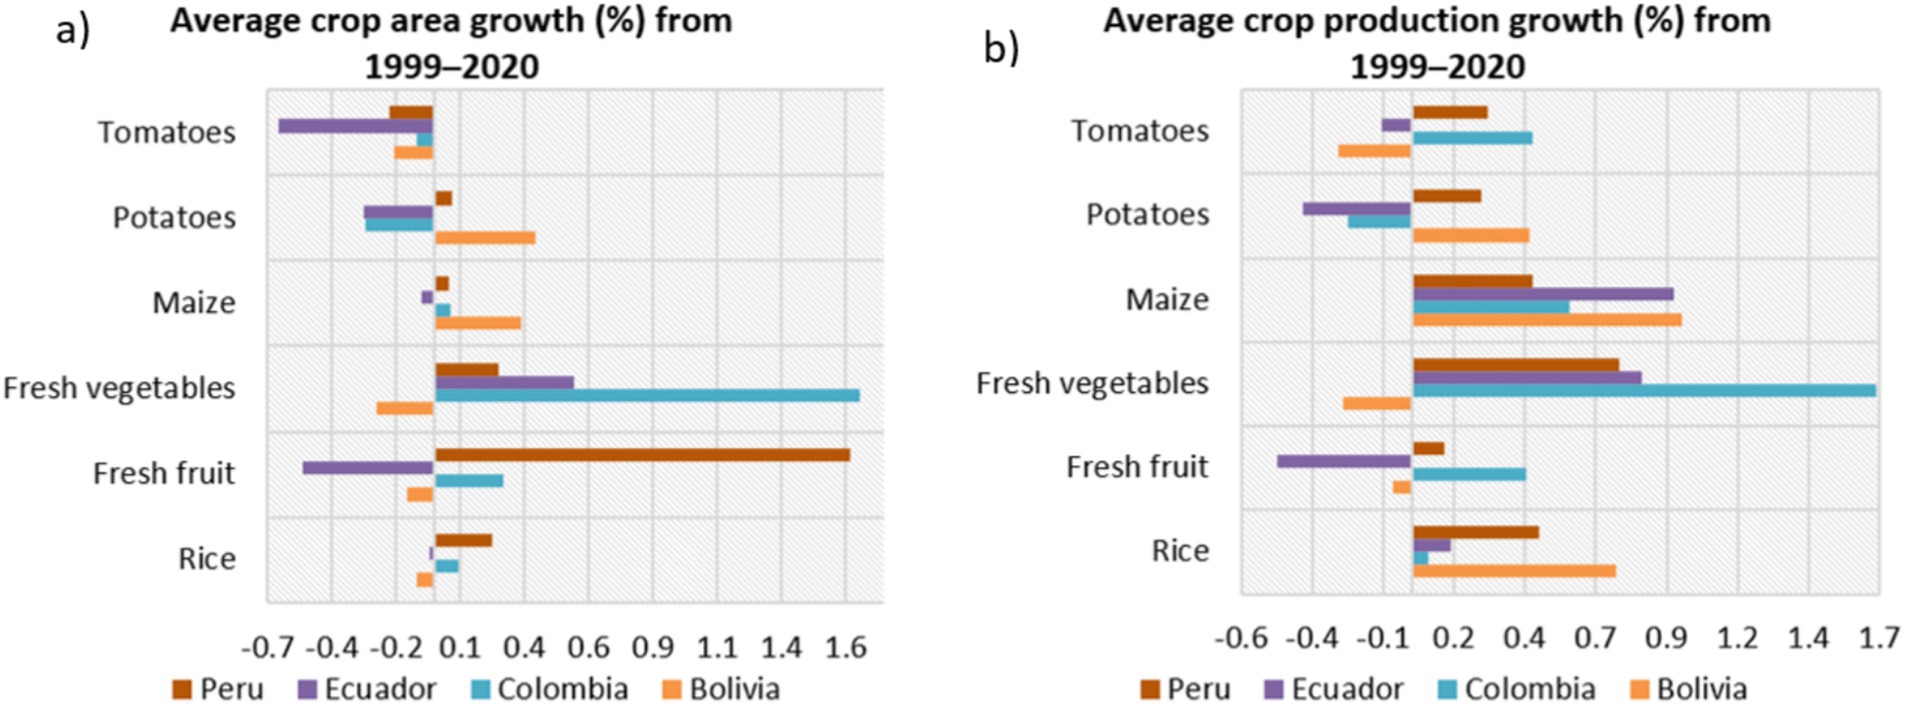
Figure 1. Crop growth since 1999–2020 in Peru, Ecuador, Colombia, and Bolivia for different crops, (a) average crop area growth (b) average crop production growth (FAO, 2018).
Furthermore, agriculture in this region is marked by significant structural inequalities in access to critical resources such as water, land, credit, and technology. On average, 80% of small farmers have access to only 15% of the land, while the remaining 20% control 85% of agricultural land, reflecting stark disparities in land distribution. This inequality is further highlighted by the region’s high Gini index of 0.70 (Amamou et al., 2018; Vollrath, 2007).
Altieri et al. (2015) demonstrated that rising global mean temperatures could lead to significant increases in food prices, exceeding 30%. Ecuador’s unique geographical characteristics create distinct challenges for future climate projections, particularly concerning water availability. Rainfed agriculture dominates the country’s farming sector due to limited access to irrigation infrastructure (Franco-Crespo and Sumpsi, 2017). Since agriculture serves as the primary source of income for the most economically vulnerable populations (Stevens and Madani, 2016), most farmers rely on seasonal rainfall for successful crop production. Consequently, even minor variations in climate conditions can substantially increase agricultural risks. Several key factors influence crop yields, including (a) a reduction in the number of rainy days per year, (b) an increase in the frequency of dry days, (c) shifts in seasonal timing, and (d) a rise in crop pest infestations (Hussain et al., 2021).
Toward assessing the anticipated effects of climate change within specific predictive frameworks. The Third (MAE, 2017) and Fourth National Communication on Climate Change (MAATE, 2022) projects an increase in extreme climatic events, rising sea levels, glacier retreat, and reduced annual runoff. These phenomena are closely linked to the vulnerabilities previously discussed, particularly in Ecuador, where agriculture heavily depends on stable and predictable weather patterns. The application of Representative Concentration Pathway (RCP) scenarios, specifically RCP4.5 (or pessimistic, meaning if no action is taken) and RCP8.5 (or optimistic, if the energy matrix is completely transformed), provides a comprehensive perspective on potential future outcomes, ranging from moderate to severe impacts. This forward-looking approach highlights the urgent need for strategic adaptation and resilience planning. In this context, The Ministry of the Environment, Water, and Ecological Transition of Ecuador (MAATE, by its Spanish acronym), formerly known as the Ministry of the Environment of Ecuador (MAE), before 2021; plays an important role in integrating these climate projections with stakeholder needs, ensuring a proactive and targeted strategy to protect the agricultural sector and, by extension, the nation’s socioeconomic stability from the increasing threats posed by climate change (Robinson et al., 2015).
Recent studies (Chimborazo and Vuille, 2021) predict substantial shifts in temperature and precipitation patterns. By leveraging satellite data and advanced forecasting tools, the RCP4.5 and RCP8.5 scenarios offer more precise and efficient climate projections. A comprehensive review of the projected impacts of climate change under various scenarios is presented in Table 1.
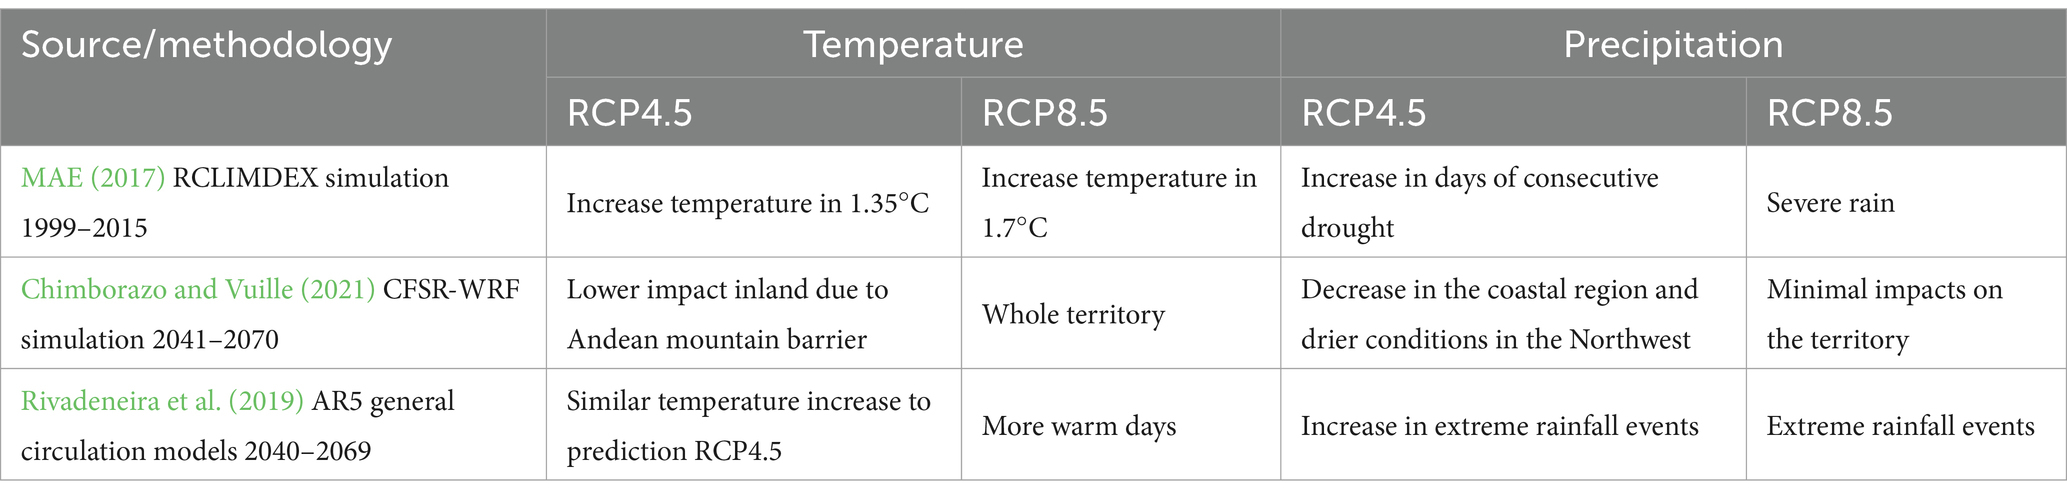
Table 1. Studies of climate consequences for Ecuador under the RCP4.5 (optimistic) and RCP8.5 (pessimistic) scenarios.
Anthropogenic environmental impacts are evident in Ecuador, particularly due to agricultural expansion and deforestation (Jaramillo et al., 2025). The coastal and northwestern regions are especially vulnerable under both RCP4.5 and RCP8.5 scenarios. In these areas, agro-export crops such as bananas, sugarcane, rice, cacao, and coffee have significantly altered land use, replacing forests with farmland; as well as the expansion of shrimp farming into mangrove swamps. All these practices had increased flood risks and reducing natural barriers against extreme weather events. Furthermore, the use of chemical fertilizers has had a comparatively lower impact on climate change, as the absence of public policies promoting sustainable agricultural practices has hindered efforts to mitigate environmental damage in monoculture farming systems (FAO, 2018).
In the Andean highlands, glacial retreat has severe environmental implications, particularly for water availability essential to agricultural irrigation (Hidalgo et al., 2024). Moreover, limited access to technology remains a critical barrier to climate change adaptation, contributing to crop losses and forcing many farmers to abandon agriculture (Rosenzweig et al., 2014). A reduction in water availability is imminent in the southern region (Markley, 2015), rainfall polarization is occurring, characterized by an increase in drought frequency during dry seasons and regions, while extreme rainfall events are intensifying during wet seasons (Serrano Vincenti et al., 2016). Given these challenges, agri-food systems in the region have always been deeply dependent on climate conditions, which influence crop selection, production methods, and harvesting techniques (Cordero-Ahiman et al., 2021). A review of the literature on climate change impacts is presented in Table 2.
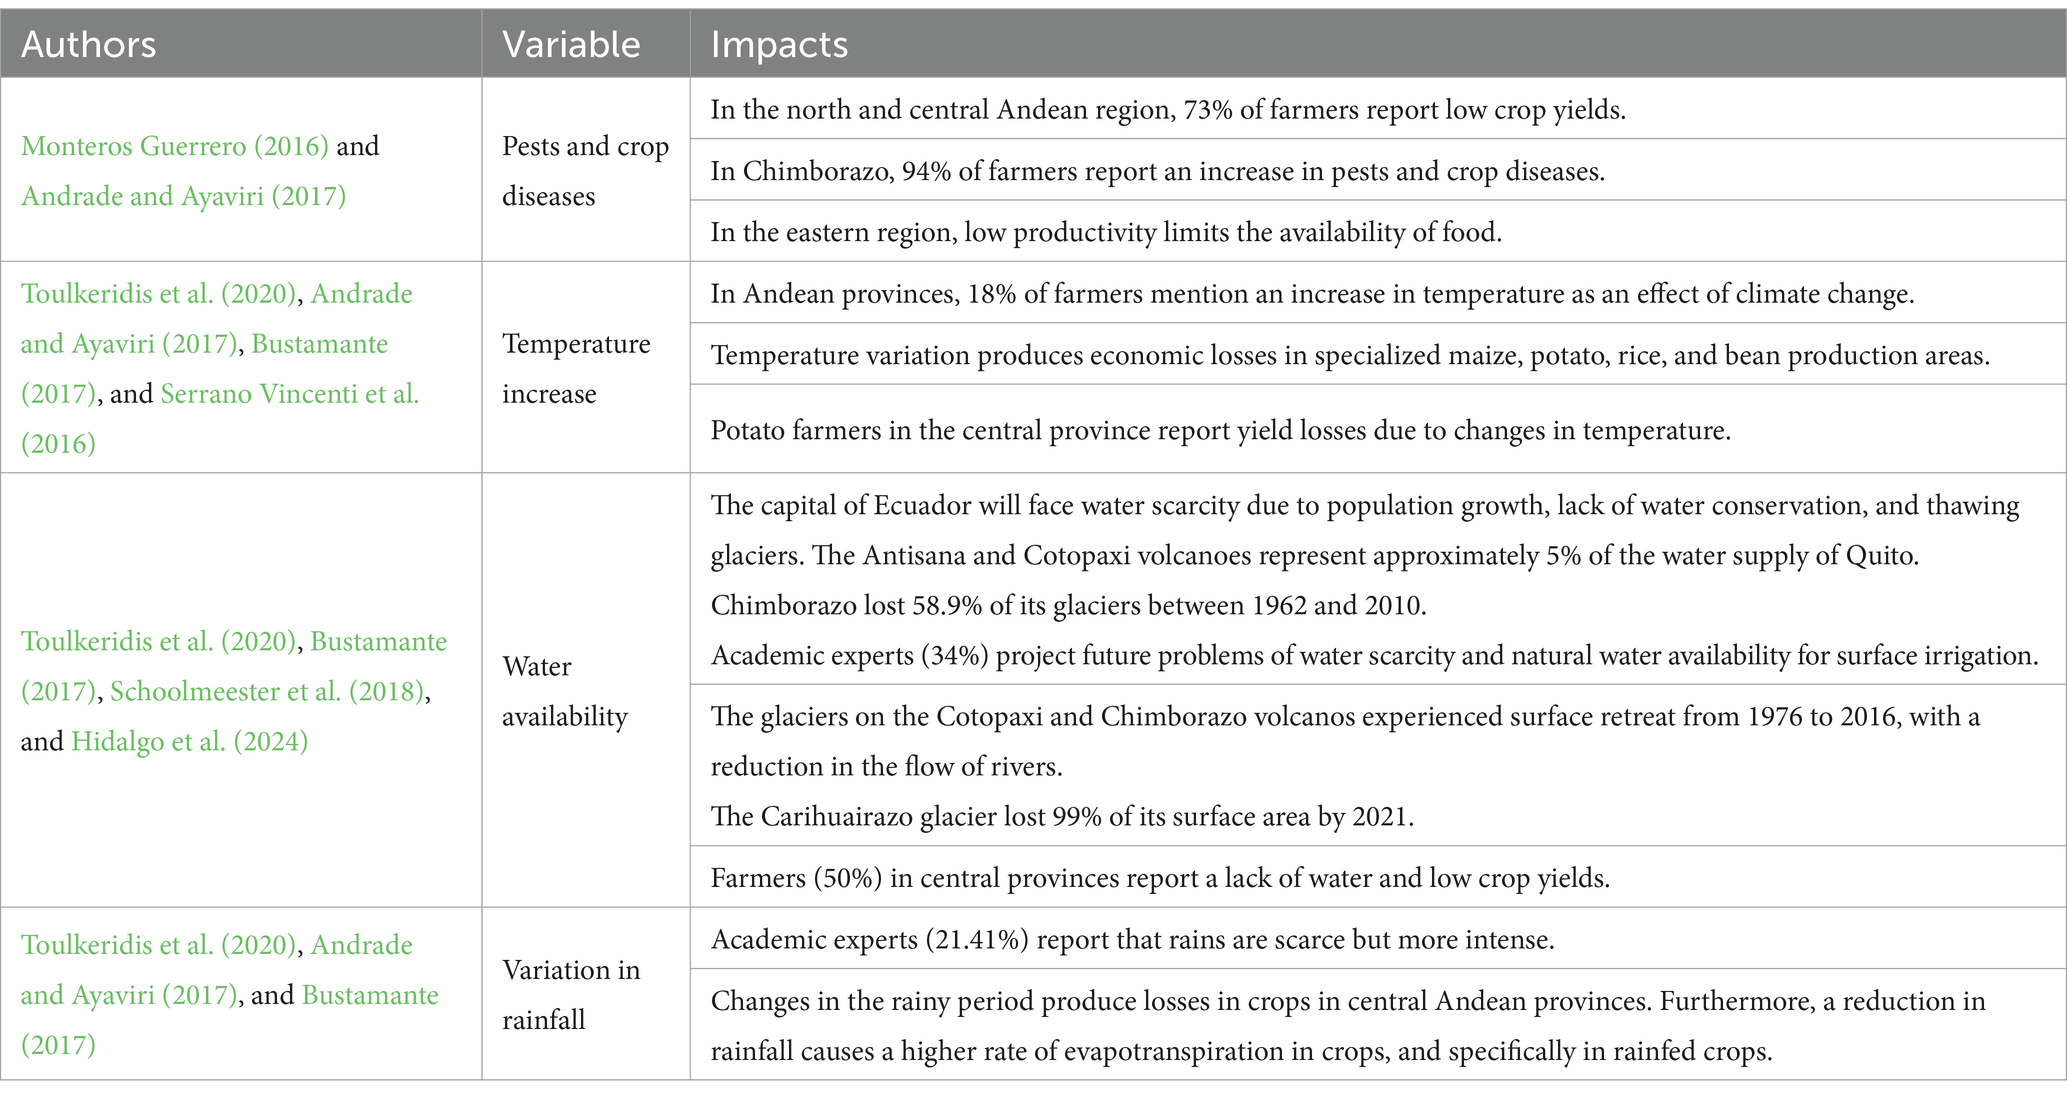
Table 2. Literature review of climate change impacts in Ecuador.
Then climate in Ecuador has undergone significant changes over the past several decades, leading to severe consequences for farmers, who are among the most directly affected by these shifts (Li et al., 2021; Rivadeneira et al., 2019). The main climate change impacts perceived by farmers and researchers in Ecuador are summarized in Table 2. Changes in temperature and precipitation patterns have been identified as major drivers of yield losses, underscoring the direct impact of climate change on food production and food security in the northern and central Andean regions. Furthermore, climate variability introduces uncertainties regarding pest life cycles. Shifts in humidity, precipitation, and temperature create optimal conditions for certain insect, bacterial, viral, and fungal populations, potentially escalating minor pest issues into widespread infestations (Food and Agriculture Organization of the United Nations, 2008).
Chakraborty and Newton (2011), in a global review, outlined the potential consequences of climate change on pest and pathogen populations in agroecosystems, as well as strategies for mitigating these impacts. They highlighted that increased soil activity and plant diversification can reduce pest reproduction by fostering competition between prey and predators. More recent studies have also simulated future pest risks. The Intergovernmental Panel on Climate Change (IPCC) (2023) concluded that climate change exacerbates issues related to crop loss, particularly in cold regions, where alterations in pathogen life cycles could lead to yield reductions and create new challenges for traditional agriculture. Abbass et al. (2022) proposed both short- and long-term adaptation strategies, emphasizing the role of technology and public policies as key tools for mitigating future pest-related threats. Similar conclusions were drawn by Skendži et al. (2021), who found that rising temperatures alter soil conditions, disrupting pest life cycles and shifting ecosystems away from their traditional states. Additionally, changes in precipitation patterns influence pest activity, as rainfall can reduce insect populations by washing them off plant surfaces.
To mitigate the risks associated with climate change, policymakers are increasingly relying on sophisticated mathematical models to anticipate the outcomes of various climate change scenarios (Mimura et al., 2015). The efficacy of these models in forecasting agricultural outputs is crucial for maintaining food security, as demonstrated by numerous studies in food production (Gebresamuel et al., 2021). This approach is particularly vital for regions lacking the means to adapt to the shifting climate. Through mixed-method strategies that combine climate future scenarios with mathematical modeling, researchers can explore, design, and project the dynamics of agricultural systems. These systems are analyzed in terms of their inherent properties, management practices, and the influence of external variables. Such models are adept at forecasting crop growth, productivity, and overall performance offering a valuable tool for decision-makers in planning and ensuring the resilience of food production systems against climate-induced uncertainties (Rosenzweig et al., 2014).
Building on the premise that advanced mathematical modeling plays a crucial role in predicting and mitigating the impacts of climate change on agriculture, this study aims to assess the future of agricultural production in the context of a changing climate. Specifically, our research focuses on the agricultural dynamics of Tungurahua, an Andean province of Ecuador, analyzing key crops including maize (Zea mays), potato (Solanum tuberosum), blackberry (Rubus ulmifolius), and tree tomato (Solanum betaceum). By integrating diverse data sources, this study seeks to identify how climate change is expected to manifest within Ecuador’s distinct geographical and climatic conditions and its subsequent implications for national food security.
Our investigation is structured around a comprehensive analysis that combines empirical data, climate projections, and the predictive power of mathematical modeling. This approach allows us to not only forecast the direct impacts of climate change on crop yields and agricultural productivity but also to understand the indirect effects on food availability, access, and stability. By exploring these scenarios, the study seeks to provide a view of how climate variability and change could reshape food production systems in the Tropical Andes, highlighting the potential challenges and opportunities for adaptation and resilience in the face of a changing climate. Through this research, we aspire to contribute valuable insights and recommendations that can guide policymakers, agricultural stakeholders, and communities in devising effective strategies to ensure the continued security and sustainability of food resources in Ecuador.
2 Materials and methods
This study focuses on Tungurahua province, located in Ecuador’s Andean Sierra with a population of 563,532, with 59.1% residing in rural areas. Agriculture and livestock play a vital role in the region’s economy, employing 88,424 individuals—27.61% of the workforce (INEC, 2019). The research specifically examines the cantons of Píllaro, Mocha, and Tisaleo, selected for their key contributions to regional food security through crop production. These cantons have an average altitude of 2,600 meters above sea level (masl), a factor that significantly shapes agricultural practices. Notably, 90% of cultivated land in these areas depends on rainfed agriculture, making them particularly vulnerable to climate variability, besides these three cantons are urbanized on a small to medium scale, so the urban heat island effect is not very noticeable, except to Querochaca station.
2.1 In situ and modeled climate data
The study utilized in situ meteorological data from Tungurahua province, obtained from the National Institute of Meteorology and Hydrology of Ecuador (INAMHI, by its Spanish acronym). The selected stations, shown in Figure 2, met the criterion of at least 80% data completeness for daily precipitation (rr), maximum temperature (tx), and minimum temperature (tn). A detailed description of the dataset is provided in Table 3.
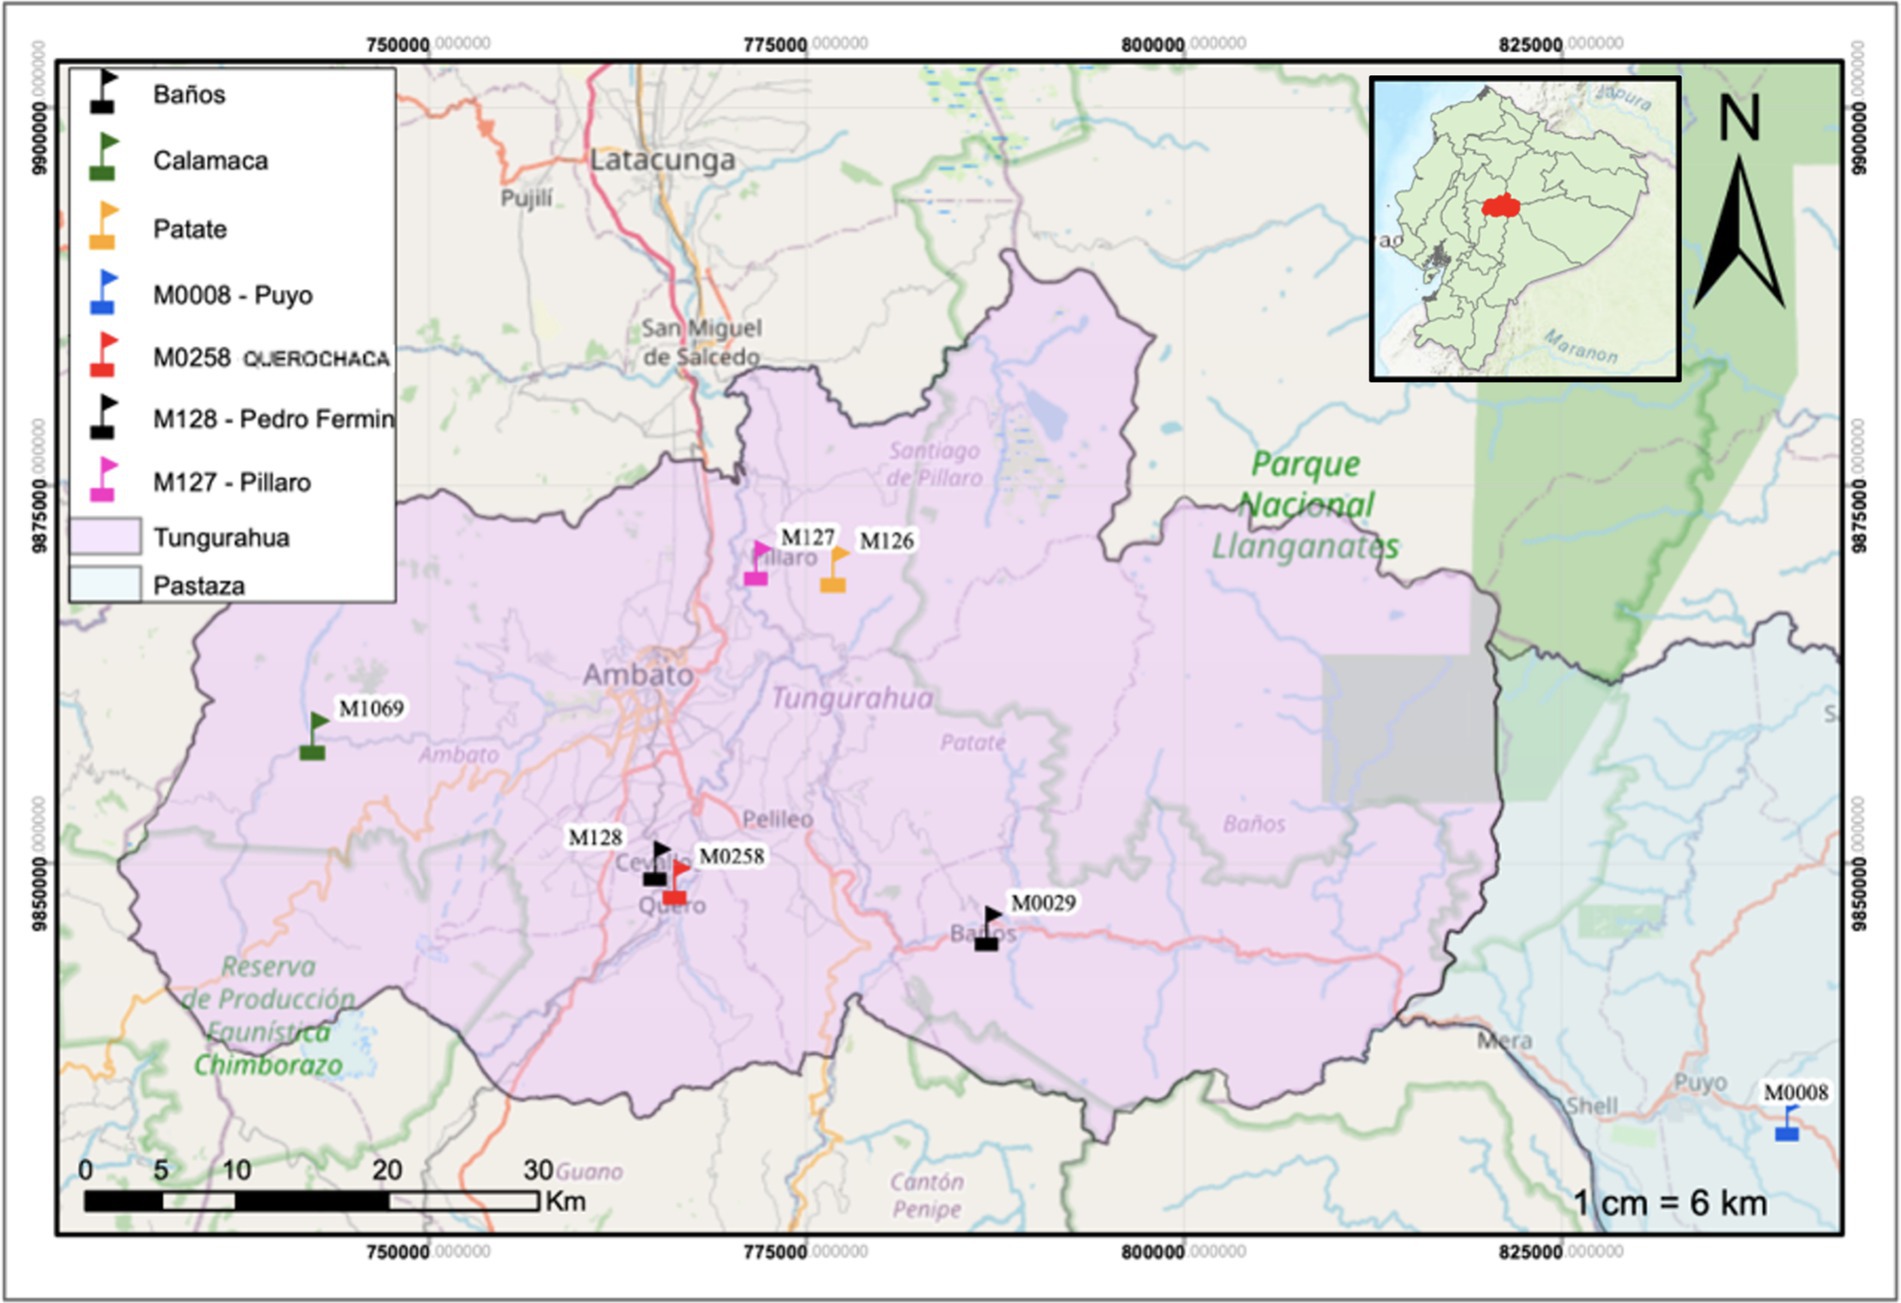
Figure 2. Location map of nearby weather available stations in the provinces of Tungurahua and Pastaza.
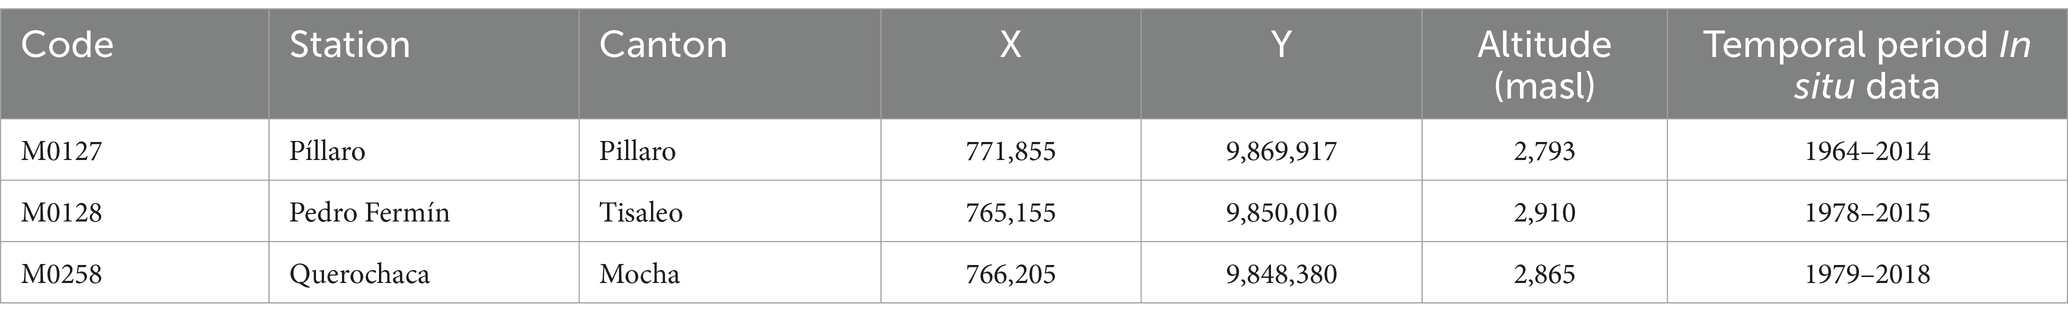
Table 3. General information on the meteorological stations used in the study.
Climate projection data were provided by Ministerio del Ambiente, Agua y Transición Ecológica (2017) and MAATE (2022), 15 models from the CMIP5 (Coupled Model Intercomparation Project -CMIP5-) database were chosen based on the availability of monthly data for precipitation and temperature (mean, maximum, and minimum) for both the historical period (1976–2005) and future RCP scenarios (2011–2,100). These models had previously shown strong performance in representing tropical climate conditions, particularly in Colombia. Additionally, observed monthly data from INAMHI for 1981–2005 were reviewed and quality-checked. This period was selected due to the high completeness and reliability of station records. The final dataset included stations with at least 85% of complete, validated data.
These data consisted of historical and future climate scenarios presented in gridded (50 km x 50 km) formats included daily precipitation (rr), maximum temperature (tx), and minimum temperature (tn). The historical dataset covered the period 1981–2015, while projections were available for 2011–2070 under the two RCP scenarios RCP4.5 and RCP8.5.
Since meteorological data provided by INAMHI were in a tab-separated text format (CSV), they were not directly compatible with RClimDex. To address this, a pre-processing step was performed using Python. A custom script was developed to convert the individual meteorological files from INAMHI into a format compatible with RClimDex. The full algorithm is available in the GitHub repository: https://github.com/rtufino/Conversor-Datos-Meteorologicos.
It is important to note that the lack of in-situ meteorological stations, combined with the poor quality of available data—due to various factors such as inadequate maintenance, sensor replacements, and other operational issues—resulted in a high level of uncertainty in the initial dataset. For this reason, a thorough and meticulous quality control process was necessary to ensure the reliability of the data used in this study. Then, meteorological quality control was conducted by identifying outliers based on the criteria μ ± 4σ and Tmax – Tmin ≥ 0 for minimum and maximum temperature. Additionally, modeled temperature data were corrected by comparing them with in situ observations to identify and adjust for bias errors, also for precipitation data, outliers were detected and examined using the μ ± 10σ and Prec ≥ 0 criterion (Lanzante, 1996). However, they were not removed, considering their importance in extreme event analysis (Serrano-Vincenti et al., 2022).
A statistical downscaling approach was applied for bias correction, comparing modeled vs. in situ data (Chuqui, 2022; Guamán, 2020; Pacheco, 2022). Monthly averages of historical simulated data (1981–2015) and observed data were calculated. The historical model outputs were matched with in situ temperature data for 1981–2015, and an adjustment factor was applied to equalize the moving averages. In the case of precipitation, it was found that both the modeled and in-situ data exhibited the same seasonal dynamic behavior. This consistency in the temporal distribution of rainfall patterns validates the reliability of both datasets and supports their use in the study (Erazo et al., 2018). This correction was applied for computing climate indices in RClimDex and generating projections for 2050 (Quiroz Antunez et al., 2022).
2.1.1 Climate change indexes
The Expert Team on Climate Change Detection, Monitoring, and Indices (ETCCDMI) developed 27 climate change indexes, implemented in the ClimDex computational package. These indexes are designed to analyze extreme temperature and precipitation patterns over different time periods and regions. The climate change indexes most relevant to the tropical Andes are presented in Tables 4, 5. These indexes were calculated using both in situ observations and climate projections under both RCP4.5 and RCP8.5 scenarios (Serrano Vincenti et al., 2016).
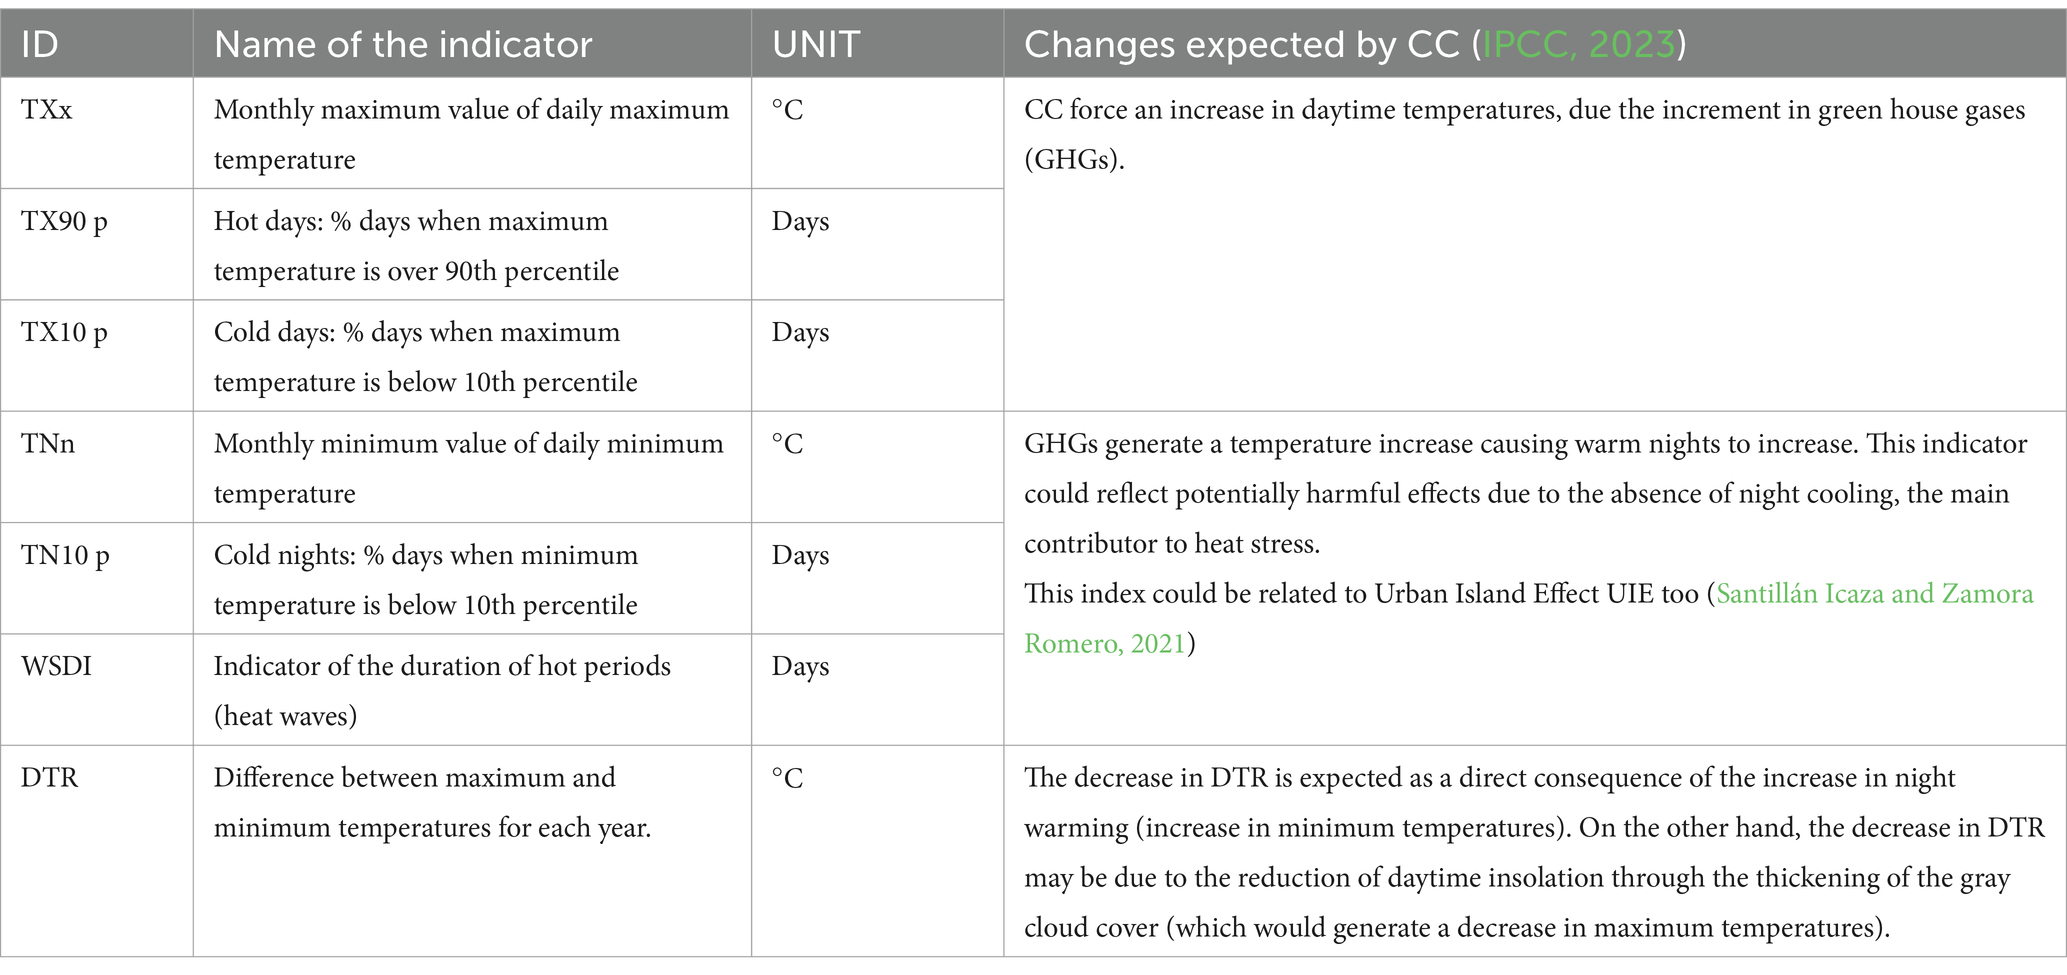
Table 4. Temperature-based climate change indexes recommended by the ECTCCDI used in this study (Serrano et al., 2012; Serrano Vincenti et al., 2016).
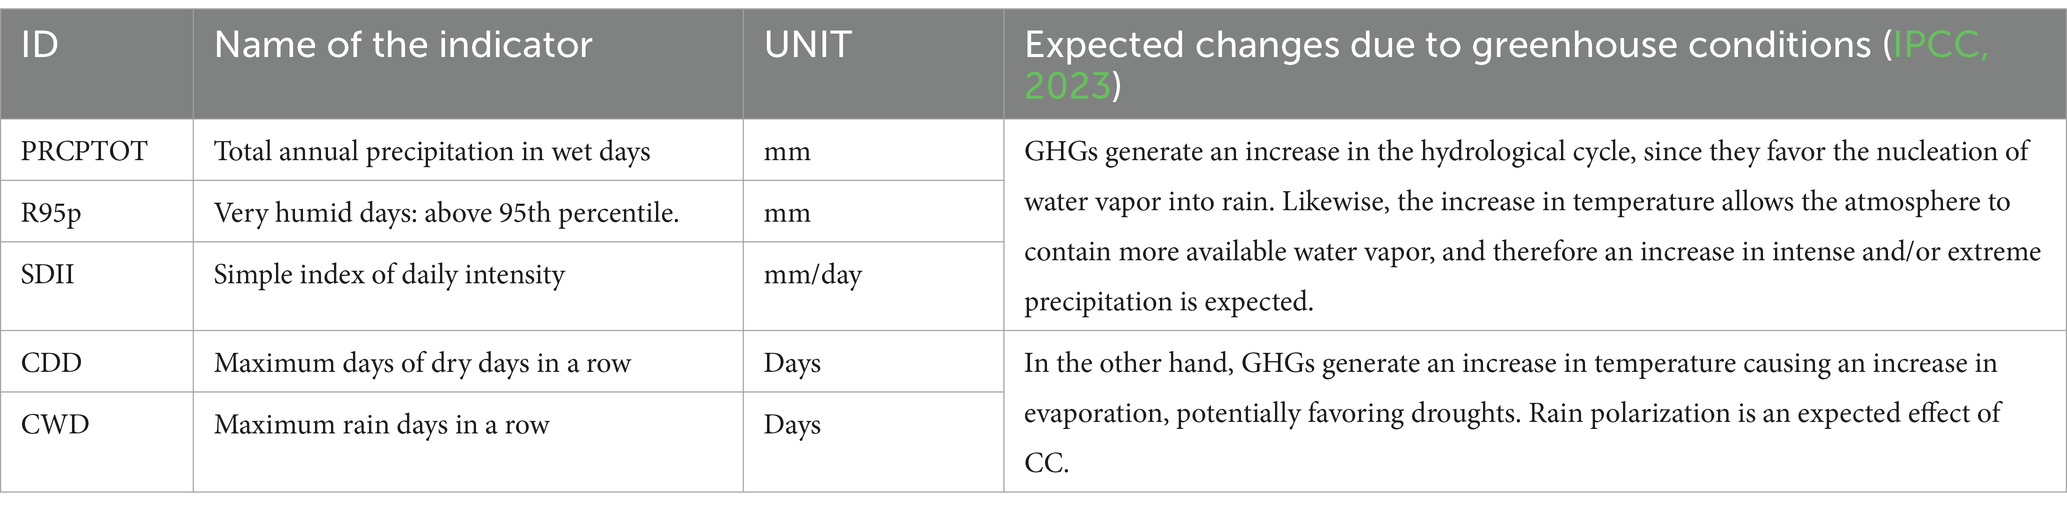
Table 5. The climate change indexes used in this study are related to the precipitation differences recommended by the ECTCCDI (Serrano et al., 2012; Serrano Vincenti et al., 2016).
2.2 Agricultural and socioeconomic data collection and validation
Socioeconomic data were obtained from a validated database based on a stratified sample of 202 farmers from Píllaro, Mocha, and Tisaleo in Tungurahua province. Surveys were conducted on-site in 2019, targeting household heads, and designed following previous studies (Cordero-Ahiman et al., 2021; Franco-Crespo and Sumpsi, 2017). The survey collected information on social and economic factors, land ownership, access to irrigation water, and perceptions of climate change (CC). These data helped define crop area, farm income, production levels, and agricultural characteristics, with a particular focus on food security and sovereignty for blackberry, maize, potato, and tree tomato production. Additional data for the mathematical model were sourced from the Ministry of Agriculture and Livestock of Ecuador and its regional office in Tungurahua (see Tables 6, 7).
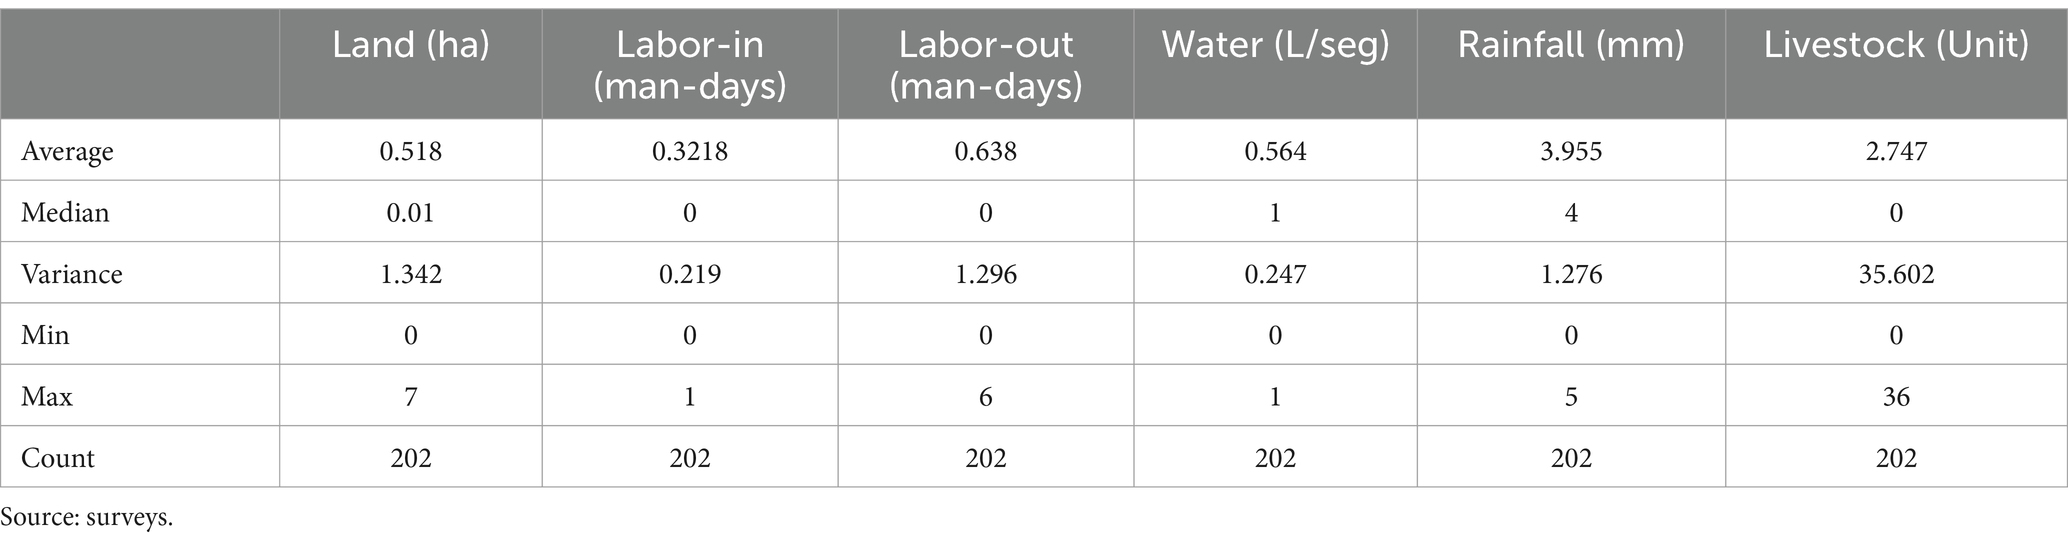
Table 6. Summary of the data analysis of the sample collected by surveys.
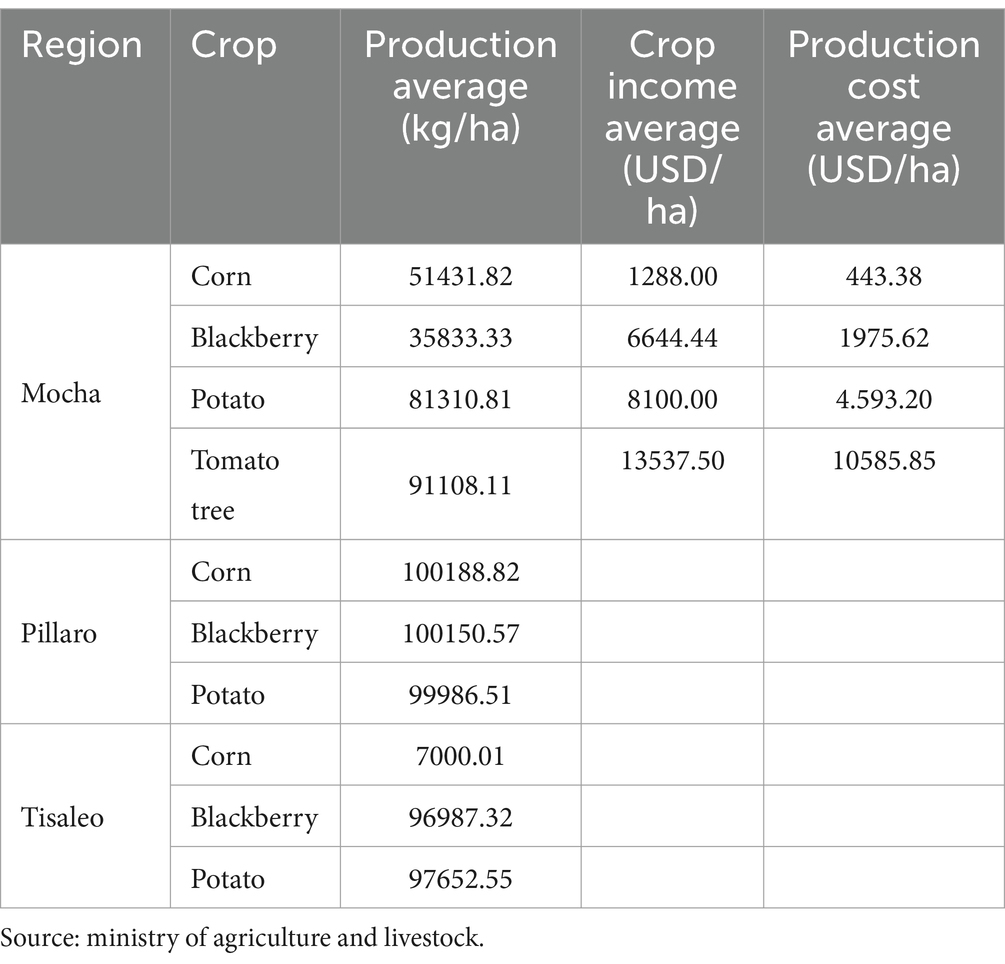
Table 7. Summary of the crop yield per region and profit estimated per hectare in a production cycle.
The survey’s internal consistency was assessed using Cronbach’s alpha, yielding a reliability coefficient of 0.903, which indicates high reliability. This measure reflects the average correlation among survey questions, where values between 0.80 and 0.90 denote strong reliability, and the minimum acceptable threshold is 0.70.
2.2.1 Modeling scenarios
This study employs a mathematical optimization model designed to maximize profit as an objective function, subject to resource constraints related to agricultural production. Among these constraints, a key parameter is water availability, which was incorporated using calculated data (see Table 8). The model estimates the impact of climate change on a selected group of crops, representing the primary sources of family income and food security in the province.
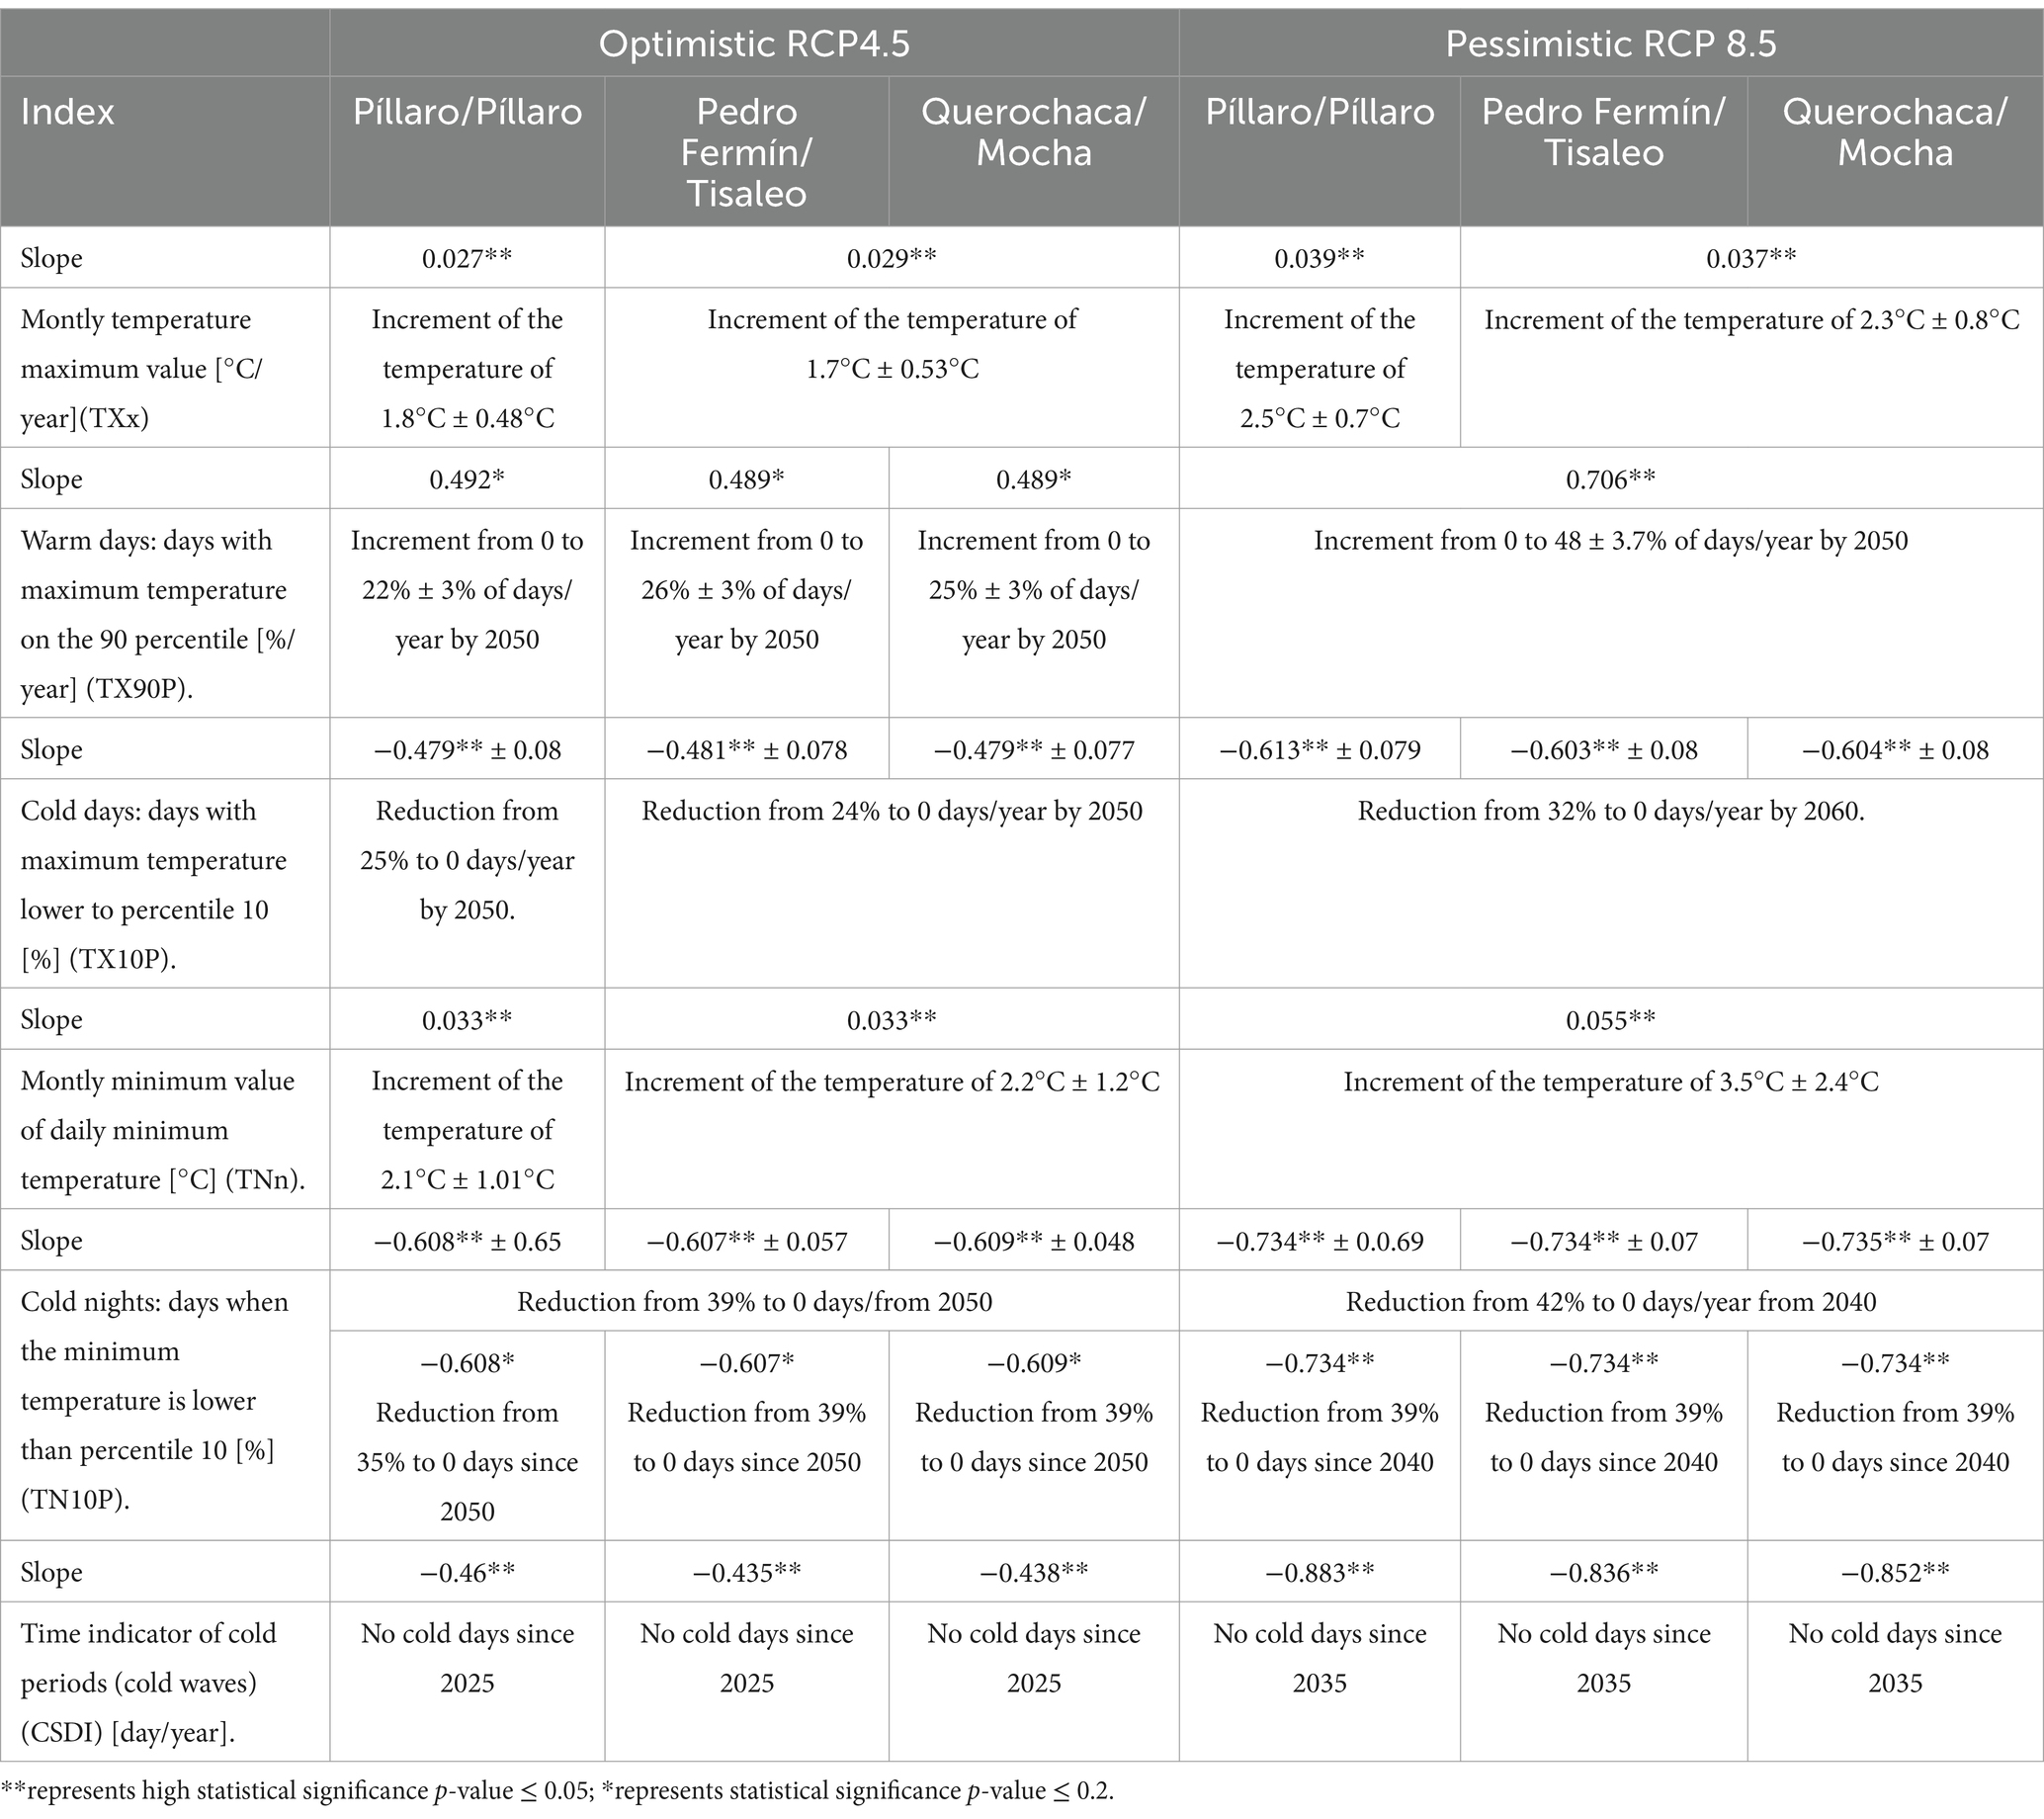
Table 8. Summary of ETCCI recommended climate change indexes for temperature under the RCP4.5 and RCP8.5 scenarios expected by 2050.
The mathematical model and its algorithms optimize cropped area variation based on the imposed constraints. It is implemented as a production function, following the simplex method developed by Dantzig.3 The formulation represents a linear programming problem, where a generalized matrix X is determined to satisfy the objective function.
The objective function in this study is based on the model proposed by Hazell and Norton (1986), which maximizes farm profit while accounting for resource constraints. To evaluate the effects of climate change on agricultural production, the model integrates external parameters, such as water availability, to adjust yield projections under different climate scenarios. The mathematical and calibrated models were implemented using the General Algebraic Modeling System (GAMS) languaje. The general equation is presented in Equation 1.
where P is the profit of each exploitation, i, j = coefficient represents crops and type of exploitation, respectively, and = crop area by the available resources (real numbers greater than or equal to zero).
The mathematical model was calibrated by introducing the factors of positive mathematical programming (PMP) observed, using information on the farmers’ crops to generate self-calibration of agricultural use and production. The model proposed by Howitt (1995) in a general equation is shown in Equations 2, 3.
subject to
where is the area of land allocated to crop i; is the cost per unit of input j; and with elements and are the intersection of the unknown yields and the slope of the marginal yield function, respectively. is a matrix where the requirements of production resources are located, and b are the available resources.
The model adapted in this study is presented in Equation 4. It was defined with the variables and parameters representing the profit considering all income minus the cost of production. Where is the profit calculated from the crop production in each canton multiplicate with the price of each crop minus the cost of production (water, labor, fertilizers used) per crop per canton.
where Z is the objective function and xc is the analyzed activity. c = crop type, and n = canton. Additionally, the mathematical model includes limitations such as land availability, water availability, and labor availability.
2.2.1.1 Land use constraints
Similar models that incorporate land availability as a key constraint have been widely acknowledged in agricultural economics literature. For instance, studies by Howitt (1995) have applied agricultural production models to assess the impact of land availability on crop selection and farm profitability. These models underscore the critical nature of land as a finite resource, necessitating its efficient allocation among various crops to maximize returns while ensuring environmental sustainability. The area of arable land for each crop by canton (Equation 5):
where reqland = land required for crop production and dl = land available for crops.
2.2.1.2 Water availability constraints
Water, as a crucial input for agriculture, has been the focus of numerous studies, particularly in regions where water scarcity poses a significant challenge to food security. Research by Robinson et al. (2015) utilized models that integrate water availability constraints to evaluate the impact of water scarcity on agricultural productivity and the effectiveness of water management policies. By accounting for water availability in our model, we align with a body of work emphasizing the need for efficient water use and the adoption of water-saving technologies in agriculture. The available amount of water farmers has access to (Equation 6):
Where reqwater = water required for cultivation by canton and dawater = availability of rainwater.
2.2.1.3 Labor availability constraints
The inclusion of labor as a constraint reflects the reality of agricultural labor markets and the importance of labor management in crop production with the dynamics of labor availability and its impact on agricultural operations, highlighting how labor constraints can influence crop choices, planting and harvesting times, and ultimately, farm profitability. By considering labor availability, our model acknowledges the human resource aspect of agricultural production, emphasizing the need for strategic labor planning and management. The number of days laborers needed for each crop per canton (Equation 7):
Where reqlab = labor required to produce each crop by canton; and dlab = available labor.
To analyze and validate a Positive Mathematical Programming (PMP) model aimed at optimizing agricultural profits within resource constraints, several key methods are employed. Sensitivity analysis gauges the impact of input variability on outcomes, ensuring the model’s robustness. Historical data comparison validates the model’s accuracy reflecting past agricultural scenarios.
2.2.2 Complementary data
The constraint equations use information from Tables 6, 7. The additional information used to validate the field data is from (INEC, 2019). No labor shortages are seen in any of the cantons—on the contrary, there is a surplus due to the permanent high level of unemployment in the rural sector.
Complementary data were incorporated into the model, including yield and production data for blackberry, maize, potato, and tree tomato crops.
The Table 9 illustrates the seasonal variability in water demand for each crop throughout the year. Tomato, potato, and blackberry exhibit higher water requirements during the middle months, likely corresponding to growth and fruiting stages. In contrast, maize reaches its peak water demand between months 4 and 6, followed by a sharp decline in months 9 and 10, suggesting harvest or dormancy during this period, using Cropwat (Arteaga Ramírez et al., 2011).
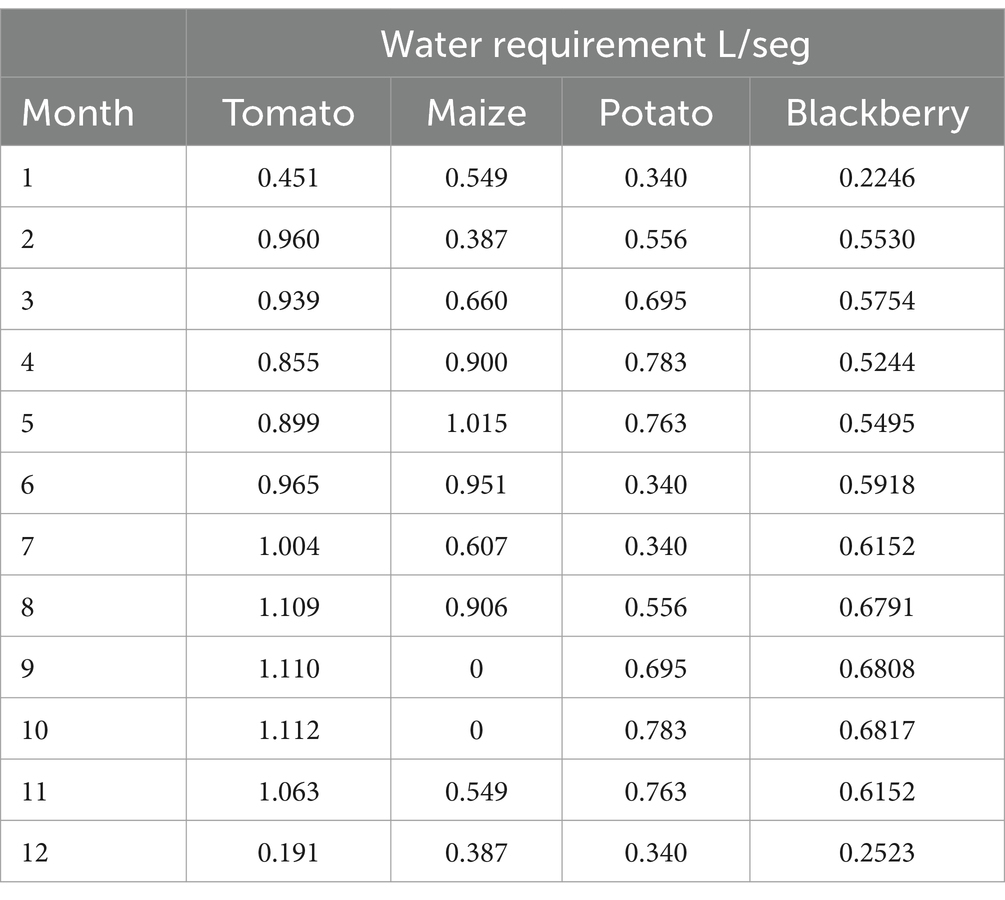
Table 9. The average water requirement per year was collected from Cropwat, where potato has two production cycles.
Each crop follows a distinct water usage pattern, influenced by growth cycles, environmental adaptation, and physiological needs. Potatoes, for example, display fluctuating water demands, aligning with two production cycles, which may indicate different planting and harvesting periods. Meanwhile, tomatoes and blackberries show a steady increase in water consumption as the year progresses into warmer months, likely due to higher evapotranspiration rates and the plants’ developmental phases.
3 Results
3.1 Precipitation and temperature variability
Figure 3A illustrates a bimodal precipitation pattern, with peak rainfall occurring in March, April, and May, followed by a secondary maximum in September and October. The dry season is observed from June to August. Among the analyzed stations, Querochaca records the highest precipitation in June at 67.56 mm, whereas Píllaro exhibits the lowest precipitation, with 17.51 mm.
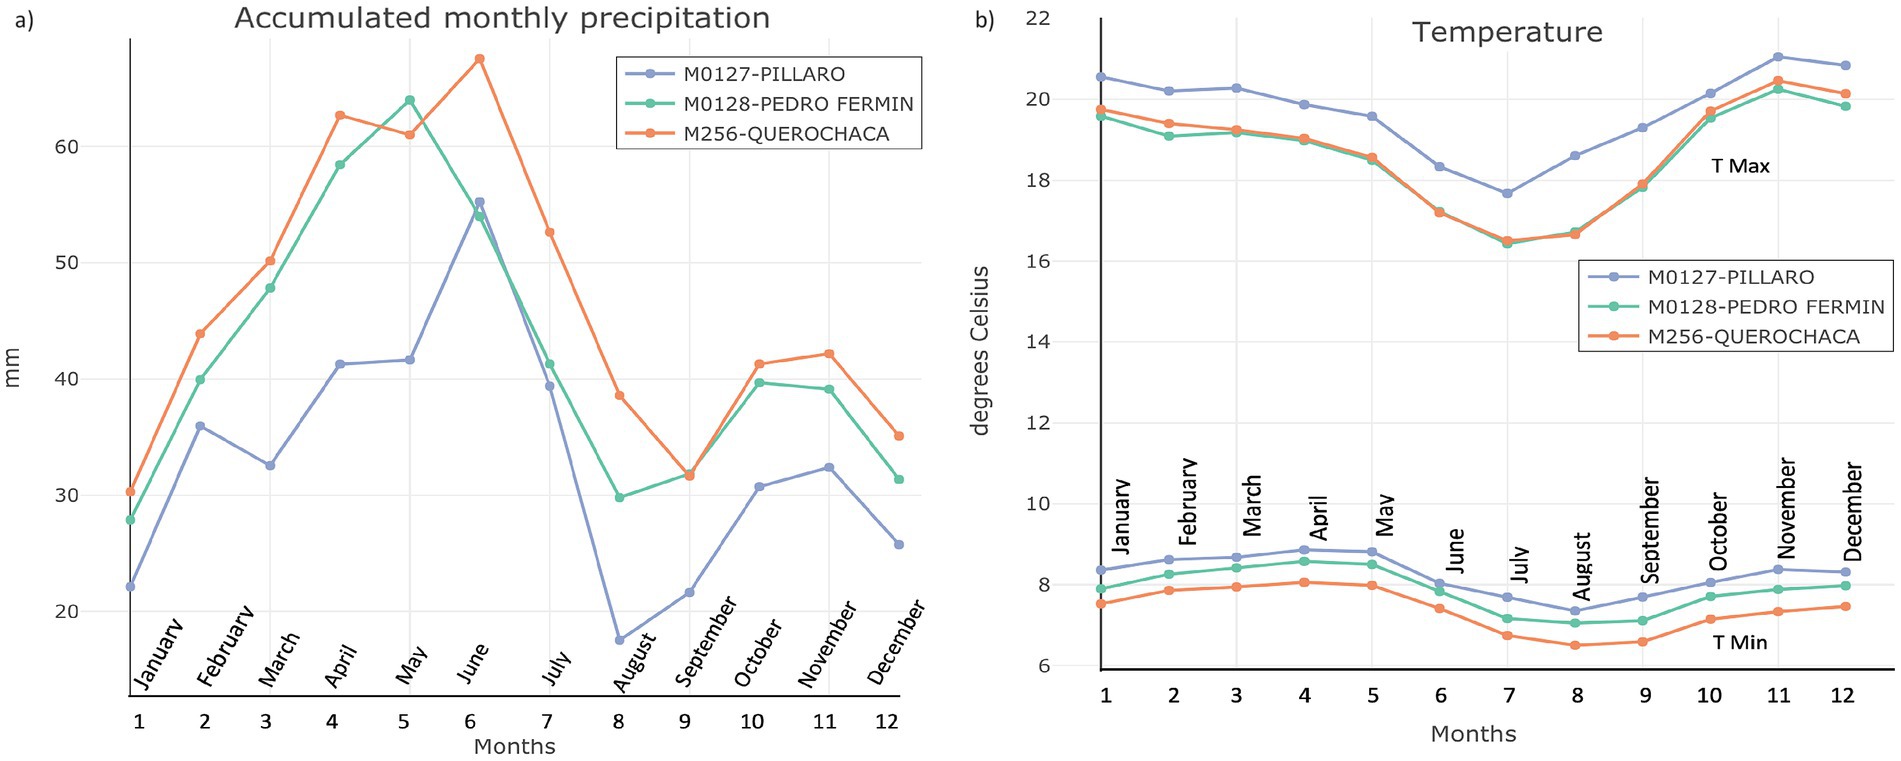
Figure 3. Average series with (a) monthly precipitation data and (b) temperature data for in-situ meteorological stations. Pillaro, Pedro Fermín and Querochaca represent Pillaro, Tisaleo and Mocha cantons, respectively.
Figure 3B presents temperature variations across the study area. The highest recorded maximum temperature is 21°C at the Píllaro station, while the lowest recorded maximum temperature is 16.4°C at the Pedro Fermín and Querochaca stations. Regarding minimum temperatures, the highest recorded value is 8.8°C, while the lowest reaches 6.5°C.
3.2 Observed climate change indexes
Table 10 indicate a sustained warming trend in the study area, as evidenced by the significant increase in both maximum (TXx, TX90p) and minimum (TXn) temperature indicators. Concurrently, extreme cold indicators, including TX10p (cold days) and TN10p (cold nights), exhibit a marked decreasing trend. This aligns with previous research, particularly the findings by Shen et al. (2018), who also reported similar trends of warming and a reduction in frost events associated with climate change and intensified by urban heat island effects due to urban expansion. These observed changes underscore the critical need for continued monitoring and adaptation strategies in the region, given the implications for agricultural productivity and overall regional climate resilience. It is important to highlight the unique behavior observed at the Querochaca station, which is notably more urbanized compared to other stations surrounded predominantly by vegetation. At Querochaca, minimum temperatures increase more significantly than maximum temperatures, likely due to the Urban Heat Island effect (Shen et al., 2014). These urban effects, together with the observed increase in the diurnal temperature range (Tmax-Tmin), may also be influenced by other factors such as increased cloud cover and solar radiation (Zhou et al., 2023).
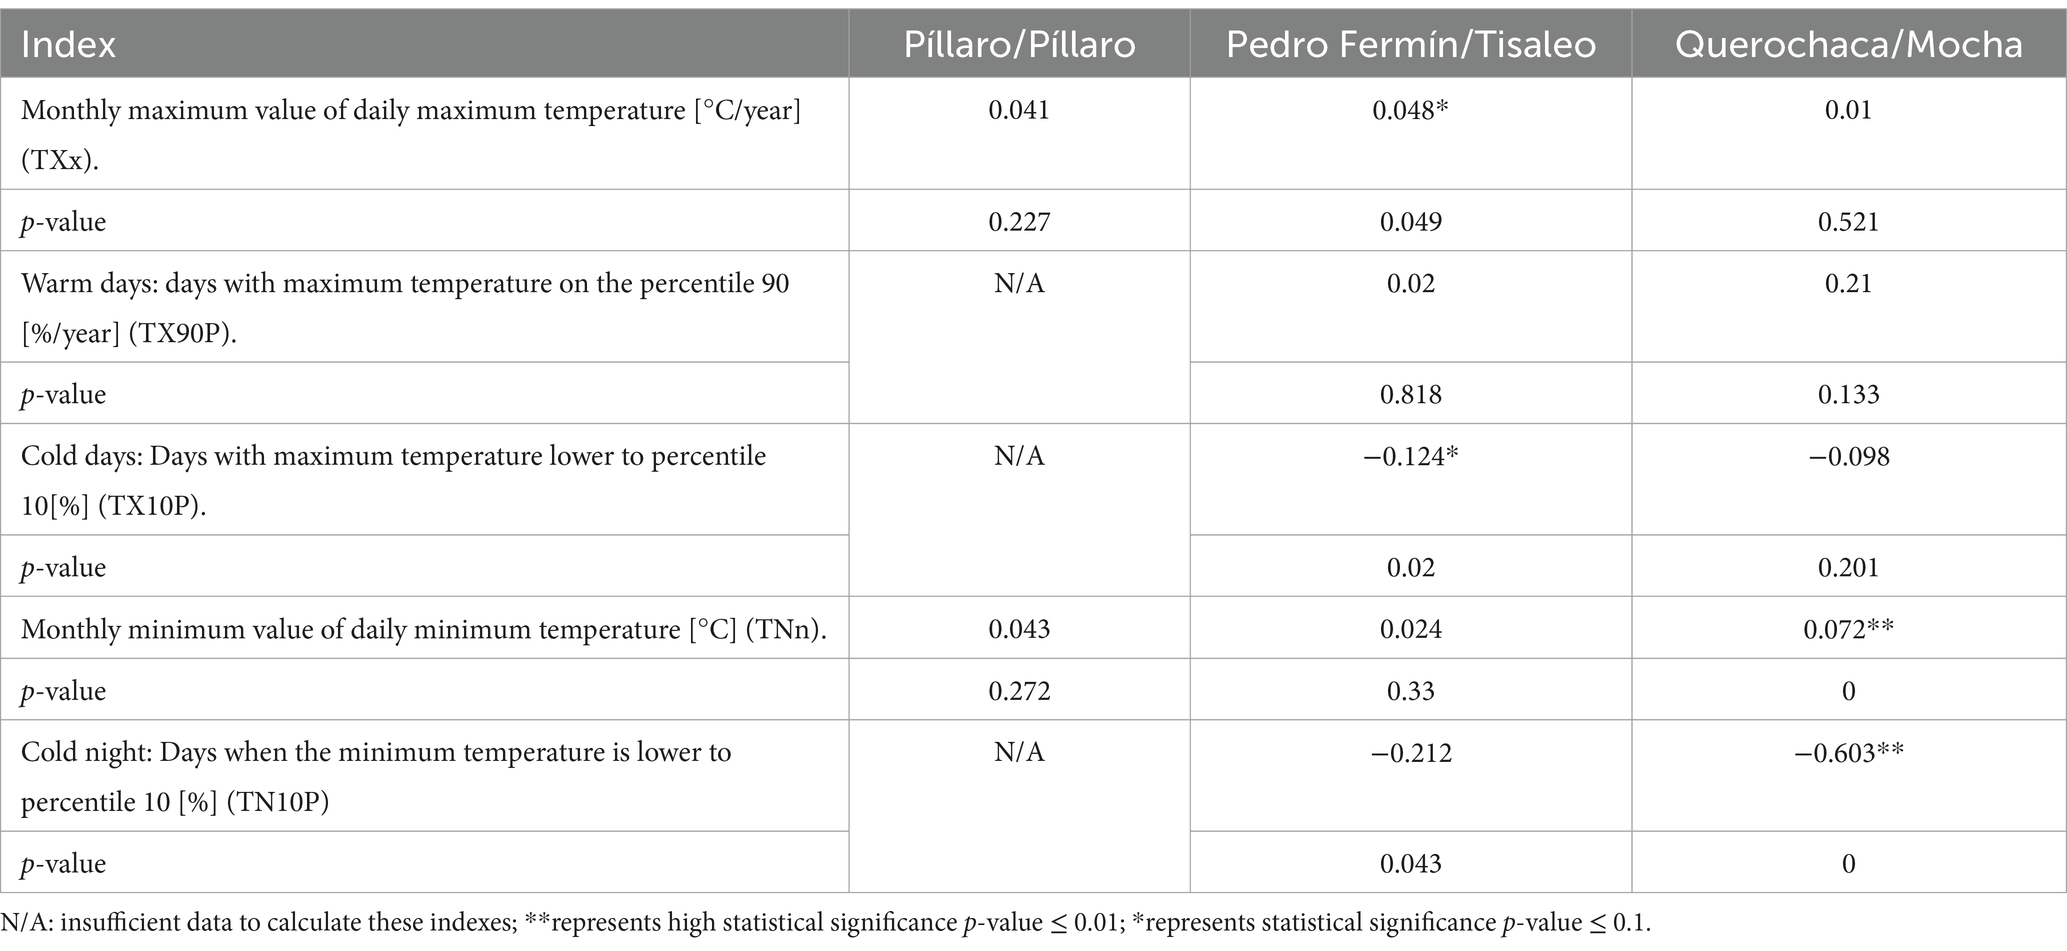
Table 10. Summary of the ETCCI recommended slope trends of the temperature indexes at the three stations according to the in situ data (positive slope: increase; negative slope: decrease).
Table 11 presents the precipitation trends derived from climate change indexes using in situ data. No evidence of an increase in extreme rainfall or drought events was found. In fact, at the Píllaro and Querochaca stations, a decline in extreme rainfall events (SII, R95p, and PRCPTOT) was observed, alongside an increase in light rainfall events. This shift is beneficial for crop production, as it ensures more consistent irrigation.
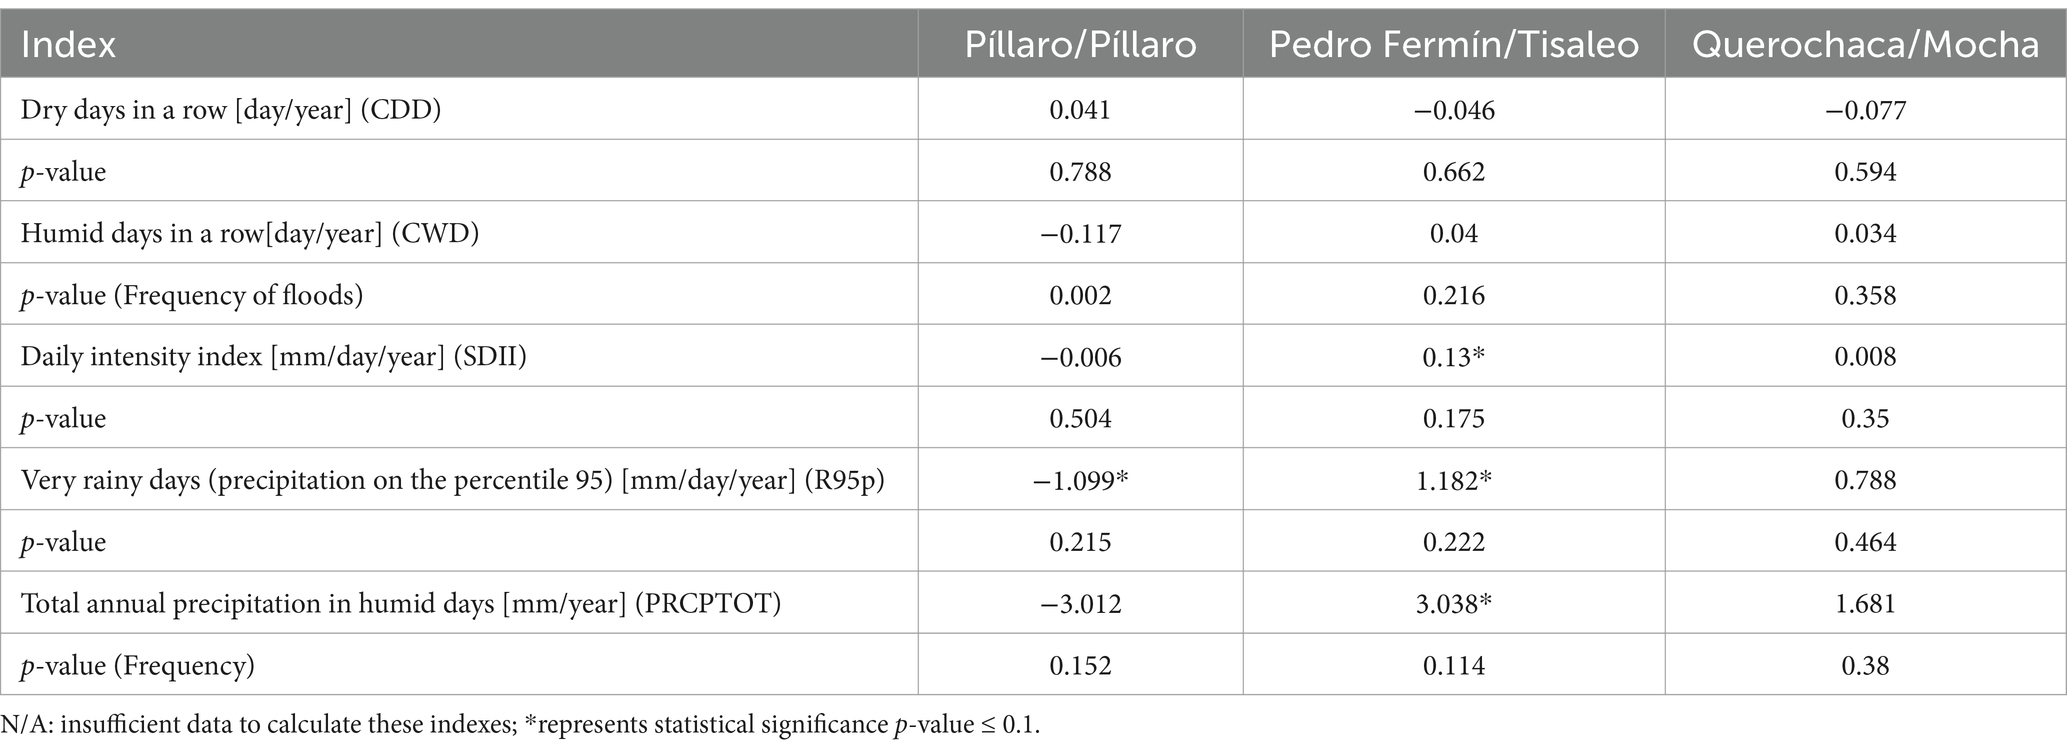
Table 11. Summary of the precipitation slope trend indexes recommended by the ETCCI for the three stations based on in situ data.
3.3 Projected temperature trends under climate scenarios
Table 8 and Figure 4 summarize the minimum (Tmin) and maximum (Tmax) temperature indexes for the RCP4.5 (optimistic) and RCP8.5 (pessimistic) scenarios, both of which show increasing temperature trends. The projected temperature data align closely with in situ observations, reinforcing the reliability of these estimates. The daily maximum temperature (TXX index) is expected to rise by 1.7°C to 1.8°C under the optimistic scenario and by 2.3°C to 2.5°C under the pessimistic scenario.
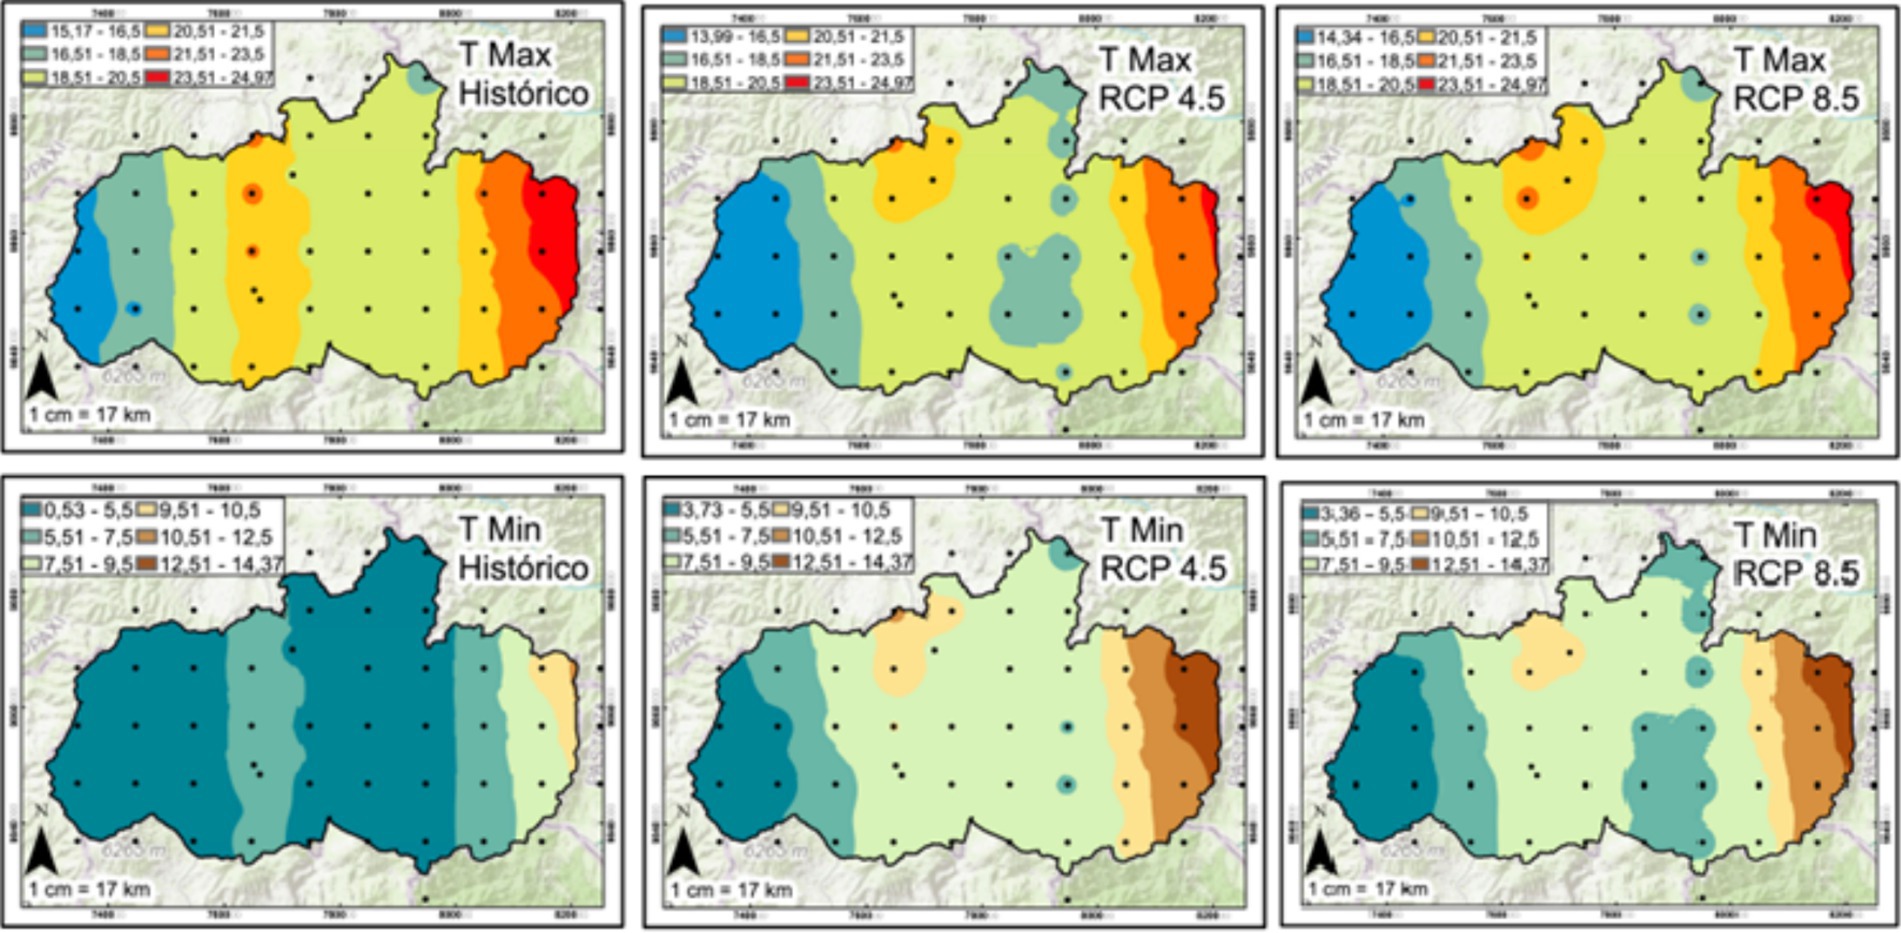
Figure 4. Maximum (top) and minimum (bottom) temperatures with historical and projected data in the optimistic RCP4.5 and pessimistic RCP8.5 scenarios to the year 2050.
Regarding minimum temperatures, the projected increase is 2.1°C to 2.2°C under RCP4.5, while RCP8.5 suggests a more pronounced rise of up to 3.5°C. These results are consistent with the urban heat island effect, where heat is absorbed during the day and released at night, influencing temperature patterns (Padrón et al., 2020; Quiroz Antunez et al., 2022). Consequently, the number of frost days is expected to decline, disappearing by approximately 2050 under the optimistic scenario and by 2040 under the pessimistic scenario.
With respect to rainfall, the models indicate a general increase in rainfall events, as indicated by the PRCPTOT index, which predicts an increase in rainfall at every studied location; in both scenarios, the more severe the rainfall is, the greater the increase. Additionally, an increase in extreme rainfall events is expected, as indicated by the R95p and SDII indexes, which indicate more intense rainfall events in 2050 and more wet days, as indicated by the CWD index, i.e., extreme events are predicted to increase in frequency and intensity. The CDD, which determines potential droughts, has decreased. Therefore, a reduction in droughts is expected in the study area.
Table 12 shows the indexes recommended by the IPCC for precipitation, and among the most alarming are the increase in precipitation in extreme events of up to five times more from 2011 to 2050 with respect to intensity and total annual precipitation. There is a significant increase in the amount and duration of daily and annual precipitation, which is inversely proportional to the decrease in consecutive dry days per year.
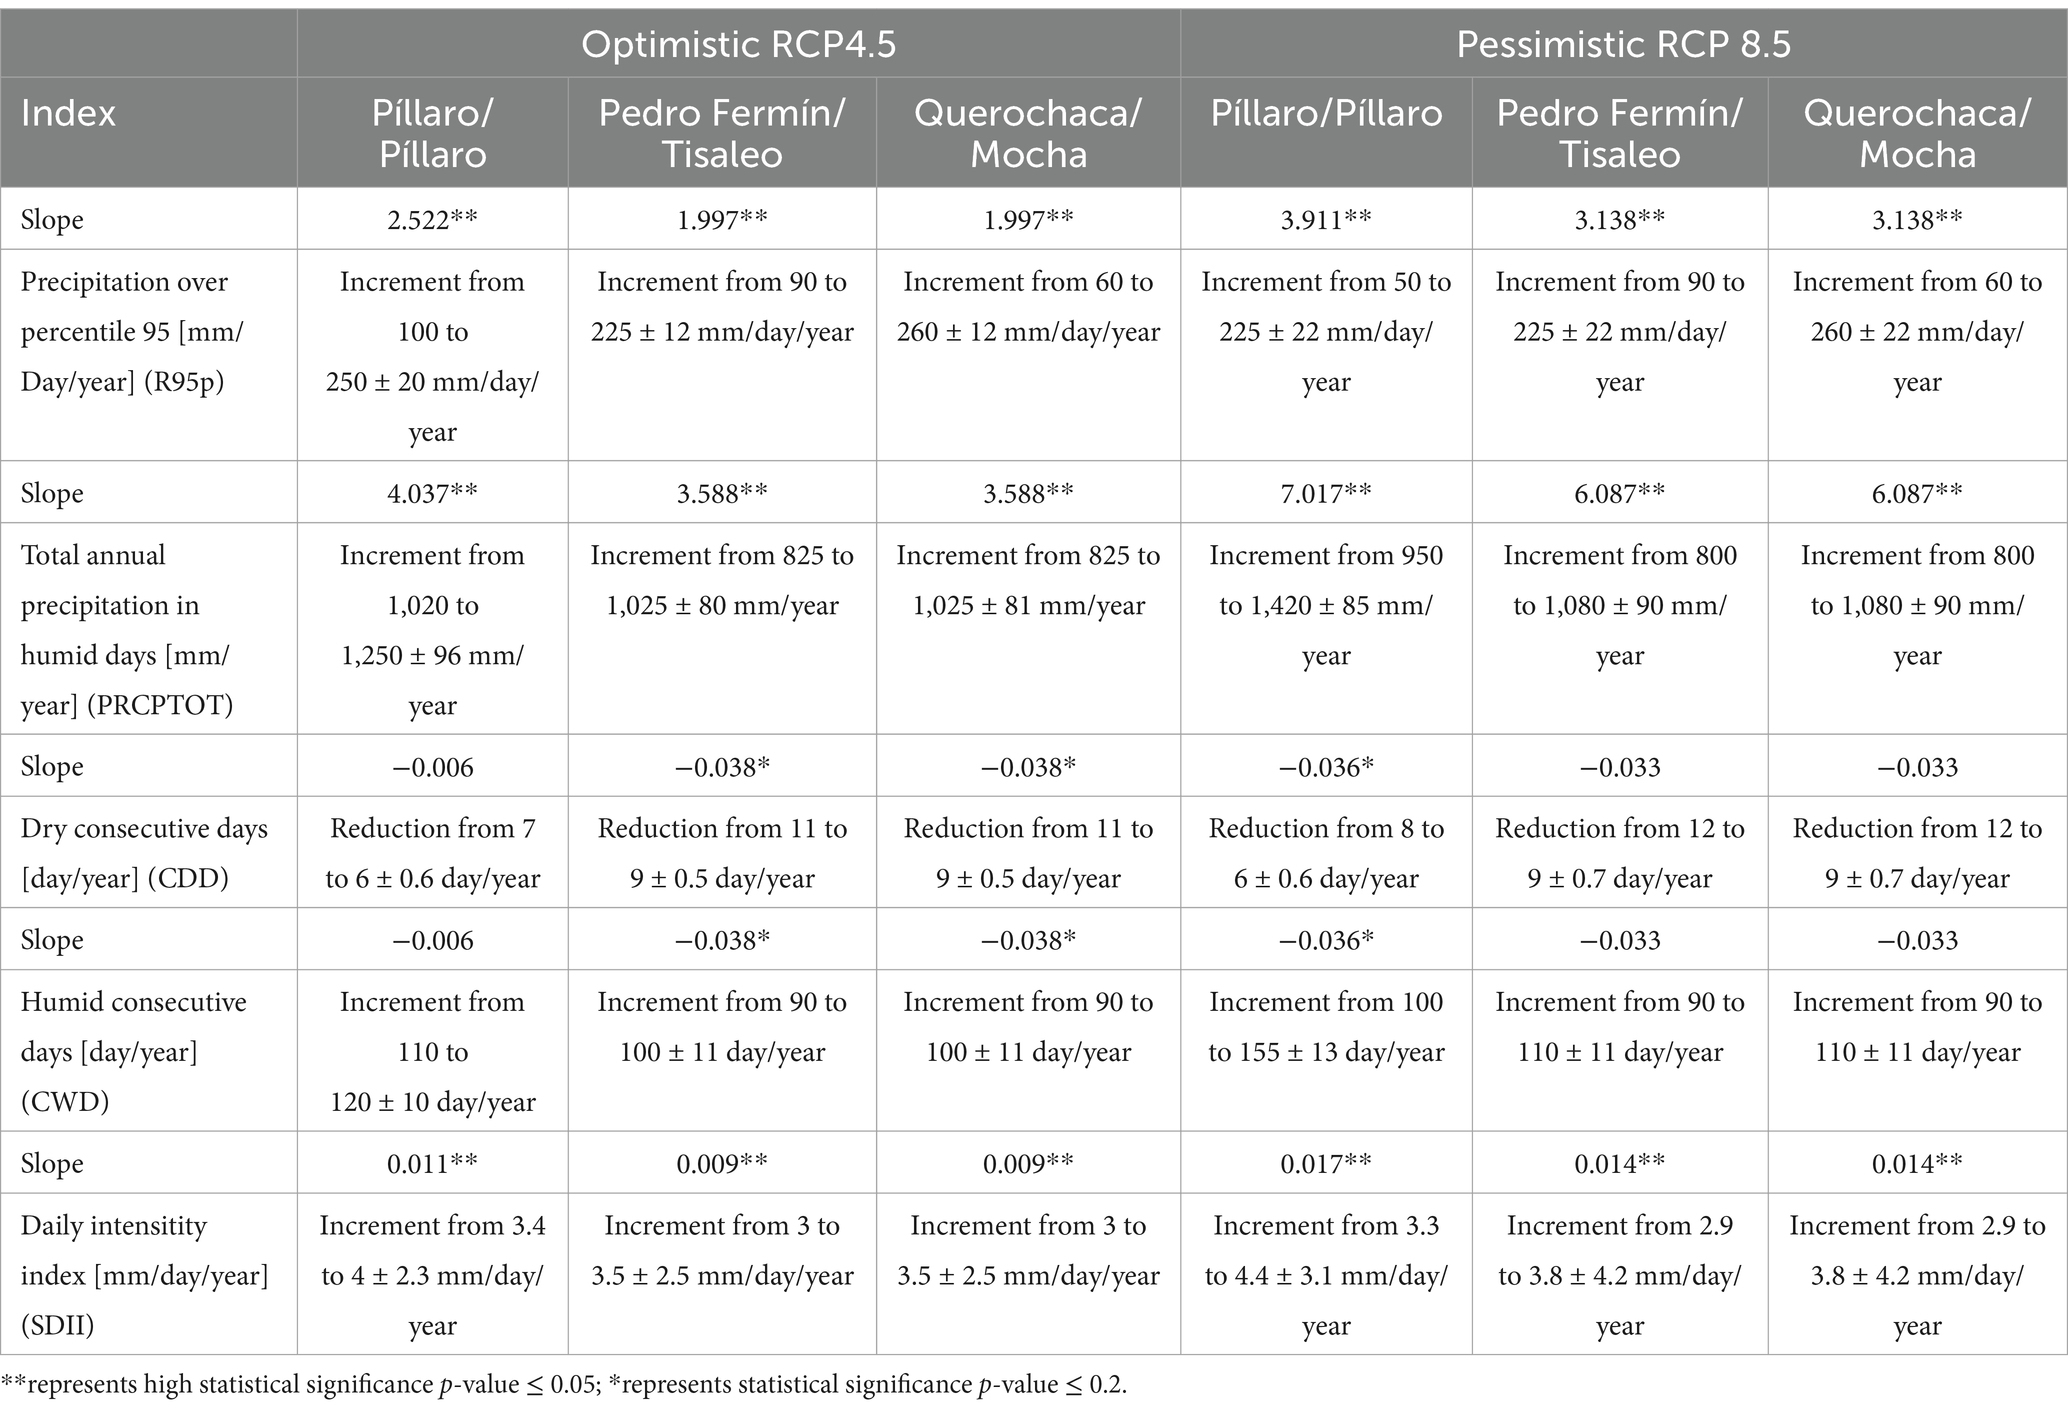
Table 12. Summary of ETCCI recommended climate change indexes for precipitation under the rCP4.5 and RCP8.5 Scenarios.
3.4 Simulation of agricultural production
In this region, agricultural production is mainly based on maize, blackberry, potato, and tree tomato crops. Píllaro seems to be the canton with the largest number of arable hectares and has a greater availability of resources (water). It is therefore the largest producer, having the best production and yield per hectare of crop. On the other hand, survey data show that the average age of farmers is 41 years, although ages vary from 22 years to 88 years, and significant data dispersion is observed, with a standard deviation of 16.91. Most of the farmers in the cantons of Píillaro, Mocha, and Tisaleo do not have much of their own land, so a large number of them (142 of 202 farmers) work in nonfarming activities or on other people’s lands because they have the possibility of obtaining additional income.
The curves in Figure 5 have positive and negative slopes because a proportional reduction in water has a different impact on crop development. However, the observed effect depends on the territory analyzed, according to the availability of resources for each crop. This means that the less water there is, the more production will decrease: crops will not produce the same amount of food if they do not receive an adequate amount of water.
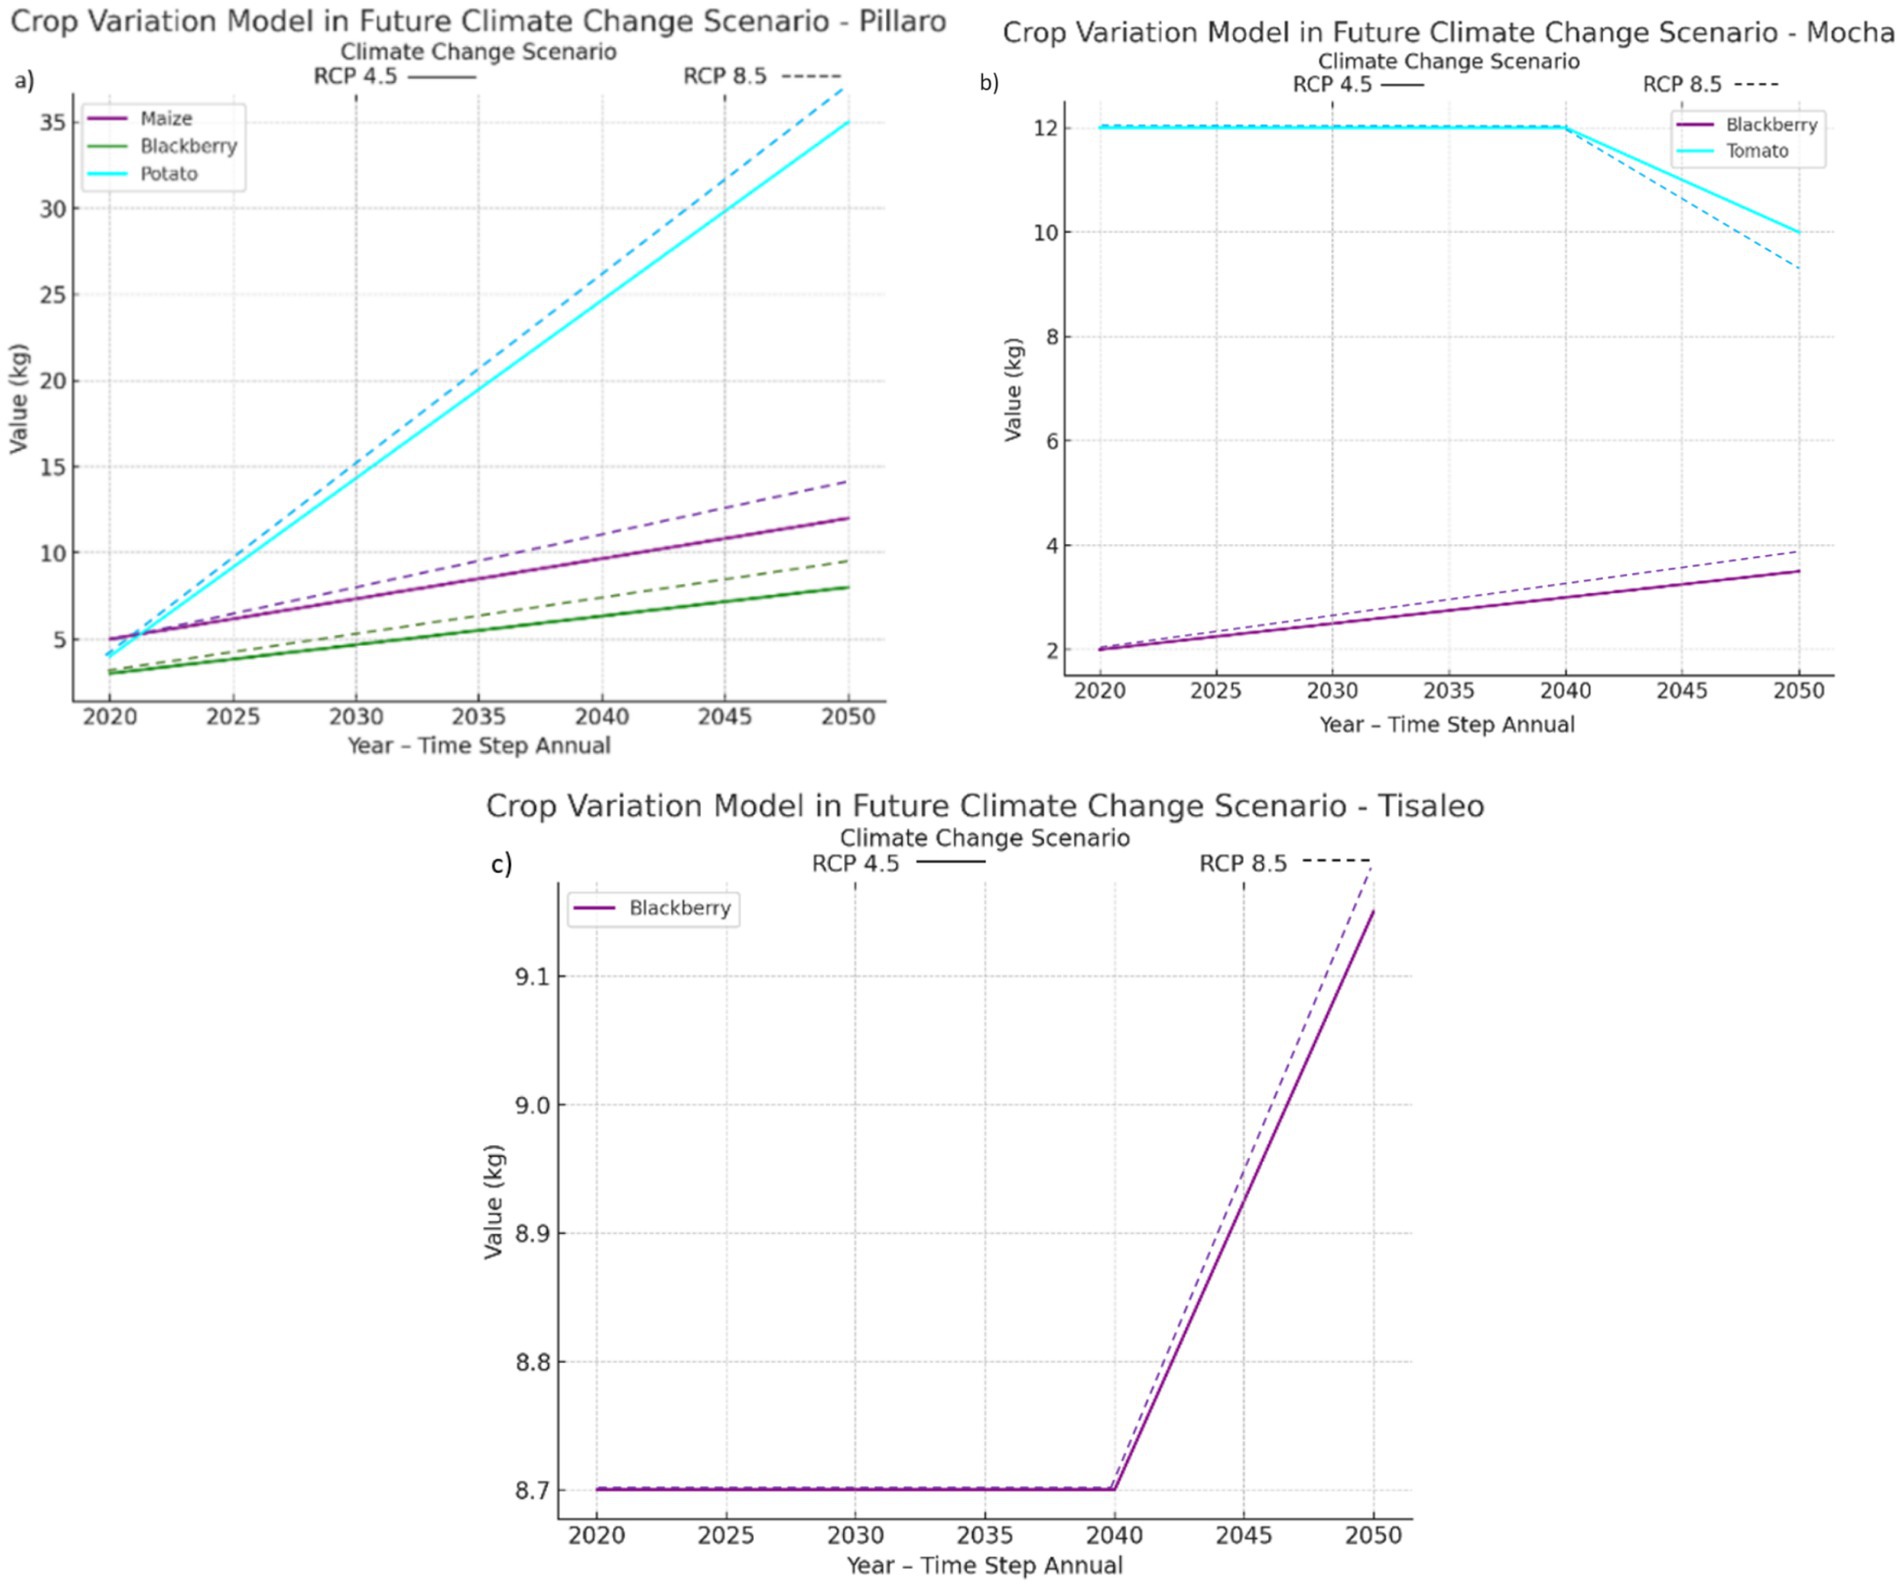
Figure 5. Crop production in the context of climate change in the cantons of (a) Pillaro, (b) Mocha, and (c) Tisaleo using projected RCP4.5 and RCP8.5 scenarios for water availability until 2050.
Figure 5 shows the analysis of crop variation under projected climate change scenarios in Pillaro, Mocha, and Tisaleo reveals significant differentiated responses among crops based on weather forecasting data and expected shifts in water availability. The figures illustrate crop variation trends over time incorporate annual step simulations from 2020 to 2050, integrating rainfall patterns, irrigation availability, and temperature projections. These results provide insights into the resilience and vulnerability of specific crops, marking critical inflection points in production trends that are influenced by climate variability.
The blackberry crop exhibits an upward trend in all three cantons, with its production expected to increase progressively through 2050. This result aligns with the positive relationship between increased precipitation and blackberry yields, as the crop benefits from higher soil moisture and favorable agroclimatic conditions. The forecast suggests that blackberries will remain one of the most resilient crops, with its projected production showing a continuous rise, particularly in Tisaleo and Pillaro, where soil and climate conditions are conducive to its expansion. The observed trend suggests that the combination of higher rainfall, moderate temperatures, and improved soil moisture retention could enhance blackberry yields, reinforcing its adaptive capacity to climate change in the study region.
In contrast, tomato production in Mocha is expected to decline, particularly after 2040, indicating the crop’s high sensitivity to excessive rainfall. This result confirms previous findings that waterlogging and increased humidity negatively impact tomato growth, leading to yield losses due to disease susceptibility and soil saturation issues. The inflection point observed around 2040 marks a critical transition where tomato production begins to decline under projected weather conditions. This suggests that adaptive measures, such as improved drainage systems and controlled irrigation techniques, will be necessary to mitigate yield reductions.
The projected trends for maize and potato in Pillaro indicate stable or increasing production levels, suggesting positive adaptation potential. These crops appear to benefit from changes in precipitation patterns without showing significant losses in yield. Maize maintains a steady trajectory, while potato production increases slightly post-2040, reflecting its ability to adapt to future agroclimatic conditions. This resilience is likely due to these crops’ capacity to tolerate moderate shifts in precipitation and temperature, making them suitable candidates for climate-adaptive farming strategies in Pillaro.
The figures also highlight a major shift in production trends occurring around 2040, coinciding with changes in rainfall patterns and water availability. This inflection point suggests that climate conditions will not impact all crops uniformly and that certain species, such as blackberry and potato, have higher resilience than others, like tomato. The trends reinforce the importance of water management strategies and climate-informed agricultural policies to sustain food production under shifting environmental conditions. From a broader perspective, land use and resource allocation must also be considered in future production strategies. Given that a significant portion of arable land is currently used for livestock, particularly dairy systems with small-scale herds, integrating sustainable livestock-crop systems could enhance climate resilience and optimize land productivity. Future planning should focus on balancing crop production with pasture management, ensuring that both sectors remain sustainable amid evolving climate conditions.
The Figure 6 presents crop production versus rainfall forecast illustrates the relationship between projected precipitation changes and crop yield trends for maize, blackberry, potato, and tomato from 1990 to 2050. The primary y-axis represents the production of each crop (kg), while the secondary y-axis tracks rainfall (mm) over the same period. The results reveal divergent responses among crops in relation to increased precipitation levels. Potato production exhibits the most significant growth, aligning with the steady increase in rainfall, suggesting that higher precipitation supports its yield. Maize and blackberry production also show positive trends, reflecting gradual adaptation to wetter conditions. However, tomato production peaks around 2020 and declines afterward, indicating a potential sensitivity to excess moisture or waterlogging risks under future rainfall projections.
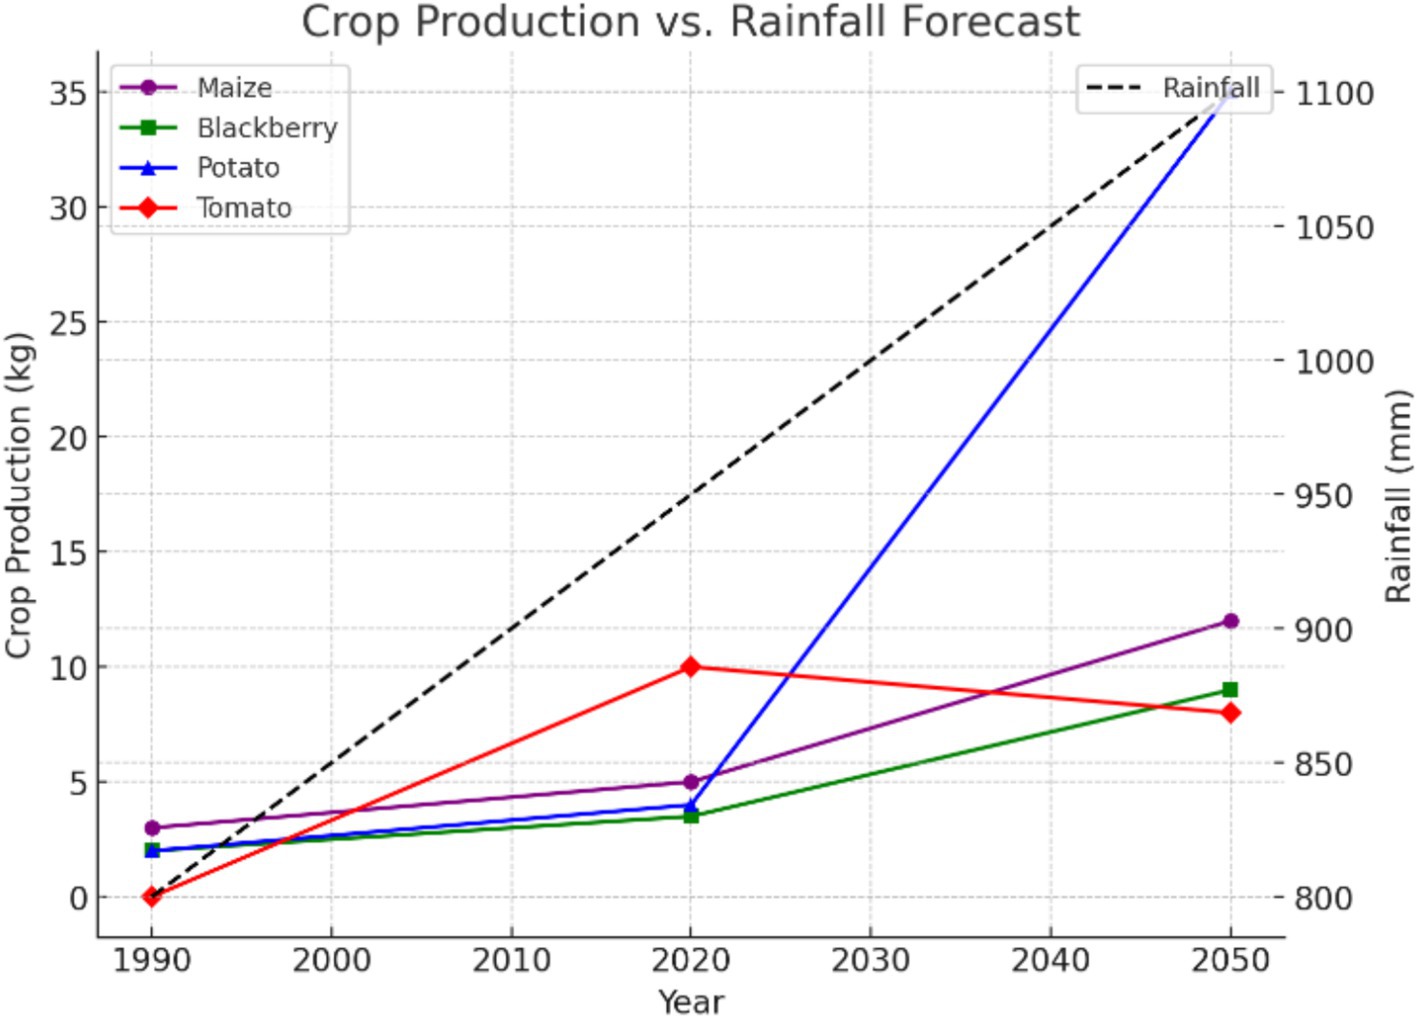
Figure 6. Crop production versus precipitation forecasting relationship.
The rainfall trend (black dashed line) indicates a steady increase, which correlates with the rising production of certain crops but also highlights potential climate-induced vulnerabilities. The positive correlation between increased rainfall and potato and maize production suggests that these crops are more resilient to wetter conditions. Conversely, the declining tomato production beyond 2020 may indicate a threshold beyond which excessive precipitation negatively impacts growth and productivity. These findings emphasize the need for targeted adaptation strategies, such as optimized irrigation management for sensitive crops like tomato, and further exploration of resilient crop varieties that can thrive under changing precipitation regimes. The dual-axis approach in this figure provides a comprehensive visualization of how climate variability is expected to shape agricultural outcomes in the coming decades.
In Figure 7, the forecasted impact of climate change on crop production across Tisaleo, Mocha, and Pillaro reveals differentiated effects influenced by water availability and precipitation changes. The results, now visualized through a heatmap representation, allow for a clear temporal comparison of production trends from 1990 to 2050. The observed patterns highlight both the adaptive capacities and vulnerabilities of different crops, offering insights into long-term agroclimatic resilience within the region’s agricultural systems.
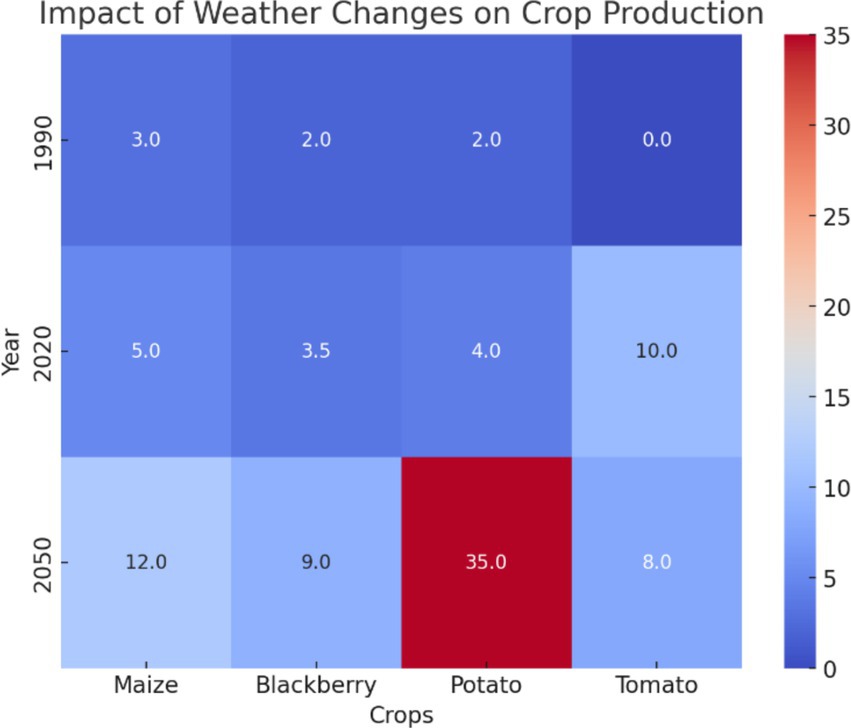
Figure 7. Crop production estimation in kilograms—projection to 2050.
The analysis confirms that blackberry production is expected to increase in all three cantons (Tisaleo, Mocha, and Pillaro). This trend suggests that blackberries benefit from projected rainfall changes, likely due to their high adaptability to shifting climatic conditions. The heatmap illustrates this consistent upward trend, reinforcing the idea that blackberry cultivation could serve as a climate-adaptive strategy for farmers in the study region. In contrast, tomato production in Mocha exhibits a decline after 2040, supporting the claim that tomatoes are highly sensitive to excessive water availability. The cooler shades in the heatmap for tomato production from 2020 to 2050 reflect this decline, reinforcing the need for water management strategies to mitigate production losses in future climate scenarios.
A critical inflection point emerges around 2040, where significant variations in crop performance become evident. The stabilization or increase of maize and potato yields in Pillaro suggests that these crops possess a higher adaptive capacity to rainfall fluctuate. The heatmap clearly indicates that potato production will experience the most substantial increase by 2050, reflecting its strong resilience to climate variability. Conversely, the declining tomato production trend in Mocha underscores the necessity for alternative adaptation measures, such as adjusting planting schedules or implementing controlled irrigation techniques to counteract excessive water stress.
Beyond individual crop trends, the analysis also emphasizes the broader implications of agricultural land use. The visualization highlights that a significant portion of arable land is allocated to livestock rather than crop cultivation, particularly in dairy production systems with small-scale herds (1–4 cows per farm). This underscores the need for integrated adaptation strategies that account for both crop resilience and livestock sustainability. Future agricultural policies should prioritize holistic management approaches that combine climate-resilient crop selection with sustainable livestock production, ensuring long-term food security and production stability in climate-sensitive regions.
4 Discussion
Although the effects of climate change observed in the past have not been particularly extreme, some could even be considered beneficial. For instance, rising temperatures have led to a reduction in frost occurrences, and no significant increase in extreme rainfall events or droughts has been recorded. Climate models, which in this case align well with the climatological characteristics of the system, project a sustained increase in temperature alongside an increase in both total precipitation and extreme rainfall events.
Therefore, adapting to climate change necessitates a comprehensive set of tools to safeguard the livelihoods of farmers in developing countries, particularly as shifts in water availability alter conventional production cycles. The implementation of advanced irrigation and drainage systems presents a viable strategy for mitigating the negative impacts of rainfall variability observed in this study. Moreover, the current capacities of farmers are insufficient to transform existing agricultural systems into resilient frameworks.
In the province of Tungurahua, the response to climate change varied among different crop groups. As previously noted, the geographical characteristics and location of each territory are influenced by the Andean Mountain range, leading to variations in water availability. Studies on climate change in Ecuador indicate an increase in extreme rainfall and drought events occurring during atypical months (Serrano-Vincenti et al., 2022). Additionally, the four crops analyzed in this study are cultivated in rainfed agricultural systems. While greater water availability during atypical seasons may improve access to water and enhance yields, it may also contribute to an increase in pest infestations.
Furthermore, demographic factors such as the aging farming population and the increasing participation of women in agricultural activities may also influence food production. The declining involvement of younger generations in agriculture reduces the availability of labor in rural areas, which in turn threatens overall food production (Deaconu et al., 2021).
Survey data also indicate that most farmers do not own the land they cultivate and instead work as day laborers on land owned by others. However, these tracts of land generally have access to irrigation systems (Nguema et al., 2013). Farmers also report that rainfall has become increasingly scarce but occurs with greater intensity, a pattern they attribute to climate change, which aligns with existing climate models. Thus, they appear to be aware that their environment is changing. However, farmers are not taking measures to address these changes, possibly due to a lack of economic resources or action from authorities, who have not adequately assessed the consequences of failing to implement policies and interventions that could help mitigate these challenges (Hernández-Mora and Del Moral, 2015).
To improve outcomes under these potential scenarios, decisive policy measures must be implemented to support farmers. Price volatility during critical months should be minimized to ensure economic stability, rural families should have access to a basic level of security, and unemployment in agricultural areas must be reduced. Additionally, individuals engaged in farming should receive support to enhance their quality of life, reducing the necessity of seeking employment in other sectors. A shift away from agriculture could lead to food shortages and exacerbate food security issues.
4.1 Limitations and uncertainties
This study acknowledges several limitations and sources of uncertainty that should be considered when interpreting the results. First, the spatial distribution and density of in-situ meteorological stations in Ecuador is limited, particularly in complex Andean terrains, which may affect the representativeness of the observational data. Although a rigorous quality control process was applied, gaps in historical records and potential inconsistencies from sensor changes or maintenance issues introduce uncertainty. Additionally, while modeled climate data were validated and showed good agreement with observations, especially for temperature, the simulation of precipitation remains challenging due to the complexity of tropical rainfall processes. Therefore, the validation emphasized seasonal dynamics rather than daily magnitudes. Moreover, the statistical significance and the standard error of the trends in climate change indices were reported to express uncertainty in the projected changes. Despite these limitations, continued climatic studies are essential, not only due to the scarcity of available data but also because of the high vulnerability of this region, which relies predominantly on agricultural activities.
5 Conclusion
The variation in naturally available water resulting from climate change could generate serious chaos for agricultural production and consequently for the food security of territories. This study used a new perspective to incorporate climatic forecasting data for crop production in small territories. The scenarios of climatic variation modeled indicate that the agro-food system will be affected if the variation in rainfall increases until 2050. The consequences for food security could change diversified food in terms of less variety of crops and an increase in the cost of products due to scarcity. The modeled scenarios show that maize, potato, blackberry, and tree tomato crops will present different behaviors according to the specific water necessity, amount of water from rainy days increase and adaptation of each crop in the territory. According to the forecasts for the agricultural yields of the crops studied, potato production is likely to increase in the face of changes in water availability, particularly in dryland agricultural systems.
However, several aspects could be further elaborated or improved to enhance the discussion and applicability of the model’s findings. One key area of improvement is the integration of climate scenarios. While the model accounts for rainfall constraints, the inclusion of RCP 4.5 and RCP 8.5 projections in the crop yield estimation process could improve its predictive capability. This could be achieved by introducing probabilistic climate models to assess the range of possible precipitation and temperature variations that might affect agricultural productivity. Additionally, the inclusion of socioeconomic factors such as market fluctuations, policy incentives, and farmer behavioral responses could provide a more dynamic assessment of agricultural decision-making beyond biophysical constraints. Finally, validation of the model using observed historical yield data would enhance its reliability, ensuring that forecasted production trends align with past climate and agricultural outcomes. These improvements would increase the robustness of the model’s results, making them more applicable to policy recommendations and adaptive strategies for climate-resilient agriculture.
Data availability statement
The original contributions presented in the study are included in the article/supplementary material, further inquiries can be directed to the corresponding author/s.
Author contributions
SS-V: Conceptualization, Formal analysis, Investigation, Methodology, Project administration, Resources, Supervision, Validation, Visualization, Writing – original draft, Writing – review & editing. JG-P: Data curation, Formal analysis, Methodology, Software, Visualization, Writing – original draft. JC: Data curation, Investigation, Software, Visualization, Writing – review & editing. RT: Data curation, Formal analysis, Investigation, Software, Writing – review & editing. CF-C: Conceptualization, Data curation, Formal analysis, Investigation, Methodology, Project administration, Resources, Software, Supervision, Writing – original draft, Writing – review & editing.
Funding
The author(s) declare that no financial support was received for the research and/or publication of this article.
Conflict of interest
The authors declare that the research was conducted in the absence of any commercial or financial relationships that could be construed as a potential conflict of interest.
Generative AI statement
The authors declare that Generative AI was used in the creation of this manuscript. AI technology was used solely for the purpose of translating the manuscript into English, as none of the authors are native English speakers. Specifically, we used OpenAI’s ChatGPT, version GPT-4, accessed via https://chat.openai.com. The AI was not used for generating original scientific content, analysis, or interpretations; and it was not included in Material and Methods section.
Publisher’s note
All claims expressed in this article are solely those of the authors and do not necessarily represent those of their affiliated organizations, or those of the publisher, the editors and the reviewers. Any product that may be evaluated in this article, or claim that may be made by its manufacturer, is not guaranteed or endorsed by the publisher.
Footnotes
3. ^Dantzig, G. B. (1947). Maximization of a linear function of variables subject to linear inequalities [unpublished manuscript], RAND Corporation.
References
Abbass, K., Zeeshan, M., Huaming, Q., Muntasir, S., and Mahmood, H. (2022). A review of the global climate change impacts, adaptation, and sustainable mitigation measures. Environ. Sci. Poll. Res. 29:0123456789. doi: 10.1007/s11356-022-19718-6
Altieri, MA, and Koohafkan, P. (2008) Fincas sostenibles: cambio climático, pequeños productores y comunidades agrícolas tradicionales. Serie de Medio Ambiente y Desarrollo 6. Penang, Red del Tercer Mundo. Available online at: https://www.researchgate.net/publication/252167278_Enduring_Farms_Climate_Change_Smallholders_and_Traditional_Farming_Communities
Altieri, M. A., Nicholls, C. I., Henao, A., and Lana, M. A. (2015). Agroecology and the design of climate change-resilient farming systems. Agron. Sustain. Dev. 35, 869–890. doi: 10.1007/s13593-015-0285-2
Amamou, H., Sassi, M. B., Aouadi, H., Khemiri, H., Mahouachi, M., Beckers, Y., et al. (2018). Climate change-related risks and adaptation strategies as perceived in dairy cattle farming systems in Tunisia. Climate. Risk Manage. 20, 38–49. doi: 10.1016/j.crm.2018.03.004
Andrade, C. M., and Ayaviri, V. D. (2017). Environmental issues and food security in guano, Ecuador. Informacion Tecnologica 28, 233–242. doi: 10.4067/s0718-07642017000500022
Arteaga Ramírez, R., Ángeles Montiel, V., and Vázquez Peña, M.A. (2011). Programa CROPWAT para planeación y manejo del recurso hídrico. Revista mexicana de ciencias agrícolas, 2, 179–195. Recuperado en 27 de febrero de 2025, de. Available online at: http://www.scielo.org.mx/scielo.php?script=sci_arttext&pid=S2007-09342011000200001&lng=es&tlng=es
Bocchiola, D., Brunetti, L., Soncini, A., Polinelli, F., and Gianinetto, M. (2019). Impact of climate change on agricultural productivity and food security in the Himalayas: a case study in Nepal. Agricultural Systems 171, 113–125. doi: 10.1016/j.agsy.2019.01.008
Bustamante, C. D. (2017). Escenario de cambio climático a nivel de subcuencas hidrográficas para el año 2050 de la provincia de Chimborazo-Ecuador. Revista de Ciencias de la Vida 26, 15–27. doi: 10.17163/lgr.n26.2017.02
Chakraborty, S., and Newton, A. C. (2011). Climate change, plant diseases and food security: an overview. Plant Pathol. 60, 2–14. doi: 10.1111/j.1365-3059.2010.02411.x
Chimborazo, O., and Vuille, M. (2021). Present-day climate and projected future temperature and precipitation changes in Ecuador. Theor. Appl. Climatol. 143, 1581–1597. doi: 10.1007/s00704-020-03483-y
Chuqui, J. (2022). Proyecciones de los índices de cambio climático en la Provincia de Tungurahua, al año 2070. (bachelor´s thesis). Universidad Politécnica Salesiana. Available online at: http://dspace.ups.edu.ec/handle/123456789/22898
Cordero-Ahiman, O. V., Vanegas, J. L., Franco-Crespo, C., Beltrán-Romero, P., and Quinde-Lituma, M. E. (2021). Factors that determine the dietary diversity score in rural households: the case of the paute river basin of Azuay province, Ecuador. Int. J. Environ. Res. Public Health 18, 1–16. doi: 10.3390/ijerph18042059
Deaconu, A., Berti, P. R., Cole, D. C., Mercille, G., and Batal, M. (2021). Market foods, own production, and the social economy: how food acquisition sources influence nutrient intake among ecuadorian farmers and the role of agroecology in supporting healthy diets. Sustainability (Switzerland) 13. doi: 10.3390/su13084410
Erazo, B., Bourrel, L., Frappart, F., Chimborazo, O., Labat, D., Dominguez-Granda, L., et al. (2018). Validation of satellite estimates (tropical rainfall measuring Mission, TRMM) for rainfall variability over the Pacific slope and coast of Ecuador. Water 10:213. doi: 10.3390/w10020213
Food and Agriculture Organization of the United Nations. (2008). The state of food and agriculture 2008. FAO. Available online at: https://www.fao.org/3/i0100e/i0100e.pdf
Franco-Crespo, C. D., and Sumpsi, J. M. (2017). The impact of pricing policies on IrrigationWater for agro-food farms in Ecuador. Sustain. For. 9, 1–19. doi: 10.3390/su9091515
Gebresamuel, G., Abrha, H., Hagos, H., Elias, E., and Haile, M. (2021). Empirical modeling of the impact of climate change on altitudinal shift of major cereal crops in South Tigray, northern Ethiopia. J. Crop Improv. 36, 169–192. doi: 10.1080/15427528.2021.1931608
Guamán, J. (2020). Índices de cambio climático y su afectación a la agricultura, caso de estudio cantón Ambato [Universidad Politécnica Salesiana]. Available online at: https://dspace.ups.edu.ec/handle/123456789/19187
Hazell, P., and Norton, R. (1986). Mathematical programming for economic analysis in agriculture. Berkeley: University of California.
Hernández-Mora, N., and Del Moral, L. (2015). Developing markets for water reallocation: revisiting the experience of Spanish water mercantilización. Geoforum 62, 143–155. doi: 10.1016/j.geoforum.2015.04.011
Hidalgo, D., Domínguez, C., Villacís, M., Ruíz, J. C., Maisincho, L., Cáceres, B., et al. (2024). Retroceso del glaciar del Carihuairazo y sus implicaciones en la comunidad de Cunucyacu. La Granja: Revista de Ciencias de la Vida 39, 92–115. doi: 10.17163/lgr.n39.2024.06
Howitt, R. E. (1995). Positive mathematical programming. Am. J. Agric. Econ. 77, 329–342. doi: 10.2307/1243543
Hussain, A., Qamar, F. M., Adhikari, L., Hunzai, A. I., and Rehman, A. (2021). Climate change, mountain food systems, and emerging opportunities: a study from the Hindu Kush Karakoram Pamir.
Intergovernmental Panel on Climate Change (IPCC). (2023). Sixth Assessment Report (AR6) – Synthesis Report. Available online at: https://www.ipcc.ch/report/sixth-assessment-report-cycle/
IPCC. (2023). “Summary for policymakers” in Climate change 2023: Synthesis report. 888 Contribution of working groups I, II and III to the sixth assessment report of the intergovernmental panel on climate change. eds. H. Lee and J. Romero (Core Writing Team). Geneva, Switzerland: IPCC, 1–34. doi: 10.59327/IPCC/AR6-9789291691647.001
Jaramillo, L., Mancheno Herrera, A., Guzmán, A., and y Mollocana Lara, J. G. (2025). Análisis y predicción del cambio de uso y cobertura de suelo en el Corredor de Conectividad Llanganates-Sangay para 2030. La Granja: Revista de Ciencias de la Vida 41, 11–32. doi: 10.17163/lgr.n41.2025.01
Lanzante, J. R. (1996). Resistant, robust and non-parametric techniques for the analysis of climate data: theory and examples, including applications to historical radiosonde station data. Int. J. Climatol. 16, 1197–1226. doi: 10.1002/(SICI)1097-0088(199611)16:11<1197::AID-JOC89>3.0.CO;2-L
Li, X., Cao, Z., and Shi, X. (2021). How do farmer’s disaster experiences influence their climate change perception and adaptation? Clim. Dev. 14, 523–536. doi: 10.1080/17565529.2021.1949572
MAATE. (2022). Cuarta Comunicación Nacional y Segundo Informe Bienal de Actualización del Ecuador a la Convención Marco de las Naciones Unidas sobre el Cambio Climático. Ministerio del Ambiente, Agua y Transición Ecológica (MAATE). Quito, Ecuador.
MAE (2017). Tercera Comunicación Nacional del Ecuador. Ministerio del Ambiente, del Ecuador (MAE). Ecuador: Quito.
Markley, K. (2015). Present and near future water availability for closing yield gaps in four crops in South America, vol. 333. Lund University.
Mimura, N., Pulwarty, R. S., Duc, D. M., Elshinnawy, I., Redsteer, M. H., Huang, H. Q., et al. (2015). Adaptation planning and implementation. Clim. Change 2014 Impact. Adapt. Vulnerabil. 1, 869–898. doi: 10.1017/CBO9781107415379.020
Ministerio del Ambiente, Agua y Transición Ecológica. (2017). Estrategia Nacional de Cambio Climático del Ecuador 2012–2025. Available online at: https://www.ambiente.gob.ec/wp-content/uploads/downloads/2017/10/ESTRATEGIA-NACIONAL-DE-CAMBIO-CLIMATICO-DEL-ECUADOR.pdf
Molotoks, A., Smith, P., and Dawson, T. (2021). Impacts of land use, population and climate change on global food security. Food Energy Secur. 10, e261. doi: 10.1002/fes3.261
Monteros Guerrero, A. (2016). Rendimientos de papa en el Ecuador Segundo ciclo 2015. Dermatol. Sin. 2015, 1–11. Available online at: https://repositorio.iniap.gob.ec/bitstream/41000/5751/1/Informe%20Anual%20PNRT%20PAPA%202020.pdf
Nguema, A., Norton, G. W., Alwang, J., Taylor, D. B., Barrera, V., and Bertelsen, M. (2013). Farm-level economic impacts of conservation agriculture in Ecuador. Exp. Agric. 49, 134–147. doi: 10.1017/S0014479712001044
Ortíz-T, P., and Gerique, A. (2024). Colapso climático en la región andina. Dimensiones ecosistémicas, socioeconómicas y sociopolíticas.
Pacheco, K. (2022). Estudio de Cambio Climático y sus proyecciones al 2070 en el cantón Ventanas, provincia de Los Ríos. Tesis, 1–100. Available online at: http://dspace.ups.edu.ec/bitstream/123456789/5081/1/UPS-CYT00109.pdf
Padrón, R. S., Feyen, J., Córdova, M., Crespo, P., and Célleri, R. (2020). Comparación Entre Pluviómetros Cuantifica R Ain Gauge Inter—Comparison Quantifies Differences in. La Granja 31, 7–20. doi: 10.17163/lgr.n31.2020.01
Quiroz Antunez, U., Monterroso Rivas, A., Calderón Vega, M., and Ramírez García, A. (2022). Aptitud de los cultivos de café (Coffea arabica L.) y cacao (Theobroma cacao L.) considerando escenarios de cambio climático 36, 60–74. doi: 10.17163/lgr.n36.2022.05
Rivadeneira, J., Zambrano, Y., and Pérez-Martín, M. (2019). Adapting water resources systems to climate change in tropical areas: Ecuadorian coast. Sci. Total Environ. 703:135554. doi: 10.1016/j.scitotenv.2019.135554
Robinson, S., Islam, S., Sulser, T., Robertson, R., Zhu, T., Gueneau, A., et al. (2015). The international model for policy analysis of agricultural commodities and trade (IMPACT) (01483; 3, Issue November). International Food Policy Research Institute (IFPRI). Available online at: https://www.ctc-n.org/sites/default/files/130036.pdf
Rosenzweig, C., Elliott, J., Deryng, D., Ruane, A. C., Müller, C., and Arneth, A. (2014). Assessing agricultural risks of climate change in the 21st century in a global gridded crop model intercomparison. Proc. Nat. Acad. Sci. 111, 3268–3273. doi: 10.1073/pnas.1222463110
Santillán Icaza, K. E., and Zamora Romero, B. E. (2021). Análisis climático y de cambio climático en el Distrito Metropolitano de Quito. (bachelor’s thesis). Universidad Politécnica Salesiana. Available online at: http://dspace.ups.edu.ec/handle/123456789/19899
Saxena, A., Raghuwanshi, R., Gupta, V. K., and Singh, H. B. (2016). Chilli anthracnose: the epidemiology and management. Front Microbiol. 7:1527. doi: 10.3389/fmicb.2016.01527
Schoolmeester, T., Johansen, K. S., Alfthan, B., Baker, E., Hesping, M., and Verbist, K. (2018). Atlas de Glaciares y Aguas Andinos: El impacto del retroceso de los glaciares sobre los recursos hídricos. UNESCO. Available online at: https://unesdoc.unesco.org/ark:/48223/pf0000266209
Serrano Vincenti, S., Ruiz, J. C., and Bersosa, F. (2016). Heavy rainfall and temperature Proyections in a climate change scenario over Quito, Ecuador. La Granja 25:16. doi: 10.17163/lgr.n25.2017.02
Serrano, S., Zuleta, D., Moscoso, V., Jácome, P., Palacios, E., and Villacís, M. (2012). Statistical analysis of daily and monthly meteorological data of the Metropolitan District of Quito for weather variability and climate change studies. La Granja 16, 23–47. doi: 10.17163/lgr.n16.2012.03
Serrano-Vincenti, S., Condom, T., Campozano, L., Escobar, L. A., Walpersdorf, A., Carchipulla-Morales, D., et al. (2022). Harmonic analysis of the relationship between GNSS Precipitable water vapor and heavy rainfall over the northwest equatorial coast, Andes, and Amazon Regions. Atmosphere 13:1809. doi: 10.3390/atmos13111809
Shen, X., Liu, B., Li, G., Wu, Z., Jin, Y., Yu, P., et al. (2014). Spatiotemporal change of diurnal temperature range and its relationship with sunshine duration and precipitation in China. J. Geophys. Res. Atmos. 119, 13–163. doi: 10.1002/2014JD022326
Shen, X., Liu, B., and Lu, X. (2018). Weak cooling of cold extremes versus continued warming of hot extremes in China during the recent global surface warming hiatus. J. Geophys. Res. Atmos. 123, 4073–4087. doi: 10.1002/2017JD027819
Skendži, S., Zovko, M., and Pajǎ, I. (2021). The impact of climate change on agricultural insect pests. Insects 12:440. doi: 10.3390/insects12050440
Stevens, T., and Madani, K. (2016). Future climate impacts on maize farming and food security in Malawi. Sci. Rep. 6, 1–14. doi: 10.1038/srep36241
Sultan, B., Roudier, P., Quirion, P., Alhassane, A., Muller, B., Dingkuhn, M., et al. (2013). Assessing climate change impacts on sorghum and millet yields in the Sudanian and Sahelian savannas of West Africa. Environmental Research Letters 8:14040. doi: 10.1088/1748-9326/8/1/014040
Tambet, H., and Stopnitzky, Y. (2021). Climate adaptation and conservation agriculture among Peruvian farmers. Amer. J. Agr. Econ. 103, 900–922. doi: 10.1111/ajae.12177
Toulkeridis, T., Tamayo, E., Simón-baile, D., Reyes-yunga, D. F., Viera-torres, M., and Heredia, M. (2020). Cambio Climático según los académicos ecuatorianos—Percepciones versus hechos. La Granja. Revista de Ciencias de La Vida 31, 21–49. doi: 10.17163/lgr.n31.2020.02
Vilema-Escudero, S., and Manya Orellana, M. (2024). Riesgo Climático en los Servicios de Salud Local en Ecuador. La Granja: Revista de Ciencias de la Vida 40, 37–49. doi: 10.17163/lgr.n40.2024.02
Vollrath, D. (2007). Land distribution and international agricultural productivity. Am. J. Agric. Econ. 89, 202–216. doi: 10.1111/j.1467-8276.2007.00973.x
Wossen, T., Alene, A., Abdoulaye, T., Feleke, S., Rabbi, I. Y., and Manyong, V. (2019). Poverty reduction effects of agricultural technology adoption: the case of improved cassava varieties in Nigeria. J Agric Econ 70, 392–407. doi: 10.1111/1477-9552.12296
Keywords: GAMS, water availability, rainfed crops, projected scenarios, ClimDex
Citation: Serrano-Vincenti S, Guamán-Pozo J, Chuqui J, Tufiño R and Franco-Crespo C (2025) Measuring the effects of climate change on traditional crops in tropical highlands, Ecuador. Front. Sustain. Food Syst. 9:1447593. doi: 10.3389/fsufs.2025.1447593
Edited by:
Roger Rodrigues Torres, Federal University of Itajubá, BrazilReviewed by:
Xiangjin Shen, Chinese Academy of Sciences (CAS), ChinaOrestis Stavrakidis-Zachou, Hellenic Centre for Marine Research (HCMR), Greece
Copyright © 2025 Serrano-Vincenti, Guamán-Pozo, Chuqui, Tufiño and Franco-Crespo. This is an open-access article distributed under the terms of the Creative Commons Attribution License (CC BY). The use, distribution or reproduction in other forums is permitted, provided the original author(s) and the copyright owner(s) are credited and that the original publication in this journal is cited, in accordance with accepted academic practice. No use, distribution or reproduction is permitted which does not comply with these terms.
*Correspondence: Christian Franco-Crespo, Y2QuZnJhbmNvQHV0YS5lZHUuZWM=; Sheila Serrano-Vincenti, c3NlcnJhbm92QHVwcy5lZHUuZWM=
†Present address: Jessica Guamán-Pozo, Pontificia Universidad Católica del Ecuador, Quito, Ecuador