 Lei Shi1,2
 Shabir Mohsin Hashmi
- 1School of Economics and Management, Yancheng Institute of Technology, Yancheng, China
- 2School of Agriculture, Yangzhou University, Yangzhou, China
- 3School of Economics and Management, Northeast Forestry University, Harbin, China
- 4School of Digital Economics and Management, Suzhou City University, Suzhou, China
Agricultural trade is fundamental to human sustenance and economic development, serving as a critical pillar of the Regional Comprehensive Economic Partnership (RCEP). With the progressive implementation of RCEP, China’s agricultural trade with member countries has exhibited steady growth, underscoring its substantial development potential. Drawing on data from 2009 to 2023, this study systematically examines the export patterns of Chinese agricultural products to RCEP countries. Utilizing the stochastic frontier gravity model, it further explores the key determinants that facilitate or constrain China’s agricultural exports. Moreover, the study assesses export efficiency, untapped potential, and the scope for expansion in China’s agricultural trade with RCEP partners. The findings reveal that New Zealand and Myanmar possess a distinct competitive advantage in agricultural exports. Additionally, factors such as tariff structures, government efficiency, and political stability exert a significant influence on China’s agricultural trade performance. In terms of export potential, China demonstrates considerable opportunities for expanding agricultural exports to Japan, Indonesia, and the Philippines. This study aims to provide theoretical insights and policy recommendations to optimize China’s agricultural trade strategies within the RCEP framework.
1 Introduction
Agriculture is a cornerstone industry in China, and the development of the agricultural economy is critical to the overall economic advancement of the country. Trade in agricultural products is a key component of this economic development. Presently, China is in a pivotal phase of accelerating the development of a robust agricultural nation. To establish such a nation, it is essential to possess a robust capacity for global resource allocation, which includes maintaining strong competitiveness of agricultural products in global trade, ensuring the security of the agricultural product supply chain, providing global agricultural public goods, formulating international agricultural regulations, and supporting multinational corporations with industrial chain integration capabilities. The occurrence of unprecedented global changes, major international events, the rise of anti-globalization sentiments, and food security concerns in various nations have significantly altered the global agricultural trade landscape (Bian, 2019; Luckstead, 2024). The importance of stable regional agricultural trade has become increasingly evident. To establish a strong agricultural nation with Chinese characteristics (Liu, 2020; Zhang, 2024), it is critical to develop a robust agricultural trade system (Ma et al., 2024), enabling effective responses to major risks and challenges while efficiently coordinating and utilizing both domestic and international markets and resources.
The Regional Comprehensive Economic Partnership (RCEP) represents a crucial institutional framework and a “new engine” driving regional economic integration. RCEP was signed and came into force on November 15, 2020, with member states including China, the ten ASEAN countries, Japan, South Korea, Australia, and New Zealand. On June 2, 2023, it fully came into force for the 15 member states, marking the commencement of a new phase in the complete implementation of the world’s largest and most dynamic free trade agreement, involving the most populous and economically significant region (Muhamad et al., 2020; Xu et al., 2024). In 2023, intra-regional trade within RCEP reached $5.6 trillion. By June 2024, a year after full implementation, the agreement has significantly facilitated the free flow of resources within the region, fostering the gradual formation of a more prosperous and integrated regional market. This has encouraged broader, more sophisticated, and deeper cooperation among member states, effectively mitigating the impact of weak global trade growth and counteracting the adverse effects of global economic fragmentation and the formation of trade blocs. RCEP member states include major agricultural resource producers and the largest global agricultural markets. In light of global climate change, food blockades, and unforeseen events, stable regional agricultural trade has become especially critical. In this context, studying regional agricultural trade under the RCEP framework is of significant strategic importance and urgency (Fan et al., 2023; Lv and Mengyuan, 2024).
2 Literature review
The literature on agricultural product trade among RCEP countries can be classified into three main categories. The first category predominantly employs the gravity model to quantitatively analyze the determinants of international trade. The model was initially proposed by Gross and Friedmann (1964) and Poyhonen (1963), who suggested that trade between two countries is directly proportional to their economic size and inversely proportional to the distance between them. This model was subsequently expanded into a stochastic frontier gravity model, incorporating research on technical efficiency in production functions by Farrell (1957) and Lebenstein (1966) and adapting it to the gravity model, which has been continuously refined (Meeusen and Van Den Broeck, 1977; Aigner et al., 1977). Several studies have applied this model to analyze the determinants of trade, the impacts of various trade agreements, and to estimate potential trade (Masood et al., 2022; Sharkasi et al., 2023). Several domestic scholars have refined and applied this model to study international agricultural trade, noting that variables such as GDP and geographical proximity to trade partners significantly promote the export scale of Chinese agricultural products, while variables such as population size and international distance significantly hinder China’s agricultural exports (Li and Yang, 2019). Factors such as improvements in China’s agricultural economic development level, the signing of bilateral FTAs, and increased trade openness significantly promote China’s vegetable exports to RCEP member countries, while economic distance hinders vegetable exports (Zheng and Li, 2024). Furthermore, factors such as the quality of national economic institutions, the signing of free trade agreements, GDP, population, common languages, and geographical distance all significantly impact agricultural product trade (Xu et al., 2024; Narayan and Bhattacharya, 2019).
The second category of literature primarily examines the impact of free trade areas (Panagariya and Duttagupta, 2002; Cao et al., 2022), with a particular emphasis on the effects of RCEP implementation on China’s agricultural product trade. As anti-globalization challenges have emerged, regional trade agreements (RTAs) have generally enhanced trade efficiency among member countries (Qi and Xi, 2023). Joining both RCEP and CPTPP provides greater benefits than participating in only one trade agreement or abstaining from trade agreements altogether (Li and Li, 2021). The entry into force of the RCEP agreement has created numerous opportunities for China’s international agricultural cooperation. Tariff reductions have stimulated positive effects in regional agricultural product trade within the RCEP, while the accumulation of rules of origin has facilitated the integration of the agricultural industrial chain in the Asia-Pacific region (Chevassus-Lozza et al., 2008; Dong, 2024). The signing and implementation of FTAs have facilitated China’s agricultural product exports to its FTA partner countries (Tai and Li, 2022).
The third category of literature primarily investigates the trade efficiency, trade potential, and scalability of agricultural product trade across different countries. Regarding trade efficiency, the digital economy significantly enhances agricultural product export trade efficiency (Xiao and Abula, 2023; Liu and Dong, 2024). With respect to trade potential, among ASEAN countries, Myanmar, Laos, and the Philippines exhibit the highest agricultural product trade competitiveness in the global market, while Laos, Cambodia, and Myanmar hold the strongest competitiveness in the regional market (Mizik et al., 2020). China’s agricultural product export efficiency to member countries demonstrates an overall declining trend, with substantial trade expansion potential for Japan, South Korea, and Singapore (We and Zhang, 2021). Research on the impact of RCEP on specific agricultural product trade reveals that tariff reductions have effectively facilitated China’s seafood trade with other RCEP member countries, leading to a highly significant trade creation effect (Ghosh and Yamarik, 2004; Han et al., 2024). The differences in fruit and vegetable attributes between China and RCEP member countries are considerable, suggesting significant trade potential in the future (Tong et al., 2023).
With the full implementation of RCEP in June 2023, it provided significant opportunities for China’s agricultural openness and the high-quality development of agricultural product trade, while also presenting new challenges (Tong et al., 2023). Building on existing research by experts and scholars, and based on relevant data from RCEP countries between 2009 and 2023, this study employs the stochastic frontier gravity model to first conduct a multidimensional analysis of China’s agricultural exports to RCEP countries, including export scale, export markets, export structure, and export competitiveness, to provide a comprehensive understanding of the main export product categories and markets. Secondly, the stochastic frontier gravity model is employed to analyze the factors influencing China’s agricultural exports, exploring aspects such as trade agreements, tariffs, container shipping, and economic freedom. Finally, the study measures export efficiency, export potential, and scalability, providing corresponding policy recommendations for agricultural exports to various RCEP member countries. In terms of methodology, employing the stochastic frontier gravity model avoids inaccuracies in regression results caused by trade frictions and human factors commonly observed in traditional gravity models. The study utilizes a one-step method to investigate trade inefficiency, thereby avoiding theoretical contradictions and result biases that may arise from step-by-step research. Ultimately, this study aims to offer theoretical support for China’s agricultural and trade cooperation with RCEP countries.
To facilitate readers’ understanding of the themes and purposes of the cited literature, this paper provides a summary table of the references, making the content of the literature review section clearer, as shown in Table 1.
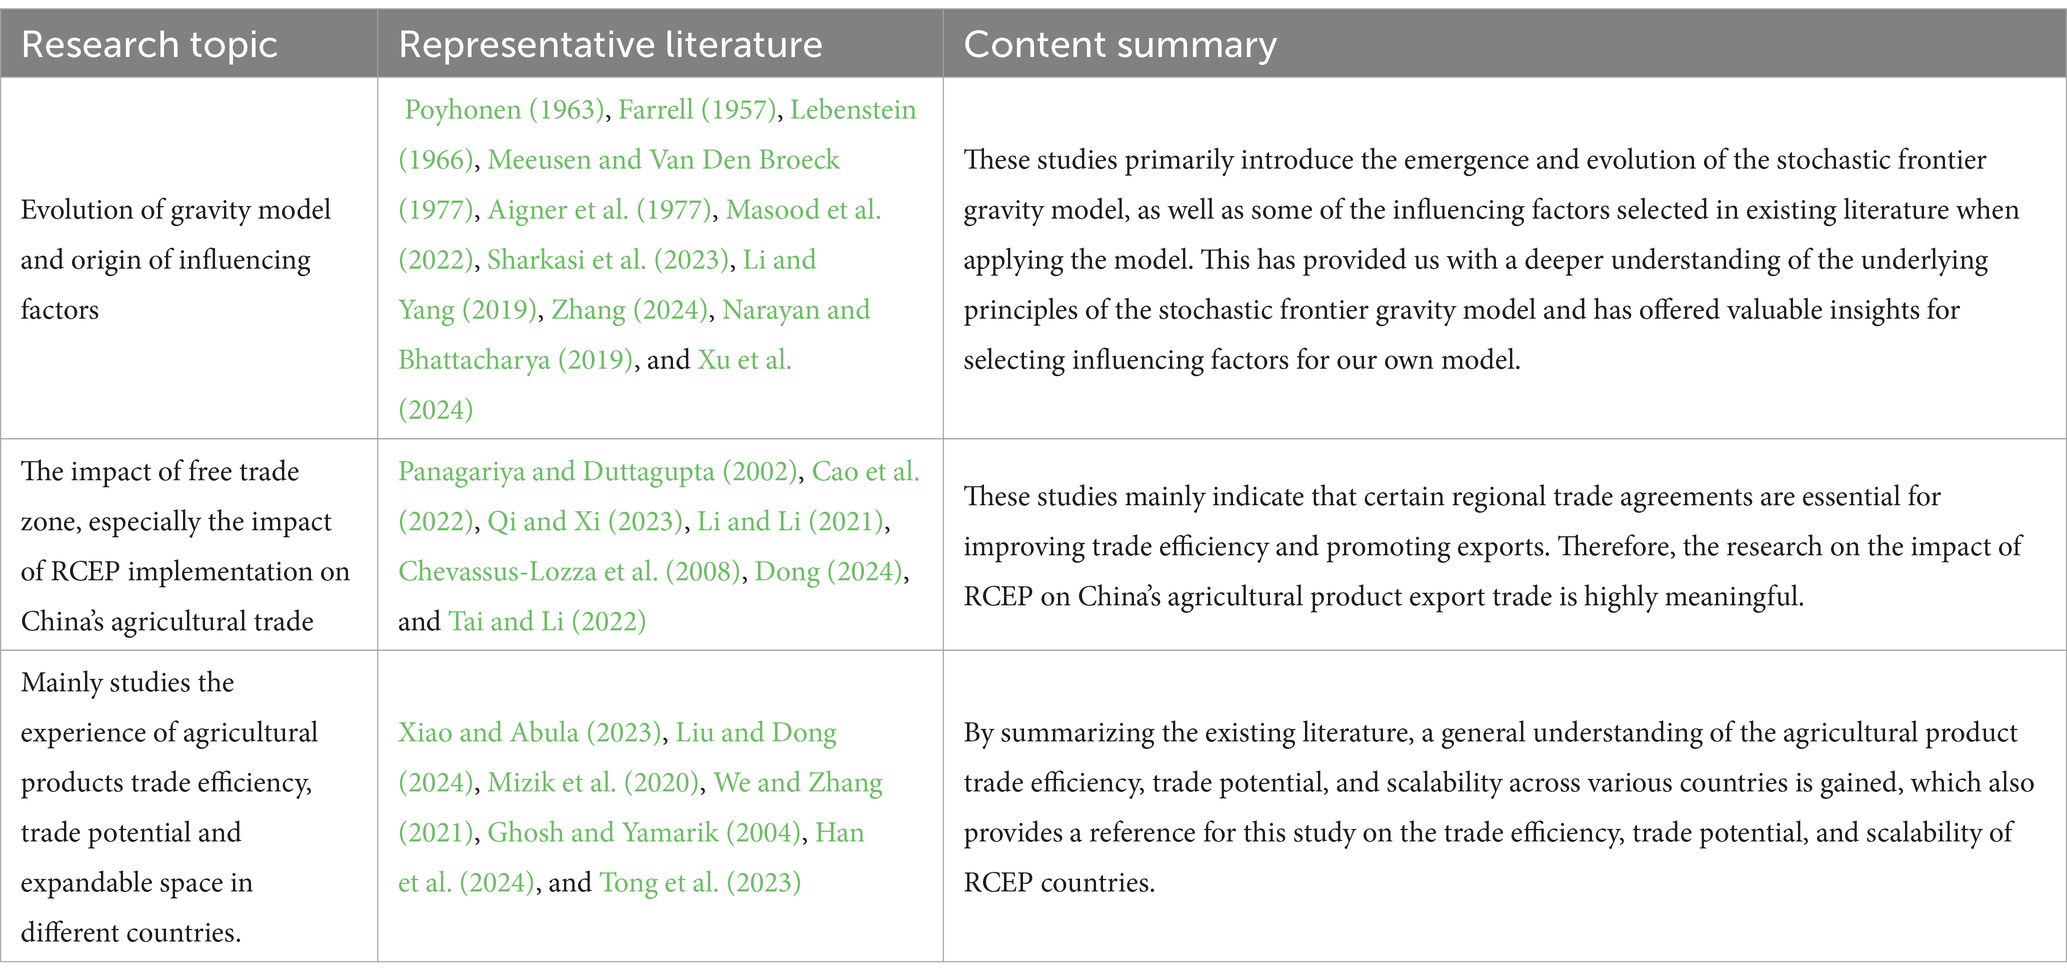
Table 1. Literature summary.
3 Methodology
3.1 Theoretical modelling
The stochastic frontier gravity model improves on the traditional gravity model by splitting the error term into two parts. This makes it easier to assess trade efficiency and potential. It is commonly used to measure export efficiency and potential. The model is as follows (see Equation 1):
Taking the logarithm on both sides gives Equation (2):
represents the volume of trade between country i and country j in period t. The model uses GDP per capita, population size and geographical distance as the key variables affecting the size of actual trade volume, β is a parameter to be estimated and is a random disturbance term. is the trade inefficiency term, which represents factors that are barriers to trade that are not considered in the model, such as tariffs, government efficiency and political stability. indicates that there is no efficiency loss in the trade process, which is when the level of trade between country i and country j is maximised. The formula for calculating the potential trade volume is expressed in Equation (3):
denotes the potential trade volume.
When trade potential exists, trade efficiency can be introduced into trade potential, which generally takes the form of actual trade value over trade potential, see Equation (4):
When trade inefficiency , , the trade level reaches the frontier; when , , it represents that trade inefficiency term exists and acts as an impediment to the trading partner countries, the actual trade volume is smaller than the potential trade volume, and the trade level does not reach the frontier.
As the time dimension of the study increases to a certain extent, some scholars have found that changes over time, i.e., the influencing factors of trade non-efficiency terms have changed. In the study of trade non-efficiency influencing factors, a one-step method is used to introduce the trade non-efficiency term and its influencing factors directly into the stochastic frontier function for regression analysis to obtain Equation (5):
The study firstly adopts a time-varying model to explore the influencing factors related to China’s trade in agricultural products with RCEP member countries, and determines the trade inefficiency term over time. Then the “one-step method” is used to construct a trade inefficiency model and explore the influence factors related to the trade inefficiency term. Finally, the model is based on the measurement of export efficiency, export potential and room for expansion.
3.2 Model setting and variable selection
In the research, trade-influencing factors are categorized into natural and human factors. The former determines the realization of trade potential, encompassing elements such as geographical distance, economic size, and population size. The latter affects the manifestation of trade inefficiency, which includes factors like tariffs, trade policies, and the institutional environment.
In view of Armstrong’s method and idea of model setting (Armstrong, 2007), the time-varying model set in this study is in the following form as shown by Equation (6):
The information of each variable is shown in Table 2.
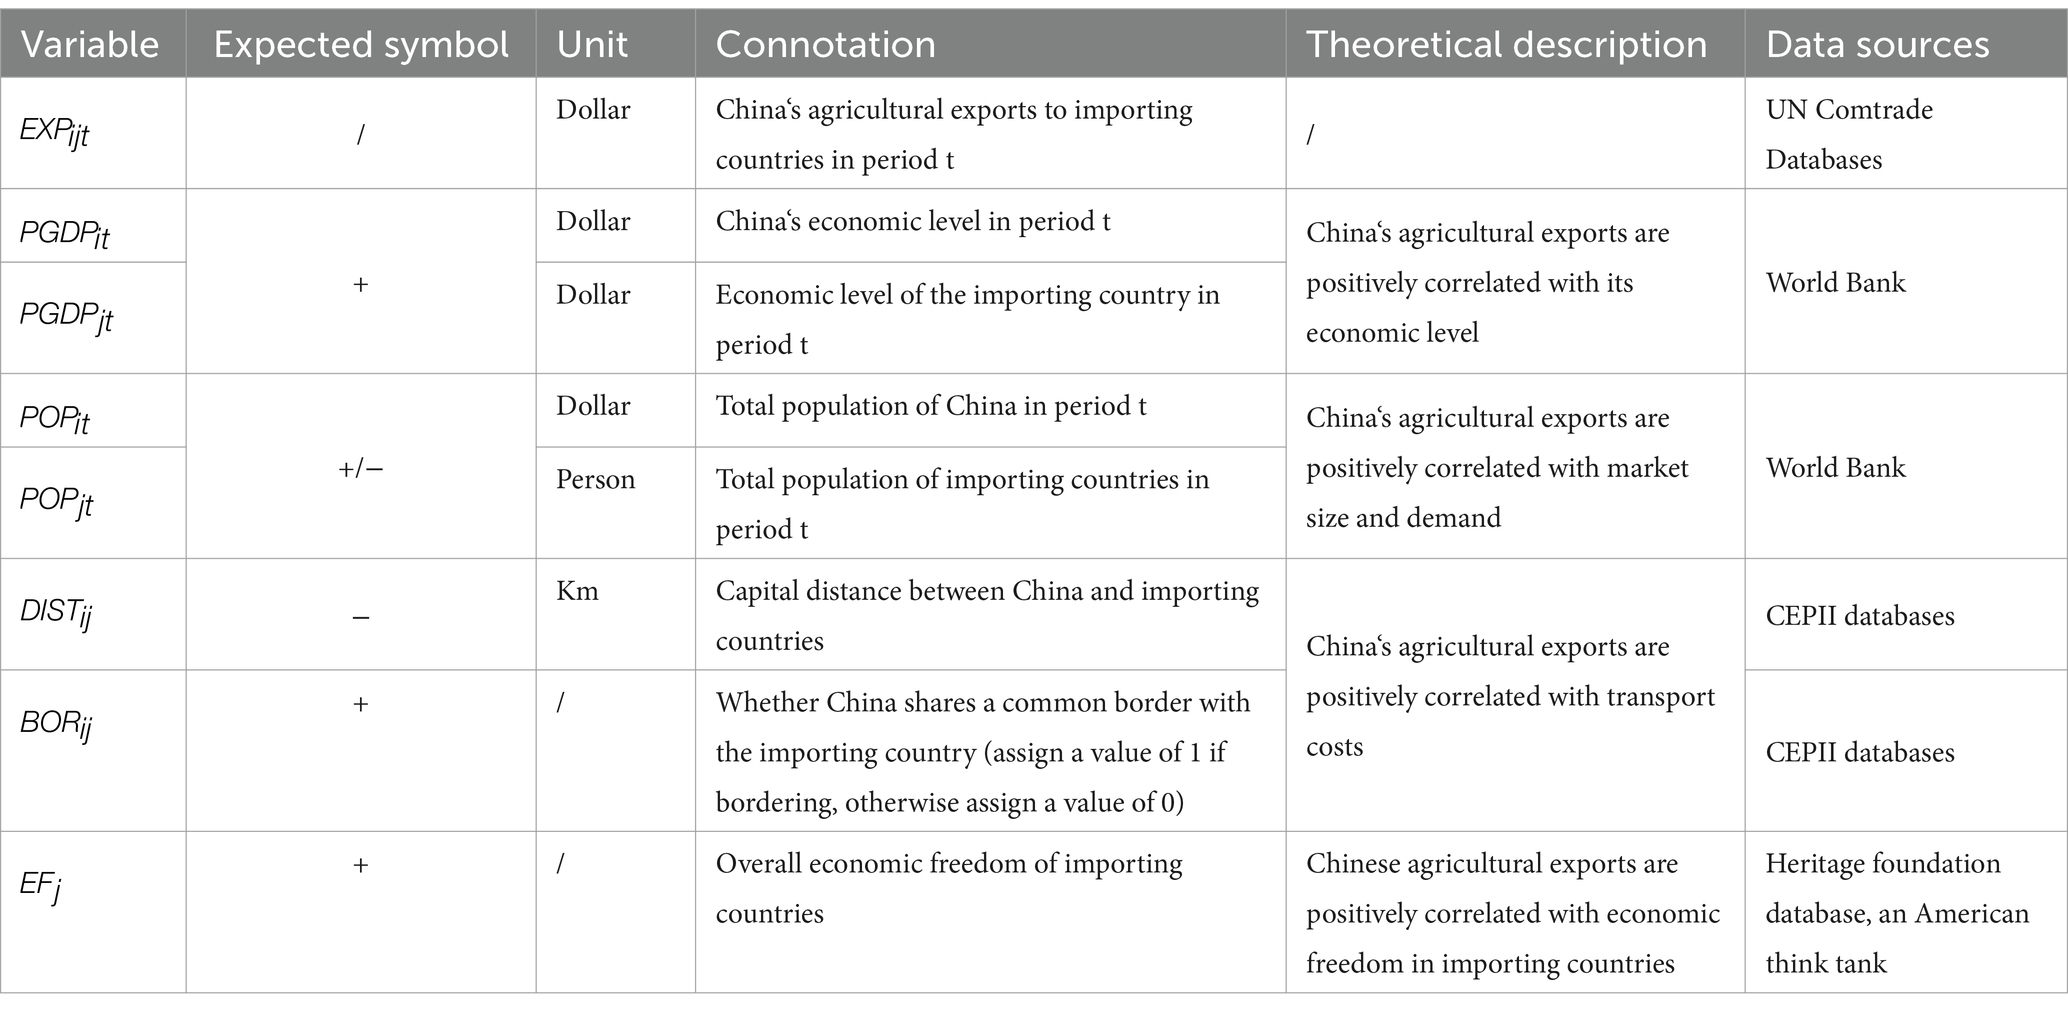
Table 2. Description of variables used in the time-varying model.
A “one-step” approach is then used to explore the factors affecting the trade inefficiency term, and the final “one-step” model is expressed in Equation (7):
The information of each variable is shown in Table 3.
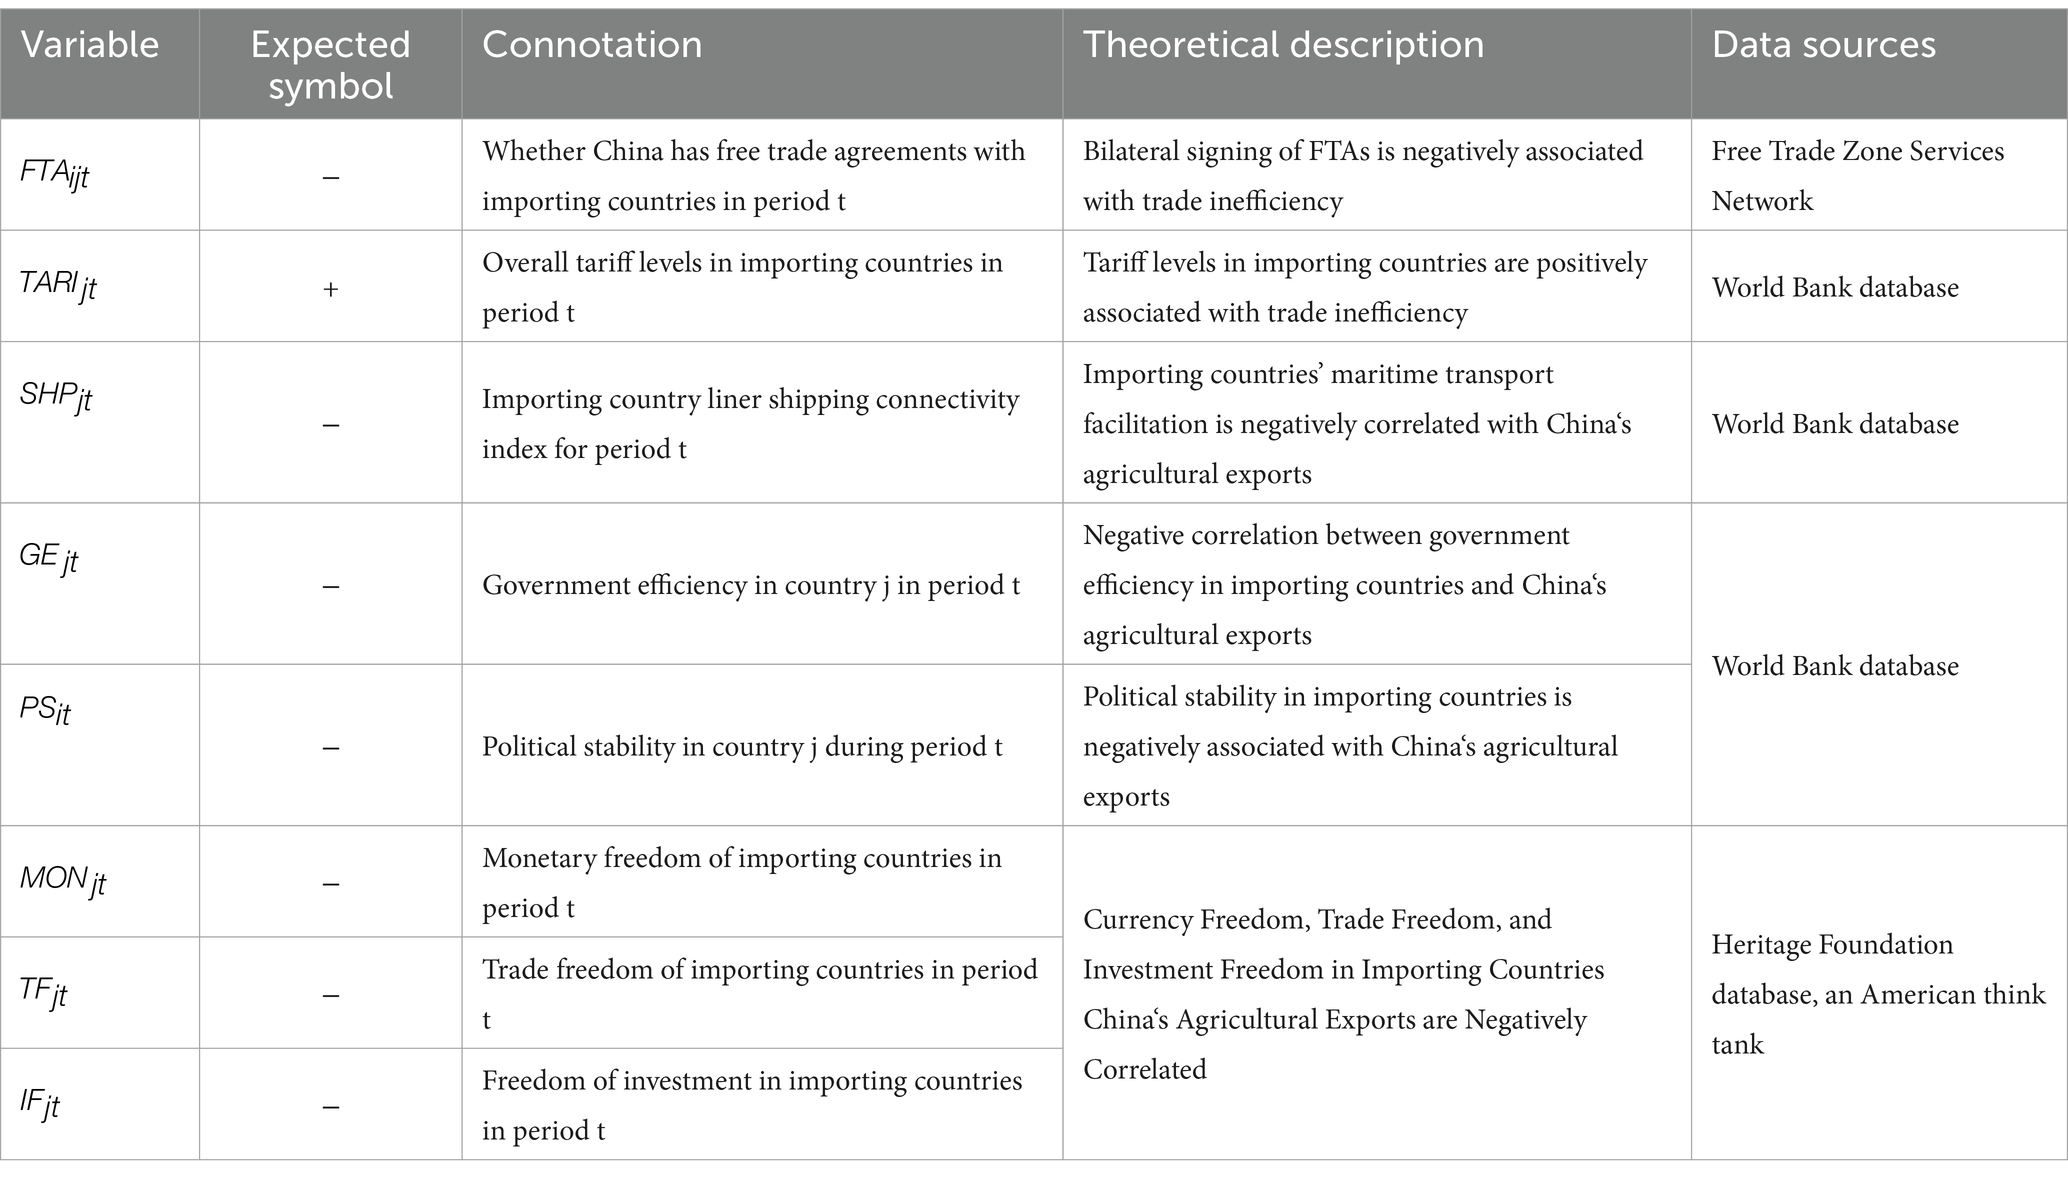
Table 3. Description of variables used in the trade inefficiency models.
3.3 Description of samples and data
The study utilizes agricultural export trade data from RCEP countries spanning the years 2009 to 2023 for an analysis of the export structure. When employing the stochastic frontier gravity model, panel data from 2009 to 2023 for 14 RCEP member countries, excluding China, are used to account for influencing factors. Considering the complexity of the concept of agricultural products and the diversity in classification standards, the research includes agricultural products from chapters 1 to 24. Since cotton and hemp products are advantageous export commodities for China, chapters 50 (5,001, 5,002, 5,003), 51 (5,101, 5,102, 5,103), 52 (5,201, 5,202, 5,203), and 53 (5,301, 5,302) are also incorporated. The econometric model employs Frontier Analyst 4.1 software, and missing data are filled in using interpolation methods from Stata software.
4 Analysis of China’s export pattern of agricultural products to RCEP countries
4.1 Scale of exports
As can be seen from Table 4, between 2009 and 2023, China’s agricultural product exports to RCEP countries consistently accounted for more than 40% of the total agricultural product exports from China over the years. The total value of China’s agricultural product exports increased from $38.542 billion in 2009 to $97.110 billion in 2023, marking a net growth of $58.568 billion. The total value of agricultural product exports to RCEP countries rose from $16.297 billion in 2009 to $40.982 billion in 2023, reflecting a net increase of $24.685 billion. The latter’s net growth represents 42.15% of the former’s net growth.
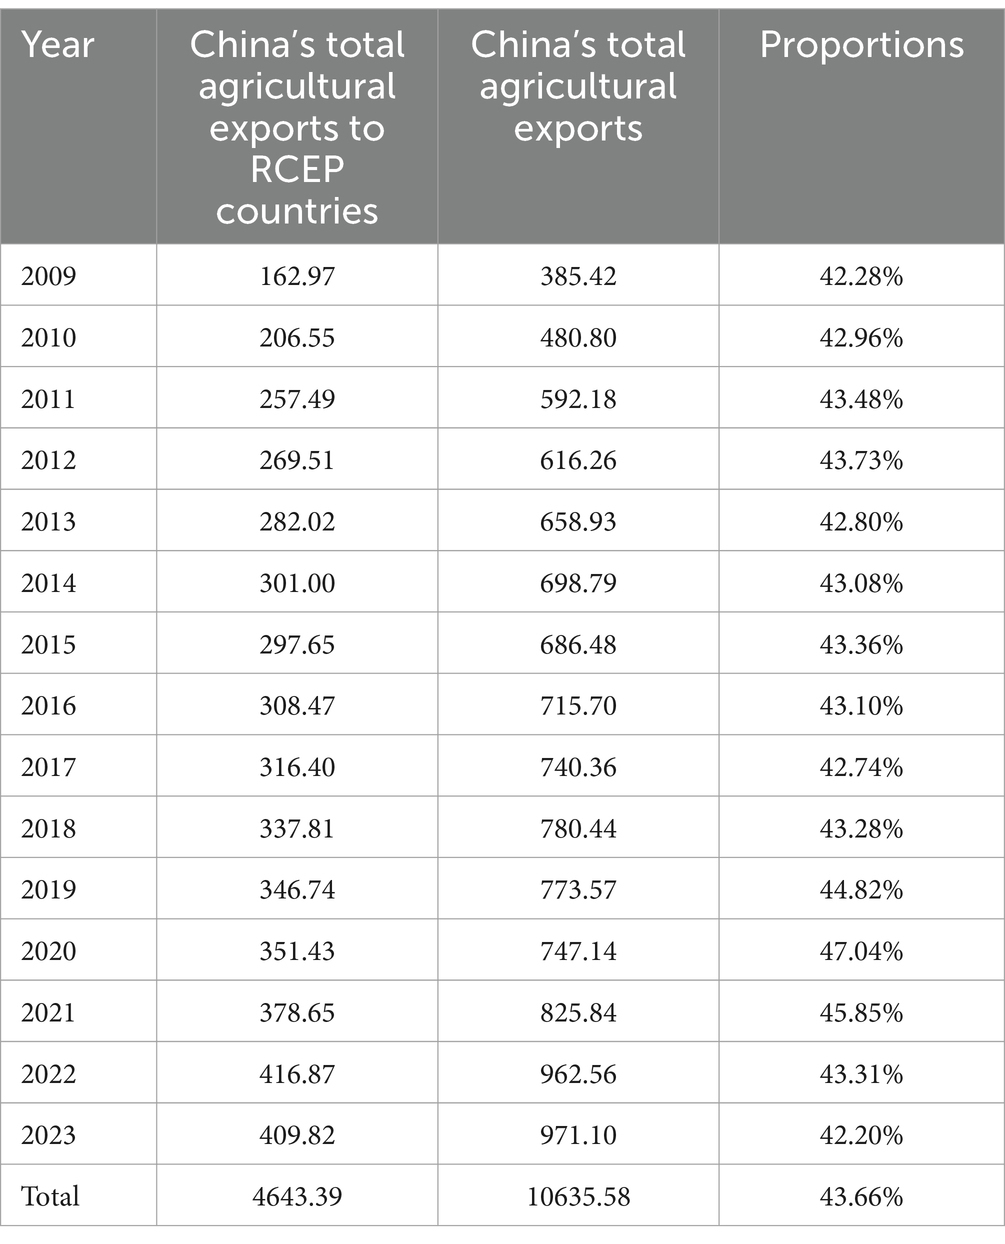
Table 4. China’s trade in agricultural exports to RCEP countries, 2009–2023 (in billions of dollars, %).
4.2 Export markets
As indicated by Figures 1, 2, from 2009 to 2023, the top three recipients of China’s agricultural product exports to RCEP countries were Japan, South Korea, and Vietnam. Over the nearly fifteen years, the cumulative exports to these three countries accounted for 14.37, 6.55, and 5.25% of the total agricultural product exports worldwide, respectively. The last three in terms of export volume were Cambodia, Laos, and Brunei, with cumulative exports over nearly eleven years representing 0.11, 0.05, and 0.02% of the total global exports, respectively. This phenomenon may be determined by factors such as market demand and the level of development of the recipient countries.
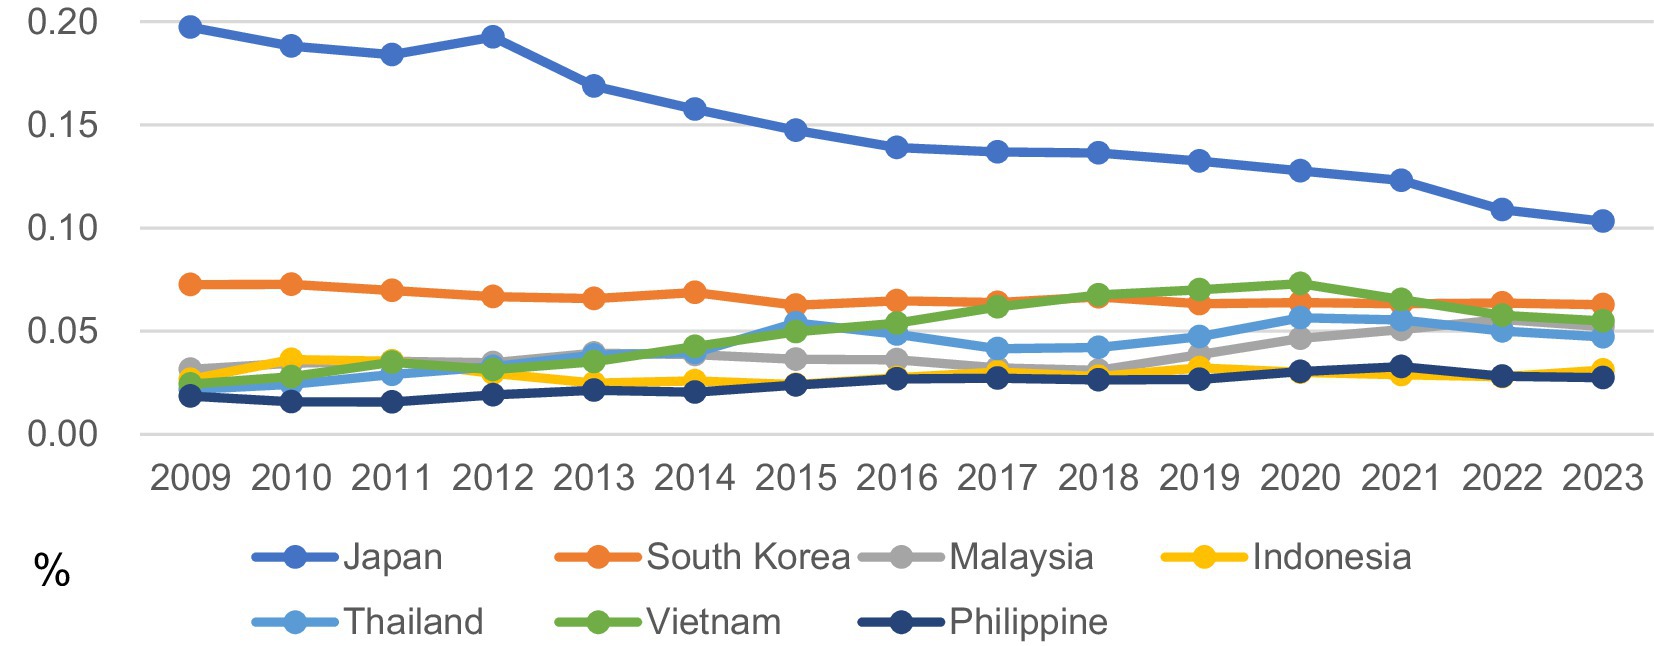
Figure 1. Proportionate share of one part of China’s agricultural export markets, 2009–2023.
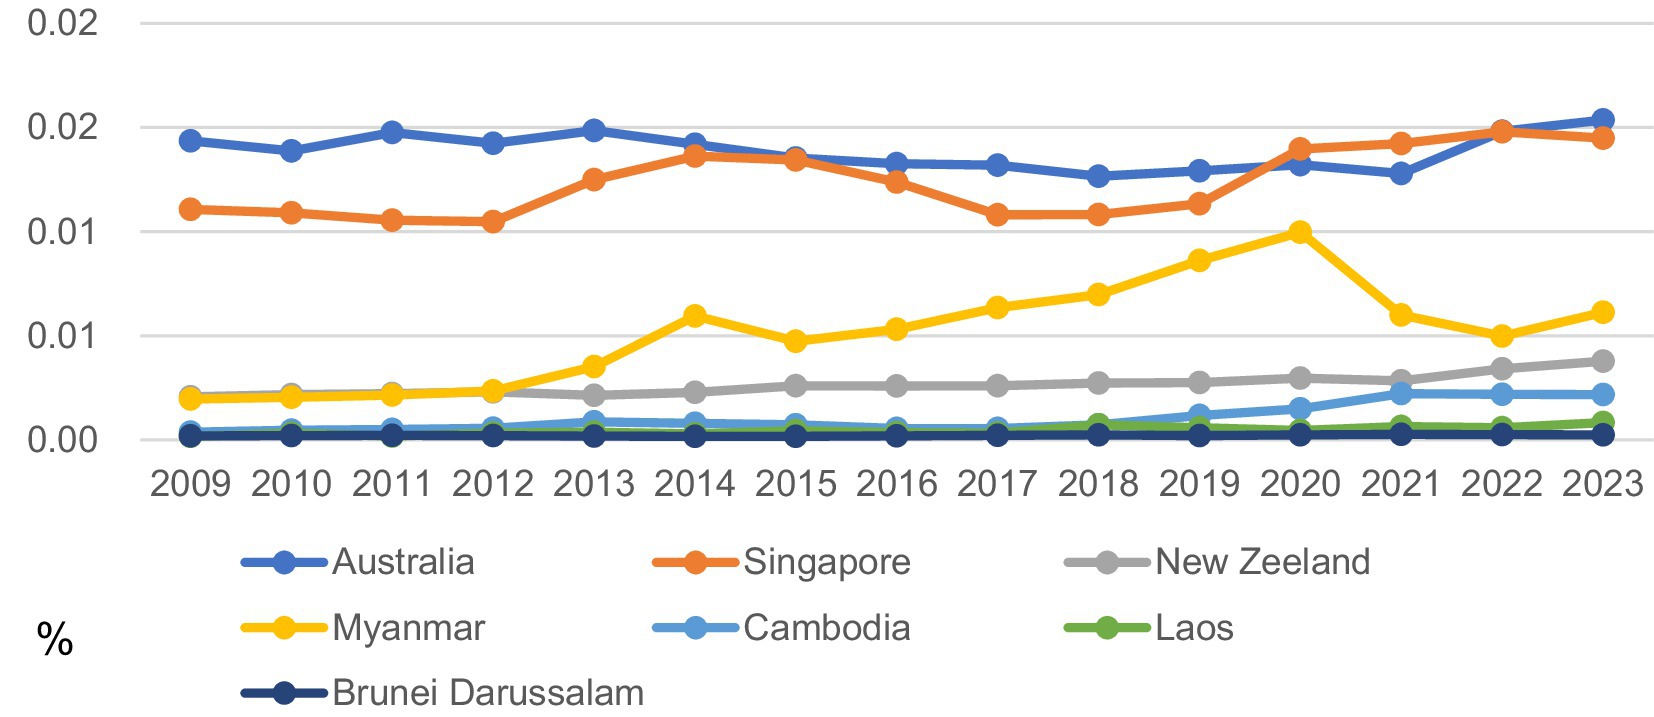
Figure 2. Proportionate share of the other part of China’s agricultural export markets, 2009–2023.
4.3 Export structure
Due to the absence of data for the export of silk, wool, cotton, and hemp agricultural products to Singapore, Brunei, Cambodia, and Laos, and considering the relatively small volume of agricultural product exports to some ASEAN countries, for the sake of convenience in calculation and analysis, the ten ASEAN countries are treated as a single entity here, and only the cross-sectional data from 2023 are selected. The structure of China‘s agricultural product exports to RCEP countries is shown in Table 5.
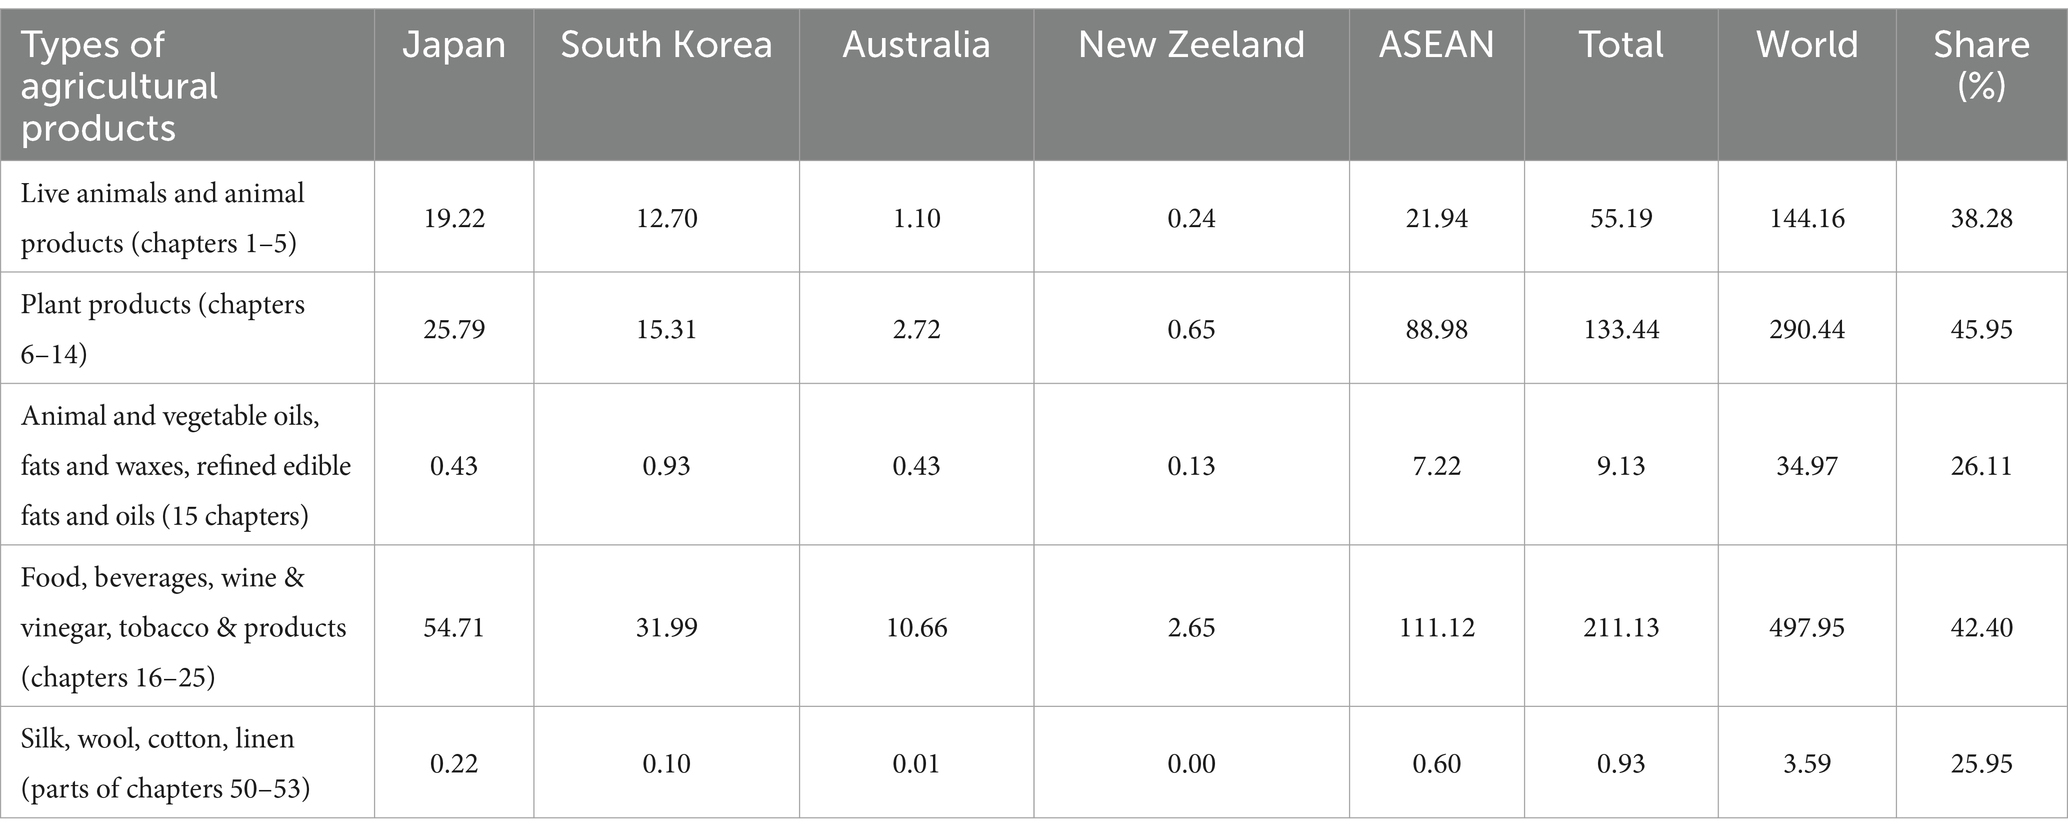
Table 5. Structure of China’s agricultural exports to RCEP countries, 2023 (in billion USD).
According to Table 5, in 2023, the largest export category of agricultural products from China to RCEP member countries was food, beverages, alcohol, vinegar, tobacco, and related products, with an export value reaching $21.113 billion, accounting for 42.40% of the total exports to the world. Plant products were the second-largest category, with an export value of $13.344 billion, representing 45.95% of the total exports to the world. The lowest export value was for silk, wool, cotton, and hemp products, amounting to $0.93 billion, which constituted 25.95% of the exports to the world. The main export destinations for all categories of agricultural products were Japan, South Korea, and ASEAN.
From this, the following conclusions can be drawn: First, in terms of export markets, with a focus on Japan, South Korea, and ASEAN, China should further deepen and refine its agricultural product exports to these countries and strive to open up export markets in the remaining countries. Second, regarding the export structure, which is currently dominated by lower-end products such as food, beverages, and plant products, with fewer processed products like silk, wool, cotton, and hemp, China should promptly adjust and optimize the structure of its agricultural product exports.
4.4 Export competitiveness
The index of revealed comparative advantage is an indicator used to assess the competitiveness of a country’s exports of a given product (Sheng and Yunxin, 2024), which is calculated as Equation (8):
is country i’s product k exports, is country i’s entire product exports; is the world’s product k exports, and is the world’s entire product exports. RCA > 2.5 represents a strong export advantage, 1.25 < RCA < 2.5 represents a stronger export advantage, and RCA < 0.8 represents a weaker export advantage. The results are shown in Table 6.
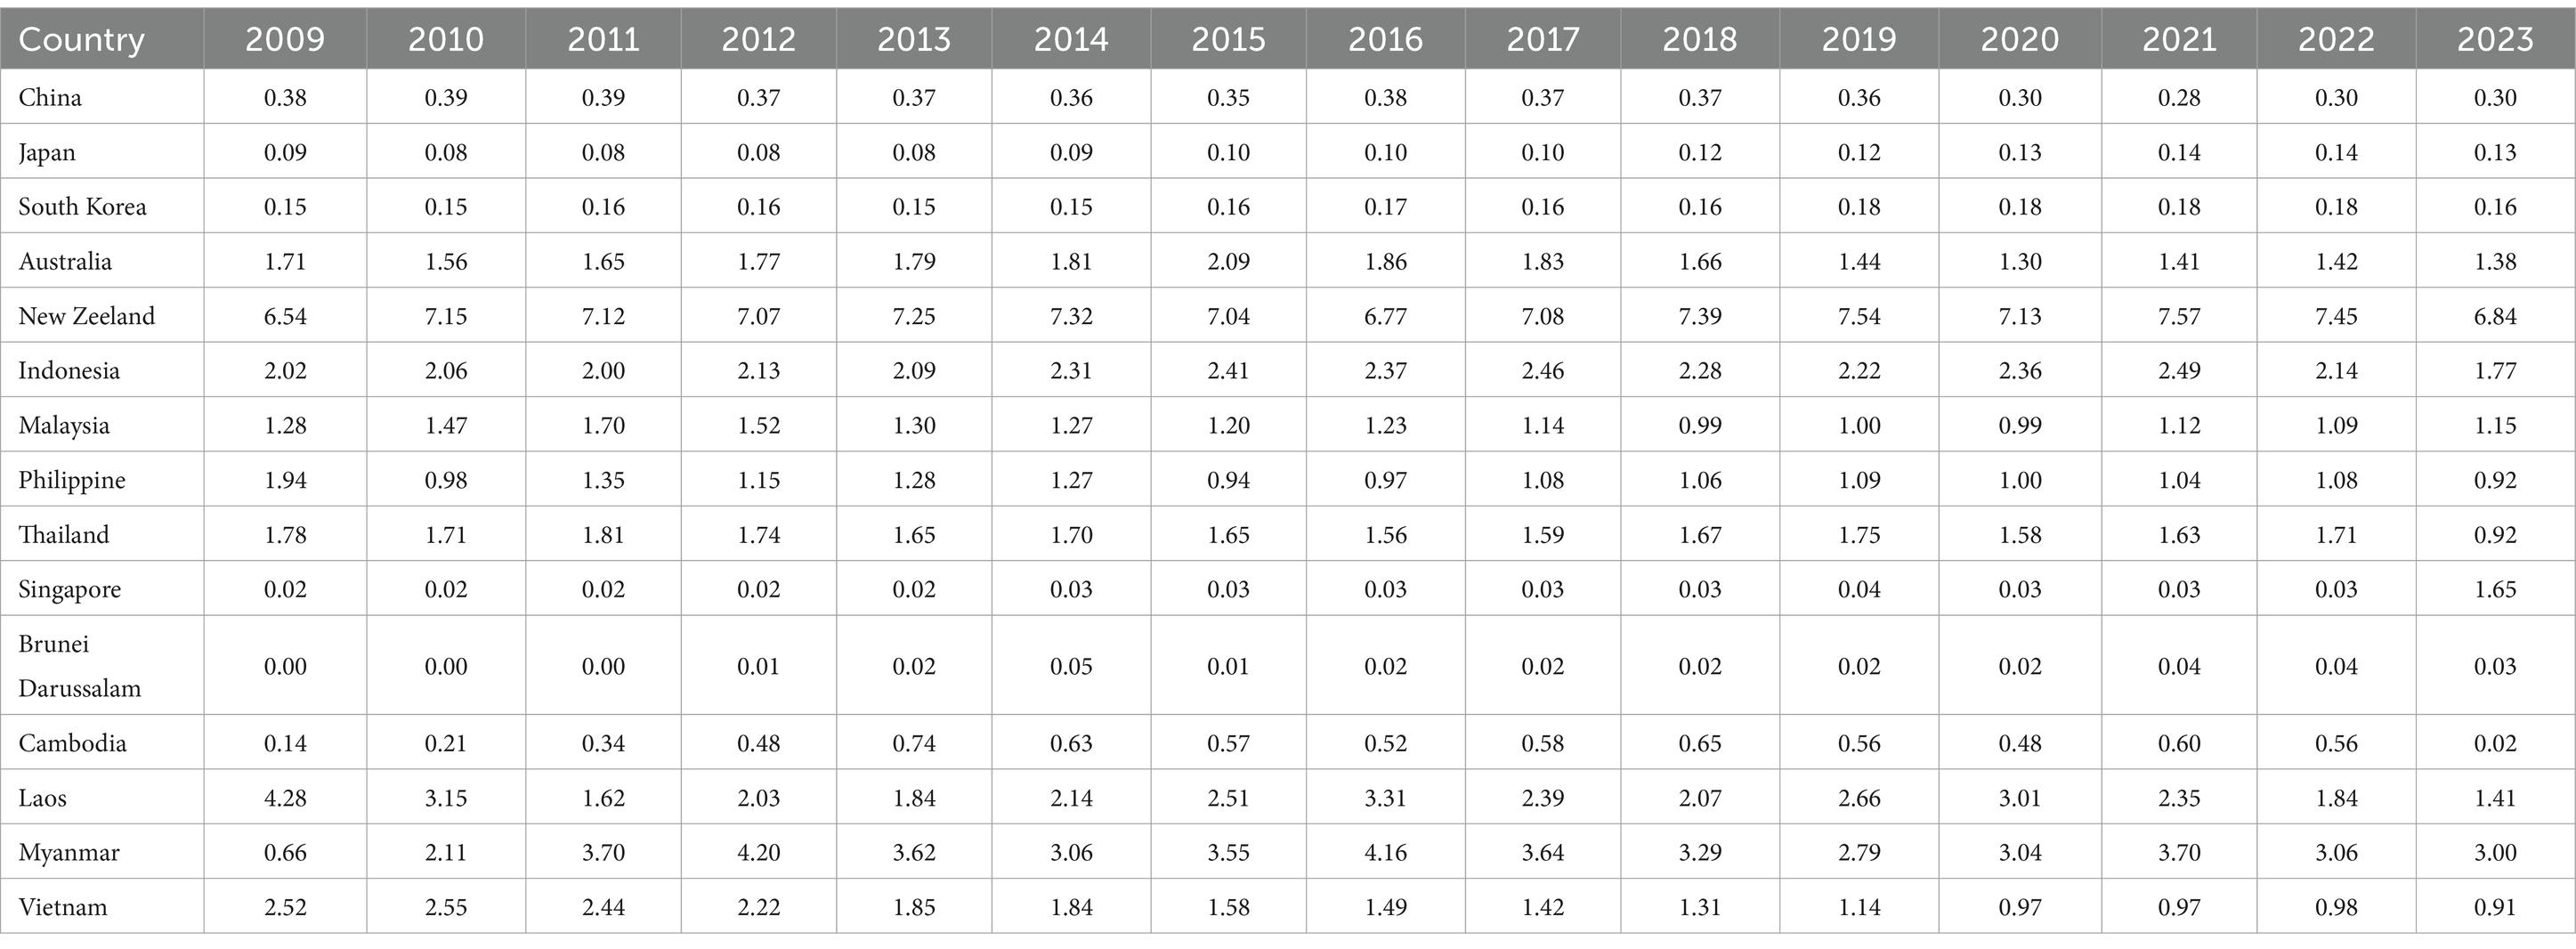
Table 6. Analysis of revealed comparative advantage index for agricultural exports of RCEP member countries, 2009–2023 (RCA values).
According to Table 6, overall, New Zealand and Myanmar have a very strong advantage in agricultural product exports, while Australia, Indonesia, Malaysia, the Philippines, Thailand, Laos, and Vietnam have a relatively strong advantage. China, Japan, South Korea, Brunei, and Cambodia have a relatively weaker advantage in agricultural product exports. China should not only learn from the advanced technology of developed countries and improve its level of specialization but also pay attention to the methods used by developing countries to promote agricultural exports. It should extract the essence and discard the dross, and propose relevant policy recommendations according to local conditions.
5 Empirical analysis of China’s agricultural exports to RCEP countries
5.1 Applicability test
The applicability of the model was tested using the likelihood ratio test (LR test). The results are shown in Table 7.
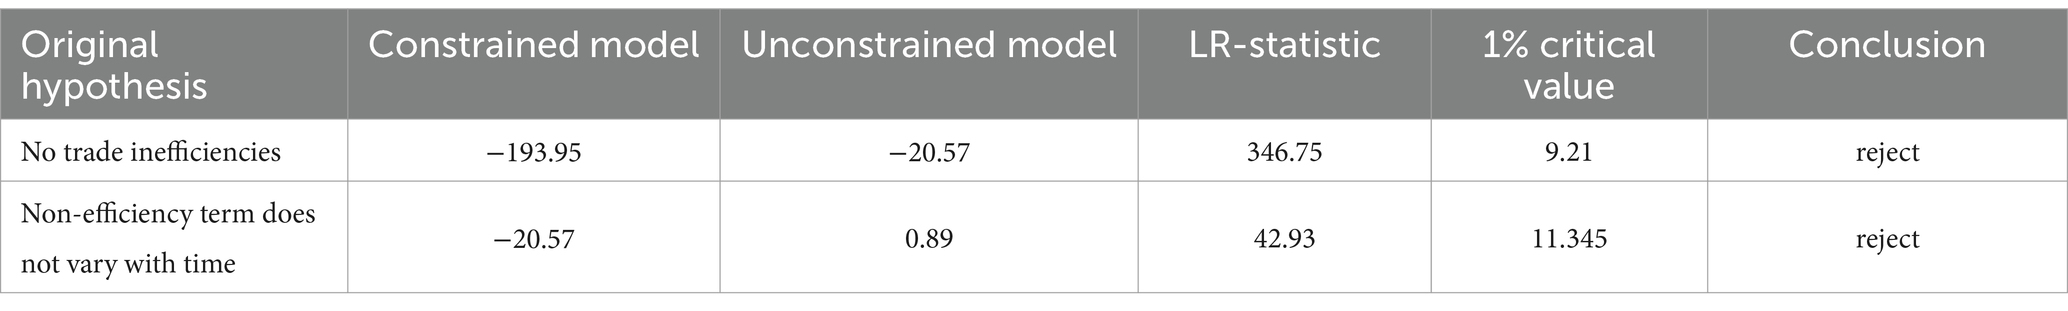
Table 7. Stochastic frontier gravity model applicability test.
According to Table 7, the rejection of the initial hypothesis at a significant level indicates that the model passes the applicability test, the trade inefficiency term is present, the model is time-varying in form, and the time-varying stochastic frontier gravity model is set up correctly.
5.2 Regression results of the stochastic frontier gravity model
The estimation results of the time-varying and time-invariant models are shown in Table 8.
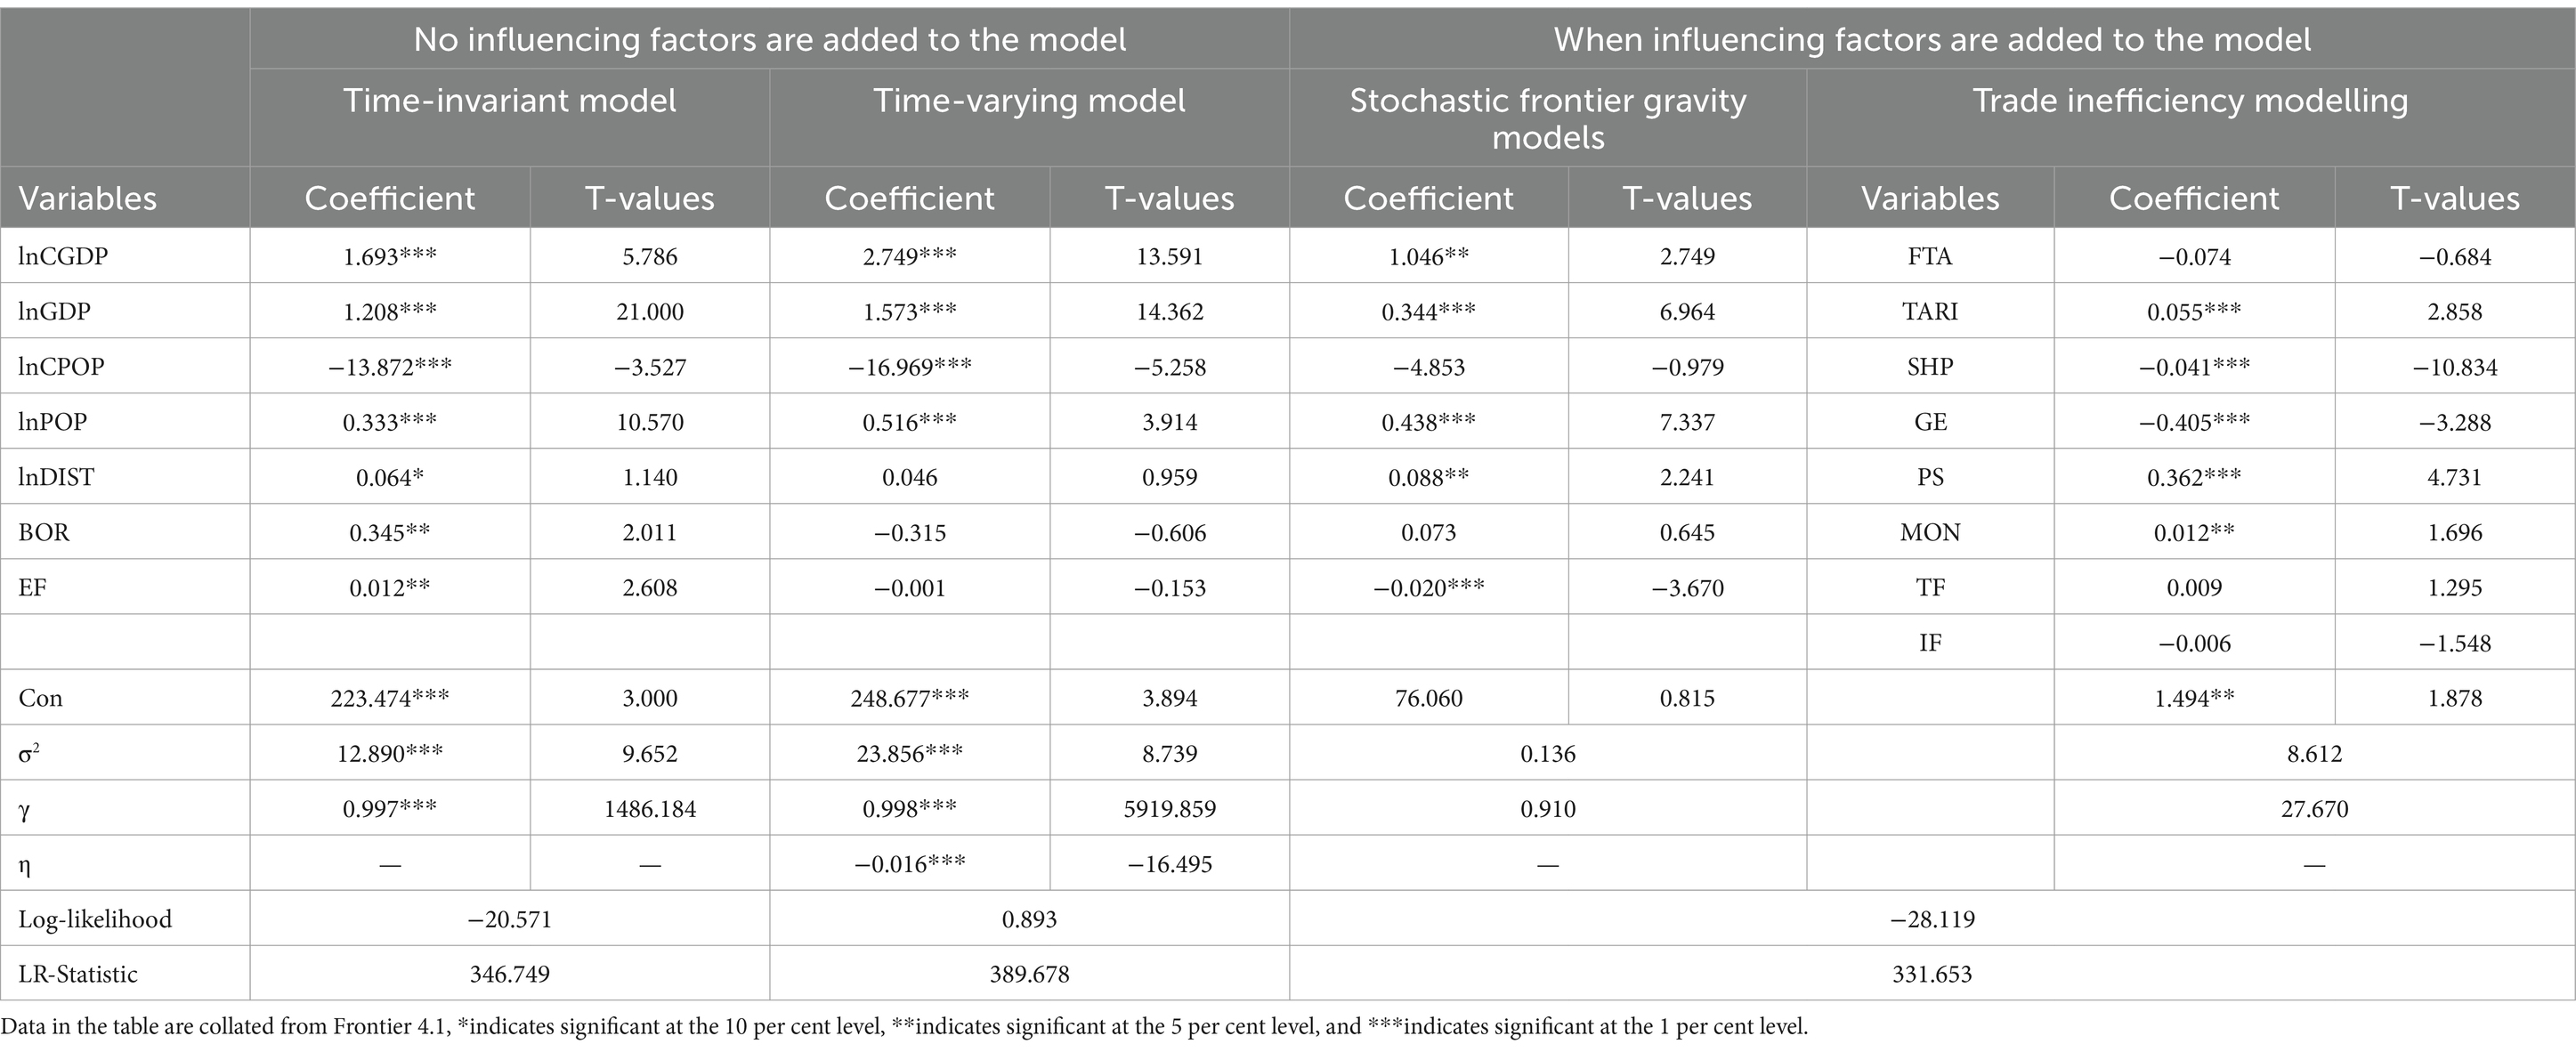
Table 8. Estimation results of the stochastic frontier gravity model and trade inefficiency modelling.
According to Table 8, both the time-varying model and the time-invariant model exhibit a γ value that is significantly high, which further confirms the existence of the trade inefficiency term and the applicability of the stochastic frontier gravity model. The η value of the time-varying model is significantly negative at the 1% level, indicating an increase in the trade inefficiency term. It is imperative to enhance the efficiency of China’s agricultural product exports to RCEP countries.
From the perspective of explanatory variables, the following points are noted: First, the GDP of China and its RCEP partner countries has a significantly positive impact on China‘s agricultural product exports, indicating a strong promotional effect. Second, the total population of China has a significantly negative impact on agricultural product exports, which may be due to the high consumption of agricultural products by the exporting country’s population or the low quality of agricultural product regulation that increases the difficulty of exports; in contrast, the total population of the importing country has a significantly positive impact on agricultural product exports, suggesting that the larger the population and market size of the importing country, the more it aids China’s agricultural product exports. Third, the distance variable, border variable, and economic freedom have no significant impact on agricultural product exports, indicating that transportation costs, transportation time, and border cooperation related to them are not the main factors affecting China’s agricultural product exports.
5.3 Regression results of the trade inefficiency model
In the process of studying the trade inefficiency model, a positive coefficient of the independent variable means that the variable will increase trade inefficiency and hinder China’s agricultural exports. A negative coefficient of the independent variable means that the variable will reduce trade inefficiency and promote China’s agricultural exports.
The results of the estimated trade inefficiency model are shown in Table 8.
First, the coefficient for tariffs is significantly positive, while the coefficients for the liner shipping connectivity index, government efficiency, and monetary freedom are significantly negative, all of which are in line with expectations. This indicates that the higher the tariff levels between China and RCEP member countries, the less favorable it is for China’s agricultural product exports. Conversely, the better the importing country’s infrastructure, the higher the government efficiency, and the more open the monetary policy, the more it benefits the export efficiency of China’s agricultural products. Second, the positive coefficient for government stability is contrary to expectations, possibly due to the importing countries adopting trade protection measures to safeguard their domestic agricultural markets, thereby hindering China’s agricultural exports. Third, the coefficients for free trade agreements, investment freedom, and trade freedom are not significant, which may be because there are large differences in the levels of economic, political, and cultural development among RCEP countries. Many countries have not yet established comprehensive trade reciprocity and investment management mechanisms, and there are numerous trade barriers, thus creating certain obstacles for China’s agricultural product exports.
5.4 Export efficiency, export potential and room for expansion
The export efficiency, export potential and scope for expansion in 2021–2023 are shown in Table 9.
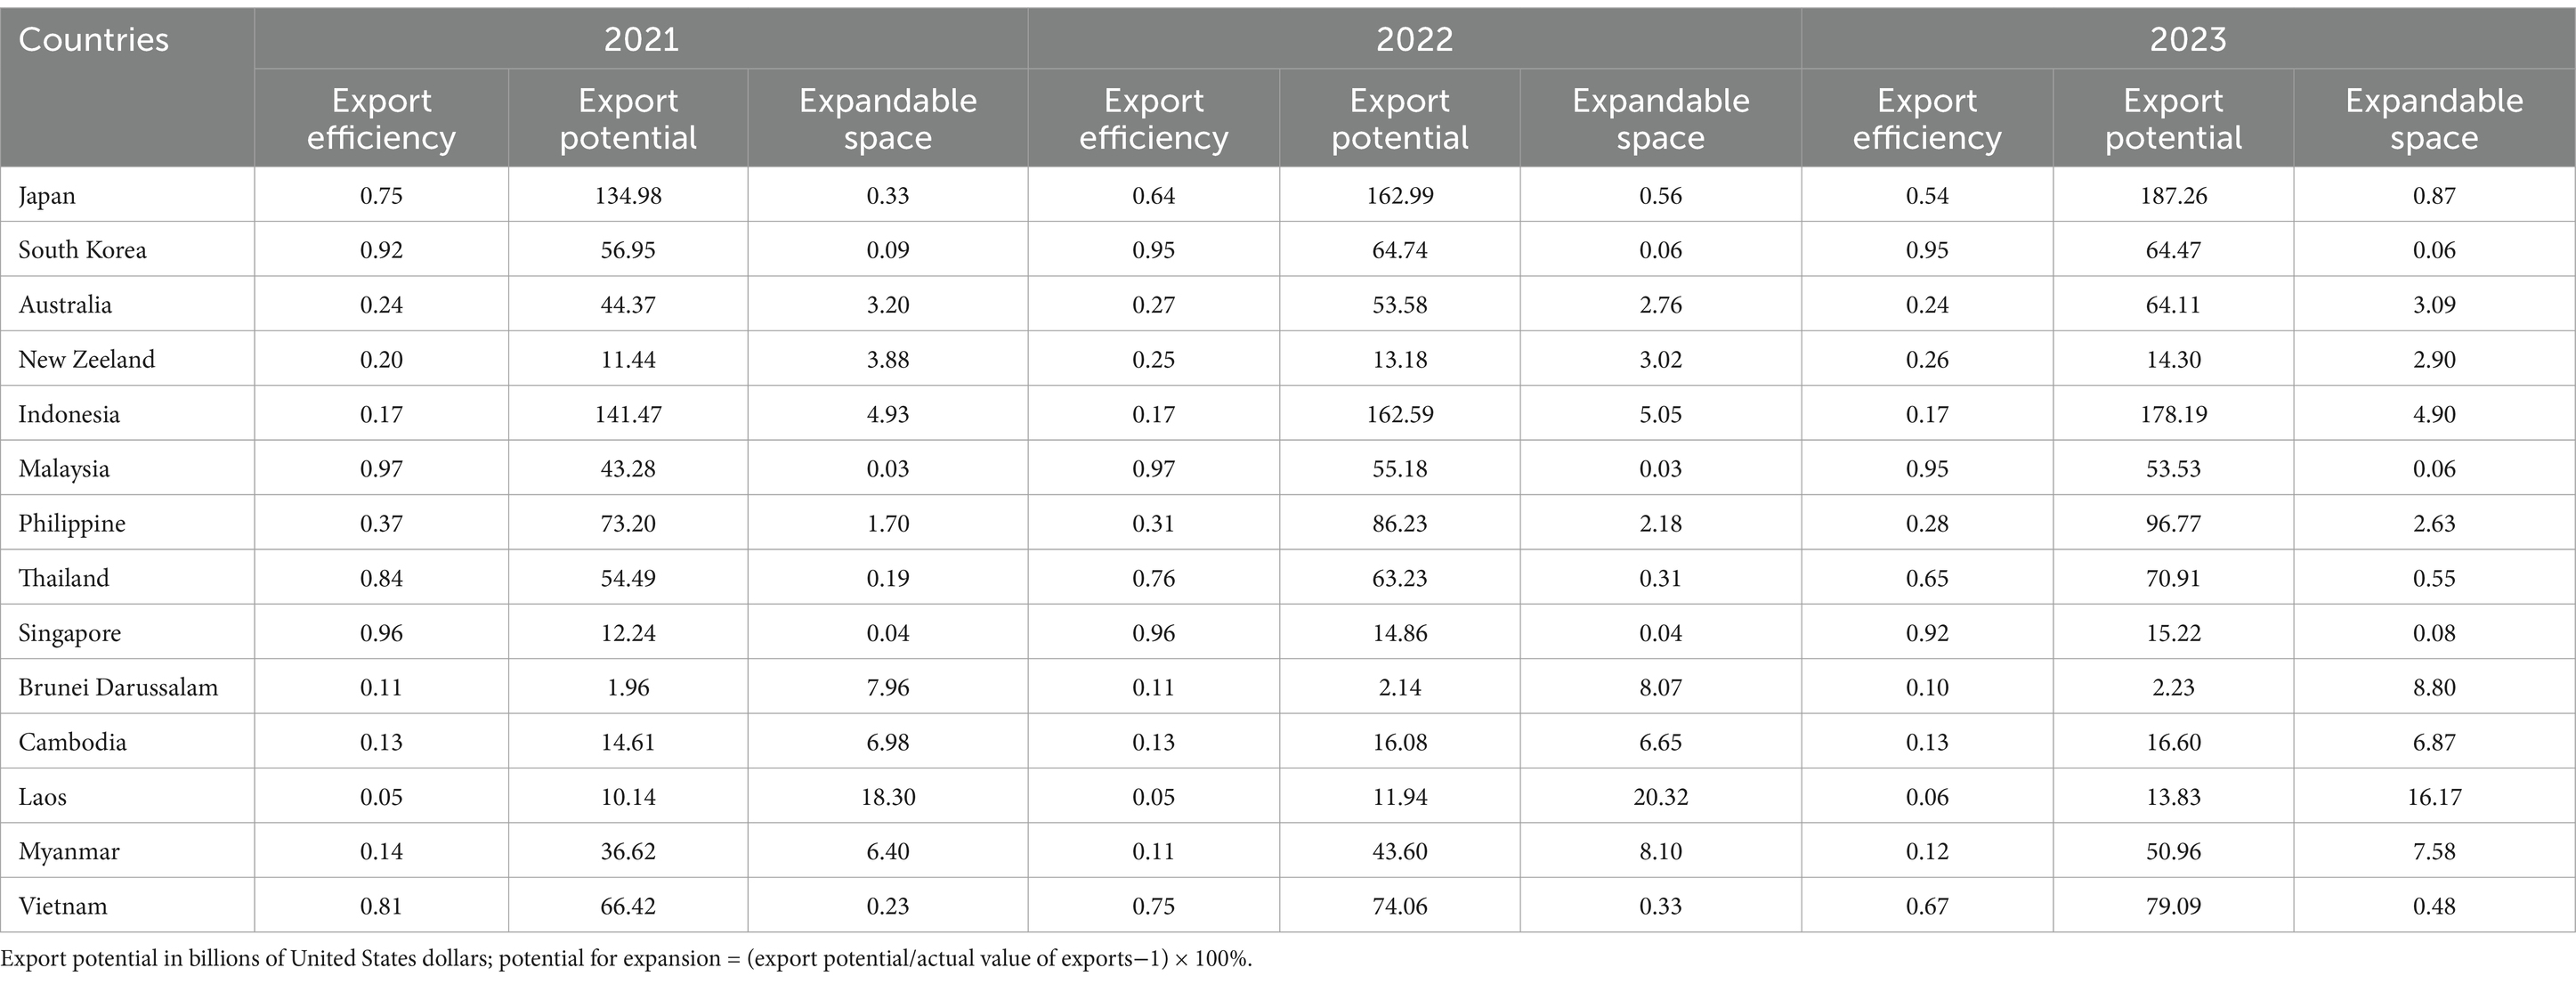
Table 9. Trade efficiency, potential and room for expansion of China’s agricultural exports to RCEP member countries, 2009–2023.
Sheng and Yunxin (2024) categorize export efficiency into four types of markets: Saturated (0.9 to 1.0), Expansion (0.6 to 0.9), Development (0.3 to 0.6), and Iceberg (0 to 0.3). According to the table, South Korea, Malaysia, and Singapore are Saturated markets where China‘s agricultural product exports are already quite mature, and it should further optimize the export structure of agricultural products and enhance their high added value. Thailand and Vietnam are Expansion markets, where China should expand investment in capital, technology, and management on the basis of a certain scale of agricultural product exports to promote market maturation. Australia, New Zealand, Indonesia, the Philippines, Brunei, Cambodia, Laos, and Myanmar are Iceberg markets. China‘s agricultural product export trade to these countries is yet to be developed and faces significant artificial resistance, and it should focus on encouraging trade liberalization and advocating for the elimination of trade barriers.
In terms of potential, over the past three years, the export potential of China to RCEP member countries has been continuously increasing. Individually, there are significant differences in the export potential of agricultural products to RCEP member countries. In 2023, the export potential to Japan is 187.26, while for Brunei it is 2.23, a difference of 84 times. This may be due to the large gap in economic development level and trade policies between the two countries. Among them, Japan, Indonesia, and the Philippines have tremendous export potential. As for the expandable space, China should pay special attention to agricultural trade with countries such as Cambodia, Myanmar, Laos, and Brunei, focusing on removing artificial trade barriers. It is necessary not only to focus on the current trade situation but also to take a long-term perspective and actively explore markets with a large potential for trade expansion.
6 Conclusion and policy implications
6.1 Conclusion
This study, employing the Stochastic Frontier Gravity Model, systematically examines China’s agricultural exports to RCEP countries through three key dimensions. First, it analyzes the export patterns of Chinese agricultural products within the region. Second, it explores the determinants influencing these exports. Finally, it evaluates the efficiency, potential, and expansion capacity of China’s agricultural trade with RCEP member states.
The study yields the following key findings:
Export Patterns: China’s agricultural exports to RCEP countries constitute a substantial share of its total agricultural trade, accounting for 42.15% of overall exports. Between 2009 and 2023, the average annual export growth rate reached 6.81%, reflecting consistent and stable expansion with a positive long-term outlook. Japan, South Korea, and Vietnam emerged as China’s top three export markets, capturing 4.37, 6.55, and 5.25% of the market share, respectively. In contrast, Cambodia, Laos, and Brunei registered the lowest market shares, at 0.11, 0.05, and 0.02%, respectively, highlighting significant disparities in regional demand. Notably, while China’s market share in Japan and South Korea—two critical agricultural import destinations—has been declining, other RCEP countries have exhibited gradual increases, indicating shifts in the competitive landscape. The leading category of agricultural exports consists of food, beverages, alcohol, vinegar, tobacco, and related products, whereas the least exported category includes silk, wool, cotton, and hemp products. Furthermore, the complementarity between China’s agricultural exports and RCEP countries’ agricultural imports has been declining, suggesting a diminishing alignment between supply and market demand.
Determinants of Agricultural Exports: The analysis identifies China’s GDP as a significant and positive factor driving agricultural exports to RCEP nations. However, this impact is more pronounced for developing countries than for developed ones. China’s total population exerts a negative effect, whereas the total population of importing countries has a positive impact on agricultural trade. Meanwhile, variables such as distance, shared borders, and economic freedom do not exhibit statistically significant effects. The tariff coefficient is notably positive, indicating that higher tariffs impede China’s agricultural exports. Conversely, the coefficients for the Liner Shipping Connectivity Index, government efficiency, and monetary freedom are negative, implying that enhancements in these factors contribute positively to export performance. Additionally, government stability positively influences exports, whereas free trade agreements, investment freedom, and trade freedom demonstrate insignificant effects, suggesting that these elements do not serve as major constraints on China’s agricultural trade with RCEP countries.
Export Potential and Expansion Capacity: The study classifies RCEP markets into three categories based on their saturation and growth potential. South Korea, Malaysia, and Singapore are identified as saturated markets, exhibiting limited room for further expansion. Thailand and Vietnam are categorized as expansion markets, where growth opportunities remain. Meanwhile, Australia, New Zealand, Indonesia, the Philippines, Brunei, Cambodia, Laos, and Myanmar are designated as iceberg markets, representing untapped or underdeveloped trade opportunities. The export potential of China’s agricultural products within the RCEP region has been steadily increasing, with Japan displaying the highest potential and Brunei the lowest. To optimize trade expansion, China should prioritize agricultural trade partnerships with Cambodia, Myanmar, Laos, and Brunei, where opportunities for growth remain substantial.
These findings offer critical insights for policymakers and stakeholders seeking to enhance China’s agricultural trade strategy within the RCEP framework.
6.2 Policy implications
Based on the findings of this study, the following policy recommendations are proposed: First, optimize the export structure and enhance the competitiveness of agricultural exports. Following the implementation of the RCEP agreement, tariff reductions have promoted mutual market openness among member countries, while lower export costs have intensified agricultural competition. China should actively adjust its agricultural export structure by increasing the share of high-value-added and high-tech products. Enterprises should focus on technological innovation and talent development to improve the quality of agricultural products and enhance processing technologies. Meanwhile, the government should increase financial support, introduce preferential policies, reduce export costs, and strengthen core competitiveness to build international competitive advantages.
Second, consider national differences within the RCEP and expand regional agricultural cooperation. China should adopt a strategic, region-specific approach by recognizing variations in geography, market demand, and tariff levels among RCEP member countries. Strengthening political consultation and policy trust, improving infrastructure cooperation, and formulating targeted trade and investment strategies will help meet the diverse needs of different markets. For countries such as Laos and Myanmar, which have high export potential and expansion capacity, both the government and enterprises should intensify market development efforts and promote deeper, broader regional agricultural cooperation.
Third, improve information exchange platforms and develop innovative marketing models. Information plays a crucial role in facilitating trade. China should establish and enhance modernized information exchange platforms to strengthen communication on agricultural trade with RCEP member countries. Keeping up to date with policies on the origin of goods will allow timely adjustments to import and export decisions. Leveraging emerging digital technologies such as big data and the Internet of Things (IoT), alongside cross-border e-commerce and live-streaming sales platforms, can accelerate the digital transformation of agricultural exports, enabling more precise and intelligent services for diverse market needs.
Fourth, fully implement the RCEP agreement and improve risk prevention mechanisms. China should comprehensively implement all aspects of the RCEP agreement, capitalize on its benefits, and actively disseminate preferential policies to major agricultural enterprises. Simplifying tariff exemption procedures and reducing export costs are essential. Additionally, a realistic evaluation of the current status and prospects of China’s agricultural exports should be conducted, ensuring readiness for potential risks. Recognizing the long-term and objective nature of these challenges, China should establish risk response mechanisms in collaboration with relevant countries to effectively address various risks and uncertainties in a timely manner.
Data availability statement
The datasets presented in this article are not readily available because we will upload later. Requests to access the datasets should be directed to aGFzaG1pc2hhYmJpckAxNjMuY29t.
Author contributions
LS: Formal analysis, Funding acquisition, Writing – original draft. SZ: Data curation, Writing – original draft. SH: Investigation, Writing – review & editing.
Funding
The author(s) declare that financial support was received for the research and/or publication of this article. This research has been supported by National Statistical Science Research (project no. 2023LY056); Philosophy and Social Science Research in Colleges and Universities in Jiangsu Province (project no. 2024SJYB1459). This research is funded by the Suzhou City University (project no. 5010714424).
Conflict of interest
The authors declare that the research was conducted in the absence of any commercial or financial relationships that could be construed as a potential conflict of interest.
Publisher’s note
All claims expressed in this article are solely those of the authors and do not necessarily represent those of their affiliated organizations, or those of the publisher, the editors and the reviewers. Any product that may be evaluated in this article, or claim that may be made by its manufacturer, is not guaranteed or endorsed by the publisher.
References
Aigner, D. J., Lovell, K. C. A., and Schmidt, P. (1977). Formulation and estimation of stochastic frontier production function models. J. Econ. 6, 21–37. doi: 10.1016/0304-4076(77)90052-5
Bian, J. (2019). Research on the changes in the international agricultural trade pattern and response strategies. Macroecon. Res. 4, 116–129.
Cao, L., Zhi, Y., and Tan, Z. (2022). Impact of intermediate goods tariff reduction in the China-ASEAN free trade area on China’s agricultural high-quality development. Macroecon. Res. 1, 74–90.
Chevassus-Lozza, E., Latouche, K., Majkovič, D., and Unguru, M. (2008). The importance of EU-15 borders for CEECs Agri-food exports: the role of tariffs and non-tariff measures in the pre-accession period. Food Policy 33, 595–606. doi: 10.1016/j.foodpol.2008.07.005
Dong, S. (2024). Opportunities, challenges, and path choices for China’s agricultural international cooperation under the RCEP background. Agric. Econ. 4, 127–129.
Fan, Z., Peng, S., and Hu, W. (2023). How does the regional comprehensive economic partnership affect the restructuring of global value chains? Chin. World. Econ. 31, 140–172. doi: 10.1111/cwe.12488
Farrell, M. J. (1957). The measurement of productive efficiency. J. R. Stat. Soc. 120, 253–290. doi: 10.2307/2343100
Ghosh, S., and Yamarik, S. (2004). Are regional trading arrangements trade creating?: an application of extreme bounds analysis. J. Int. Econ. 63, 369–395. doi: 10.1016/s0022-1996(03)00058-8
Gross, L., and Friedmann, W. (1964). Shaping the world economy: suggestions for an international economic policy. Am. J. Int. Law 58, 546–547. doi: 10.2307/2196248
Han, J., Jia, M., and Yu, Z. (2024). Trade cooperation and industrial transfer under the RCEP framework. Econ. Dyn. 7, 38–56.
Li, C., and Li, D. (2021). When regional comprehensive economic partnership agreement (RCEP) meets comprehensive and progressive trans-Pacific partnership agreement (CPTPP): considering the “spaghetti bowl” effect. Emerg. Mark. Financ. Trade 58, 1988–2003. doi: 10.1080/1540496x.2021.1949284
Li, W., and Yang, F. (2019). Factors influencing China’s agricultural exports to countries along the silk road Economic Belt and trade efficiency—an analysis based on the stochastic frontier gravity model. Int. Trade Iss. 7, 100–112.
Liu, H. (2020). Strategic thinking and measures for accelerating China’s transformation from an agricultural power to an agricultural strong nation. China Agric. Res. Reg. Plan. 41, 7–11.
Liu, Y., and Dong, Y. (2024). The impact of agricultural digital economy on the sustainable development of China’s agricultural product exports. Price Monthly. 11, 67–80.
Luckstead, J. (2024). Globalisation and Agri-food trade. Eur. Rev. Agric. Econ. 51, 32–53. doi: 10.1093/erae/jbad038
Lv, Y., and Mengyuan, W. (2024). Regional value chain construction and possible paths under the RCEP framework. Financial and Trade Research. 35, 54–65.
Ma, L., Qi, G., and Liang, M. (2024). Promoting the construction of a trade power through high-level opening-up: internal logic, empowering channels, and practical pathways. Int. Trade 8, 17–26+96.
Masood, S., Khurshid, N., Haider, M., Khurshid, J., and Khokhar, A. M. (2022). Trade potential of Pakistan with the south Asian countries: a gravity model approach. Asia Pac. Manag. Rev. 28, 45–51. doi: 10.1016/j.apmrv.2022.02.001
Meeusen, W., and Van Den Broeck, J. (1977). Efficiency estimation from cobb-Douglas production functions with composed error. Int. Econ. Rev. 18, 435–444. doi: 10.2307/2525757
Mizik, T., Szerletics, Á., and Jámbor, A. (2020). Agri-food export competitiveness of the ASEAN countries. Sustain. For. 12:9860. doi: 10.3390/su12239860
Muhamad, R. K., Zainuddin, V., Sarmidi, T., and Khalid, N. (2020). Sustainable production, non-tariff measures, and trade performance in RCEP countries. Sustain. For. 12:9969. doi: 10.3390/su12239969
Narayan, S., and Bhattacharya, P. (2019). Relative export competitiveness of agricultural commodities and its determinants: some evidence from India. World Dev. 117, 29–47. doi: 10.1016/j.worlddev.2018.12.013
Panagariya, A., and Duttagupta, R. (2002). Politics of free trade areas: tariffs versus quotas. J. Int. Econ. 58, 413–427. doi: 10.1016/s0022-1996(01)00173-8
Poyhonen, P. (1963). A tentative model for the volume of trade between countries. Weltwirtschaftliches Arc. 90, 93–100.
Qi, L., and Xi, L. (2023). Unveiling the trade and welfare effects of regional services trade agreements: a structural gravity approach. Econ. Model. 127:106426. doi: 10.1016/j.econmod.2023.106426
Sharkasi, N., Chau, N. V. H., and Rajasekera, J. (2023). Export potential analysis of Vietnamese bottled coconut water by incorporating criteria weights of MCDM into the gravity of trade model. Sustain. For. 15:11780. doi: 10.3390/su151511780
Sheng, X., and Yunxin, L. (2024). Analysis of agricultural trade co-operation dynamics between China and RCEP member countries—Re-examination based on social network perspective : Price Monthly, 1–16.
Tai, Y., and Li, H. (2022). Study on the export effects of bilateral free trade agreements on China’s agricultural products. Northern Horticulture. 18, 140–149.
Tong, G., Hong, R., and Shi, L. (2023). The growth effect and its influencing factors: empirical evidence regarding China’s fruit and vegetable exports to RCEP countries. Agriculture 13:1908. doi: 10.3390/agriculture13101908
We, X., and Zhang, Y. (2021). RCEP and the expansion of agricultural product trade and efficiency enhancement. World Agriculture. 10, 70–80+127-128.
Xiao, Y., and Abula, B. (2023). Examining the impact of digital economy on agricultural trade efficiency in RCEP region: a perspective based on spatial spillover effects. J. Knowl. Econ. 15, 9907–9934. doi: 10.1007/s13132-023-01484-6
Xu, S., Zhang, H., and Qian, J. (2024). Analysis of the network characteristics and influencing factors of agricultural trade in the RCEP region. J. Nat. Resour. 9, 2206–2223.
Zhang, M. (2024). Building an agricultural strong nation in the process of Chinese-style modernization: strategic connotations, practical layout, and policy system. Rural Econ. 8, 9–17.
Keywords: agricultural trade, export patterns, export potential, trade efficiency RCEP, agricultural products, export pattern
Citation: Shi L, Zhang S and Hashmi SM (2025) Study on the export pattern and export potential of agricultural products from China to RCEP countries—an empirical study based on gravity model. Front. Sustain. Food Syst. 9:1492812. doi: 10.3389/fsufs.2025.1492812
Edited by:
Jianxu Liu, Shandong University of Finance and Economics, ChinaReviewed by:
Shashika Rathnayaka, University of Aberdeen, United KingdomSushil Mohan, University of Brighton, United Kingdom
Copyright © 2025 Shi, Zhang and Hashmi. This is an open-access article distributed under the terms of the Creative Commons Attribution License (CC BY). The use, distribution or reproduction in other forums is permitted, provided the original author(s) and the copyright owner(s) are credited and that the original publication in this journal is cited, in accordance with accepted academic practice. No use, distribution or reproduction is permitted which does not comply with these terms.
*Correspondence: Shabir Mohsin Hashmi, c21oYXNobWlAc3pjdS5lZHUuY24=