 Chuanjian Li1
 Jianxu Liu
 Yameng Wang
- 1College of Economics, Qufu Normal University, Rizhao, China
- 2College of Economics, Shandong University of Finance and Economics, Jinan, China
China faces severe water scarcity, with water resources unevenly distributed across country-abundant in the south, and to better understand the degree of decoupling between China’s economic development and the water resource utilization, this study uses panel data from prefecture-level cities between 2010 and 2019 to examine the degree of decoupling between economic growth and the ecological footprint of water resources, providing a more comprehensive description of water resource consumption. The findings show the following: (1) The number of cities achieving strong decoupling is still relatively small, and the share of cities experiencing weak decoupling is also limited, indicating that most cities’ economic growth still heavily depends on water resources. (2) A comparison of decoupling levels across different river basins in China shows that water resource utilization efficiency remains low, with an acute conflict between economic growth and water resources. In addition, the ecological footprint of both agricultural and industrial water use continues to grow, highlighting the urgent need to improve water resource utilization efficiency. (3) An analysis based on the decoupling catch-up index model shows that most less-developed cities have been unable to achieve a win–win situation in their pursuit of economic growth and improvements in water resource utilization efficiency. Moreover, the gap in per capita GDP between most less-developed cities and developed cities is increasingly widening. This study offers valuable theoretical support and practical guidance for enhancing the sustainable use of water resources and fostering the coordinated development of regional economies. In addition, its findings have broad application prospect in advancing water resource management tailored to local conditions.
1 Introduction
Water resources are vital for human survival, acting as both a fundamental natural resource and a strategic economic resource that constrains the level of economic and social development (Desbureaux and Rodella, 2019). Water scarcity is primarily driven by the overexploitation of water resources, pollution, and the growing demand driven by economic development (Divakar et al., 2011; Roozbahani et al., 2015). As the economy rapidly develops, water consumption continues to rise, and the issue of water scarcity exacerbated by economic growth has become a major focal point in academic research (Gai et al., 2013). Currently, China faces a critical water scarcity issue. In 2020, the per capita water resources in China were 2238.13 m3, which is only a quarter of the global average. The per capita water resources in regions such as Beijing, Tianjin, Hebei, Shanxi, Shanghai, Shandong, Henan, and Ningxia are below 500 m3, far below the threshold for severe water scarcity. Furthermore, the distribution of water resources in China exhibits considerable regional variation (Sun et al., 2017). According to the 2020 China Water Resources Bulletin, the total water resources in the six northern regions amounted to 664.5 billion cubic meters, while the total water resources in the four southern regions reached 2496.02 billion cubic meters. This disparity in the distribution of water resources has, to some extent, contributed to the regional development gap (Babuna et al., 2020). On a global scale, as the world’s population grows and the economy develops, the issue of water scarcity has become increasingly prominent. High-income countries generally exhibit higher water utilization efficiency. According to data from the article “A Comparative Analysis of Water Use Efficiency Levels in China and Abroad,” published by the Development Research Center of the Ministry of Water Resources in 2022, the average water utilization per ten thousand yuan of GDP in high-income countries is 26.3 cubic meters, whereas in middle- and low-income countries, the figure is as high as 424.3 cubic meters. This indicates that economic development is closely linked to water resource utilization, not only in China but also in various regions around the world.1 Therefore, “resolving the contradiction between the allocation of water resources and the needs of economic and social development is a major strategic issue in the new stage of development.”2
In existing studies on the relationship between water resources and economic development, some research focuses on the current state of water resources in China, offering qualitative analyses of water security issues and their constraints on the country’s social and economic development. Other scholars study whether the distribution of water resources matches with elements of economic development, analyzing the relationship between the two. For instance, coupling analyses of water resources and economic development have been conducted to explore whether these factors are developing in a coordinated manner (Yao et al., 2023). Currently, the inequality of water resources and the spatial mismatch between water resources and other elements are increasingly discussed at various levels, ranging from grid, prefectural, and basin levels to the national level (Long et al., 2003; Liu and Jia, 2019; Cole et al., 2017). In China, regional studies focusing on water resource balance have primarily concentrated in the northern arid and semi-arid regions (Ma et al., 2020; Malakar and Mishra, 2018). Existing studies have extensively explored the mismatch issue from different perspectives, including physical water (Wang et al., 2012), virtual water (Lou et al., 2023), and the water nexus. Regarding research methodology, the Lorenz curve and Gini coefficient are commonly used to represent the correlation ratio between matched objects. These methods are widely adopted due to their simplicity in calculation and clear physical meaning. In addition, the Gini coefficient based on the Lorenz curve also enables comparative analysis between different countries or regions (Li et al., 2022; Yang et al., 2022).
Most studies assess the carrying capacity of regional water resources to illustrate the maximum capacity of these resources to support social and economic development. They then analyze whether the current water resources are in alignment with the needs of social and economic development (Wiemer and Daniele, 2015). The concept of water resources carrying capacity was first introduced in the 1970s. During this period, the United Nations Educational, Scientific and Cultural Organization (UNESCO) and the Organization for Economic Cooperation and Development (OECD) conducted research on natural resources—land, water, and forests—in resource-scarce regions, focusing on their carrying capacity and potential for sustainable development. It was in the course of this research that the concept of water resources carrying capacity was initially proposed (Jia and Wang, 2023). As scholars worldwide have delved deeper into the study of water resources carrying capacity, the related concepts and research methods have been significantly expanded. Currently, the concept is typically divided into two types: The first refers to the maximum capacity of water resources to support regional economic and social development (Yang et al., 2021), while the second focuses on the overall coordination of economic, social, and environmental systems within the framework of water resources (Wu et al., 2022).
In recent years, analyses of the decoupling of water resources from social and economic development have been relatively scarce. However, decoupling analyses have gained widespread application (Melek et al., 2023; Fotia and Tsirogiannis, 2023). Three main methods are currently commonly used for this analysis. The first is the decoupling index model, proposed by the Organization for Economic Co-operation and Development (OECD) (OECD, 2003). OECD conducted quantitative studies on the relationship between economic development and water resource utilization/environmental pressure, proposing models to determine relative and absolute decoupling. The second method is comprehensive decoupling analysis based on variation (Toma et al., 2016; Vehmas et al., 2007). This method, which studies the decoupling relationship between GDP development and material consumption in 15 European Union (EU) member countries, divides the decoupling relationship into six categories. The third method is the decoupling elasticity method, proposed by Tapio (2005). Tapio used this method to analyze the relationship between GDP, transportation volume, and carbon dioxide (CO2) emissions in European transportation from 1970 to 2001, categorizing the decoupling relationship into eight types. With the continuous development of decoupling theories and methods, research on decoupling has been growing worldwide (Wang and Chen, 2015; Conrad and Cassar, 2014; Wei, 2014; Schandl et al., 2016; Lamastra et al., 2017; Naqvi and Zwickl, 2017; Wang and Li, 2016). In a United Nations Environment Programme (UNEP) Information Resource Planning (IRP) Report, Urama et al. (2016) noted the emergence of relative decoupling between economic growth and water resources.
However, most of these studies are conducted from a single perspective of water resource utilization or water pollution that analyze the decoupling relationship between the two. For example, the water footprint is calculated based on the total volume of water resources consumed by local consumption in Hubei Province, with a decoupling evaluation model developed to assess the relationship between water resource consumption and social and economic development (Xia and Zhu, 2002). Alternatively, some studies adopt a comprehensive approach, considering both water resource utilization and the degree of water pollution, but limit their analysis to decoupling at the regional level. For instance, assessed the level of decoupling between water resources and economic development by evaluating the ecological footprint of water resources from both the quantity and quality perspectives. The findings suggest that the limited availability of water resources in karst areas significantly constrains the transformation of industrial structure, resulting in a contradiction between water resources and social-economic development. Therefore, this study focuses on whether there is coordination between water resource utilization and economic development in Guiyang City, contributing to the understanding of water resources and economic development in regions with complex terrain (Ane and Li, 2014).
Compared to existing literature, the marginal contributions of this study are as follows: First, based on the perspective of the water resource ecological footprint, this study quantitatively analyzes the decoupling relationship between economic development and water resources across different regions, providing data support for accurately understanding the extent of urban economic dependence on water resources in China. Second, the water resource ecological footprint calculated in this study includes both the water quantity ecological footprint and the water quality ecological footprint, offering a more comprehensive description of water resource consumption. Third, by constructing a decoupling catch-up index model, this study quantitatively analyzes the changes in local water resource consumption when less-developed regions approach developed regions, providing empirical evidence for context-specific water governance strategies.
2 Theoretical analyses of the decoupling of economic development and water resources
There are significant regional differences in the degree of decoupling between economic development and water resources (Liu et al., 2020). In some areas, water resource utilization is more efficient, and economic development is less dependent on water resources. In these regions, there is strong decoupling between economic development and water resources, meaning that local economic growth is not achieved at the cost of water consumption. By 2019, the number of cities with strong decoupling between economic development and water resources had significantly increased. Most of these cities are located in southeastern China, with a few in the northern regions. The reasons for the strong decoupling between urban economic development and water resources are as follows: (1) Continuous population growth has led to a reduction in per capita water resources, thereby increasing water scarcity. This has raised awareness about the importance of water resource protection and efficient utilization, which has contributed to promoting water efficiency and reducing the dependency of economic development on water resources (Wu et al., 2022). (2) Due to more rational industrial restructuring, the number of high-water-consuming, high-polluting enterprises in the secondary sector has decreased. Meanwhile, the proportion of the tertiary sector, which consumes less water and has higher water utilization efficiency, has gradually increased, further reducing the dependence of economic development on water resources. (3) The level of regional economic development also determines local water resource utilization efficiency. Generally, the higher the level of regional economic development, the greater the capacity to conduct scientific research or adopt advanced technologies. This leads to improvements in water-saving technologies and water pollution control capabilities, which help mitigate the conflict between regional economic development and water resources (Hanna and Oliva, 2015).
Compared to strong decoupling, weak decoupling indicates that the amount of water resources consumed for regional economic development has decreased, though there remains continued dependence on water resources. From 2011 to 2019, the number of cities exhibiting weak decoupling showed a fluctuating growth trend; however, the number of cities achieving weak decoupling has remained relatively low. As water resource issues in China have become increasingly severe, a series of policies addressing these problems have been introduced to alleviate the imbalances between water supply and demand, tackle growing water shortages, inefficient usage, water pollution, and ecosystem deterioration, and ultimately promote the efficient use and protection of water resources (Wang and Li, 2018).3 With the ongoing strengthening of water resource management, enterprises that were once high-water-consuming and high-polluting have been compelled to improve water use efficiency and enhance end-of-pipe pollution control. Furthermore, some high-water-consuming, high-polluting industries have exited the market, leading to improved water resource efficiency and reduced water pollution. This has, in turn, mitigated the constraints water resources impose on regional development, enabling the weak decoupling of regional economic development from water resource consumption (Raihan, 2023).
However, in some regions, although economic growth has been achieved, the dependence on water resources is excessively high, and the amount of water resources consumed is too large, resulting in an expansive negative decoupling relationship between regional economic development and water resources. For example, Guai and Lingyan (2017) employed the CCR model to analyze China’s water resource utilization efficiency. The study found that regions such as Sichuan, Hubei, and Hunan consume excessive amounts of water resources while achieving economic growth. It also revealed that the structure of water use across sectors—such as agriculture, industry, and domestic use—negatively affects water resource utilization efficiency to some extent (Su et al., 2024). From an industrial structure perspective, some regions face water scarcity and are characterized by heavy chemical industries. The high-water-consumption and high-pollution industrial pattern worsens the conflict between economic development and water resources, forcing economic growth at the cost of water resources, leading to a negative decoupling between economic development and water resources (Guai and Lingyan, 2017). In addition, local governments, prioritizing economic growth, have relaxed water resource regulations, promoting high-water-consuming, high-polluting industries. Some of these enterprises, having exited regions with stricter regulations, have moved into these areas, further intensifying the conflict between economic development and water resources and increasing dependence on water resources (Sun et al., 2024).
In some regions, although there is no sharp conflict between economic development and water resources, water consumption decreases while the economy experiences negative growth. This suggests a weak negative decoupling or recessionary decoupling between economic development and water resources. On the one hand, although some regions are rich in water resources, they have insufficient investment in water infrastructure, leading to low levels of water resource development and utilization, as well as relatively low economic returns from water use (Dehui et al., 2022). On the other hand, in some regions, economic development was heavily reliant on water resources before the implementation of water resource regulations. Although water consumption has decreased following the imposition of these regulations, the local economy has experienced negative growth. This is due to the inability of these regions to adapt to the current low-water-consumption economic model, indicating that their dependence on water resources remains relatively high (Yao et al., 2020). In a few other regions, the conflict between economic development and water resources is particularly severe. Specifically, these regions consume vast amounts of water resources while experiencing negative economic growth. This indicates that the local economy is highly dependent on water resources, resulting in a strong negative decoupling between economic development and water resources (Qunxi et al., 2021).
3 Research technique
3.1 Decoupling index calculation
The Tapio elasticity index provides a quantitative measure of the degree of decoupling between economic development and water resource utilization. This approach helps decision-makers understand the impact of economic activities on water pressure and evaluate the effectiveness of resource management measures. Compared to other decoupling analysis methods, such as the Kuznets curve or other environmental economic models, the Tapio method can simultaneously account for the influences of both water quantity and water quality. It reflects the degree of decoupling between economic development and water resource utilization through the elasticity index. In this study, the Tapio decoupling analysis model is used to measure the degree of decoupling between economic development and water resources by combining changes in both total water usage and relative water quantity. The ecological footprint of water resources is a method for assessing water resource utilization and regional sustainable development (Qingling et al., 2022). Therefore, this study employs the degree of decoupling between water ecological footprints and economic development levels to assess the spatiotemporal dynamics of water-economy decoupling across China’s regions. Considering that economic development not only consumes water resources but also generates water pollution, this study calculates both the water quantity ecological footprint and the water quality ecological footprint, with reference to relevant literature (Chen et al., 2024). The ecological footprint of water quality is based on the discharge of industrial wastewater as the accounting index. The calculation method for the water resource ecological footprint is based on the approach outlined in “Method for Calculating Water Resource Ecological Footprint” (Antonio et al., 2023). The specific calculation steps are shown in Equations 1–6:
Among them, ECv represents the ecological footprint of water quantity, while ECp represents the ecological footprint of water quality. EC denotes the total water resource ecological footprint, which is the sum of the water quantity ecological footprint (ECv) and the water quality ecological footprint (ECp). In this study, the water quantity ecological footprint (ECv) is further subdivided into the ecological footprints of industrial, agricultural, and residential water use. The total water quantity ecological footprint is calculated by summing these individual components. N refers to the population, AECv represents the per capita water quantity ecological footprint, and Øw is the global equilibrium factor for water resources, set at 5.19 (Tao et al., 2023). TCv refers to water use for industrial, agricultural, and domestic purposes, while APw represents the average water resource production capacity during the specified period. ECp is the water quality ecological footprint, and AECp represents the per capita water quality ecological footprint. TCp refers to the water required for the dilution and purification of pollutants. Ci represents the concentration of the i-th pollutant, which, in this study, is defined as the concentration of industrial wastewater. C0i is the concentration of the i-th pollutant required to meet water quality standards, and in this study, it is equated with the sewage treatment rate. Qi refers to the discharge of substandard industrial wastewater, specifically industrial wastewater that has not undergone sewage treatment.
The Tapio decoupling index for assessing the relationship between the water resource ecological footprint and economic development is calculated as follows:
Tit represents the decoupling elasticity index for city i in year t, with ECit and GDPit denoting the water resource ecological footprint and per capita GDP for city i in year t, respectively. ECi(t−1) and GDPi(t−1) refer to the water resource ecological footprint and per capita GDP for city i in the previous year. When the water resource ecological footprint does not increase in tandem with economic growth, but instead decreases as the economy grows, this is considered decoupling. Based on the calculated Tapio decoupling index, the decoupling relationship between water resources and local economic development can be classified into the following six categories:
1. Expansive Negative Decoupling: Economic growth is achieved, but at the expense of consuming large amounts of water resources (△EC > 0, △GDP > 0, Tit > 1).
2. Weak Decoupling: Economic growth is achieved while water resource consumption decreases (△EC > 0, △GDP > 0, 0 ≤ Tit < 1).
3. Strong Decoupling: Economic growth occurs without reliance on water resources, and water resource utilization efficiency is high (△EC < 0, △GDP > 0, Tit < 0).
4. Recessive Decoupling: Economic growth is negative, but water resource consumption is significantly reduced (△EC < 0, △GDP < 0, Tit > 1).
5. Weak Negative Decoupling: Economic growth is negative, and water resource utilization decreases (△EC < 0, △GDP < 0, 0 ≤ Tit < 1).
6. Strong Negative Decoupling: Economic growth is negative, but water consumption continues to increase, indicating low-water resource utilization efficiency (△EC > 0, △GDP < 0, Tit < 0).
3.2 Calculation of the decoupling catch-up index
The Tapio decoupling index quantifies how water resources change as an economy develops, reflecting changes within a specific region. However, because less-developed regions may seek to catch up with more developed regions (which are economically advanced and exhibit high-water resource efficiency), it is important to assess whether these regions are achieving economic growth at the expense of water resources, or if they are pursuing economic development while simultaneously conserving water resources, thereby achieving a balanced outcome of environmental protection and economic growth.
Building on this premise, this study develops a decoupling catch-up model based on the ecological footprint of water resources and per capita GDP. This model is designed to analyze how water consumption changes in less-developed regions as they catch up with developed regions in terms of per capita GDP. The specific formula of the decoupling catch-up index model is as follows:
where refer to the decoupling catch-up index of i city in year t, indicating the water ecological footprint and per capita GDP of developed regions in year t and year t−1, respectively.
4 Data source and processing
This study uses panel data from 277 prefecture-level cities from 2010 to 2019 as the sample. The data were sourced from the water resource bulletins of various provinces and cities, the China City Statistical Yearbook, the Statistical Yearbook of China Urban Construction, as well as regional statistical yearbooks and bulletins, all of which were manually compiled and calculated. Due to difficulties in obtaining data for Hainan Province and the Tibet Autonomous Region, cities from these regions were excluded from the sample. In addition, because of significant missing data on industrial wastewater discharge in Liaoning, Heilongjiang, and Qinghai provinces, cities from these areas were also excluded. Similarly, Turpan and Hami cities were excluded due to missing industrial wastewater discharge data. For the missing values in the water quantity and water quality ecological footprints, linear interpolation was used to estimate the missing data.
In this study, the per capita GDP of each prefecture-level city is selected as an indicator to measure regional economic development. To eliminate the influence of price factors, the per capita GDP is deflated using 2010 as the base year. The study incorporates industrial, agricultural, and domestic water consumption data from 2010 to 2019 for each city. This study uses the global water balance factor 5.19 calculated by WWF as the global water balance factor Øw. The water yield modulus of each city over the years is used to assess the average water resource productivity APw, based on which the ecological footprints of industrial, agricultural, and domestic water use are calculated. Since data on the discharge concentrations of different water pollutants in each city are difficult to obtain, this study selects the concentration of industrial wastewater discharge as a proxy for pollutant discharge concentration Ci. The choice of industrial wastewater emission concentration as a measure of pollutant concentration does not affect the results. In highly industrialized areas, industrial wastewater is a significant source of pollutants, and its impact on water pollution is substantial. Thus, this proxy is appropriate. The sewage treatment efficiency rate is taken as the standard pollutant concentration C0i, while the concentration of untreated industrial wastewater is used as the pollutant concentration Qi. For the classification of developed and less-developed regions, this study compares the total water resource ecological footprint of prefecture-level cities in 2019, examines whether GDP growth has been achieved, and determines whether strong decoupling between regional economic development and the water resource ecological footprint was realized in 2019. Based on data analysis, Lianyungang, Huzhou, Ningbo, Quzhou, Xiamen, Sanming, Ningde, Luoyang, and Luzhou meet the criteria for developed regions. The water resource ecological footprint and per capita GDP of these nine prefecture-level cities are averaged annually, forming a benchmark group of “high economic development and high-water resource utilization efficiency” developed cities (Table 1).
Table 1. Descriptive statistics.
5 Empirical analysis
To accurately assess the decoupling between economic development and water resources across different regions in China, this study conducts an in-depth analysis of changes in water consumption and their underlying causes from 2010 to 2019. It also examines the evolving decoupling relationship between regional economic development and water resources. Furthermore, this study investigates whether less-developed regions, in the process of learning from and converging toward developed regions, have simultaneously achieved economic growth and improvements in water resource utilization efficiency.
5.1 Analysis of the decoupling between water resource ecological footprint and economic development
5.1.1 Analysis of the ecological footprint of the water quantity in China
Figure 1 illustrates the total water ecological footprint in China from 2010 to 2019, categorized by water use into industrial water ecological footprint, agricultural water ecological footprint, and domestic water ecological footprint. The figure shows that the total water ecological footprint remained at a relatively high level throughout this period, indicating consistently high-water consumption and low-water use efficiency nationwide. Among these categories, agricultural water accounted for the largest share, suggesting that agricultural water use efficiency was particularly low. The reasons for this are 2-fold. First, the development of agricultural mechanization in China has been slow, and the construction of water conservancy facilities has stagnated, leading to significant agricultural water consumption. Second, due to the influence of traditional small-scale farming practices and outdated institutional mechanisms, deep-seated structural contradictions in agricultural development have become increasingly prominent, making agricultural growth highly dependent on resource consumption (Tao et al., 2023). At the same time, China’s industrial water ecological footprint exhibited an overall upward trend, with a particularly significant increase from 2017 to 2019 compared to previous years.
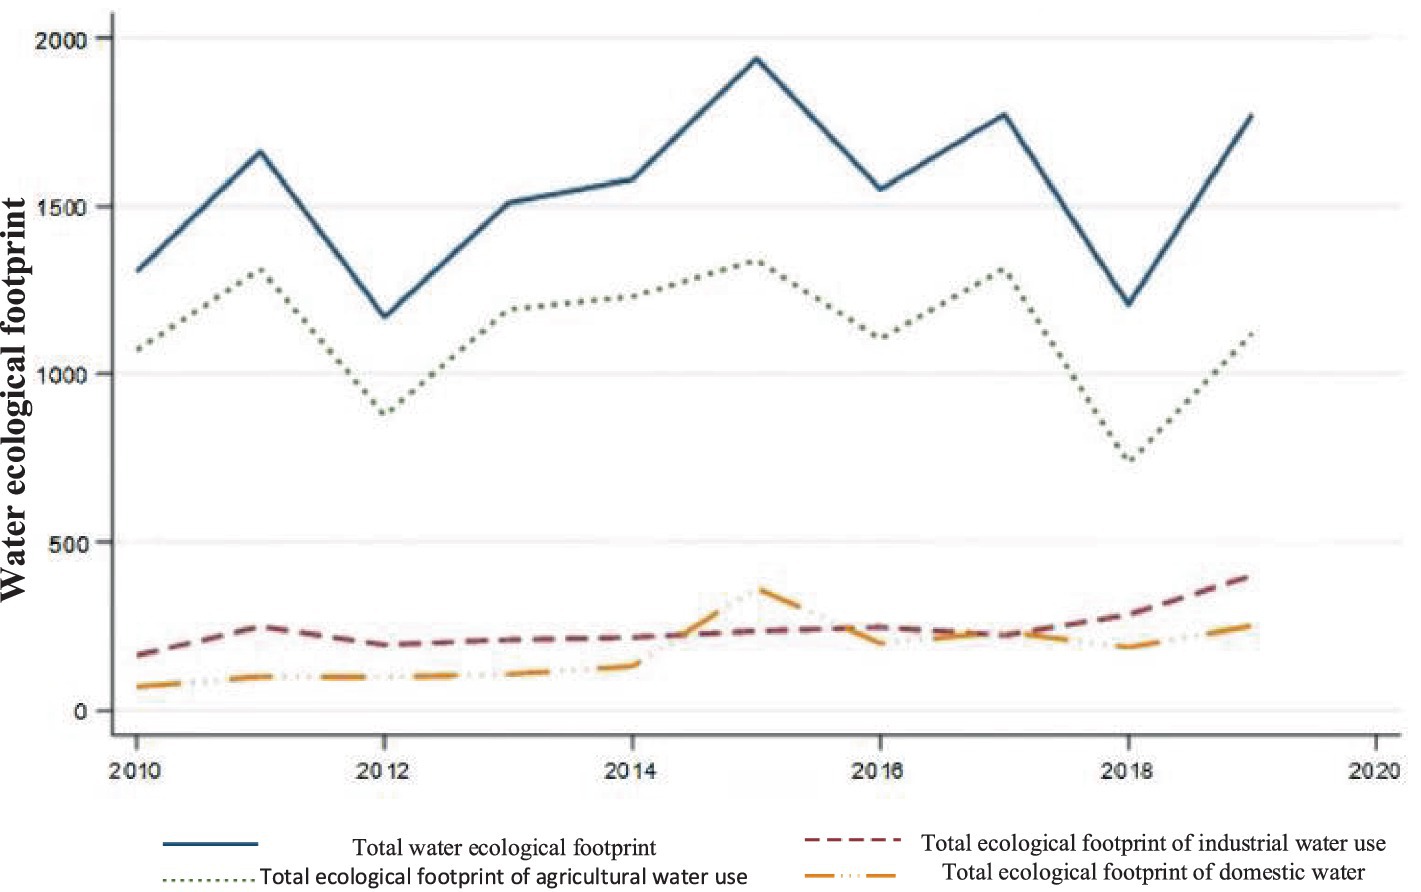
Figure 1. Change of water volume ecological footprint from 2010 to 2019.
Previous studies have shown that in developed countries that once had a strong industrial base, industrial water consumption follows a turning point from rising to declining as the economy develops, forming an inverted “U” shape between industrial water use and economic growth (Wenqi et al., 2023). Meanwhile, China’s industrial water ecological footprint has consistently increased, with industrial water use rising year after year. This indicates that China still needs to focus on further developing industrial water-saving technologies, strengthening industrial water management, and promoting the transformation and upgrading of its industrial structure to improve water use efficiency. Finally, the total ecological footprint of domestic water use in China has also shown a year-on-year increase, with a particularly notable rise between 2014 and 2015. The proportion of agricultural, industrial, and domestic water use can indirectly reflect a country or region’s economic development and level of civilization. A higher share of industrial and domestic water use indicates a more developed economy, greater industrialization, and higher civilization (Ling and Heping, 2010). However, in China, agricultural water use accounts for the largest proportion of total water consumption, while the combined share of industrial and domestic water use remains relatively small. This further suggests that China’s agricultural science and technology are relatively underdeveloped and that innovation and development in agricultural production and irrigation technologies are still needed (Kai, 2017).
5.1.2 Analysis of the degree of decoupling between regional economic growth and water resources
Based on the previous discussion, the three decoupling levels—expansive decoupling, weak decoupling, and strong decoupling—reflect a decreasing degree of economic dependence on water resources. Therefore, this study will discuss the changes and reasons for each prefecture-level city’s position within these three decoupling levels from 2011 to 2019. This study selects three time points—2011, 2015, and 2019—to analyze the Tapio decoupling index for each prefecture-level city, as shown in Figure 2.
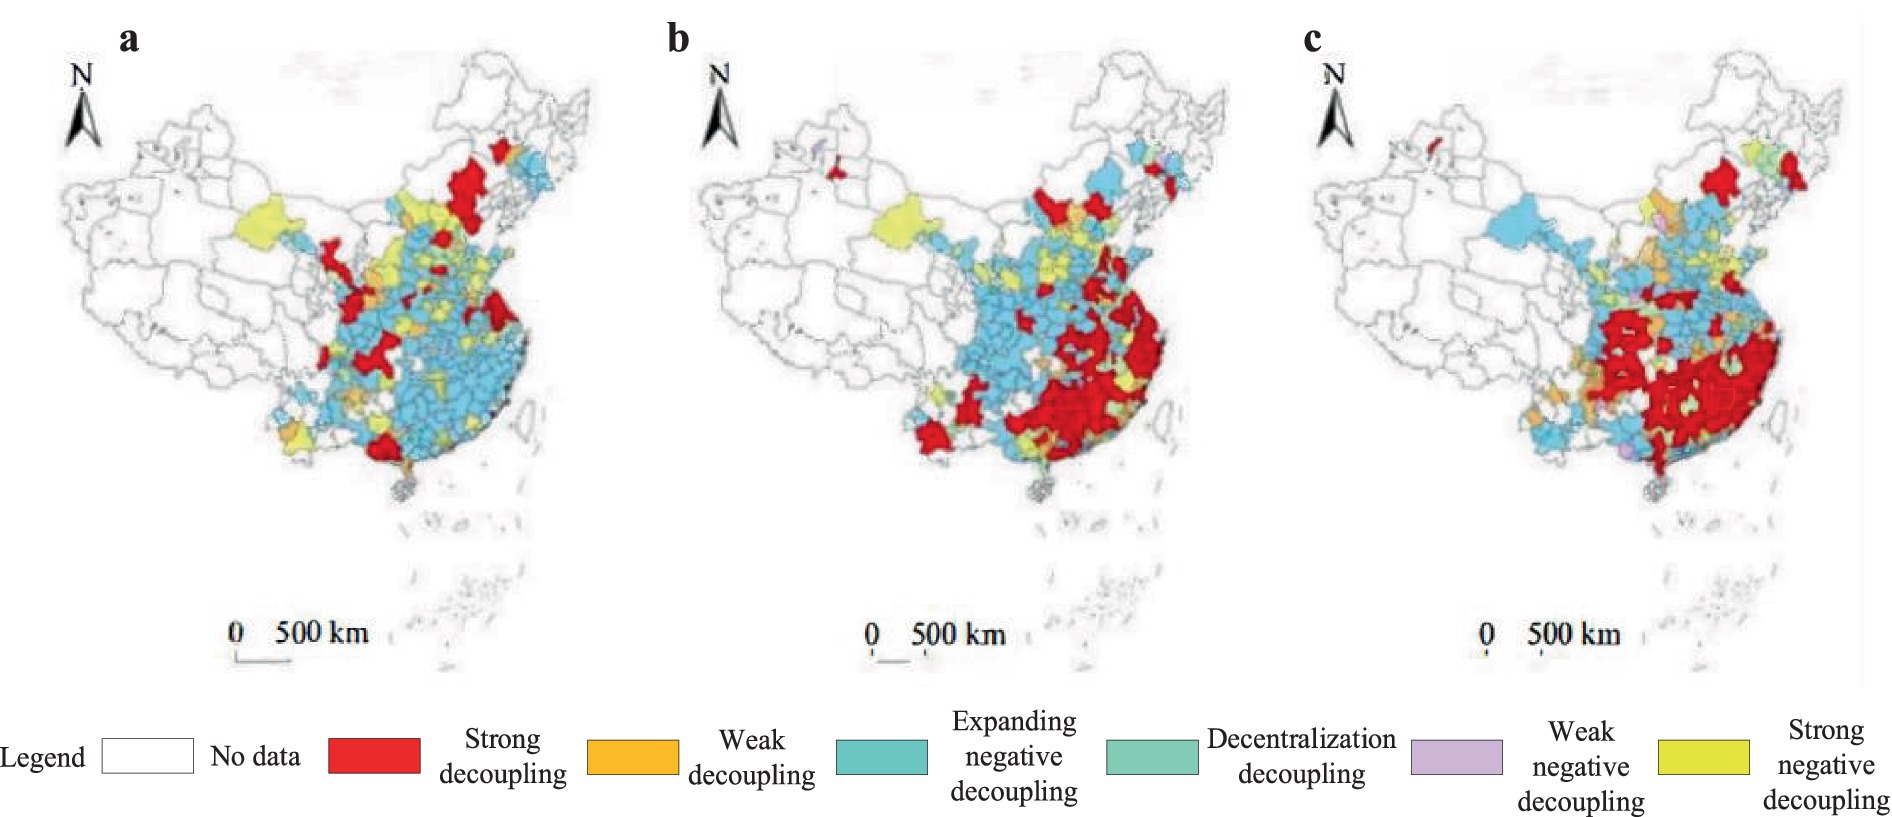
Figure 2. Decoupling of economic development and water resources in 2011, 2015, and 2019. (a) Tapio decoupling in 2011. (b) Tapio decoupling in 2015. (c) Tapio decoupling in 2019.
In 2011, China issued the “Decision of the CPC Central Committee and the State Council on Accelerating Reform and Development of Water Conservancy,” marking the eighth Central No. 1 Document issued by the Central Committee of the CPC and the State Council since the beginning of the new century. In 2015, the Central Committee of the Communist Party of China proposed the formulation of the 13th Five-Year Plan for National Economic and Social Development, which emphasized the “strict implementation of the water resource management system, determining production and urban development based on water availability, and the creation of a water-saving society.” The period from 2015 to 2019 corresponds to the time span from 2011 to 2015. In this study, we selected three time points—2011, 2015, and 2019—to analyze the Tapio decoupling index for each prefecture-level city. The results are presented in Figure 2.
In 2011, a total of 33 prefecture-level cities in China achieved strong decoupling between water resource utilization and regional economic development. Among them, 19 cities were located in the eastern region, accounting for 57.58% of all prefecture-level cities that achieved strong decoupling that year. In contrast, only 5 cities in the central region and 9 cities in the western region reached the same level of decoupling, indicating that water resource utilization efficiency in the eastern region was relatively higher than in the central and western regions. However, these 19 prefecture-level cities in the east accounted for only 19.19% of all prefecture-level cities in the region, suggesting that economic development in most eastern cities was still highly dependent on water resources. In addition, 17 prefecture-level cities experienced weak decoupling between water resource utilization and economic development in 2011. Among them, 5 were located in the eastern region, 4 in the central region, and 8 in the western region.
Although western cities accounted for a relatively large proportion of those that achieved weak decoupling, they still represented only a small share of the total number of prefecture-level cities nationwide. This suggests that the development and utilization of water resources in western China remain relatively limited. Several factors may contribute to this: First, the western region is less economically developed, with a relatively high reliance on the primary sector and an unbalanced industrial structure within the secondary and tertiary sectors. Second, water resource utilization in this region remains inefficient due to extensive water use practices, insufficient investment in water infrastructure, and a lack of emphasis on water resource conservation, all of which have further hindered improvements in water use efficiency (Li et al., 2023). Based on the reasons mentioned above, although some regions in western China exhibited a weak decoupling trend, issues such as water resource wastage and low-water use efficiency remain prevalent. Moreover, in 2011, the number of prefecture-level cities in the western region that achieved weak decoupling between water resources and economic development accounted for only 12.90% of all western cities, while those that achieved strong decoupling made up just 14.52%. This indicates that in most western cities, economic development and local water resources were still in significant conflict, suggesting that the region’s overall economic growth remained highly dependent on water resources. In 2011, a total of 151 prefecture-level cities experienced expansive negative decoupling between water resources and economic development. Among them, 51 cities were in the eastern region, 36 in the western region, and 64 in the central region, with the latter accounting for 65.98% of all prefecture-level cities in central China. Clearly, in 2011, economic development in the central region was more reliant on water resources than in the eastern and western regions, with most of its prefecture-level cities exhibiting expansive negative decoupling. This phenomenon can be attributed to several factors. First, the northern part of the central region is dominated by heavy industries and chemical sectors, where water scarcity is particularly acute. Second, the southern part has a highly developed agricultural sector and hosts several high-water-consuming, high-polluting industries. These factors have led to a sharp conflict between economic development and water resources in central China (Pute et al., 2003).
In 2015, a total of 86 prefecture-level cities achieved strong decoupling, reflecting a 160.61% increase compared to 2011. This suggests that, overall, the efficiency of water resource utilization across the country improved during this period. The likely reason for this improvement is that between 2011 and 2015, the central government introduced a series of water resource management policies to address China’s increasingly severe water issues. These policies, which focused on water conservation planning, the construction of water conservancy projects, and water price regulation, significantly alleviated the conflict between regional economic development and water resource use. They also contributed to a marked improvement in industrial water efficiency, particularly in high-water-use and high-pollution industries. Among the cities that achieved strong decoupling of economic development and water resources, 47 were located in the eastern region, accounting for 47.47% of the total number of prefecture-level cities in the east; 30 were in the central region, accounting for 30.93% of the central region’s total; and 9 were in the western region, which made up just 14.52% of the region’s total. Clearly, the central region saw a significant increase in the number of cities achieving strong decoupling, and nearly half of the prefecture-level cities in the eastern region reached this stage. However, only 12 cities achieved weak decoupling, including 7 in the eastern region, 5 in the central region, and none in the western region.
By comparing the number of prefecture-level cities that achieved weak decoupling in 2015 and 2011, it is evident that in 2015, some cities managed to improve their water utilization efficiency, enabling the decoupling of local economic development from water resources to reach the level of strong decoupling. In total, 112 prefecture-level cities achieved expansive negative decoupling in 2015. Compared to 2011, the number of cities achieving this level of decoupling decreased by 25.83%. Based on the earlier analysis of the number of cities achieving strong decoupling and weak decoupling in 2015, it can be inferred that some cities transitioned from expansive negative decoupling to strong decoupling, which significantly improved water resource utilization efficiency. This transition allowed these cities to advance regional economic development while also ensuring water resource conservation. Among the cities that achieved expansive negative decoupling, 29 were in the eastern region, 35 in the central region, and 48 in the western region. Compared to 2011, the number of cities in the eastern and central regions reaching the expansion-negative decoupling level decreased, while the number of cities in the western region increased by 33.33%. This indicates that the overall improvement in national water resource utilization efficiency was largely driven by the increased efficiency in the eastern and central regions.
In 2019, a total of 83 prefecture-level cities achieved strong decoupling, with 36 in the eastern region, 30 in the central region, and 17 in the western region. Compared to 2015, the number of cities achieving strong decoupling of water resources and regional economic development in 2019 remained relatively stable. However, compared to 2011, the number of cities achieving strong decoupling increased by approximately 151.52%, indicating a general upward trend in the number of cities achieving strong decoupling between 2011 and 2019. The underlying reasons for these changes include, on the one hand, the continuous strengthening of water resource management in China, as evidenced by the implementation of the “strictest water resource management system, with production and urban development determined by water availability and the establishment of a water-saving society.”4 On the other hand, the pace of industrial structure transformation and upgrading in China has been accelerating, with the proportion of the secondary sector gradually decreasing and the share of the tertiary sector steadily increasing. Furthermore, China is transitioning from traditional manufacturing to new, environmentally friendly manufacturing, resulting in a continuous decline in the proportion of water-intensive and high-pollution industries (Jianwen, 2022). Based on the above reasons, the proportion of regions in China that have achieved strong decoupling between economic development and water resources has shown an upward trend. Among them, the number of cities in the eastern region that achieved strong decoupling accounted for 36.37% of the total number of cities in the eastern region. Compared to 2015, this number decreased, but it has significantly increased compared to 2011. In the central region, the proportion of cities that achieved strong decoupling between regional economic development and water resources was 30.93%, showing a significant increase compared to 2011, with an overall steady improvement. In the western region, the number of cities that achieved strong decoupling accounted for 27.42% of the total number of cities in the western region, showing significant growth compared to both 2011 and 2015. In 2019, 34 cities achieved weak decoupling between the two, with a significant increase compared to previous years. Moreover, as the number of cities achieving strong decoupling remained relatively unchanged, it indicates that cities previously at lower decoupling levels (such as expansive negative decoupling, weak negative decoupling, declining decoupling, and strong negative decoupling) have improved their water resource utilization efficiency, thereby achieving weak decoupling between water resources and regional economic development.
In the cities that achieved weak decoupling between regional economic development and water resources, there were seven cities in the eastern region, showing no significant change compared to 2011. As mentioned earlier, the proportion of cities in the eastern region that achieved strong decoupling remains relatively low, suggesting that some eastern cities still exhibit a high degree of dependence on water resources for economic development, and thus, further improvements in water resource utilization efficiency are necessary. In the central region, 13 cities achieved weak decoupling, with no significant change compared to the previous time points. These cities accounted for just 13.40% of the total number of cities in the central region. Furthermore, the combined proportion of cities in the central region that achieved strong and weak decoupling is less than half of the total number of cities, indicating that economic development in the central region still relies heavily on water resources. In the western region, 14 cities achieved weak decoupling between regional economic development and water resources in 2019. As noted earlier, the number of cities in the western region that achieved strong decoupling remains low, indicating that a significant portion of cities in the western region continue to exhibit low-water resource utilization efficiency. In 2019, a total of 83 cities achieved expanding negative decoupling between economic development and water resources. Compared to 2011 and 2015, this number has decreased significantly, and the overall trend of cities in the expanding negative decoupling category shows a decline from 2011 to 2019. This suggests that the efficiency of water resource utilization has improved across the country, and the dependence of regional economic development on water resources has decreased. Specifically, in the eastern region, 32 cities fell into the expansive negative decoupling category, making up 32.32% of the total number of cities in the region. In the central region, 30 cities were in this category, accounting for 30.93% of the region’s total cities. In the western region, 21 cities experienced expanding negative decoupling, which accounted for 33.87% of the total number of cities in the western region. Although, in general, the dependence of economic development on water resources has decreased across China, a significant number of cities still consume large amounts of water resources for economic growth. Furthermore, some cities, despite consuming vast amounts of water, continue to experience negative economic growth.
5.1.3 Analysis of the degree of decoupling from water resources during negative regional economic growth
The concepts of strong decoupling, weak decoupling, and expansive negative decoupling all reflect the degree to which regional economic growth depends on water resources. However, some regions are experiencing negative economic growth, resulting in a decoupling trend where regional economic development and water resources are characterized by deteriorating decoupling, weak negative decoupling, and strong negative decoupling.
The reason for negative economic growth may lie in the fact that adjusting an economic development model takes time. If a region’s early-stage economic growth was heavily reliant on water resources, the imposition of water resource restrictions could lead to economic contraction. This happens because the region may struggle to adapt to a low-water-consumption development model, which indicates that the region’s economic development is still heavily dependent on water resources. As shown in Figure 2, only a few cities in China experienced negative economic growth, with most of them located in the northeast and southwest regions. As previously discussed, the structure of a region’s industrial base not only determines the extent of its economic development but also affects the level of environmental pollution (Lian et al., 2013). Industrial water usage patterns significantly influence water resource utilization efficiency and the degree to which economic development relies on water resources. In northeast China, the share of the secondary industry in the overall industrial structure is disproportionately high, and within the secondary industry, the distribution across various sectors is highly unbalanced. Knowledge- and technology-intensive industries make up a small proportion, while many industries are water-intensive, causing significant water pollution. Although China has introduced the “Revitalization of Northeast China’s Old Industrial Bases” plan to promote industrial transformation, shift the economic growth model, and enhance technological progress, the region’s initial over-reliance on water resources, combined with the slow pace of economic restructuring, has left local economies ill-prepared to transition to the new model. Consequently, despite a decrease in the water ecological footprint, these regions have experienced negative economic growth, highlighting that water utilization efficiency still needs significant improvement (Quan et al., 2022). In contrast, while the southwest of China is rich in water resources, with relatively low pollution and wastewater emissions, it faces constraints due to economic, technological, and natural factors. As a result, the region has a low level of water resource development and utilization, with poor water use efficiency and lagging economic development. This situation leads to a low dependence on water resources, resulting in no significant contradiction between economic development and water usage. However, the region still experienced negative economic growth (Xiusheng and Peng, 2015).
5.2 The decoupling analysis of the subbasin
The degree of economic development and the efficiency of water resource utilization vary significantly across different river basins in China. Analyzing the decoupling relationship between regional economic development and water resources by watershed is crucial for promoting the decoupling process as quickly as possible in China. The following section will discuss the decoupling degree between regional economic development and water resources in both the Yellow River Basin and the Yangtze River Basin. The study area primarily covers cities within various river basins in China, including the major ones outlined below. First, the Yellow River Basin: Overall, cities in this basin exhibit low-water resource utilization efficiency, and the relationship between economic development and water resources shows a trend of negative decoupling. The ecological footprint of water in the Yellow River Basin is relatively high, and both industrial and residential water footprints have been increasing year by year. Second, the Yangtze River Basin: Spanning multiple provinces across eastern, central, and western China—including Qinghai, Tibet, Sichuan, Yunnan, Hubei, Hunan, Jiangxi, Anhui, and Jiangsu—this basin presents a more complex picture. While urban economic development in this region consumes relatively less water, the efficiency of water resource utilization has not yet reached an optimal level. As a result, water resource issues remain a significant challenge.
5.2.1 Analysis of Yellow River Basin
The Yellow River Basin spans nine provinces: Qinghai, Sichuan, Gansu, Ningxia, Inner Mongolia, Shaanxi, Shanxi, Henan, and Shandong. It is a key region for irrigation agriculture and industry in China and supports a large population. However, the basin faces significant challenges, including water scarcity and severe water pollution. Overall, the total water consumption in the Yellow River Basin exceeds its sustainable capacity, with the water resource carrying capacity of most prefecture-level cities being in an overloaded state. In particular, some cities in Gansu, Inner Mongolia, Henan, Shanxi, and Shandong are experiencing severe overloading (Huirong et al., 2021). Furthermore, the economic development of cities in the Yellow River basin lags behind that of cities in the Yangtze River basin. This disparity can be attributed to several factors, including the basin’s northern location, which results in a relatively dry climate and limited water resources. Particularly in the upper reaches of the Yellow River, water scarcity has severely constrained agricultural and industrial growth. The economic structure of the Yellow River basin is relatively uniform, with a heavy reliance on traditional agriculture and mining. Many urban economies are centered around resource-dependent industries, such as coal and metallurgy, making economic transformation and upgrading more challenging. These factors exacerbate the region’s water resource issues, creating a significant conflict between economic development and water resources.
Figure 2 illustrates the trends in the total water ecological footprint, industrial water ecological footprint, agricultural water ecological footprint, and domestic water ecological footprint in the Yellow River Basin from 2010 to 2019. Figure 3 shows that, from 2010 to 2019, the total water ecological footprint of cities in the Yellow River Basin increased from 1251.56 hm2 to 1689.74 hm2, marking a growth of 35.01%. This indicates that the overall water ecological footprint of cities in the Yellow River Basin remains at a consistently high level. Despite fluctuations throughout the period, the general trend has been one of increase. In particular, industrial water usage in the Yellow River Basin has consistently remained high, following a steady upward trajectory, with recent years showing more significant growth. By 2019, the total industrial water ecological footprint in cities of the Yellow River Basin reached 364.22 hm2, up from 151.22 hm2 in 2010, a remarkable increase of 140.85%. This suggests that industries in the Yellow River Basin are consuming an increasingly large amount of water, with industrial water efficiency showing little improvement over time. Meanwhile, the agricultural water ecological footprint in the Yellow River Basin has fluctuated but has generally been maintained at a higher level. This indicates that agricultural water efficiency remains low and that water distribution across the basin is highly uneven. The tension between agricultural development and water resources exacerbates the situation, with a shortage of water resources available to serve the basin’s extensive arable land and agricultural labor force (Lijun and Quansheng, 1998). Further division of the Yellow River Basin into the upper, middle, and lower reaches reveals that cities in the upper and middle regions face relatively scarce water resources, while their ecological sensitivity and ecological importance are relatively high (Shi et al., 2020).
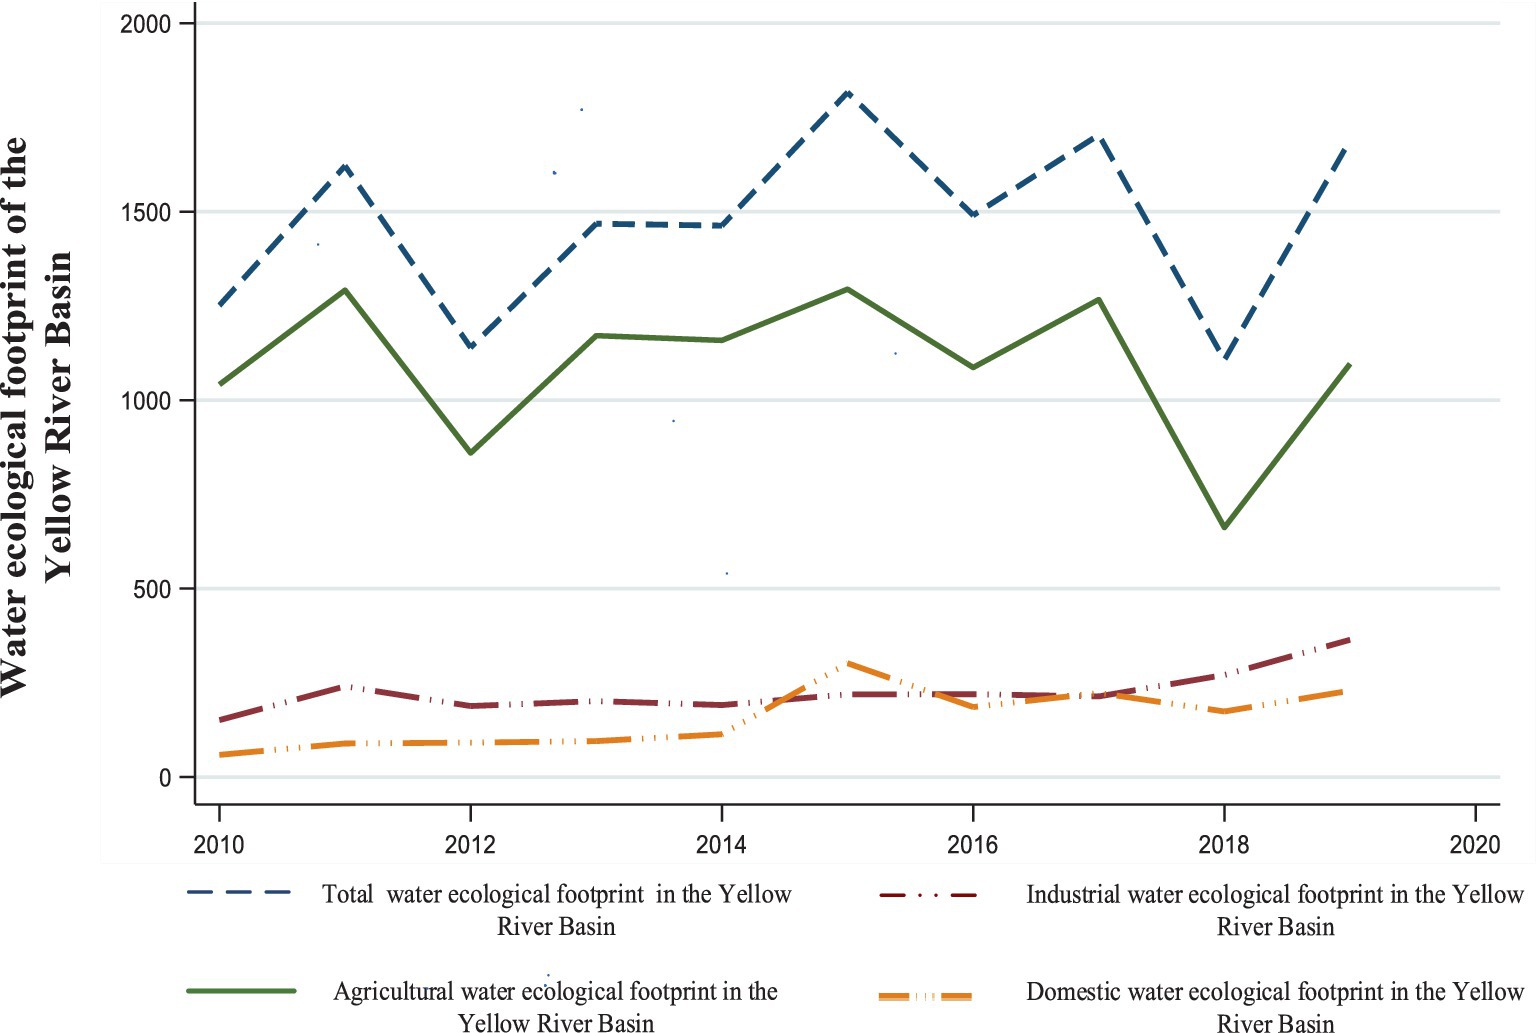
Figure 3. Changes in water volume ecological footprint in the Yellow River Basin from 2010 to 2019.
A further analysis of the relationship between urban economic development and water resource decoupling in the Yellow River Basin reveals that in 2011, only 10 cities—accounting for just 9.9% of all cities in the basin—achieved strong decoupling between economic growth and water consumption. By 2015, this number had increased to 12, and by 2019, it had risen to 19, representing 18.81% of all cities in the Yellow River Basin. These cities, which have successfully achieved strong decoupling, are primarily located in Shandong, Henan, and Sichuan provinces. However, in most other cities, the relationship between economic development and water resources remains weakly decoupled or exhibits an expanding negative decoupling trend. In many cases, economic growth continues to demand substantial water consumption, yet water use efficiency remains low, intensifying the conflict between regional economic development and water resource constraints. Due to the dominance of primary and secondary industries in the Yellow River Basin, both agricultural and industrial water consumption have been increasing year by year. In addition, many industries in the region are characterized by high-water consumption and severe pollution, further exacerbating the water resource crisis. As one of China’s key agricultural and industrial regions, the Yellow River Basin plays a crucial role in the nation’s economic development. However, its heavy reliance on water consumption significantly constrains the sustainable and healthy growth of China’s economy.
5.2.2 Decoupling analysis of the Yangtze River Basin
The Yangtze River Basin spans China’s eastern, central, and western economic regions, covering 11 provinces, autonomous regions, and municipalities, including Qinghai, Tibet, Sichuan, Yunnan, Hubei, Hunan, Jiangxi, Anhui, and Jiangsu. It accounts for one-fifth of China’s land area and plays a crucial role in the national economy and social development due to its abundant natural resources and strategic geographical advantages. However, since the 1990s, the frequency and severity of flood disasters in the Yangtze River Basin have reached historically unprecedented levels. At the same time, rapid population growth and economic expansion have resulted in the discharge of large quantities of domestic sewage and industrial wastewater into the river system, further exacerbating water pollution. Therefore, addressing the conflict between economic development and water resources in the Yangtze River Basin, achieving a harmonious coexistence between humans and nature, and ensuring sustainable national economic development have become urgent priorities for balancing economic growth and environmental protection in the region.
Figure 4 illustrates the total water ecological footprint in the Yangtze River Basin from 2010 to 2019. As shown in the graph, the overall water consumption in the Yangtze River Basin has shown an upward trend, with a significant increase between 2018 and 2019. However, compared to the Yellow River Basin, the total water consumption in the Yangtze River Basin remains at a relatively lower level. In 2019, the total water ecological footprint was 308.60 hm2, which represents a 250.56% increase from 88.03 hm2 in 2010. This indicates a substantial growth in water consumption within the Yangtze River Basin over the past decade. Breaking it down by category, the total industrial water ecological footprint in the cities of the Yangtze River Basin has generally increased, with a noticeable rise between 2018 and 2019, from 221.28 hm2 to 324.60 hm2. This figure is comparable to the total industrial water ecological footprint in cities of the Yellow River Basin. In contrast, the total agricultural water ecological footprint is generally higher than the industrial water footprint. However, when compared to the agricultural water ecological footprint in the Yellow River Basin, the total remains relatively lower in the Yangtze River Basin. Looking at the trend of change, the total agricultural water consumption in the cities of the Yangtze River Basin has also exhibited an overall increase, rising by 81.61% in 2019 compared to 2010. The most significant rise occurred between 2015 and 2017, although there was a brief dip in agricultural water consumption between 2017 and 2018. However, the consumption resumed its upward trajectory in 2019. There is little difference between the total domestic water ecological footprint in the Yellow River and Yangtze River Basins. The total domestic water ecological footprint in cities of the Yangtze River Basin has generally increased year by year from 2010 to 2019. While it remains at a relatively low level, there has been substantial growth over the decade. In 2019, the total domestic water ecological footprint was 150.80 hm2, compared to only 36.80 hm2 in 2010.
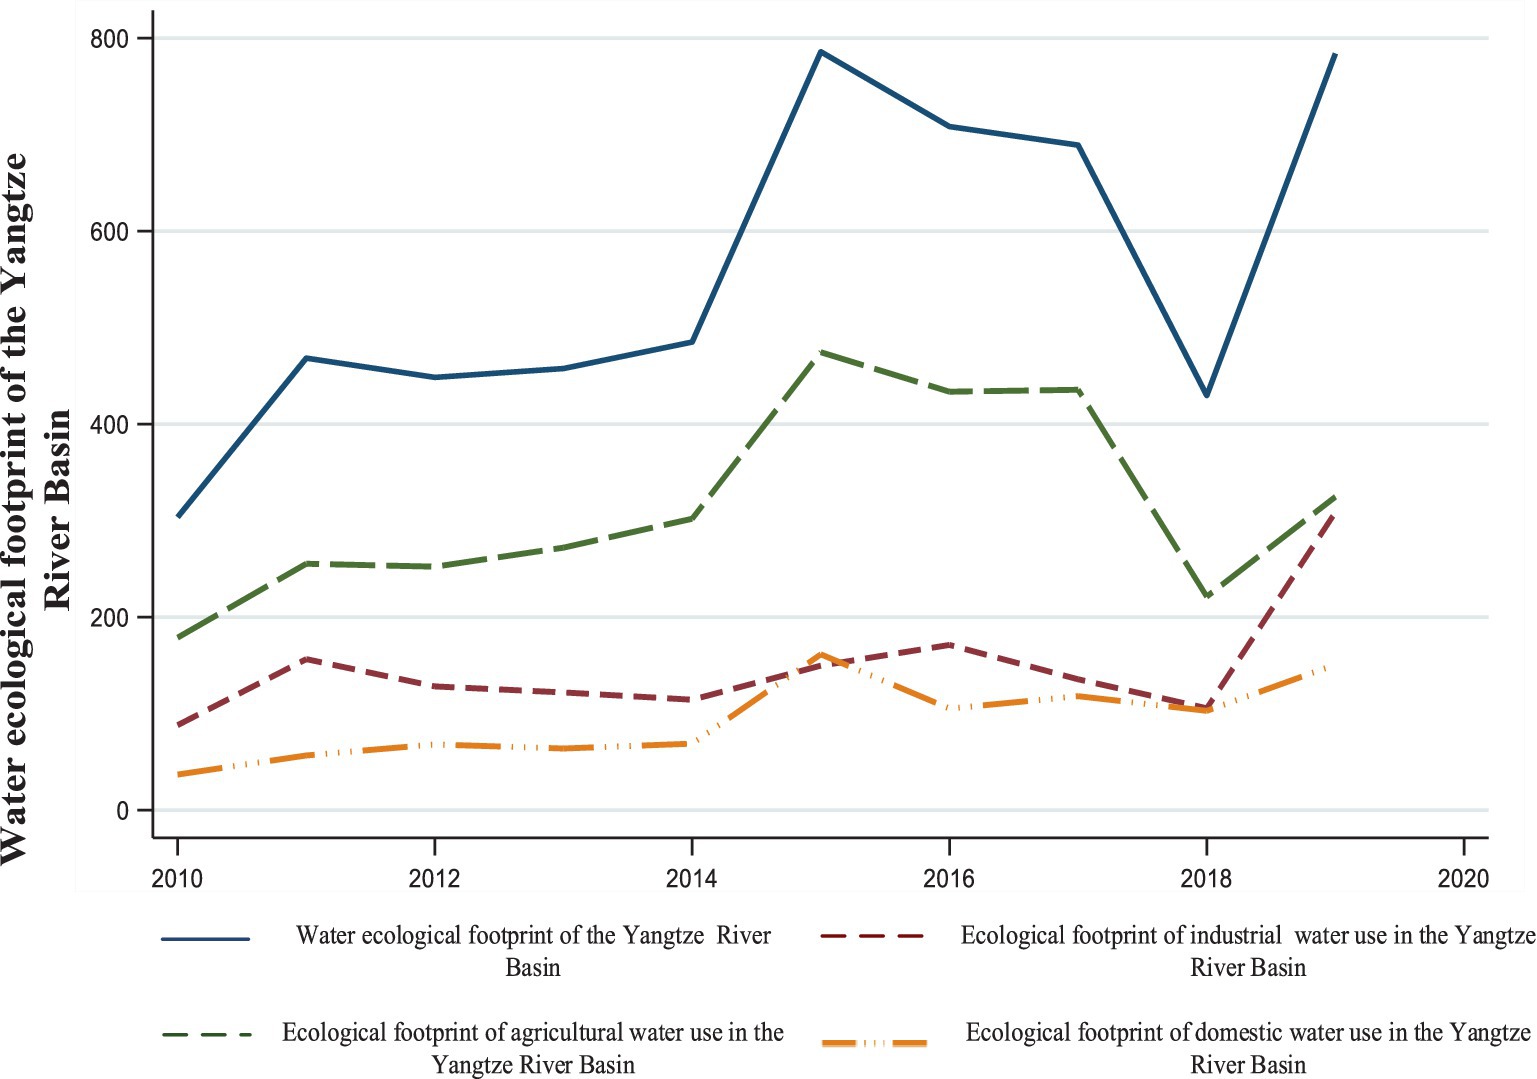
Figure 4. Change in water ecological footprint in the Yangtze River Basin from 2010 to 2019.
Based on the analysis above, the number of cities in the Yangtze River Basin that achieved strong decoupling increased steadily from 2011 to 2019. Among the cities that did not reach the strong decoupling threshold, most exhibited a trend of expansive negative decoupling between economic development and water resources. In 2011, a total of 76 cities were classified under this category, accounting for 80% of all cities in the Yangtze River Basin. Although the overall number of cities exhibiting expansion of negative decoupling has decreased, the proportion remains relatively high. This suggests that the conflict between economic development and water resources in the Yangtze River Basin remains significant, and there is a pressing need to improve water resource utilization efficiency.
5.3 Analysis of the decoupling catch-up index model
This study also constructs a decoupling catch-up index model to analyze the changes in the water resource ecological footprint of less-developed regions as they attempt to catch up with more developed areas. The model aims to determine whether these regions can achieve a win–win situation by simultaneously driving economic growth and improving water resource utilization efficiency. The classification criteria for the decoupling catch-up index are the same as those used for the Tapio decoupling index, as discussed earlier. The index is divided into six categories: strong decoupling, weak decoupling, expansive negative decoupling, declining decoupling, weak negative decoupling, and strong negative decoupling. The results are shown in Figure 5. In 2011, 22 cities nationwide achieved strong decoupling. By 2015, this number increased to 45, and in 2019, it reached 46. Although the number of cities achieving strong decoupling fluctuated between 2011 and 2019, the overall trend was upward. However, the total number of cities achieving strong decoupling from 2010 to 2019 remained relatively low, indicating that only a small portion of economically lagging cities managed to achieve a win–win situation of economic growth and improved water resource utilization efficiency while catching up with more developed cities. Moreover, the number of cities reaching the weak decoupling level was also relatively low. In 2011, 55 cities achieved weak decoupling, but this number dropped to 19 in 2015. Although there was some increase in 2019, only 24 cities reached the weak decoupling level. Despite some fluctuations between 2011 and 2019, this number remained low, indicating that most cities experienced expanding negative decoupling, declining decoupling, weak negative decoupling, or strong negative decoupling. In 2011, 80 cities achieved expanding negative decoupling. By 2015, this number decreased to 63, and by 2019, it had dropped further to 34, showing an overall declining trend. Expanding negative decoupling suggests that the gap in per capita GDP between lagging regions and developed regions is gradually narrowing, and the difference in water resource utilization efficiency is also shrinking year by year. However, by 2019, the number of cities experiencing expanding negative decoupling had decreased, and the number of cities achieving strong or weak decoupling remained low. This indicates that, by 2019, the number of cities successfully catching up with developed cities had been steadily decreasing, and the gap in per capita GDP between most cities and developed regions had been widening. This further underscores the difficulty that economically lagging cities face in achieving both economic growth and improved water resource efficiency during their process of catching up with more developed cities. Generally, cities that are catching up have a better chance of achieving a win–win situation in both economic growth and water resource efficiency if their water resource management intensity and per capita GDP values are closer to, or even exceed, those of the cities they are attempting to catch up with. This highlights the need for continued strengthening of water resource management in China.
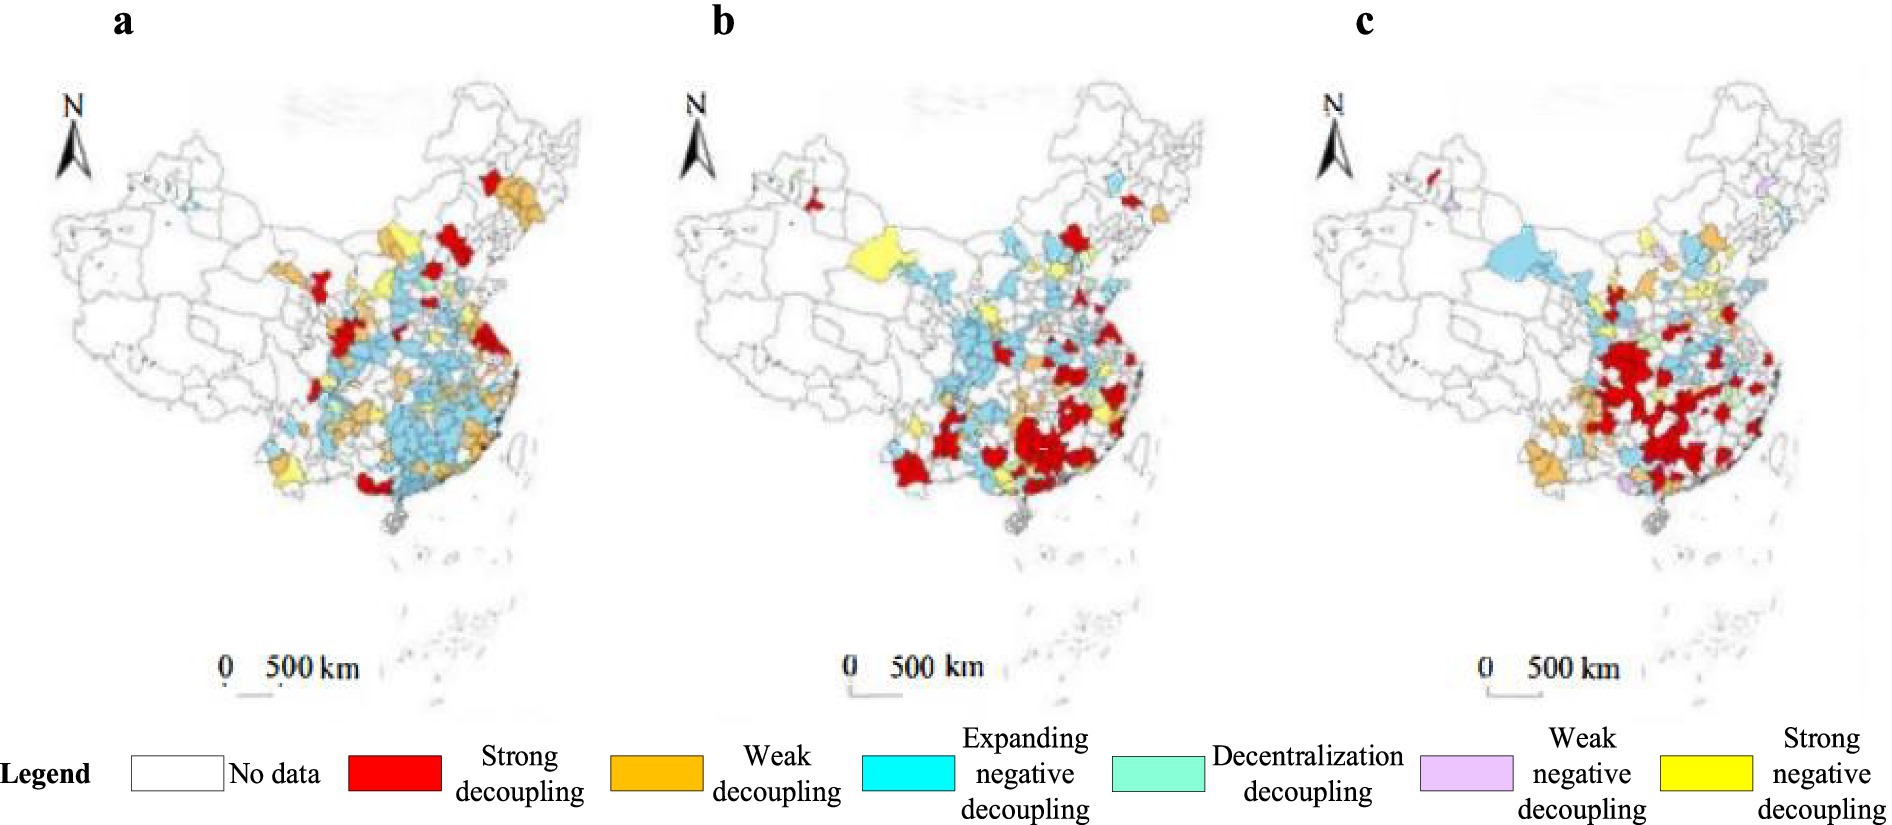
Figure 5. Regional decoupling catch-up in 2011, 2015, and 2019. (a) Chasing decoupling in 2011. (b) Chasing decoupling in 2015. (c) Chasing decoupling in 2019.
6 Conclusion and policy recommendations
First, the study measures how to measure water resources and economic development. The total ecological footprint of water resources is calculated by using ecological footprint of water quantity and ecological footprint of water quality, respectively, and then, the per capita GDP is used to measure economic development. Second, the study calculates the Tapio decoupling index between the economic development and the total ecological footprint of water resources of prefecture-level cities in China during 2011–2019. The decoupling degree between economic development and water resources of prefecture-level cities is analyzed by index. The study found that the Tapio decoupling index of different cities has significant differences. Third, to investigate whether the win–win situation of economic development and improving water resource utilization efficiency can be achieved, this study further constructs a decoupling and catch-up model. The results show that the decoupling of urban economic development and water resources in China is improving year by year, but the degree of decoupling is not consistent among cities.
6.1 Study conclusion
The following conclusions are obtained through analysis:
(1) Through analyzing the Tapio decoupling index of cities in eastern, central, and western China, it is found that only a small number of cities achieve strong or weak decoupling between economic development and water resources. The majority of cities remain in a state of expanding negative decoupling. This indicates that most cities in China are still highly dependent on water resources for economic development, and the efficiency of water resource utilization needs significant improvement. Moreover, the negative economic growth in Northeast and Southwest China highlights the reliance on single industries and resource dependence, emphasizing the need for economic transformation and enhanced water resource management.
(2) Through a comparative analysis of the river basins, it has been found that the utilization efficiency of urban water resources in the Yellow River Basin is relatively low. Most cities in the region remain in a state of negative decoupling, with the ecological footprint of water resources consistently high. This indicates that the economic development in this area is heavily reliant on water resources. Therefore, it is essential to accelerate the adoption of water-saving technologies in agriculture and optimize industrial water usage. In contrast, although the tension between urban economic development and water resources in the Yangtze River Basin is not as severe as in the Yellow River Basin, there is still a need to further optimize the allocation of water resources and improve efficiency to achieve a more balanced development of the economy and ecology.
(3) According to the analysis of decoupling catch-up index model, it is found that most less-developed cities fail to achieve a win–win situation of economic growth and water resource utilization efficiency improvement in the process of catch-up, and the gap between per capita GDP between less-developed and developed cities continues to expand, indicating that China still faces significant challenges in achieving both economic growth and efficient water resource utilization. Although the number of negative decoupling cities in expansion decreases, there are still few cities that achieve strong decoupling and weak decoupling, indicating that the gap between less-developed cities and developed cities is widening, and there exists the problem of unbalanced regional development.
6.2 Policy recommendations
Based on the findings of the research, it is evident that although the decoupling of economic development and water resources in Chinese cities is improving year by year, the degree of decoupling varies across regions. This is due to factors such as geography, environment, resources, economy, and historical context. Moreover, most cities are still struggling to achieve a win–win situation of both economic growth and improved water resource utilization efficiency. In light of these challenges, the study proposes the following recommendations:
(1) Different water pricing policies and resource management systems should be implemented according to the specific characteristics of each region and industry. It is essential to control overall agricultural water usage, raise farmers’ awareness of water conservation, encourage them to adopt more efficient irrigation methods, and promote the widespread adoption of water-saving irrigation technologies. For industrial water use, particularly in sectors with high-water consumption, water prices should be increased to incentivize the adoption of water-saving technologies, optimize production processes, and promote industrial restructuring by reducing the proportion of industries that consume large amounts of water and generate high levels of pollution. This approach will help foster a resource-efficient and environmentally friendly society. In addition, regions should develop tailored water management strategies based on local water availability and economic conditions, gradually improving the efficiency of water resource utilization.
(2) The study proposes to coordinate the relationship between key development areas, living environments, and water resource capacity, promoting the harmonious integration of water resource protection and high-quality economic development; optimize the model for water resource development and utilization, particularly by improving water use efficiency in regions that have not yet achieved strong or weak decoupling of local economic development and water resources; and strengthen the rational allocation of water resources, especially in water-scarce and densely populated areas. The allocation of water resources among regions should be based on the distribution of water resources and differences in water usage across regions to ensure rational planning of inter-regional water resource distribution.
(3) Achieving strong decoupling between regional economic development and water resource utilization is a long-term and gradual process that requires simultaneous efforts to foster economic growth and improve water efficiency. It is recommended that a sustainable water use strategy be implemented to support regional economic development, with a focus on investing in and innovating water conservation projects, water-saving technologies, and water resource management. In addition, China can draw upon lessons from advanced water management practices, gradually establishing and refining a water trading system tailored to local conditions, promoting water resource tax reforms, and exploring market-oriented water allocation mechanisms. For example, the water rights trading system in Australia has proven effective in promoting the efficient use of water resources. Moreover, the adoption of sustainable water use strategies can be further advanced through innovation and increased investment in water conservancy projects, water-saving technologies, and improved water resource management, ensuring that economic development proceeds without compromising water resources.
Data availability statement
The original contributions presented in the study are included in the article/supplementary material, further inquiries can be directed to the corresponding author.
Author contributions
CL: Formal analysis, Resources, Writing – original draft. SQ: Software, Visualization, Writing – review & editing. JL: Formal analysis, Methodology, Writing – review & editing. YW: Conceptualization, Supervision, Writing – review & editing.
Funding
The author(s) declare that financial support was received for the research and/or publication of this article. This research was funded by the Humanities and Social Sciences Youth Foundation, Ministry of Education of the People’s Republic of China (24YJC630222), the Shandong Province social science planning research project (Grant No. 23DJJJ08), the General Project of Philosophy and Social Science Research Project of Colleges and Universities in Shandong Province (Grant No. 2024ZSMS172), the Excellent Youth Innovation Team of Colleges and Universities in Shandong Province (Grant No. 2022RW041), the Science and Technology Bureau of Rizhao (Grant No. RZ2022ZR45), and 2024 Innovation Team of Shandong Provincial Colleges and Universities Youth Innovation Science and Technology Plan: Research on Location Selection of Shandong Going-out Enterprises’ Agricultural Foreign Investment under the Background of the Belt and Road (2024KJL001).
Acknowledgments
We would like to thank the journal experts who edited this manuscript. We also appreciate the constructive suggestions and comments on the manuscript from the reviewer(s) and editor(s).
Conflict of interest
The authors declare that the research was conducted in the absence of any commercial or financial relationships that could be construed as a potential conflict of interest.
Publisher’s note
All claims expressed in this article are solely those of the authors and do not necessarily represent those of their affiliated organizations, or those of the publisher, the editors and the reviewers. Any product that may be evaluated in this article, or claim that may be made by its manufacturer, is not guaranteed or endorsed by the publisher.
Footnotes
1. ^https://www.waterinfo.com.cn/xsyj/zjgd/202210/t20221009_34926.html
2. ^Li Guoying, secretary of the Party Leadership Group and minister of the Ministry of Water Resources, pointed out in the article entitled “Deeply Implementing the New Concept of Development and Promoting the Intensive and Safe Utilization of Water Resources” published by the People’s Daily that water resources are the basic, guiding and controlling elements of economic and social development, and the carrying space of water determines the space of economic and social development. China has more people and less water, the uneven spatial and temporal distribution of water resources is matched, and the distribution of productive forces, solving the contradiction that water resources allocation does not meet the needs of economic and social development, is a major strategic problem facing China’s development in the new stage.
3. ^The no. 1 central document of 2011 and the Central Water Conservancy Work Conference clearly requires the implementation of the strictest water resources management system, Establish the “three red lines” of water resources development and utilization control, water use efficiency control, and pollution limitation in water functional areas, Promote economic and social development and the carrying capacity of water resources and water environment; in 2012, The State Council clarified the Opinions on the Implementation of the Strictest Water Resources Management System that “Strengthening the red line management of water resources development and utilization and water use efficiency control, Strictly implement total water use control, To promote the construction of a water-saving society”; in 2013, the third Plenary Session of the CPC Central Committee proposed the Decision of the 18th CPC Central Committee, stressing the need to “accelerate the construction of ecological civilization, Establish a sound system… Such as the property rights and use control system of water resources assets”; the proposal of the fifth Plenary Session of the 18th Session of the 18th CPC Central Committee made it clear that “the strictest water resources management system should be implemented”; in 2016, The Ministry of Finance and the State Administration of Taxation jointly issued the Notice on Comprehensively Promoting the Reform of Resource Tax, Announced that China will comprehensively promote the resource tax reform since 1 July 2016. According to the Notice, China will carry out the pilot reform of water resources tax, for industries with high water resource utilization, over planned water use, and groundwater use in areas with groundwater overexploitation, appropriate increase in tax standards, etc.
4. ^The Proposal of the CPC Central Committee on the formulation of the 13th Five-Year Plan for National Economic and Social Development issued in 2015 proposed to “implement the strictest water resources management system, determine the production and the city by water, and build a water-saving society.”
References
Ane, P., and Li, C. (2014). Analysis of the coordinated development of water resources utilization and economy in Hubei Province- -based on water footprint perspective. Resour. Sci. 36, 328–333.
Antonio, M. M., Gabriela, A., Sleimann, A. L. B., and Talamini, E. (2023). Domestic and foreign decoupling of economic growth and water consumption and its driving factors in the Brazilian economy. Ecol. Econ. 206:107737. doi: 10.1016/j.ecolecon.2022.107737
Babuna, P., Yang, X., and Bian, D. (2020). Water use inequality and efficiency assessments in the Yangtze River Economic Delta of China. Water 12:1709. doi: 10.3390/w12061709
Chen, Y., Zhong, S., Liang, X., Li, Y., Cheng, J., and Cao, Y. (2024). The relationship between urbanization and the water environment in the Chengdu-Chongqing urban agglomeration. Land 13:1054. doi: 10.3390/land13071054
Cole, M. J., Bailey, R. M., Cullis, J. D. S., and New, M. G. (2017). Spatial inequality in water access and water use in South Africa. Water Policy 20, 37–52. doi: 10.2166/wp.2017.111
Conrad, E., and Cassar, L. (2014). Decoupling economic growth and environmental degradation: reviewing Progress to date in the Small Island state of Malta. Sustain. For. 6, 6729–6750. doi: 10.3390/su6106729
Dehui, B., Xiaohua, Y., Yu, L., Chen, H., Sun, B., and Wu, F. (2022). Analysis of the spatiotemporal patterns and decoupling effects of China's water resource spatial equilibrium. Environ. Res. 216, –114719. doi: 10.1016/j.envres.2022.114719
Desbureaux, S., and Rodella, A. (2019). Drought in the City: the economic impact of water scarcity in Latin American metropolitan areas. World Dev. 114, 13–27. doi: 10.1016/j.worlddev.2018.09.026
Divakar, L., Babel, M. S., Perret, S. R., and Gupta, A. D. (2011). Optimal allocation of bulk water supplies to competing use sectors based on economic criterion—an application to the Chao Phraya River basin, Thailand. J. Hydrol. 401, 22–35. doi: 10.1016/j.jhydrol.2011.02.003
Fotia, K., and Tsirogiannis, I. (2023). Water footprint score: a practical method for wider communication and assessment of water footprint performance. Environ. Sci. Proc. 25:71. doi: 10.3390/ECWS-7-14311
Gai, M., Wang, Y. F., and Ma, G. D. (2013). Evaluation of the coupling coordination development between water use e ciency and economy in Liaoning coastal Economic Belt. J. Nat. Resour. 28, 2081–2094. doi: 10.11849/zrzyxb.2013.12.006
Guai, Y. Y., and Lingyan, L. (2017). Analysis of regional differences and influencing factors of water resource efficiency in China. Econ. Geogr. 37, 12–19.
Hanna, R., and Oliva, P. (2015). The effect of pollution on labor supply: evidence from a natural experiment in Mexico City. J. Public Econ. 122, 68–79. doi: 10.1016/j.jpubeco.2014.10.004
Huirong, C., Jianzhong, Y., and Jinliang, W. (2021). Sustainable utilisation of water resources in Guangxi and its decoupling from economic development in the past decade. J. Environ. Prot. Ecol. 22, 445–457.
Jia, Y., and Wang, H. (2023). Study on water resource carrying capacity of Zhengzhou City based on DPSIR model. Int. J. Environ. Res. Public Health 20:1394. doi: 10.3390/ijerph20021394
Jianwen, S. (2022). Study on the decoupling relationship and rebound effect between agricultural economic growth and water footprint: a case of Yangling agricultural demonstration zone, China. Water 14:991.
Kai, W. A. (2017). “Structural contradictions and their policy transformation in China's agricultural development” in Rural Economy in China, 2–17.
Lamastra, L., Miglietta, P. P., Toma, P., De, L. F., and Massari, S. (2017). Virtual water trade of Agri-food products: evidence from italian-chinese relations. Sci. Total Environ. 599-600, 474–482. doi: 10.1016/j.scitotenv.2017.04.146
Li, S., Abdelkareem, M., and Al-Arifi, N. (2023). Mapping groundwater prospective areas using remote sensing and GIS-based data driven frequency ratio techniques and detecting land cover changes in the Yellow River Basin, China. Land 12:771. doi: 10.3390/land12040771
Li, M., Yang, X., Wu, F., and Babuna, P. (2022). Spatial equilibrium-based multi-objective optimal allocation of regional water resources. J. Hydrol. Reg. Stud. 44:101219. doi: 10.1016/j.ejrh.2022.101219
Lian, G. L., Zhen, Z., and He, H. J. (2013). Study on the development and sustainable utilization of water resources in the Western regions of China. Adv. Mater. Res. 864-867, 2306–2311. doi: 10.4028/www.scientific.net/AMR.864-867.2306
Lijun, C., and Quansheng, B. (1998). Reconciliation of the contradiction between regional economic development and water environment capacity shortage- -macro layout of industrial productivity and industrial structure adjustment strategy. Econ. Geogr. 18, 54–61.
Ling, X., and Heping, J. (2010). Construction and calculation of the evaluation index system for the development level of agricultural modernization in China. Res. Agricult. Modernizat. 31, 646–650.
Liu, Y. Z., Bian, J. C., Li, X. M., Liu, S. Y., Lageson, D., and Yin, Y. K. (2020). The optimization of regional industrial structure under the water-energy constraint: a case study on Hebei Province in China. Energy Policy 143:111558. doi: 10.1016/j.enpol.2020.111558
Liu, Y., and Jia, L. (2019). Research on decoupling between economic development and water resource utilization. IOP Conf. Ser. Earth Environ. Sci. 233:052038. doi: 10.1088/1755-1315/233/5/052038
Long, A., Xu, Z., and Zhang, Z. (2003). Estimate and analysis of water footprint in Northwest China. J. Glaciol. Geocryol. 25, 692–700. doi: 10.7522/j.issn.1000-0240.2003.0122
Lou, Y., Qiu, Q., Zhang, M., Feng, Z., and Dong, J. (2023). Spatial equilibrium evaluation of the water resources in Tai’an City based on the Lorenz curve and correlation number. Water 15:2617. doi: 10.3390/w15142617
Ma, T., Sun, S., Fu, G., Hall, J. W., Ni, Y., He, L., et al. (2020). Pollution exacerbates China’s water scarcity and its regional inequality. Nat. Commun. 11:650. doi: 10.1038/s41467-020-14532-5
Malakar, K., and Mishra, T. (2018). Patwardhan, A. Inequality in water supply in India: an assessment using the Gini and Theil indices. Environ. Dev. Sustain. 20, 841–864. doi: 10.1007/s10668-017-9913-0
Melek, A., Bilge, K., Vecdi, A. C., and Kıvraklar, M. K. (2023). Adapting the activity-based costing method for water footprint accounting. J. Clean. Prod. 400:136691. doi: 10.1016/j.jclepro.2023.136691
Naqvi, A., and Zwickl, K. (2017). Fifty shades of green: revisiting decoupling by economic sectors and air pollutants. Ecol. Econ. 133, 111–126. doi: 10.1016/j.ecolecon.2016.09.017
OECD (2003). OECD environmental indicators: Development, measurement and use, the organisation for economic co-operation and development. Paris: OECD.
Pute, W., Hao, F., and Wenquan, N. (2003). Analysis on the development trend of water-use structure and water-saving countermeasures in China. J. Agricult. Eng. 19, 1–6.
Qingling, P., Weijun, H., Yang, K., Yuan, L., Degefu, D. M., and An, M. (2022). Identifying the decoupling pathways of water resource liability and economic growth: a case study of the Yangtze River Economic Belt, China. Environ. Sci. Pollut. Res. Int. 29, 55775–55789. doi: 10.1007/s11356-022-19724-8
Quan, L., Fengjiao, L., Yanjun, L., and Wang, D. (2022). Study on the relationship between water resources utilization and economic growth in Tarim River basin from the perspective of water footprint. Water 14:1655. doi: 10.3390/w14101655
Qunxi, G., Gengxuan, G., Sipan, L., and Liang, X. (2021). Decoupling of urban economic growth and water consumption in Chongqing and Chengdu from the “production-living-ecological” perspective. Sustain. Cities Soc. 75:103395. doi: 10.1016/j.scs.2021.103395
Raihan, A. (2023). Nexus between economy, technology, and ecological footprint in China. J. Econ. Technol. 1, 94–107. doi: 10.1016/j.ject.2023.09.003
Roozbahani, R., Schreider, S., and Abbasi, B. (2015). Optimal water allocation through a multi-objective compromise between environmental, social, and economic preferences. Environ. Model. Softw. 64, 18–30. doi: 10.1016/j.envsoft.2014.11.001
Schandl, H., Hatfield-Dodds, S., Wiedmann, T., Geschke, A., Cai, Y., West, J., et al. (2016). Decoupling global environmental pressure and economic growth: scenarios for energy use, materials use and carbon emissions. J. Clean. Prod. 132, 45–56. doi: 10.1016/j.jclepro.2015.06.100
Shi, C., Yuan, H., Pang, Q., and Zhang, Y. (2020). Research on the decoupling of water resources utilization and agricultural economic development in Gansu Province from the perspective of water footprint. Int. J. Environ. Res. Public Health 17:5758. doi: 10.3390/ijerph17165758
Su, Y., Liao, S., Ren, J., and Zhao, Z. (2024). Research on the decoupling relationship between water resources utilization and economic development at the county scale in Qian ‘nan prefecture, Guizhou Province. Front. Environ. Sci. 12:1347652. doi: 10.3389/fenvs.2024.1347652
Sun, S., Fang, C., and Lv, J. (2017). Spatial inequality of water footprint in China: a detailed decomposition of inequality from water use types and drivers. J. Hydrol. 553, 398–407. doi: 10.1016/j.jhydrol.2017.08.020
Sun, F., Guo, J., Huang, X., Shang, Z., and Jin, B. (2024). Spatio-temporal characteristics and coupling coordination relationship between industrial green water efficiency and science and technology innovation: a case study in China. Ecol. Indic. 159:111651. doi: 10.1016/j.ecolind.2024.111651
Tao, O. X., Yu, L. H., Xiang, J. Q., and Wang, Z. L. (2023). Simulation and regulation of water resources sustainable utilization in China based on improved water resources ecological footprint model. Environ. Sci. 44, 1368–1377. doi: 10.13227/j.hjkx.202204267
Tapio, P. (2005). Towards a theory of decoupling: degrees of decoupling in the EU and the case of road traffic in Finland between 1970 and 2001. Transp. Policy 12, 137–151. doi: 10.1016/j.tranpol.2005.01.001
Toma, P., Massari, S., and Miglietta, P. P. (2016). “Life cycle approaches to sustainable regional development” in Life cycle approaches to sustainable regional development. eds. S. Massari, G. Sonnemann, and F. Balkau (New York, NY: Routledge, Taylor & Francis Group), 143–148.
Urama, K. C., Bjørnsen, P. K., Riegels, N., Vairavamoorthy, K., Herrick, J., Kauppi, L., et al. (2016). UNEP IRP report—Options for decoupling economic growth from water use and water pollution—Factsheet. United Nations Environment Programme: Paris.
Vehmas, J., Luukkanen, J., and Kaivo-Oja, J. (2007). Linking analyses and environmental Kuznets curves for aggregated material flows in the EU. J. Clean. Prod. 15, 1662–1673. doi: 10.1016/j.jclepro.2006.08.010
Wang, Q., and Chen, X. (2015). Energy policies for managing China’s carbon emission. Renew. Sust. Energ. Rev. 50, 470–479. doi: 10.1016/j.rser.2015.05.033
Wang, Q., and Li, R. (2016). Journey to burning half of global coal: trajectory and drivers of China’s coal use. Renew. Sust. Energ. Rev. 58, 341–346. doi: 10.1016/j.rser.2015.12.104
Wang, S., and Li, R. (2018). Toward the coordinated sustainable development of urban water resource use and economic growth: an empirical analysis of Tianjin City, China. Sustain. For. 10:1323. doi: 10.3390/su10051323
Wang, X., Zhang, J., Shahid, S., ElMahdi, A., He, R., Wang, X., et al. (2012). Gini coefficient to assess equity in domestic water supply in the Yellow River. Mitig. Adapt. Strat. Glob. Change 17, 65–75. doi: 10.1007/s11027-011-9309-7
Wei, S. (2014). Decoupling cultivated land loss by construction occupation from economic growth in Beijing. Habitat Int. 43, 198–205. doi: 10.1016/j.habitatint.2014.03.002
Wenqi, Z., Defu, L., Xianming, C., Zhou, X., Ding, Y., and Zhang, J. (2023). Driving factors for decoupling water resources ecological footprint and economic growth in water-deficient cities dominated by agriculture. Water Sci. Technol. 88, 1246–1268. doi: 10.2166/wst.2023.284
Wiemer, S., and Daniele, C. (2015). Handbook of income distribution. Amsterdam: Elsevier isbn:ISBN 978-0-444-81631-3.
Wu, C., Jiang, A.-D., and Zheng, W. (2022). Study on the measures for optimizing China’s provincial territorial space based on the perspective of resource and environmental carrying capacity in the New situation. Sustain. For. 14:13754. doi: 10.3390/su142113754
Wu, H., Li, X., and An, H. (2022). Decoupling of water resources utilization and coordinated economic development in China's Hexi corridor based on ecological water resource footprint. Environ. Sci. Pollut. Res. Int. 29, 90936–90947. doi: 10.1007/s11356-022-21732-7
Xia, J., and Zhu, Y. Z. (2002). Measures of water resources security: research and challenges of water resources carrying capacity. J. Nat. Resour. 17, 262–269. doi: 10.11849/zrzyxb.2002.03.001
Xiusheng, Z., and Peng, W. (2015). “The new normal of economic development and industrial structure optimization” in Economic problems, 46–49 + 82.
Yang, G., Dong, Z., Feng, S., Li, B., Sun, Y., and Chen, M. (2021). Early warning of water resource carrying status in Nanjing City based on coordinated development index. J. Clean. Prod. 284:124696. doi: 10.1016/j.jclepro.2020.124696
Yang, G., Li, S., Wang, H., and Wang, L. (2022). Study on agricultural cultivation development layout based on the matching characteristic of water and land resources in North China plain. Agric. Water Manag. 259:107272. doi: 10.1016/j.agwat.2021.107272
Yao, P., Jia, Q., Liu, J., and Yamaka, W. (2023). Reform of collective land for construction and rental housing and the growth of farmers’ property income: evidence from China. Land 12:131. doi: 10.3390/land12010131
Keywords: economic development, ecological footprint of water resources, decoupling analysis, decoupling catch-up, China
Citation: Li C, Qian S, Liu J and Wang Y (2025) Analysis on the decoupling of China’s economic development and water resource utilization under the rigid constraint of water resources. Front. Sustain. Food Syst. 9:1498807. doi: 10.3389/fsufs.2025.1498807
Edited by:
Thomas Ramsey, China Three Gorges University, ChinaReviewed by:
Xinchen Gu, China Institute of Water Resources and Hydropower Research, ChinaYilinuer Alifujiang, Xinjiang University, China
Copyright © 2025 Li, Qian, Liu and Wang. This is an open-access article distributed under the terms of the Creative Commons Attribution License (CC BY). The use, distribution or reproduction in other forums is permitted, provided the original author(s) and the copyright owner(s) are credited and that the original publication in this journal is cited, in accordance with accepted academic practice. No use, distribution or reproduction is permitted which does not comply with these terms.
*Correspondence: Yameng Wang, d3ltMjAyMkBxZm51LmVkdS5jbg==