 Miao Wenjun
 Huo Zenghui
 Chen Fuqiao
 Zhang Mei
- 1College of Economics and Management, China Jiliang University, Hangzhou, China
- 2Tea Research Institute, Chinese Academy of Agricultural Sciences, Hangzhou, China
- 3Nanxun Innovation Institute, Zhejiang University of Water Resources and Electric Power, Hangzhou, China
The RCEP countries are key markets for China’s tea exports, and the harmonization of Maximum Residue Limits (MRLs) standards for pesticides between China and these countries significantly impacts China’s tea trade. Building on previous research, this study develops an enhanced MRLs harmonization index and proposes a theoretical hypothesis that the harmonization of MRLs affects tea export prices and quantities by influencing trade costs. By analyzing tea MRL data from 2010 to 2022, the study finds that the harmonization of MRLs standards between China and the RCEP countries has continuously improved. Estimation results from the stochastic frontier gravity model indicate that MRL harmonization significantly enhances tea export efficiency, a conclusion further supported by robustness and endogeneity tests. Heterogeneity analysis reveals that MRLs harmonization has a stronger impact on tea trade with low- and middle-income countries than with high-income countries. Mechanism analysis further demonstrates that reducing MRLs disparities between China and the RCEP countries reduces tea export costs and effectively boosts export volumes. These findings provide theoretical and practical insights for the RCEP countries to enhance tea trade standard harmonization and promote the sustainable development of regional tea trade.
1 Introduction and literature review
The Regional Comprehensive Economic Partnership agreement (RCEP) was officially implemented at the beginning of 2022. This agreement marked the formal establishment of the world’s most populous Free Trade Agreement (FTA). The FTA has the most diverse membership structure and the greatest development potential, and represents a new stage in China’s high-level opening up to the outside world (Wang et al., 2021). With the RCEP agreement coming into effect, more than 90% of goods will progressively be subject to zero tariffs. During this transition, the significance of standards and conformity assessments, as key technical trade measures to support the implementation of RCEP will become increasingly prominent (Zhang et al., 2023). As a major producer and exporter of tea, China’s tea trade is crucial to its international trade and economic development. In 2022, the total area of tea plantations in China remained at 3.2 million hectares, and it was predicted that the total output of dry and gross tea would exceed 3.2 million tonnes, and the total value of output would exceed 300 billion yuan (Chen, 2023). In addition, in 2023, the import and export value of tea in China was US$146 million and US$1.739 billion respectively, achieving a trade surplus of up to US$1.593 billion.
However, the maximum residue limits (MRLs) standards for pesticides vary significantly among the RCEP member countries. The most stringent country is Japan, with 297 MRLs set up in 2010, followed by Malaysia and South Korea, with 31 and 32 MRLs set up, respectively. These MRLs are much higher than China’s 9 MRLs. The only countries below China are Australia and Cambodia, with only 6 and 5 MRLs, respectively. Research indicates that divergent MRL standards raise trade costs (Schmidt and Steingress, 2022) and reduce the trade volume and flow (Fiankor et al., 2021). In recent years, China has significantly improved its MRL standards, expanding coverage to 110 categories. Over 50% of these standards have limit values between 0.01 and 0.1 mg/kg, helping to narrow the gap with the RCEP member countries. However, how will MRL coordination impact China’s tea exports to the RCEP members, and what mechanisms drive this effect? These questions warrant further exploration.
The current research primarily focuses on the measurement of differences in maximum residue limits (MRLs) for pesticides, their impact on international trade, and the underlying mechanisms.
1. In terms of measuring the standard deviation of MRLs, mainstream methods include Heterogeneity Trade Index (HIT), MRLs Standard Deviation Index (Rn method), Bilateral Strictness Index (BSI), and Pearson Distance Method. Winchester et al. (2012) introduced the HIT to assess the impact of non-tariff measures on bilateral trade in plant products, quantifying differences in MRLs standards. Achterbosch et al. (2009), building on Kox and Nordås (2007), refined the Rn method to measure cross-country MRLs differences. Li and Beghin (2014) further developed the BSI to evaluate MRLs stringency at the national and product levels. However, these three methods assume equal weights for all pesticide residue limits, failing to account for variations in regulatory intensity across different pesticides. Drogué and DeMaria (2012) proposed the Pearson similarity index, which measures standard differences by assessing the similarity between national MRLs. However, this method assumes that all countries regulate an identical number of pesticides, limiting its applicability.
2. There is currently no consensus on the trade effects of differences in MRLs standards in existing research. Although a few studies have shown that strict import standards can promote international trade (Choi and Yue, 2016), such as SPS measures generating import demand enhancement effects by reducing market asymmetry risks (Hyun and Jang, 2021), or that the net effect of MRL gaps on bilateral trade remains uncertain (Traoré and Tamini, 2022). However, most research support the view that MRLs differences negatively impact trade, particularly for the developing countries.
Firstly, the strict MRLs standards of importing countries have a restraining effect on the trade of exporting countries. Otsuki et al. (2001) used aflatoxin standards as an example and found that strict import country standards had the greatest negative impact on agricultural product exports. Similarly, Achterbosch et al. (2009) used Chile’s fruit exports to the European Union as an example and found that when the MRLs standards of the importing country became stricter, the trade flow of the exporting country significantly decreased. Dong (2011) used malachite green pesticide residue standards as an example and found that each unit increase in pesticide residue stringency in importing countries led to an 8.8% decline in China’s eel exports. Using an extended gravity model, Kong (2021) demonstrated that stricter MRLs regulations substantially decrease China’s tea exports.
Secondly, the trade effects of bilateral standard differences can influence trade flows between countries significantly. Fiankor et al. (2021) highlighted that stricter MRLs reduce the variety of traded goods and the observed trade flows. Achterbosch et al. (2009) took Chile’s fruit exports to the European Union as an example and found that greater bilateral MRLs disparities increase import resistance, significantly reducing trade flows. Dong (2014) used bilateral data between China and the developed countries to find that differences in MRLs regulation limit China’s tea exports to the developed countries. Dong and Wu (2024) found that poor regulation of MRLs suppresses the binary margin of China’s fruit and vegetable agricultural product exports, namely the trade cost effect suppresses the expansion margin and intensification margin.
Thirdly, the impact of differences in MRLs standards varies significantly among different countries. Compared to developed countries, strict MRLs standards have a more significant inhibitory effect on the export trade of developing countries (Handford et al., 2015). Xiong and Beghin (2014) further confirmed that the inhibitory effect on agricultural exports from developing countries is more significant when faced with strict MRLs standards. Traoré and Tamini (2022) noted that the high standard MRLs of member countries of the Organization for Economic Cooperation and Development (OECD), while promoting their import demand, have suppressed the export supply of developing countries. However, Hejazi and Grant (2022) found that stringent MRLs reduced US’s fruit and vegetable exports to the EU. On the contrary, Drogué and DeMaria (2012) argued that aligning MRLs with importing countries could enhance trade for developing nations. Furthermore, Shingal and Ehrich (2024) observed that the EU’s MRLs harmonization policy not only boosted intra-EU trade but also increased the export probability and value for non-EU countries, including OECD members and developing nations.
Fourth, heterogeneity effects of different MRLs Categories. Chen et al. (2024) found that MRLs targeting high-risk pesticides promoted China’s agricultural exports, while those addressing lower-risk chemicals significantly hindered trade. The study also demonstrated that both the number and strictness of MRLs regulations influence China’s agricultural export patterns. Karemera et al. (2021) argued that stringent MRLs are justified as necessary public health measures.
1. Regarding the impact mechanism of MRLs standards on trade, existing research mainly analyzes factors such as transaction costs and prices. Chen et al. (2024) suggested that MRLs adjustments influence both fixed and variable compliance costs, leading to heterogeneous effects on export margins. Traoré and Tamini (2022) argued further that the trade impact of MRLs disparities depends on factors such as consumer perception, transaction costs, and compliance costs. Additionally, stricter MRLs have been shown to restrict trade by raising product prices (Fiankor et al., 2021), and increasing market entry barriers (Curzi et al., 2020).
In summary, existing research provides a solid theoretical and methodological foundation for analyzing the impact of Maximum Residue Limits (MRLs) on international agricultural trade. However, several gaps remain. First, there is limited exploration of how MRLs standards affect tea exports. Second, most studies focus on differences in MRLs rather than their harmonization across countries. Although Shingal and Ehrich (2024) examined the positive effects of EU MRLs coordination on international trade, their reliance on the HIT index and the use of dummy variables (with Zhang and Wang, 2008 as a threshold) did not specifically address the harmonization of MRLs standards among different nations.
Building on this foundation, this study draws on the trade cost theory (Anderson and Van, 2003; Novy, 2011; Liapis, 2011; Handford et al., 2015) to construct a theoretical framework and refine the MRLs standard harmonization index. From a cost perspective, it analyzes the impact mechanism of MRLs standard harmonization on tea exports. The potential contributions of this study are elaborated below.
First, we develop a new MRLs standard harmonization index that incorporates absolute differences in pesticide residues and an improved Rn index based on Euclidean distance. The absolute difference index accounts for the absence of MRLs standards, while the improved Rn index considers the common pesticide residue standards of both countries. Compared with traditional methods, our index not only captures the number of pesticide types but also quantifies variations in residue limits, providing a more comprehensive measure of MRLs standard harmonization. This contributes significantly to the theoretical research on MRLs harmonization. Second, this study examines the relationship between the export unit price and the export quantity through the lens of trade costs. We propose a theoretical hypothesis that changes in MRLs standards influence trade costs and empirically test this hypothesis using data from the RCEP (Regional Comprehensive Economic Partnership) countries. Employing a stochastic frontier gravity model, we analyze the harmonization trends of MRLs standards among the RCEP countries, which, given their geographic proximity in the South Pacific region, may be particularly pronounced (Yeung et al., 2018). The findings of this study contribute to an enhanced understanding of the current state of MRLs standard harmonization in the RCEP countries. This addresses a gap in the literature on how MRLs standard alignment facilitates international tea trade. Furthermore, this study provides a theoretical foundation for accelerating the harmonization of tea MRLs standards in the RCEP countries, and offers policy recommendations to promote the sustainable development of the tea trade.
2 Development trends of pesticide residue standards in RCEP countries and their relationship with China’s tea export trade
2.1 Trend of revision of pesticide residue standards for tea in China
Since the establishment of New China, the pursuit of standardization has developed rapidly. In 1949, the Finance and Economic Commission of the State Council of the Central People’s Government was established, and the Standard Specification Department was set up. The State Science and Technology Commission, the National Bureau of Standards and Metrology, the General Administration of Standards, and the State Bureau of Quality and Technical Supervision were established successively. The year 2001 saw the establishment of the State General Administration of Quality Supervision, Inspection and Quarantine, and the State Administration of Standardization, and in 2008, China became a permanent member of the International Organization for Standardization (ISO) (Liu, 2011).
The regulation of MRLs in food is an important part of China’s standardization development. The regulation of MRLs in tea is governed by the following four series of documents: mandatory national standards (GB), recommended national standards (GB/T), agricultural standards (NY/T), and import and export industry standards (SN/T). These documents are issued by the State Administration of Market Supervision and Administration, the National Health Commission, the Ministry of Agriculture, and the General Administration of Quality Supervision, Inspection and Quarantine, which shows the importance that China attaches to MRLs in tea and the protection of tea products for consumers.
The regulation of MRLs in tea in China has a very clear development lineage. Prior to 2010, the “GB 2763–2005” standards indicated a rise in the MRLs for tea in China. According to GB 2763–2005, NY 660–2003 and other documents, a total of 9 pesticides were regulated for MRLs in tea in China, namely acephate, cyhalothrin, deltamethrin, fenitrothion, HCH, DDT and Permethrin, esfenvalerate, and flucythrinate, all of which are grouped under the category of insecticides. In 2013, there was a small explosion in China’s regulation of MRLs in tea. According to SNT2432, GB 2763–2012, GB 23200.112. NY/T 1720 and other documents, new acaricides, fungicides, herbicides and other categories, as well as its subordinate such as the acaricide pyridaben, fungicide carbendazim, herbicide glyphosate and other 16 types of pesticide residue MRLs. The situation was in a stable state between 2014 and 2016, China only new acaricide thiabendazole (Hexythiazox). By 2017, the Ministry of Agriculture (MOA) and the State Food and Drug Administration (SFDA) issued a number of documents, including GB 2763–2016, which increased the number of regulatory standards for MRLs to 48 and revised the limit for the insecticide methomyl from 3 to 0.2 mg/kg. The last big wave of growth came in 2022, with the National Health Commission the State Administration of Market Supervision and Administration, and the Ministry of Agriculture and Rural Development. The number of standards for MRLs increased to 106, and many of the standards were further reduced, so that the regulation of MRLs in tea in China could reach a new height, which shows that the relevant governmental departments attached great importance to it. Figure 1 depicts the development trend of the number of MRLs standards in China from 2010 to 2022.
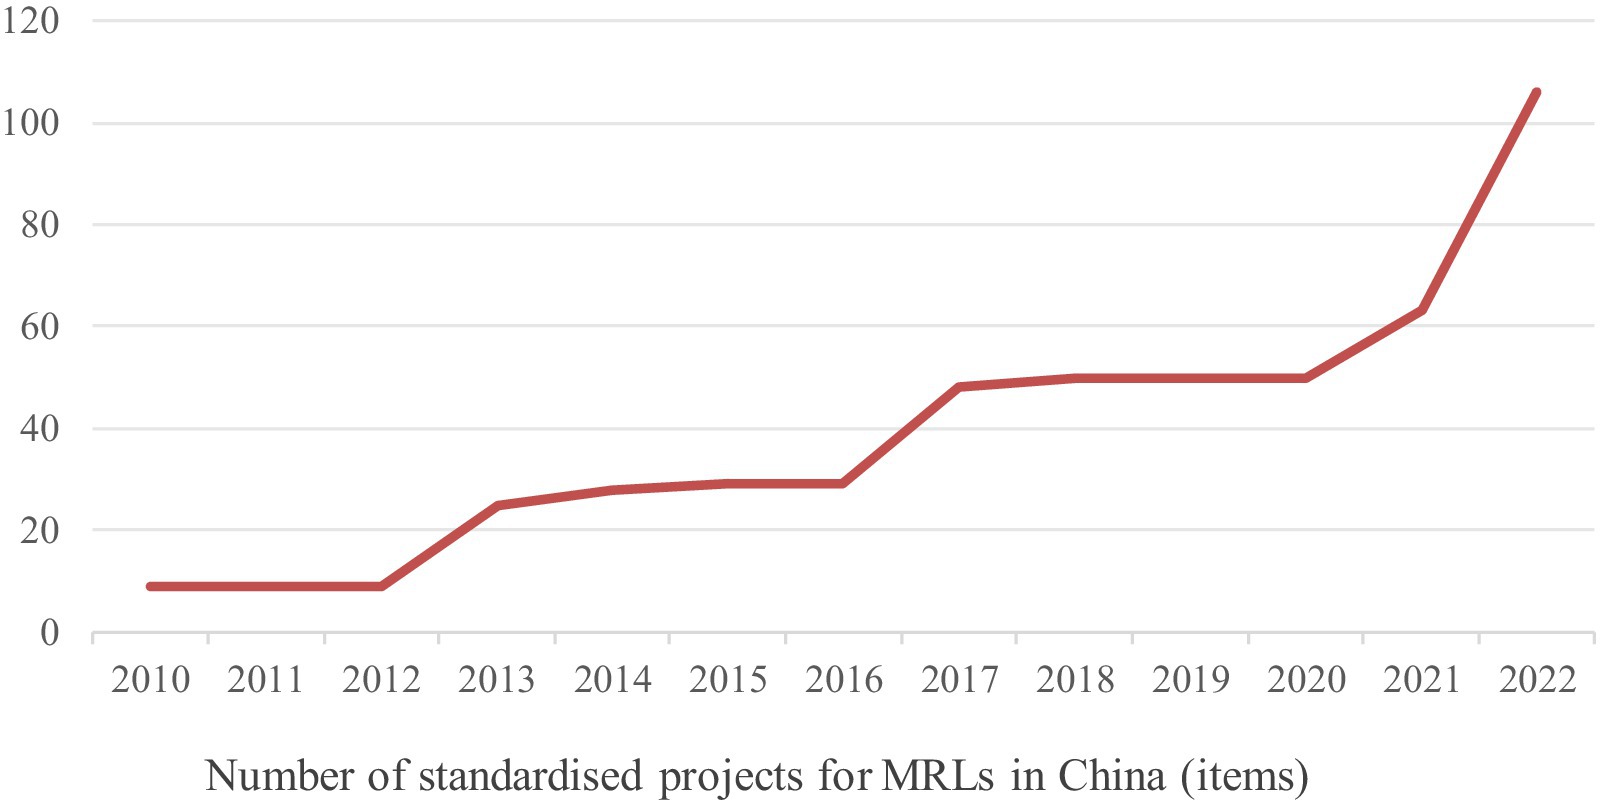
Figure 1. Number of standard projects for MRLs in China, 2010–2022.
2.2 Development trend of tea pesticide residue standards in RCEP countries
In the process of tea production, the application of pesticides has become an essential component. The pesticides are mainly used for the prevention, elimination or control of agricultural, forestry diseases, insects, grasses and other pests. In addition, these chemical agents are used to purposefully regulate the growth of plants, insects, chemically synthesized or other biological natural substances, or a mixture of substances in their preparation of tea. The widespread use of pesticides has greatly reduced the production burden of tea farmers, but also enhanced the efficiency of tea production. However, there are always two sides to everything, “the other side of the coin” is the application of pesticides can bring about a variety of problems. For instance, unregulated use of pesticides is problematic. The use of pesticides, by the tea farmers can result in pesticide dosage problems, pesticide mixing and environmental pollution, among others. These problems may not be obvious in the production process. However, once you reach the consumer side, that is, when consumers drink the tea, the harmful effects of pesticides will emerge instantly.
Therefore, governments are paying close attention to pesticide residues in tea, and have set maximum residue limits (MLRs) for pesticides to control the safety of tea consumption. The MRLs set by each country basically rely on the basic economic situation of the country, plus the standard system and standard function, standard technology level, standard control and standard update speed and other factors. Generally speaking, the more economically developed a country is, the more it develops its own series of laws and regulations for the development of high-quality products. For example, residents have higher expectations of the quality of consumer goods, such as the establishment of pesticide MRLs standards for a greater number of items.
Today, the significance of the MRLs standard has expanded from ensuring food safety to becoming a new barrier to trade. In import and export trade, MRLs are categorized as sanitary and phytosanitary measures (SPS). As countries continue to add to their MRLs, new barriers to trade have grown by leaps and bounds and have become an integral part of today’s tea trade.
Two countries, Brunei and Laos, are not included in the analyses of this article due to their serious missing data. This article focuses on the impact of changes in the MRLs standards of RCEP countries on China’s tea exports from 2010 to 2022. The number of MRLs standards in each country is shown in Table 1.
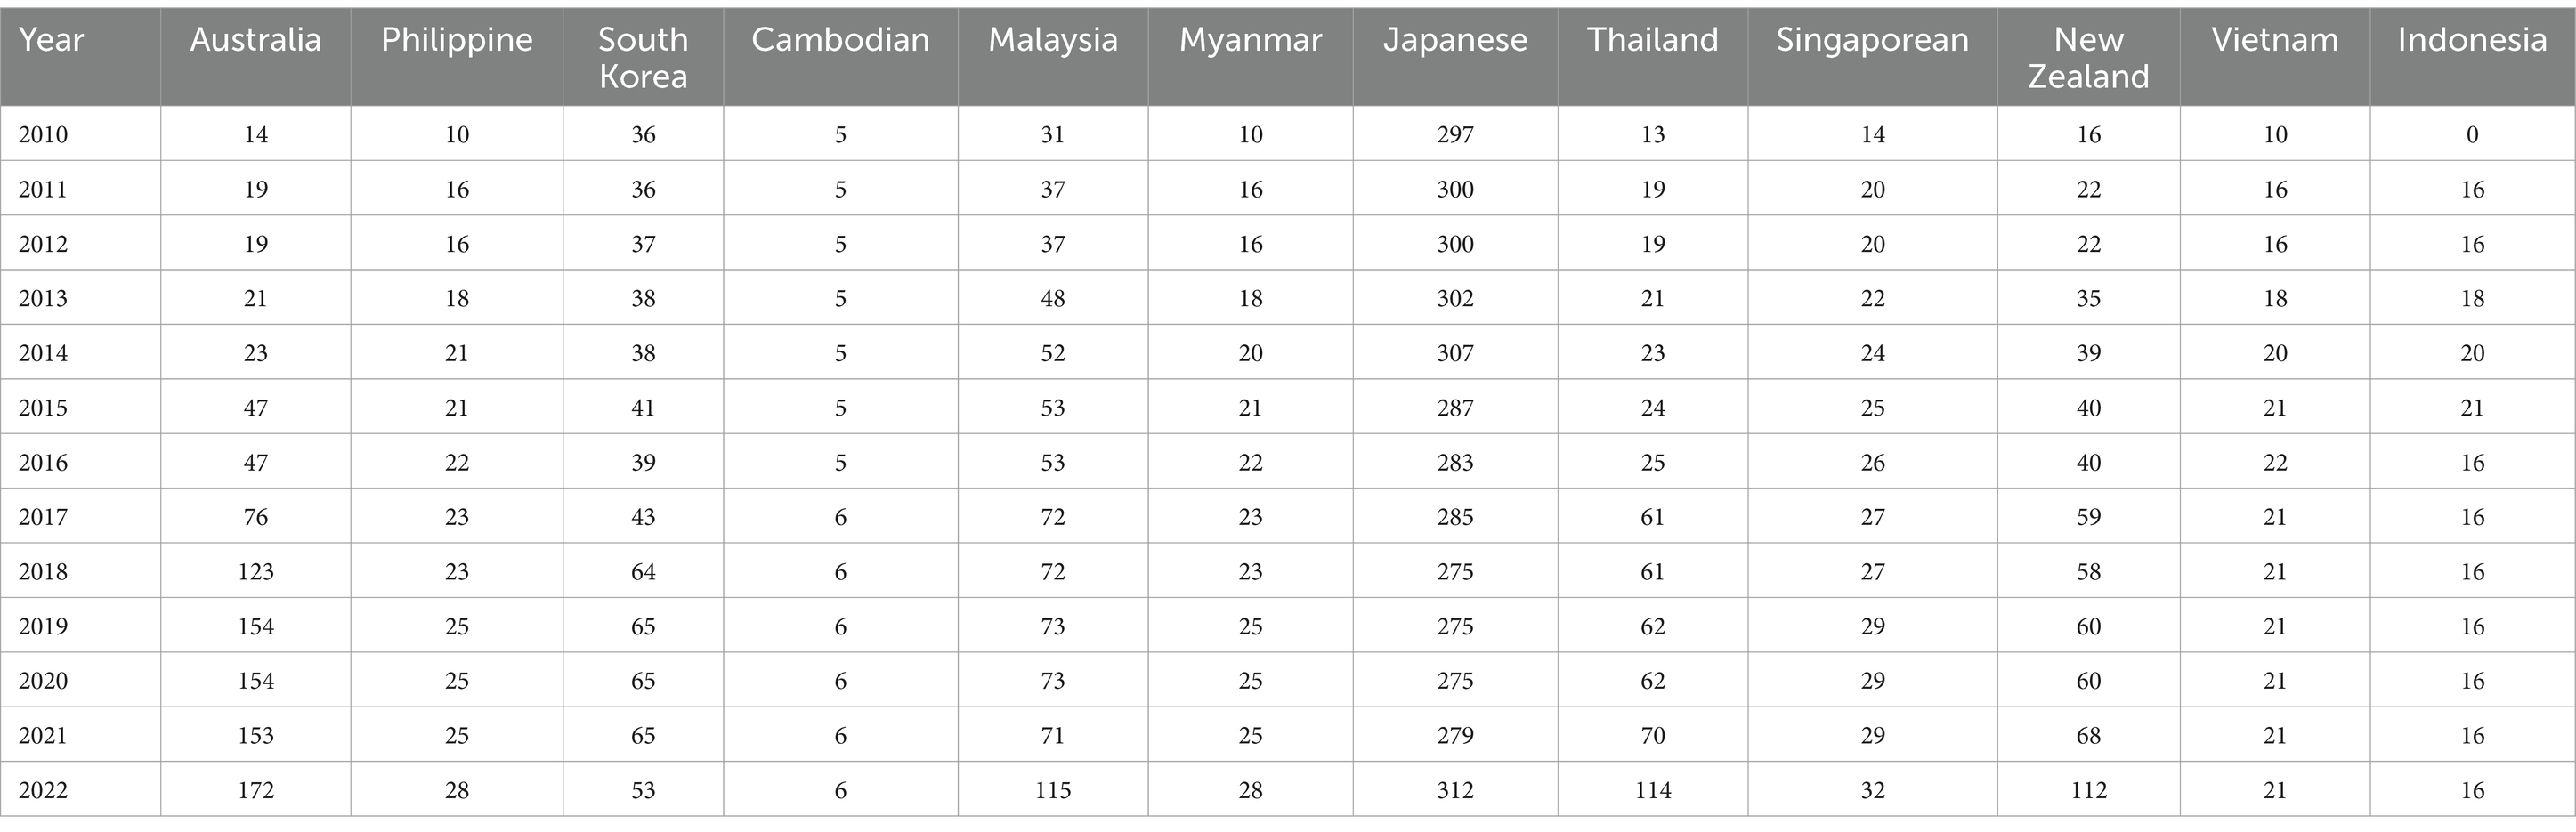
Table 1. Number of MRLs standards in RCEP countries, 2010–2022.
As can be seen from the above table, the number of MRLs standards of RCEP member countries is generally on the rise. As the subject of the study, the number of MRLs in China has been increasing on a yearly basis, soaring from single digits to triple digits between 2010 and 2022, an increase of nearly 11 times. As a developed country, Japan, which benefits from the Positive List System for agricultural chemicals imported into fruits and vegetables, started with a higher number of MRLs standards, reaching 297 in 2010. The number of MRLs far exceeded the number of national standards of the rest of the countries in the same year. However, the number of MRLs standards in Japan is not on the rise compared to other countries but is hovering around 300. Japan’s adjustment of the number of standards for MRLs is partly due to the adjustment of its foreign trade policy. Malaysia, Thailand and New Zealand’s number of MRLs standards rise more gently until 2021, and then suddenly shoots up to around 110 in 2022. Following the COVID-19 pandemic, governments worldwide prioritized responses to public health emergencies and economic stabilization during 2020–2021. As the pandemic containment measures improved, international tea trade demonstrated a gradual recovery trend. This global crisis increased consumer awareness of food safety protocols, concurrently spurring intensified international scrutiny of tea maximum residue limit (MRL) standards. Within Southeast Asia, Malaysia and Thailand, as regional tea export leaders, are strategically enhancing their products’ international competitiveness through dynamic updates to national MRL frameworks. Conversely, as a representative tea-importing nation, New Zealand initiated the development of stricter MRL regulations, responding to sustained growth in domestic demand for organic and health-focused food products. Meanwhile, developed economies including Australia, Japan, and South Korea maintain policy continuity through their pre-existing comprehensive MRL systems. By contrast, developing nations like Cambodia and Indonesia predominantly adhere to Codex Alimentarius Commission (CAC) guidelines without implementing substantive domestic standard reforms.
Overall, the number of MRLs standards in RCEP countries has basically increased steadily. To protect their tea trade in today’s international trade, RCEP countries have become more and more stringent on MRLs standards. At the same time, to protect their own tea competitiveness, countries with fewer MRLs standards are moving closer to countries with more MRLs standards. However, the countries that adopt more comprehensive MRLs standards are engaging in beggar-thy-neighbor policies, imposing stricter specific criteria for items subject to MRLs.
2.3 Relationship between trends in MRLs standards in RCEP countries and China’s tea export trade
The area under tea cultivation as well as the production output of each province in China is basically on an upward trend (Mei and Liang, 2024). China’s total tea production and total tea exports have increased over the years. According to the data disclosed in the China Statistical Yearbook, the total production of tea in China skyrocketed from 1,475,000 tonnes in 2010 to 3,342,000 tonnes in 2022, this is a strong increase in production. The substantial increase in tea production is attributed to the country’s modernization of the tea industry’s production transformation and the research and development and application of machinery (Qiu and Liu, 2023). According to the data provided by the United Nations Trade Statistics, China’s total tea exports were expected to reach US$2 billion from US$700 million between 2010 and 2022, with a general upward trend. According to Figure 2, China’s total tea production and total tea exports are in an optimistic position, and China attaches more importance to tea production as well as exports.
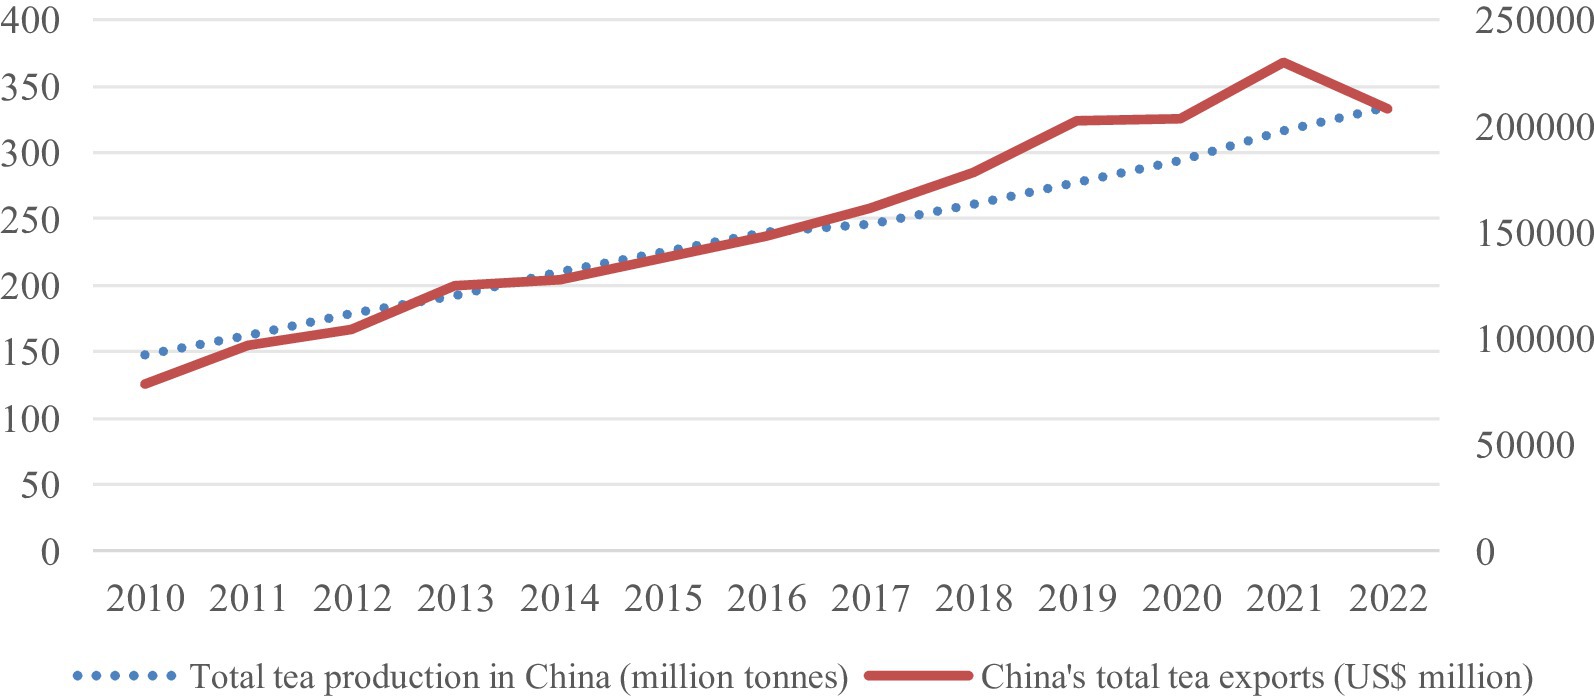
Figure 2. Total Chinese tea production and total Chinese tea exports.
As the world’s most populous FTA with the most diverse membership structure and the greatest development potential, tea trade between China and RCEP countries is particularly important. According to Figure 3 the proportion of China’s total tea exports to RCEP is generally on an upward trend. From 12.05% in 2010 to 24.59% in 2022, reaching a peak of 26.92% in 2020, the RCEP countries have gradually become the main market for China’s tea exports. Therefore, to understand the situation of China’s tea exports, it is inevitable to bypass the RCEP countries. The selection of the RCEP countries as the target market for China’s tea exports in this study is scientifically justified.
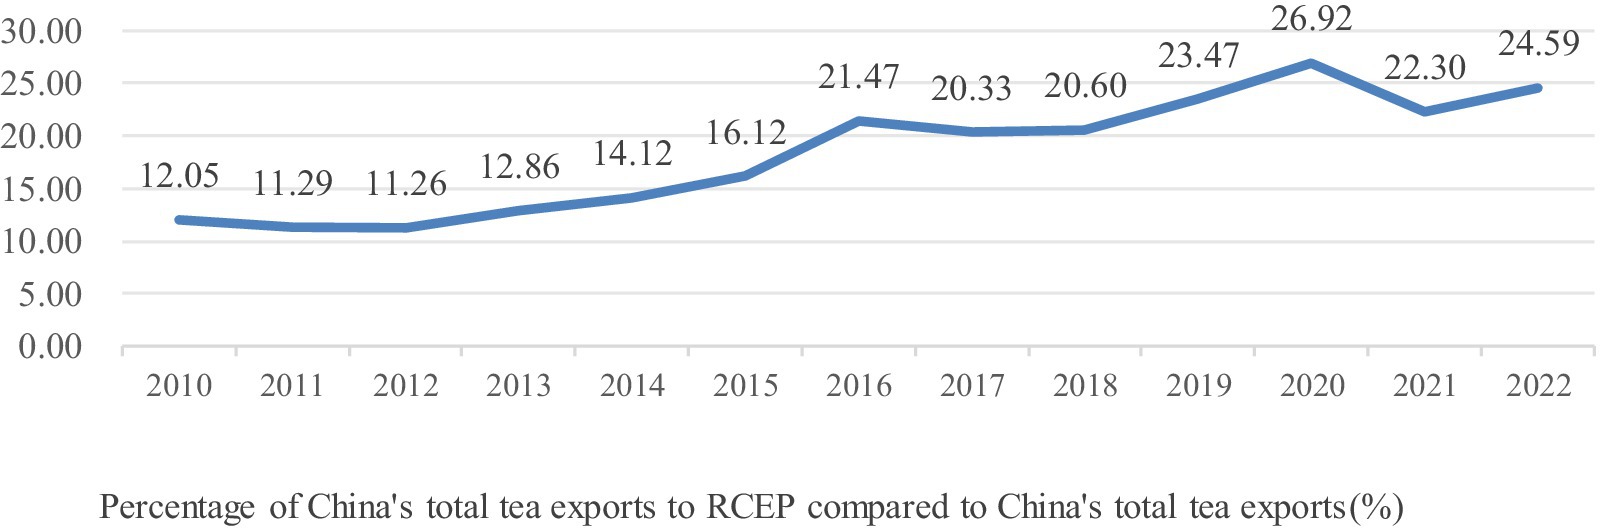
Figure 3. Total Chinese tea exports to RCEP as a percentage of total Chinese tea exports.
The comprehensive Table 1 and Figures 2, 3 clearly indicate that the number of MRLs standards in RCEP countries is basically on the rise. Countries such as Australia, Malaysia and New Zealand are experiencing strong growth in MRLs clinker, while the number of MRLs standards in China has also increased significantly. The scale of China’s tea export trade to RCEP countries has been expanding gradually. Common sense suggests that the rising complexity of MRLs standards is a negative trend for tea exports as it creates a greater obstacle to trade. Focusing on the year 2022, China’s total tea exports declined considerably compared to the previous year, while the MRLs standards of the RCEP countries witnessed a large-scale increase, but the ratio of China’s tea exports to the RCEP total to China’s total tea exports increased by 2.29% compared to the previous year. This means that in that year, the MRLs standards of various countries were further tightened. The export orders of Chinese tea decreased due to the Pandemic, and the market share of Chinese tea exports in RCEP was further enlarged. The phenomenon is not consistent with common sense, and the relationship deserves further excavation.
In summary, MRLs standards have been a key factor that cannot be ignored in the tea trade of RCEP member countries. However, the MRLs standards of each country are not only different in number and items, but also different in specific standards for the same item. Until 2022, Cambodia has the lowest number of MRLs, with only six standards, while Japan has the highest number of MRLs, with 312 items. For the same pesticide MRLs, for example, for dicofol, the most stringent standard is 0.01 mg/kg in China, while the most lenient ones are 40 mg/kg in the Philippines, Myanmar, among others. The most lenient limit is 4,000 times more stringent than the most stringent limit, which is a very large span. Therefore, knowing that the gap in MRLs standards has a large impact on tea trade, it is difficult to draw a clear and specific link between MRLs standards and tea export trade because it is inherently difficult to quantify. In the following section, we will quantify the differences in MRLs standards between China and RCEP member countries, and construct a pesticide residue harmonization index, in order to obtain the linkage between China’s tea exports to RCEP member countries and pesticide residue harmonization.
3 Construction of pesticide residue harmonization index
In order to express more realistically and concretely the degree of harmonization or similarity of the MRLs for tea between China and the RCEP countries, this article sets up the concept of pesticide residue harmonization. As the name suggests, the degree of harmonization of pesticide residues refers to the degree of similarity between the two countries’ MRLs under a certain commodity category, with a certain chasing trend. To more intuitively feel the degree of similarity, it is reduced to the form of percentage. In this article, to construct the concept of pesticide residue harmonization degree with scientific nature, the overall method in mathematics, distance measurement, etc., are used.
3.1 Calculation of pesticide residue harmonization
Countries set standards for MRLs based on their own national realities, with little consideration of the impact on other countries. Two countries setting standards for a particular MRLs may have a wide range of values, ranging from 0.01 mg/kg to 50 mg/kg. Therefore, it is difficult to directly calculate the degree of harmonization of pesticide residues. Instead, we can broaden our view to the whole by calculating the difference in pesticide residue standards between the two countries, and then subtracting the total from the difference in pesticide residue standards between the two countries to obtain the degree of pesticide residue harmonization.
Since in the process of tea export, generally speaking, if a country detects the presence of a pesticide residue exceeding a certain standard in imported tea, it will prohibit the import of tea in that instance. Regarding the proportion of a particular pesticide residue standard to the overall MRLs standard, this article adopts a homogenization process.
When calculating the differences between the pesticide residue standards of the two countries, we will find more interesting points. Firstly, some pesticide residue standard indicators are set separately in the two countries, i.e., country A sets country A has set some indicators, and country B has not set standards. For this kind of pesticide residue standard difference between country A and country B, it is called absolute difference among all pesticide residue standard differences. Secondly, when both countries have established standards for a particular pesticide residue, but the specific limits are different, this is referred to as a relative difference in the total pesticide residue standard difference.
3.1.1 Calculation of absolute differences in pesticide residues
When one country sets up certain MRLs for tea and the other country does not, we can feel the difference in pesticide residue standards for tea between the two countries. This part of the pesticide residue standard difference due to only one party to set up, the gap between the two sides is very obvious and relatively easy to quantify, this article is called pesticide residue absolute difference. The calculation of the absolute pesticide residue standard difference between the two countries is relatively simple. With the volumes determined above, the formula for calculating the absolute pesticide residue difference is as follows (Equation 1):
In the above equation, the , the are the same as above. refers to the absolute difference in pesticide residues between the two countries. refers to the number of pesticide residue standard items established by each country, and . The number of elements in the intersection of pesticide residue index items of the two countries. According to the above formula, when the number of pesticide residue standard items established independently by each country is larger, the absolute difference of pesticide residue between the two countries is also larger.
3.1.2 Calculation of relative differences in pesticide residues
The absolute differences in pesticide residues can be quantified by counting the unique pesticide residue standards of each country. In the face of the fact that both countries have set up standards for a certain pesticide residue but with different specific limits, this part of the article is named as the relative difference in pesticide residues. Due to the wide range of MRLs, it is difficult to quantify the relative pesticide residue differences in the context of economics. In this article, we decided to use the heterogeneity index Rn method derived from the Euclidean Distance to measure the relative differences in pesticide residues between the two countries.
The basic calculation of the Euclidean distance is as follows (Equation 2):
The Rn method, constructed according to Achterbosch et al. (2009), is calculated as follows (Equation 3):
Therefore, in this article, the Rn method was applied to measure the relative differences in pesticide residues calculated as Equation 4:
In the above equation refers to the two countries that calculate the relative differences in pesticide residue standards, and i stands for the establishment of the two countries for a particular pesticide residue standard. Where refers to the relative difference in pesticide residues between the two countries, and and represents the different qualification standards of the two countries in the pesticide residue standard i, and with the number of elements in the two countries’ pesticide residue index items. The main difference between this article and the Rn method is that the pesticide residue standards not established by one of the two countries are not recorded as zero, but only for the common pesticide residue standards of the two countries are measured. According to the above formula , the greater the difference between the two countries in the limits set for a common pesticide residue standard, the greater the distance between the two countries, and the greater the relative difference between the two countries in terms of pesticide residue standards.
3.1.3 Calculation of pesticide residue harmonization
The relative and absolute differences in pesticide residue standards between the two countries have been quantified above, and the degree of pesticide residue harmonization between the two countries can be obtained by subtracting the difference in total pesticide residue standards between the two countries according to the setting. The formula for calculating the degree of harmonization of pesticide residues is as follows (Equation 5):
The relative and absolute differences calculated above were brought into the above formulae to obtain the following extended formula for pesticide residue harmonization (Equation 6):
In summary, the pesticide residue harmonization of the two countries is obtained by dividing the differences in pesticide residue standards between the two countries into relative and absolute differences for quantification, and then subtracting the differences in pesticide residue standards between the two countries from the total by the holistic method. This concludes the quantification of pesticide residue harmonization between the two countries.
3.2 Trends in pesticide residue harmonization between China and RCEP countries
According to the MRLS data of RCEP countries provided by Huo et al. (2024), the harmonization degree of agricultural residues between China and RCEP countries can be obtained by bringing in the above formula. The pesticide residue harmonization of tea between China and RCEP countries is shown in Table 2.
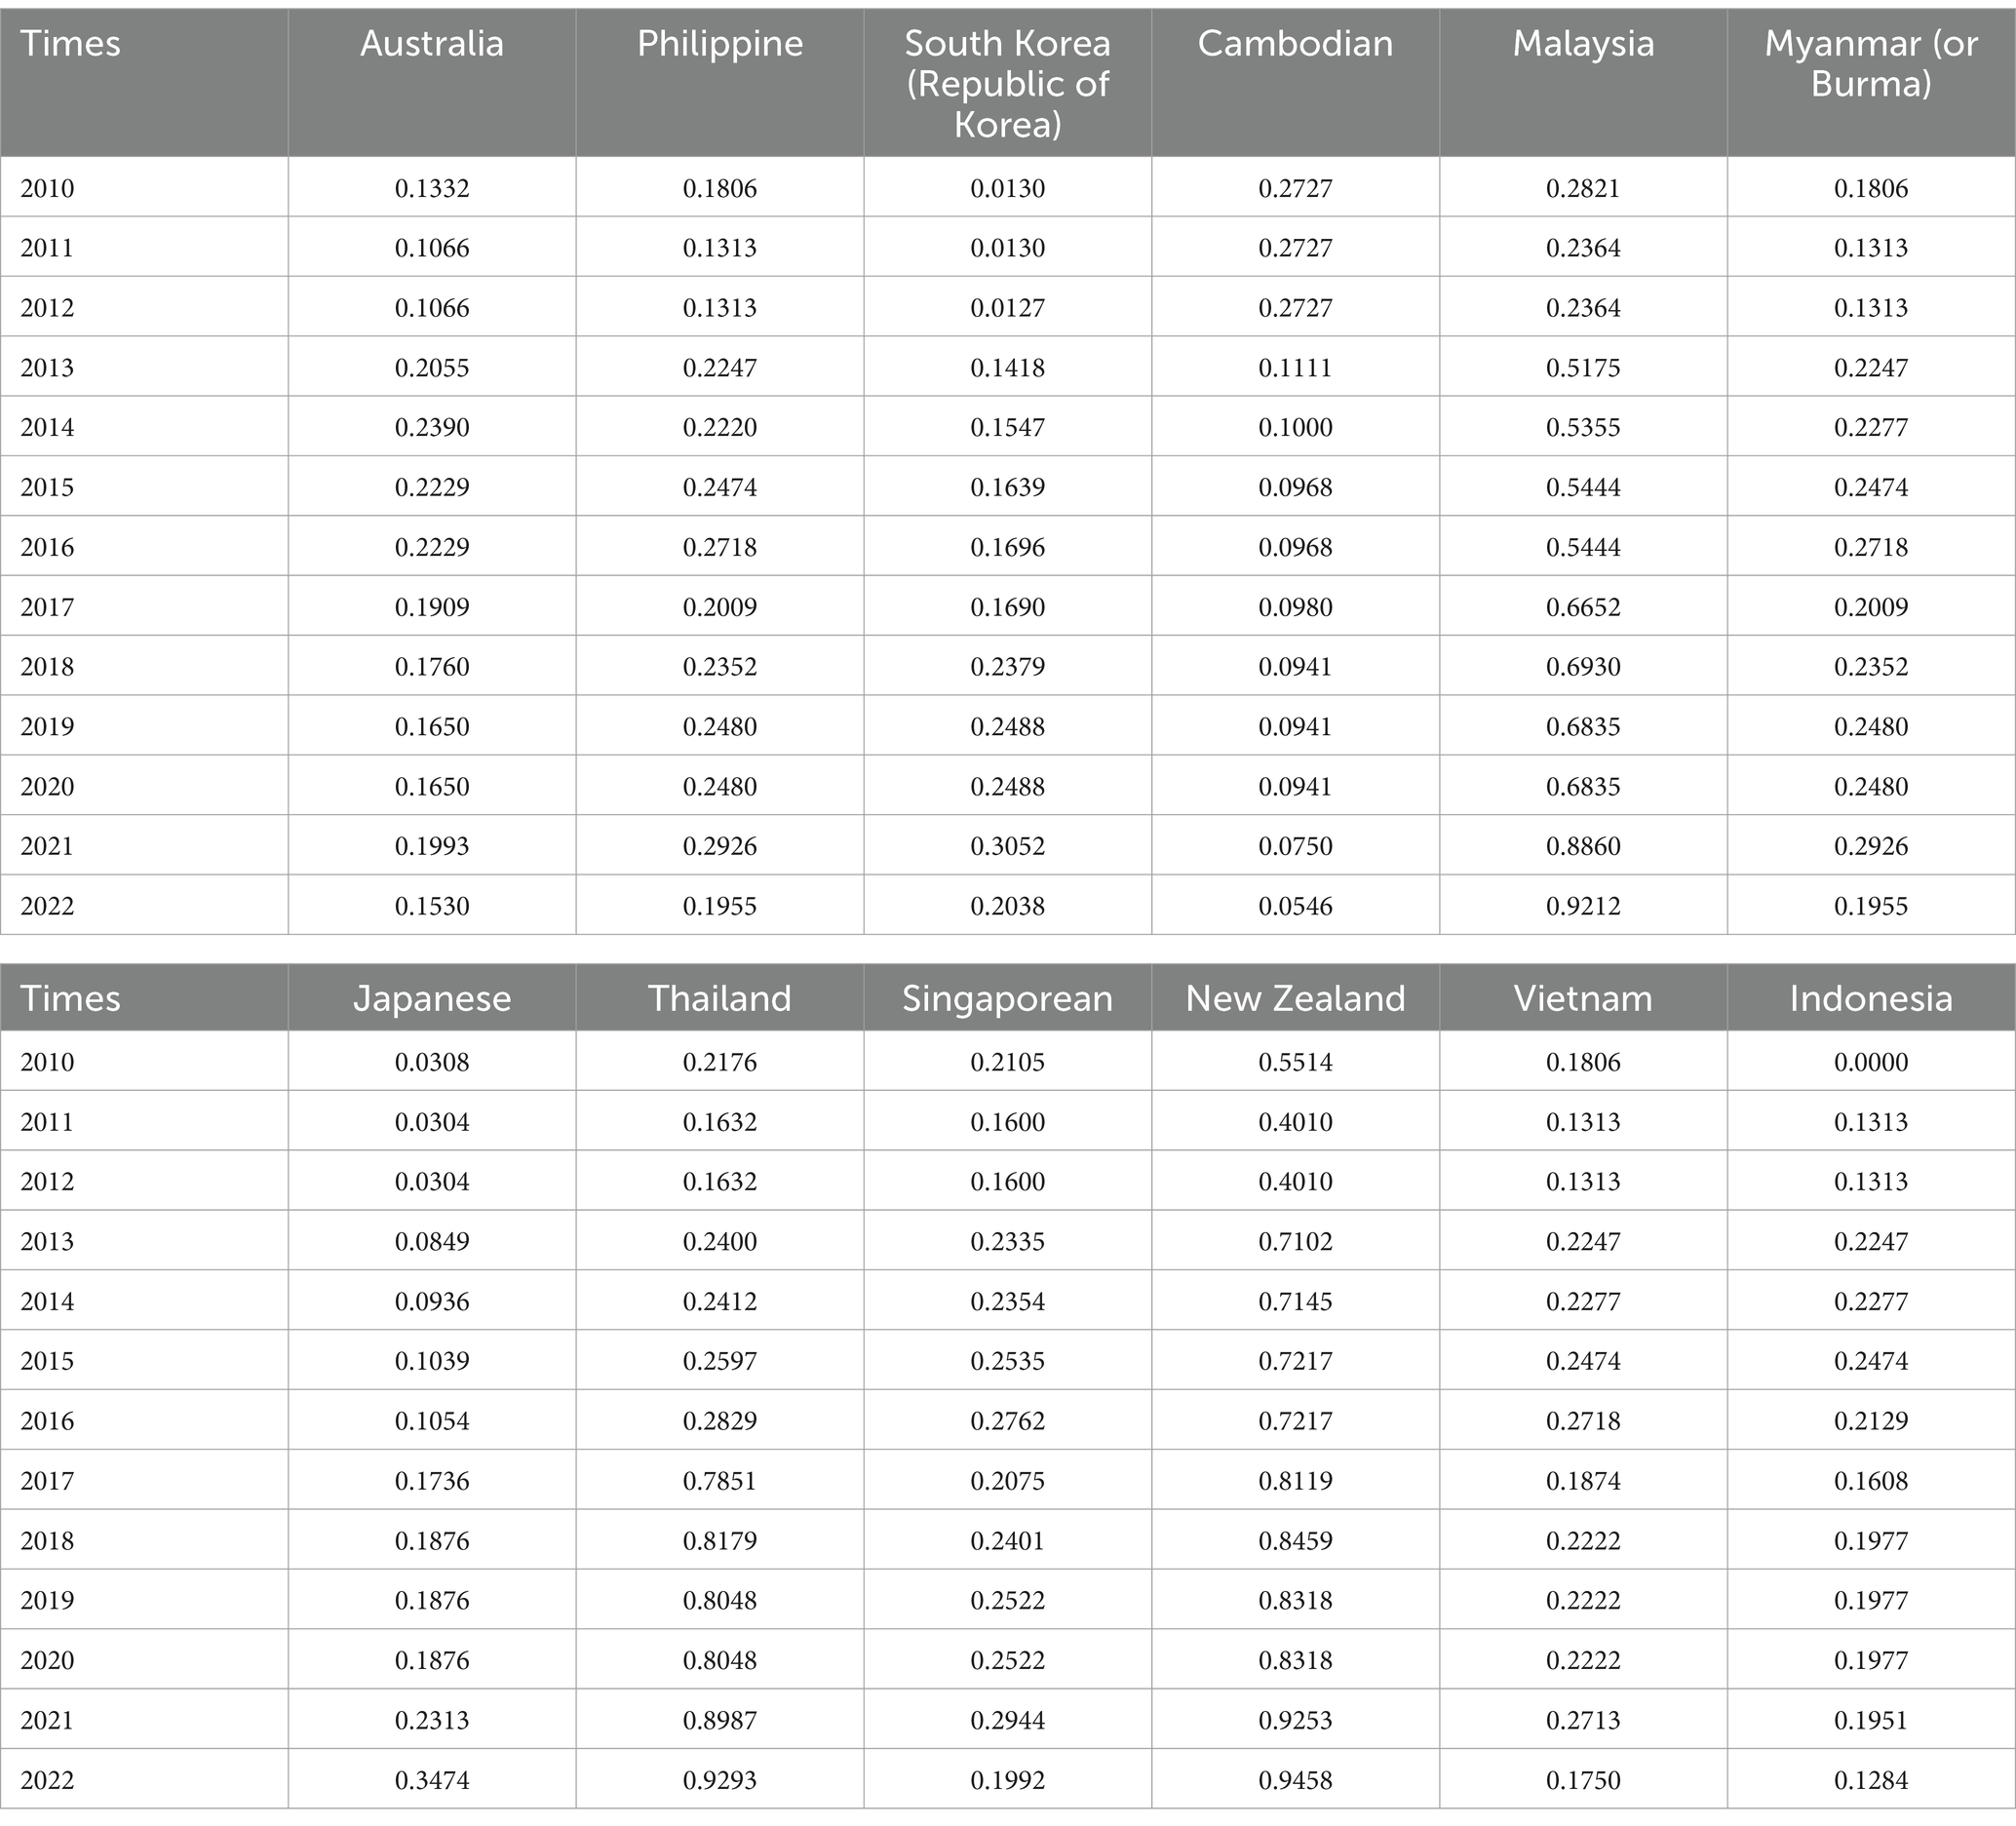
Table 2. Harmonization of pesticide residues between China and RCEP countries.
From the above table, we can intuitively conclude that the degree of harmonization of pesticide residues between China and the RCEP countries is on the rise. Among them, there are countries catching up with China’s MRLs standards, mainly the developing countries with weaker complexity of NTBs than China. There are also countries catching up with other countries’ MRLs standards, mainly developed countries with stronger complexity of NTBs than China. The specific linkages of pesticide residue harmonization on China’s tea exports to RCEP countries are further analysed below.
4 Mechanism of pesticide residue harmonization on tea export trade
4.1 The relationship between MRLs standards and trade costs
For the link between MRLs standards and international trade, academics have mainly taken a trade cost perspective. Scholars such as Anderson consider trade costs as all the costs that must be paid to obtain goods in addition to the production costs of goods, including transport costs, policy costs (tariffs and non-tariff barriers), language costs, information costs, and the cost of fulfilling contracts (Anderson and Van, 2003). Novy (2011) method of correlating trade with the size of the partner country’s economy and trade costs has become the basic template for the study of international trade in recent years. Liapis (2011) showed that trade costs of agricultural exports play a significant role in trade relations. The linkage between MRLs standards and trade costs is primarily reflected in the compliance costs. These costs include infrastructure upgrades, hiring professional operators, and obtaining relevant certifications to ensure accurate compliance with MRLs standards (Handford et al., 2015).
Significant differences in regulatory standards across countries increase compliance costs for exporters, limit product variety, and constrain export destinations (Schmidt and Steingress, 2022). These challenges are particularly evident when exporters must adhere to stricter foreign regulations than their own, often incurring additional fixed costs (Macedoni and Weinberger, 2022). For instance, excessively high compliance costs may force less competitive small and medium-sized enterprises (SMEs) out of the export market (Dong and Wu, 2024). Such enterprises often lack the flexibility to quickly adjust their production processes (Shingal and Ehrich, 2024).
However, regulatory harmonization between countries can effectively reduce trade compliance costs. When exporters adopt stricter domestic standards, their compliance burden in importing countries decreases accordingly (Shingal and Ehrich, 2024). This harmonization minimizes regulatory costs by aligning Maximum Residue Limits (MRLs) and reducing disparities in regulatory stringency among the trading partners. Additionally, regulatory harmonization can encourage firms to invest in standardized production by increasing demand for compliant products, thereby further expanding export opportunities (Schmidt and Steingress, 2022).
Based on the above analysis, this article argues that greater harmonization in pesticide residue standards will reduce trade costs. Building on this premise, it conducts a theoretical hypothesis inference analysis.
4.2 Assumption: the increase in pesticide residue harmonization leads to a decrease in trade costs
The establishment of the MRLs standards regime is a form of technical barrier to trade, Anderson and Van (2003) argues that the impact of trade barriers on trade is mainly from a cost-of-trade perspective, i.e., they increase the cost of exporting from other countries to their own countries, and thus serve the purpose of preventing other countries from protecting their own trade.
The most intuitive data on China’s tea exports is the total amount of exports. However, it is difficult to analyse the total export value directly from the cost point of view, so the total export value is divided into export unit price and export volume for analysis.
Therefore, for the mechanism of pesticide residue harmonization and China’s tea export, this article will start from the cost point of view, the total amount of export will be divided into the export unit price and export volume, and analyse the situation, and has obtained the impact path on the total amount of export. It sets the cost function of China’s export of tea as , where S is the degree of harmonization of pesticide residues. The export unit price function is then set as , where is the coefficient of the cost function on the export unit price, f(X) is the function of the remaining factors affecting the export unit price, and is a constant. Then, set the export volume function as where is the coefficient of the cost function on the export volume, and is the coefficient of the cost function on the export volume, f(X) is the function of the remaining factors affecting the export volume, and is a constant.
If it is assumed that an increase in pesticide residue harmonization results in a decrease in trade costs, then the derivation of the production function yields the following Equation 7:
At this point, the export unit price function and export volume function to the pesticide residue harmonization degree of derivatives, leads to the following Equation 8:
From the above equation we know that when β > 0, then 0, when the increase in pesticide residue harmonization will lead to a decrease in export unit price; when , then 0, then the increase of pesticide residue harmonization degree will lead to the decrease of export volume. The opposite is true (Table 3).
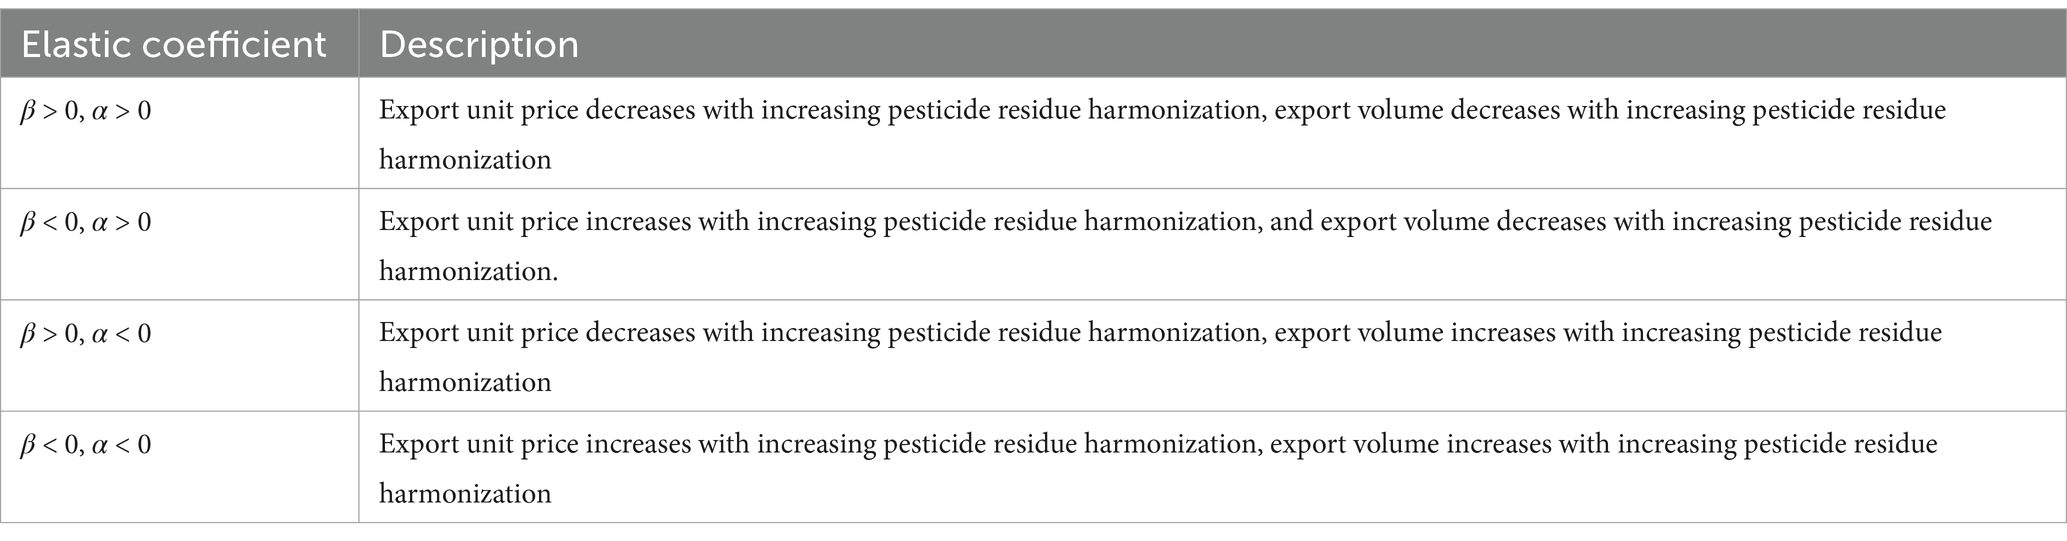
Table 3. Theoretical hypotheses.
To sum up, the change in pesticide residue harmonization leads to the change in the cost of China’s tea exports, which leads to the change in the unit price and total amount of China’s tea exports, and ultimately affects the change in the total amount of exports. As to whether the change in pesticide residue harmonization degree leads to the change in the cost of Chinese tea export is positive or negative ( the sign of), the export unit price and export volume about whether the cost change is positive or negative ( vs. the sign of), a more detailed impact formulation will be further analysed in the next part of the empirical study.
5 Modeling
In constructing a stochastic frontier gravity model, Armstrong suggests estimating trade resistance by incorporating influences that cannot be easily changed in the short and medium term, such as economy, distance, population, and so on, into the stochastic frontier gravity model, while influences that can be artificially changed in the short term, such as trade agreements, institutional environment, and infrastructure, are incorporated into the trade inefficiency model (Armstrong, 2007). This article constructs a stochastic frontier trade gravity model based on the above ideas.
In this article, we construct a stochastic frontier gravity model expressed as follows (Equation 9):
This article constructs a trade inefficiency model expressed as follows (Equation 10):
In the above regression model, the subscript i is the tea exporting country. Due to the theme and space limitations, the exporting country in this article is fixed as China; j is the tea importing country, i.e., the rest of the RCEP member countries; and t is the trade qualifying period, which is selected as 2010–2022 in this article.
In the stochastic frontier gravity model (7), the explanatory variable is the total tea exports from country i to country j in period t. and the total tea exports from country i to country j in period t. The explanatory variables are and and the gross national product (GNP) of country i and country j in period t (the base period is the constant 2010 US$). and are the total population of country i and country j in period t, and is a set distance between countries i and j in period t, is a dummy variable set to indicate whether there is a common official language between the two countries (yes = 1, no = 0).
In the trade inefficiency model (8), the explanatory variable is which shows the trade efficiency of country i to country j in period t. The explanatory variable is the set degree of harmonization of pesticide MRLs between country i and country j on tea in period t, which is derived from the constructed calculation method above. is a set dummy variable indicating whether country j is a developed country in period t (yes = 1, no = 0). is expressed as the total amount of tea imported by country j from all countries in the world in period t, and is expressed as the trade openness of country j in period t, the is expressed as country i’s total domestic production of tea in period t (Table 4).
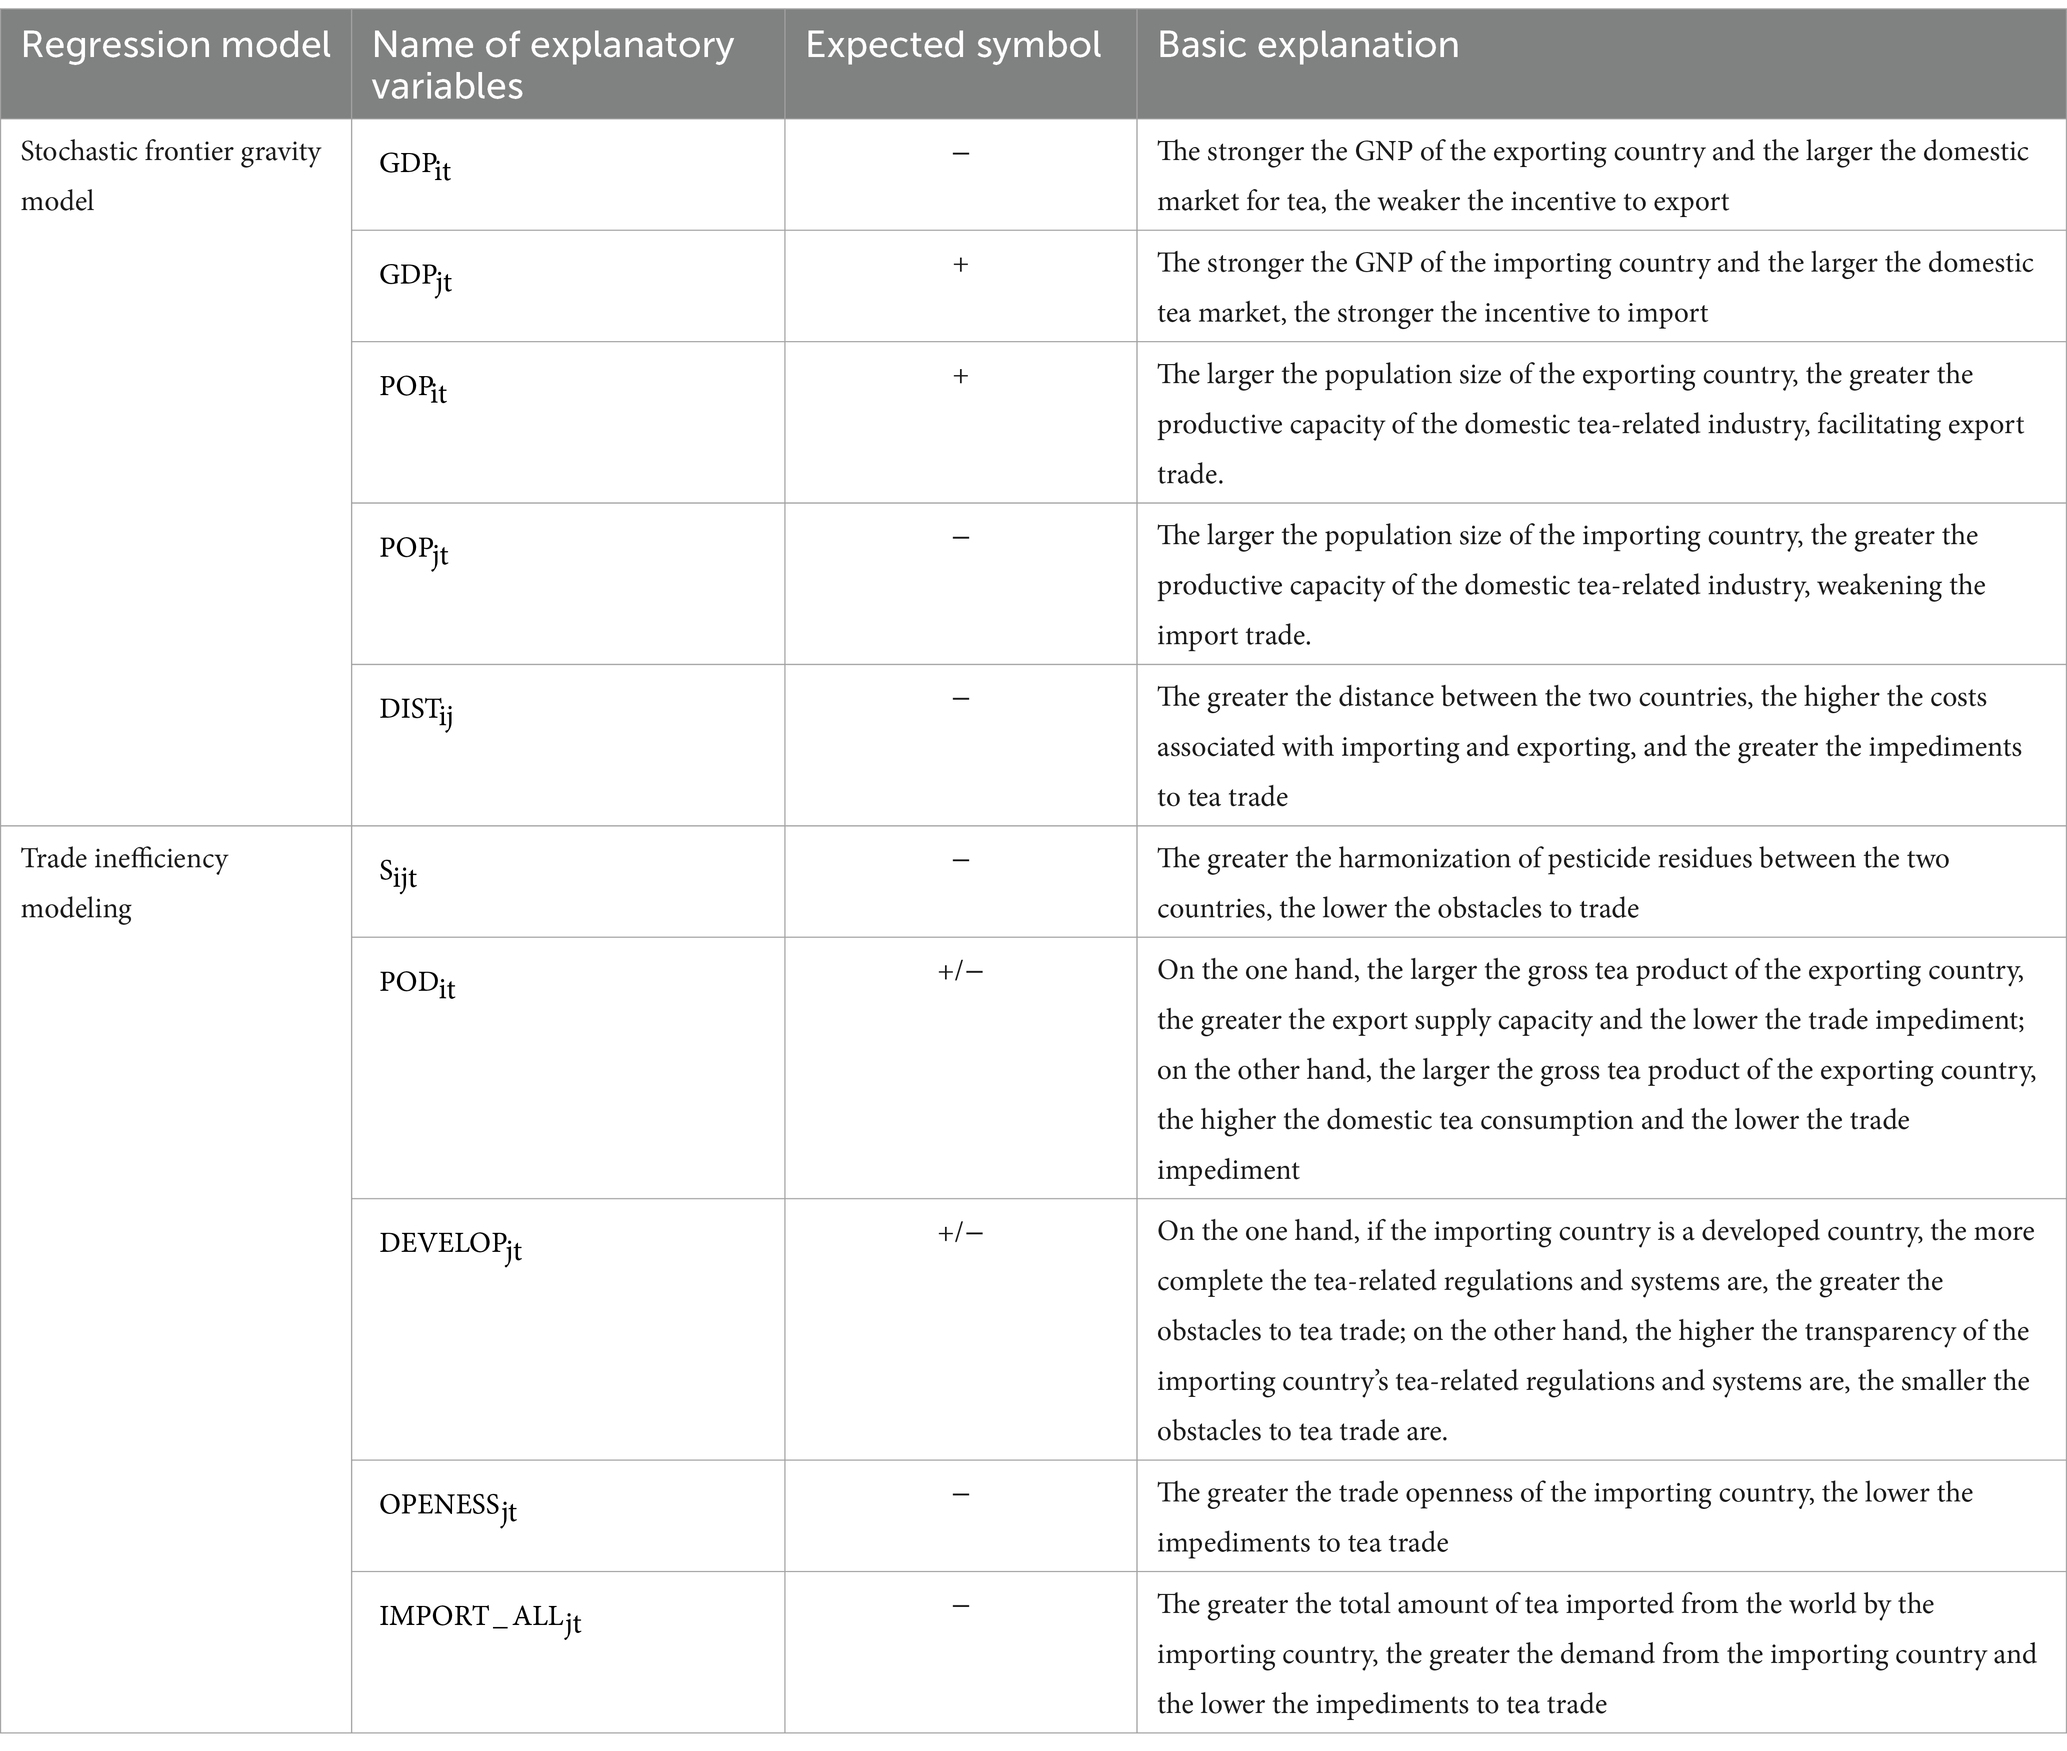
Table 4. Expected signs of explanatory variables and related underlying explanations.
The sources of each variable used in the text to construct the stochastic frontier gravity model are shown in Table 5 below:
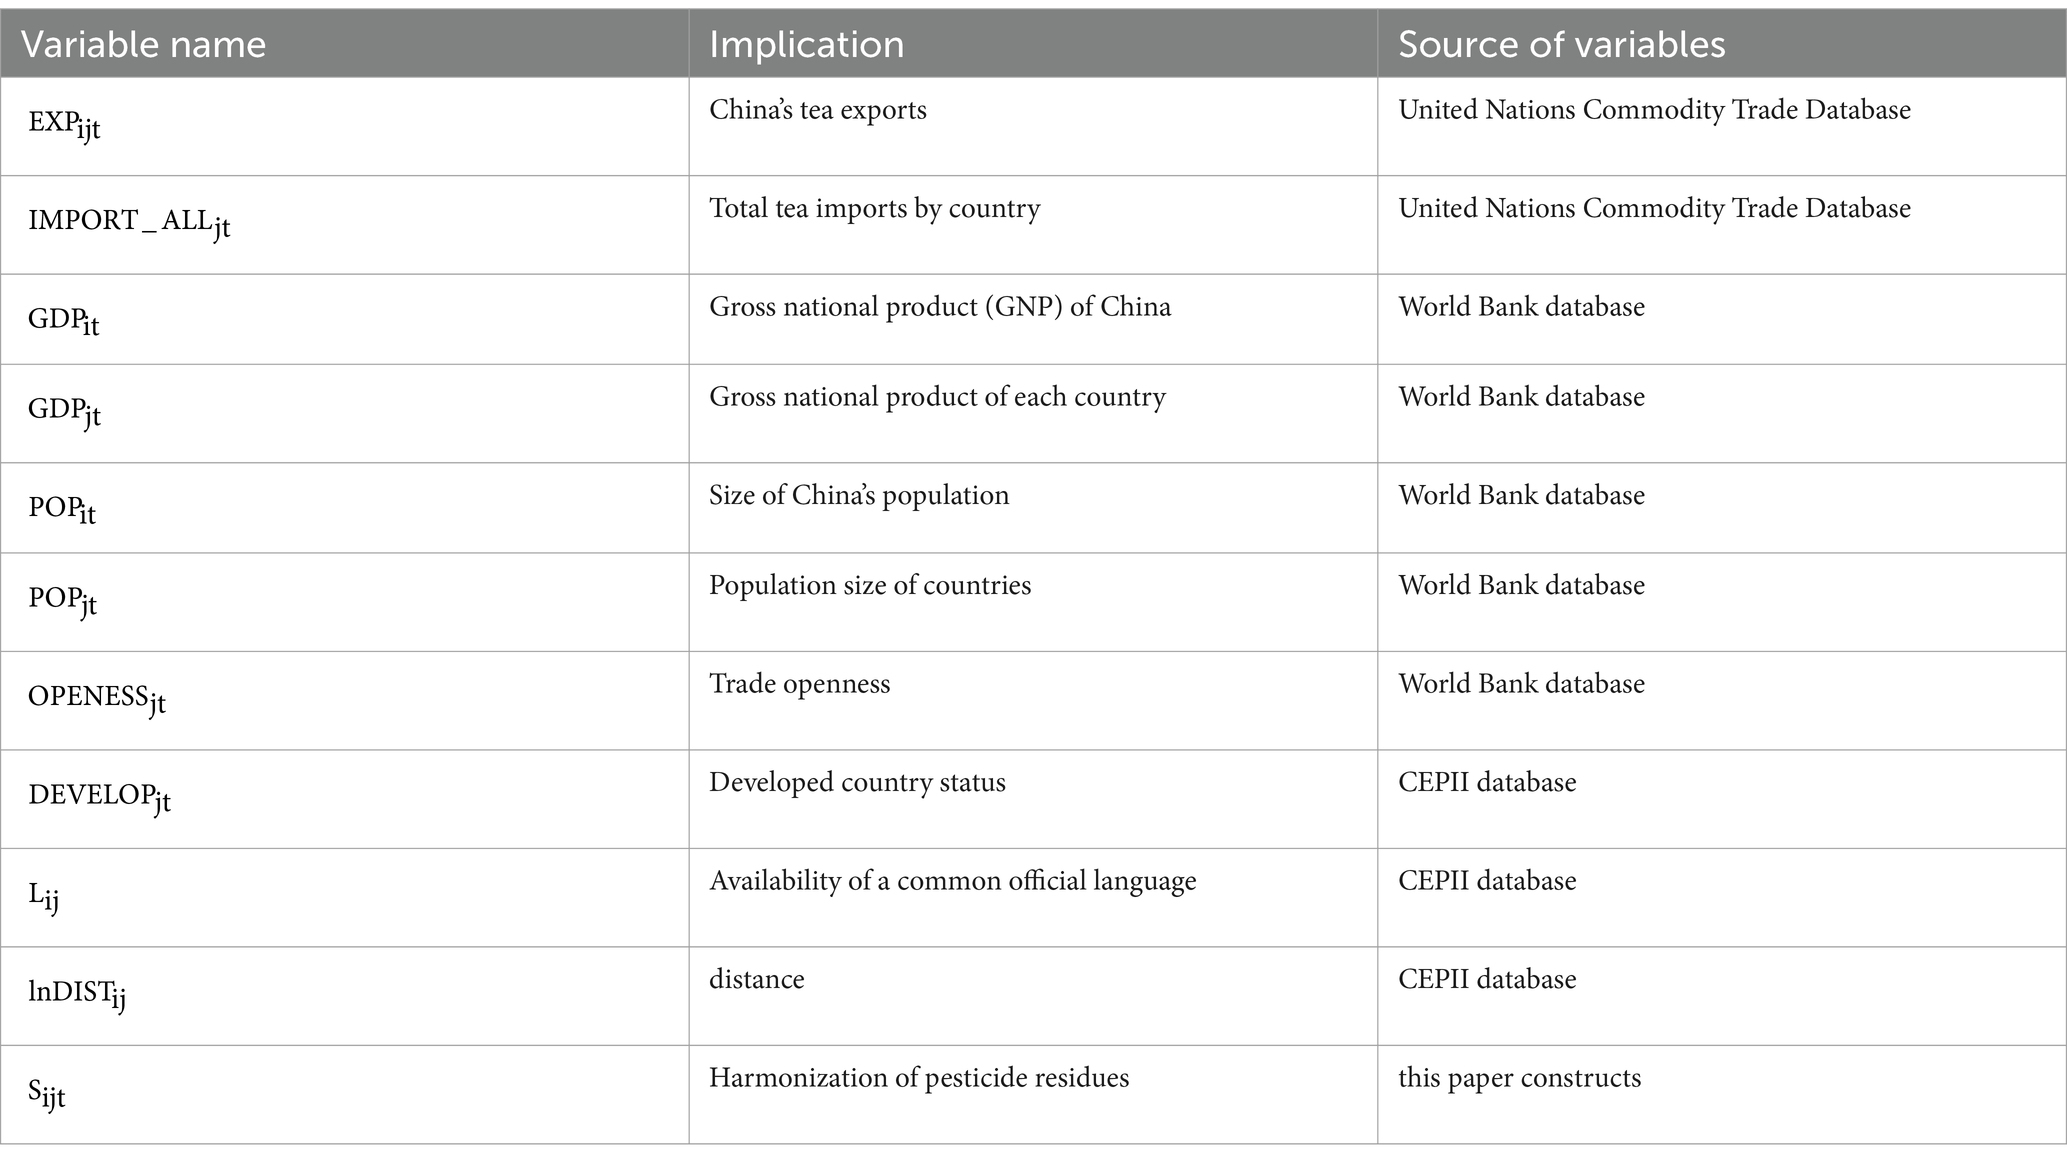
Table 5. Sources of each variable in the stochastic frontier gravity model.
6 Empirical results and analyses
6.1 Model applicability tests
The model in this article uses Frontier 4.1 software for data analysis. Among them, the explanatory variables, China’s tea export value as well as the GNP of each country and the population size of each country of the stochastic frontier gravity model did the logarithmic processing work. The missing values of each variable in the trade inefficiency model did the processing of taking the mean of the three periods before and after. To test the reasonableness of the model setting, to test whether there is a trade inefficiency term in the model, and whether the trade inefficiency phase changes over time, the likelihood ratio test was conducted on the model setting. The test results are shown in Table 6.
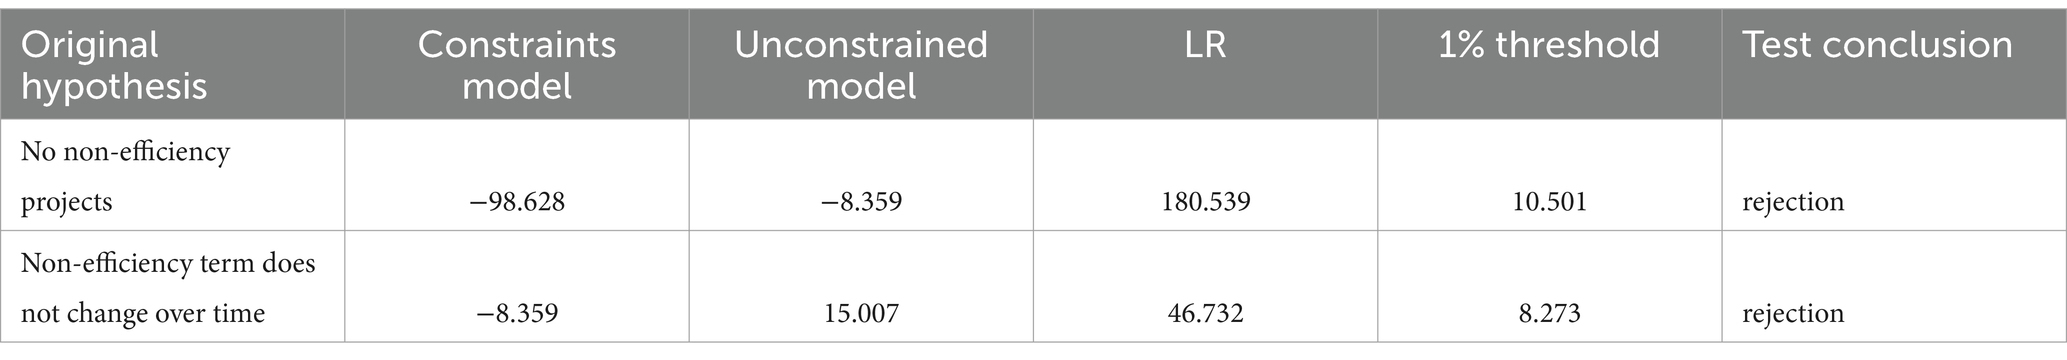
Table 6. Stochastic frontier likelihood ratio test.
From the above results of the statistical analysis of the likelihood ratio test, the following conclusions can be obtained: at the 1% significance level, the test rejects the hypothesis that there is no non-efficiency item, i.e., there is obviously a trade non-efficiency item in China’s export trade of tea with the other member countries of the RCEP; at the 1% significance level, the test rejects the non-efficiency item does not change over time, i.e., trade non-efficiency item changes over time and change. In summary, this paper should construct a time-varying stochastic frontier gravity model.
6.2 Empirical results and analyses
The model in this article was analysed using Frontier 4.1 software for data analysis and the empirical results are shown in Table 7.
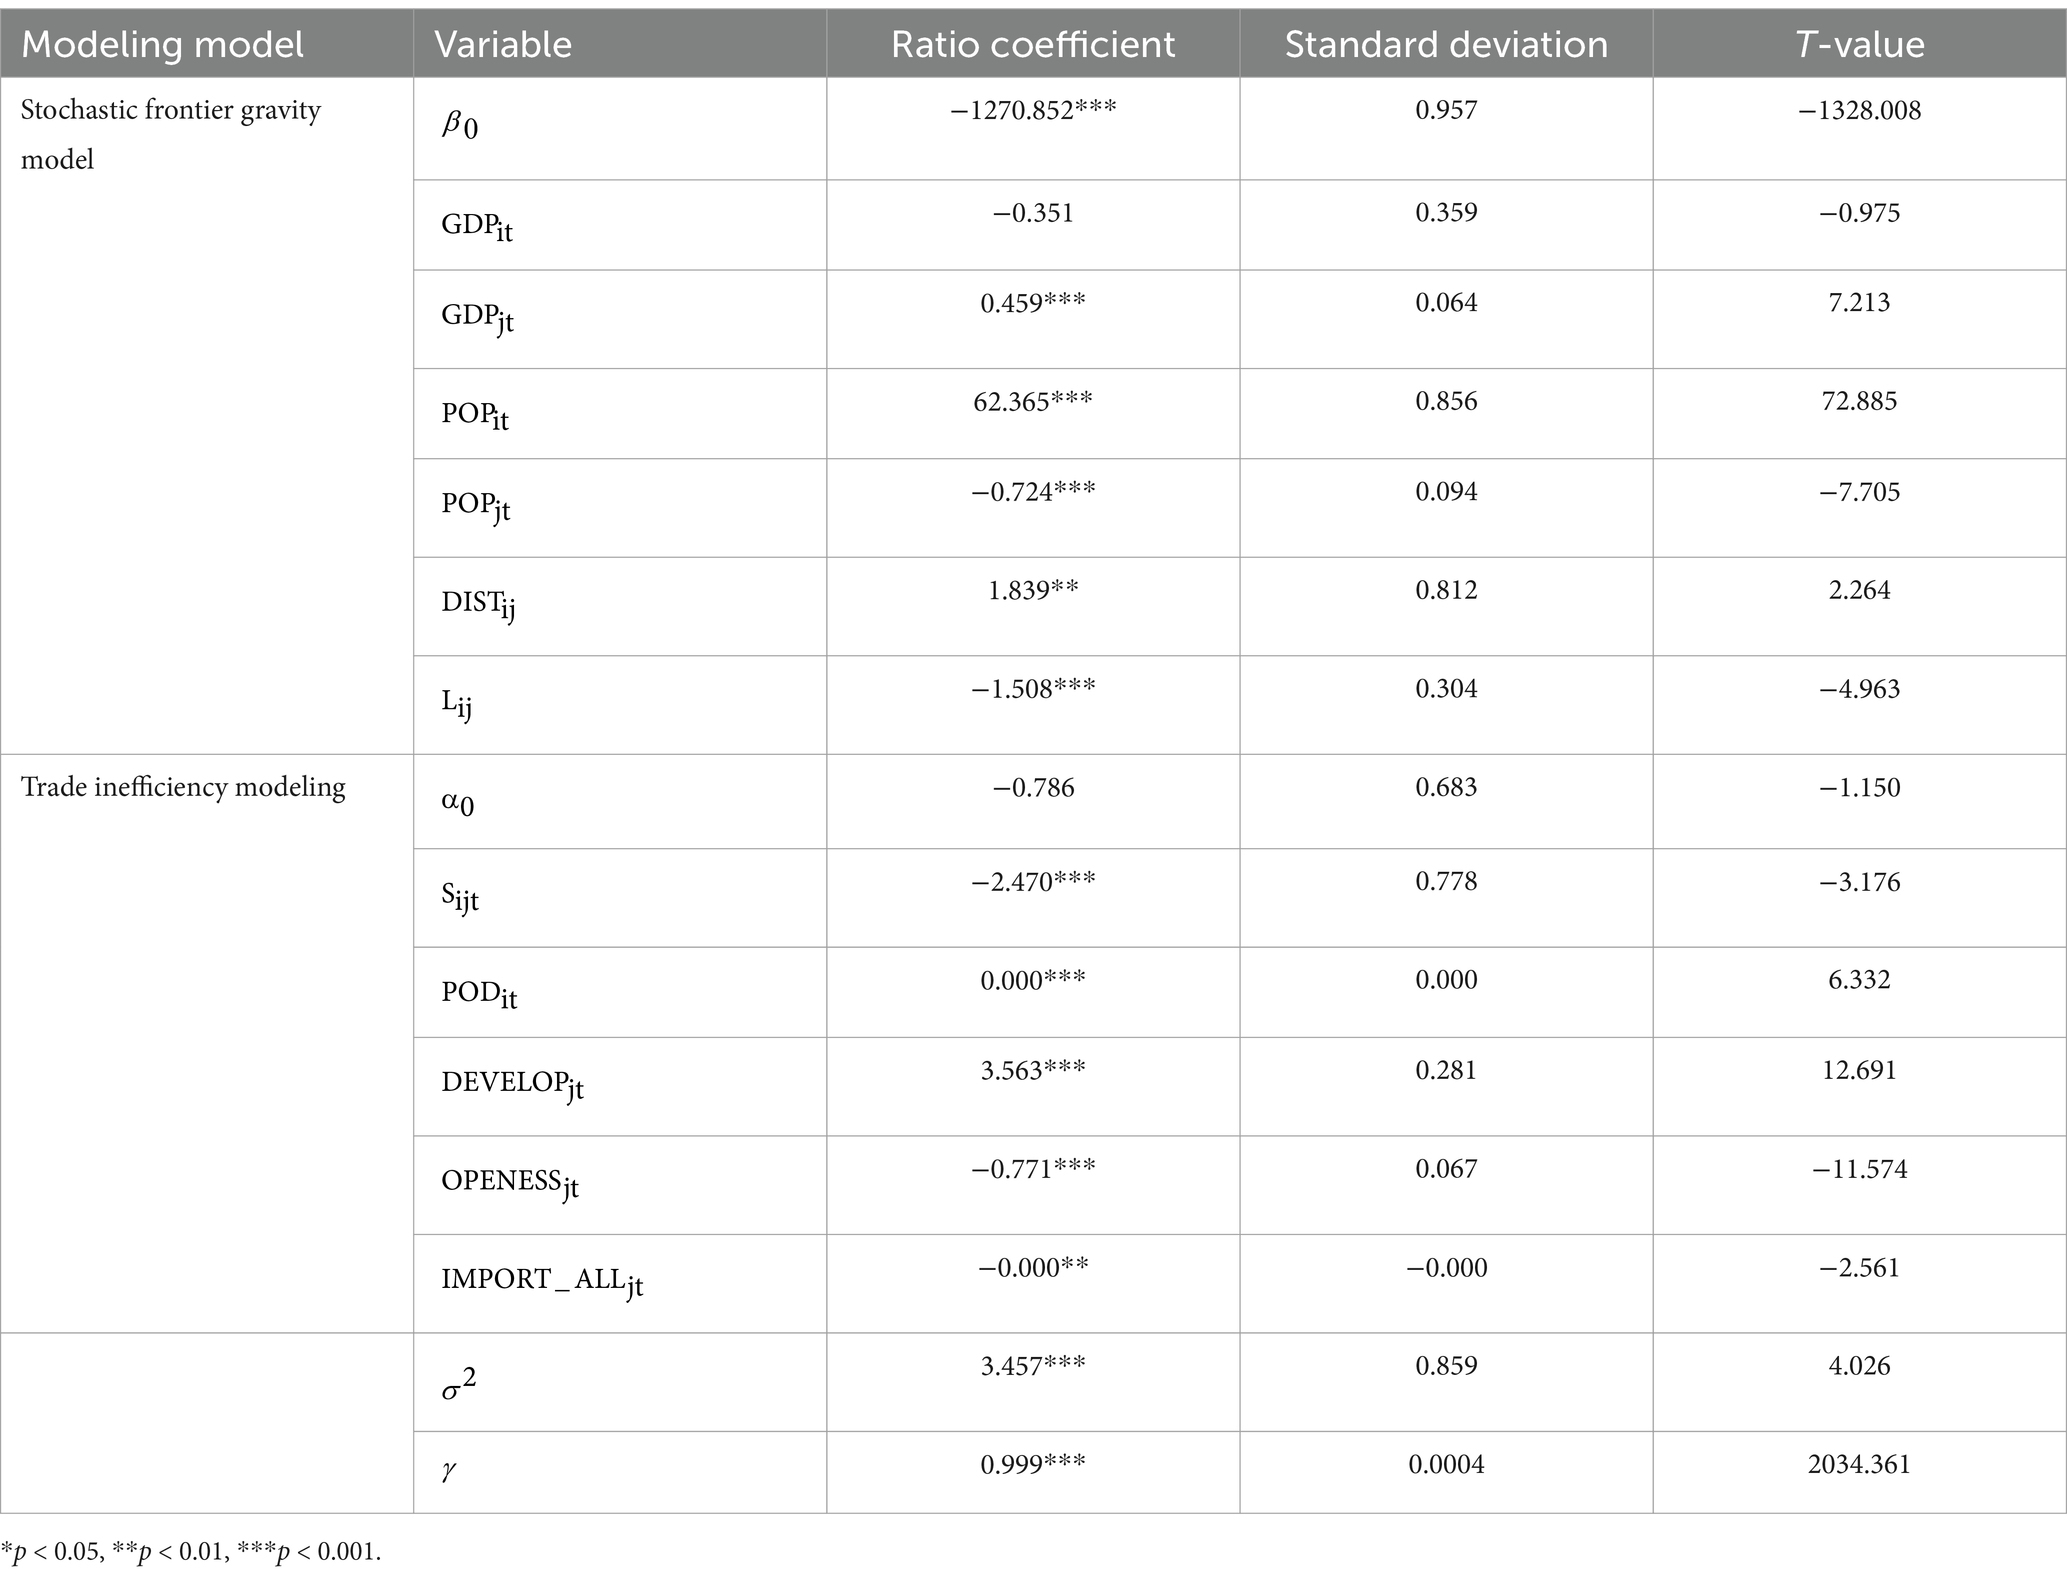
Table 7. Empirical results of stochastic frontier gravity model.
In the empirical results of the above table, the γ The value of 0.999, which is very close to 1 and significant at 1% level, indicates that trade inefficiency does exist in the process of China’s tea exports to RCEP countries and that the gap between the actual trade value and the potential value of exports is mainly due to trade inefficiency. On the other hand, the value of 3.457 is also significant at the 1% level, which indicates that the inclusion of variables in the non-efficiency term set in this article has a certain degree of influence on the trade value of tea. The two parts of the model are analysed separately in the following section.
6.2.1 Stochastic frontier gravity model analysis
Based on the observed empirical results, the negative coefficient of the GDP of the exporting country indicates to some extent that the larger the exporting economy is, and the larger the internal market is, the lesser the export incentive for its tea, which has some negative utility. On the contrary, the positive coefficient of GDP of the importing country indicates that the larger the economy of the importing country, the stronger the market consumption of tea, and the stronger the import motivation. The coefficient of the population size of the exporting country is positive, which to some extent indicates that in the tea trade, the larger the population size of the exporting country, the larger the scale of production within the exporting country, and the stronger the ability to export supply. Similarly, the negative coefficient of the population size of the importing country indicates that the larger the population size of the importing country, the stronger its domestic production capacity, which has a hindering effect on imports. A positive coefficient on whether or not there is a common language indicates that trade is less hindered when the two countries previously had a common official language. A negative coefficient on distance indicates that the greater the distance between the two countries, the greater the cost of importing and exporting, and the greater the impediment to trade between the two countries.
6.2.2 Non-efficiency modeling analysis
The first is the core explanatory variable, pesticide residue harmonization. The coefficient of pesticide residue harmonization is negative and statistically significant at the 1% level of significance. This indicates that the pesticide residue harmonization negatively affects trade inefficiency, in other words, an increase in pesticide residue harmonization cuts down on impediments to tea trade between the two countries. Secondly, the coefficients of tea production of exporting countries and whether they are developed countries are positive, both of which have a positive impact on trade inefficiency. The larger export tea production itself is accompanied by the larger amount of tea consumed in the home country, while the importing country is a developed country, whose rules and regulations on imports are more perfect, both of which have a certain impediment to tea trade. Finally, both coefficients are negative for the total imports of tea from importing countries and trade openness. Obviously, the increase in both has a negative impact on trade inefficiency, indicating that both weaken the impediments to tea trade.
In summary, the increase of pesticide residue harmonization reduces the trade obstacles between China and the RCEP countries, and the cost of tea export from China decreases. In the process of China exporting tea to the RCEP countries, the pesticide residue harmonization degree and the export cost are negatively related, that is, the pesticide residue harmonization degree and the export cost are negatively related. which satisfies the assumption 1 stated above.
6.3 Model robustness tests
To strengthen the reliability of the empirical results, it is quite necessary to conduct model robustness tests. The above illustrates the applicability of using the stochastic frontier gravity model by conducting the great likelihood ratio comparison test. The empirical results illustrate to some extent the impact of the variables on China’s tea export volume, but the impact of the inefficiency term on trade efficiency is difficult to visualize. In the part of testing the robustness of the model, this article uses the trade efficiency data generated by the stochastic frontier gravity model to further demonstrate the relationship between trade efficiency and the selected non-efficiency terms. The test results are shown in Table 8.
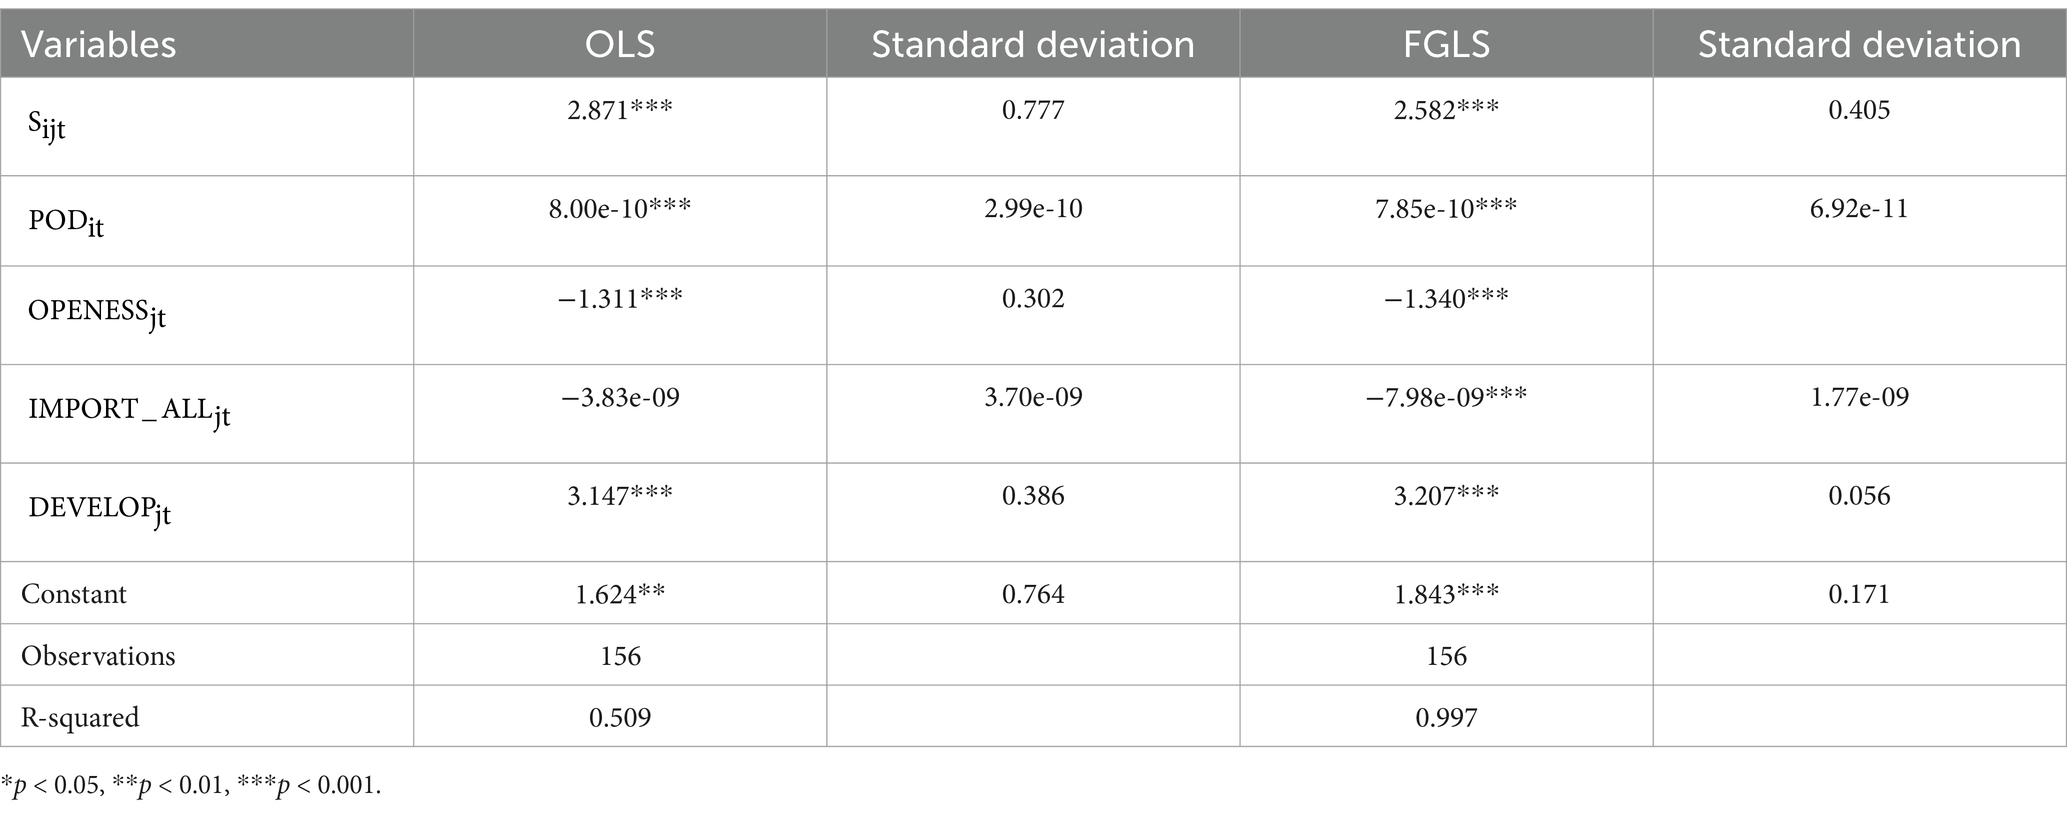
Table 8. Model robustness test results.
The Ordinary Least Squares and Fully Feasible Generalized Least Squares (FGLS) are chosen for the model test. The FGLS method is used for estimating multivariate regressions, which can effectively deal with the presence of heteroskedasticity and correlation. The data used in this article are long panel, and the estimation by FGLS can effectively improve the validity and consistency of the panel regression. The sign of the regression coefficients of the above variables is consistent and the results are robust. Their core explanatory variables are all positively related to trade efficiency at the 1% significance level, confirming that the improvement of pesticide residue harmonization can bring about the improvement of trade efficiency, thus increasing China’s tea exports to the RCEP countries. Overall, the robustness of the stochastic frontier gravity model chosen in this article is good.
Given the potential endogeneity issues, such as reverse causality and omitted variable bias between MRLs standards harmonization and tea export efficiency, this study utilizes the instrumental variable approach for testing. Reverse causality may arise if countries align standards in response to increased trade volume. Additionally, omitted variables, such as bilateral diplomatic relations, may influence the relationship.
To address the above issues, this article refers to the research of Shingal et al. (2020) and Shingal and Ehrich (2024), using a lag of one period in pesticide residue harmonization (L.Sijt) as the instrumental variable, and applies two-stage least squares (2SLS) for endogeneity testing. Table 9 shows the test results: the Kleiberen Paap rk LM statistic significantly rejects the null hypothesis of insufficient identification of instrumental variables, while the Cragg Donald Wald F statistic and Kleiberen Paap rk Wald F statistic both indicate the absence of weak instrumental variable problems. These results demonstrate that the selected instrumental variables in this article are reasonable and effective. In addition, the regression results of the second stage show that the coefficient of pesticide residue harmonization is positive and significant at the 1% level, and this is consistent with the benchmark regression results. This indicates that even after controlling for endogeneity issues, the improvement of MRLs standards harmonization can still significantly promote the efficiency of China’s tea export trade.
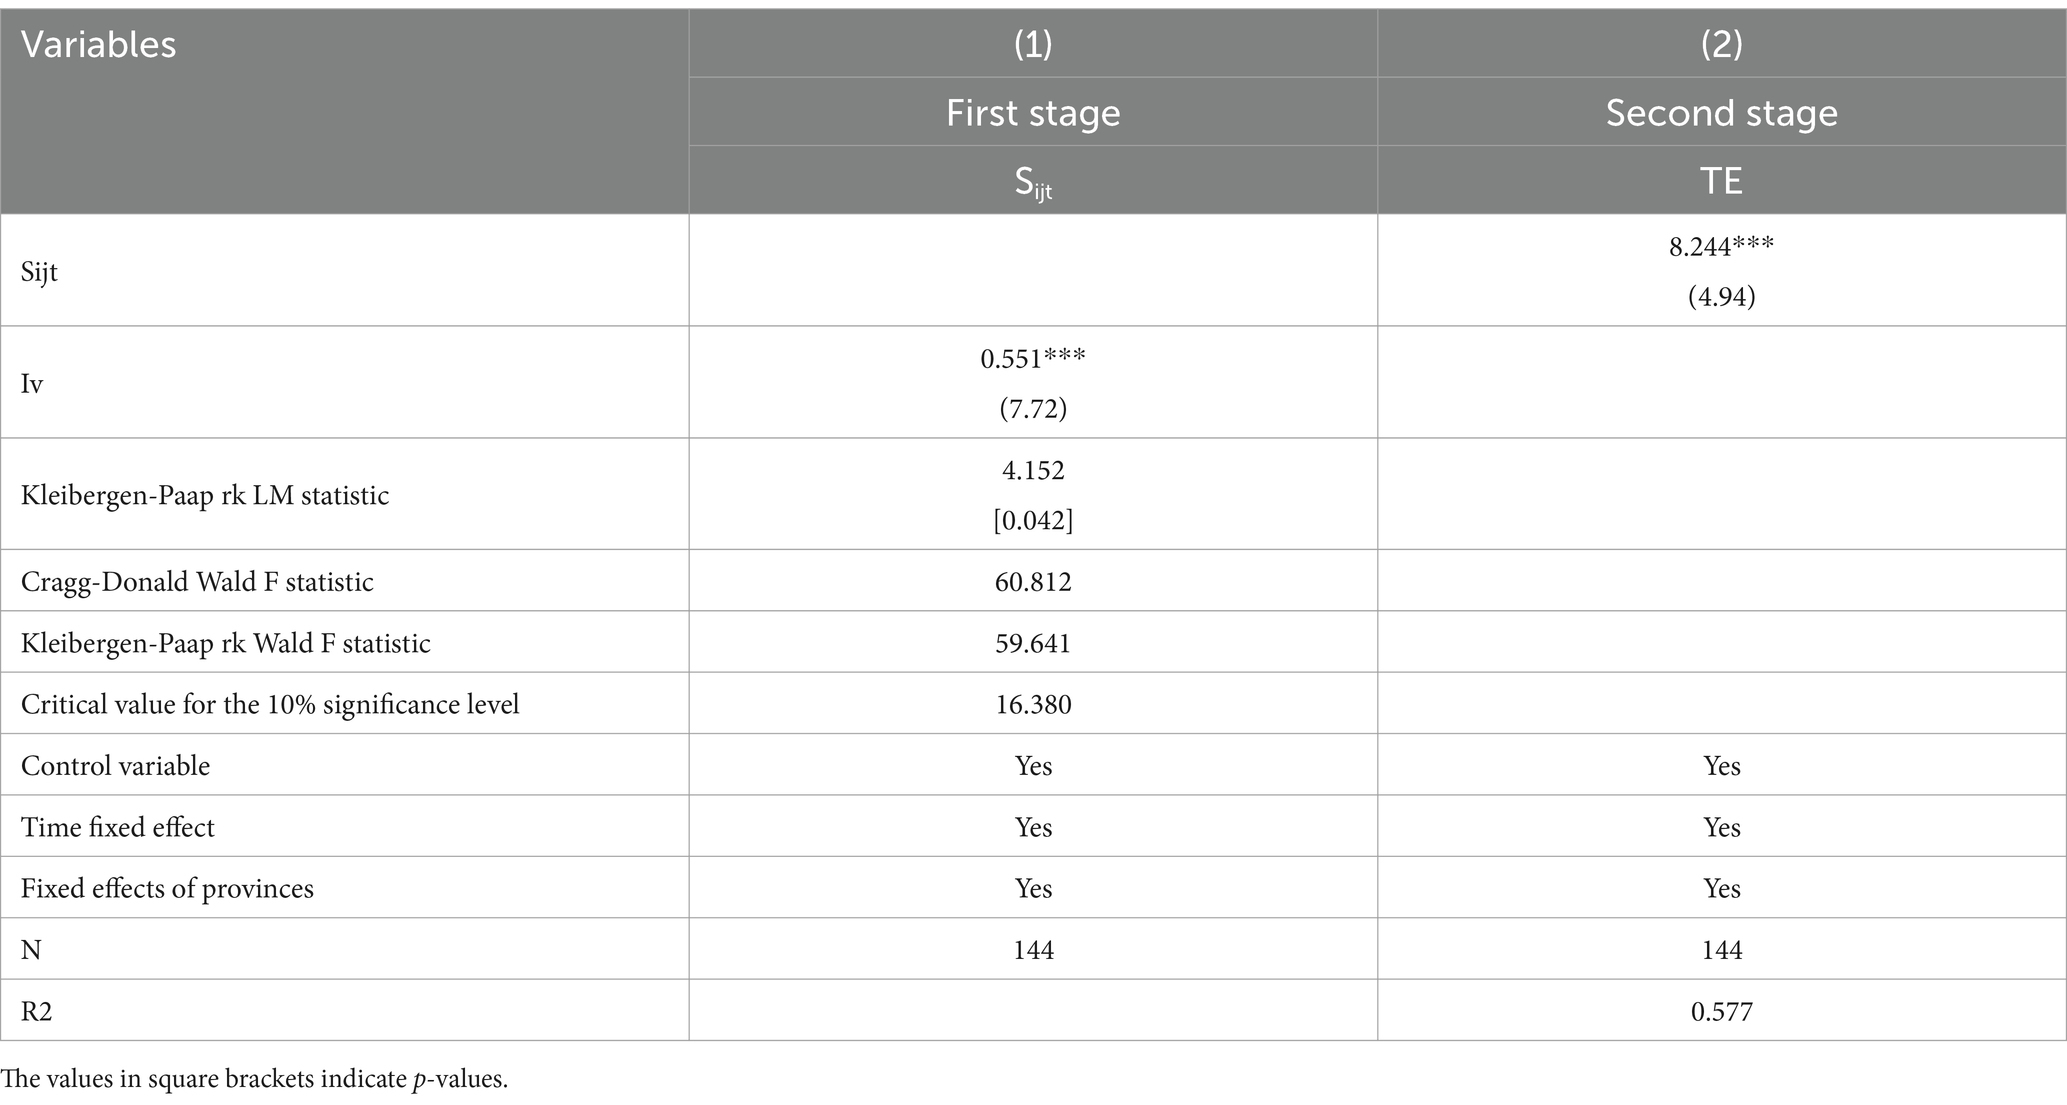
Table 9. Results of endogeneity test.
6.4 Heterogeneity analysis
To further examine the heterogeneous impact of MRLs standard harmonization on tea export trade, we categorize countries based on their average per capita GDP. The high-income group includes Japan, South Korea, Australia, Singapore, and New Zealand, while the low-income group consists of seven countries, including the Philippines, Cambodia, Myanmar, and Thailand. Given that high-income countries tend to enforce stricter MRLs standards, whereas low-income countries generally adopt more lenient regulations, we consider the heterogeneity in regulatory stringency to be closely associated with income level differences. Furthermore, due to data constraints, we do not analyze the export heterogeneity of different tea types, such as green tea and black tea.
The grouped regression results based on income levels are presented in the Table 10. The findings indicate that in both high-income and middle- and low-income countries, MRLs standard harmonization significantly reduces trade inefficiency. Greater harmonization in pesticide residue standards helps lower trade barriers in the tea industry, and this aligns with the benchmark regression results. However, in terms of magnitude, the impact of MRLs standard harmonization is more pronounced in the middle- and low-income countries. This suggests that the alignment of MRLs standards between China and the developing nations has a stronger effect in mitigating trade inefficiencies compared to the developed countries.
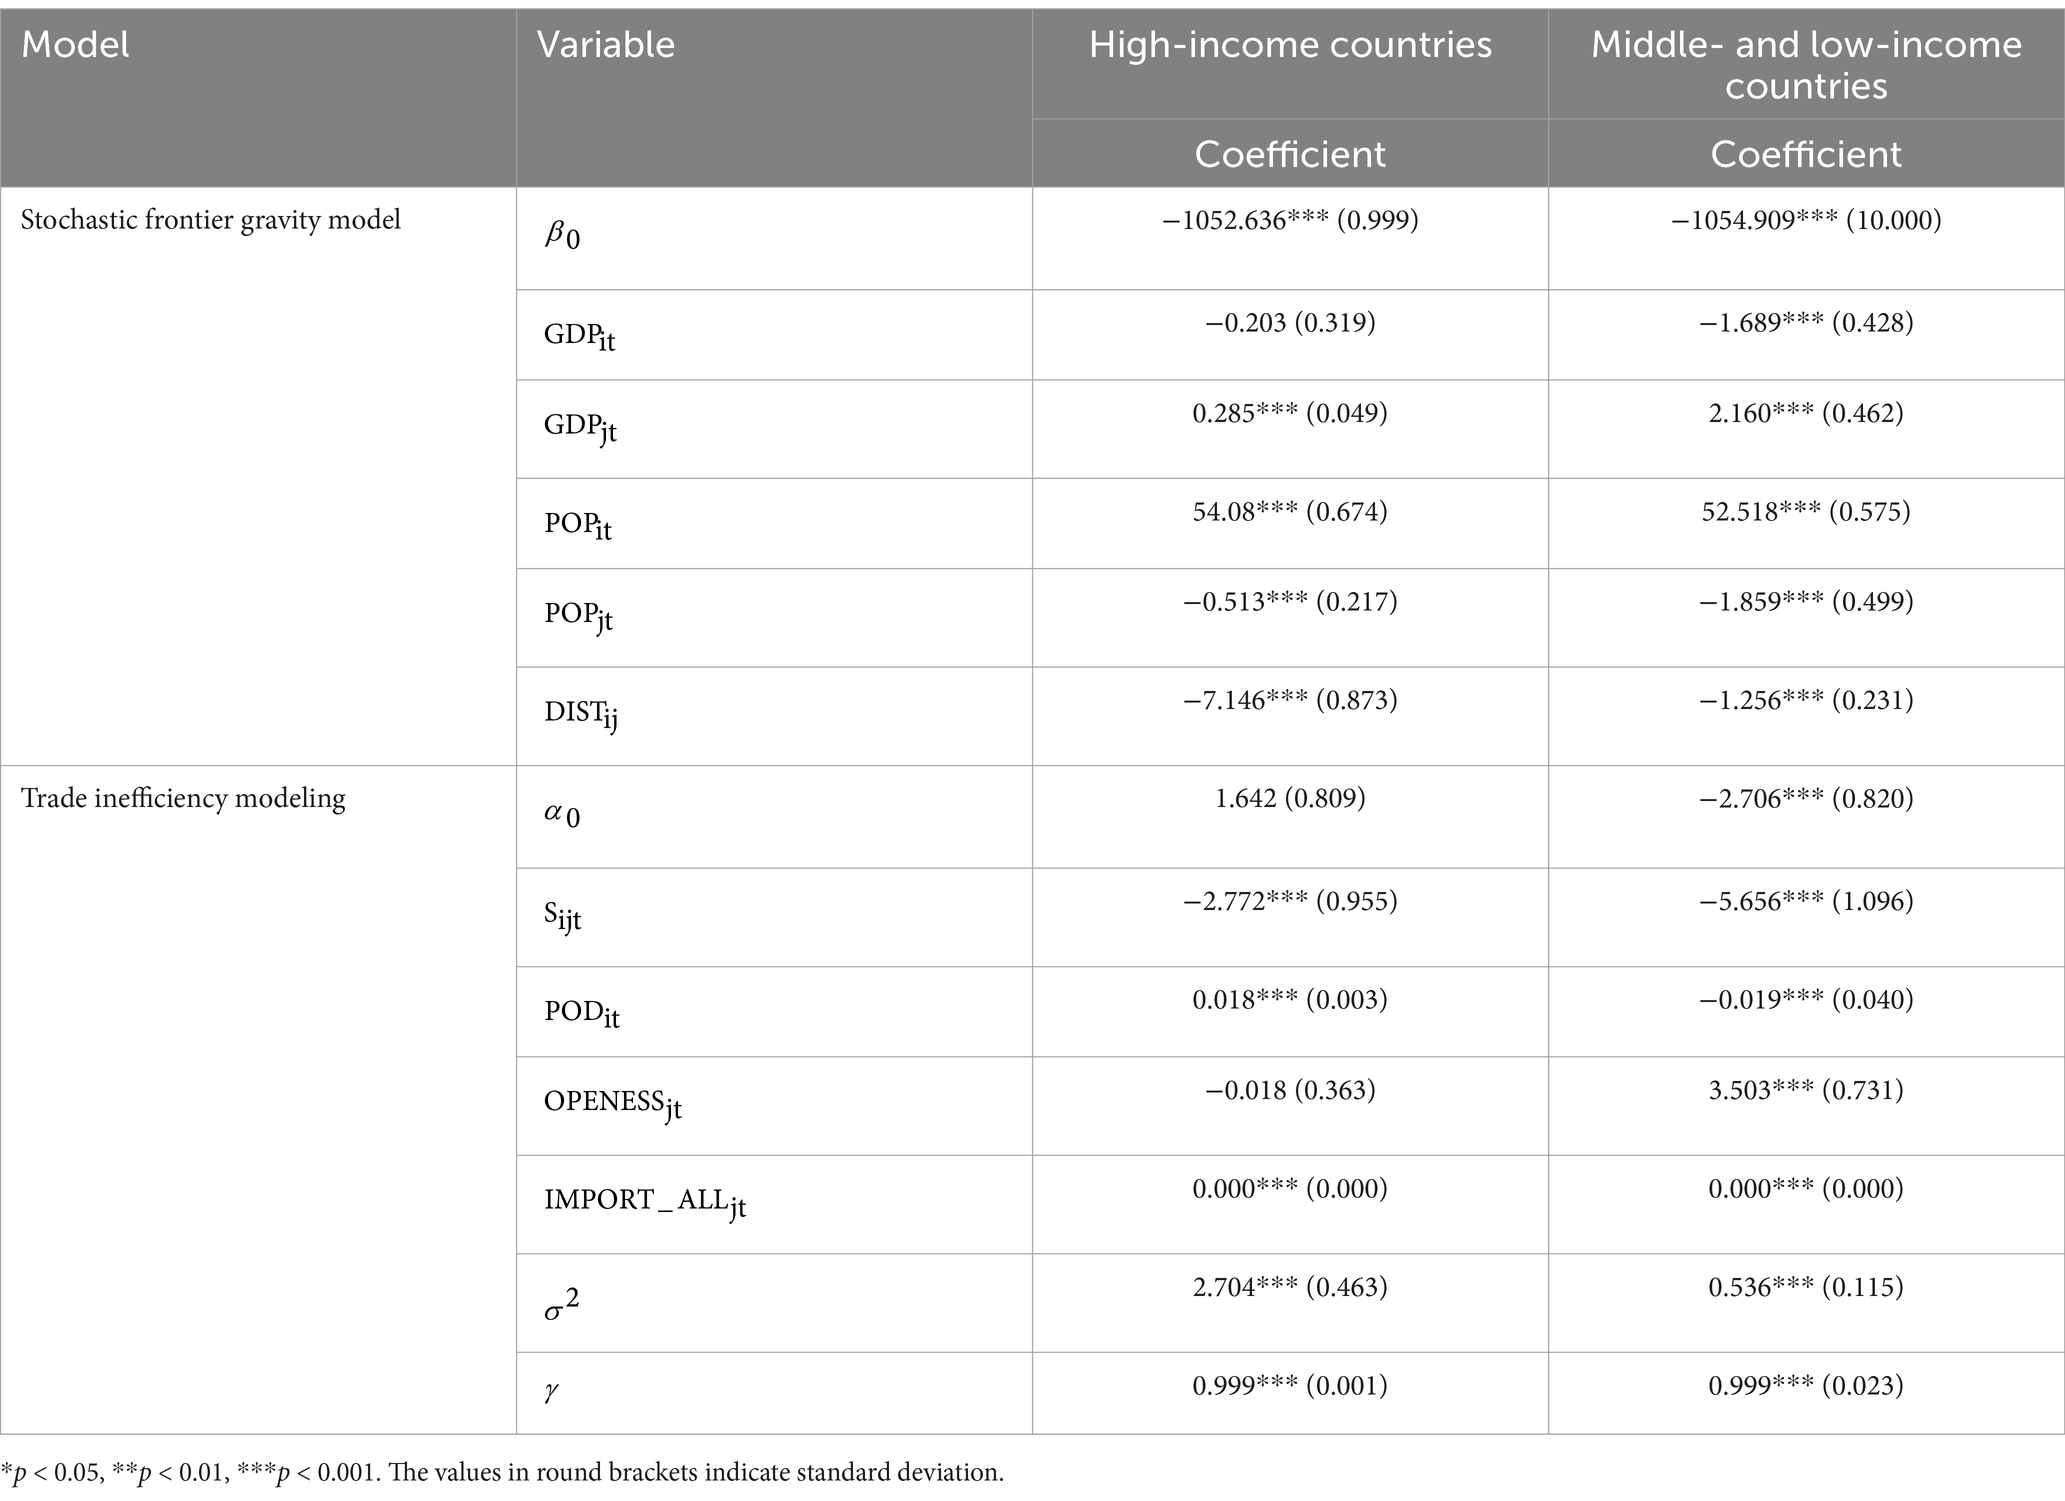
Table 10. Estimation results of the stochastic frontier gravity model by income group.
6.5 The specific mechanism of the impact of pesticide residue harmonization on Chinese tea exports
To further explore the impact of pesticide residue harmonization on China’s tea exports, four new variables are introduced in this section: per capita GNP of importing countries ( ), the cleanliness index of each country ( ), whether the two countries share a border ( ), and the exchange rate of each country ( ). The data on export volume and export unit price come from the UN Comtrade database, the data on GNP per capita and exchange rate of each country come from the World Bank database, and the data on the integrity index of each country and whether the two countries share a border come from the CEPII database. The regressions for total export volume, export unit price, and total export trade volume are obtained from the Table 11. From the empirical results in Table 11, it can be found that the harmonization of pesticide residues is significant at the 1% level in all the three trade attraction models.
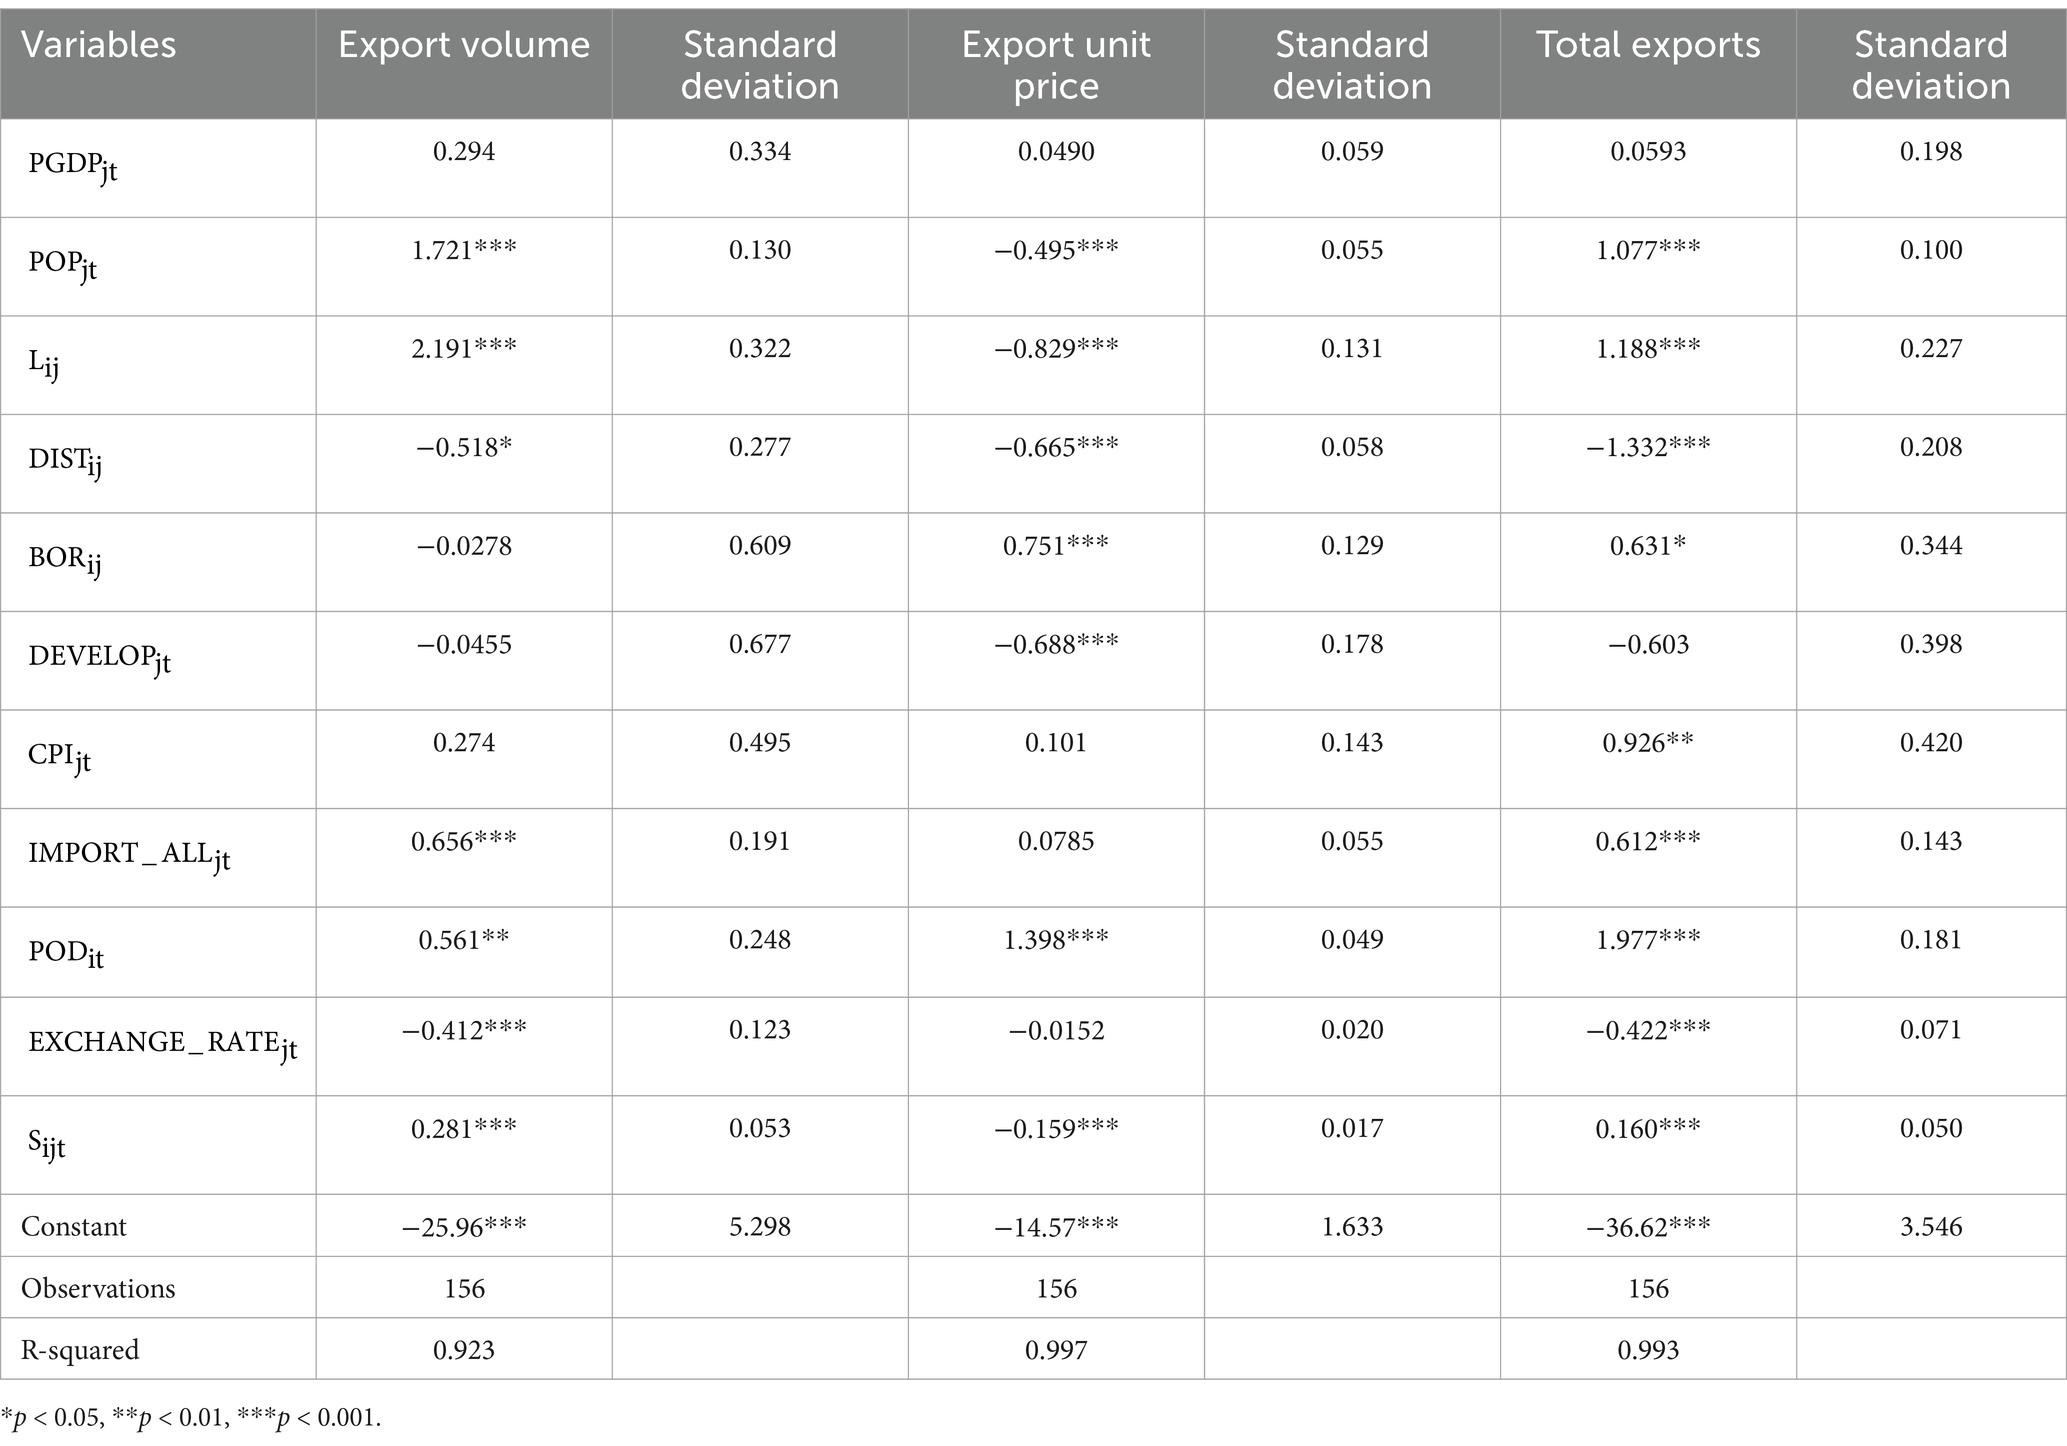
Table 11. Gravity regression modeling results.
From the model (1) and model (3), pesticide residue harmonization has a positive effect on the total export volume, i.e., for every 1% increase in pesticide residue harmonization, the total export volume increases by 0.281%. Similarly, the degree of pesticide residue harmonization has a positive effect on the total export trade volume, i.e., for every 1% increase in the degree of pesticide residue similarity, the total export trade volume increases by 0.16%. Although pesticide harmonization has a positive effect on both of the above, it has a somewhat greater effect on the total export volume than on the total export trade volume, suggesting that the pesticide harmonization has a somewhat negative effect on other aspects of trade.
Returning to model (2), it is clear that the pesticide residue harmonization has a negative effect on the export unit price, in that for every 1% increase in pesticide residue harmonization, the export unit price decreases by 0.159%. This happens in part because the more similar the requirements for a commodity are between the two trading parties, the lower the overall cost to the exporter. For exporters who want to expand their trade, this is a very important option by lowering the price of the product, the so-called thin profit margin.
According to the analysis of the stochastic frontier gravity model, the increase of pesticide residue harmonization has a negative effect on trade inefficiency, i.e., the increase of pesticide residue harmonization will lead to the reduction of trade impediments, which will make the trade cost lower. According to chapter 4, the mechanism of pesticide residue harmonization degree on China’s tea exports is known as . The coefficient of the export unit price and cost function at this time β > 0, α < 0, that is, the export unit price decreases with the increase of the degree of pesticide residue harmonization, and the export volume increases with the increase of the degree of pesticide residue harmonization.
Overall, the increase in pesticide residue similarity has a positive effect on total export volumes and a negative effect on export unit prices. Taken together, the increase in pesticide similarity has a positive effect on the total export trade volume.
In summary, as the similarity of pesticide residues increases, i.e., China and the RCEP countries tend to develop similar pesticide residue standards for tea, it promotes the growth of the total export volume of the tea trade, and the export unit price is suppressed to a certain extent. Under the interaction of the two, the total export volume of tea trade also grows with the growth of pesticide residue similarity. As the RCEP countries improve the pesticide residue standards system, increasingly similar agricultural and residue standards between trading countries have expanded the tea market on both sides to some extent, which is in line with the basic market theory, but also in line with the theoretical analysis of the expectations.
7 Conclusions and recommendations
Through the above arguments, we have demonstrated the mechanism and actual results of pesticide residue harmonization on China’s export of tea to the RCEP countries. The specific conclusions are as follows: The pesticide residue harmonization degree is constructed from the actual data of MRLs standards between China and the RCEP countries, and the pesticide residue harmonization degree between China and the RCEP countries shows an increasing trend in general. The stochastic frontier gravity model used in this article confirms that the rise in pesticide residue harmonization has a significant inhibitory effect on the non-trade efficiency of tea exported from China to RCEP countries, i.e., it significantly weakens the trade impediments, and the total cost of tea exported from China becomes smaller. The impact mechanism is shown as follows: as the degree of pesticide residue harmonization increases, the total cost of China’s tea exports becomes smaller, the unit price of exports decreases, the volume of exports rises, and the total amount of exports improves.
The RCEP member countries should actively promote collaborative mechanisms for standard regulation under the RCEP framework. Standardization agencies across the member states should accelerate the harmonization of regulatory standards in the tea industry and support the establishment of a regional tea standardization technical committee. Through joint research efforts, countries should develop tea regulatory standards tailored to the regional trade requirements, such as tea grading standards (He and Wen, 2021) and bilateral or multilateral lists of maximum residue limits (MRLs) for tea pesticides (Wang and Su, 2023). Furthermore, countries should expedite the mutual recognition of regulatory standards and strengthen collaboration in the research and production of internationally certified products (Zhao et al., 2023). Importantly, member states should enhance the transparency of MRL standards by promptly disseminating updates and providing accessible information services to businesses.
The Chinese government must further strengthen pesticide residue control in tea production to ensure the quality and safety of exported tea. On the one hand, the government should enhance pesticide knowledge training and safe usage guidance for tea enterprises and farmers (Zhong et al., 2021; Feng et al., 2023), while promoting green control technologies such as biological, physical, and mechanical methods (He et al., 2023). On the other hand, the government must accelerate the integration of information technology into tea quality traceability systems to improve the monitoring of pesticide residues across the entire supply chain. For example, it can promote QR code traceability for tea products and establish a unified national platform for tea quality and safety traceability.
The limitations of this study are as follows: due to data constraints, we were unable to analyze the differential impact of MRLs on the export trade of various types of tea, such as black tea and green tea. Additionally, in the empirical analysis, this study may have overlooked unobserved confounders, including naval diplomacy and consumer perception. Future research should collect micro-level data at the tea enterprise level and conduct further related studies.
Data availability statement
The original contributions presented in the study are included in the article/supplementary material, further inquiries can be directed to the corresponding author.
Author contributions
MW: Writing – original draft. HZ: Conceptualization, Data curation, Writing – review & editing. CF: Formal analysis, Project administration, Writing – review & editing. ZM: Software, Supervision, Writing – review & editing.
Funding
The author(s) declare that financial support was received for the research and/or publication of this article. This research was supported by the Fundamental Research Funds for the Provincial Universities of Zhejiang (2023YW79), the Research Project of Soft Science in Zhejiang Province (2024C35091), the Humanities and Social Sciences Foundation of the Ministry of Education of China (Project no. 22YJAZH153), and the Research Project of the Belt and Road Regional Standardization Research Center of China Jiliang University (BRZK07B).
Acknowledgments
The authors would like to thank the editors and reviewers for their valuable comments and suggestions.
Conflict of interest
The authors declare that the research was conducted in the absence of any commercial or financial relationships that could be construed as a potential conflict of interest.
Generative AI statement
The authors declare that no Gen AI was used in the creation of this manuscript.
Publisher’s note
All claims expressed in this article are solely those of the authors and do not necessarily represent those of their affiliated organizations, or those of the publisher, the editors and the reviewers. Any product that may be evaluated in this article, or claim that may be made by its manufacturer, is not guaranteed or endorsed by the publisher.
References
Achterbosch, T. J., Engler, A., Rau, M. L., and Toledo, R. (2009). Measure the measure: the impact of differences in pesticide MRLs on Chilean fruit exports to the EU. In: Paper presented at the International Association of Agricultural Economists Conference, Beijing, China, 08.
Anderson, J. E., and Van, W. E. (2003). Gravity with gravitas. A solution to the border puzzle. Social Sci. Electr. Pub. 93, 170–192. doi: 10.1257/000282803321455214
Armstrong, M. (2007). Measuring trade and trade potential: a survey. Asia Pacific Economic Papers 368, 1–17. doi: 10.2139/ssrn.1760426
Chen, B., Chen, Y., and Zhang, S. (2024). The effect of maximum residue limit standards on China’s Agri-food exports: a health perspective. Rev. Int. Econ. 32, 1698–1725. doi: 10.1111/roie.12752
Chen, T. (2023). Discussion on the development of tea economy under the threshold of "belt and road". Fujian Tea. 5, 53–55.
Choi, J. W., and Yue, C. (2016). Investigating the impact of maximum residue limit standards on the vegetable trade in Japan. Int. Food Agribus. Manage. Rev. 20, 159–173.
Curzi, D., Schuster, M., Maertens, M., and Olper, A. (2020). Standards, trade margins and product quality: firm-level evidence from Peru. Food Policy 91:101834. doi: 10.1016/j.foodpol.2020.101834
Dong, Y. (2011). An empirical analysis of the impact of SPS measures on China's fishery products trade: the impact of malachite green standard on eel exports. China Rural Econ. 22, 43–51.
Dong, Y. (2014). Analysis of the impact of SPS measures of developed countries on China's tea export: from the perspective of standard differences. Chinese Rural Econ. 11, 83–95.
Dong, Y. G., and Wu, Y. S. (2024). Impact of regulatory differences in SPS measures on China’s export trade of fruit and vegetable agricultural products from the perspective of pesticide maximum residue standard. J. Agro-Forestr. Econ. Manage. 23, 299–308. doi: 10.16195/j.cnki.cn36-1328/f.2024.03.32
Drogué, S., and DeMaria, F. (2012). Pesticide residues and trade, the apple of discord? Food Policy 37, 641–649. doi: 10.1016/j.foodpol.2012.06.007
Feng, J., Wang, Z., Yi, H. Y., Liang, Q.H., and Li, H. P.. (2023). Comparison and suggestions for China on pesticide residue limit standards for tea in domestic and abroad. J. Food Safety Q. 14, 207–219.
Fiankor, D. D. D., Curzi, D., and Olper, A. (2021). Trade, price and quality upgrading effects of Agri-food standards. Eur. Rev. Agric. Econ. 48, 835–877. doi: 10.1093/erae/jbaa026
Handford, C. E., Elliott, C. T., and Campbell, K. (2015). A review of the global pesticide legislation and the scale of challenge in reaching the global harmonisation of food safety standards. Integr. Environ. Assess. Manag. 11, 525–536. doi: 10.1002/ieam.1635
Hejazi, M., and Grant, J. H. (2022). PETERSON E. Trade impact of maximum residue limits in fresh fruits and vegetables. Food Policy 106:102203. doi: 10.1016/j.foodpol.2021.102203
He, M. Z., and Wen, L. X. (2021). Impact of tea standards and technical regulations of RCEP member countries on trade. Agric. Res. Appl. 34, 75–82.
He, Q., Chen, D., Yang, X., Yao, C., and Ma, Y.J.. (2023). Comparative analysis of the maximum residue limits for pesticides in tea at home and abroad. Q. Safety Agro-Products 5, 98–104.
Huo, Z., Liu, C., Zhang, M., Chen, F. Q., and Liu, Z. H. (2024). Study on the effect of different maximum residue limits of pesticides on the trade efficiency of China's tea exports to RCEP member countries: based on stochastic frontier gravity model. Tea Sci. 44, 526–542. doi: 10.13305/j.cnki.jts.2024.03.006
Hyun, H., and Jang, Y. J. (2021). Technical regulation and trade: export quality matters. World Econ. 45, 1447–1476. doi: 10.1111/twec.13188
Karemera, D., Xiong, B., Smalls, G., and Whitesides, L. (2021). The political economy of maximum residue limits: a long-term health perspective. J. Agric. Econ. 73, 709–719. doi: 10.1111/1477-9552.12476
Kong, Z. (2021). Impact of differences in maximum residue limit standards for pesticides on the export of tea from China. Fujian Tea. 43, 36–37.
Kox, H. L., and Nordås, H. K. (2007). Services trade and domestic regulation. Trade Policy Working Paper. Available online at: https://mpra.ub.uni-muenchen.de/id/eprint/2116 (Accessed March 9, 2007).
Liapis, P. (2011). Changing patterns of trade in processed agricultural products. Oecd Food Agric. Fisheries Papers 47, 110–138. doi: 10.1787/9789264113084-6-en
Li, Y., and Beghin, J. C. (2014). Protectionism indices for non-tariff measures: An application to maximum residue levels. Food Policy. 45, 57–68. doi: 10.1016/j.foodpol.2013.12.005
Macedoni, L., and Weinberger, A. (2022). Quality heterogeneity and misallocation: the welfare benefits of raising your standards. J. Int. Econ. 134:103544. doi: 10.1016/j.jinteco.2021.103544
Mei, Y., and Liang, X. (2024). Analysis of China's tea production, sales, import and export situation in 2023. China Tea. 46, 18–26.
Novy, D. (2011). Gravity redux: measuring international trade costs with panel data. Econ. Inq. 51, 101–121. doi: 10.1111/j.1465-7295.2011.00439.x
Otsuki, T., Wilson, J. S., and Sewadeh, M. (2001). Saving two in a billion: quantifying the trade effect of European food safety standards on African exports. Food Policy 26, 495–514. doi: 10.1016/S0306-9192(01)00018-5
Qiu, G., and Liu, J. (2023). Empirical analysis of factors affecting tea yield. Shanghai Agric. Sci. Technol. 11, 97–100.
Schmidt, J., and Steingress, W. (2022). No double standards: quantifying the impact of standard harmonization on trade. J. Int. Econ. 137:103619. doi: 10.1016/j.jinteco.2022.103619
Shingal, A., and Ehrich, M. (2024). The EU’s pesticides MRLs harmonization: effect on trade, prices and quality. Food Policy 125:102634. doi: 10.1016/j.foodpol.2024.102634
Shingal, A., Ehrich, M., and Foletti, L. (2020). Re-estimating the effects of stricter standards on trade: endogeneity matters. World Econ. 44, 756–787. doi: 10.1111/twec.13015
Traoré, O. Z., and Tamini, L. D. (2022). African trade of mangoes to OECD countries: disentangling the effects of compliance with maximum residue limits on production, export supply and import demand. Eur. Rev. Agric. Econ. 49, 383–432. doi: 10.1093/erae/jbab016
Wang, H., and Su, H. (2023). The impact of reducing the maximum pesticides residue limit standard in RCEP member countries on tea trade. J. Tea Commun. 50, 266–271.
Wang, Y., Bian, E., and Zhang, Y. (2021). Three waves of China's economic opening-up and its evolution logic: also on the characteristics and influence of RECP, CECAI and CPTPP. Reformation 5, 76–87.
Winchester, N., Marie-Luise, R., Goetz, C., Larue, B., Otsuki, T., Shutes, K., et al. (2012). The impact of regulatory heterogeneity on Agri- food trade. World Econ. 35, 973–993. doi: 10.1111/j.1467-9701.2012.01457.x
Xiong, B., and Beghin, J. (2014). Disentangling demand-enhancing and trade-cost effects of maximum residue regulations. Econ. Inq. 52, 1190–1203. doi: 10.1111/ecin.12082
Yeung, M., Kerr, W. A., Coomber, B., Lantz, M., and McConnell, A. (2018). Declining harmonisation in maximum residue levels for pesticides. Br. Food J. 120, 901–913. doi: 10.1108/BFJ-05-2017-0291
Zhang, J., Zhang, Y., Wang, C., Yu, F., and Zhang, X. L.. (2023). RCEP membership standards, conformity assessment and response to technical barriers to trade. Standard Sci. 11, 47–70.
Zhang, Z., and Wang, Q. (2008). “Overview of the codex Alimentarius commission (CAC) standard setting for maximum residue limits for pesticides (MRLs),” in 2008 Symposium on Plant Protection and Agricultural Product Quality and Safety in Zhejiang Province. Hangzhou, Chinese.
Zhao, L., Li, Y. N., Li, W., and Xie, Y. Q. (2023). Exporting Guizhou tea to Malaysia and ASEAN countries under RCEP trade agreement. Acta Tea Sinica. 64, 53–59. doi: 10.20045/j.cnki.issn.2096-0220.2023.05.008
Keywords: MRLs standards, harmonization, RCEP, tea exports, influencing mechanism
Citation: Wenjun M, Zenghui H, Fuqiao C and Mei Z (2025) The impact mechanism of MRLs standards harmonization on China’s tea export trade—evidence from RCEP countries. Front. Sustain. Food Syst. 9:1504001. doi: 10.3389/fsufs.2025.1504001
Edited by:
Samuel Ayofemi Olalekan Adeyeye, Hindustan Institute of Technology and Science, IndiaReviewed by:
Yanyong Hu, Henan Normal University, ChinaJuan Du, Jiangxi Agricultural University, China
Copyright © 2025 Wenjun, Zenghui, Fuqiao and Mei. This is an open-access article distributed under the terms of the Creative Commons Attribution License (CC BY). The use, distribution or reproduction in other forums is permitted, provided the original author(s) and the copyright owner(s) are credited and that the original publication in this journal is cited, in accordance with accepted academic practice. No use, distribution or reproduction is permitted which does not comply with these terms.
*Correspondence: Huo Zenghui, aHVvemVuZ2h1aUBjamx1LmVkdS5jbg==