 Yanbo Liu1,2
 Mingshun Guo1*
- 1School of Management, Shenyang University of Technology, Shenyang, China
- 2Institute of Higher Education, Shenyang Agricultural University, Shenyang, China
Crop planting structure fundamentally shapes food security while serving as a critical pathway for high-quality agricultural development. This study examines the relationship between near-surface ozone pollution and cash crop cultivation using panel data from Chinese prefecture-level cities (2014–2019). Through Pedroni cointegration tests and spatial autocorrelation analysis, this study finds that: ozone pollution in China exhibits distinct regional characteristics, with expanding high-concentration zones concentrated in central and southern regions. Cash crop (it refers to crops that provide raw materials for industry, especially light industry) cultivation areas exhibit significant spatial autocorrelation and clustering patterns across Chinese prefecture-level cities. A long-term negative cointegration relationship between ground-level ozone pollution and cash crop planting shares. The impact of ozone concentration on the planting area of cash crops shows an inverted U-shaped pattern. The inflection point is when the near-surface ozone concentration is 64.81 ppb. The vast majority of cities (O3 > 64.81 ppb, N = 1,597) are on the right side of the inflection point, accompanied by a negative spatial spillover effect. This article argues that the government should prioritize the development of ozone-resistant crop varieties and the establishment of farming systems that are adaptable to odor pollution, in order to mitigate its negative impact on agricultural production.
1 Introduction
Crop planting structure serves as a vital indicator reflecting the spatial allocation of agricultural production resources and the distribution characteristics of crop species. It also constitutes a crucial basis for national policymaking and adjustments in agricultural planting structures (Guo et al., 2024; An et al., 2021). The adjustment and optimization of planting structure support sustainable regional economic and environmental growth, boost farmer incomes, and ensure food security (Renard and Tilman, 2019; Wang et al., 2021). Therefore, it is imperative to grasp the spatial evolution characteristics and influencing factors of crop planting structure to ensure the transformation of planting structure to high quality and high efficiency.
The evolution mechanisms and drivers of agricultural planting structures remain a prominent research focus. Ge and Zhang (2021) revealed the spatial evolution characteristics and regional variability of crop planting structure at different stages in Northeast China from the perspectives of yield and planting area, which provided a scientific basis for guaranteeing food security and formulating food policy. Zhang and Li (2022) argued that farmland rights and production hosting services have a significant impact on crop planting structure, in addition to factors such as gender, age, income and village location of farmers also play a role. According to Jiang et al. (2023), multifunctional factors such as agricultural mechanization and technology promotion affect farmers’ planting decisions, which in turn affects the planting area of cash crops and changes the crop planting structure. Yang et al. (2022) argued that factors such as urbanization and population density also lead to the continuous adjustment of the planting structure within crops. Subsequently, An et al. (2021) demonstrated that the evolution of crop composition results from interactions between regional natural environmental conditions and external factors: societal development and market demand increase the proportion of cash crops, agricultural protection policies secure the planting area of staple food crops, and technological progress expands the overall cultivated area.
Crop production represents a deeply intertwined process of natural and economic reproduction. Natural reproduction embodies the biological growth patterns of crops, while economic reproduction specifically refers to the cyclical circulation and value appreciation of total social capital within the agricultural sector. Specifically, farmers make planting decisions based on cost–benefit analyses, and the agricultural industry chain completes the value regeneration process through stages like processing, storage, transportation, and marketing of agricultural products. Within this process, natural climatic factors constitute dominant influences on agricultural production alongside socioeconomic factors. Against the backdrop of global climate change and intensified human activities, near-surface ozone pollution has emerged as a critical environmental stressor constraining sustainable agricultural development (Wang et al., 2025). As the second-largest pollutant after haze, persistently rising ground-level ozone concentrations not only directly threaten crop physiological functions and yield formation but may also drive farmers to adjust planting decisions by altering comparative agricultural profitability, thereby triggering systemic shifts in regional crop composition.
Existing research on the impact of ozone pollution on crop yields and composition indicates that elevated ground-level ozone concentrations significantly reduce yields by inhibiting photosynthesis, accelerating leaf senescence, and reducing water-use efficiency (Zhang et al., 2025). In the United States, rising ozone levels cause yield losses in major crops such as winter wheat, cotton, and soybeans, incurring annual losses of approximately $2 billion (Liu and Lu, 2023). Feng et al. (2019) noted that when ground-level ozone concentrations reach 40–60 ppb, the yield of cash crops (such as trees) decreases by an average of 11–13%. In contrast, staple food crops like rice and wheat exhibit relatively stronger tolerance, showing a lower reduction of approximately 6–8%. Cash crops display even greater ozone sensitivity. Feng et al. (2022) and Wang et al. (2023) confirmed that for every 10 ppb increase in ozone concentration, the output value loss for high-value cash crops like tea and citrus in the Yangtze River Delta reached 8.3–15.6%, significantly higher than the 3.5–7.8% loss for staple food crops. This asymmetric impact further alters regional crop composition. Sun et al. (2017) demonstrated that farmers in areas with severe ozone pollution tend to shift toward ozone-tolerant crop varieties to minimize losses. Consequently, crops with stronger antioxidant capacities, such as certain soybean and maize varieties, may see increased proportions in the planting structure. Conversely, ozone-sensitive cash crops like tobacco and lettuce experience declining comparative advantages, leading to potential shifts in production to less polluted regions and corresponding reductions in planting area.
Faced with ozone stress and its associated economic risks, farmers, as primary agricultural decision-makers, invariably pursue profit maximization (Schultz, 1979). Consequently, they may actively or passively adjust their crop composition, leading to adaptive (or forced) economic transformation. According to comparative advantage theory, farmers optimally allocate production resources based on their objectives (Huang and Wang, 2021), with smallholders continuously adjusting crop types and land-use patterns to maximize land output and income (Chen, 2003). On one hand, farmers tend to reduce cultivation of ozone-sensitive, high-risk crops. Modeling studies predict that under high-ozone scenarios, parts of the US may reduce soybean area in favor of more ozone-tolerant maize (Liu and Lu, 2023), while willingness to plant sensitive cereals like wheat is suppressed in severely polluted regions like the North China Plain (Feng et al., 2019). On the other hand, producers may shift toward relatively ozone-tolerant varieties or crops offering higher economic returns to offset potential losses. For instance, studies indicate certain maize or sorghum varieties possess relatively strong ozone tolerance (Peng et al., 2019; Feng et al., 2019), making them viable adjustment options. Therefore, theoretically, farmers adapt by comparing the relative advantages of crops under ozone stress, adjusting factor inputs, and consequently altering crop composition. According to China’s Environmental Status Bulletin, the national average near-surface ozone concentration has increased by 10 units over the past 5 years. Days exceeding air quality standards with ozone as the primary pollutant now account for 41.8% of all non-attainment days in China. Consequently, ozone pollution is poised to significantly influence crop composition adjustments. Clarifying the relationship between near-surface ozone and crop composition has thus become an imperative issue for rationally allocating agricultural resources, safeguarding farmer income, and ensuring high-quality agricultural development (Yang et al., 2016).
A review of the literature reveals that existing studies predominantly employ static cross-sectional analyses, focusing on ozone’s impact on single-crop yields. These approaches fail to adequately capture the spatiotemporal dynamics of ozone pollution and its interactive mechanisms with crop composition, leaving a gap in systematic explanations of how ozone reshapes agricultural landscapes. This study aims to elucidate the relationship between near-surface ozone pollution and crop composition. Utilizing spatial panel cointegration analysis, it delves into the long-term equilibrium relationship and spatial spillover effects between ozone pollution and crop composition, providing robust scientific support for synergistically addressing air pollution, optimizing planting layouts, and ensuring food security.
2 Materials and research methods
2.1 Distribution of near-surface ozone concentrations in the study area
Near-surface ozone is the result of environmental pollution and climate change, mainly formed by nitrogen oxides (NOx) and volatile organic compounds (VOCs) in the air through a series of photochemical reactions such as solar radiation, and is a typical secondary pollutant that exists within a range of 1–2 km from the ground (Yang et al., 2016). Unlike pollutants such as PM2.5, ozone concentration exceeds the standard even when the weather is sunny, and its daily variation cycle is obvious, with the daily maximum values in different areas occurring mainly in the afternoon when the light intensity is the strongest during the 13:00–15:00 period, and the concentrations in the early morning and at night are relatively low. Temperature, humidity and air pressure have strong and stable effects on ozone concentration (Avnery et al., 2011; Ainsworth, 2017). Following established methodologies in environmental research (Yang et al., 2016), this study employs the M7 metric to quantify near-surface ozone concentrations. The M7 parameter specifically denotes the hourly mean ozone concentration measured at ground-level monitoring stations during the 9:00–16:00 local time window.
Ground-level ozone concentrations across Chinese prefecture-level cities from 2014 to 2019 were classified into four tiers using the Jenks Natural Breaks method in ArcGIS (Figure 1), revealing distinct spatiotemporal patterns (Chen et al., 2022). In terms of spatial dimensions, a clear “milder in the north, more severe in the south, with central clustering” pattern emerged. Pollution levels were generally higher in central and southern regions. In terms of the time dimension, the concentration thresholds defining each pollution tier increased annually. In 2014, the highest tier (≥126.658 ppb) encompassed 56 regions, primarily concentrated in the North China Plain (e.g., Beijing, Tianjin, Shijiazhuang within the Jing-Jin-Ji region) and the Yangtze River Delta (e.g., Shanghai, Nanjing, Hangzhou), while pollution levels were relatively lower in the northeast and west. By 2019, the threshold for this highest tier had risen to 138.493 ppb, and the number of affected regions expanded to 80, representing a 43% increase compared to 2014. A contiguous high-pollution zone developed, centered on the Jing-Jin-Ji urban cluster and extending southeastward along the coast (e.g., Zhejiang, Shanghai). Simultaneously, pollution intensified in northwestern (e.g., Inner Mongolia) and southwestern regions. Although the Pearl River Delta (e.g., Guangzhou, Shenzhen) also experienced some spatial expansion of high concentrations, the severity of pollution there was comparatively lower. Notably, Southern China exhibited a slight decrease in pollution intensity relative to 2014, potentially attributable to a dilution effect associated with enhanced monsoon activity. Conversely, historically cleaner regions like Northeast China showed localized increases in ozone concentrations in specific cities, likely reflecting the marginal impact of growing traffic emissions during urbanization. This spatiotemporal evolution can be attributed to several factors. Industrial concentration and high traffic volumes in regions like the Jing-Jin-Ji and Yangtze River Delta led to elevated background ozone precursor levels. High temperatures and intense solar radiation, particularly in summer, accelerated ozone formation rates, resulting in more pronounced peak concentrations. In contrast, regions with lower industrialization and traffic emissions historically exhibited lower ozone levels. However, accelerated urbanization in recent years has gradually exacerbated ozone pollution in these areas as well.
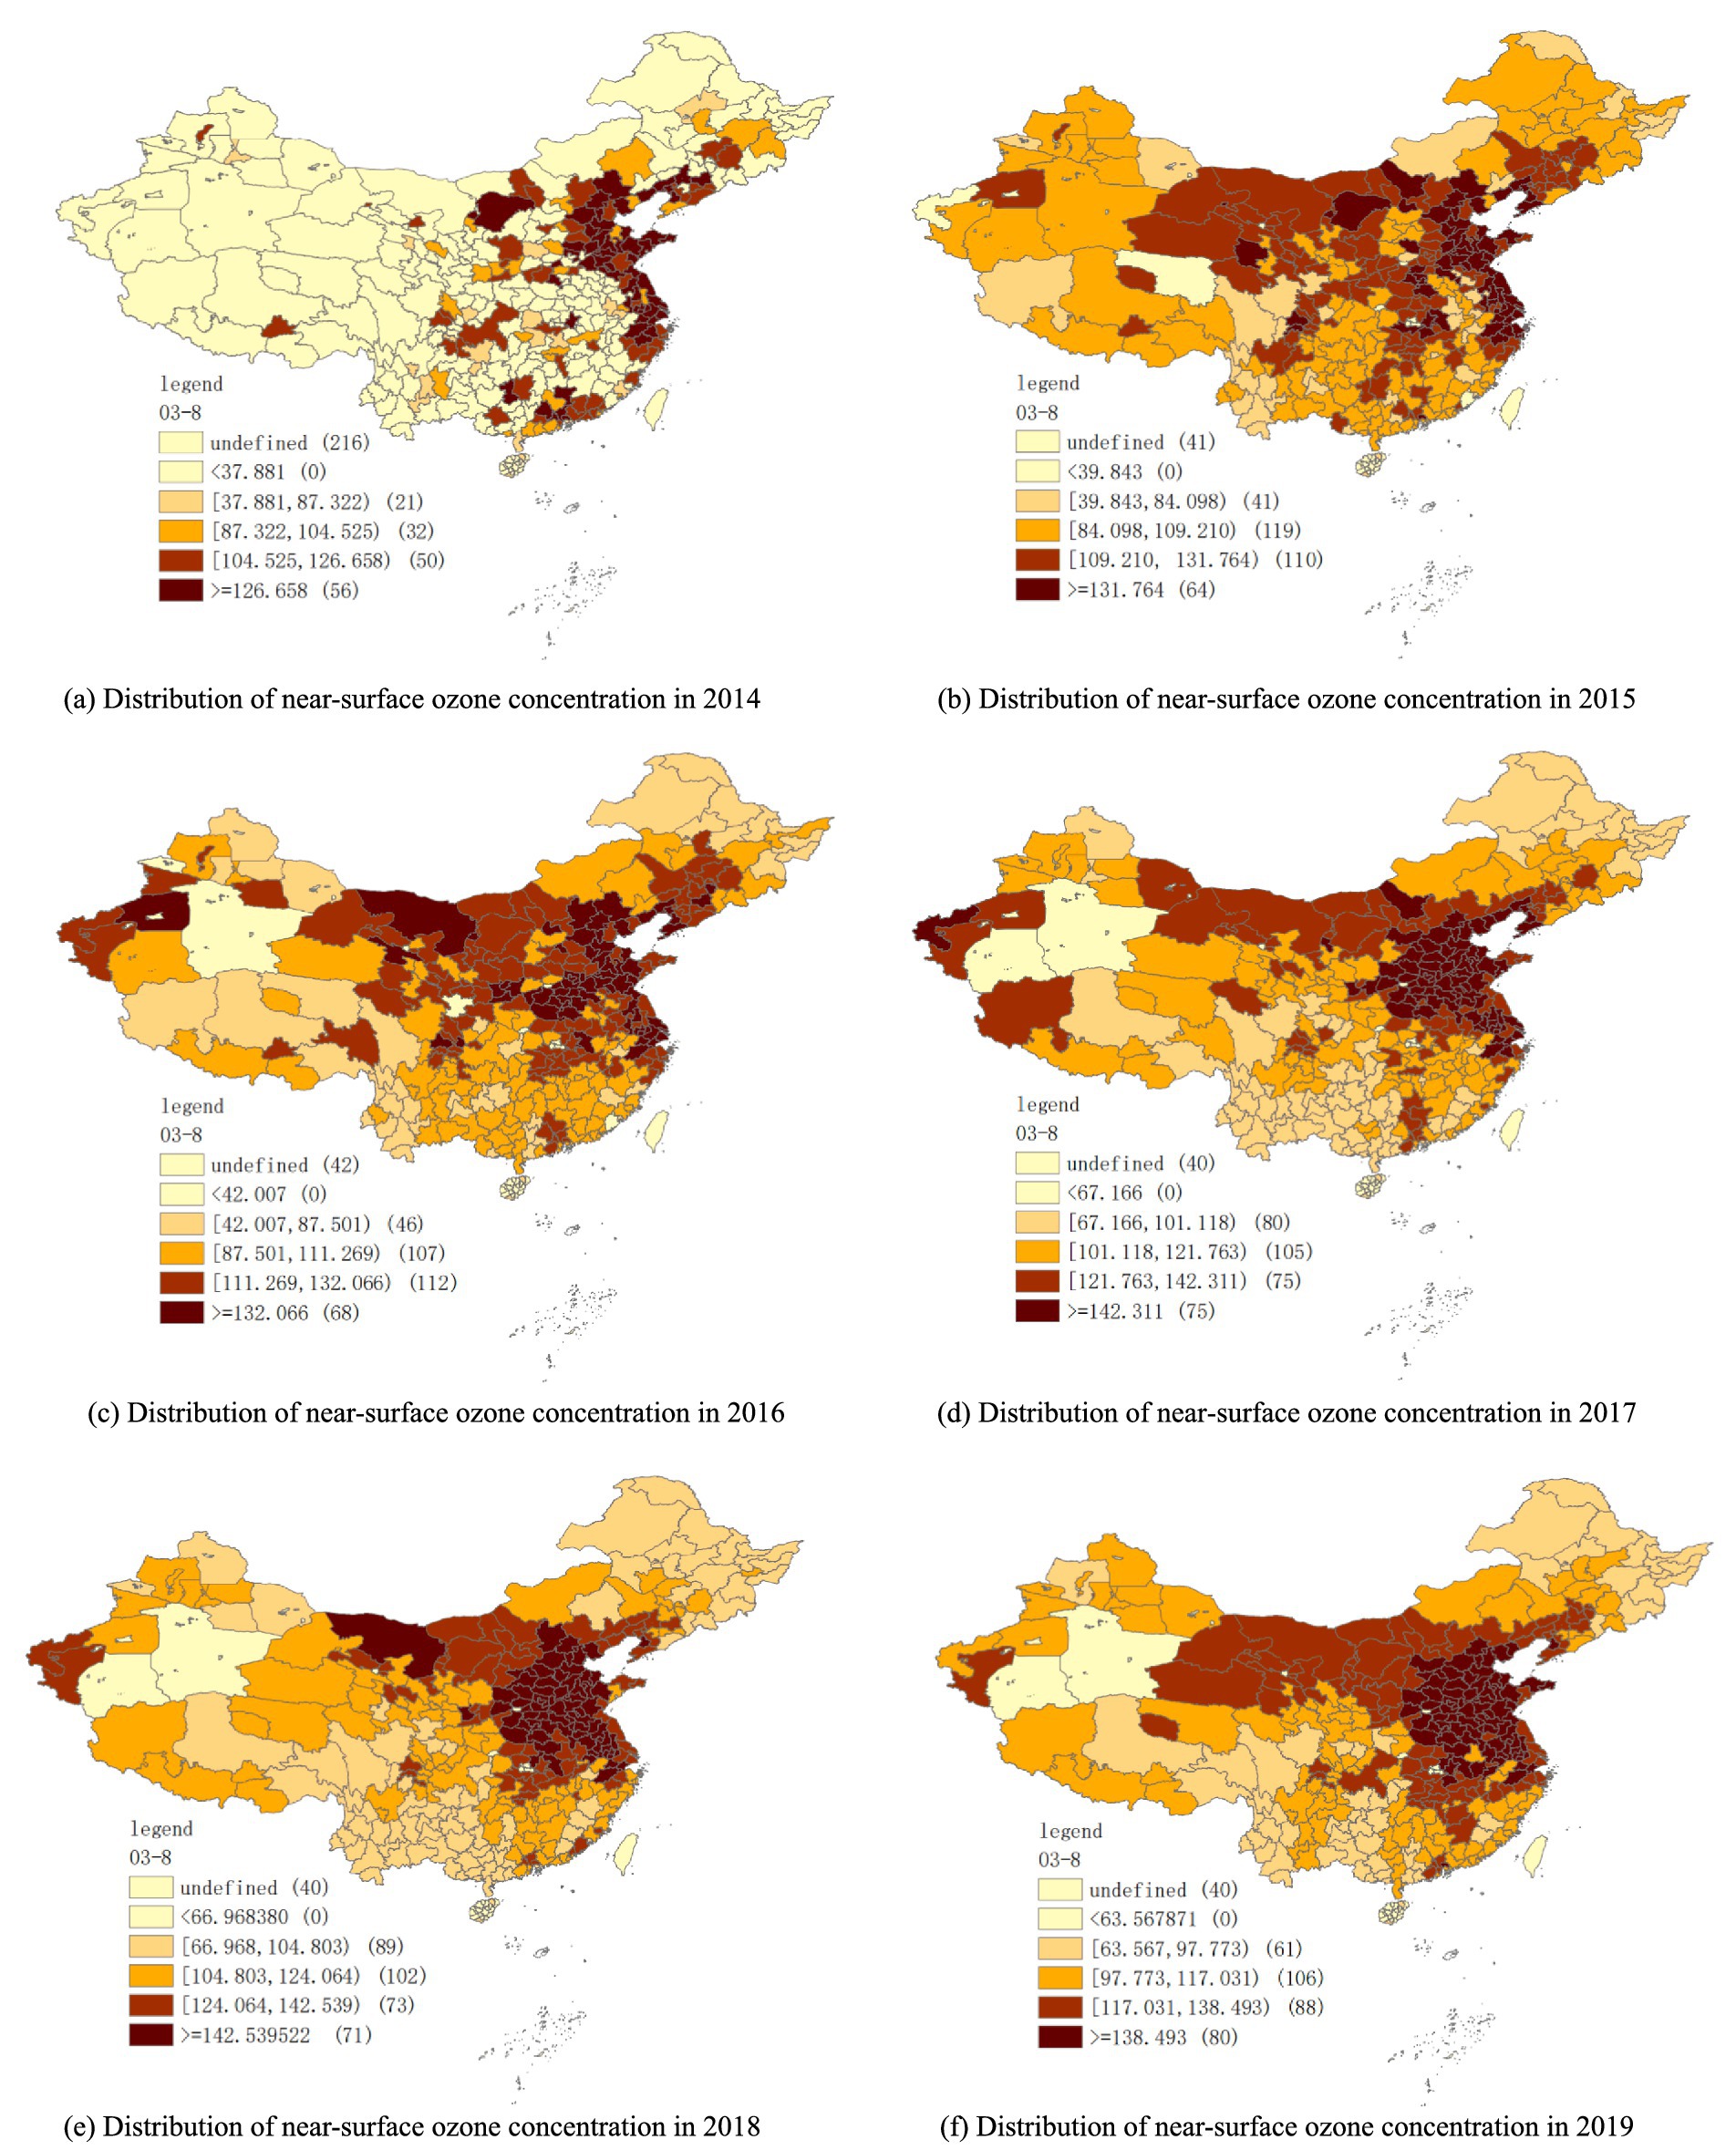
Figure 1. Annual distribution map of near-surface ozone concentration from 2014 to 2019. (a) Indicate the near-surface ozone concentration in 2014. (b) Indicate the near-surface ozone concentration in 2015. (c) Indicate the near-surface ozone concentration in 2016. (d) Indicate the near-surface ozone concentration in 2017. (e) Indicate the near-surface ozone pollution concentration in 2018. (f) Indicate the near-surface ozone concentration in 2019.
Further analysis of the characteristics of the core polluted area. Within the eastern and central urban clusters, a significant spatial gradient was observed, with ozone concentrations increasing from northwest to southeast. Most areas exceeded the National Grade I Standard. Zibo, Shandong (169.82 ppb) recorded the regional maximum, while Sanya, Hainan (72.74 ppb) represented the minimum. This distribution correlates strongly with terrain: The Shandong Peninsula, situated on the eastern edge of the North China Plain, features low mountains and hills with higher elevations in the east sloping down westward. This topography promotes airflow stagnation and orographic lifting. Combined with intense anthropogenic activity, this leads to higher ozone concentrations. Sanya, Hainan, benefits from a tropical monsoon climate and its coastal location. Favorable natural conditions promote good air circulation and lower concentrations of ozone precursors, resulting in lower ozone levels. Within the northwestern interior, anomalously high ozone concentrations occurred in valley-basin cities like those in Shaanxi-Gansu-Ningxia (Shaan-Gan-Ning), exemplified by Xianyang (131.87 ppb). This contrasts sharply with lower values observed in areas like Nujiang Prefecture (77.34 ppb). These high values are closely linked to the region’s unique topography: The Loess Plateau (Shaan-Gan-Ning) features complex, interwoven valleys and basins. This terrain inhibits pollutant dispersion. Coupled with an arid climate and relatively sparse vegetation, ozone precursors readily accumulate and undergo photochemical reactions, generating high ozone concentrations. Higher industrialization and population density further exacerbate precursor emissions and ozone formation. Nujiang Prefecture, located in deep northwest Yunnan gorges, also has complex topography. However, its humid climate, abundant vegetation, and good ventilation promote pollutant dispersion, resulting in lower ozone levels.
2.2 Theoretical analysis and hypothesis formulation
2.2.1 Theory of the agricultural production function
This section describes the response and adaptation mechanisms of agriculture to ozone pollution in order to illustrate the impact of near-surface ozone pollution on the cropping structure of crops, which is analyzed using the theory of the C-D production function, which is a mathematical expression that describes the relationship between the input elements of production and their combinations in the production process, and the maximum amount of output it is possible to produce, and which is constructed in this study in the form of the C-D production function:
In Equation 1, y is the agricultural output that is crop yield, f(X; B) is the relationship between inputs and outputs in the process of agricultural production, X = c(l,f,m) represents input factors, mainly including labor (l), fertilizers (f), machinery (m), β = c(β1,β2,β3) for the coefficients of the input factors (Gong et al., 2020). This study draws on the research methodology of its study, from the perspective of factor inputs, to study the impact of near-surface ozone pollution on the structure of crop planting.
On the one hand, near-surface ozone pollution affects the normal growth of crops, and its mechanism of action is to reduce the chlorophyll content in plants, damage the leaf membrane system, slow down the net photosynthesis rate of leaves, reduce the number of leaves, etc., resulting in a reduction of yields (Ainsworth, 2017), but the degree of reduction of yields varies among different types of crops (Yang et al., 2016). On the other hand, ozone has unique characteristics. Unlike temperature and precipitation, which are easily perceived by people, in most cases, people are not sensitive to ozone, which can directly affect the behavior of farmer’s factor inputs is the food production and profit, if the production of a certain crop declines, farmers will reduce the planting area of the crop and other factor inputs, and then change the planting structure. Furthermore, some scholars have discovered that the impact of ozone pollution on cash crops such as soybeans, cotton and oilseed rape is more obvious, and the degree of damage is more serious than that of grain crops such as rice and maize when ozone is aggravated (Bisbis et al., 2018). Therefore, as near-surface ozone pollution continues to increase, the planting area of cash crops will change more obviously, specifically, when the ozone concentration continues to rise, the planting area of cash crops will decrease. Based on this, the first hypothesis of this study is formulated:
H1: There is a long-run covariance between ozone pollution and the share of area under cash crops.
2.2.2 Theory of comparative returns in agriculture
There is no essential difference between the economic behavior of farmers in traditional societies and that of modern capitalist farmers, and they always follow the “principle of profit maximization” (Schultz, 1979). Under the given resource constraints, farmers will make optimal use of resources. Based on the assumption that rational farmers pursue profit maximization, in the process of agricultural production, farmers, as the decision makers of production, always expect to use the least inputs, including time, labor, material costs, etc., to get greater outputs and benefits under the constraints of the external environment and resources. To achieve this goal, farmers will seek an optimal behavioral scheme that makes reasonable use of human and material resources according to their own goals and the resources they possess (Huang and Wang, 2021), and small farmers will constantly adjust the types of crops and land use to maximize land returns (Chen, 2003). According to the theory of comparative advantage, during periods of lower ozone concentration, certain economic crops may experience reduced production management costs indirectly. This occurs because the oxidative effect of ozone can suppress the reproduction of specific pests and diseases or stimulate the accumulation of secondary metabolites, thereby enhancing stress resistance. At this stage, although ozone begins to affect stomatal conductance in leaves, crop yield losses have not yet exceeded critical thresholds. Consequently, the enhanced resistance may confer a comparative market advantage to certain ozone-tolerant economic crops (such as specific vegetables or fiber crops). Driven by profit maximization, agricultural producers tend to expand the cultivation area of these crops, resulting in a positive initial response in planting area to rising pollution. However, once ozone concentrations surpass a critical threshold, its toxic effects dominate crop physiological processes. High ozone levels significantly damage chloroplast structure, inhibit photosynthetic system activity, impede carbohydrate synthesis, and accelerate leaf senescence. For economic crops, this damage not only directly reduces yield but also triggers market price fluctuations due to quality deterioration (e.g., abnormal fruit coloration, reduced fiber strength), ultimately diminishing planting profits. At this point, even for crops possessing some ozone tolerance, their marginal returns diminish as pollution intensifies. Agricultural producers consequently adjust planting structures, reducing investment in highly sensitive economic crops and shifting toward more resistant conventional crops or fallowing land. This leads to a negative response in planting area. In summary, we propose the second hypothesis of this study:
H2: Ozone pollution exerts a significant inverted U-shaped influence on the planting area of economic crops.
2.3 Data sources
In this study, we use data on the percentage of cash crop cultivation area and near-surface ozone concentration in prefecture-level cities from 2014 to 2019. The cash crop cultivation area is obtained from the statistical yearbooks of each province and city. The ozone concentration data is obtained from the China Meteorological Data Service Centre-China Surface Climate Data Daily Value Dataset,1 which includes historical daily value data from over 2,400 national-level meteorological stations across the China. It has been extensively utilized in compiling the China Ecological and Environmental Status Bulletin and contributing to the IPCC Climate Change Assessment Reports. Its scientific validity and reliability have gained broad recognition within academia (Guha et al., 2024; Wang et al., 2025). The data were interpolated into grid point data by ArcGIS software and inverse distance weighting (IDW) method, and then aggregated by region to get the daily average value of each city and finally the annual average value for analysis. The raster size used for interpolation is 500 m × 500 m. For the missing values and outliers of the data, if the data are missing for only 1 year, the mean interpolation method is used to get the average of the two adjacent years to fill in, if the data are missing for more than years or the data at both ends of the time series are missing, for more than 2 years or the data at both ends of the time series are missing, the linear difference method is used to fill in, and for the outliers, this study directly deletes them, and then interpolates them to deal with them.
2.4 Research methodology
2.4.1 Spatial autocorrelation test
To assess the spatial effects of the variables, this study conducted a spatial autocorrelation analysis on the proportion of cash crop cultivation area. This analysis included both global spatial autocorrelation (Equation 2) and local spatial autocorrelation (Equation 3) tests, examining spatial dependence and agglomeration patterns at the global and local scales, respectively. The formulas are as follows:
= and = , Y i are the observations in region i, n is the number of regions, and is the spatial weight matrix.
2.4.2 Spatial panel cointegration estimation
First, following Dawo and Khalifa (2025), this study employs the Levin-Lin-Chu Test (LLC), Im-Pesaran-Shin Test (IPS), Augmented Dickey-Fuller Test (ADF), and Phillips-Perron Test (PP) to perform panel unit root tests on the proportion of cash crop cultivation area and near-surface ozone concentration. Subsequently, the Pedroni test is applied to examine the existence of a cointegration relationship between these two variables.
Second, we construct the following panel cointegration model for the proportion of cash crop cultivation area and near-surface ozone concentration:
In Equation 4, Y denotes the proportion of cash crop cultivation area, X represents near-surface ozone concentration, and ε is the error term.
Finally, accounting for spatial dependence, we estimate three spatial econometric models: the Spatial Lag Model (SLM), Spatial Error Model (SEM), and Spatial Durbin Model (SDM). The SLM (Equation 5) captures spatial interdependence through the lagged dependent variable, the SEM (Equation 6) addresses spatial autocorrelation in error terms, while the SDM (Equation 7) integrates both approaches. The specifications are as follows:
In Equations 5–7 ρ denotes the spatial autoregressive coefficient, λ represents the spatial error parameter, β indicates the explanatory variable coefficients, W is the spatial weights matrix (constructed as a binary contiguity matrix where Wij = 1 if regions i and j share a common border, and Wij = 0 otherwise). All other variables maintain their definitions from Equation 4.
2.5 Selection of variables
The explained variable selected in this study is the proportion of area planted with cash crops, i.e., the ratio of the sown area of cash crops to the total sown area of crops. The explanatory variable is the concentration of near-surface ozone, which refers to the ozone gas within 1–2 kilometers from the ground. In this study, building upon the methodology outlined by Yang et al. (2016), we employ the M7 metric to quantify near-surface ozone concentrations. Specifically, M7 represents the hourly mean ozone concentration measured during the 9:00–16:00 local time window, which corresponds to the photochemical peak period when diurnal ozone accumulation reaches its maximum. Consequently, M7 serves as our primary quantitative indicator for daily ozone exposure, with annual averages derived through spatial aggregation across monitoring zones. Given that the share of cash crop cultivation area, as a proportional variable, may exhibit asymmetric distribution characteristics, we apply a logarithmic transformation to this variable. This transformation serves two purposes: it mitigates potential heteroscedasticity by compressing the effects of extreme values, and enables the interpretation of coefficients as elasticities. The elasticity form better aligns with the theoretical expectation regarding the marginal impact of environmental stressors on agricultural planting structure (Table 1).
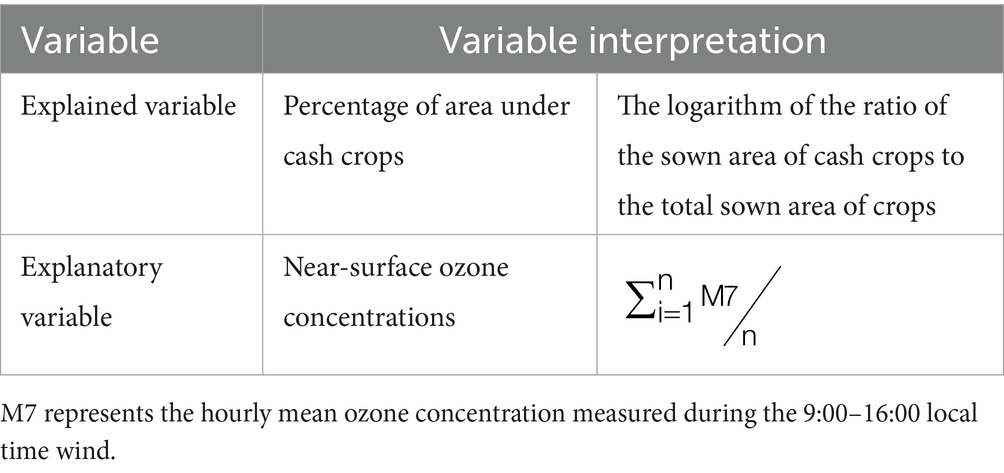
Table 1. Selection of variables and assignment of values.
3 Results and analyses
3.1 Spatial autocorrelation test
To examine the spatial effects of the variables, this study first employs global spatial autocorrelation to analyze the spatial dependence of the proportion of cash crop cultivation area among regions and generates Moran scatter plots. The results are presented in Figures 2, 3.
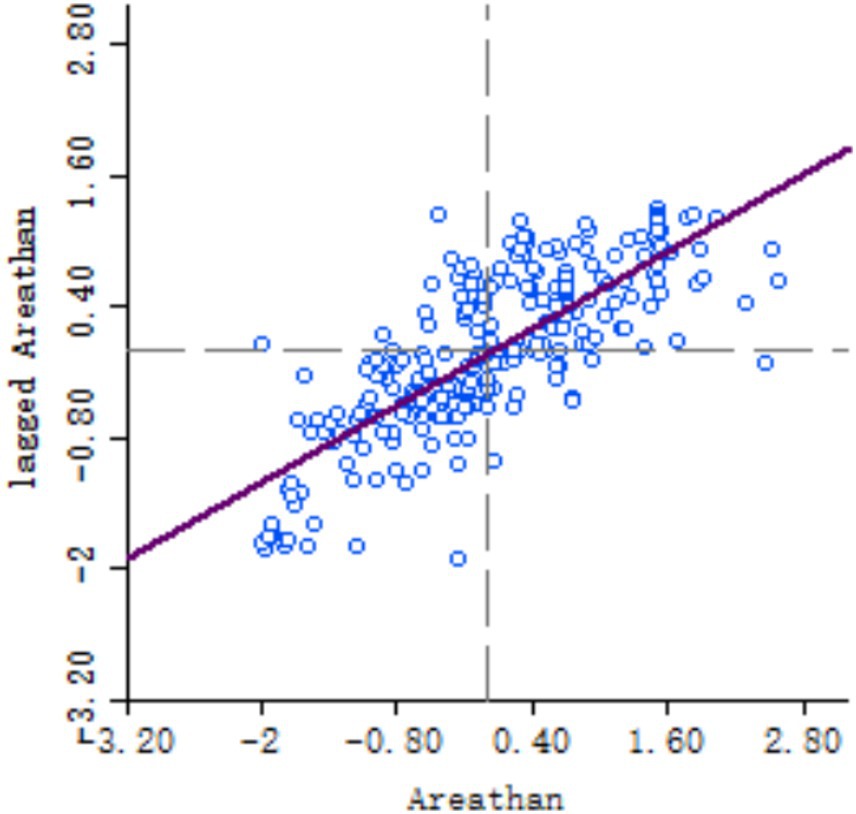
Figure 2. Scatterplot of Moran’s share of area under cash crops, 2014.
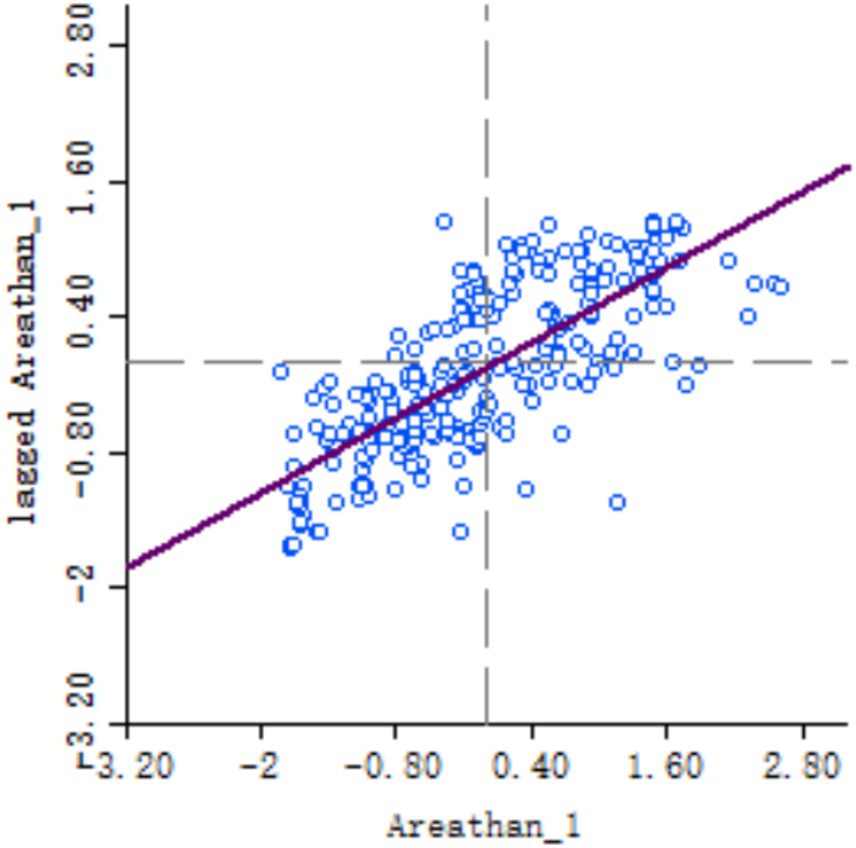
Figure 3. Scatterplot of Moran’s share of area under cash crops, 2019.
Figures 2, 3 display the Moran scatter plots for prefecture-level cities in 2014 and 2019, respectively. The Moran’s I values are 0.586 and 0.556, both positive and statistically significant at the 1% level. This indicates a significant positive spatial autocorrelation in the proportion of cash crop cultivation area across regions. While global spatial autocorrelation reflects the average clustering intensity of similar attributes within the study area, it cannot identify specific spatial patterns at the local scale. Therefore, we further apply local indicators of spatial association (LISA) to pinpoint areas exhibiting spatial clustering, as illustrated below.
Regions with statistically significant local spatial autocorrelation can be categorized into four cluster types: high-high (HH), high-low (HL), low-high (LH), and low-low (LL). Figures 4, 5 present the LISA cluster maps for the proportion of cash crop cultivation area in 2014 and 2019, respectively. Comparing these maps reveals the following spatial patterns. In 2014, LL clusters were concentrated in northeastern and central China, encompassing 101 cities (e.g., Shenyang, Fushun, and Chaoyang in Liaoning; Heihe, Daqing, and Qiqihar in Heilongjiang; Linyi and Zaozhuang in Shandong; Zhengzhou and Kaifeng in Henan). This indicates spatial agglomeration of regions with low cash crop proportions. HH clusters comprised 83 cities primarily in southern China (e.g., Maoming, Shanwei, and Foshan in Guangdong; Fuzhou, Zhangzhou, and Putian in Fujian; Xiangtan and Yiyang in Hunan), signifying spatial agglomeration of regions with high cash crop proportions. HL and LH clusters were relatively scarce and dispersed. In 2019, LL clusters in eastern Inner Mongolia were no longer statistically significant, while significant LL clusters emerged in cities like Baoding, Tangshan, and Cangzhou in Hebei. Overall, the spatial distribution of LL clusters remained largely consistent with 2014. The number of HH clusters decreased slightly from 83 to 80 cities, maintaining their concentration in southern regions.
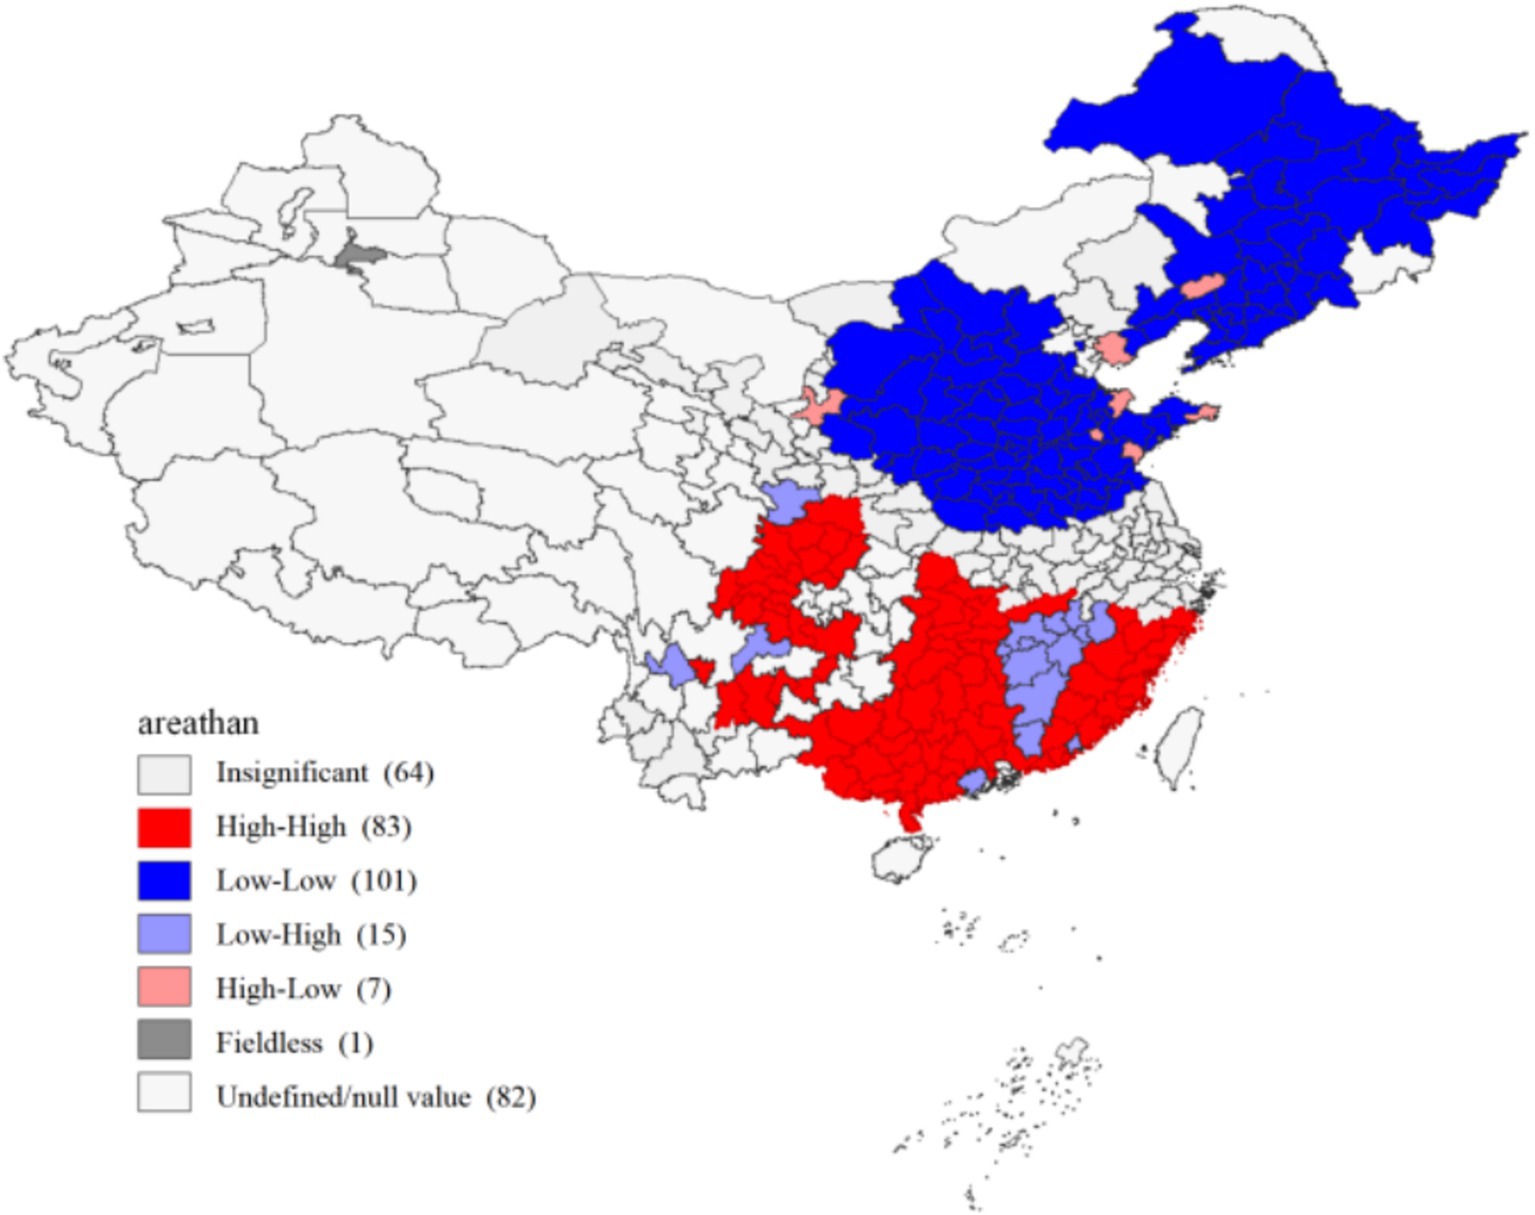
Figure 4. Clustering of cash crop acreage share, 2014.
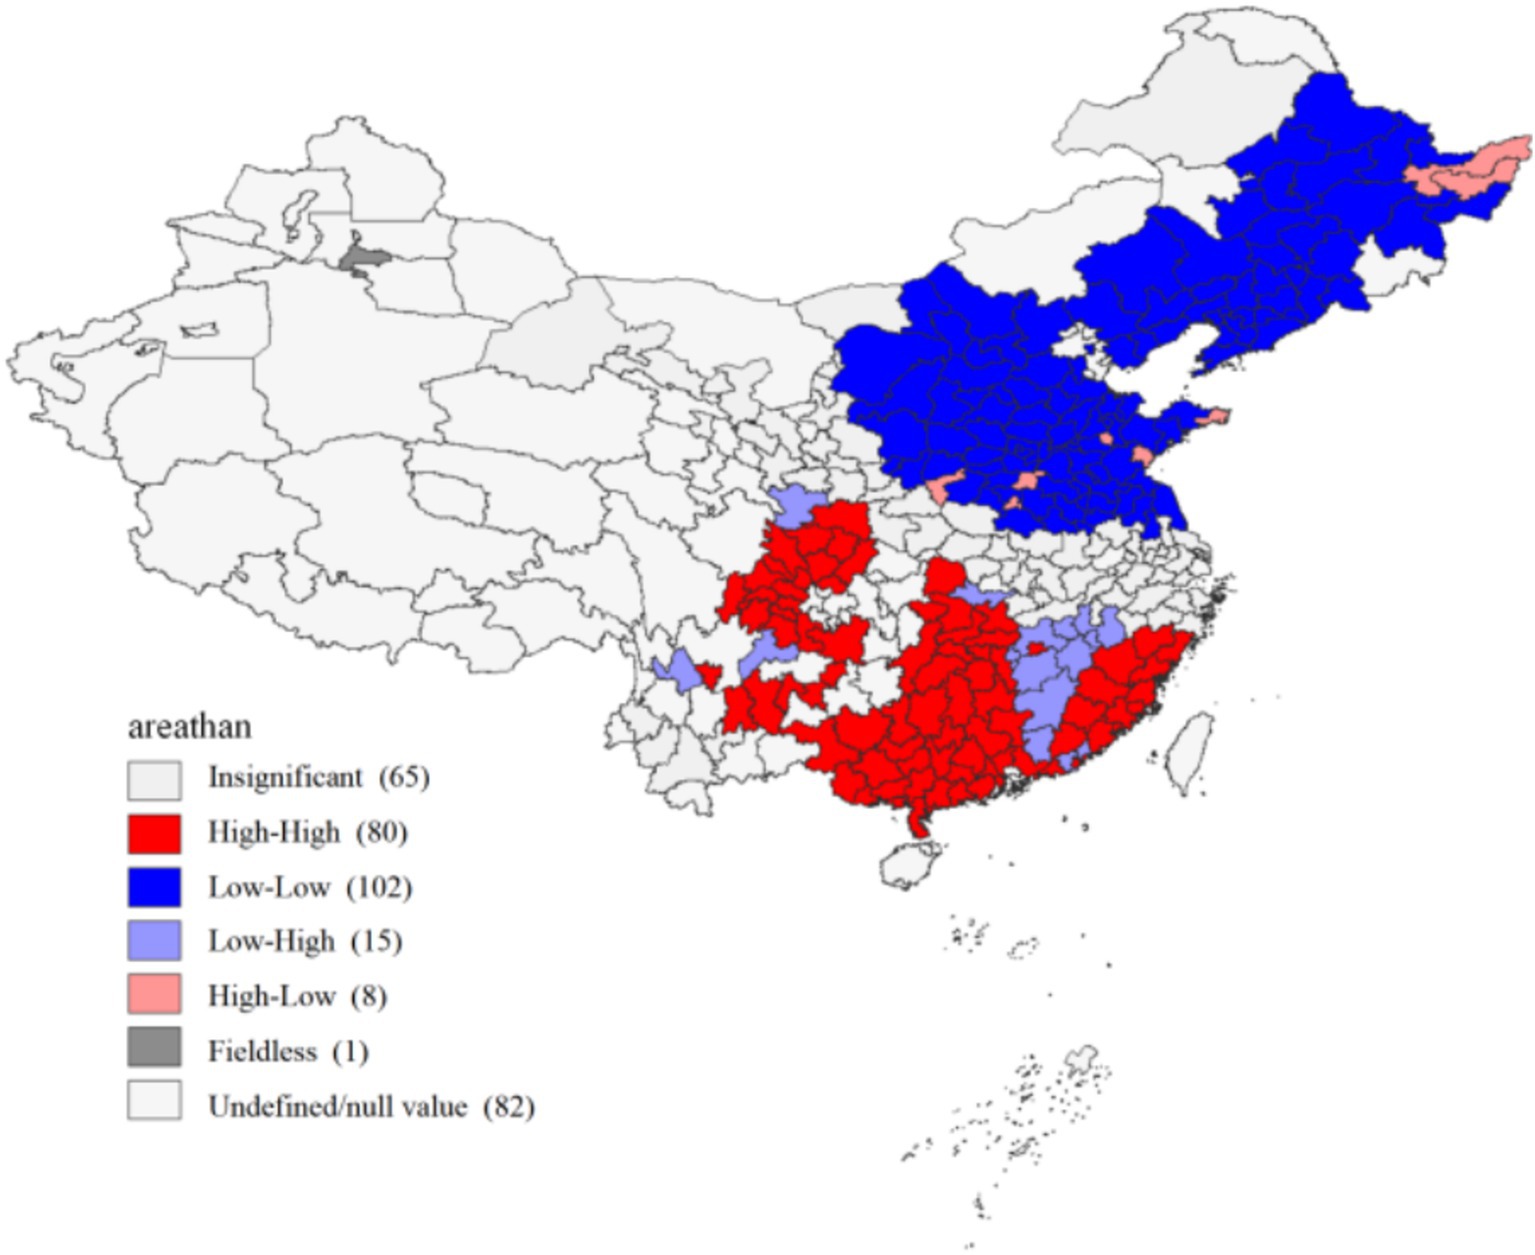
Figure 5. Clustering of cash crop acreage share, 2019.
These results demonstrate significant spatial dependence and distinct geographic heterogeneity in the proportion of cash crop cultivation area among prefecture-level cities.
3.2 Unit root tests
Prior to conducting spatial panel cointegration regression, stationarity tests were performed on both the proportion of cash crop cultivation area and ground-level ozone concentration for each city to determine the presence of unit roots in the variables. If the data fail the stationarity tests, indicating the presence of unit roots, direct cointegration analysis is invalid. In such cases, the variables require differencing. Reliable spatial econometric regression results depend on all variables passing stationarity tests. Therefore, in this study, four methods, namely, LLC test, IPS test, ADF test and PP test (Fu, 2010), were used to test the smoothness of the proportion of area planted with cash crops and near-surface ozone concentration in each city, respectively. The results are presented in Table 2.
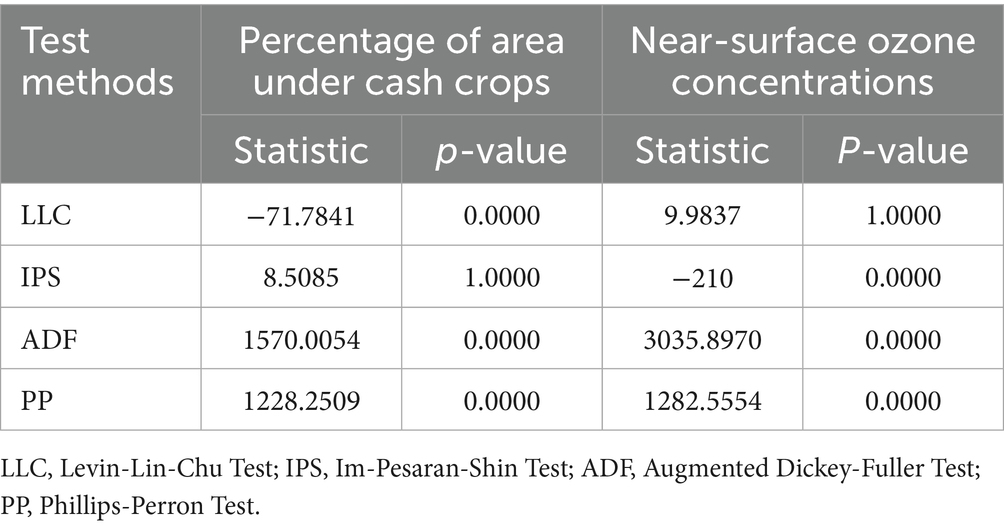
Table 2. Panel unit root test results.
As shown in Table 2, for the proportion of cash crop cultivation area, three of the four tests (LLC, ADF, PP) rejected the null hypothesis of a unit root at the 1% significance level, while the IPS test did not. This outcome suggests that the first-difference series of this variable is stationary. Similarly, for ground-level ozone concentration, three tests (IPS, ADF, PP) rejected the unit root null hypothesis at the 1% level, though the LLC test did not. These results indicate that the first-difference series of ground-level ozone concentration is stationary, exhibiting good stationarity properties.
As can be seen from the results in Table 2, for the percentage of area planted with cash crops, except for the IPS test result which did not pass, all the other three methods passed the 1% significant level test, which can indicate that there is no unit root in its first-order difference series, whereas for the near-surface ozone concentration, except for the failure of the LLC test, all the other results passed the 1% significant level test, which indicates that there is no unit root in its first-order differences and that it is of good smoothness.
3.3 Cointegration test
Based on the stationarity test conducted in section 3.2, the cointegration test method is adopted, aiming to examine the potential existence of a long-term equilibrium relationship between the proportion of cash crop cultivation area and ground-level ozone concentration across different cities. The test results are summarized in Table 3.
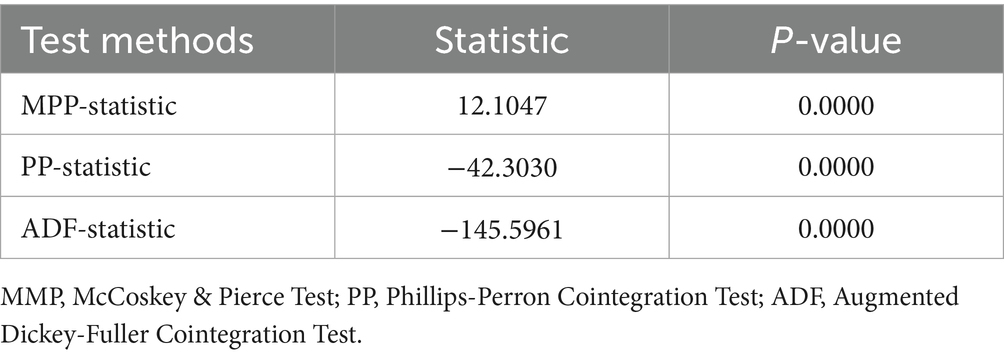
Table 3. Panel cointegration data test results.
The results in Table 3 show that the original data series passed the MPP, PP, and ADF cointegration tests at the 1% significance level. This provides evidence of a cointegrating relationship, confirming the existence of a long-term equilibrium relationship between the proportion of cash crop cultivation area and ground-level ozone concentration.
3.4 Spatial panel cointegration regression
Section 3.3 results demonstrate a long-term equilibrium relationship between the share of cash crop cultivation area and ground-level ozone pollution. However, the precise nature of this equilibrium requires further investigation. Given that environmental factors often exhibit threshold or tipping point effects, this study incorporates both linear and quadratic terms of ground-level ozone concentration into the baseline regression model. The results of the simultaneous White test and Durbin-Watson test indicated the absence of heteroscedasticity and autocorrelation in the dataset. As panel data are employed, we assessed whether random-effects or fixed-effects models are more appropriate for analyzing the impact of ground-level ozone pollution on cash crop cultivation share. The Hausman test indicates that the fixed-effects specification is preferable. Furthermore, to account for spatial dependence, we estimate spatial panel cointegration data using a spatial adjacency matrix through three spatial econometric models: the Spatial Lag Model (SLM), Spatial Error Model (SEM), and Spatial Durbin Model (SDM), all employing fixed effects. Results are presented in Table 4.
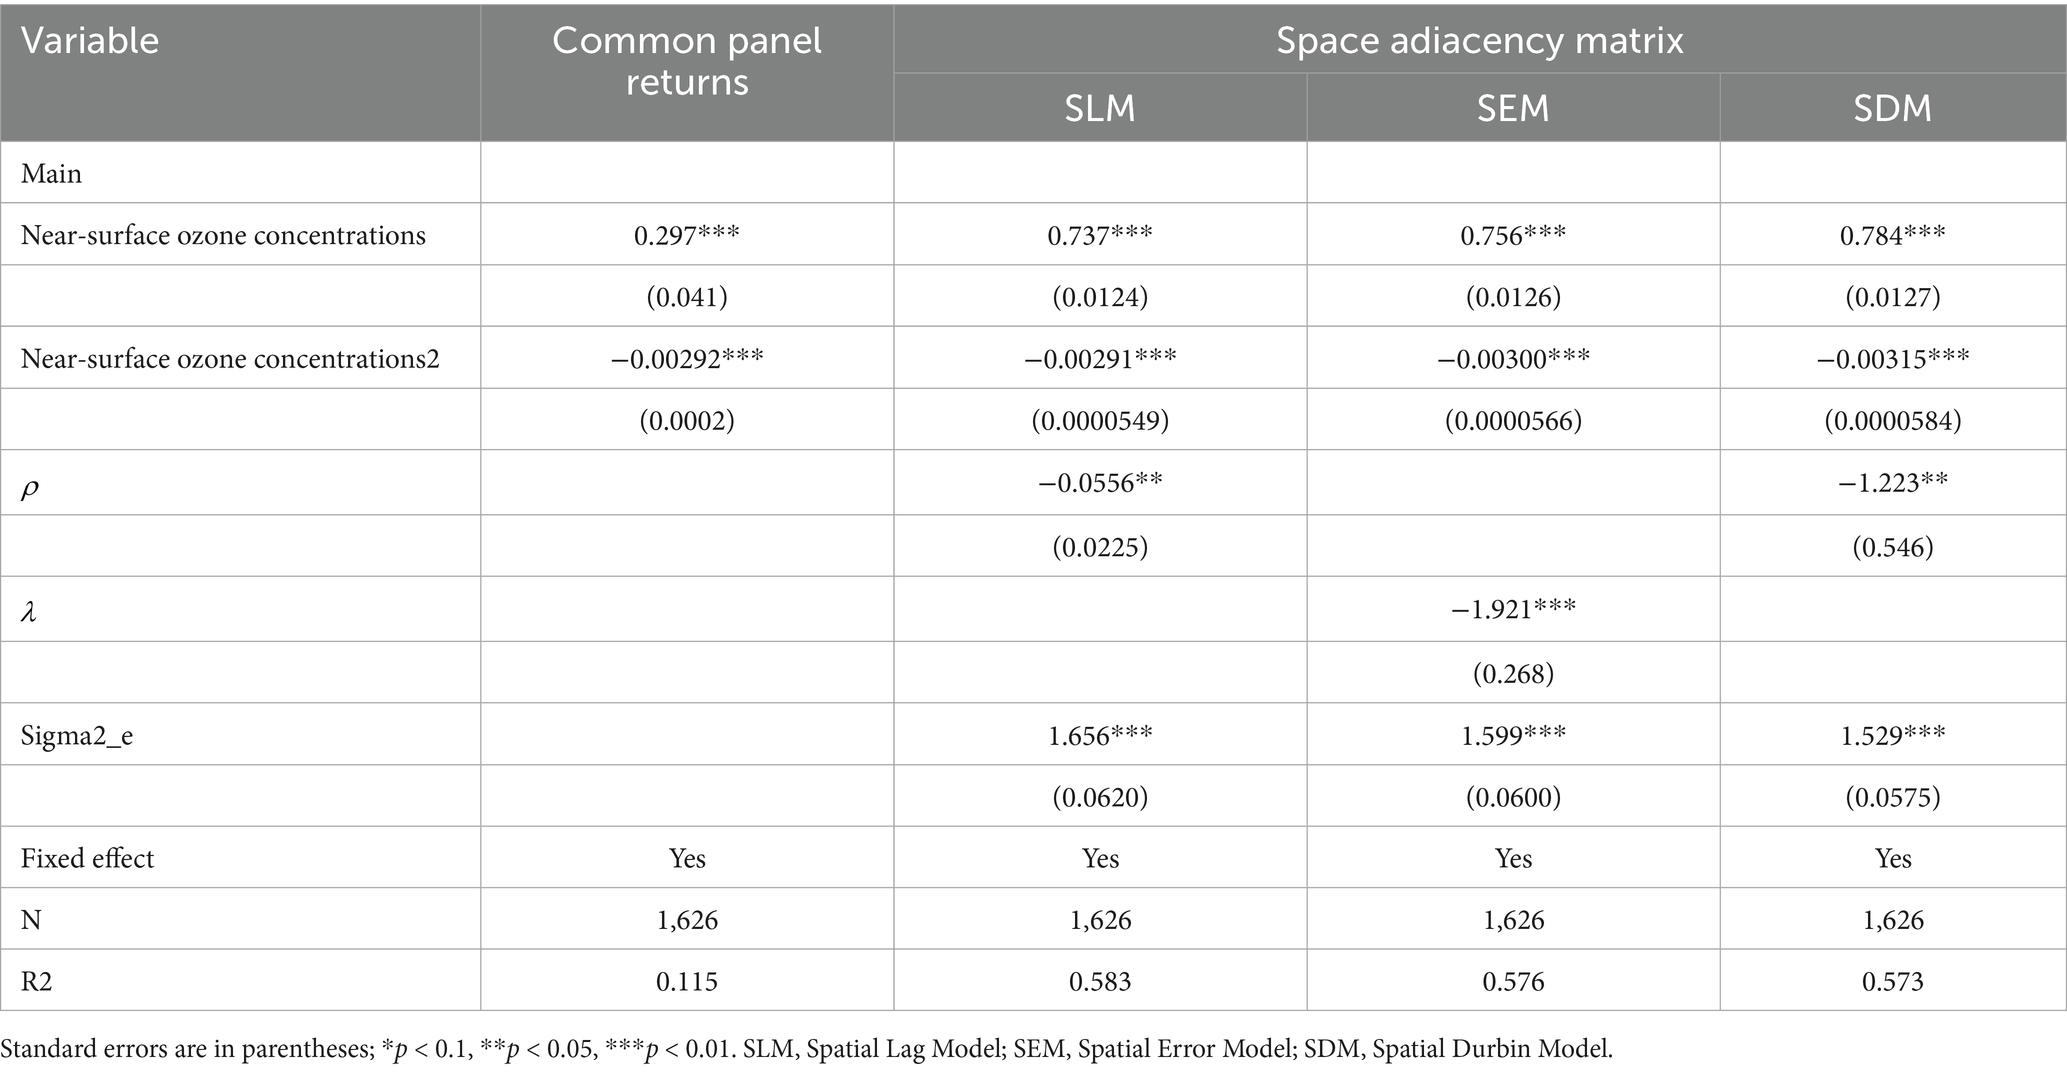
Table 4. Spatial panel cointegration estimation results.
Table 4 shows that the coefficient of ground-level ozone concentration is significantly positive at the 1% level, while its quadratic term is significantly negative at the 1% level. This initially suggests an inverted U-shaped relationship between ozone concentration and cash crop cultivation share. Specifically, short-term increases in ozone concentration correlate with expanded cash crop cultivation. However, persistent ozone accumulation leads to a long-term reduction in both the absolute cultivation area and its share of total cropland. This implies that farmers adjust planting structures by reducing land and other inputs dedicated to cash crops in response to ozone-induced productivity losses. The spatial panel regression results (Table 4) reveal consistent findings across all three models (SLM, SEM, SDM), indicating robust empirical outcomes. Regarding spatial spillover effects, both the spatial lag and spatial error terms are significantly negative, suggesting that elevated ozone levels in neighboring regions reduce local cash crop cultivation.
To rigorously verify the inverted U-shaped relationship, we apply the three-step procedure proposed by Lind and Mehlum (2010). Step 1 requires a significantly negative coefficient for the quadratic ozone term (already satisfied). Step 2 necessitates a significantly positive slope at the sample minimum ozone concentration and a significantly negative slope at the sample maximum. Step 3 requires the inflection point to lie within the observed data range. Results in Table 5 confirm: The slope is significantly positive at the minimum ozone concentration (k = 0.15, t = 0.03). The slope is significantly negative at the maximum concentration (k = −0.41, t = 0.01). The inflection point (64.81) falls within the sample range. The overall test for the inverted U-shaped relationship is highly significant (p < 0.01). These findings further support the existence of an inverted U-shaped relationship between near-surface ozone concentration and the proportion of economic crop planting area. To visually illustrate this inverted U-shaped relationship, an inverted U-shaped curve was plotted based on the regression results from Column (1) in Table 5, as displayed in Figure 6.
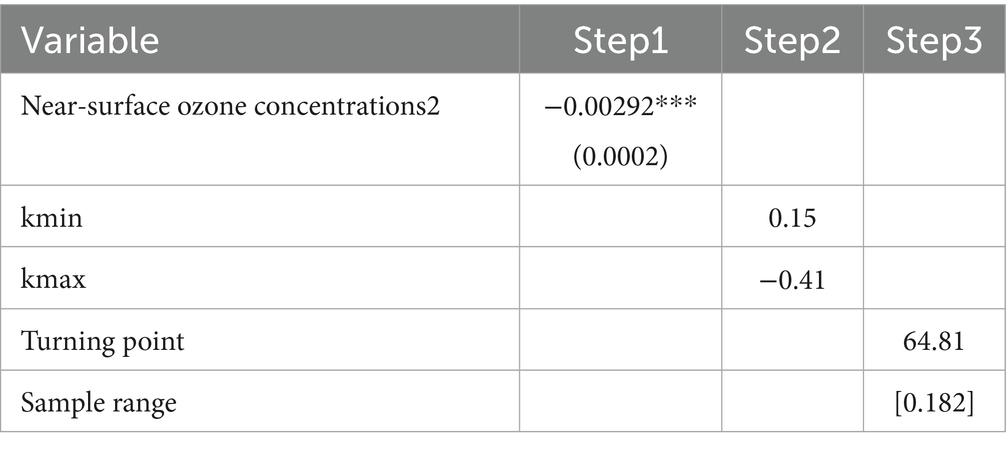
Table 5. Inverted U-shaped relationship test.
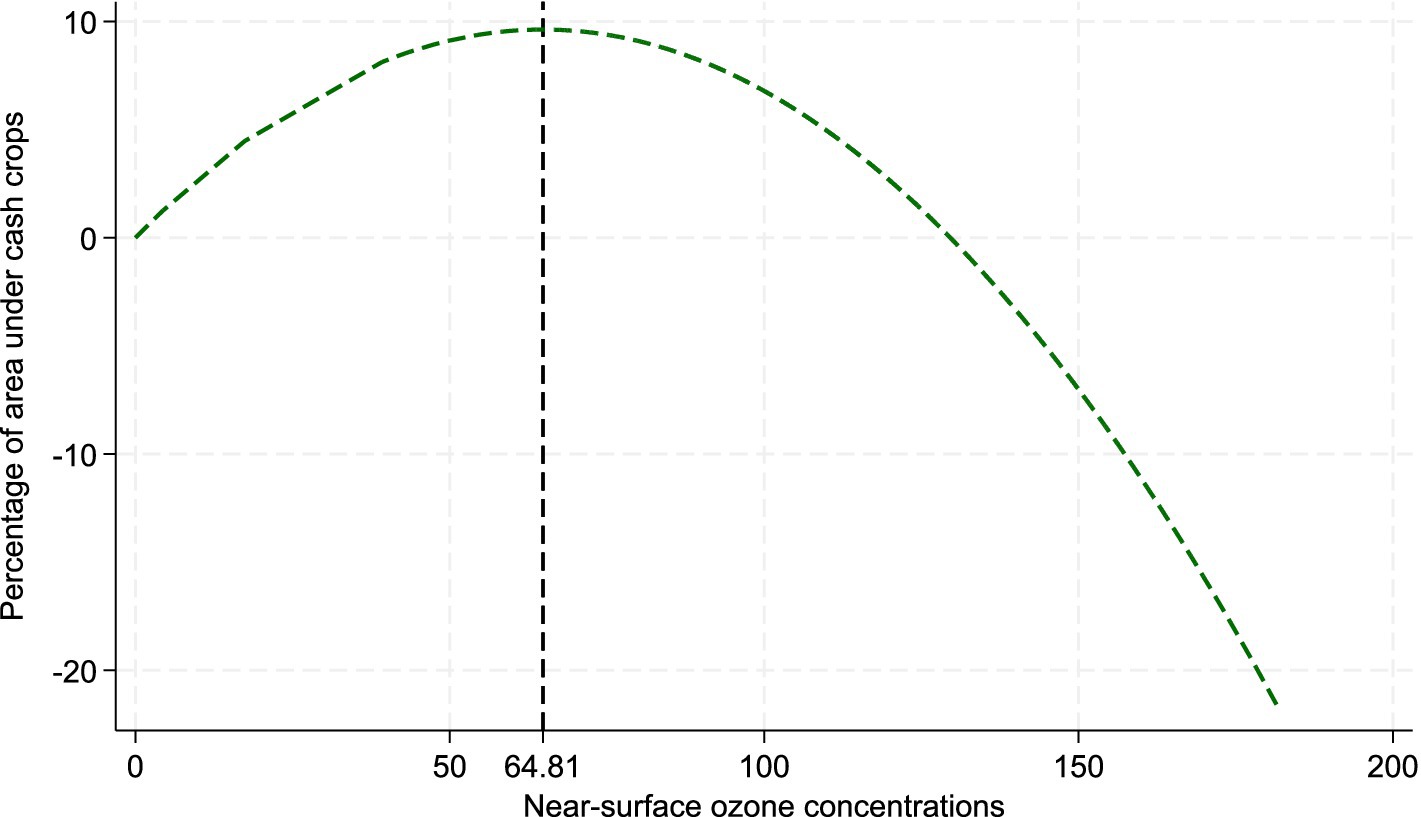
Figure 6. The inverted U-shaped curve of near-surface ozone pollution and the proportion of economic crop cultivation.
4 Discussion
The adjustment of crop planting structure holds significant importance for maintaining the balance of the grain market, enhancing the quality of agricultural products, and increasing farmers’ income. This study reveals a notable spatial correlation in the proportion of economic crop planting area among prefecture-level cities in China (global Moran’s I index: 0.586 in 2014 and 0.556 in 2019, p < 0.01). The local Moran’s I index clustering map indicates patterns of HH and LL agglomeration, suggesting that adjacent regions exhibit significant spatial clustering in terms of economic crop planting proportions. We identify an inverted U-shaped relationship between ground-level ozone pollution and cash crop cultivation share (β1 = 0.297, p < 0.01; β2 = −0.003, p < 0.01), alongside negative spatial spillover effects (both spatial lag and error terms are significantly negative). When surface-level ozone concentrations are below the inflection point, the proportion of land allocated to economic crops increases with rising ozone levels. Specifically, for every one-unit increase in ozone concentration, the share of economic crop cultivation area rises by approximately 0.297 units on average, though the magnitude of this increase tapers off as concentrations approach the inflection point. Conversely, when ozone concentrations exceed the inflection point, the proportion of economic crops decreases with further ozone elevation. The magnitude of reduction depends on the concentration level—for instance, at higher concentrations (e.g., 100 ppb), the share declines by approximately 0.303 units per unit ozone increase. The maximum proportion of economic crop cultivation area occurs precisely at the inflection point. Empirical data show only 29 observations (1.78% of cities) below the inflection point (O3< 64.81), where ozone increases may marginally boost cash crop share. Conversely, 1,597 observations (98.22% of cities) exceed the threshold (O3 > 64.81), where ozone accumulation substantially reduces cultivation share. Critically, elevated ozone levels in one region suppress cash crop cultivation in both local and adjacent areas. The potential theoretical explanation for the aforementioned phenomenon is as follows: low-concentration ozone (<64.81 ppb) may exert a promoting effect by inducing mild oxidative stress, which activates the plant’s antioxidant defense system and stimulates the synthesis of growth hormones such as salicylic acid. This process enhances root development and chlorophyll content, thereby improving photosynthetic efficiency. Additionally, due to its strong oxidizing properties, ozone can reduce the population of pathogens and pests, thereby indirectly protecting crops. This may lead to a decreased reliance on pesticides, enabling farmers to maintain or even expand their planting areas in response to short-term yield stability. In contrast, high-concentration ozone (>64.81 ppb) significantly impairs plant physiology by inducing stomatal closure, which reduces stomatal conductance by 23–41%, inhibits Rubisco enzyme activity by 15–28%, and triggers oxidative stress responses. These effects result in a decline in photosynthetic efficiency by over 30% and accelerate leaf senescence. Economic crops, such as vegetables and fruit trees, are particularly vulnerable due to their prolonged growth cycles and higher stomatal conductance. Their sensitivity to ozone damage is 1.5–3 times greater than that of food crops (Feng et al., 2022), with reported yield losses ranging from 32 to 47% (Zheng and Wang, 2004). The resulting decline in income per unit area has prompted farmers to adopt risk-averse strategies, such as reducing the cultivation of cash crops and shifting toward ozone-tolerant food crops, which has consequently led to a decrease in the proportion of land allocated to cash crop production. An important finding of this study is that as ozone concentration increases, the planting area of economic crops decreases, leading to a decline in their proportion of total sown area. This trend aligns with both theoretical predictions and empirical observations. Feng and Peng (2020) noted that ozone’s strong oxidizing properties accelerate leaf senescence, degrade chlorophyll, affect stomatal function, weaken photosynthesis, and ultimately reduce crop yield. When ozone peaks exceed 100 ppb, open-field vegetable areas decrease by 11.2–14.8% year-on-year, while corn yields drop by 6.4–11.8%. The physiological damage caused by ozone and its heightened impact on economic crops have been substantiated. For every 1 ppb increase in environmental ozone concentration, soybean planting area decreases by 1.59–1.97%, confirming that farmers adjust planting strategies by switching to ozone-tolerant crops (Liu, 2025).
Compared to previous studies, this paper contributes new insights. Existing literature primarily examines crop planting structure from the perspective of food crop yield and profitability under ozone pollution. Zheng and Wang (2004) emphasized that economic crops are more sensitive to ozone and suffer greater damage than food crops. Prior research has not systematically investigated the relationship between near-surface ozone and cash crop planting areas or adequately considered spatial correlation. By employing spatial econometric methods, this study confirms the significant negative impact of ozone pollution on cash crop cultivation and identifies negative spatial spillover effects between adjacent regions. Farmers adjust long-term expectations of cash crop returns based on differences in crop sensitivity during peak pollution periods. Pollution conditions in neighboring areas influence decision-making through farmer social networks, intensifying the convergence of planting structure adjustments. These findings offer valuable insights and policy implications for the reform and adjustment of crop planting structures.
While the current methodology offers considerable merits as an initial investigation—particularly through its parametric spatial weight matrix and cointegration framework that elucidate fundamental mechanisms—this study remains constrained by data limitations. Our analysis focuses exclusively on near-surface ozone pollution impacts on cash crop cultivation during the six-year period (2014–2019). To advance this research, future work should pursue the following directions when data availability permits: Implement Geographically and Temporally Weighted Regression (GTWR) coupled with high-resolution ozone grid data to capture dynamic crop responses during critical growth stages; Employ quantile regression to resolve structural adjustment differences across pollution exposure gradients; Conduct comprehensive analysis of ozone-crop planting structure relationships through integrated methodological approaches.
5 Conclusion and policy implications
This study employs panel data from Chinese prefecture-level cities (2014–2019), integrating production function theory with spatial econometric methods to systematically investigate the impact of ground-level ozone pollution on the planting structure of cash crops. Spatial dependence tests and panel cointegration analyses yield the following key conclusions and corresponding policy implications:
(1) Near-surface ozone pollution in China.
Ozone pollution in China exhibits significant regional disparities. High-concentration areas continue to expand and are predominantly concentrated in the central and southern regions. Over time, the ozone pollution problem has become increasingly prominent across the country.
(2) Cash crop cultivation areas.
Significant positive spatial autocorrelation and clustering exist in the cultivation areas of cash crops among cities. Specifically, changes in the cultivation area of a given city tend to align with those in its neighboring cities, demonstrating a pronounced pattern of spatial agglomeration imbalance.
(3) Near-surface ozone pollution and the planting area of cash crops.
A long-term cointegration relationship exists between ground-level ozone pollution and the share of cash crop cultivation area. The impact of ozone concentration exhibits an inverted U-shaped pattern, accompanied by negative spatial spillover effects. In the short term, the elevated near-surface ozone concentration is expected to result in an expansion of the area allocated to cash crop cultivation. However, in the long term, as ozone levels continue to rise, the proportion of land dedicated to cash crops within the total sown area is likely to gradually decline. Concurrently, elevated ozone levels in neighboring regions suppress local cash crop cultivation.
Based on these findings, this study proposes three policy implications:
First, establish a coordinated ozone pollution control framework. Given the dual drivers of climate change and anthropogenic activities, integrating precursors (VOCs and NOx) emission reduction into the overarching strategy for ecological civilization is imperative. Cross-regional joint prevention and control mechanisms should be implemented to overcome the “Not-In-My-Backyard” effect in environmental governance, thereby curbing rising ozone concentrations at their source.
Second, strengthen capacity for agricultural science and technology innovation. To address differential crop sensitivity to ozone, dedicated research funding should support breeding ozone-resistant crop varieties. Concurrently, adaptive farming systems—such as intercropping, relay cropping, and ecological regulation—should be promoted. Technological innovation can thus alleviate agricultural production constraints under environmental stress.
Third, refine agricultural support and protection policies. We recommend establishing a dynamic ozone pollution monitoring and crop impact assessment system to implement differentiated subsidy policies based on crop-specific damage levels. Farmers continuing cash crop cultivation should receive ecological compensation. Policy leverage can guide orderly adjustments to planting structures, preventing grain supply–demand imbalances caused by factor market distortions and safeguarding farmer livelihoods alongside agricultural sustainability.
Data availability statement
The original contributions presented in the study are included in the article/supplementary material, further inquiries can be directed to the corresponding author.
Author contributions
YL: Writing – original draft. MG: Conceptualization, Writing – review & editing.
Funding
The author(s) declare that no financial support was received for the research and/or publication of this article.
Conflict of interest
The authors declare that the research was conducted in the absence of any commercial or financial relationships that could be construed as a potential conflict of interest.
Generative AI statement
The authors declare that no Gen AI was used in the creation of this manuscript.
Any alternative text (alt text) provided alongside figures in this article has been generated by Frontiers with the support of artificial intelligence and reasonable efforts have been made to ensure accuracy, including review by the authors wherever possible. If you identify any issues, please contact us.
Publisher’s note
All claims expressed in this article are solely those of the authors and do not necessarily represent those of their affiliated organizations, or those of the publisher, the editors and the reviewers. Any product that may be evaluated in this article, or claim that may be made by its manufacturer, is not guaranteed or endorsed by the publisher.
Footnotes
References
Ainsworth, E. A. (2017). Understanding and improving global crop response to ozone pollution. Plant J. 90, 886–897. doi: 10.1111/tpj.13298
An, Y., Tan, X., Tan, J., Yu, H., Wang, Z., and Li, W. (2021). Crop planting structure evolution and influence factors of Hunan province. J. Econ. Geogr. 41, 156–166. doi: 10.15957/j.cnki.jjdl.2021.02.017
Avnery, S., Mauzerall, D. L., Liu, J., and Horowitz, L. W. (2011). Global crop yield reductions due to surface ozone exposure: 2. Year 2030 potential crop production losses and economic damage under two scenarios of O3 pollution. Atmos. Environ. 45, 2297–2309. doi: 10.1016/j.atmosenv.2011.01.002
Bisbis, M. B., Gruda, N., and Blanke, M. (2018). Potential impacts of climate change on vegetable production and product quality– a review. J. Clean. Prod. 170, 1602–1620. doi: 10.1016/j.jclepro.2017.09.224
Chen, L. (2003). The connotation, characteristics and countermeasures of rural industrial structure adjustment. Truth Seek. 8, 56–58. doi: 10.3969/j.issn.1673-2464.2003.03.019
Chen, Y., Li, H., Karimian, H., Li, M., Fan, Q., and Xu, Z. (2022). Spatio-temporal variation of ozone pollution risk and its influencing factors in China based on Geodetector and geospatial models. Chemosphere 302:134843. doi: 10.1016/j.chemosphere.2022.134843
Dawo, A. A. K., and Khalifa, S. M. W. (2025). Do green innovation, environmental governance, and renewable energy transition drive trade-adjusted resource footprints in top sub-Saharan African countries? Sustainability 17:4907. doi: 10.3390/su17114907
Feng, Z., Marco, A. D., Anav, A., Gualtieri, M., Sicard, P., Tian, H., et al. (2019). Economic losses due to ozone impacts on human health, forest productivity and crop yield across China. Environ. Int. 131:104966. doi: 10.1016/j.envint.2019.104966
Feng, Z., and Peng, J. (2020). Effects of ground-level ozone on grain yield and quality of cereal crops in China: status and perspectives. J. Agro-Environ. Sci. 39, 797–804. doi: 10.11654/jaes.2020-0048
Feng, Z., Xu, Y., Kobayashi, K., Dai, L., Zhang, T., Agathokleous, E., et al. (2022). Ozone pollution threatens the production of major staple crops in East Asia. Nat. Food 3, 47–56. doi: 10.1038/s43016-021-00422-6
Fu, L. (2010). An empirical research on industry structure and economic growth. Stat. Res. 8, 79–81. doi: 10.19343/j.cnki.11-1302/c.2010.08.011
Ge, S., and Zhang, H. (2021). Cultivated land use layout adjustment based on crop planting suitability: a case study of typical counties in Northeast China. Land 10:107. doi: 10.3390/land10020107
Gong, B., Zhang, S., Wang, S., and Yuan, L. (2020). 70 years of technological progress in China’s agricultural sector. Issues Agric. Econ. 6, 11–29. doi: 10.13246/j.cnki.iae.2020.06.002
Guha, S., Zhang, T., Kinney, P. L., and Henneman, L. R. F. (2024). Fine particulate matter and ozone variability with regional and local meteorology in Beijing, China. Atmos. Environ. 338:120793. doi: 10.1016/j.atmosenv.2024.120793
Guo, W., Huang, Y., Huang, Y., Li, Y., Song, X., Shen, J., et al. (2024). Develop agricultural planting structure prediction model based on machine learning: the aging of the population has prompted a shift in the planting structure toward food crops. Comput. Electron. Agric. 221:108941. doi: 10.1016/j.compag.2024.108941
Huang, L., and Wang, Y. (2021). Comparative benefits, production options and crop structure adjustment. Jiangsu Agric. Sci. 49, 231–235. doi: 10.15889/j.issn.1002-1302.2021.11.040
Jiang, Y., Wang, X., Huo, M., Chen, F., and He, X. (2023). Changes of cropping structure lead diversity decline in China during 1985–2015. J. Environ. Manag. 346:119051. doi: 10.1016/j.jenvman.2023.119051
Lind, J. T., and Mehlum, H. (2010). With or without U? The appropriate test for a U-shaped relationship. Oxf. Bull. Econ. Stat. 72, 109–118. doi: 10.1111/j.1468-0084.2009.00569.x
Liu, Z. (2025). Ambient ozone and planting decision: evidence from US crop acreage. Agric. Econ. doi: 10.1111/agec.70029
Liu, Z., and Lu, Q. (2023). Ozone stress and crop harvesting failure: evidence from US food production. Food Policy 121:102540. doi: 10.1016/j.foodpol.2023.102540
Peng, J., Shang, B., Xu, Y., Feng, Z., Pleijel, H., and Calatayud, V. (2019). Ozone exposure- and flux-yield response relationships for maize. Environ. Pollut. 252, 1–7. doi: 10.1016/j.envpol.2019.05.088
Renard, D., and Tilman, D. (2019). National food production stabilized by crop diversity. Nature 571, 257–260. doi: 10.1038/s41586-019-1316-y
Schultz, T. W. (1979). The economics of being poor. Nobel Prize Econ. Docum. 36, 32–37. doi: 10.2307/20635094
Sun, F., Dai, Y., and Yu, X. (2017). Air pollution, food production and food security: a review from the perspective of food system. J. Integr. Agric. 16, 2945–2962. doi: 10.1016/S2095-3119(17)61814-8
Wang, Y., Chen, B., Ye, Q., Zhao, L., and Song, Z. (2025). Estimation and impact factor analysis of 24-h near-surface ozone concentration in China using FY-4A/B collaboration and machine learning. Atmos. Pollut. Res. 16:102538. doi: 10.1016/j.apr.2025.102538
Wang, S., Fu, G., Ma, X., Xu, L., and Yang, F. (2021). Exploring the optimal crop planting structure to balance water saving, food security and incomes under the spatiotemporal heterogeneity of the agricultural climate. J. Environ. Manag. 295:113130. doi: 10.1016/j.jenvman.2021.113130
Wang, Y., Wang, Y., Feng, Z., Yuan, X., and Zhao, Y. (2023). The impacts of ambient ozone pollution on China's wheat yield and forest production from 2010 to 2021. Environ. Pollut. 330:121726. doi: 10.1016/j.envpol.2023.121726
Wang, L., Yang, X., Zhou, H., Yang, Y., Dong, J., Dong, S., et al. (2025). Reanalysis-based retrieval of near-surface ozone concentrations and its implications for ozone pollution events across China. Atmos. Pollut. Res. 16:102643. doi: 10.1016/j.apr.2025.102643
Yang, S., Wang, H., Tong, J., Bai, Y., Alatalo, J. M., Liu, G., et al. (2022). Impacts of environment and human activity on grid-scale land cropping suitability and optimization of planting structure, measured based on the MaxEnt model. Sci. Total Environ. 836:155356. doi: 10.1016/j.scitotenv.2022.155356
Yang, Y., Yi, F., and Hu, H. (2016). The new challenge of agricultural environment to the yield of food production: a case study of winter wheat planting under near-ground ozone pollution. Chin. Rur. Econ. 9, 72–82. doi: 10.20077/j.cnki.11-1262/f.2016.09.006
Zhang, J., and Li, X. (2022). Research on the influence mechanism of land tenure security on farmers’ cultivated land non-grain behavior. Agriculture 12:1645. doi: 10.3390/agriculture12101645
Zhang, X., Wu, W., and Liu, H. (2025). Spatial heterogeneous associations and spillover effects of ozone pollution in China. Environ. Res. 283:122201. doi: 10.1016/j.envres.2025.122201
Keywords: near-surface ozone, cropping structure, cash crops, spatial panel covatiance, China
Citation: Liu Y and Guo M (2025) Near-surface ozone pollution and planting decision: evidence from China crop structure. Front. Sustain. Food Syst. 9:1522255. doi: 10.3389/fsufs.2025.1522255
Edited by:
Mohamed Ait-El-Mokhtar, University of Hassan II Casablanca, MoroccoReviewed by:
Neena M. Gopi, SRM Institute of Science and Technology, IndiaXiaotang Zhang, South China University of Technology, China
Youliang Chen, Jiangxi University of Science and Technology, China
Copyright © 2025 Liu and Guo. This is an open-access article distributed under the terms of the Creative Commons Attribution License (CC BY). The use, distribution or reproduction in other forums is permitted, provided the original author(s) and the copyright owner(s) are credited and that the original publication in this journal is cited, in accordance with accepted academic practice. No use, distribution or reproduction is permitted which does not comply with these terms.
*Correspondence: Mingshun Guo, c3V0Z21zQDE2My5jb20=