 Abel Endawkie1*
 Shimels Derso Kebede2
 Eyob Tilahun Abeje1
 Ermias Bekele Enyew2
 Chala Daba3
 Lakew Asmare1
 Fekade Demeke Bayou1
 Mastewal Arefaynie4
 Asnakew Molla Mekonen5
 Abiyu Abadi Tareke6
 Awoke Keleb3
 Kaleab Mesfin Abera5
 Natnael Kebede7
 Endalkachew Mesfin Gebeyehu5
 Aznamariam Ayres1
 Yawkal Tsega5
- 1Department of Epidemiology and Biostatistics, School of Public Health, College of Medicine and Health Sciences, Wollo University, Dessie, Ethiopia
- 2Department of Health Informatics, School of Public Health, College of Medicine and Health Sciences, Wollo University, Dessie, Ethiopia
- 3Department of Environmental Health College of Medicine and Health Sciences, Wollo University, Dessie, Ethiopia
- 4Department of Reproductive and Family Health, School of Public Health, College of Medicine and Health Sciences, Wollo University, Dessie, Ethiopia
- 5Department of Health System and Management, School of Public Health, College of Medicine and Health Sciences, Wollo University, Dessie, Ethiopia
- 6West Gondar Zonal Health Department, Amref Health in Africa, Gondar, Ethiopia
- 7Department of Health Promotion, School of Public Health, College of Medicine and Health Sciences, Wollo University, Dessie, Ethiopia
Background: Ethiopia faces inadequate minimum dietary diversity (MDD), which significantly contributes to rising death rates and the spread of diseases among children aged 6–23 months. The evidence of socioeconomic and regional inequalities is central to the Sustainable Development Goals (SDGs), and it is especially crucial for guiding the development of local, regional, and national policies and initiatives that address these inequalities in MDD consumption. This will help achieve the SDG target of ending all forms of malnutrition. However, there is limited evidence on socioeconomic and regional inequalities in MDD consumption among children in Ethiopia. Therefore, this study aimed to investigate the socioeconomic and regional inequalities in MDD among children aged 6–23 months in Ethiopia.
Methods: This study utilized nationally representative weighted data comprising 3,145 samples from the 2019 Ethiopia Demographic and Health Survey (EDHS). The concentration index (CIX)was employed to estimate the socioeconomic and regional inequalities in MDD consumption.
Results: The prevalence of adequate MDD in Ethiopia was 7.11%. The concentration index (CIX) values for MDD by wealth status and region were 0.3 and 0.084, respectively, with a p-value of <0.05 for both. The concentration curve was below the equality line, and adequate MDD was concentrated among the wealthy, developed, and urban regions of Ethiopia. Maternal education (0.88%), the sex of the household head (0.3%), and region (3.1%) contributed to the observed inequalities in MDD across both the poor and wealthy regions. Wealth status (11.06%), maternal age (6.7%), maternal educational status (1.87%), and residence (0.02%) contributed to the observed inequalities in MDD consumption across both the less developed and developed regions of Ethiopia.
Conclusion: This study revealed that the wealth and regional inequalities observed in MDD consumption in Ethiopia were influenced by factors such as parental marital status, women’s educational status, place of residence, and short preceding birth intervals. Adequate MDD consumption among the children in Ethiopia was concentrated in the wealthy and developed regions. Therefore, efforts should focus on reducing poverty, improving maternal education, and implementing targeted interventions. In particular, nutrition and public health organizations should support less developed regions to achieve greater dietary diversity for infants and young children.
Background
Adequate minimum dietary diversity (MDD) is defined according to the criteria set by the World Health Organization (WHO) and the United Nations Children’s Fund (UNICEF) (World Health Organization, 2021).
The consumption of MDD has a direct impact on the nutrient sufficiency of a diet (Eshete et al., 2018). After the first 6 months, children should be given adequate and acceptable supplemental foods while continuing to be breastfed for at least 2 years (World Health Organization, 2023).
One of the main causes of childhood malnutrition is inadequate feeding habits, which pose one of the biggest obstacles to long-term socioeconomic development and the eradication of poverty worldwide (Eshete et al., 2018; World Health Organization, 2017).
In low- and middle-income countries, including Ethiopia, where the issue is most prevalent, inadequate feeding habits significantly contribute to rising death rates and the spread of diseases (World Health Organization, 2009; Black et al., 2008; Onyango et al., 2014).
In particular, the prevalence of inadequate MDD is significantly high in Sub-Saharan Africa (SSA) (Arimond and Ruel, 2004). Currently, under-five mortality is largely attributed to inadequate nutrition, with SSA and South Asia bearing the greatest burden of this issue (Cheo and Tapiwa, 2021).
Various studies have revealed that women’s education (Kang et al., 2019; Eshete et al., 2018; Belete et al., 2022), wealth index (Kang et al., 2019; Eshete et al., 2018; Belete et al., 2022), antenatal care (Dafursa and Gebremedhin, 2019), the husband’s educational status (Kang et al., 2019; Eshete et al., 2018; Belete et al., 2022), child age (Eshete et al., 2018; Paramashanti et al., 2021), mass media exposure (Kang et al., 2019; Eshete et al., 2018; Belete et al., 2022), maternal age (Paramashanti et al., 2021; Khanam and Sarker, 2023), occupational status (Belay et al., 2022; Ba et al., 2022), and residence (Ba et al., 2022) are associated with MDD consumption among children aged 6–23 months.
The Sustainable Development Goals (SDGs) 2 aims to eliminate hunger, ensure food security, and enhance nutrition by 2030 (Gil et al., 2019). However, in Ethiopia, the trend is moving in the opposite direction, with statistics indicating a decline in adequate MDD consumption between 2016 and 2019 (Teshome and Tadele, 2022; Endawkie et al., 2024).
Understanding the socioeconomic and geographic disparities in MDD consumption is crucial for effectively achieving SDG target 2.2. However, current epidemiological data remain insufficient to determine whether the decline in MDD consumption is linked to these disparities. In addition, inconsistencies in regional data contribute to the lack of evidence. To address this research gap, it is essential to evaluate disparities in MDD consumption among children aged 6 to 23 months in Ethiopia, taking into account socioeconomic and geographic factors.
Socioeconomic and geographic decomposition analysis offers valuable insights for national policymakers, particularly important for guiding the development of local, regional, and national policies and initiatives aimed at addressing inequalities in MDD consumption in Ethiopia. In addition, this analysis is crucial for identifying disparities within the Ethiopian context.
Therefore, this study aimed to assess socioeconomic and geographic inequalities in MDD consumption among children aged 6–23 months in Ethiopia, using data from the Ethiopia Mini Demographic and Health Survey (EMDHS) 2019.
Methods
Study setting and design
The research employed a cross-sectional study design utilizing secondary data from the 2019 Ethiopia Demographic and Health Survey (EDHS). The study was conducted in Ethiopia, a country bordered by Sudan to the west, Somalia and Djibouti to the east, Eritrea to the north, and Kenya to the south. Ethiopia covers an area of 1,112,000 square kilometers and is divided into 11 regions, in addition to two municipal governments.
Study population and data source
The study focused on children aged 6–23 months in Ethiopia. The data used in this research were sourced from the 2019 EMDHS, specifically extracted from the birth record (BR) dataset available in the DHS Program. Access to this data was granted through personal accounts after justifying the request (Koroso et al., 2021). We extracted dependent and independent variables from the EDHS 2019 data, which includes the full birth history of all children whose mothers were interviewed. The data set contains health and nutrition data for children born in the last 5 years (Rutstein and Rojas, n.d.; Daniel et al., 2012).
Sample size and sampling method
The study comprised representative weighted samples of 3,154 children (aged 6–23 months) from the 2019 round of the EDHS. The DHS used a two-stage stratified cluster sampling technique. In the first stage, a sample of enumeration areas (EAs) was selected independently from each stratum using proportional allocation, stratified by residence (urban and rural). In the second stage, households were chosen from the selected EAs using a systematic sampling technique (Daniel et al., 2012).
Variable measurement
Dependent variables
A child was considered to have adequate MDD if they consumed at least five of the eight food groups in the 24 h preceding the interview. The food groups included the following: (1) breast milk; (2) grains, roots, and tubers; (3) legumes and nuts; (4) dairy products; (5) flesh foods (such as meat, fish, poultry, and liver/organ meats); (6) eggs; (7) vitamin-A rich fruits and vegetables; and (8) other fruits and vegetable (World Health Organization, 2021). Adequate MDD was labeled as “1,” while inadequate MDD was labeled as “0.”
Socioeconomic and geographic variables
The household wealth index, maternal education, and regions of Ethiopia were used for the inequality analysis of the concentration index (CIX).
Household wealth index
The household wealth index is a composite measure that reflects a household’s cumulative living standards, calculated using principal components analysis (PCA) based on various asset indicators. These indicators include ownership of items such as televisions, refrigerators, mobile phones, bicycles, cars, and carts, as well as access to electricity and landline phones (Indicators, 2019). In the DHS data, household wealth status was categorized into five quintiles: poorest, poorer, middle, richer, and richest.
Maternal education was divided into four categories: no education, primary education, secondary education, and higher education.
The regions were also categorized into three groups based on their geopolitical features: less developed or small peripherals (Afar, Gamble, Benishangul, and Somali), developed or large central (Tigre, Amara, Southern Nations, Nationalities, and Peoples Region, and Oromo), and urban or metropolitans (city administrations, including Addis Ababa, Harreri and Diredewa). This classification is consistent with a prior Ethiopian study (Ahmed et al., 2019).
Socio-demographic characteristics such as maternal age, child age, sex of the household head, sex of the child, household size, residence, preceding birth interval, number of under-five children in the household, and type of birth were included as independent variables.
Data processing and analysis
Data cleaning, recoding, variable generation, and labeling were performed using STATA version 17.0. We applied sample weights to account for unequal probabilities of selection across geographically defined strata and non-responses. Means and standard deviations were calculated for normally distributed continuous variables, following the skewness and kurtosis tests. In addition, frequencies and percentages were computed for categorical variables to describe the characteristics of the study population. Throughout the analysis, the survey design was accounted for and appropriately declared.
Decomposition analysis
Before conducting the decomposition analysis, a bivariate logistic regression was performed, and variables with p-values less than 0.25 were selected for the subsequent decomposition analysis.
Inequalities in MDD across the wealth index and geographic region categories were estimated using the concentration curve (CC) and concentration index (CIX) in their relative form (O’Donnell et al., 2016).
Concentration curves
The concentration curves (CCs) were plotted, starting with the most disadvantaged groups and ending with the most advantaged groups, to illustrate the cumulative proportion of MDD (y-axis) against the cumulative proportion of the children, sorted by household wealth and geographic region (x-axis). A 45-degree slope, extending from the northwest to the northeast, represents perfect equality. If the CC overlaps with the line of equality, it indicates that MDD was equally distributed among the children aged 6–23 months across the household wealth and geographic regions. However, if the CC deviates above or below the line of equality, it suggests the presence of inequality. A curve below the equality line indicates that MDD was more concentrated among the advantaged groups. The degree of inequality increases as the curve moves further away from the line of equality (O’Donnell et al., 2016).
Decomposition of the concentration index
The purpose of the decomposition was to determine the contribution of different independent variables to inequalities. A chi-squared test (x2) was used to examine statistically significant inequalities in MDD by wealth index and region. Before the decomposition analysis, bi-variable logistic regression was fitted, and variables with p-values less than 0.25 were selected for the decomposition analysis. Prior to conducting the decomposition analysis, multicollinearity was checked among the explanatory variables using the variance inflation factor (VIF), and no multicollinearity was detected since the mean–variance inflation factor (VIF) was 2.28.
To assess inequalities in MDD consumption, we calculated the concentration index, which is a widely used measure of socioeconomic inequality (O’Donnell et al., 2016). This index was calculated based on the following formula (Equation 1):
where CI is the concentration index, r is a person’s fractional rank in the distribution of socioeconomic position (Wagstaff et al., 2007), μ is the mean of the health variable, h is the health variable measured for inequality, and cov indicates the covariance. The value of the concentration index ranges from −1 to +1. A negative value indicates a disproportionate concentration of MDD consumption among the disadvantaged groups, whereas a positive value indicates a disproportionate concentration of MDD among the advantaged groups.
As our outcome was a binary variable, the bounds of the concentration index did not extend to −1 and +1 but could equal to μ. Therefore, we normalized the concentration index by dividing its value by its bound, as proposed by Wagstaff (2005, 2011) (Equation 2).
We broke down the concentration index to calculate the explanatory variables’ relative contributions to wealth disparities in MDD, aiming to identify the variables causing the observed disparities in dietary diversity. For a set of determinants (Xk) and MDD (y) in a linear additive relationship, such as (Equation 3):
Here, 𝛽𝑘 is the coefficient of 𝑥𝑘, and 𝜀 is the error term. The concentration index of y denoted (C) could be written as follows (Equation 4):
In this context, μ is the mean of y, −xₖ is the mean of xₖ, and Cₖ is the concentration index for xₖ, defined similarly to C. In addition, βₖ −xₖ = μ indicates the elasticity of MDD with respect to the explanatory variables, while G C_∊/μ represents the generalized concentration index for the error term ∊ (O’Donnell et al., 2016).
A negative contribution revealed that an independent variable contributed to a pro-poor distribution of MDD. In contrast, a positive contribution indicated that an independent variable contributed to a pro-rich distribution (Equation 5).
We employed a generalized linear model (GLM) with a binomial family and a logit link to decompose inequalities in MDD because the outcome variable was binary.
Ethical approval
Ethical approval was not required for our study as we used the demographic and health survey data, which de-identifies all data before making it public, and the DHS data sets are openly accessible. We obtained an authorization letter from the Central Statistical Agency to download the DHS data set at https://dhsprogram.com/. The dataset and all methods and data of demographic and health survey were performed based on DHS research guidelines.
Results
Socio-demographic characteristics of the respondents from the 2019 EDHS
From the 3,145 weighted samples of mothers with children aged 6–23 months, the mean age and standard deviation values of the mothers and the children were 33 ± 5 years and 11.09 ± 4 months, respectively. Regarding the consumption of MDD among the children, 8.5% of the children with mothers aged 35–49 years, 35.2% of the children with married mothers, 26.2% of the children with mothers who had a higher education level, and 15.1% of the children with mothers having a wealth status consumed adequate MDD (Table 1).
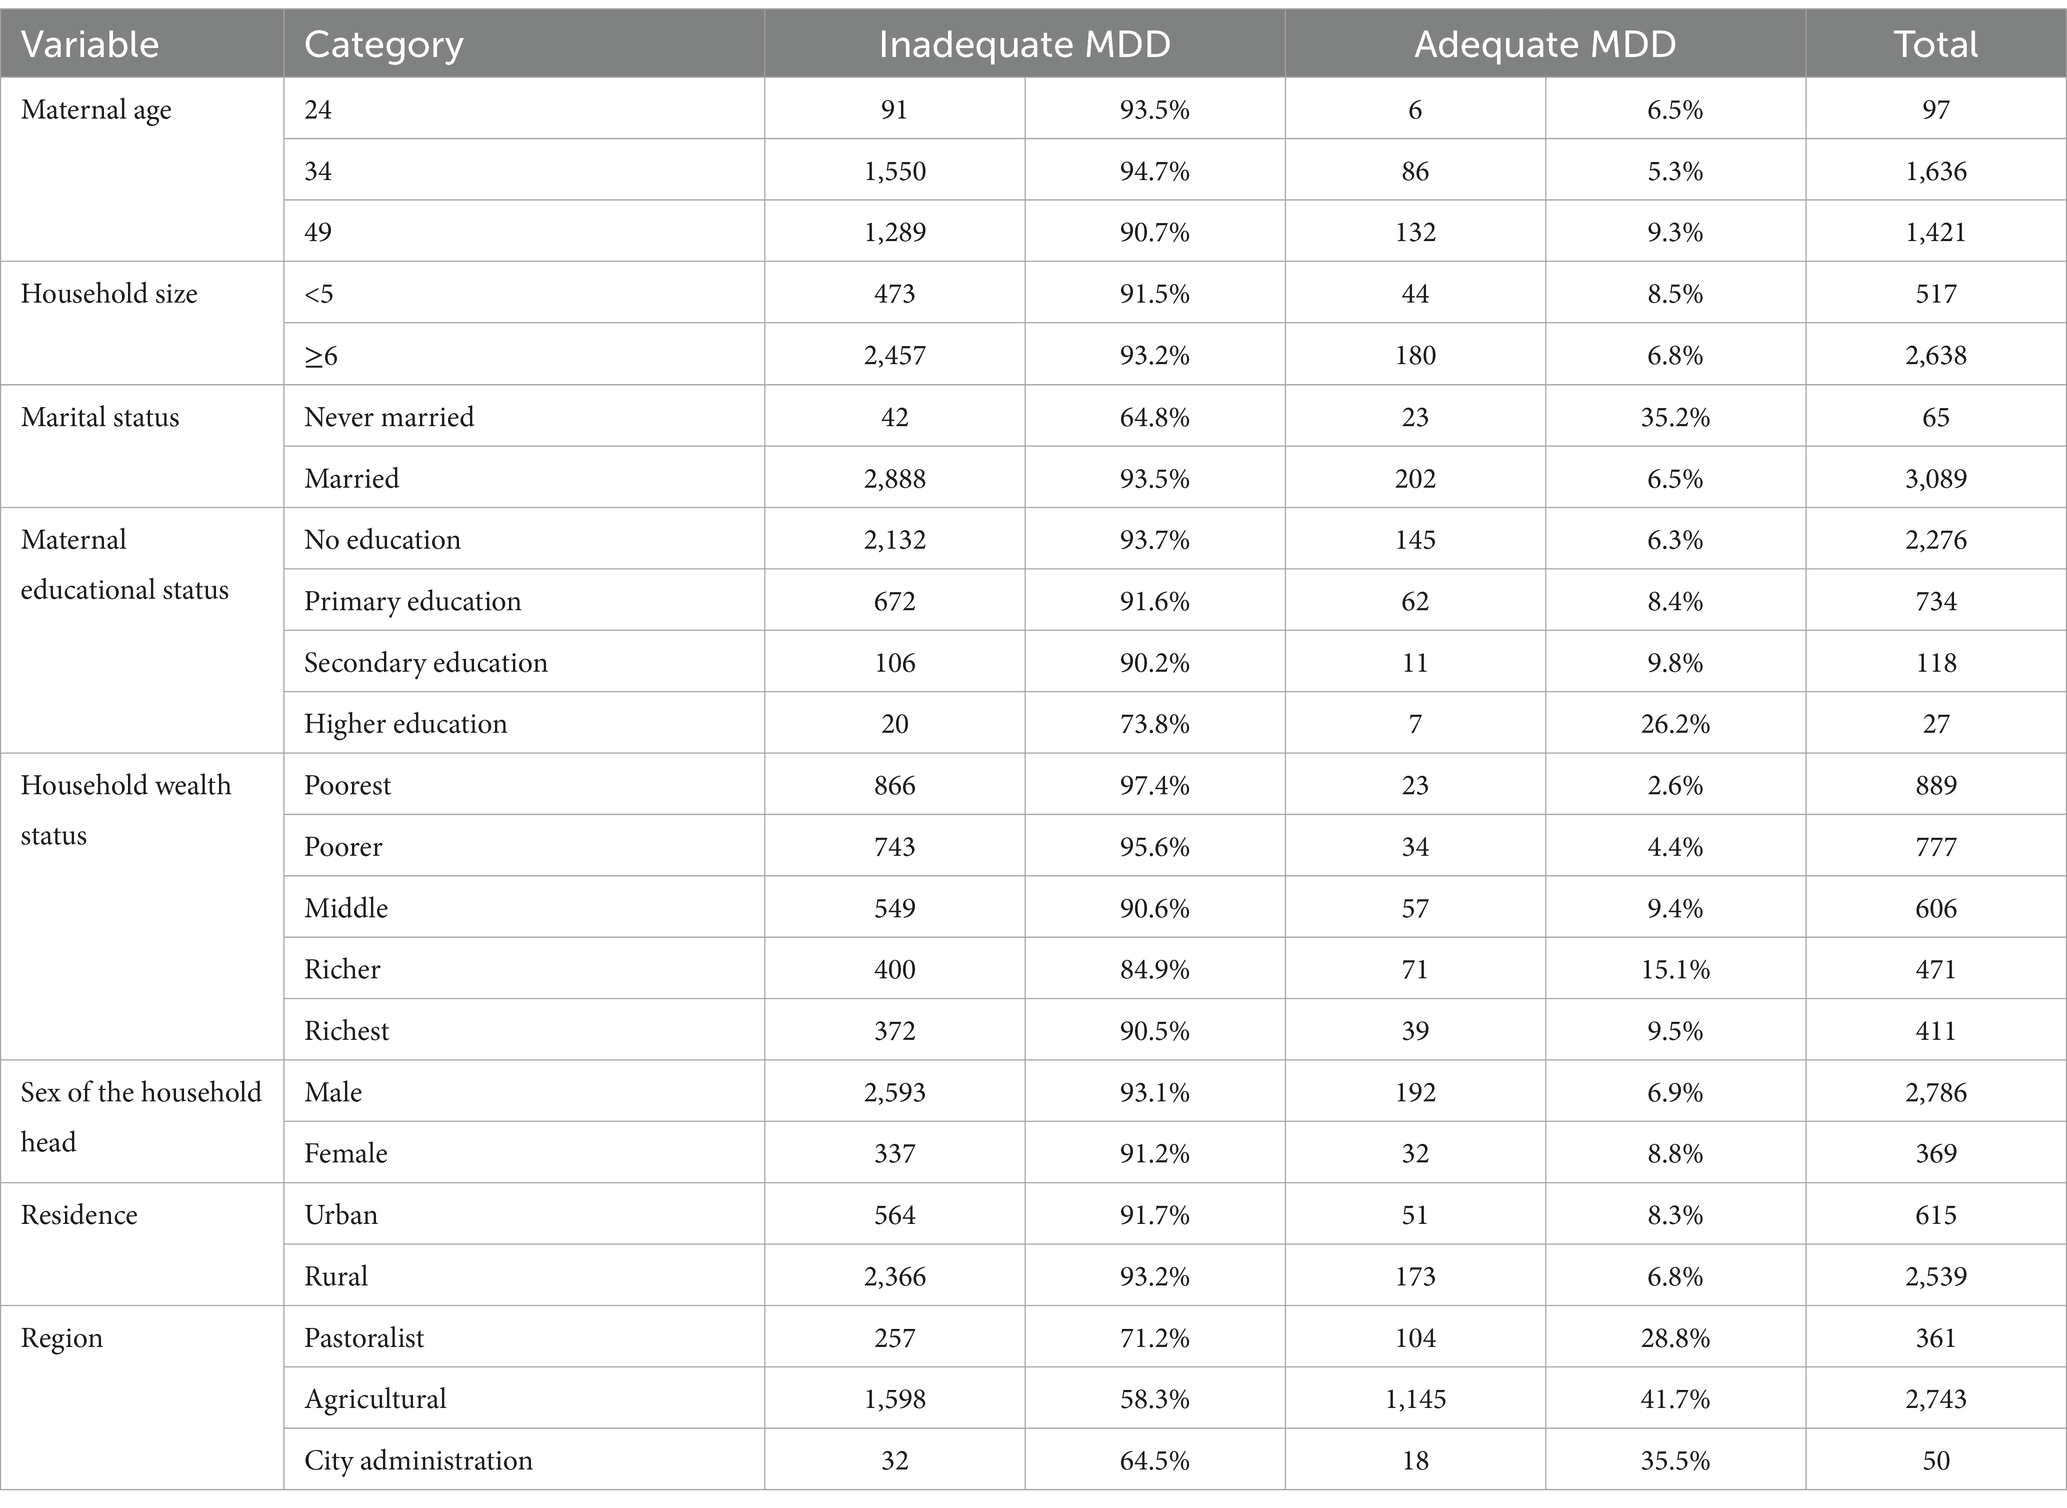
Table 1. The socio-demographic characteristics of the respondents in Ethiopia, 2019 EDHS.
The characteristics of the children according to the respondents in the 2019 EDHS
Approximately 6.2% of the male children, 7.2% of the children aged 6–12 months, and 35% of the children with birth intervals greater than 24 months in Ethiopia consumed adequate MDD (Table 2).
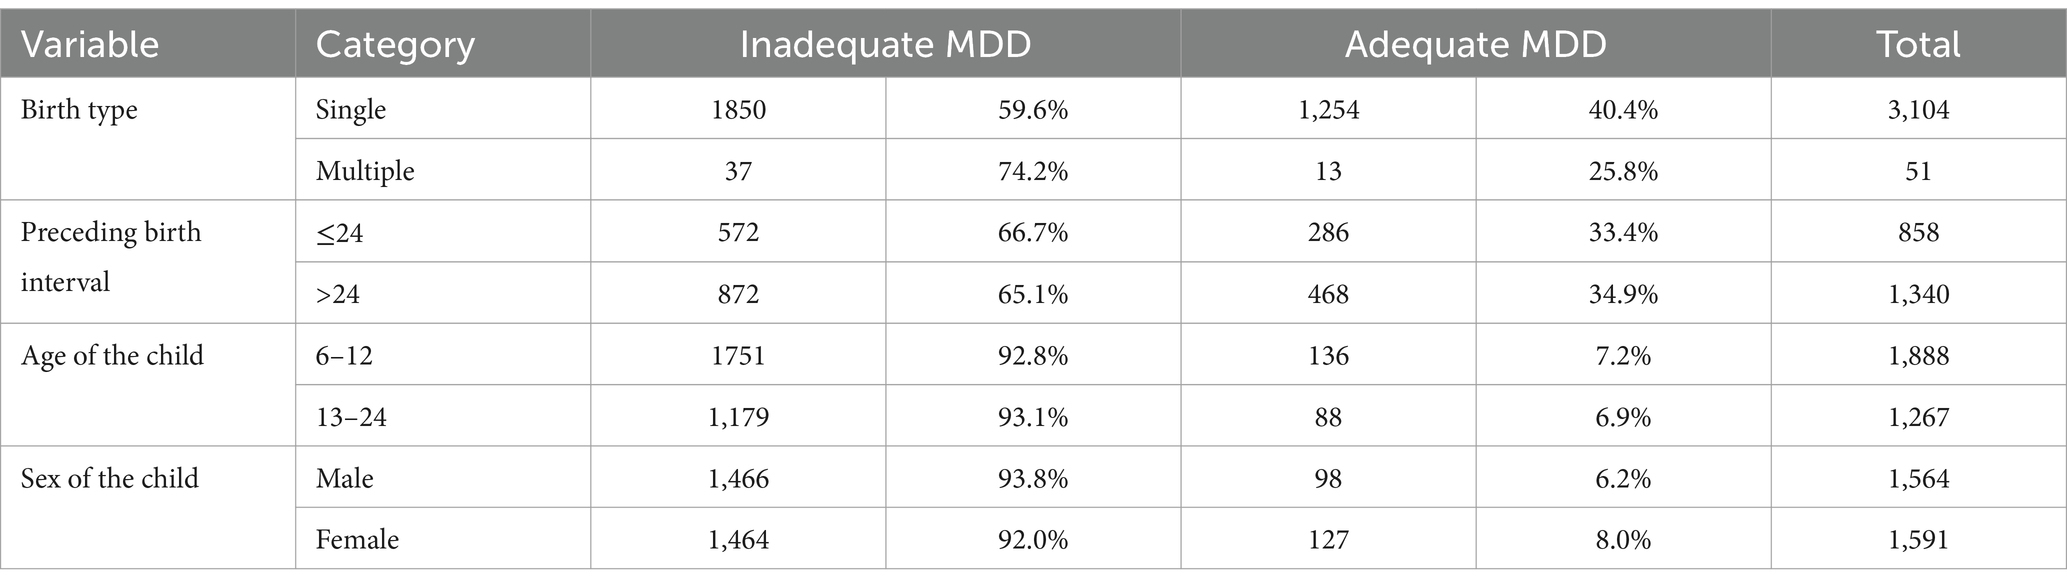
Table 2. MD consumption by the characteristics of the children aged 6–23 months in Ethiopia, 2019 EDHS (weighted).
Concentration index for MDD according to the wealth index and the geographic regions of Ethiopia
The Concentration index (CIX) for MDD by wealth status was 0.3, with a p-value of less than 0.05, indicating that the consumption was concentrated among the children in the higher wealth status group (pro-rich).
The CIX for MDD by maternal educational status was 0.085, and the p-value of 0.087 suggested that there was no statistically significant inequality.
The CIX for MDD by the geographic regions of Ethiopia was 0.084, and the p-value (<0.05) indicated that MDD consumption among the children was significantly concentrated among the respondents from the developed and urban areas, as the positive CIX suggested (Table 3).
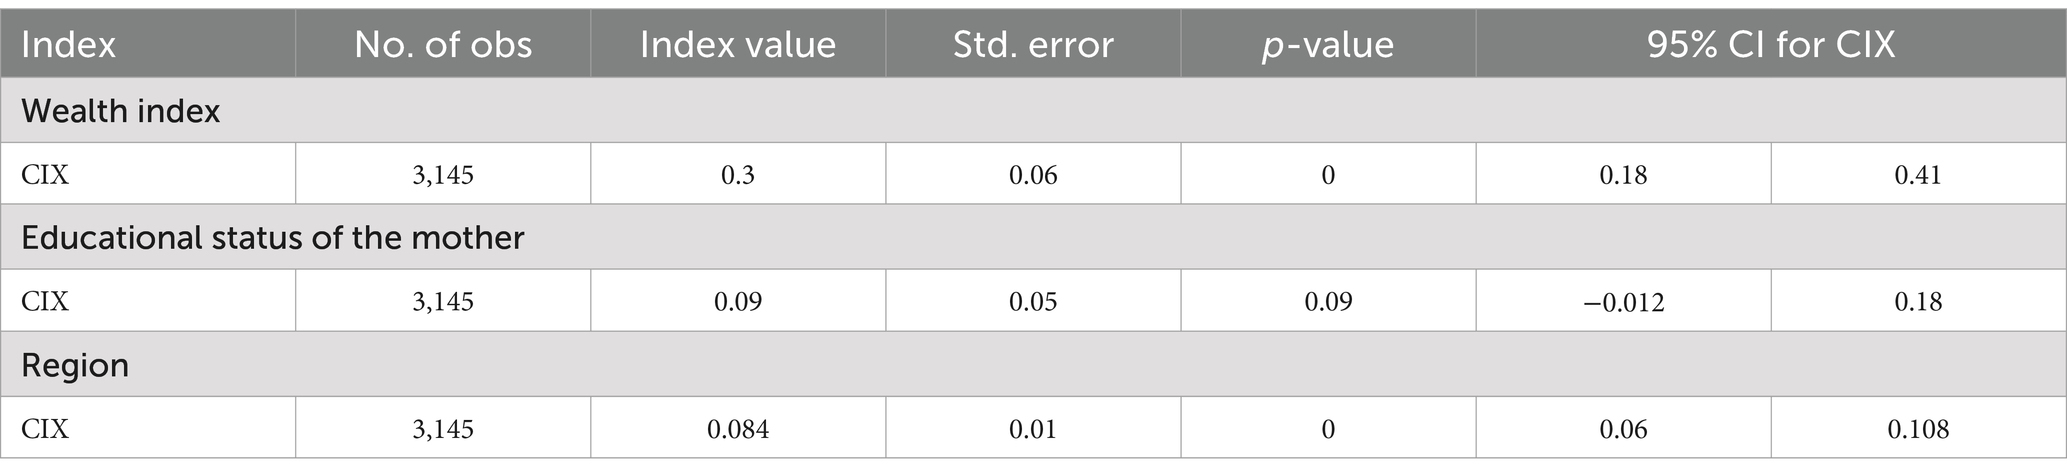
Table 3. Concentration index for MDD consumption among the children according to the socioeconomic characteristics and geographic regions of Ethiopia.
Prevalence and concentration curves of MDD according to the wealth index and regions of Ethiopia
The prevalence of adequate MDD in Ethiopia was 7.11%. The concentration curve of MDD against wealth status showed that the curve was below the 45° line, indicating that MDD consumption among the children was more concentrated among the mothers with a higher wealth status. In the graph, the X-axis represents the percentage of the children with varying levels of dietary diversity by wealth status, the Y-axis displays the cumulative proportion of the children achieving specific dietary diversity levels, and the L (p) line indicates the cumulative proportion of the children meeting the MDD criteria.
It shows how MDD consumption was distributed among the children based on their family’s wealth status. The shaded region around the L (p) line illustrates the 95% confidence interval (CI) of the estimates, indicating the range within which the true values are likely to fall.
The curve was generally found to rise with increasing wealth status, indicating that the children from the wealthier families tended to have higher MDD consumption (Figure 1).
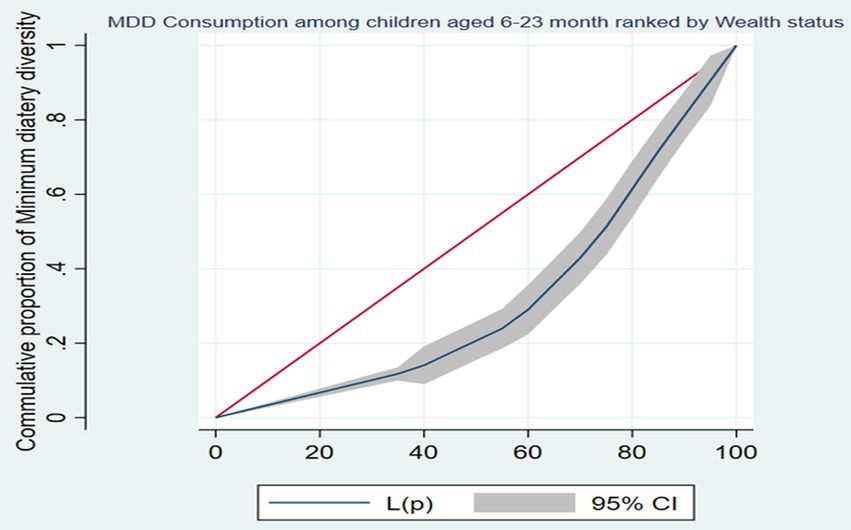
Figure 1. The concentration curve of minimum dietary diversity consumption among children aged between 6 and 23 months ranked by wealth status in Ethiopia, 2019.
The concentration curve of MDD against the regions of Ethiopia was below the 45° line, indicating that MDD consumption among the children was more concentrated among the mothers from the developed and urban regions of Ethiopia. The curve’s shape suggests that there were regional differences in MDD consumption, with the developed regions showing a higher cumulative proportion of the children achieving a diverse diet compared to less developed regions (Figure 2).
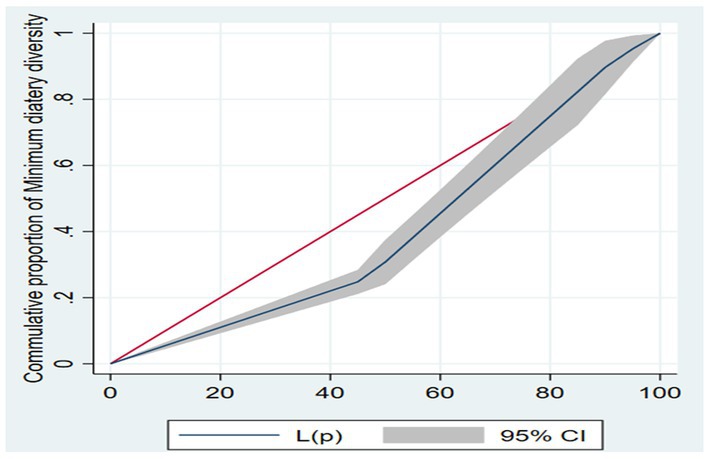
Figure 2. The concentration curve of minimum dietary diversity consumption among children aged between 6 and 23 months ranked by regions of Ethiopia, 2019.
Decomposition analysis of the CIX for MDD consumption according to the wealth index and regions in Ethiopia
The study, as presented in Tables 4, 5, showed the decomposition of the concentration index (CIX) for MDD consumption according to the wealth status and regions of Ethiopia, respectively. A negative percentage contribution indicated that the factors helped reduce inequality, while a positive percentage contribution indicated that the variables helped increase the observed inequalities.
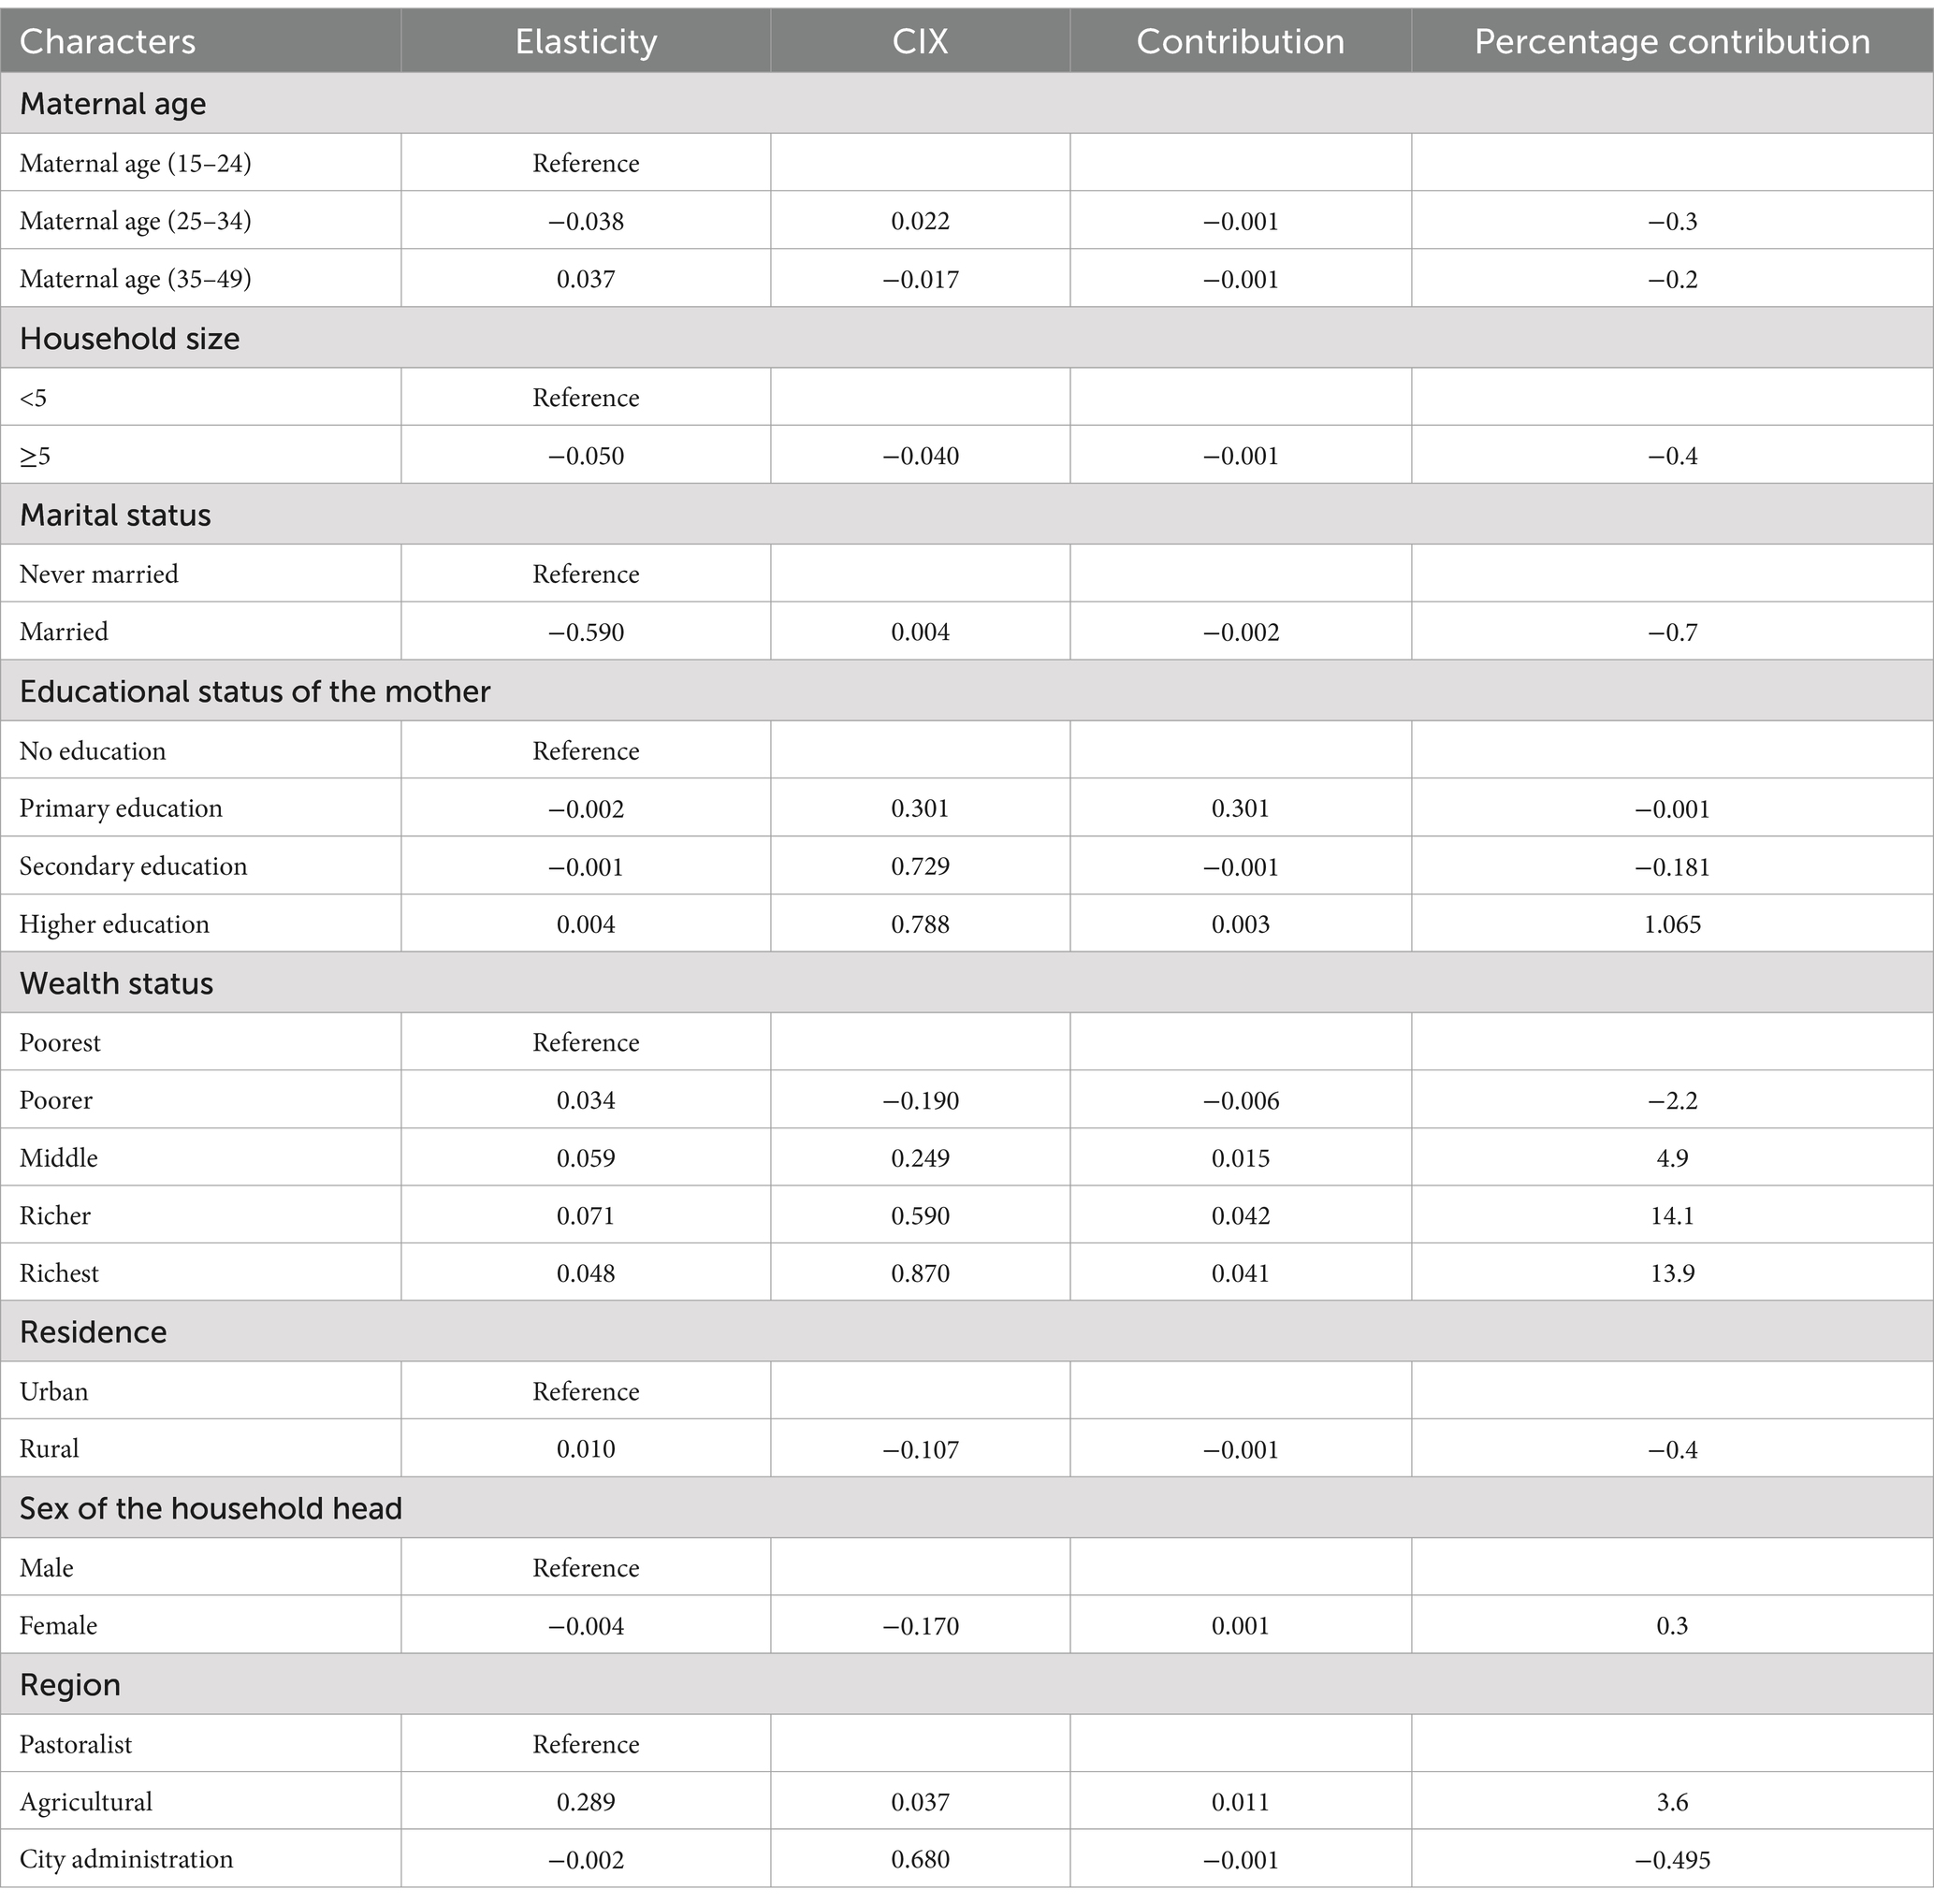
Table 4. Decomposition of the concentration index for MDD with wealth index in Ethiopia.
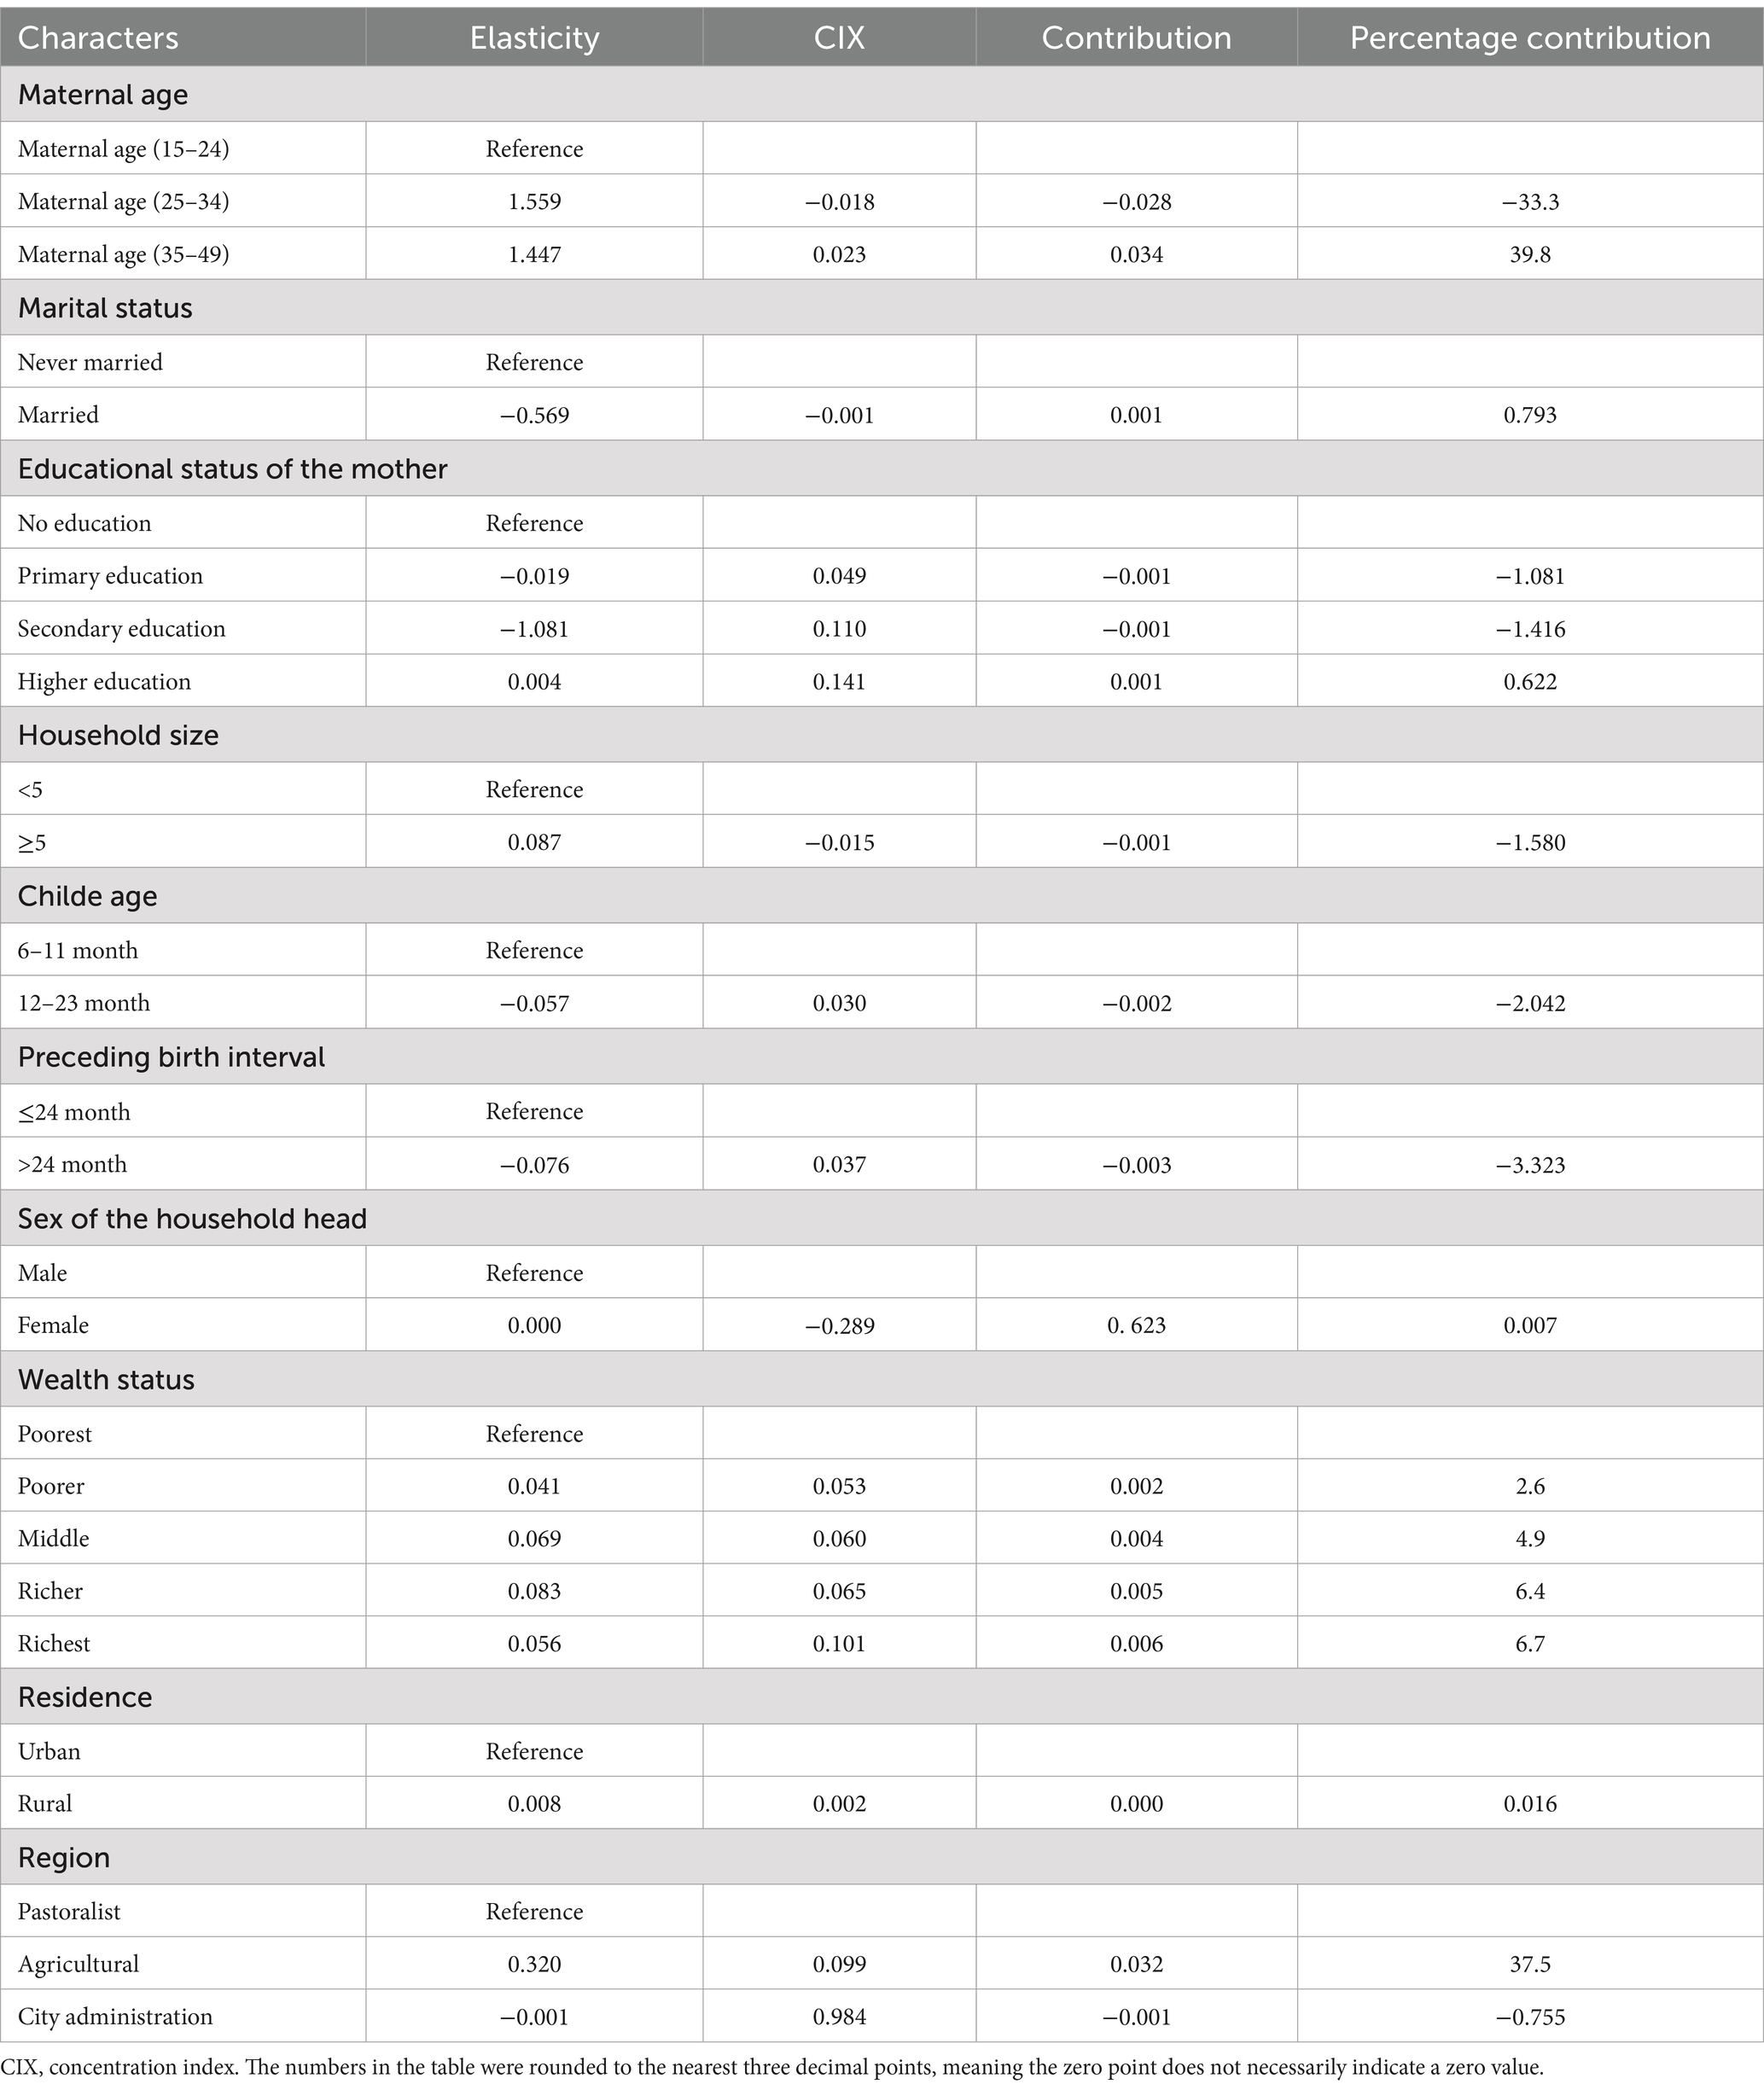
Table 5. Decomposition of the concentration index for MDD according to the regions in Ethiopia.
Regarding maternal educational status (0.88%), elementary education and secondary education were found to have negative contributions, while higher education had a significant positive contribution to MDD consumption. The sex of the household head (0.3%) and region (3.1%) contributed to increasing the observed inequalities in MDD consumption between the wealthy and poor regions (Table 4). Wealth status (11.06%), maternal age (6.7%), maternal educational status (1.87%), and place of residence (0.016%) contributed to increasing the observed inequalities in MDD consumption in the less developed and developed regions of Ethiopia (Table 5).
Discussion
The study investigated socioeconomic and geographic inequalities in MDD consumption among children aged from 6 to 23 months in Ethiopia using recent Demographic and Health Survey (DHS) data.
The prevalence of adequate MDD in Ethiopia was 7.11%, which is lower than findings from studies conducted in Bangladesh, India, and other Asian countries (Akombi et al., 2017; Tripathy et al., 2022; Kundu et al., 2022), as well as previous studies in Ethiopia (Ba et al., 2022; Sisay et al., 2022). This difference may be due to rapid population growth, socioeconomic differences, drought, and other artificial and natural occurrences that have direct and indirect effects on nutrition in Ethiopia (Simane et al., 2016; Webb and Van Braun, 1990; Muriuki et al., 2023).
The analysis of socioeconomic and geographic inequalities revealed disparities in MDD consumption among the children in Ethiopia with respect to wealth status and regional differences.
The concentration curve indicated that the consumption of adequate MDD was concentrated among those with higher wealth indexes and in the developed and urban regions of Ethiopia. This suggests that children from wealthy households are more likely to receive adequate MDD, while children from poor households are left behind. Studies conducted in India, Bangladesh, and Kenya that used socioeconomic inequality decomposition analysis support this finding (Tripathy et al., 2022; Kundu et al., 2022; Achoki et al., 2019). Therefore, policymakers should focus on nutritional strategies that address MDD consumption inequalities for disadvantaged groups. Targeted interventions, such as mobile health education to improve dietary diversity among children and subsidized nutritional support by introducing nutrient-rich foods in low-income areas, can make these foods more accessible to poor households.
Inequalities in MDD consumption with respect to wealth status in Ethiopia were influenced by maternal age, sex of the household head, marital status, place of residence, maternal education status, and regional differences. This finding is supported by findings from studies conducted in India and Bangladesh (Paramashanti et al., 2021; Tripathy et al., 2022; Kundu et al., 2022), Addis Ababa Ethiopia (Solomon et al., 2017), Southern Ethiopia (Dafursa and Gebremedhin, 2019), Indonesia (Paramashanti et al., 2021), and Southern Africa (Kang et al., 2019).
A possible reason for this may be that younger mothers lack experience in nutrition, while female-headed households might prioritize different resources compared to male-headed ones. Single mothers often face economic challenges that limit dietary diversity, whereas married couples may pool resources more effectively. Urban areas generally have better access to diverse foods than rural areas. People in rural areas who are less educated and poor may be less likely to consume a diversified diet due to economic constraints. In contrast, educated mothers are more likely to prioritize varied diets, highlighting the need for a multifaceted approach to improving dietary diversity. Therefore, to address inequalities in MDD consumption in Ethiopia, targeted interventions could include implementing community-based nutrition education programs that focus on empowering mothers, particularly younger and single mothers, with knowledge about diverse diets and food preparation. These programs could be coupled with initiatives to improve access to diverse food sources through local markets and community gardens, particularly in rural areas. In addition, engaging male household heads in discussions about the importance of dietary diversity and resource allocation can foster collaborative approaches to nutrition within families.
The study revealed a notable concentration of MDD consumption among the children aged 6–23 months in the developed and urban areas, as shown by the concentration index. The decomposition analysis indicated that the sub-national/regional disparities in adequate MDD consumption were due to variations in compositional factors such as wealth status, maternal age, and the mother’s education level. This finding is in line with those of other studies (Paramashanti et al., 2021; Tripathy et al., 2022; Kundu et al., 2022).
A possible reason may be that families in wealthier urban regions are more likely to afford a varied diet, which is essential for MDD, while higher maternal education levels often correlate with better nutritional knowledge and practices. In addition, maternal age may influence dietary choices, as older mothers might have more experience and stability to provide diverse food options for their children (Variyam et al., 1999; Assefa et al., 2022).
Practical and policy implication
The concentration of adequate MDD consumption among the children in the wealthy, developed, and urban regions indicates the need for focused efforts targeting disadvantaged groups in poor, rural, and less developed regions.
The findings call for policy actions to reduce poverty and improve maternal education levels, as these were major contributors to wealth-based and geographic inequalities in MDD. National policies should ensure equitable distribution of resources and access to diverse foods across all regions of Ethiopia.
Strengths and limitations
This study’s robustness lies in its use of nationally representative data, enabling generalizability to all Ethiopian children. In addition, the application of a decomposed concentration index approach allowed for a detailed analysis of socioeconomic and regional inequalities in MDD consumption, providing valuable insights into the contributing factors.
The study’s cross-sectional nature limited its ability to establish causal relationships between the socioeconomic factors and MDD consumption. In addition, the reliance on self-reported information in the DHS survey data might have introduced recall bias or social desirability bias, which is a potential limitation of this study.
Conclusion
This study revealed wealth-based and regional inequalities in MDD consumption in Ethiopia. It found that adequate MDD consumption among the children in Ethiopia was concentrated in the wealthy and developed regions. These wealth-based and regional inequalities in MDD consumption in Ethiopia were influenced by factors such as parental marital status, maternal educational level, place of residence, and short preceding birth intervals. Therefore, efforts should be made to reduce poverty, improve maternal education levels, and implement interventions. In particular, nutrition and public health organizations should focus on supporting less developed regions to achieve dietary diversity for infants and young children.
Data availability statement
The original contributions presented in the study are included in the article/supplementary material, further inquiries can be directed to the corresponding author.
Author contributions
AE: Conceptualization, Data curation, Formal analysis, Investigation, Methodology, Project administration, Resources, Software, Supervision, Validation, Visualization, Writing – original draft, Writing – review & editing. SK: Conceptualization, Investigation, Methodology, Supervision, Validation, Visualization, Writing – original draft, Writing – review & editing. EA: Conceptualization, Methodology, Validation, Visualization, Writing – original draft, Writing – review & editing. EB: Conceptualization, Investigation, Methodology, Supervision, Validation, Visualization, Writing – original draft, Writing – review & editing. CD: Conceptualization, Investigation, Methodology, Supervision, Validation, Writing – original draft, Writing – review & editing. LA: Conceptualization, Methodology, Visualization, Writing – original draft, Writing – review & editing. FB: Conceptualization, Investigation, Methodology, Writing – original draft, Writing – review & editing. MA: Conceptualization, Investigation, Methodology, Visualization, Writing – original draft, Writing – review & editing. AM: Conceptualization, Investigation, Methodology, Supervision, Validation, Writing – original draft, Writing – review & editing. AT: Conceptualization, Investigation, Methodology, Supervision, Validation, Visualization, Writing – original draft, Writing – review & editing. AK: Conceptualization, Investigation, Methodology, Validation, Visualization, Writing – original draft, Writing – review & editing. KA: Conceptualization, Investigation, Methodology, Supervision, Validation, Writing – original draft, Writing – review & editing. NK: Conceptualization, Investigation, Methodology, Supervision, Validation, Writing – original draft, Writing – review & editing. EM: Conceptualization, Software, Writing – original draft, Writing – review & editing. AA: Conceptualization, Investigation, Methodology, Supervision, Validation, Writing – original draft, Writing – review & editing. YT: Conceptualization, Data curation, Formal analysis, Investigation, Methodology, Supervision, Validation, Writing – original draft, Writing – review & editing.
Funding
The author(s) declare that no financial support was received for the research, authorship, and/or publication of this article.
Acknowledgments
The authors are sincerely grateful to the Demographic Health Survey (DHS) program for allowing us to use the 18 countries of the SSA DHS dataset through their archives (https://dhsprogram.com).
Conflict of interest
The authors declare that the research was conducted in the absence of any commercial or financial relationships that could be construed as a potential conflict of interest.
Generative AI statement
The authors declare that no Generative AI was used in the creation of this manuscript.
Publisher’s note
All claims expressed in this article are solely those of the authors and do not necessarily represent those of their affiliated organizations, or those of the publisher, the editors and the reviewers. Any product that may be evaluated in this article, or claim that may be made by its manufacturer, is not guaranteed or endorsed by the publisher.
Abbreviations
CIX, Concentration index; CSA, Central statistical agency; DHS, Demographic and Health Survey; EDHS, Ethiopian Demographic and Health Survey; EA, Enumeration area; MDD, Minimum dietary diversity; SSA, Sub-Saharan Africa; SDG, Sustainable development goal; WHO, World Health Organization.
References
Achoki, T., Miller-Petrie, M. K., Glenn, S. D., Kalra, N., Lesego, A., Gathecha, G. K., et al. (2019). Health disparities across the counties of Kenya and implications for policy makers, 1990–2016: a systematic analysis for the global burden of disease study 2016. Lancet Glob. Health 7, e81–e95. doi: 10.1016/S2214-109X(18)30472-8
Ahmed, K. Y., Page, A., Arora, A., and Ogbo, F. A. (2019). Trends and determinants of early initiation of breastfeeding and exclusive breastfeeding in Ethiopia from 2000 to 2016. Int. Breastfeed. J. 14, 1–14. doi: 10.1186/s13006-019-0234-9
Akombi, B. J., Agho, K. E., Hall, J. J., Wali, N., Renzaho, A., and Merom, D. (2017). Stunting, wasting and underweight in sub-Saharan Africa: a systematic review. Int. J. Environ. Res. Public Health 14:863. doi: 10.3390/ijerph14080863
Arimond, M., and Ruel, M. T. (2004). Dietary diversity is associated with child nutritional status: evidence from 11 demographic and health surveys. J. Nutr. 134, 2579–2585. doi: 10.1093/jn/134.10.2579
Assefa, D., Belachew, T., Assefa, D., and Belachew, T. (2022). Minimum dietary diversity and associated factors among children aged 6-23 months in Enebsie Sar Midir Woreda, East Gojjam, North West Ethiopia. BMC Nutr. 8:149. doi: 10.1186/s40795-022-00644-2
Ba, D., Ssentongo, P., Gao, X., Chinchilli, V., Richie, J., Maiga, M., et al. (2022). Prevalence and determinants of meeting minimum dietary diversity among children aged 6–23 months in three sub-Saharan African countries: the demographic and health surveys, 2019–2020. Front. Public Health 10:846049. doi: 10.3389/fpubh.2022.846049
Belay, D., Aragaw, F. M., Teklu, R. E., Fetene, S. M., Negash, W., Asmamaw, D. B., et al. (2022). Determinants of inadequate minimum dietary diversity intake among children aged 6–23 months in sub-Saharan Africa: pooled prevalence and multilevel analysis of demographic and health survey in 33 sub-Saharan African countries. Front. Nutr. 9:894552. doi: 10.3389/fnut.2022.894552
Belete, K., Daba, D. B., Shallo, S. A., Yebassa, M. A., Danusa, K. T., and Gadisa, D. (2022). Levels of dietary diversity and its associated factors among children aged 6–23 months in West Shoa, Ethiopia: a comparative cross-sectional study. Journal of nutritional. Science 11:e20. doi: 10.1017/jns.2022.17
Black, R. E., Allen, L. H., Bhutta, Z. A., Caulfield, L. E., de Onis, M., Ezzati, M., et al. (2008). Maternal and child undernutrition: global and regional exposures and health consequences. Lancet 371, 243–260. doi: 10.1016/S0140-6736(07)61690-0
Cheo, A. E., and Tapiwa, K. A. (2021). Understanding the Interlinkages between SDG-2 and the Other SDGs. In SDG 2–Zero Hunger: Food Security, Improved Nutrition and Sustainable Agriculture. United Kingdom: Emerald Publishing Limited. 22, 43–48.
Dafursa, K., and Gebremedhin, S. (2019). Dietary diversity among children aged 6–23 months in Aleta Wondo District, southern Ethiopia. J. Nutr. Metab. 2019, 1–10. doi: 10.1155/2019/2869424
Daniel, J., Corsi, M. N., Finlay, J. E., and Subramanian, S. V. (2012). Demographic and health surveys: a profil. Int. J. Epidemiol. 41, 1602–1613. doi: 10.1093/ije/dys184
Endawkie, A., Asmare, L., Alemu, H. T., Geberu, D. M., Hagos, A., Jejaw, M., et al. (2024). Trend and determinants of minimum dietary diversity consumption change among children aged 6–23 months in Ethiopia from 2011 to 2019: a multivariate decomposition analysis. PLoS One 19:e0308349. doi: 10.1371/journal.pone.0308349
Eshete, T., Kumera, G., Bazezew, Y., Mihretie, A., and Marie, T. (2018). Determinants of inadequate minimum dietary diversity among children aged 6–23 months in Ethiopia: secondary data analysis from Ethiopian demographic and health survey 2016. Agric. Food Secur. 7, 1–8. doi: 10.1186/s40066-018-0219-8
Gil, J. D., Reidsma, P., Giller, K., Todman, L., Whitmore, A., van Ittersum, M., et al. (2019). Sustainable development goal 2: Improved targets and indicators for agriculture and food security. United Kingdom. Ambio. 48:685–98.
Kang, Y., Chimanya, K., Matji, J., Garg, A., Heidkamp, R., Marshal, Q., et al. (2019). Determinants of minimum dietary diversity among children aged 6-23 months in 7 countries in east and southern Africa (P10-035-19). Current developments. Nutrition 3:nzz034.P10-035-19. doi: 10.1093/cdn/nzz034.P10-035-19
Khanam, M., and Sarker, A. R. (2023). Dietary diversity among children aged 6–23 months in Bangladesh: Determinants and inequalities. Bangl. Dev. Stud. XLIV, 81–102. doi: 10.57138/HKFC5019
Koroso, N. H., Lengoiboni, M., and Zevenbergen, J. A. (2021). Urbanization and urban land use efficiency: Evidence from regional and Addis Ababa satellite cities, Ethiopia. Habitat Int. 117:102437.
Kundu, S., Das, P., Rahman, M. A., Banna, M. H. A., Fatema, K., Islam, M. A., et al. (2022). Socio-economic inequalities in minimum dietary diversity among Bangladeshi children aged 6–23 months: A decomposition analysis. Sci. Rep. 12:21712. doi: 10.1038/s41598-022-26305-9
Mollier, L., Seyler, F., Chotte, J.-L., and Ringler, C. (2017). End hunger, achieve food security and improved nutrition and promote sustainable agriculture: SDG 2 : ICSU.
Muriuki, J., Hudson, D., and Fuad, S. (2023). The impact of conflict on food security: evidence from household data in Ethiopia and Malawi. Agric. Food Secur. 12:41. doi: 10.1186/s40066-023-00447-z
O’Donnell, O., O'Neill, S., Van Ourti, T., and Walsh, B. (2016). Conindex: estimation of concentration indices. Stata J. 16, 112–138. doi: 10.1177/1536867X1601600112
Onyango, A. W., Borghi, E., de Onis, M., del Carmen, C. M., and Garza, C. (2014). Complementary feeding and attained linear growth among 6–23-month-old children. Public Health Nutr. 17, 1975–1983. doi: 10.1017/S1368980013002401
Paramashanti, B. A., Huda, T. M., Alam, A., and Dibley, M. (2021). Trends and determinants of minimum dietary diversity among children aged 6–23 months: a pooled analysis of Indonesia demographic and health surveys from 2007 to 2017. Public Health Nutr. 25, 1956–1967. doi: 10.1017/S1368980021004559
Simane, B., Beyene, H., Deressa, W., Kumie, A., Berhane, K., and Samet, J. (2016). Review of climate change and health in Ethiopia: status and gap analysis. Ethiop. J. Health Dev. 30, 28–41.
Sisay, B., Afework, T., Jima, B. R., Gebru, N. W., Zebene, A., and Hassen, H. Y. (2022). Dietary diversity and its determinants among children aged 6–23 months in Ethiopia: evidence from the 2016 demographic and health survey. Journal of nutritional. Science 11:e88. doi: 10.1017/jns.2022.87
Solomon, D., Aderaw, Z., and Tegegne, T. K. (2017). Minimum dietary diversity and associated factors among children aged 6–23 months in Addis Ababa, Ethiopia. Int. J. Equity Health 16:181. doi: 10.1186/s12939-017-0680-1
Teshome, F., and Tadele, A. (2022). Trends and determinants of minimum acceptable diet intake among infant and young children aged 6–23 months in Ethiopia: a multilevel analysis of Ethiopian demographic and health survey. BMC Nutr. 8, 1–11. doi: 10.1186/s40795-022-00533-8
Tripathy, A., Bhati, D., Srivastava, S., and Mishra, P. S. (2022). Change in socioeconomic inequality in minimum dietary diversity among children aged 6–23 months in India: Evidence from National Family Health Survey. Child Indic. Res. 16, 1049–1071. doi: 10.1007/s12187-022-10004-y
Variyam, J. N., Blaylock, J., Lin, B. H., Ralston, K., and Smallwood, D. (1999). Mother's nutrition knowledge and children's dietary intakes. Am. J. Agric. Econ. 81, 373–384. doi: 10.2307/1244588
Wagstaff, A. (2005). The bounds of the concentration index when the variable of interest is binary, with an application to immunization inequality. Health Econ. 14, 429–432. doi: 10.1002/hec.953
Wagstaff, A., O’Donnell, O., Van Doorslaer, E., and Lindelow, M. (2007). Analyzing health equity using household survey data: a guide to techniques and their implementation. Washington, D.C., USA: World Bank Publications 2.
Wagstaff, A. (2011). The concentration index of a binary outcome revisited. Health Econ. 20, 1155–1160. doi: 10.1002/hec.1752
Webb, P., and Van Braun, J. (1990). Drought and food shortages in Ethiopia. A preliminary review of effects and policy implications. Washington, DC: IFPRI.
World Health Organization (2009). Infant and young child feeding: Model chapter for textbooks for medical students and allied health professionals. Geneva, Switzerland: World Health Organization.
World Health Organization (2017). WHO expert consultation on public health intervention against early childhood caries: Report of a meeting, Bangkok, Thailand, 26–28 January 2016. Geneva, Switzerland: World Health Organization.
World Health Organization (2021). Indicators for assessing infant and young child feeding practices: Definitions and measurement methods. Geneva, Switzerland: World Health Organization.
Keywords: socioeconomic and regional inequality, minimum dietary diversity, children, Ethiopia, decomposed concentration index approach
Citation: Endawkie A, Kebede SD, Abeje ET, Bekele Enyew E, Daba C, Asmare L, Bayou FD, Arefaynie M, Mekonen AM, Tareke AA, Keleb A, Abera KM, Kebede N, Mesfin Gebeyehu E, Ayres A and Tsega Y (2025) Analyzing socioeconomic and regional inequalities in minimum dietary diversity consumption among children aged 6–23 months in Ethiopia: a decomposed concentration index approach. Front. Sustain. Food Syst. 9:1523115. doi: 10.3389/fsufs.2025.1523115
Edited by:
Amélia DElgado, University of Algarve, PortugalReviewed by:
Sidra Jabeen, University of Agriculture, Faisalabad, PakistanTeresa Abbattista, Senigallia Hospital, Italy
Tetsushi Sonobe, Asian Development Bank Institute (ADBI), Japan
Copyright © 2025 Endawkie, Kebede, Abeje, Bekele Enyew, Daba, Asmare, Bayou, Arefaynie, Mekonen, Tareke, Keleb, Abera, Kebede, Mesfin Gebeyehu, Ayres and Tsega. This is an open-access article distributed under the terms of the Creative Commons Attribution License (CC BY). The use, distribution or reproduction in other forums is permitted, provided the original author(s) and the copyright owner(s) are credited and that the original publication in this journal is cited, in accordance with accepted academic practice. No use, distribution or reproduction is permitted which does not comply with these terms.
*Correspondence: Abel Endawkie, YWJlbGVuZGF3a2llQGdtYWlsLmNvbQ==