 Lili Gu
 Xintong Dong
- College of Economics and Management, Jilin Agricultural University, Changchun, Jilin, China
Water scarcity has increasingly become a critical challenge for the sustainable development of Chinese agriculture. Investigating the eco-efficiency of China’s grain production (ECGP) through the water footprint (WF) lens is essential for gaining deeper insights into the current state of grain production and promoting sustainable agricultural practices. In this paper, the CROPWAT model was used to measure the water footprint (WF) of China’s provinces, to evaluate the ECGP with the food production function based on the WF, and to explore the main influencing factors of the ECGP. The study found that (1) the green water footprint of grain production (WFGPgreen) dominates the WFGP in China, and the WFGP shows an overall fluctuating growth trend. In contrast, the gray water footprint of grain production (WFGPgrey) begins to decline after reaching the peak, especially after the implementation of the “Zero Growth Action Plan for Fertilizers and Pesticides,” significantly reducing the WFGP. The three phases of change in the ECGP, namely, “high-level decline period, adjustment period in the trough, and rebound and stabilization period,” show that China has gradually shifted from an initial model of high inputs and low efficiencies to a sustainable development model oriented toward green agriculture. ECGP varies significantly among the seven major regions of China, with the northeastern region being an area of high eco-efficiency in food production, probably mainly due to its more centralized pattern of food production. (3) The level of economic development, urban–rural income disparity, scale-up level, irrigation rate of grain fields, and grain yield per unit area significantly affect ECGP.
1 Introduction
The United Nations World Water Development Report 2024 reveals that nearly half the global population is currently experiencing water scarcity.1 The projected 60% surge in global food demand by 2050 is of particular concern, which is expected to intensify pressures on already strained freshwater resources further. This challenge is especially acute in countries where the ratio between population and resource endowment is severely imbalanced (Wen and Lu, 2024). According to World Bank data (2020), China supports nearly 20% of the world’s population with just 6% of global freshwater resources.2 This imbalance is further exacerbated by pronounced spatial mismatches: over 60% of China’s arable land is located in the Huai River Basin and northern regions, which account for only around 20% of national water availability (Dai et al., 2020). Consequently, agricultural production in these areas has long relied on unsustainable practices such as groundwater over-extraction and large-scale inter-basin water diversion, posing significant threats to the long-term stability of food supply systems. Despite a steady increase in total grain output driven by ongoing reforms in the agricultural and rural sectors, this growth has been accompanied by substantial environmental trade-offs. As the primary water-consuming sector, agriculture accounted for approximately 62% of total water use in 2023 (Peng et al., 2023). Low-efficiency irrigation systems and the overuse of agrochemicals have further exacerbated water scarcity. In North China, for instance, cumulative groundwater depletion has reached 180 billion cubic meters, forming the largest groundwater depression cone worldwide (Chen et al., 2020). Concurrently, soil salinization and widespread watershed pollution have contributed to a negative feedback loop of resource depletion and ecological degradation. These converging challenges underscore the urgent need to accelerate the transition toward sustainable agricultural practices and to enhance ecological efficiency and integrated resource management in food production systems.
The academic community has initiated discussions on this topic. Researchers such as Bravo-Ureta et al. (2007), Vicente (2004), Wiebe et al. (2001), and Zhu et al. (2010) have measured the agricultural ecological efficiency of different countries around the world. Garbelini et al. (2022) further refined their study by examining the Brazilian grain production system, finding that diverse grain production systems can increase food output and maintain the sustainability of the grain production systems. The above-mentioned efficiency evaluation methods typically assume that grain production operates under full technical efficiency. However, technical inefficiencies often exist in actual production due to resource misallocation, outdated technologies, and environmental constraints. This limitation has prompted a shift in research perspectives, with scholars beginning to adopt more refined analytical methods. Specifically, scholars now employ methods such as SFA (Kuang et al., 2020; Pang and Wang, 2020; Xiao et al., 2022; Zeng et al., 2023) or DEA models (Binam et al., 2004; Deng and Gibson, 2019; Bianchi et al., 2020; Luik et al., 2009) to measure production efficiency by analyzing the inputs and outputs in grain production, while also exploring the influencing factors (Zeng et al., 2018; Mamiit et al., 2021). Subsequently, the focus of grain production has gradually shifted from merely increasing yields to achieving a balance between agricultural output and environmental sustainability. In response to new grain production requirements, scholars have expanded the evaluation framework of ECGP. The evaluation index system was developed from the food production evaluation index system consisting of labor, land, fertilizer, machinery inputs, and grain outputs (Van Asselt et al., 2014; Movilla-Pateiro et al., 2021) to a new evaluation index system incorporating carbon emissions or surface source pollution (Xiang et al., 2020; Baum and Bieńkowski, 2020; Wang et al., 2022; Lu et al., 2020; Cui et al., 2021; Li et al., 2022). Based on assessing the ECGP, scholars have explored factors influencing the ECGP from both endogenous and exogenous perspectives. The endogenous aspect focuses on input redundancy and unwanted output redundancy. Li et al. (2022) argued that the low overall efficiency of prominent grain-producing areas is because some provinces and cities have not achieved efficient, green production of grain, and they utilize resources inefficiently, exhibiting significant redundancies in inputs and unwanted outputs. The exogenous aspect emphasizes the external environment and various policies. Huang et al. (2022) found that changes in fertilizers and pesticides impact core indicators like rice production ecological efficiency. Yang et al. (2022) discovered that technological progress and improvements in agricultural infrastructure are significant drivers in enhancing the ECGP. Water resource accounting plays a critical role in evaluating the sustainability of agricultural production. Allan (2011) introduced the concept of virtual water, referring to the hidden flow of water used to produce goods and services. Building on this concept, Arjen Hoekstra—often referred to as the “father of the water footprint”—further classified WF into blue water, green water, and gray water in 2003, thereby capturing water consumption across the entire production lifecycle (Hoekstra A Y. 2003). The WF framework has since been widely applied in assessing agricultural water use. For instance, Wang et al. (2022), Li et al. (2022), and Zhai et al. (2021) have investigated the water footprints of crop production across different regions, revealing the spatiotemporal patterns of water use. Deng et al. (2007) evaluated water resource utilization in Sichuan Province by calculating the local water footprint self-sufficiency rate. In recent years, many scholars have employed water footprint accounting to study ecological efficiency.
An analysis of existing scholarly research reveals that substantial progress has been made in evaluating ECGP, particularly in selecting evaluation indicators, data processing methods, and modeling techniques. This body of research has laid a solid foundation for the current study, but there remains room for further improvement. This omission results in evaluation systems that cannot fully reflect the impact of water resource consumption and pollution on ecological efficiency. In grain production, water resources are heavily consumed and can be polluted, mainly due to agricultural activities leading to WFgrey. The long-term environmental impact of such pollution cannot be overlooked. This study fills this gap by incorporating WF and WFgrey into the evaluation framework. It provides a more comprehensive perspective, offering more substantial support for water resource management and sustainable agriculture. This is especially crucial for countries like China, where water resources are scarce, yet agriculture is highly dependent on water.
In addition to the contributions mentioned above, this study also provides a more detailed regional analysis of ECGP and identifies the main factors influencing it. These insights are essential for guiding the formulation and implementation of agricultural policies and practices.
2 Materials and methods
2.1 Research methods
2.1.1 Measurement of WF
2.1.1.1 Water footprint of grain production
Referring to studies by Baum and Bieńkowski (2020), this study defines WFGP (m3) as the total amount of water consumed during the crop growth process within a region. Since blue and green water resources can substitute for each other in agricultural production, accounting for both simultaneously aids in a comprehensive analysis of the entire water resource consumption (Sreeshna et al., 2024; Li et al., 2018). Therefore, WFGP in this study is represented as the sum of WFblue and WFgreen. This paper adopts the CROPWAT model recommended by USDA-SCS to simulate the evapotranspiration of blue and green water from crops by inputting the climatic data, crop data, and soil data in each province. Then, the WFblue and WFgreen of the different crop sub-provinces are calculated. The relevant formulas are as follows:
In the formulas mentioned, ETgreen refers to the total amount of green water undergoing evapotranspiration during the crop growth period. ETblue refers to the total amount of blue water undergoing evapotranspiration during the crop growth period. 10 is a constant factor. y represents the yield of the crop per unit area. ETc is the crop evapotranspiration amount. Pe stands for effective rainfall (mm/d). P is the daily rainfall amount (mm/d).
2.1.1.2 Gray water footprint of grain production
The WFGPgrey refers to the amount of water required to dilute various nutrient pollutants to a certain level to bring the existing environmental water quality up to safe standards when fertilizers are applied, and pesticides are sprayed to pollute the water to a certain degree during the growth process of grain. This dilution water, which addresses the additional pollution load, is not consumed; hence, the WFGPgrey represents a type of non-consumptive water use. Considering data availability and the fact that the primary sources of pollution in grain production are fertilizers and pesticides, this study focuses solely on the negative environmental impacts of these two factors when calculating WFGPgrey (Xiao et al., 2022; Liu et al., 2022). The fertilizers runoff rate and pesticides pollution rate are calculated at 65 and 50%. According to relevant research, the allowable concentration of fertilizers and pesticides in aquatic environments is 1.7 g/L and 10 mg/L, respectively.
Where WFGPgrey represents gray water footprint; F denotes the amount of fertilizer applied in grain production. Lf is fertilizers runoff rate. Ef represents the permissible concentration of fertilizer in the water environment. C signifies the quantity of pesticides used in grain production. Lc is pesticides pollution rate in grain production. Ec represents the permissible concentration of pesticides in the water environment. y stands for the yield of the grain.
Figure 1 shows the mechanistic linkages between WF, WFGP, WFblue, WFgreen, and WFGPgrey.
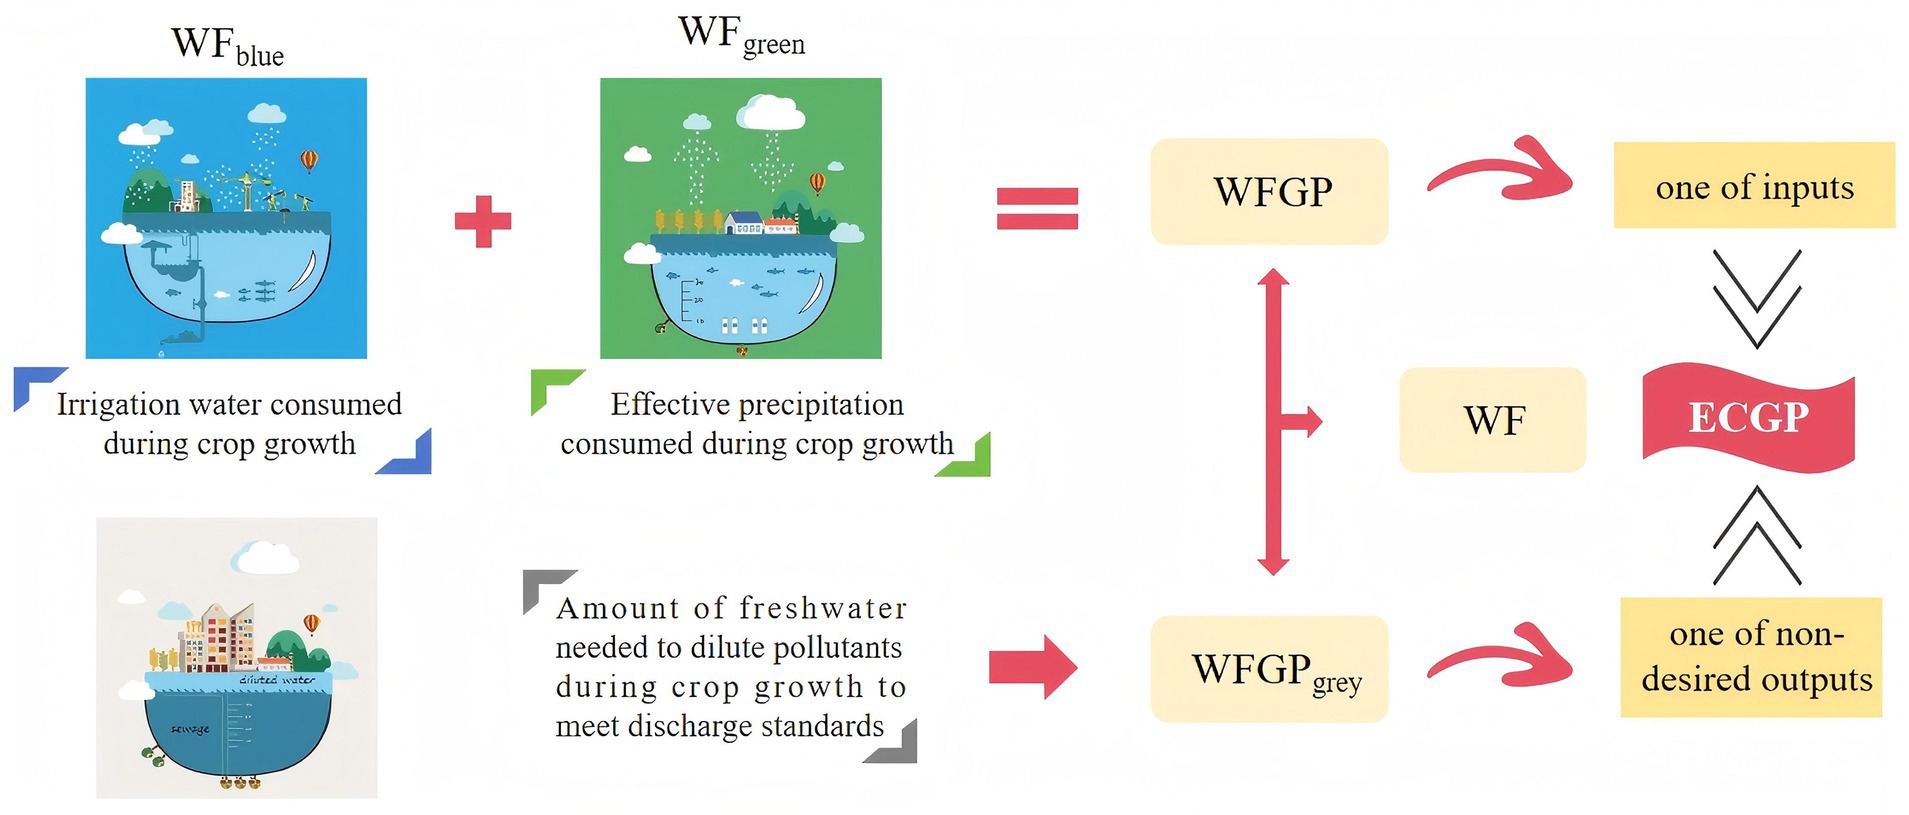
Figure 1. The mechanistic linkages between WF, WFGP, WFblue, WFgreen, and WFGPgrey.
2.1.2 Super-SBM model
Existing literature mostly uses DEA models for efficiency evaluation, including BCC (Banker - Chames - Cooper) and CCR (Chames - Cooper - Rhodes) models. However, because it does not consider the phenomenon of the factor “slack,” the measurement of its efficiency is somewhat inaccurate. To avoid this problem, this paper chooses the super-efficient SBM model used by some scholars (Tone, 2001; Han and Zhang, 2020; Qiu et al., 2022; Li et al., 2022) to measure ECGP in 31 provinces, which is shown in Equation 5.
represents the efficiency score of a decision-making unit (DMU), with values greater than 1 indicating superior performance beyond the efficient frontier. Inputs refers to the resources or factors consumed in the production process. Outputs indicates the goods or services generated from the given inputs. Adjusted inputs, denoted as , capture any excess resources used beyond what is necessary, while adjusted outputs reflect any shortfall in the production outcome compared to the most efficient DMUs. The total number of DMUs included in the analysis is denoted by n, while m and s represent the numbers of input and output variables, respectively.
2.1.3 Tobit model
The super-efficiency SBM model calculates ECGP, characterized by efficiency values greater than 1, but with 0 as the cutoff point. The Tobit model is particularly suitable for situations where the dependent variable has zero values or the data for the dependent variable are censored. The Tobit model includes both fixed effects and random effects models. The fixed effects model lacks an estimate for the constant term, resulting in usually inconsistent estimates; meanwhile, the random effects model does not require conditions for parameter settings and demands fewer statistics. In this study, we refer to the research of related scholars who use the Tobit model, considering random effects to regress and analyze the influencing factors of ECGP in China. The model expression is as follows:
EEit represents the ecological efficiency of grain production for province i in year t, serving as the dependent variable in the model. is the intercept term, representing the baseline ecological efficiency when all independent variables are zero. denotes the j-th independent variable for province i in year t, while βj is the coefficient corresponding to the j independent variable, measuring its effect on ecological efficiency. captures the random effects specific to each province i, accounting for unobservable heterogeneity across regions. is the error term, capturing all other random variations that are not explained by the model.
2.2 Construction of the Indicator system and selection of driving factors
2.2.1 Construction of the Indicator system
The measurement of ECGP takes into account resource consumption, economic benefits, and ecological damage during the production process. Under the guidance of eco-efficiency-related theories such as ecological economic theory, eco-agriculture theory, and sustainable development theory, this study constructs the indicator system by drawing on the existing studies on the ECGP (Song and Chen, 2019; Lu et al., 2019) and the eco-efficiency of agriculture (Wang and Zhang, 2018; Hou and Yao, 2019) and selecting the following indicators as the inputs, desired outputs and non-desired outputs of the ECGP in the present study, as shown in Table 1.
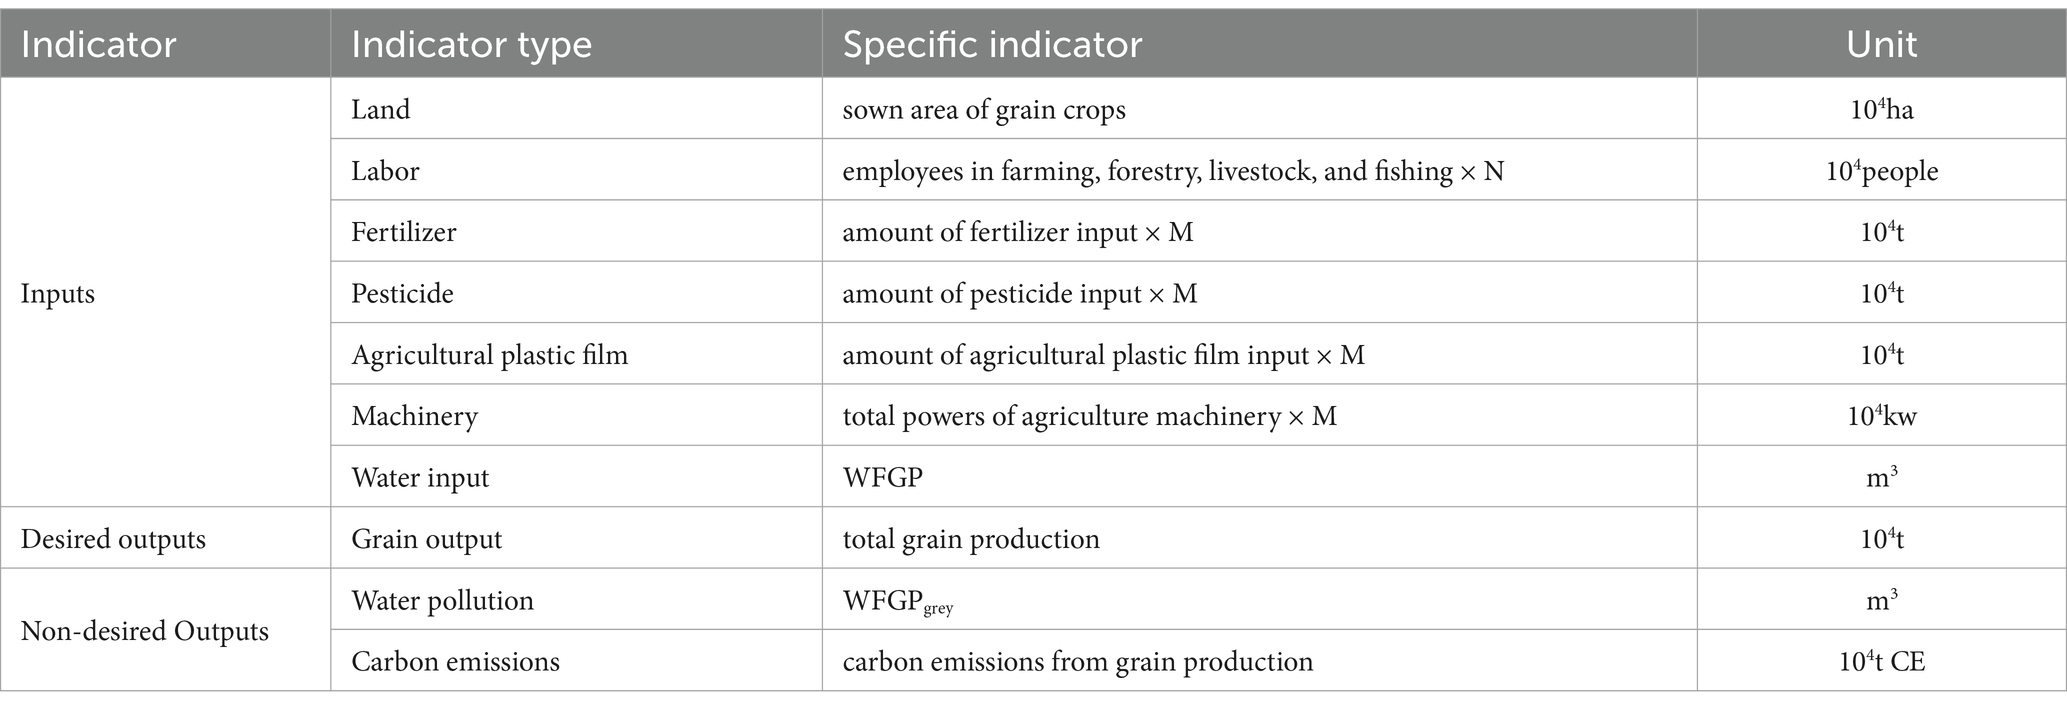
Table 1. Indicators selection.
In the calculation of input indicators, a generalized weighting coefficient method is applied, taking into account existing research findings and data availability. Since the statistical yearbooks only provide data for farming, forestry, livestock, and fishing as a whole, it is necessary to extract grain production-related input indicators by assigning appropriate weighting coefficients. The weighting coefficients are defined as follows: M = sown area of grain crops / total sown area of all crops, N = (sown area of grain crops / total sown area of all crops) × (agricultural output value / total output value of farming, forestry, livestock, and fishing). Each indicator is multiplied by the corresponding weighting coefficient to obtain the data specific to grain production inputs.
For the output indicators, the data for the desired output (grain output) can be directly obtained, whereas the data for the undesired output, such as carbon emissions, cannot be directly acquired and must be calculated. The carbon emissions in the grain production process primarily come from the use of fertilizers, pesticides, plastic films, agricultural diesel, and irrigation. This study follows the methods of relevant scholars (Khan et al., 2021; Li et al., 2024) and applies Equation (7) to calculate carbon emissions:
where: Ti represents the carbon emissions from the i source. Ei refers to the quantity of the i emission source. representing the carbon emission coefficient corresponding to the i source (Table 2).
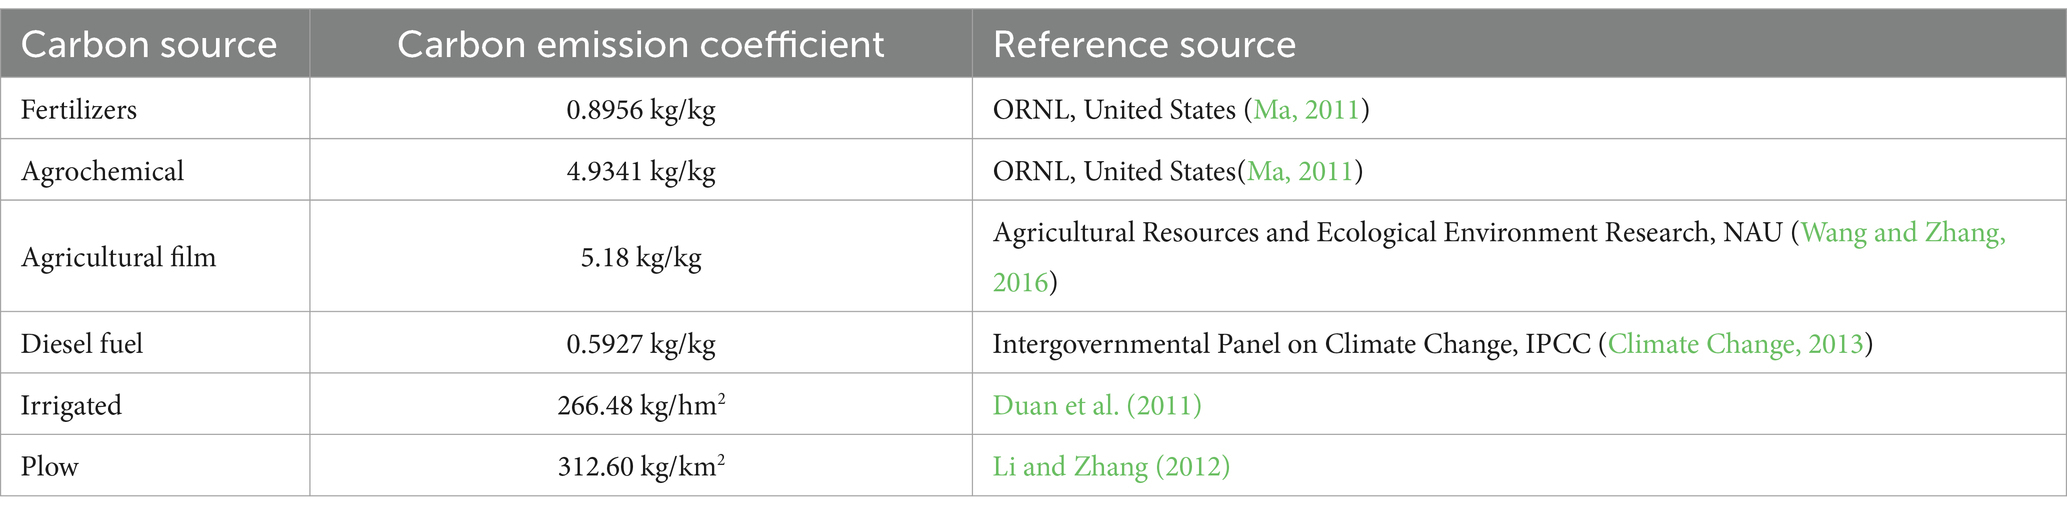
Table 2. Table of carbon emission factors.
2.2.2 Selection of impact factors
The ECGP is influenced by numerous factors. Based on a review of relevant literature (Zhou et al., 2020; Wang et al., 2022) and considering the current state of grain production and data availability across provinces, this study ultimately selects 10 influencing factors across three dimensions: economic environment, production conditions, and input intensity. The economic environment dimension includes indicators such as the level of economic development, financial support, urban–rural income disparity. Existing research suggests that regional economic growth and supportive policies tend to increase the input of production materials in grain production, thereby affecting ecological efficiency. The production conditions dimension covers the level of scale-up, the level of mechanization, the irrigation rate of grain fields, which collectively reflect the foundational and modernization level of agricultural production. The input intensity dimension includes fertilizer application intensity, pesticide application intensity, plastic film usage intensity, and grain yield per unit area. These indicators are directly associated with the environmental impact and output efficiency of agricultural production. The detailed descriptions of these variables are provided in Table 3.
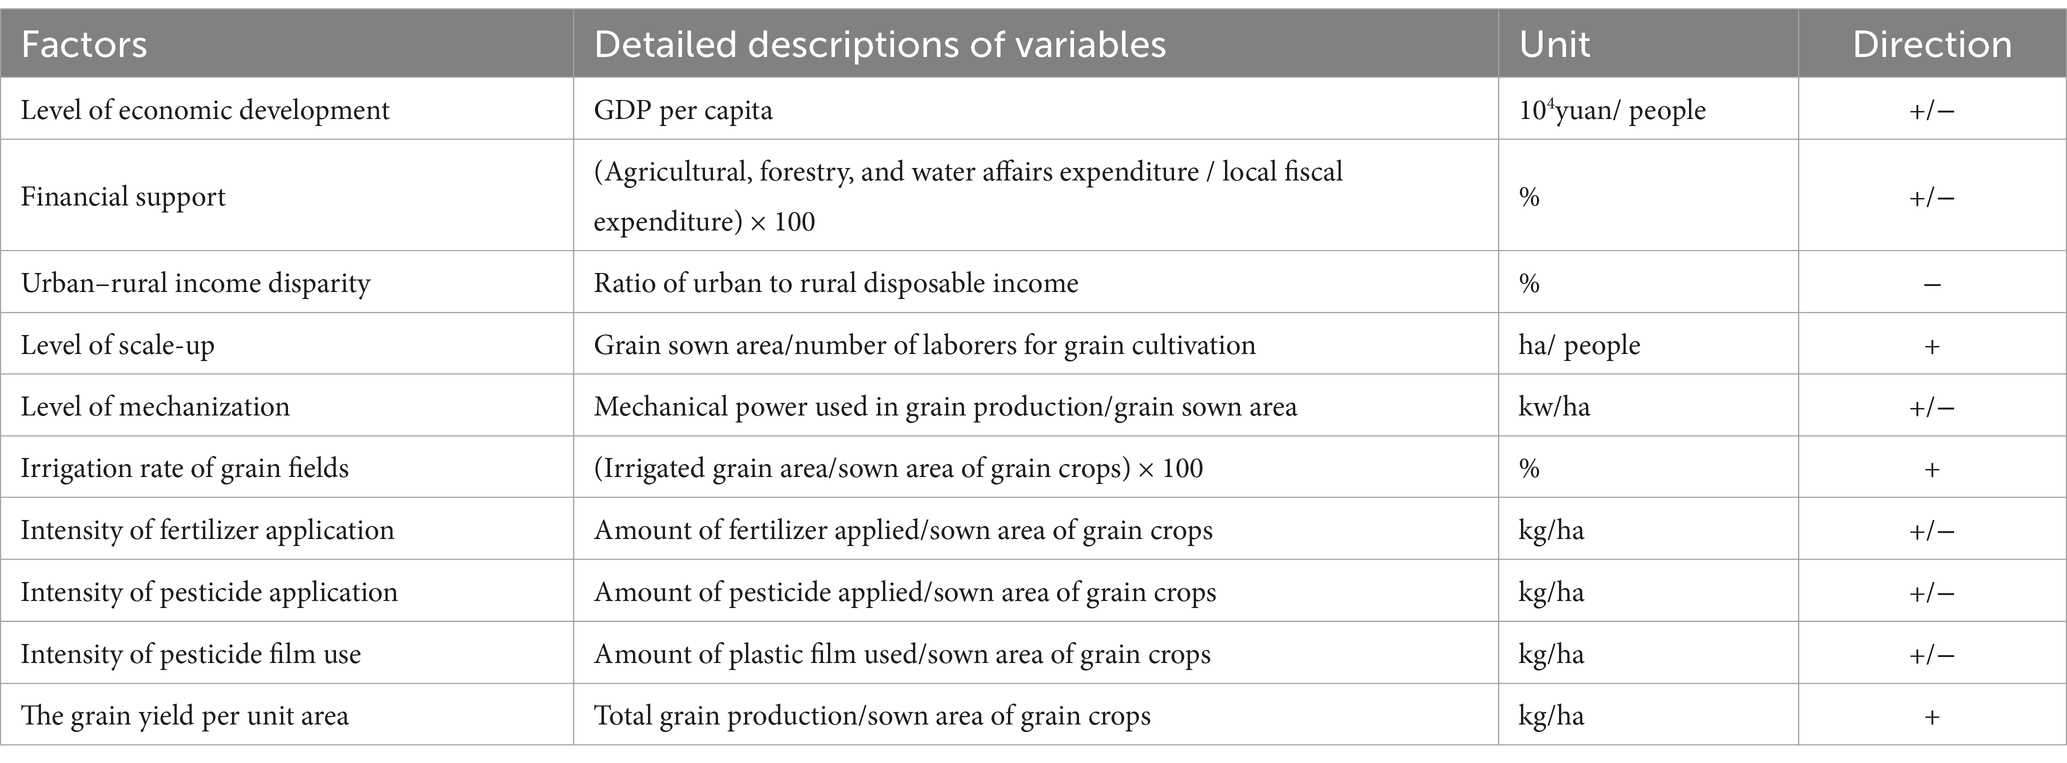
Table 3. Indicators of impact factors.
2.3 Data sources
This paper constructed a panel data for 31 provinces in China (excluding Hong Kong, Macao, and Taiwan) covering the period from 2000 to 2021. The data used for WF calculations were obtained from the China Meteorological Data Network, while other relevant data were sourced from the China Statistical Yearbook, the China Rural Statistical Yearbook, and the Statistical Yearbooks of each province from 2000 to 2021.
3 Results
3.1 Measuring the WFGP and WFGPgrey
The WFGP and WFGPgrey in China from 2000 to 2021 were calculated according to Equations 2–5, respectively. Figure 1 shows the changes in WFGP. It can be seen from Figure 2 that the WFGPgreen dominates the WFGP in China, accounting for more than 70%. Most of China’s farmland relies on natural precipitation to meet irrigation needs (Luo and Dong, 2023), especially in the vast rainfed agricultural areas of China, which primarily depend on natural rainfall to supply the water needed for crop growth. Although irrigation systems have been established in many areas of China, some areas still have underdeveloped or inefficient irrigation systems (Wang and Li, 2018), so a large amount of farmland still depends on natural rainfall. The minimum value of China’s WFGP appeared in 2009 at 39,829.96 m3; the maximum value appeared in 2020 at 45,434.87 m3. With population growth, increasing demand for grain, and the expansion of agricultural production, the demand for water resources has also risen, leading to a fluctuating upward trend in the WFGP. It increased from 34,849.87 m3 in 2000 to 39,223.72 m3 in 2021, with an increase of 12.55%. Compared to the overall growth trend, the WFGP saw slight declines in the periods of 2005–2009 and 2011–2015.
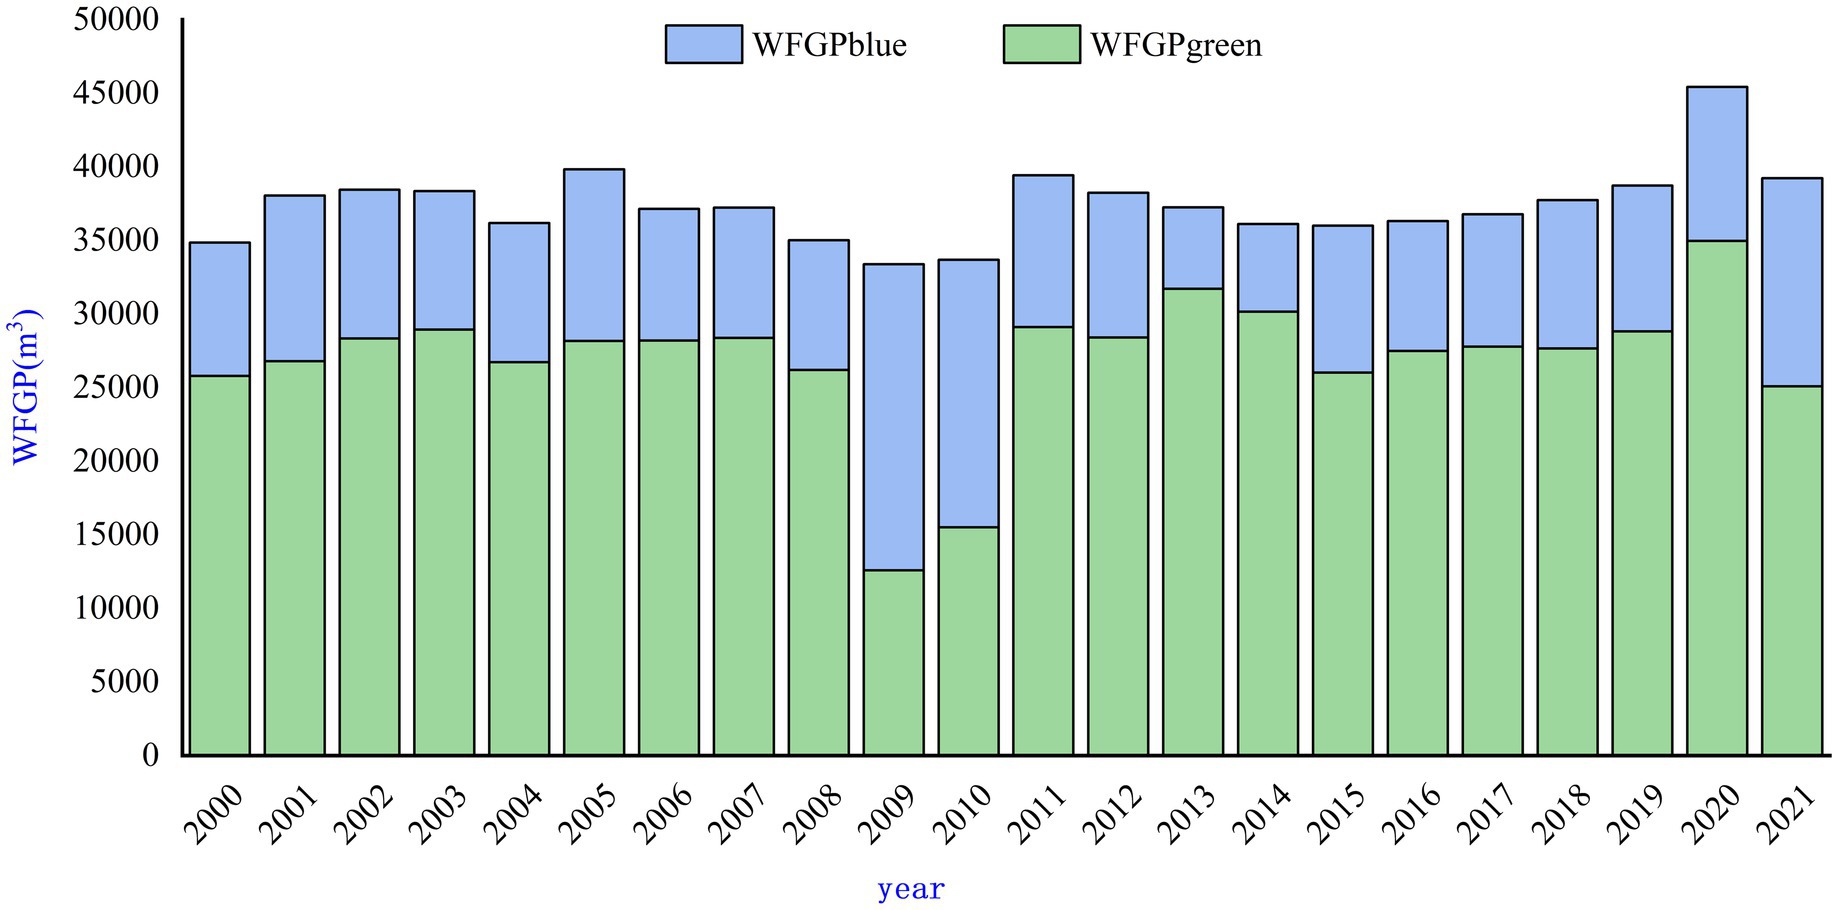
Figure 2. Variation of WFGP in China from 2000 to 2021 Data Source: Calculated using Equations 1–3.
Figure 3 illustrates the changes in WFGPgrey in China from 2000 to 2021. The WFGPgrey refers to the amount of freshwater required to dilute pollutants to meet environmental standards. It serves as an indicator for assessing the negative environmental effects within agricultural systems. Changes in the WFGPgrey reflect not only variations in the scale of grain production but also shifts in agricultural, environmental management, and policy. As can be observed from the figure, the WFGPgrey was relatively low in 2000 and gradually increased, reaching a peak around 2010. During this period, to ensure food security, China expanded its cultivated area and relied heavily on chemical inputs to boost agricultural yields, which, in turn, increased water demand and pollution loads. Although the government began to recognize the issue of agricultural pollution during this phase, the effects of mitigation efforts were not immediately apparent. As a result, from 2011 to 2014, the WFGPgrey neither grew significantly nor declined sharply, indicating a balance between maintaining crop yields and controlling pollution. After 2015, China began to strictly regulate the use of fertilizers and pesticides by implementing the Action Plan for Zero Growth in the Use of Pesticides and Fertilizers (Fan and Chen, 2022). With the government intensifying efforts to control non-point source pollution in agriculture, the WFGPgrey showed a clear downward trend.
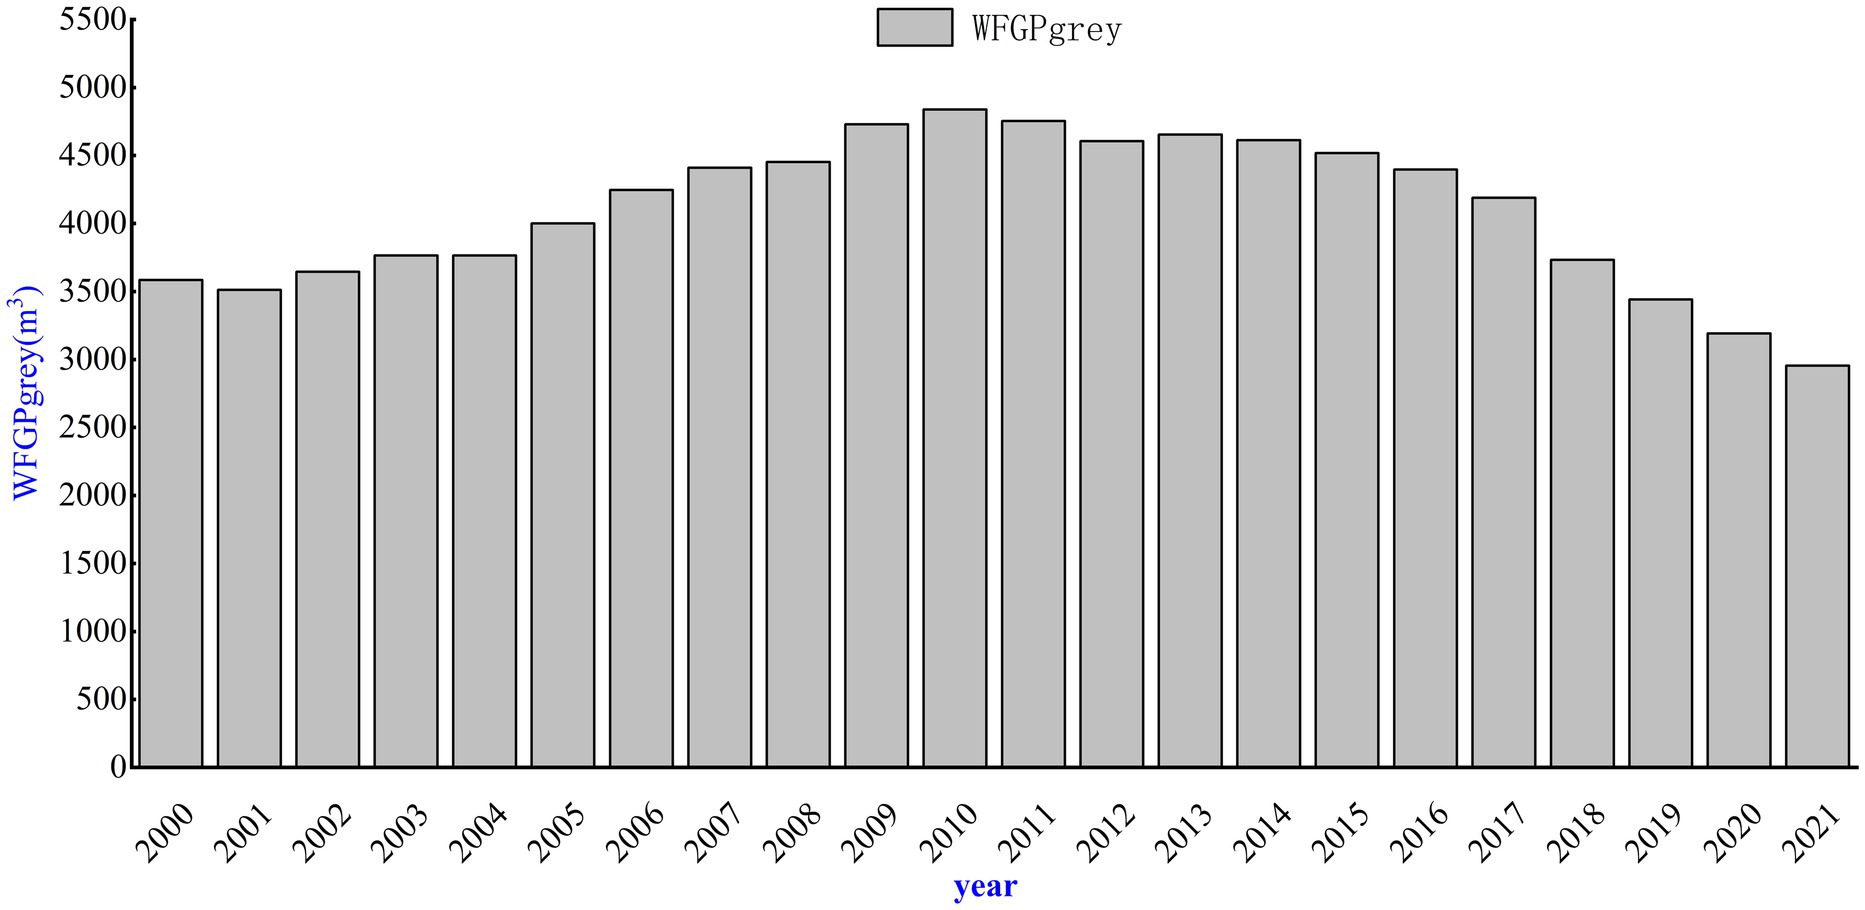
Figure 3. Variation of WFGPgrey in China from 2000–2021 Data Source: Calculated using Equations 4.
3.2 Evaluation of ECGP
The ECGP in 31 provinces from 2000 to 2021 was calculated using MaxDEA software based on Equation (6), with the results presented in Table 4.
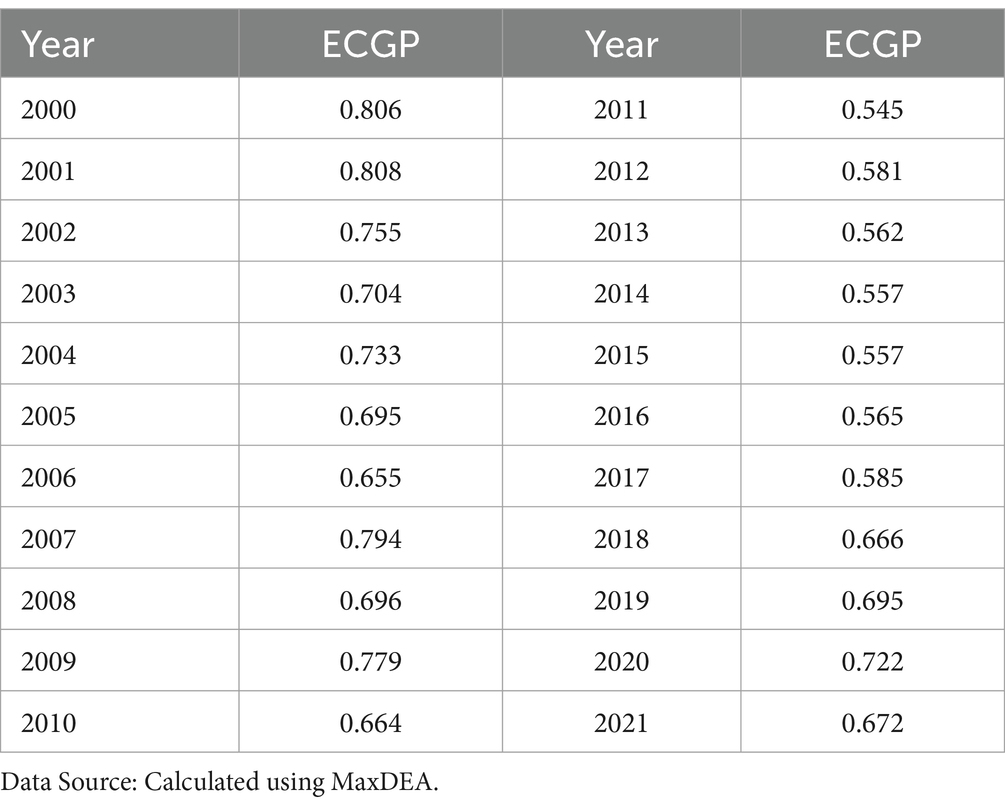
Table 4. ECGP in China (2000–2021).
Based on the calculation results of ECGP from 2000 to 2021, the average efficiency was 0.673, indicating a medium level. The peak value of 0.808 was observed in 2001, while the lowest value, 0.545, occurred in 2011. As shown in Figure 4, ECGP exhibited a fluctuating pattern over the observation period, characterized by an initial decline, followed by a period of volatility, and a subsequent rebound. This trend highlights the continuous balancing act between achieving food security and safeguarding the ecological environment in the course of China’s agricultural development.
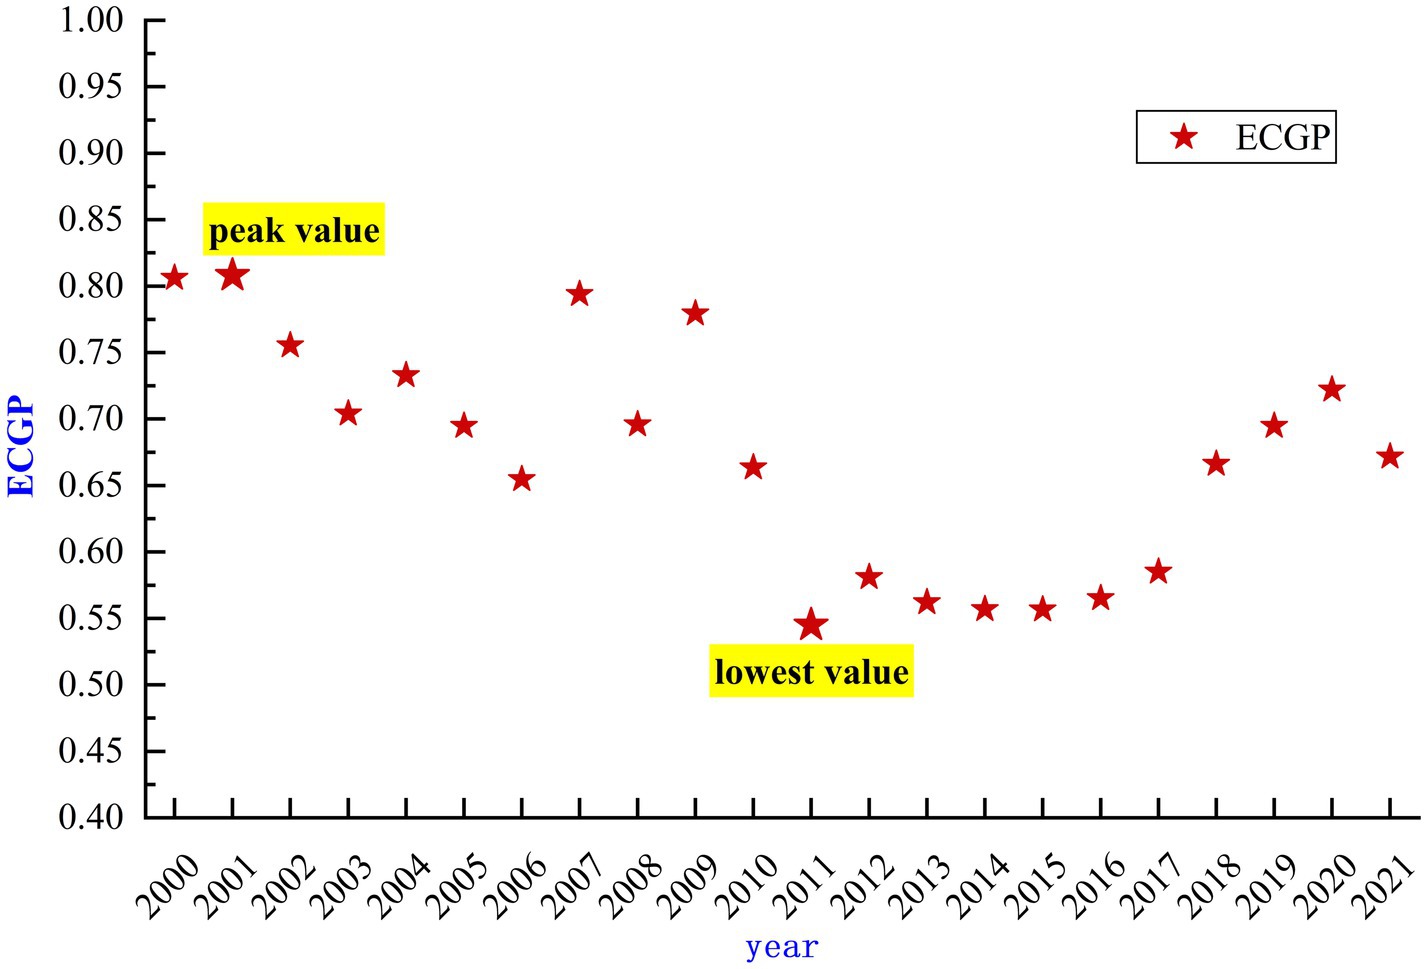
Figure 4. Variation of ECGP in China from 2000–2021 Data Source: Calculated using MaxDEA.
During 2000–2009, although the ECGP was at a relatively high level, it showed a gradual downward trend. With the government’s strong emphasis on food security, agriculture maintained a high-input, high-output production model. The extensive use of fertilizers, pesticides, and water resources increased grain outputs. However, due to Low-efficiency irrigation systems and overuse of fertilizers, pesticides, and agricultural film, water waste, and pollution were exacerbated, resulting in an increased WFGPgrey. The corresponding output increase was insufficient to compensate for this rise (Wang and Lin, 2021), resulting in decreased ecological efficiency. The ECGP also fluctuated to a certain extent during this period, which was mainly related to some sudden natural disasters, such as the frequent rainstorms that hit southern China in 2006 and the years of rare low-temperature rain and snowstorms in eastern, central, southern, and southwestern China in 2008, which caused different degrees of impacts on the agricultural production, and in turn, affected the ECGP.
During 2010–2017, ECGP declined further, with efficiency levels consistently below the average for the period from 2000 to 2021. This period marked the entry of the agricultural system into an adjustment period, facing severe challenges to the agricultural ecological environment. The long-term high-intensity production model has accumulated numerous ecological problems, such as soil degradation, water shortages, and non-point source pollution, making it difficult for the production system to maintain high efficiency. Although the government has realized the seriousness of the problem during this period and has begun to promote supply-side structural reform, attempting to limit the application of chemical fertilizers and pesticides while encouraging the adoption of eco-friendly technologies, such as water-conserving irrigation(e.g., Document No. 1 of the Central Committee of 2011 proposes the promotion of water-saving agricultural technologies), the effects of these measures have not yet been fully realized in the short term, resulting in the ECGP staying at a relatively low level. The characteristics of this period reflect the difficulties and challenges of agricultural transformation, and even with policy support, adjustments will take a long time.
From 2018 to 2021, ECGP has seen a gradual rebound and is approaching the 2000 level in 2020. This rebound trend indicates that the green agricultural policies of the previous period have begun to take effect. With the promotion of eco-friendly production methods and the widespread adoption of water-saving irrigation and precision fertilizer application technologies, agricultural production has been gradually shifting toward sustainability. In addition, the in-depth advancement of agricultural supply-side reform has prompted farmers to adopt resource-saving production methods and improve resource utilization efficiency. However, the slight fluctuation observed in 2021 suggests that the improvement of ECGP still faces challenges from the external environment, such as climate change and fluctuations in market demand. Nevertheless, the overall trend still indicates that the ECGP is moving in a stable and efficient direction (Li et al., 2022).
The seven regions of China may have significant differences in ECGP due to differences in geographic location, food production status, environmental factors and water resources (Liang and lv, 2019). Therefore, this study was organized to obtain the ECGP and its trends in the seven regions based on the above measurements, and the results are shown in Figure 5.
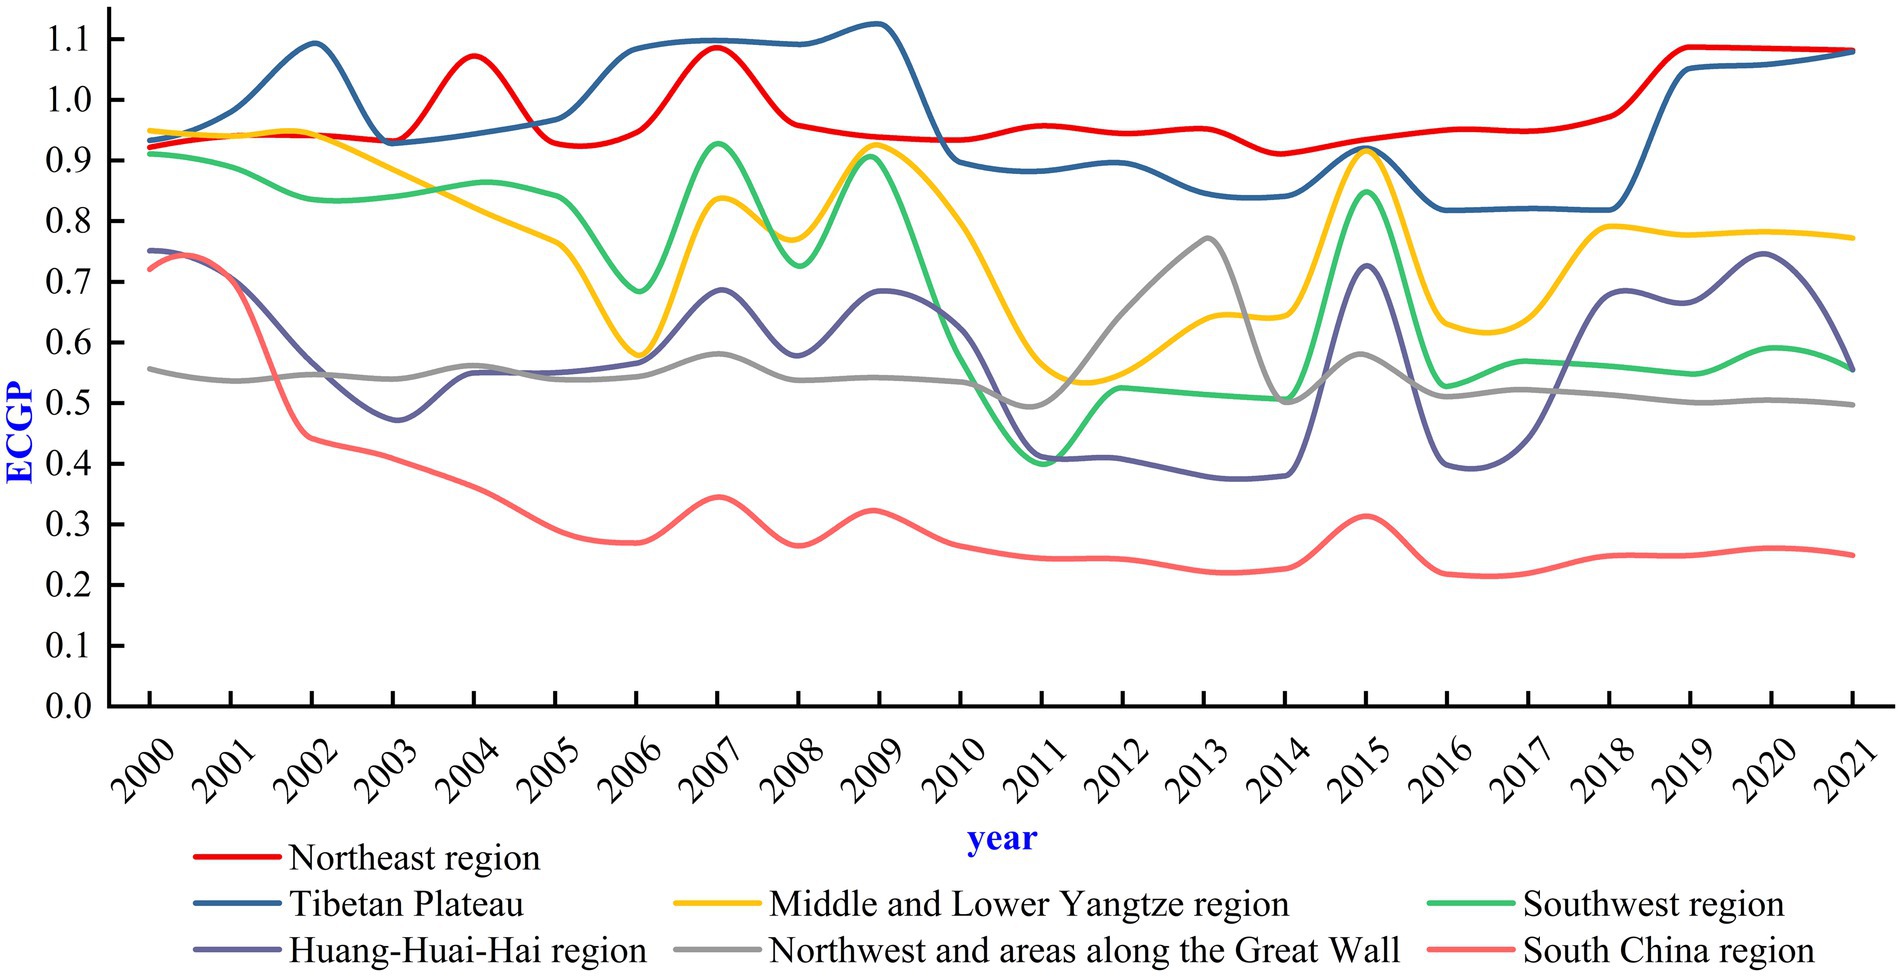
Figure 5. Variation of ECGP in China’s seven regions from 2000–2021 Data Source: Calculated using MaxDEA.
In terms of the level of ECGP in the seven regions, the South China region, the Northwest and areas along the Great Wall, and the Huang-Huai-Hai region are identified as areas with low ECGP. The Middle and Lower Yangtze region, Southwest region, and Tibetan Plateau are considered areas with medium ECGP. The Northeast region is identified as an area with high ECGP. Specifically:
The Northeast region has shown a significant improvement in its ECGP, with an overall efficiency increase of 17% over the 21 years. The high ECGP in the Northeast is mainly attributed to the favorable natural conditions, particularly the widespread black soil belt and relatively flat terrain, which provide abundant agricultural production resources. Additionally, the Northeast region has highly relied on agricultural mechanization in the past two decades, with its agricultural production model gradually shifting from traditional low-efficiency methods to intensive and mechanized production (Li, 2012), thus improving production efficiency and resource utilization. Furthermore, the impact of global warming has resulted in higher winter temperatures in the Northeast, with the climate zone shifting northward, significantly increasing accumulated temperatures. This has led to a substantial northward expansion of the planting areas for crops such as corn and rice. Coupled with the rise in temperature and increased heat resources, the planting area and total production in the Northeast region have greatly increased, further promoting the improvement of its ECGP.
Apart from the Northeast region, the ECGP in the other regions shows a declining trend. Among them, the South China region shows the most noticeable decrease in ECGP, which is closely related to the rapid urbanization process and land conversion in the region. Located mainly in the eastern coastal areas, South China is an important foreign trade gateway and economic development zone in China. With the expansion of cities, large areas of agricultural land have been converted to urban or industrial use, resulting in a significant reduction in the land available for agricultural production, thus lowering overall efficiency. At the same time, the region is frequently affected by natural disasters such as typhoons and heavy rainfall, which also significantly impact its ECGP.
Both the Southwest region and the Huang-Huai-Hai region show a certain decline in ECGP. The decline in the Southwest region’s ECGP is influenced by multiple factors, with land desertification being particularly prominent. The region’s complex terrain and relatively harsh climate conditions result in lower agricultural resource utilization efficiency. Additionally, due to water scarcity and an over-reliance on traditional agricultural methods, land degradation and increasing ecological pressure have posed significant challenges to the region’s agricultural sustainability (Fan et al., 2023). The decline in ECGP in the Huang-Huai-Hai region is closely related to the overconsumption of agricultural resources. Despite high food production in this region, the overuse of fertilizers and pesticides, as well as high-intensity agricultural activities, have led to soil degradation and the over-extraction of water resources, further hindering the improvement of ECGP.
In the Middle and Lower Yangtze region, despite having relatively good irrigation facilities and a mild climate, ECGP has also declined over the past 21 years. Although the region has a large-scale food production capacity, the over-reliance on fertilizers and pesticides has limited further improvements in ECGP. With the increasing use of fertilizers and pesticides, soil quality deteriorates, and the over-extraction of water resources places additional stress on the ecological environment. Despite the region’s good infrastructure and favorable climate conditions for agricultural production, there remains significant room for improvement in optimizing agricultural input structures and reducing environmental burdens.
Although the Northwest region shows relatively low ECGP, its changes have been relatively stable. The low ECGP in this region is closely related to its arid and semi-arid climate. The low level of agricultural mechanization has limited the potential for efficiency improvements, and climate change has further impacted agricultural production. Additionally, water scarcity and serious soil erosion problems have severely restricted the sustainable development of agriculture in this region.
In this section’s analysis, although the Tibetan Plateau has shown a certain upward trend in ECGP, it has not been analyzed in depth due to the region’s agricultural production being in a relatively early developmental stage. The ECGP improvements in this region rely more on ecological restoration and farmland irrigation measures rather than large-scale food production. These factors mean that the Tibetan Plateau does not occupy a central role in the overall discussion of agricultural production efficiency, and compared to other regions, it lacks more representative production models and typical problems. Therefore, this paper does not delve into its analysis.
3.3 Analysis of factors influencing ECGP
In this study, 10 factors were selected to analyze their relationship with ECGP. Since multicollinearity among explanatory variables may lead to inaccurate regression results. Therefore, the VIF method was employed to test for multicollinearity among the explanatory variables before conducting the Tobit regression analysis. The VIF statistic quantifies the extent to which the variance of a regression coefficient is inflated due to multicollinearity. Generally, a VIF value greater than 10 suggests a serious multicollinearity issue. The results (as shown in Table 5) indicate that the 10 selected explanatory variables exhibit no significant multicollinearity issues. Subsequently, the data were analyzed using Tobit regression in Stata 17, with the results presented in Table 6.
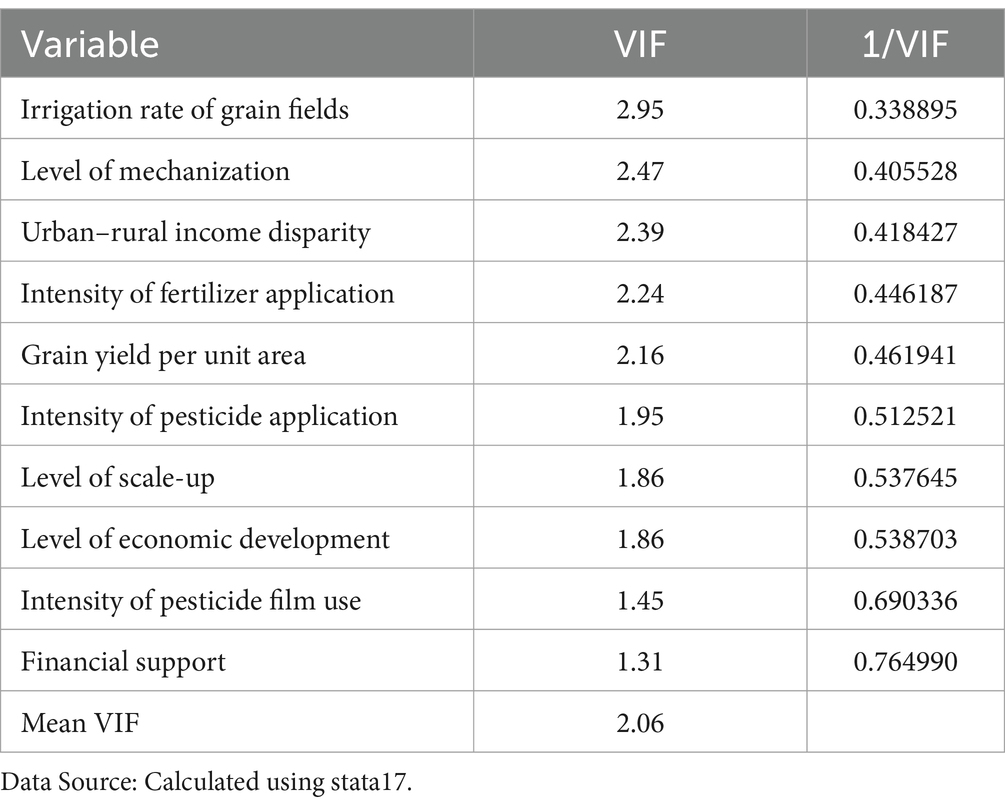
Table 5. VIF test results.
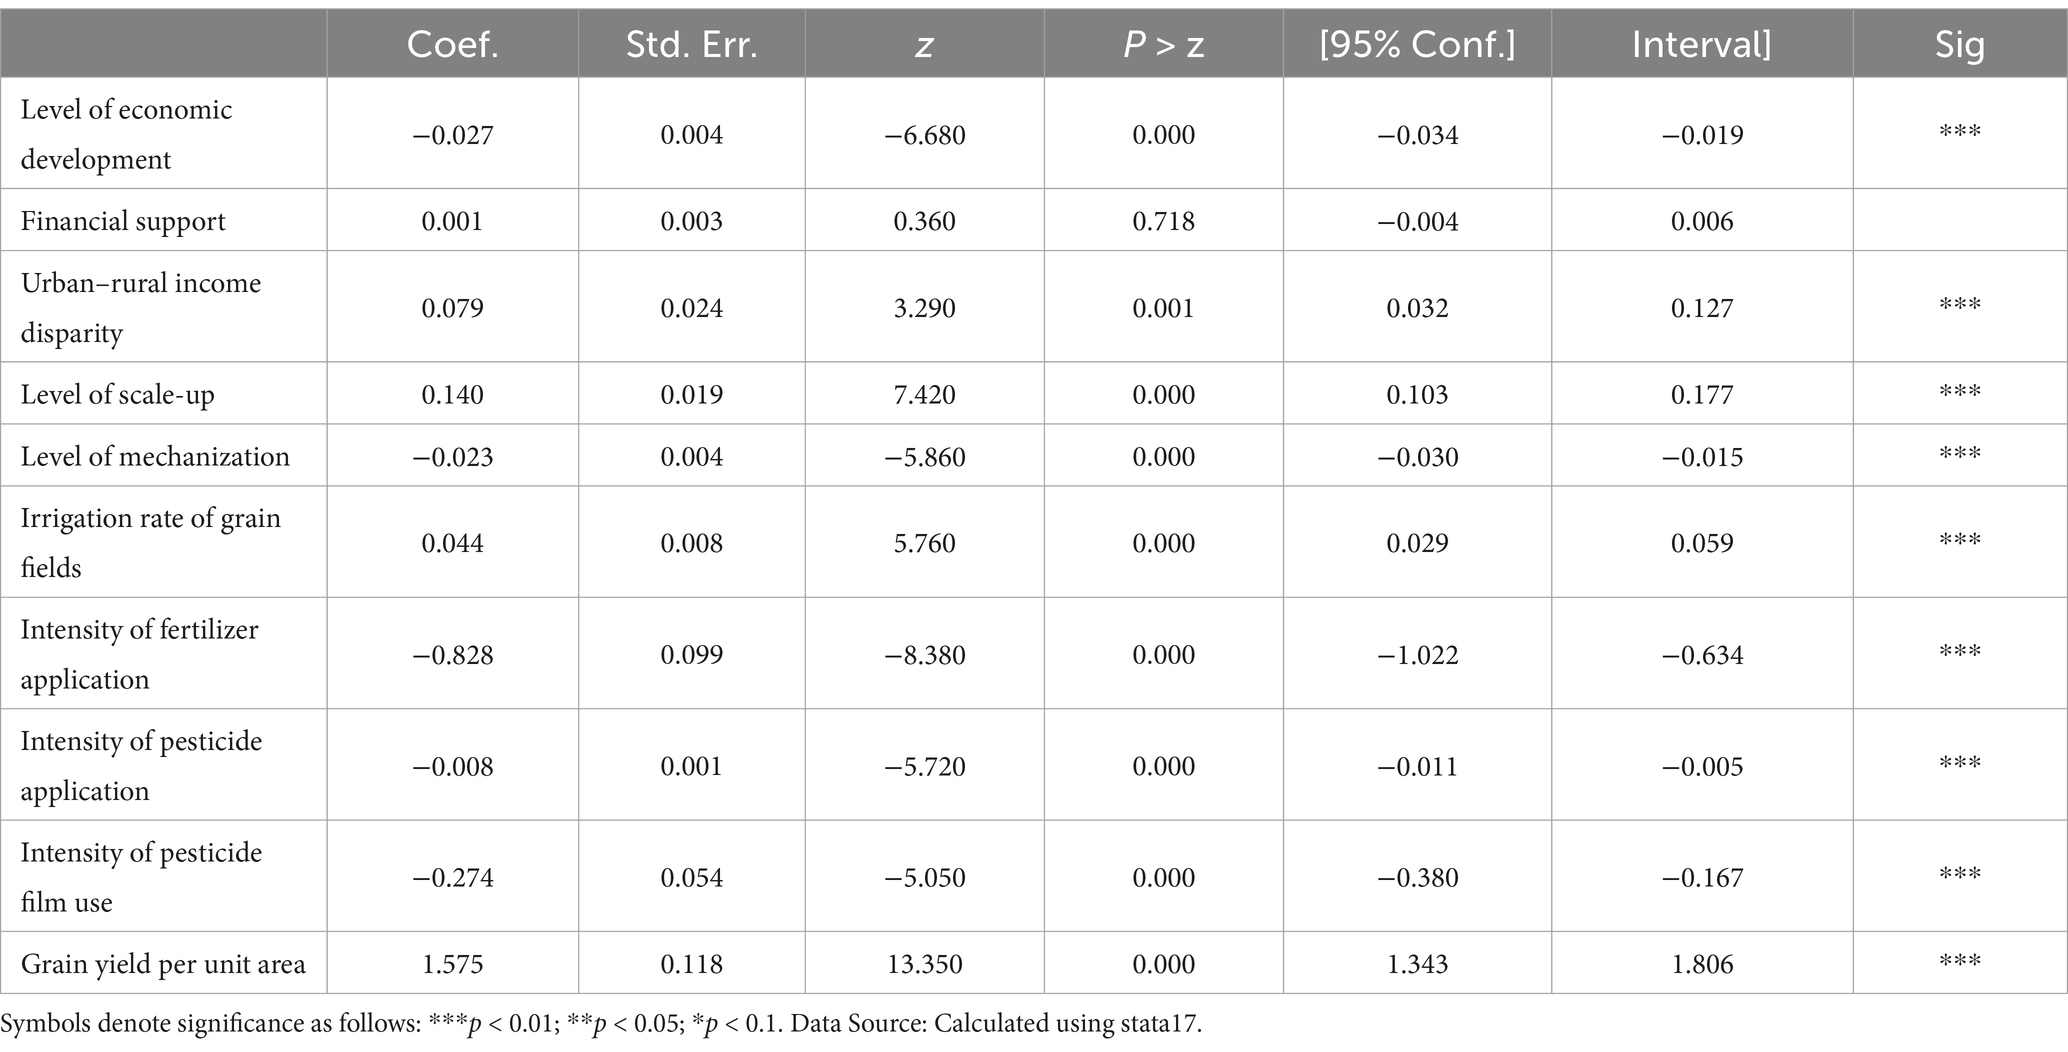
Table 6. Tobit empirical results.
The regression results show that the level of economic development is significantly negatively correlated with ECGP. As the economy develops, industrialization and urbanization accelerate, leading to a reduction in arable land and pressure on food production, which may also contribute to environmental pollution, affecting the ECGP. Fiscal support has a positive but not significant impact on ECGP, possibly because while fiscal support increases agricultural inputs and yield, the input–output ratio may not be ideal, or the efficiency of fiscal fund utilization is low. The urban–rural income disparity shows a positive relationship with ECGP, possibly because an increasing disparity may reduce labor costs in rural areas (Wang and Lin, 2021), thereby somewhat reducing the cost of food production and improving ECGP. The level of scale-up positively influences ECGP, which indicates that larger per capita sown areas among grain producers play a role in boosting ecological efficiency. The level of mechanization negatively affects ECGP at 1% level, meaning that an increase in mechanization levels actually results in a reduction in ecological efficiency, aligning with the findings of some scholars (Huan and Dai, 2023; Zhao and Zhou, 2020; Peng and Zhang, 2020). This may be because while increased mechanization in food production can enhance production efficiency, beyond a certain level, the incremental efficiency gains from further mechanization are less than the agricultural carbon emissions and pollution it causes, indicating that the level of mechanization in food production has exceeded a reasonable range or does not match its production scale (Xu et al., 2023). The irrigation rate of grain fields has a positive impact on ECGP, consistent with the effect prediction before empirical regression. Irrigation supplements the water resources necessary for food production, and a higher irrigation rate can better meet the growth needs of crops (Feng et al., 2021), thereby positively affecting ECGP. The intensity of fertilizer application negatively affects ECGP, likely because China’s fertilizer application intensity has exceeded a reasonable range. The excessive use of fertilizer increasingly diminishes its effect on increasing food yield but significantly increases undesired outputs, thus decreasing ecological efficiency. The intensity of pesticide application also negatively affects ecological efficiency, for reasons similar to those of fertilizer use; both have exceeded reasonable ranges, necessitating a reduction in pesticide application to decrease its intensity. The intensity of agricultural film use negatively impacts ECGP at the 1% significance level, possibly because the use of agricultural film does not significantly improve food yield but leads to certain undesired outputs, thus decreasing ecological efficiency. The grain yield per unit area positively influences ECGP, with a significance level of 1%, indicating that higher yields per unit of farmland signify increased efficiency in resource use, especially under conditions of limited water and land resources, effectively improving the overall ECGP.
4 Discussion
The WFGP shows a trend of fluctuating growth over time, with the WFGPgreen playing a dominant role, indicating that most farmlands rely on natural rainfall for irrigation. This is consistent with the conclusions of Vanham and Bidoglio (2013). Traditional water resource management methods focus only on the blue water part of the water cycle. However, Vanham (2012) and Falkenmark (2003) suggest incorporating green water into water management research. Berger et al. (2021) found that China’s total blue, green, and gray water footprints rank second globally, underlining the importance of exploring China’s water resources. Leng et al. (2020) discovered that despite China’s establishment of irrigation systems, efficiency remains low or undeveloped in some areas, leading to a continued significant dependence on natural rainfall. Additionally, this study found that the WFGPgrey continued to increase before 2010, during which grain production relied on high chemical inputs to boost yields, leading to increased water pollution loads. This is consistent with other studies (Chen et al., 2021; Cai et al., 2022), indicating that high-intensity agricultural production models are often accompanied by severe environmental costs. However, since the Chinese government launched the “Zero Growth Action Plan for Fertilizers and Pesticides” in 2015, the WFGPgrey has shown a clear downward trend, which is also confirmed by the research of Xu and Kong (Xu et al., 2022; Kong et al., 2022). The changes in ECGP reflect China’s gradual shift from an initial high-input, low-efficiency model toward a sustainable development model guided by green agriculture (Hou et al., 2021; Zhu and Li, 2023). An analysis of the ECGP in seven major regions showed that the South China region, the Northwest and areas along the Great Wall, and the Huang-Huai-Hai region had lower ecological efficiencies. Studies by Liu et al., Zhang and Li (2023) found issues such as water scarcity and land desertification in the Huang-Huai-Hai area (Liu et al., 2023; Zhu and Li, 2023), likely the main reasons for its lower ECGP. The Northeast region exhibited higher ecological efficiency, possibly due to its superior natural conditions, especially the fertile soil of the black earth region and a more concentrated mode of food production (Jin et al., 2023). The study further carried out a comprehensive analysis of the factors influencing ECGP. The level of economic development, the urban–rural income disparity, the level of scale-up, the irrigation rate of grain fields, and the grain yield per unit area had significant positive impacts on ECGP, whereas the level of mechanization, the intensity of fertilizer and pesticide application, and agricultural film usage exhibit negative effects on ECGP. These results indicate the need to balance improving grain production efficiency with ecological environmental protection to achieve sustainability in grain production (Gao et al., 2024).
Compared to traditional methods, the water footprint-based evaluation of ECGP is more suited to China’s specific national conditions and needs. It measures traditional production factors such as arable land and labor and pays special attention to water resource use efficiency. This is particularly important given the uneven distribution of water resources in China and the high water consumption in agriculture. Including WFGPgrey in the evaluation reflects the potential environmental burden of grain production, aiding in developing more environmentally friendly food production strategies. While this study offers innovation compared to existing research, it has limitations. Although the super-efficiency SBM model has significant advantages in evaluating technical efficiency, it has limitations in fully considering environmental indicators like the water footprint, especially in capturing and reflecting the diversity and complexity of environmental conditions in different regions. In addition, the resource consumption and environmental impacts of the food production process are highly complex and difficult to quantify comprehensively. Only a limited number of resource and environmental indicators were selected for analysis in this study, and thus, may not fully reflect all the impact factors. Future research should focus on optimizing the super-efficiency SBM model and incorporating more appropriate indicators to improve the analysis’s comprehensiveness and precision.
5 Conclusions and recommendations
This study calculates China’s WF using the CROPWAT model and evaluates the ECGP based on the WF, exploring the main factors affecting ECGP. The findings reveal that: (1) The WFGPgreen dominates China’s WFGP. Additionally, with population growth and increased food demand, the overall WFGP shows a trend of fluctuating growth. The WFGPgrey initially increased annually from 2000 to 2021, reaching a peak and then declining, particularly following the introduction of policies aimed at reducing pesticide and fertilizer use, which led to a substantial decrease in WFGPgrey. (2) Changes in ECGP from 2000 to 2021 reflect the country’s ongoing efforts to strike a balance between ensuring high yields and preserving the environment. These changes are divided into three phases: the high-level decline period, the adjustment period in the trough, and the rebound and stabilization period. The evolution of these three stages demonstrates a gradual transition from an initial high-input, low-efficiency model toward a sustainable development model guided by green agriculture. (3) The level of economic development, urban–rural income disparity, scale-up level, irrigation rate of grain fields, and grain yield per unit area positively influence ECGP, whereas the level of mechanization, intensity of fertilizer and pesticide application, and intensity of agricultural film use have a negative impact. While using agricultural inputs can enhance food yield, excessive or improper management may decrease ecological efficiency.
Based on the findings, this paper suggests: Firstly, in response to the varying water resource conditions across regions, efforts should be made to upgrade and improve the irrigation network to enhance agricultural water use efficiency. To this end, the government should increase investments in agricultural irrigation infrastructure, particularly in water-scarce regions such as the Northwest and Southwest, by promoting efficient water-saving technologies such as drip irrigation and strengthening the monitoring and scheduling of water resources. Furthermore, efforts should be made to enhance soil and water conservation and address pollution from agricultural water use. Secondly, it is essential to accelerate the promotion of green, low-carbon agricultural technologies and establish an ecological environment pollution monitoring system. The government should encourage farmers to adopt green agricultural technologies by providing financial support and technical training and setting up demonstration bases to improve the environmental sustainability and resource use efficiency of agricultural production. Additionally, a nationwide agricultural pollution monitoring platform should be established, focusing on fertilizer and pesticide use and agricultural waste management, to monitor in real-time and reduce the negative environmental impacts of agricultural production. Lastly, considering the regional differences in ECGP across China, it is crucial to respect the varying levels of efficiency in different regions and promote exchange and cooperation between regions. For example, the Northeast should continue to leverage its mechanization and resource advantages to promote efficient production, while South China and Southwest regions should focus on developing green agricultural technologies and ecological restoration to enhance their production efficiency. By strengthening cross-regional technological exchange and cooperation, the complementary use of resources and technologies can be promoted.
Data availability statement
Publicly available datasets were analyzed in this study. This data can be found at: http://www.nmic.cn/https://www.stats.gov.cn/sj/ndsj/.
Author contributions
LG: Conceptualization, Funding acquisition, Supervision, Validation, Visualization, Writing – review & editing. XD: Data curation, Investigation, Methodology, Software, Writing – original draft, Writing – review & editing. JY: Data curation, Methodology, Software, Writing – original draft.
Funding
The author(s) declare that financial support was received for the research and/or publication of this article. This work was supported by the Innovation Development Strategy Research Project of Jilin Provincial Department of Science and Technology (grant no. 20240701020FG).
Acknowledgments
We are grateful to the reviewers for their insightful comments and suggestions on this paper.
Conflict of interest
The authors declare that the research was conducted in the absence of any commercial or financial relationships that could be construed as a potential conflict of interest.
Generative AI statement
The authors declare that no Gen AI was used in the creation of this manuscript.
Publisher’s note
All claims expressed in this article are solely those of the authors and do not necessarily represent those of their affiliated organizations, or those of the publisher, the editors and the reviewers. Any product that may be evaluated in this article, or claim that may be made by its manufacturer, is not guaranteed or endorsed by the publisher.
Footnotes
1. ^The United Nations World Water Development Report 2024: water for prosperity and peace: https://unesdoc.unesco.org/ark:/48223/pf0000388948
2. ^World Bank data: https://data.worldbank.org/indicator/ER.H2O.FWAG.ZS
References
Allan, T. (2011). Virtual water: Tackling the threat to our planet's most precious resource. London, UK: Bloomsbury Publishing.
Baum, R., and Bieńkowski, J. (2020). Eco-efficiency in measuring the sustainable production of agricul-tural crops. Sustain. For. 12:1418. doi: 10.3390/su12041418
Berger, M., Campos, J., Carolli, M., Dantas, I., Forin, S., Kosatica, E., et al. (2021). Advancing the water footprint into an instrument to support achieving the SDGs–recommendations from the “water as a global resources”research initiative (GRoW). Water Resour. Manag. 35, 1291–1298. doi: 10.1007/s11269-021-02784-9
Bianchi, M., del Valle, I., and Tapia, C. (2020). Measuring eco-efficiency in European regions: evidence from a territorial perspective. J. Clean. Prod. 276:123246. doi: 10.1016/j.jclepro.2020.123246
Binam, J. N., Tonye, J., Nyambi, G., and Akoa, M. (2004). Factors affecting the technical efficiency among smallholder farmers in the slash and burn agriculture zone of Cameroon. Food Policy 29, 531–545. doi: 10.1016/j.foodpol.2004.07.013
Bravo-Ureta, B. E., Solís, D., Moreira López, V. H., Maripani, J. F., Thiam, A., and Rivas, T. (2007). Technical efficiency in farming: a meta-regression analysis. J. Prod. Anal. 27, 57–72. doi: 10.1007/s11123-006-0025-3
Cai, J. P., Xie, R., Wang, S. J., Deng, Y. P., and Sun, D. Q. (2022). Patterns and driving forces of the agricultural water footprint of Chinese cities. Sci. Total Environ. 843:156725. doi: 10.1016/j.scitotenv.2022.156725
Chen, J., Gao, Y. Y., Qian, H., Jia, H., and Zhang, Q. Y. (2021). Insights into water sustainability from a grey water footprint perspective in an irrigated region of the Yellow River Basin. J. Clean. Prod. 316:128329. doi: 10.1016/j.jclepro.2021.128329
Chen, X., Wang, P., Muhammad, T., Xu, Z., and Li, Y. (2020). Subsystem-level groundwater footprint assessment in North China plain–the world’s largest groundwater depression cone. Ecol. Indic. 117:106662. doi: 10.1016/j.ecolind.2020.106662
Cui, N. B., Wang, X. Y., and Yu, Z. (2021). Evaluation of cropland eco-efficiency and analysis of influenc-ing factors in the main grain producing areas of Northeast China. Ecol. Econ. 37, 104–110.
Dai, C., Qin, X. S., Lu, W. T., and Huang, Y. (2020). Assessing adaptation measures on agricultural water productivity under climate change: a case study of Huai River basin, China. Sci. Total Environ. 721:137777. doi: 10.1016/j.scitotenv.2020.137777
Deng, X. Z., and Gibson, J. (2019). Improving eco-efficiency for the sustainable agricultural production: a case study in Shandong, China. Technol. Forecast. Soc. Chang. 144, 394–400. doi: 10.1016/j.techfore.2018.01.027
Duan, H. P., Zhang, Y., and Zhao, J. B. (2011). Carbon footprint analysis of farmland ecosystems in China. J. Soil Water Conserv. 25, 203–208. doi: 10.13870/j.cnki.stbcxb.2011.05.020
Deng, X. J., Xie, S. Y., Qin, T., Sun, Z. B., and He, D. X. (2007). Evaluation of water resources utilization in Sichuan Province based on water footprint analysis. People’s Yangtze River. 2, 61–63. doi: 10.16232/j.cnki.1001-4179.2007.02.021
Falkenmark, M. (2003). Freshwater as shared between society and ecosystems: from divided ap-proaches to integrated challenges. Philos. Trans. R. Soc. Lond. B Biol. Sci. 358, 2037–2049. doi: 10.1098/rstb.2003.1386
Fan, X., and Chen, B. (2022). Spatio-temporal patterns and influencing factors of the water footprint grain crop production in the Sanjiang plain. J. Ecol. 42, 6368–6380.
Fan, Y. Y., Dong, J., and Cui, N. B. (2023). Food production security in Northeast China under resource and environmental constraints: conflicting goals and synergistic paths. Rural Econ. 3, 39–47.
Feng, Z. Y., Qin, T., Du, X. Z., Sheng, F., and Li, C. F. (2021). Effects of irrigation regime and rice variety on greenhouse gas emissions and grain yields from paddy fields in Central China. Agric. Water Manag. 250:106830. doi: 10.1016/j.agwat.2021.106830
Gao, P. Y., Long, G. Q., and Liu, S. X. (2024). Solidly promoting high-quality development and Accelerat-ing Chinese-style modernization--study and implementation of the Spirit of the central eco-nomic work conference. Econ. Res. 59, 4–35.
Garbelini, L. G., Debiasi, H., Junior, A. A. B., Franchini, J. C., Coelho, A. E., and Telles, T. S. (2022). Diversified crop rotations increase the yield and economic efficiency of grain production systems. Eur. J. Agron. 137:126528. doi: 10.1016/j.eja.2022.126528
Han, H. B., and Zhang, X. Y. (2020). Static and dynamic cultivated land use efficiency in China: a mini-mum distance to strong efficient frontier approach. J. Clean. Prod. 246:119002. doi: 10.1016/j.jclepro.2019.119002
Hou, M. Y., Deng, Y. J., and Yao, S. B. (2021). Rural labor transfer, fertilizer application intensity and agroecological efficiency: interaction effects and spatial spillovers. Agric. Technol. Econ. 10, 79–94. doi: 10.13246/j.cnki.jae.20210817.001
Hou, M. Y., and Yao, S. B. (2019). Convergence and divergence characteristics of agroecological effi-ciency in China under spatial perspective. China Popul. Resour. Environ. 29, 116–126.
Huan, M. L., and Dai, Y. (2023). Agricultural machinery services, technology introduction and technical efficiency of food production in China. Bus. Res. 2, 145–152. doi: 10.13902/j.cnki.syyj.2023.02.005
Huang, M., Zeng, L., Liu, C., Li, X., and Wang, H. (2022). Research on the eco-efficiency of rice production and its improvement path: a case study from China. Int. J. Environ. Res. Public Health 19:8645. doi: 10.3390/ijerph19148645
Jin, Y. R., Zhan, T. H., and Tang, Q. (2023). Characteristics of land use change and evaluation of ecologi-cal-sensitivity in the black soil belt of Northeast China. J. Soil Water Conserv. 37, 341–349. doi: 10.13870/j.cnki.stbcxb.2023.06.043
Khan, S. U., Cui, Y., Khan, A. A., Ali, M. A. S., Khan, A., Xia, X., et al. (2021). Tracking sustainable de-velopment efficiency with human-environmental system relationship: an application of DPSIR and super efficiency SBM model. Sci. Total Environ. 783:146959. doi: 10.1016/j.scitotenv.2021.146959
Kong, Y., He, W. J., Zhang, Z. F., Shen, J. Q., Yuan, L., Gao, X., et al. (2022). Spatial-temporal varia-tion and driving factors decomposition of agricultural grey water footprint in China. J. Environ. Manag. 318:115601. doi: 10.1016/j.jenvman.2022.115601
Kuang, B., Lu, X. H., Zhou, M., and Chen, D. L. (2020). Provincial cultivated land use efficiency in China: empirical analysis based on the SBM-DEA model with carbon emissions considered. Technol. Forecast. Soc. Chang. 151:119874. doi: 10.1016/j.techfore.2019.119874
Leng, J. W., Fu, Y. C., and Zhao, J. Y. (2020). Quantifying analysis of hydrological conditions dynamic alteration and its multiple influencing factors. IOP Conf. Ser. Earth Environ. Sci. 453:12008. doi: 10.1088/1755-1315/453/1/012008
Li, B. (2012). Has the “Lewis inflection point” of China's labor migration arrived? --based on the perspective of urban-rural gap changes. Contemp. Finance Econ. 12, 28–36.
Li, X., Gu, L. L., and Li, R. (2022). Evaluation of ecological efficiency of grain production in major grain-producing areas in China. Chin. J. Agric. Mech. Chem. 43, 205–213. doi: 10.13733/j.jcam.issn.2095-5553.2022.02.028
Li, J. H., Huang, Z. W., Zhou, L. F., Dai, Y. Y., and Yang, Y. (2024). A comparative study of the driving factors of water resources use efficiency in China’s agricultural and industrial sectors. Water 16:387. doi: 10.3390/w16030387
Li, H., Qin, L., and He, H. (2018). Characteristics of the water footprint of rice production under different rainfall years in Jilin Province, China. J. Sci. Food Agric. 98, 3001–3013. doi: 10.1002/jsfa.8799
Li, X. G., Xiao, P. N., Zhou, Y., Xu, J., and Wu, Q. (2022). The spatiotemporal evolution characteristics of cul-tivated land multifunction and its trade-off/synergy relationship in the two lake plains. Int. J. Environ. Res. Public Health 19:15040. doi: 10.3390/ijerph192215040
Li, B., and Zhang, J. B. (2012). Study on decoupling agricultural carbon emissions and economic devel-opment in China based on input perspective. Econ. Econ. 4, 27–31. doi: 10.15931/j.cnki.1006-1096.2012.04.004
Liang, Y. Y., and Lv, A. F. (2019). Risk assessment of water resources security in China. Resour. Sci. 41, 775–789.
Liu, C. M., Fan, G. Y., and Mao, G. X. (2023). Spatial and temporal changes in food production efficiency and influencing factors in the Huaihe River ecological and economic belt in the past 20 years. J. Nat. Resour. 38, 707–720.
Liu, H., Niu, G., Zhang, Q., Yang, Y., and Yao, H. (2022). Town-level aquatic environmental sensitivity as-sessment based on an improved ecological footprint model. Water Resour. Manag. 36, 763–777. doi: 10.1007/s11269-021-03058-0
Lu, Q. Y., Wang, S. J., and Meng, X. H. (2020, 2020). Measurement of eco-efficiency of food production in China based on SBM model and PS convergence test. Rural Econ. 12, 24–32.
Lu, D., Wang, Y. H., Yang, Q. Y., He, H. Y., and Su, K. Y. (2019). Exploring a moderate fallow scale of culti-vated land in China from the perspective of food security. Int. J. Environ. Res. Public Health 16:4329. doi: 10.3390/ijerph16224329
Luik, H., Seilenthal, J., and Värnik, R. (2009). Measuring the input-orientated technical efficiency of Es-tonian grain farms in 2005–2007. Food Econ. 6, 204–210. doi: 10.1080/16507541.2010.487658
Luo, J. Y., and Dong, M. (2023). Study on green efficiency of water use for grain production in Ningxia under the water footprint perspective--three-stage SBM-Malmquist index based on non-expected output. China Agric. Resour. Zoning 44, 67–77.
Ma, T. (2011). Assessment of the current status of agricultural carbon sources and analysis of the potential for increasing carbon sinks in Shanghai. Agric. Environ. Dev. 28, 38–41.
Mamiit, R. J., Gray, S., and Yanagida, J. (2021). Characterizing farm-level social relations’ influence on sustainable food production. J. Rural. Stud. 86, 566–577. doi: 10.1016/j.jrurstud.2021.07.014
Movilla-Pateiro, L., Mahou-Lago, X. M., Doval, M. I., and Simal-Gandara, J. (2021). Toward a sustainable metric and indicators for the goal of sustainability in agricultural and food production. Crit. Rev. Food Sci. Nutr. 61, 1108–1129. doi: 10.1080/10408398.2020.1754161
Pang, Y. Y., and Wang, X. J. (2020). Land-use efficiency in Shandong (China): empirical analysis based on a super-SBM model. Sustain. For. 12:10618. doi: 10.3390/su122410618
Peng, J., Liu, T., Chen, J., Li, Z., Ling, Y., De Wulf, A., et al. (2023). The conflicts of agricultural water supply and demand under climate change in a typical arid land watershed of Central Asia. J. Hydrol. 47:101384. doi: 10.1016/j.ejrh.2023.101384
Peng, C., and Zhang, C. (2020). Impact of agricultural mechanization on farmers' food production effi-ciency. J. South China Agric. Univ. 19, 93–102.
Qiu, G. J., Xing, X. N., Cong, G. Q., and Yang, X. Y. (2022). Measuring the cultivated land use efficiency in China: a super efficiency MinDS model approach. Int. J. Environ. Res. Public Health 20:583. doi: 10.3390/ijerph20010583
Song, J. F., and Chen, X. N. (2019). Eco-efficiency of grain production in China based on water footprints: a stochastic frontier approach. J. Clean. Prod. 236:117685. doi: 10.1016/j.jclepro.2019.11768
Sreeshna, T. R., Athira, P., and Soundharajan, B. (2024). Impact of climate change on regional water availability and demand for agricultural production: application of water footprint concept. Water Resour. Manag. 38, 3785–3817. doi: 10.1007/s11269-024-03839-3
Tone, K. (2001). A slacks-based measure of efficiency in data envelopment analysis. Eur. J. Oper. Res. 130, 498–509. doi: 10.1016/S0377-2217(99)00407-5
Van Asselt, E. D., Van Bussel, L. G. J., Van der Voet, H., Van der Heijden, G. W. A. M., Tromp, S. O., Rijgers-berg, H., et al. (2014). A protocol for evaluating the sustainability of Agri-food production systems—a case study on potato production in peri-urban agriculture in the nether-lands. Ecol. Indic. 43, 315–321. doi: 10.1016/j.ecolind.2014.02.027
Vanham, D. (2012). A holistic water balance of Austria–how does the quantitative proportion of urban water requirements relate to other users? Water Sci. Technol. 66, 549–555. doi: 10.2166/wst.2012.201
Vanham, D., and Bidoglio, G. (2013). A review on the indicator water footprint for the EU28. Ecol. Indic. 26, 61–75. doi: 10.1016/j.ecolind.2012.10.021
Vicente, J. R. (2004). Economic efficiency of agricultural production in Brazil. Rev. Econ. Sociol. Rural. 42, 201–222. doi: 10.1590/S0103-20032004000200002
Wang, J. Y., Fan, Y. F., Yang, Y., Zhang, L. Q., Zhang, Y., Li, S. X., et al. (2022). Spatial-temporal evolu-tion characteristics and driving force analysis of NDVI in the Minjiang River basin, China, from 2001 to 2020. Water 14:2923. doi: 10.3390/w14182923
Wang, X., and Li, X. (2018). Irrigation water availability and winter wheat abandonment in the North China plain (NCP): findings from a case study in Cangxian County of Hebei Province. Sustain. For. 10:354. doi: 10.3390/su10020354
Wang, S. Y., and Lin, Y. J. (2021). Spatial evolution of regional agroecological efficiency and its drivers in China - a water footprint and grey water footprint perspective. Geoscience 41, 290–301. doi: 10.13249/j.cnki.sgs.2021.02.012
Wang, G., Shi, R., Mi, L., and Hu, J. (2022). Agricultural eco-efficiency: challenges and progress. Sustainability 14:1051. doi: 10.3390/su14031051
Wang, B. Y., and Zhang, W. G. (2016). A study on the measurement of agroecological efficiency and spa-tial and temporal differences in China. China Popul. Resour. Environ. 26, 11–19.
Wang, B. Y., and Zhang, W. G. (2018). Interprovincial differences and influencing factors of China's agroecological efficiency - a panel data analysis based on 31 provinces from 1996 to 2015. China Rural Econ. 1, 46–62.
Wiebe, K. D., Soule, M. J., and Schimmelpfennig, D. E. (2001). Agricultural productivity for sustainable food security in sub-Saharan Africa. FAO Economic and Social Development Paper, pp. 55–74.
Wen, T. J., and Lu, H. (2024). Deepening the theoretical understanding of new quality productivity to promote agricultural and rural modernization. People’s Forum- Academic Frontier 10, 31–39. doi: 10.16619/j.cnki.rmltxsqy.2024.10.003
Xiang, H., Wang, Y. H., Huang, Q. Q., and Yang, Q. Y. (2020). How much is the eco-efficiency of agricultural production in West China? Evidence from the village level data. Int. J. Environ. Res. Public Health 17:4049. doi: 10.3390/ijerph17114049
Xiao, J., Wei, J., Wu, M., and Cao, X. (2022). Bibliometric and visual analysis of crop water footprint: a widely used agricultural water resources evaluation method. Water 14:2866. doi: 10.3390/w14182866
Xiao, P. N., Xu, J., Yu, Z. P., Qian, P., Lu, M. Y., and Ma, C. (2022). Spatiotemporal pattern differentiation and influencing factors of cultivated land use efficiency in Hubei Province under carbon emission constraints. Sustain. For. 14:7042. doi: 10.3390/su14127042
Xu, R. F., Shi, J. W., Hao, D. Q., Ding, Y., and Gao, J. Z. (2022). Research on temporal and spatial differentia-tion and impact paths of agricultural grey water footprints in the yellow river basin. Water 14:2759. doi: 10.3390/w14172759
Xu, Z. G., Wang, X. Y., and Zheng, X. Y. (2023). "double scale" and stability of land scale operation. J. Nanjing Agric. Univ. 23, 181–190. doi: 10.19714/j.cnki.1671-7465.2023.0016
Yang, H., Wang, X., and Bin, P. (2022). Agriculture carbon-emission reduction and changing factors be-hind agricultural eco-efficiency growth in China. J. Clean. Prod. 334:130193. doi: 10.1016/j.jclepro.2021.130193
Zeng, Y. T., Li, B., and Lv, Y. R. (2018). Regional differences in technical efficiency of grain production in China and its influencing factors - measurement based on stochastic frontier production function beyond logarithmic form. J. Hunan Agric. Univ. 19, 13–21+36. doi: 10.13331/j.cnki.jhau(ss).2018.06.003
Zeng, X. J., Ma, Y., Ren, J., and He, B. (2023). Assessing the network characteristics and structural effects of eco-efficiency: a case study in the urban agglomerations in the middle reaches of Yangtze River, China. Ecol. Indic. 150:110169. doi: 10.1016/j.ecolind.2023.110169
Zhang, D. S., and Li, J. S. (2023). Spatiotemporal evolution and convergence of food production eco-efficiency in the Yellow River Basin. Chin. J. Agric. Chem. 44, 272–280. doi: 10.13733/j.jcam.issn.2095-5553.2023.11.038
Zhao, D. D., and Zhou, H. (2020). Agricultural production agglomeration: how to improve the efficiency of food production--a re-examination based on different development paths. Agric. Technol. Econ. 8, 13–28. doi: 10.13246/j.cnki.jae.2020.08.002
Zhou, Y., Liu, Z. Y., Liu, S. D., Chen, M. C., Zhang, X. L., and Wang, Y. (2020). Analysis of industrial eco-efficiency and its influencing factors in China. Clean Techn. Environ. Policy 22, 2023–2038. doi: 10.1007/s10098-020-01943-7
Zhu, M. F., and Li, J. S. (2023). Evaluation of grain production eco-efficiency and analysis of driving fac-tors in Shandong Province--based on the dual perspectives of surface source pollution and carbon emission. Hubei Agric. Sci. 62, 197–205. doi: 10.14088/j.cnki.issn0439-8114.2023.07.033
Zhu, H. G., Weng, Z. L., and Kang, L. Y. (2010). Panel data modeling of factors affecting food input and output. Stat. Decis. Making 6, 118–120. doi: 10.13546/j.cnki.tjyjc.2010.06.019
Keywords: water footprint of grain production, eco-efficiency of grain production, gray water footprint of grain production, seven regions in China, super-efficient SBM model
Citation: Gu L, Dong X and Yin J (2025) Water footprint-based evaluation of ecological efficiency in China’s grain production and its driving factors. Front. Sustain. Food Syst. 9:1523721. doi: 10.3389/fsufs.2025.1523721
Edited by:
Xinchen Gu, China Institute of Water Resources and Hydropower Research, ChinaCopyright © 2025 Gu, Dong and Yin. This is an open-access article distributed under the terms of the Creative Commons Attribution License (CC BY). The use, distribution or reproduction in other forums is permitted, provided the original author(s) and the copyright owner(s) are credited and that the original publication in this journal is cited, in accordance with accepted academic practice. No use, distribution or reproduction is permitted which does not comply with these terms.
*Correspondence: Lili Gu, amxhdWxsZ3VAMTI2LmNvbQ==