 Babita Kudi1
 Sunita Kumari Meena
 Ajeet Kumar
 Vijay Singh Meena
- 1Department of Soil Science, Dr. Rajendra Prasad Central Agricultural University, Samastipur, Bihar, India
- 2Sugarcane Research Institute, Dr. Rajendra Prasad Central Agricultural University, Samastipur, Bihar, India
- 3ICAR-Indian Agricultural Research Institute, Regional Station, Samastipur, Bihar, India
- 4ICAR-Mahatma Gandhi Integrated Farming Research Institute, Motihari, Bihar, India
This study evaluates adaptive management in sugarcane cultivation through varied input strategies and legume integration. A total of 380 soil samples were collected across blocks at two depths (0–15 and 15–30 cm). Results showed that at 0–15 cm, oxidizable soil organic carbon (SOC) ranged from 3.19 to 8.01 g kg−1, and at 15–30 cm, it ranged from 2.50 to 6.90 g kg−1. The C indices showed a decreasing trend with depth. Total organic carbon (TOC) varied from 5.68 to 11.4 g kg−1 at 0–15 cm and from 3.85 to 11.4 g kg−1 at 15–30 cm. Permanganate-oxidizable carbon (KMnO4-C) ranged from 145 to 382 mg kg−1 at 0–15 cm and from 122 to 356 mg kg−1 at 15–30 cm. Carbon stock ranged from 12.6 to 25.9 Mg ha−1 at 0–15 cm, and from 10.2 to 24.5 Mg ha−1 at 15–30 cm. The active carbon pool decreased by 17.59%, the passive pool changed negligibly (0.22%) with depth; lability and recalcitrance indices showed carbon stability differences. Study offers key farm-level insights on carbon footprints and adaptive sugarcane management.
1 Introduction
Agricultural agroecological landscapes cover 37% of the Earth’s surface and contribute significantly to greenhouse gas (GHG) emissions (IPCC, 2006). Climate change poses a major challenge to sugarcane production, particularly in regions experiencing increased consecutive dry days, higher temperatures, and reduced precipitation (IPCC, 2021). Research by the International Sugar Organization (ISO, 2022) indicates that rising (+) temperatures and CO2 levels have varying effects on sugarcane yields. Additionally, agricultural management practices can exacerbate environmental pollution (Wakchaure et al., 2025; Yannopoulos et al., 2015). The agricultural sector contributes significantly to global greenhouse gas emissions, accounting for up to 52% of anthropogenic methane (CH₄) and 84% of nitrous oxide (N₂O) emissions (Wakchaure et al., 2025; Bonsucro, 2023). However, it also serves as a GHG sink through C-sequestration in agricultural landscapes (Lal, 2004; Hillier et al., 2009; Tubiello et al., 2014).
Global sugarcane production rose from 448 Mt. in 1961 to over 2 Bt by 2020, expanding from 8.9 to 27 Mha. The Americas and Asia account for 93% of output, with Brazil leading and India contributing 18.7% as the second-largest producer (OECD/FAO, 2019). The increasing demand for bio-ethanol, driven by its high energy balance and reduced GHG emissions, has intensified land use globally (Wakchaure et al., 2025; Cherubin et al., 2021). This intensification raises environmental sustainability concerns, such as soil quality degradation and ecosystem service impacts (do Amaral et al., 2008; Cherubin et al., 2016). India’s sugarcane production surpassed 500 million metric tons, with large shares used for sugar and ethanol, making it a top global producer and consumer (PIB, 2022).
In India, the expansion of sugarcane cultivation is becoming increasingly important to meet the rising global demand for biofuel production. However, this expansion must be supported by adaptive soil management practices to ensure agroecological stability. Achieving this goal requires regular monitoring of soil ecosystems, which is essential for maintaining a stable and sustainable environment for soil–plant interactions. Currently, sugarcane is cultivated on 5 Mha, with an average productivity of 68 tons per hectare and a sugar recovery rate of 10%.
Sugarcane cropping systems in India struggle with low technology adoption, poor ratoon management, policy gaps, and inefficient inputs. Solutions include best agronomic practices, supportive policies, balanced nutrients, better water use, farmer training, and integrated soil health indices for accurate impact assessment.
Sugarcane farming in Bihar, covering approximately 250,000 hectares, faces challenges in maintaining production stability (Kumar et al., 2023). Productivity has declined by 5.17%, from 55.17 t/ha in 2014–15 to approximately 50.0 t/ha currently. Factors such as poor germination, inadequate cultivation practices, waterlogging, poor ratoon management, substandard seed quality, insufficient irrigation, and the neglect of plant protection measures collectively contribute to low productivity in sugarcane cultivation. A significant issue is the incorrect and imbalanced use of chemical fertilizers, primarily nitrogenous ones, which adversely affect the ecosystem through nutrient loss via leaching, runoff, and volatilization, reducing nutrient use efficiency. Additionally, the lack of organic manure application depletes soil organic matter and deteriorates soil physical conditions.
The long-term stability of agricultural production systems is closely tied to soil quality and health, necessitating effective assessment and monitoring (Brejda et al., 2000; Karlen et al., 1997). Adaptive management practices significantly influence landscape sustainability (Islam and Weil, 2000; Rezapour and Samadi, 2012). Current research aims to develop multi-parametric indicators for soil productivity and environmental health (Wakchaure et al., 2025). Despite advancements, monitoring carbon footprint remains complex due to varied agricultural landscapes (Hanson et al., 2025; Ozlu et al., 2022; De la Rosa and Sobral, 2008). Most research has focused on temperate soils, with limited data on calcareous soils in semi-arid areas (Bouma, 1989; Knoepp and Swank, 1997).
Integrating soil health indices with carbon footprint analysis is crucial for addressing climate change. Practices that degrade ecosystems often increase GHG emissions, exacerbating climate change (Lal, 2004; Smith et al., 2008). Conversely, improving soil health through sustainable practices can enhance C-sequestration, mitigate GHG emissions, and promote climate resilience (Lal, 2004). Therefore, developing comprehensive soil quality indices in relation to carbon footprints and climate change is vital for sustainable agriculture (Tubiello et al., 2014).
Despite growing interest in sustainable sugarcane production, research gaps remain on how organic inputs and diverse cropping affect soil carbon and carbon footprint, especially in calcareous soils of semi-arid to sub-tropical South Asia. Most studies focus on temperate zones, with limited field data from this key region where sugarcane supports food and biofuel security. This study hypothesizes that the integration of organic amendments and legume-based crop diversification in sugarcane systems will enhance soil carbon sequestration, improve soil carbon pool dynamics, and stabilize carbon through improved lability and recalcitrance indices. Accordingly, the objectives are (i) to assess the impact of varying organic inputs on C-dynamics, C-stock, and C-pools and (ii) to evaluate the effect of incorporating legumes into sugarcane cropping sequences on soil organic carbon (SOC) fractions, lability, and recalcitrance indices. By addressing these objectives, the study contributes to closing the knowledge gap in carbon footprint analysis under tropical farming systems and supports the global agenda of climate-resilient, low-emission agricultural practices.
2 Materials and methods
2.1 Sampling site
The study was structured as a multi-location farmers’ field trial focused on different sugarcane cropping sequences (Supplementary Table 1). The research location is an important agricultural zone within the North West Alluvial Plain Zone, characterized by a semi-arid to sub-tropical climate. Agro-climatic Zone-IV (as defined by the planning commission, now NITI Ayog), known as the “Middle Gangatic Plains Region,” encompasses the entire state of Bihar, including the district of Samastipur (Figure 1). The soils of Samastipur, Bihar, are primarily alluvial in nature, classified as Entisols and Inceptisols. They have a loamy to clay-loam texture, moderate fertility, and slightly acidic to neutral pH, making them well-suited for crop cultivation. The location has a sub-tropical, semi-arid climate according to the Köppen-Geiger classification, characterized by an average annual temperature of 25.2 °C and annual rainfall of 1,236 mm (Figure 2). Summers are hot, winters are cool, and there is moderate rainfall, with the driest month being November and the highest precipitation occurring in July. The sugarcane field, managed by local farmers under Magadh Sugar and Energy Ltd., Hasanpur (Bihar), India (25.710118, 86.19065), follows standard procedures: fertilization, weed control, pest management, and leaf removal.
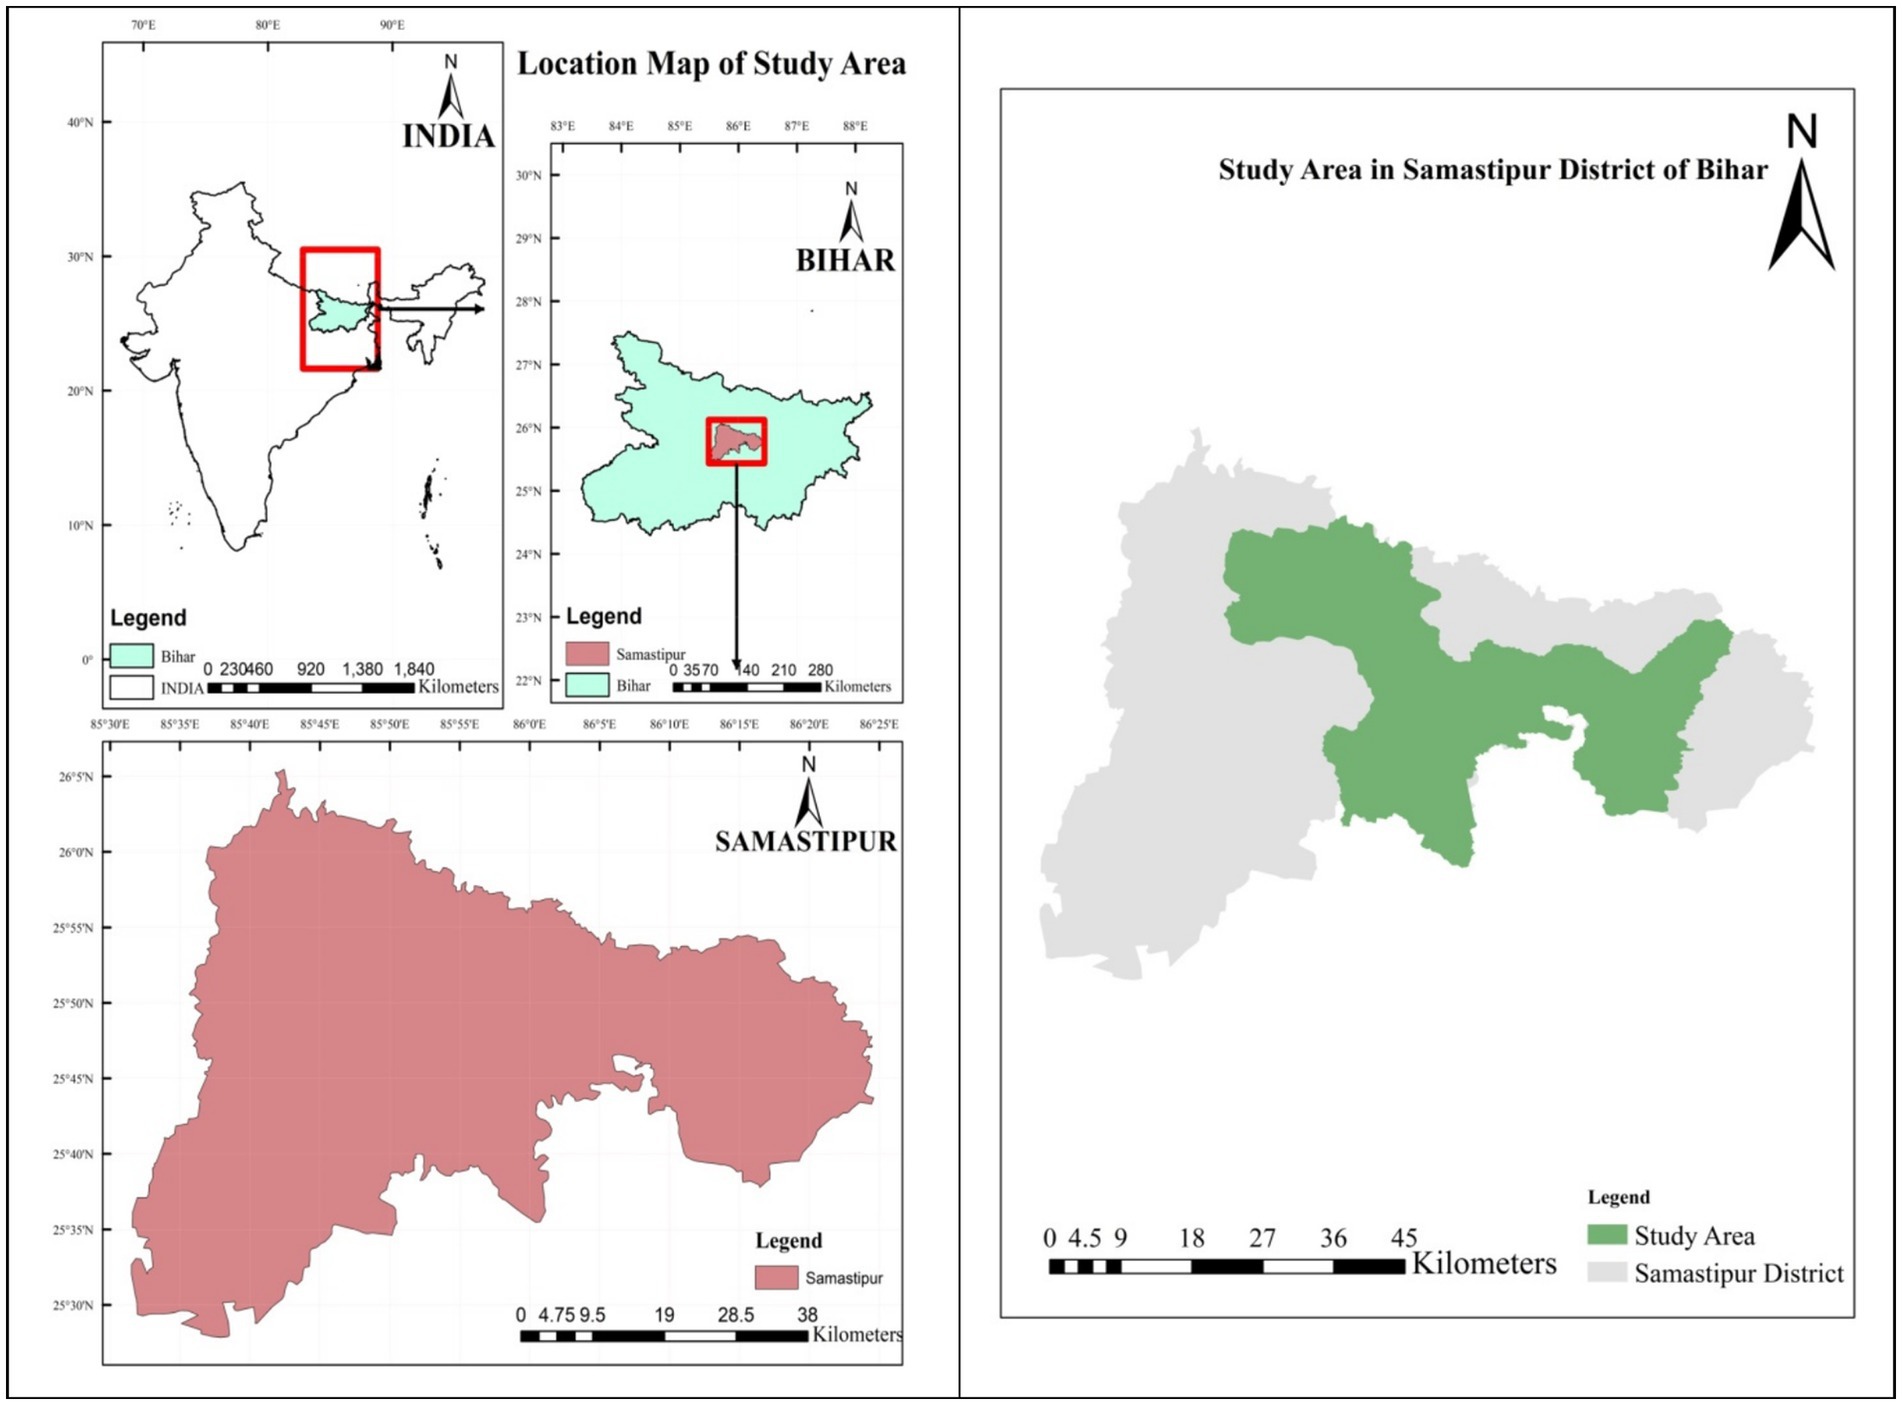
Figure 1. Map of the study area of Samastipur (25.7471° N, 85.8896° E), Bihar, India.
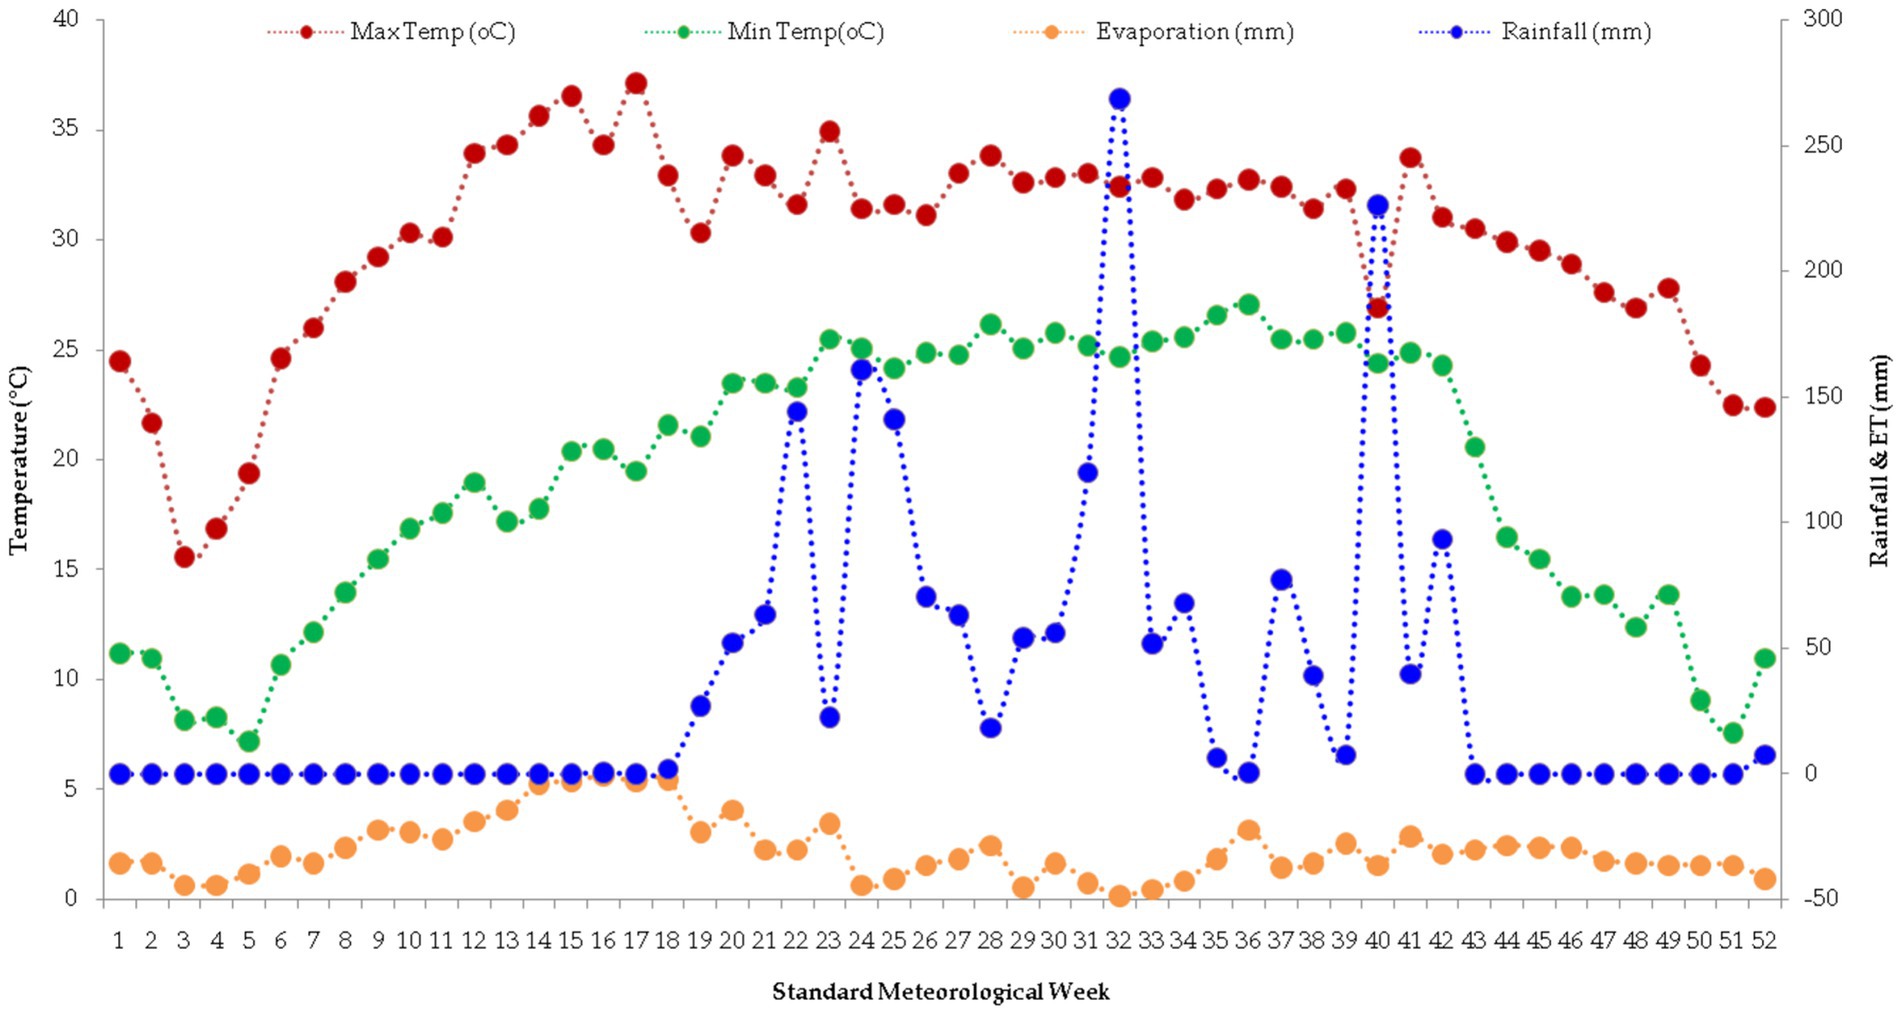
Figure 2. Trends in maximum and minimum temperature, evapotranspiration, and rainfall during the sugarcane growing period in Samastipur, Bihar, India.
2.2 Site details
A total of 380 individual soil samples were combined into 38 composite samples (each comprised 10 individual soil samples) collected from Hasanpur (18), Rosera (08), Warisnagar (05), Bibhutipur (04), and Khanpur (03) blocks in the agricultural landscape of Samastipur. Soil sampling was conducted at various farmers’ fields within these blocks, covering two (0–15 and 15–30 cm) soil depths. Sampling sites within each field were randomly selected to ensure comprehensive coverage of soil variability (Figure 3).
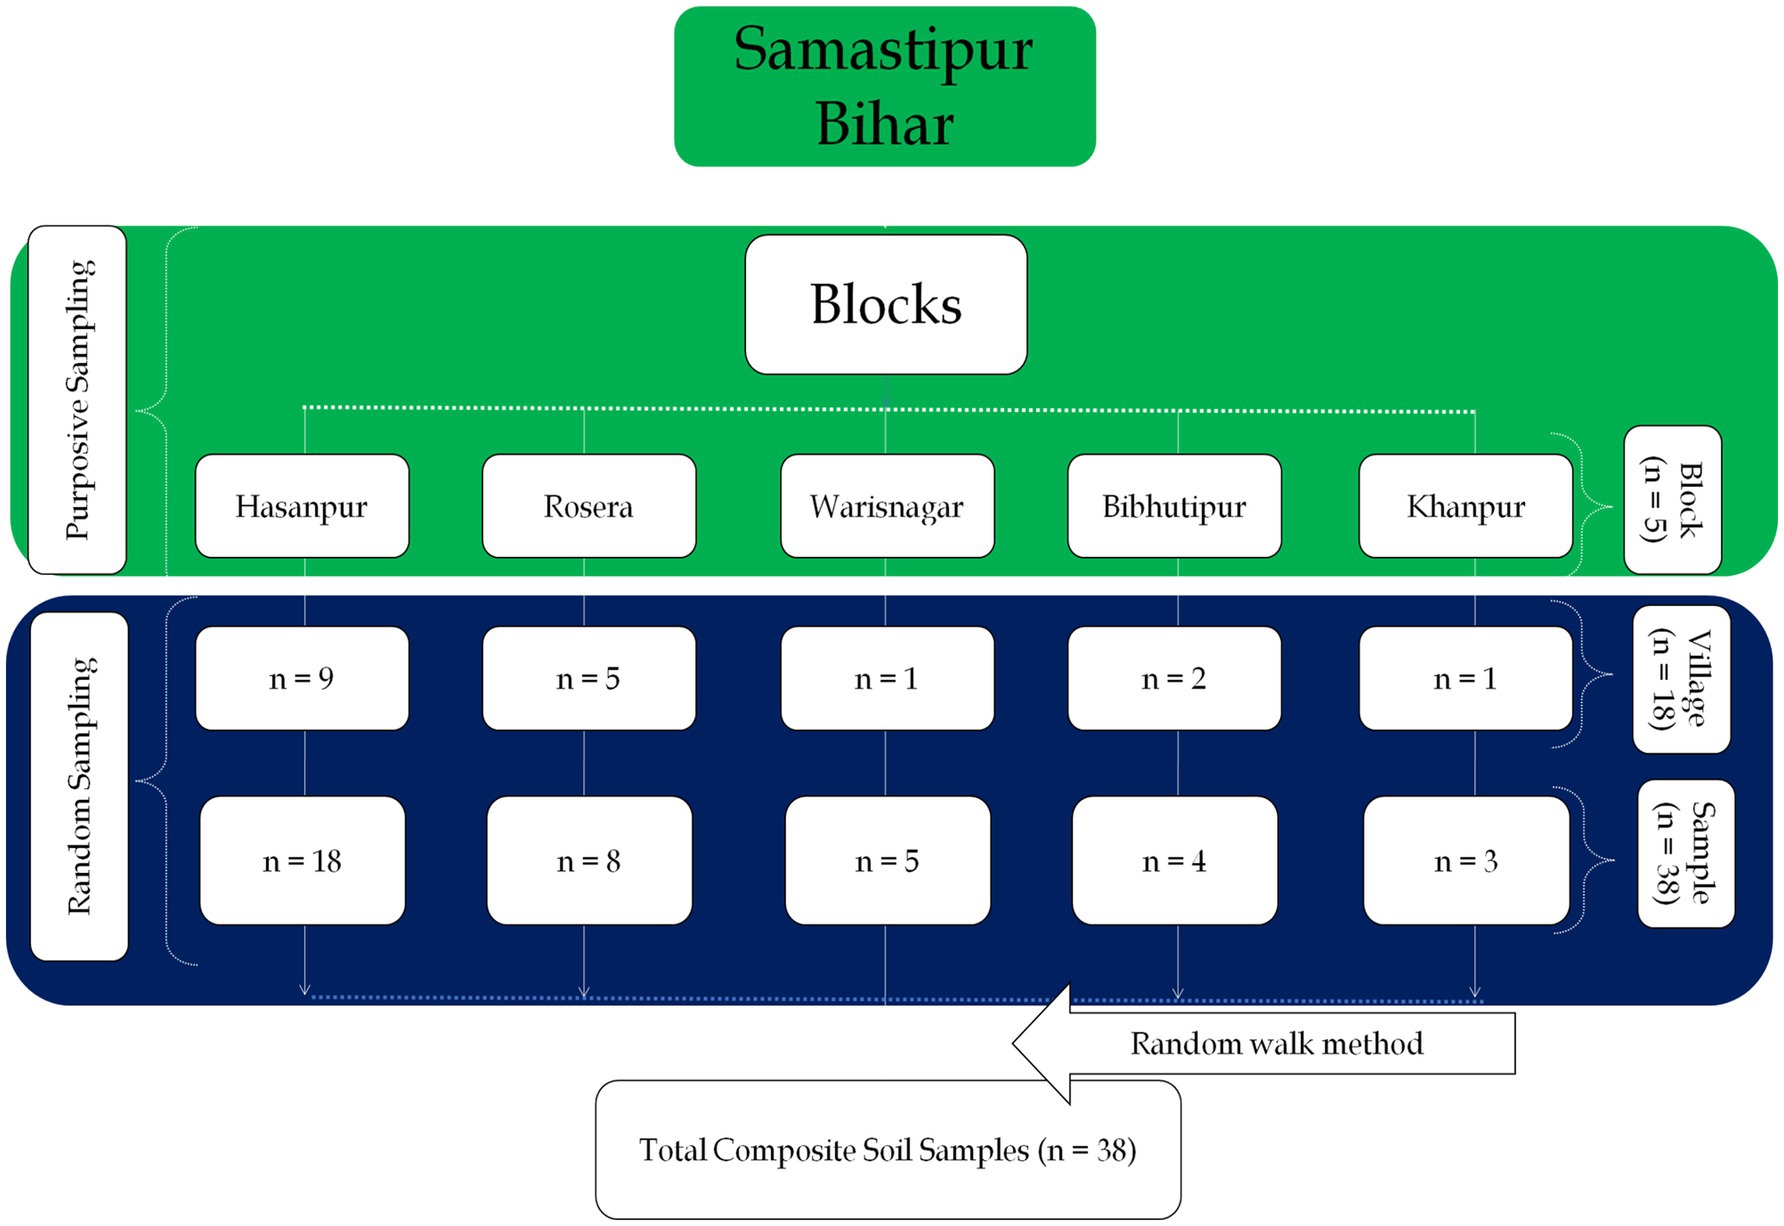
Figure 3. Description of sampling method.
2.3 Carbon pools
Oxidizable organic carbon was estimated by titration (Walkley and Black, 1934; Jackson, 1973), and its various fractions (labile and non-labile) were determined using a modified Walkley and Black method (Chan, 2001). For total organic carbon (TOC) determination, 0.25 g of the soil sample was mixed with 20 mL of 0.4 N chromic acid solution, heated at 155–160 °C for 20–25 min, and then cooled to room temperature (Jackson, 1973). Active carbon was estimated by quantifying potassium permanganate (KMnO4) oxidation with a spectrophotometer (Weil et al., 2003). Carbon stock and its active/passive pools were estimated (Equations 1–3), while lability and recalcitrance indices were calculated as per Datta et al. (2015) (Equations 4–6).
where, SOC = soil organic carbon; TOC = total organic carbon; BD = bulk density; D = depth of soil
where, CAP = carbon active pool; VLC = very labile carbon; LC = labile carbon
where,
CPP = carbon passive pool; LLC = less labile carbon; NLC = non-labile carbon
where,
LI = lability index; VLC = very labile carbon; LC = labile carbon; LLC = less labile carbon; TOC = total organic carbon; NLC = non-labile carbon; RI = recalcitrance index.
2.4 Statistical analysis
The study was structured as a multi-location farmers’ field trial, where ongoing demonstrations served as replications across different sugarcane-based cropping sequences. Data were collected over cropping years in the North West Alluvial Plain Zone of Bihar. Descriptive statistics for various soil and crop parameters were generated using IBM SPSS (v26). Location maps of the study sites were prepared in ArcGIS 10.8.2. To evaluate multi-location effects, analysis of variance (ANOVA) was performed. Replication and multi-location effects (treatment) effects across the experimentation were modeled as random factors, and variance components were estimated using Restricted Maximum Likelihood (REML). Degrees of freedom were adjusted using the Satterthwaite approximation to improve accuracy. Treatment means were compared using the critical difference (CD) test at the 5% significance level (p ≤ 0.05), and standard errors (SE) were calculated for all comparisons. For transparency, F-values, degrees of freedom, p-values, and effect sizes (95% CI) are reported in the results.
3 Results and discussion
3.1 Oxidizable organic carbon
The data revealed significant variation in oxidizable SOC content across different soil depths within the studied agricultural landscape (Table 1). At a depth of 0–15 cm, mean SOC content was 5.23 g kg−1. It ranged from 3.17 to 8.01 g kg−1, and exhibited a slight positive skewness (0.30) and leptokurtic distribution (kurtosis = 0.73). In contrast, at a deeper soil depth of 15–30 cm, the mean SOC content decreased (4.56 g kg−1), and it ranged from 2.50 to 6.90 g kg−1, with skewness (0.19) and lower kurtosis (0.33). Overall, the SOC content decreased (12.8%) at 15–30 cm depth. SOC content decreased with increasing soil depth, indicating a clear vertical gradient in its distribution. This pattern is critical for understanding nutrient dynamics and assessing soil health in agricultural ecosystems (Table 1). Continuous addition of above-ground biomass and decaying roots significantly influences C-levels. Research by Dotaniya et al. (2014) highlighted that organic amendments enhance C-content and stimulate microbial activity. The observed slight increase in integration of organic manure (OM) and mineral fertilizer application can be attributed to improved crop growth and higher yield, leading to increased residue and root exudate inputs that decompose and enrich the SOC. Similar findings have been reported by More et al. (2007), Bokhtiar et al. (2008), Jha et al. (2017), Sinha et al. (2017a), and Mthimkhulu et al. (2016), reinforcing the positive impact of organic inputs on soil fertility and C-dynamics.
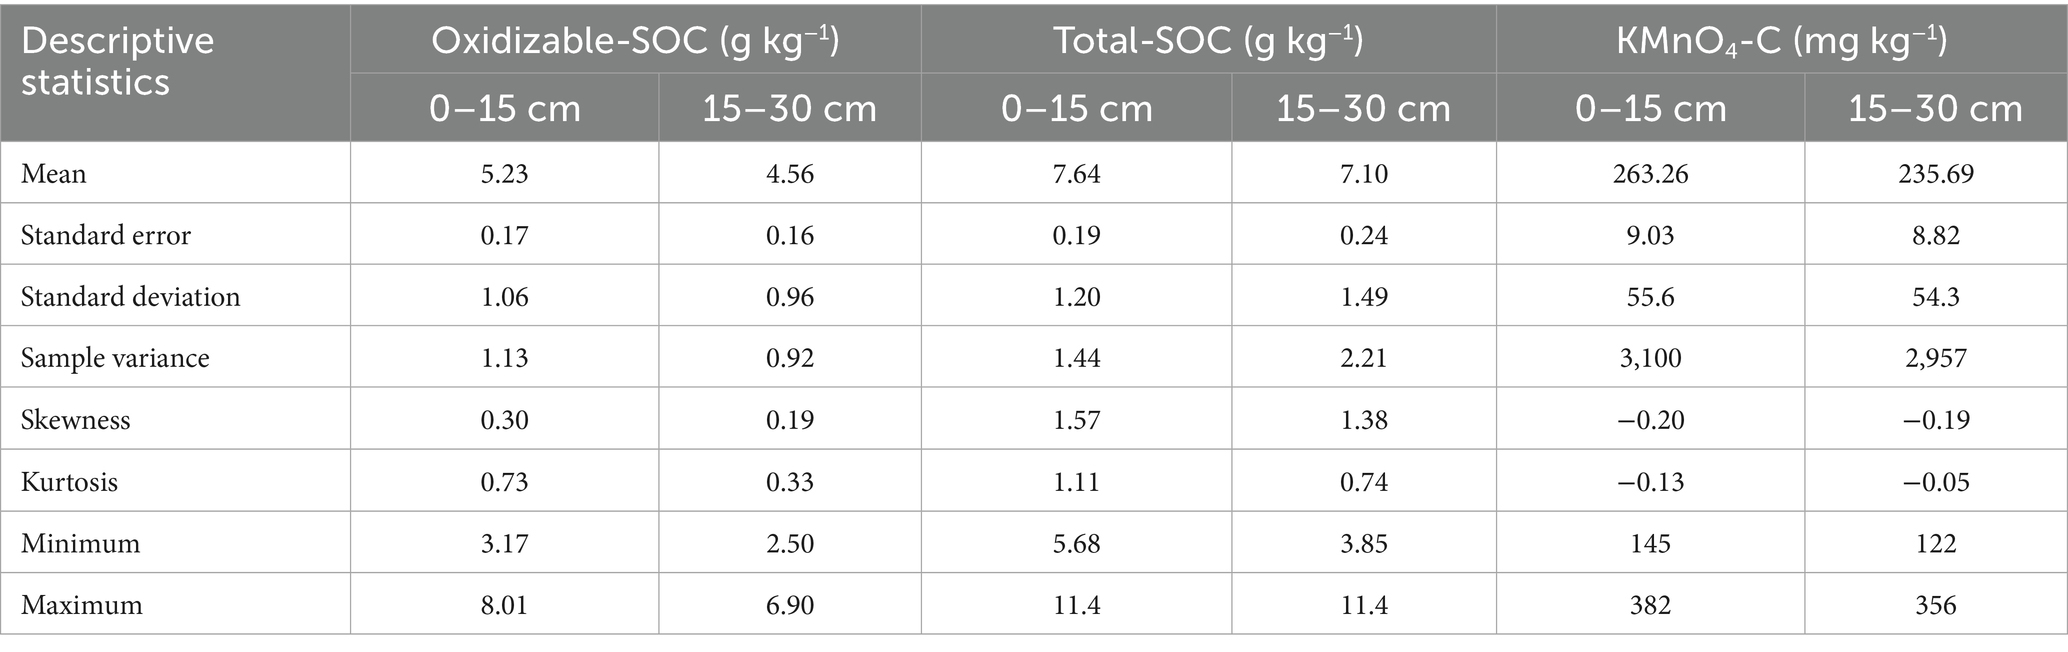
Table 1. Descriptive statistics of oxidizable, total, and KMnO4-C of sugarcane growing area.
3.2 Total organic carbon
Data showed that the mean TOC content was 7.64 g kg−1. It ranged from 5.68 to 11.4 g kg−1, showing a positively skewed distribution (skewness = 1.57) and slightly leptokurtic shape (kurtosis = 1.11) at 0–15 cm. Meanwhile, at 15–30 cm, the mean SOC content decreased to 7.10 g kg−1 and ranged from 3.85–11.4 g kg−1, exhibiting a similar positively skewed distribution (skewness = 1.38) and lower kurtosis (kurtosis = 0.74) compared to the 0–15 cm depth. A 7.1% decline in mean TOC content was observed at the 15–30 cm soil depth (Table 1). Understanding the factors influencing variations in TOC levels, such as land use practices, soil management strategies, and climatic conditions, is crucial for optimizing sustainable agricultural practices and C-sequestration. OM application to soil, as observed with SOC, plays a significant role in enhancing C-content. This phenomenon is supported by findings in the literature (Dotaniya et al., 2014; More et al., 2007; Bokhtiar et al., 2008; Jha et al., 2017; Sinha et al., 2017b; Mthimkhulu et al., 2016), which highlight the positive impact of organic inputs on C-dynamics. By elucidating these relationships, researchers can better formulate strategies to enhance SOC levels and improve soil health, thereby contributing to broader environmental sustainability goals (Table 1).
3.3 KMnO4-C
Results showed that KMnO4-C content in the soil varied between depths in the agricultural landscape (Table 1). At 0–15 cm, the mean KMnO4-C content was 263.26 mg kg−1, and it ranged from 145 to 382 mg kg−1, showing a negatively skewed distribution (skewness = −0.20) and platykurtic shape (kurtosis = −0.13). While at 15–30 cm, the mean KMnO4-C content decreased to 235.69 mg kg−1 and ranged from 122 to 356 mg kg−1, displaying similar skewness (skewness = −0.19) and kurtosis (kurtosis = −0.05) compared to the 0–15 cm depth (Table 1). The variation in the soil depth was 10.5%. This observed decline in KMnO4-C levels with increasing soil depth suggests a gradient in C-availability that is pivotal for understanding SOC dynamics and nutrient cycling in agricultural systems. Further exploration of factors influencing KMnO4-C, such as management practices and soil physical properties, is essential to optimize C-sequestration and enhance soil health strategies. Higher KMnO4-C in the 0–15 cm layer may be attributed to enhanced root biomass, rhizodeposition, and microbial activity. Monitoring labile organic matter fractions offers a sensitive and effective approach for evaluating soil quality dynamics (Needelman et al., 1999; Ding et al., 2006; Benbi et al., 2015; Meena et al., 2021).
3.4 Very labile carbon and labile carbon
Data showed that a significant variation was found in VL-C and L-C content across different depths within the agricultural landscape (Table 2). At 0–15 cm, the mean C-VL content was 1.56 g kg−1 and ranged from 1.02 to 2.60 g kg−1, showing a positively skewed distribution (skewness = 0.63) and platykurtic shape (kurtosis = −0.58). However, at 15–30 cm, the mean C-VL content decreased to 1.31 g kg−1, and ranged from 0.90 to 1.98 g kg−1, exhibiting a similar positively skewed distribution (skewness = 0.68) and slightly lower kurtosis (kurtosis = −0.31) compared to the 0–15 cm depth. The decline in mean C-VL content from 0–15 cm to 15–30 cm depth was 16% (Table 2).
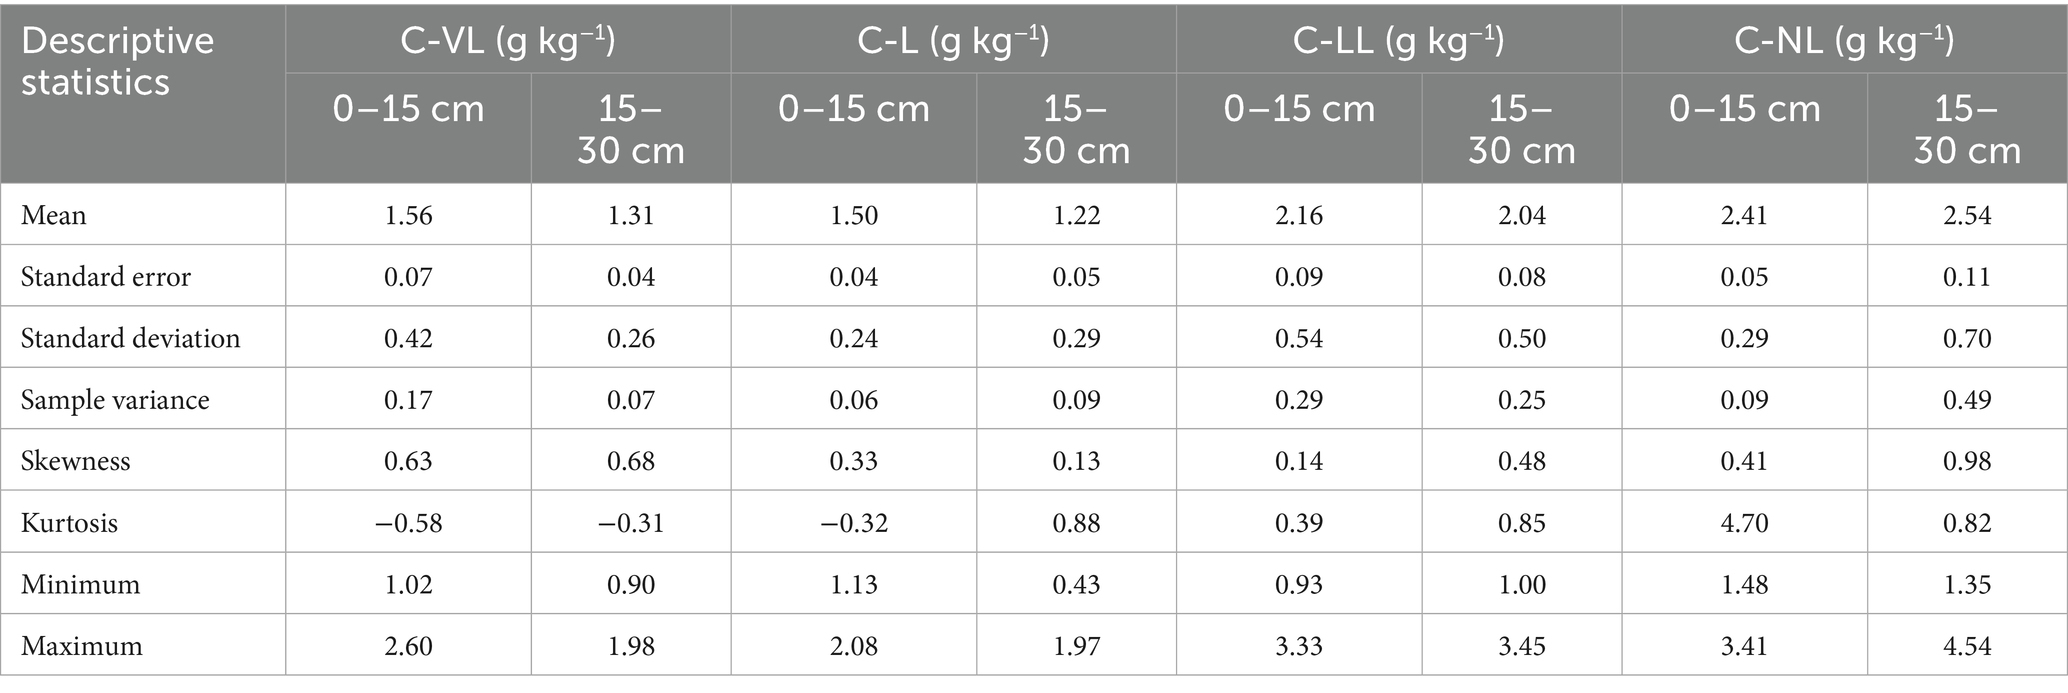
Table 2. Descriptive statistics of various carbon fractions of sugarcane growing area.
Meanwhile, C-L in the soil showed variations across different depths (Table 2). At 0–15 cm, the mean C-L content was 1.50 g kg−1 and ranged from 1.13 to 2.08 g kg−1, showing a positively skewed distribution (skewness = 0.33) and slightly platykurtic shape (kurtosis = −0.32). In contrast, at 15–30 cm, the mean C-L content decreased to 1.22 g kg−1 and ranged from 0.43 to 1.97 g kg−1, exhibiting a similar positively skewed distribution (skewness = 0.13) and leptokurtic shape (kurtosis = 0.88) compared to the 0–15 cm depth. The decrease in mean C-L content from 0–15 cm to 15–30 cm depth was approximately 18.7% (Table 2). These higher VL-C and L-C contents signify enhanced microbial activity and OM turnover (Meena et al., 2018; Meena et al., 2021). Monitoring these fractions provides insights into the responsiveness of soil carbon pools to management practices, facilitating sustainable agricultural strategies aimed at enhancing soil health and C-sequestration efforts (Table 2). Integrated studies on sugarcane highlight that sustainable trash management (Gadge et al., 2017; Shanthy et al., 2020), conservation tillage (de Oliveira et al., 2022; Turmel et al., 2015), and optimized fertigation (Ravikumar et al., 2011) are key to enhancing productivity, improving soil health, and ensuring long-term ecological balance.
3.5 Less labile carbon and non-labile carbon
Results showed that less labile carbon (LL-C) content at 0–15 cm soil layer ranged from 0.93–3.33 g kg−1, with a mean value (2.16 g kg−1), showing a slightly positively skewed distribution (skewness = 0.14) and mesokurtic shape (kurtosis = 0.39). At 15–30 cm, the mean LL-C content slightly decreased to 2.04 g kg−1 and ranged from 1.00–3.45 g kg−1, exhibiting a similar positively skewed distribution (skewness = 0.48) and higher kurtosis (kurtosis = 0.85) compared to the 0–15 cm depth. The slight decrease in mean LL-C content from 0–15 cm to 15–30 cm depth was approximately 5.6% (Table 2).
Meanwhile, in the case of NL-C at 0–15 cm, the mean was 2.41 g kg−1 and ranged from 1.48 to 3.41 g kg−1, showing a positively skewed distribution (skewness = 0.41) and a highly leptokurtic shape (kurtosis = 4.70). At 15–30 cm, the mean NL-C content slightly increased to 2.54 g kg−1, ranging from 1.35–4.54 g kg−1, exhibiting a similar positively skewed distribution (skewness = 0.98) and lower kurtosis (kurtosis = 0.82) compared to the 0–15 cm depth. The slight increase in mean NL-C content from 0–15 cm to 15–30 cm depth was 5.4% (Table 2). Sugarcane trash, being less prone to microbial decomposition, tends to accumulate as passive SOC over time. This phenomenon underscores the role of agricultural practices in influencing C-dynamics, where annual additions of sugarcane trash to the surface layer may enhance the active C-fraction compared to the deeper layer. Crop residues support microbial proliferation, which in turn stimulates nutrient cycling and enhances soil fertility (Ensinas et al., 2015; Mir et al., 2023). Additionally, Majumder et al. (2008) support the idea that management options influence the balance between C-inputs (e.g., root biomass, litter fall) and outputs (e.g., heterotrophic respiration), thereby affecting soil carbon pools. These findings align with studies by Mir et al. (2023) and Benbi et al. (2015), which emphasize the importance of understanding carbon dynamics in agricultural systems to optimize carbon management strategies and mitigate climate change impacts (Table 3).
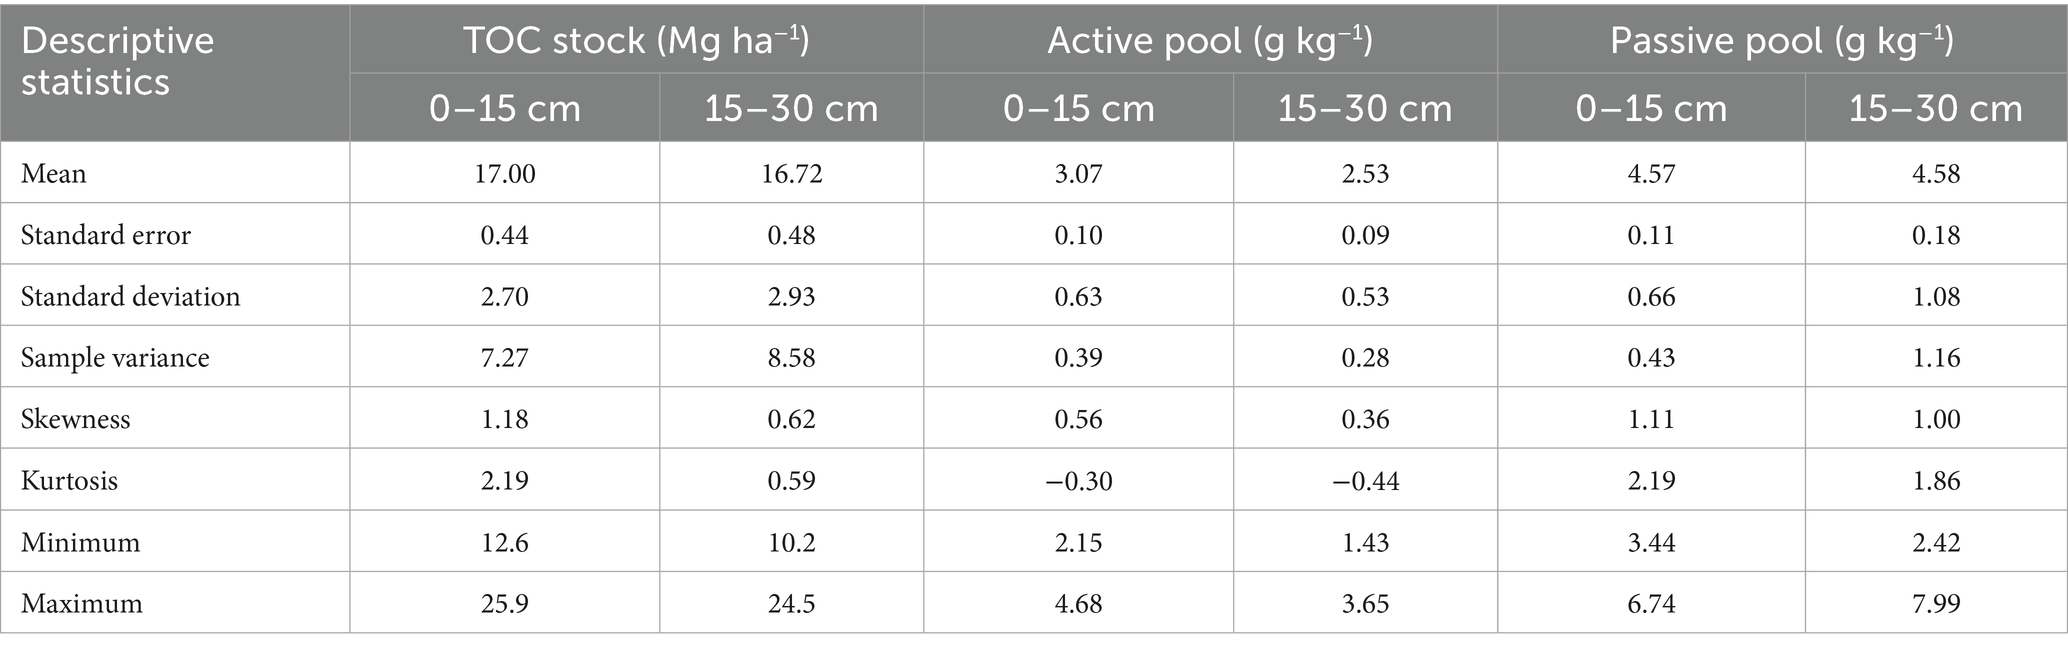
Table 3. Descriptive statistics of C-stock and C-pools of sugarcane growing area.
3.6 Carbon stock
Carbon stock in the soil varied across different depths within the agricultural landscape (Table 3). Results showed that the mean C-stock (17.00 Mg ha−1) ranged from 12.6 to 25.9 Mg ha−1 at 0–15 cm and showed a positively skewed distribution (skewness = 1.18) and leptokurtic shape (kurtosis = 2.19). At 15–30 cm, the mean C-stock slightly decreased to 16.72 Mg ha−1 and ranged from 10.2 to 24.5 Mg ha−1, exhibiting a similar positively skewed distribution (skewness = 0.62) and slightly lower kurtosis (kurtosis = 0.59) compared to the 0–15 cm depth. The decrease in mean C-stock from 0–15 cm to 15–30 cm depth was 1.6% (Table 3). The decline in mean C-stock from 0–15 cm to 15–30 cm depth highlights significant variations in organic carbon storage, crucial for soil fertility, C-sequestration, and overall soil health in the region (Table 3). Recent studies by Ensinas et al. (2015) emphasize the role of cropping systems, such as sugarcane cultivation, in influencing C-stocks and GHG mitigation. Further research on TOC dynamics, soil properties, and management practices is essential for optimizing carbon management strategies in agricultural landscapes (Benbi et al., 2015; Majumder et al., 2008; Sherrod et al., 2005; Mir et al., 2023).
3.7 Active and passive carbon pools
Data showed that active and passive carbon pools varied across the soil depths (Table 3) within the agricultural landscape. At 0–15 cm, the mean active pool was 3.07 g kg−1, and it ranged from 2.15 to 4.68 g kg−1, showing a moderately positively skewed distribution (skewness = 0.56) and a slightly negative kurtosis (kurtosis = −0.30). At 15–30 cm, the mean active pool decreased to 2.53 g kg−1, and it ranged from 1.43 to 3.65 g kg−1, indicating a similar positively skewed distribution (skewness = 0.36) and a more negative kurtosis (kurtosis = −0.44) compared to the 0–15 cm depth. Overall, these findings indicated a decrease (17.59%) in the mean active pool of soil carbon from the 0–15 cm to the 15–30 cm soil depths. However, the passive pool of soil carbon showed a negligible change of approximately 0.22% from the 0–15 cm to the 15–30 cm soil depths (Table 3). These findings underscore the complex dynamics of soil carbon storage and turnover, crucial for optimizing C-sequestration and soil fertility management strategies (Lal, 2004; Paustian et al., 2000; Regnier et al., 2022; Tubiello et al., 2021; Wieder et al., 2015; Fan et al., 2023; Chen et al., 2022; Batjes et al., 2020).
3.8 Lability and recalcitrance index
The data indicated that LI, RI-I, and RI-II values varied significantly across different soil depths (Table 4). At the 0–15 cm depth, the mean LI was 1.28 and ranged from 1.10 to 1.47. The distribution showed a slight positive skewness (skewness = 0.08) and exhibited a platykurtic shape (kurtosis = −0.88), indicating a relatively flat distribution compared to a normal distribution. At the 15–30 cm depth, the mean LI slightly decreased to 1.19 and ranged from 1.04 to 1.38, with higher positive skewness (skewness = 0.22) and more negative kurtosis (kurtosis = −1.55), suggesting a more peaked and narrower distribution compared to the 0–15 cm depth (Table 4).
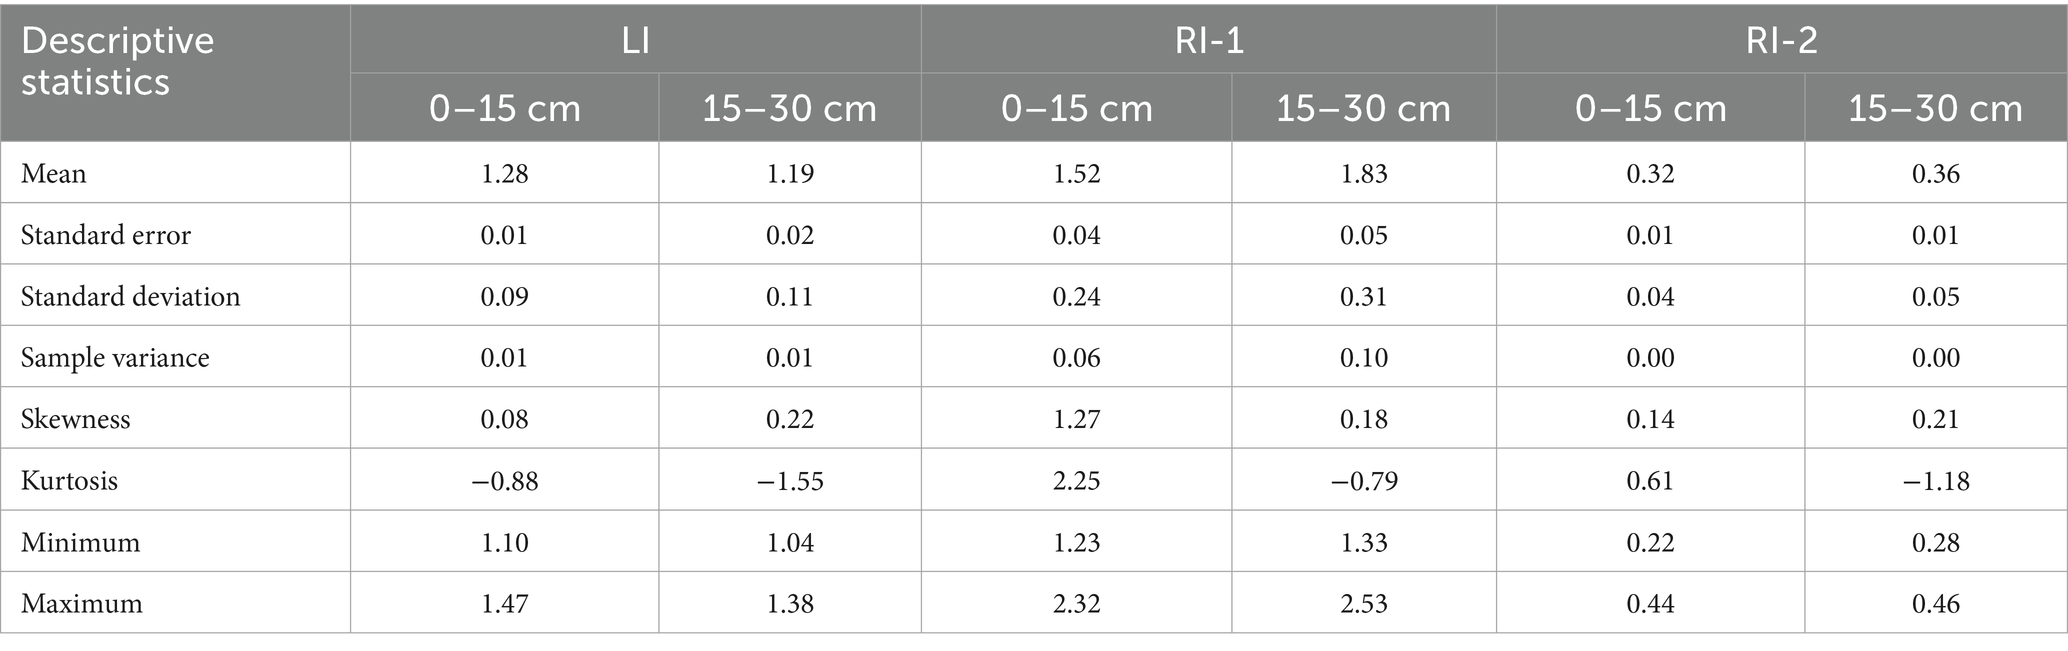
Table 4. Descriptive statistics of lability and recalcitrance index of sugarcane growing area.
Meanwhile, in the case of RI-1 at 0–15 cm depth, the mean was 1.52 and varied from 1.23 to 2.32 with positive skewness (skewness = 1.27) and exhibited leptokurtic shape (kurtosis = 2.25). At 15–30 cm depth, the mean was increased to 1.83 and ranged from 1.33 to 2.53. Distribution showed a lower positive skewness (skewness = 0.18) and negative kurtosis (kurtosis = −0.79), indicating a more flattened and broader distribution compared to the 0–15 cm depth (Table 4). Similarly, in the case of RI-2 at 0–15 cm depth, the mean was 0.32 and ranged from 0.22 to 0.44, indicating a relatively narrow distribution. The distribution showed a slight positive skewness (skewness = 0.14) and exhibited a slightly leptokurtic shape (kurtosis = 0.61), suggesting a moderately peaked distribution compared to a normal distribution. At 15–30 cm depth, the mean RI-2 increased slightly to 0.36, and values ranged from 0.28 to 0.46, indicating a slightly wider distribution compared to the 0–15 cm depth. The distribution showed a positive skewness (skewness = 0.21) and negative kurtosis (kurtosis = −1.18), suggesting a flatter and broader distribution compared to the 0–15 cm depth (Table 4). These findings underscore the importance of understanding C-stability dynamics in soil profiles, crucial for implementing effective soil management strategies to enhance C-sequestration and mitigate climate change impacts (Hassink, 1997; Poeplau and Don, 2015; Yang et al., 2024; Nie et al., 2024; Lu et al., 2024; Adhikari et al., 2024; Meena et al., 2024).
3.9 Correlation matrix
The correlation matrix revealed significant relationships among soil parameters across different soil depths within the studied agricultural landscape (Tables 5, 6). OC refers to organic carbon in soil organic matter, while TOC is a broader term that includes all forms of organic carbon, both particulate and dissolved, providing a more comprehensive measure. At the 0–15 cm soil depth, pH was negatively correlated with TOC (r = −0.732**) and KMnO₄-C (r = −0.710**), indicating reduced carbon levels with increasing pH. In contrast, EC showed strong positive correlations with TOC (r = 0.750**) and KMnO₄-C (r = 0.757**). Nitrogen exhibited the highest correlation with TOC (r = 0.903**) and KMnO₄-C (r = 0.906**). Sulfur and water-stable aggregates (WSA) were also strongly associated with KMnO₄-C (r = 0.888** and r = 0.806**, respectively), suggesting their key roles in carbon stabilization (Table 5). Meanwhile, at 15–30 cm depth, nitrogen showed strong positive correlations with TOC (r = 0.826**) and OC (r = 0.863**). Sulfur and phosphorus were also highly correlated with TOC (r = 0.744** and r = 0.715**, respectively). In contrast, bulk density was strongly negatively correlated with TOC (r = −0.734**) and OC (r = −0.763**). Unlike in the surface layer, KMnO₄-C showed no significant associations, indicating its lower sensitivity at this depth (Tables 5, 6). Recent studies underscore the importance of sustainable sugarcane cultivation using efficient irrigation (Gunarathna et al., 2018), trash and tillage practices (Surendran et al., 2016; Solomon, 2016; Suma and Savitha, 2015), and precision nutrient management (Basanta et al., 2003; Choudhary et al., 2017). These strategies improve yield, enhance soil health, and boost resource use efficiency (Powar et al., 2021).
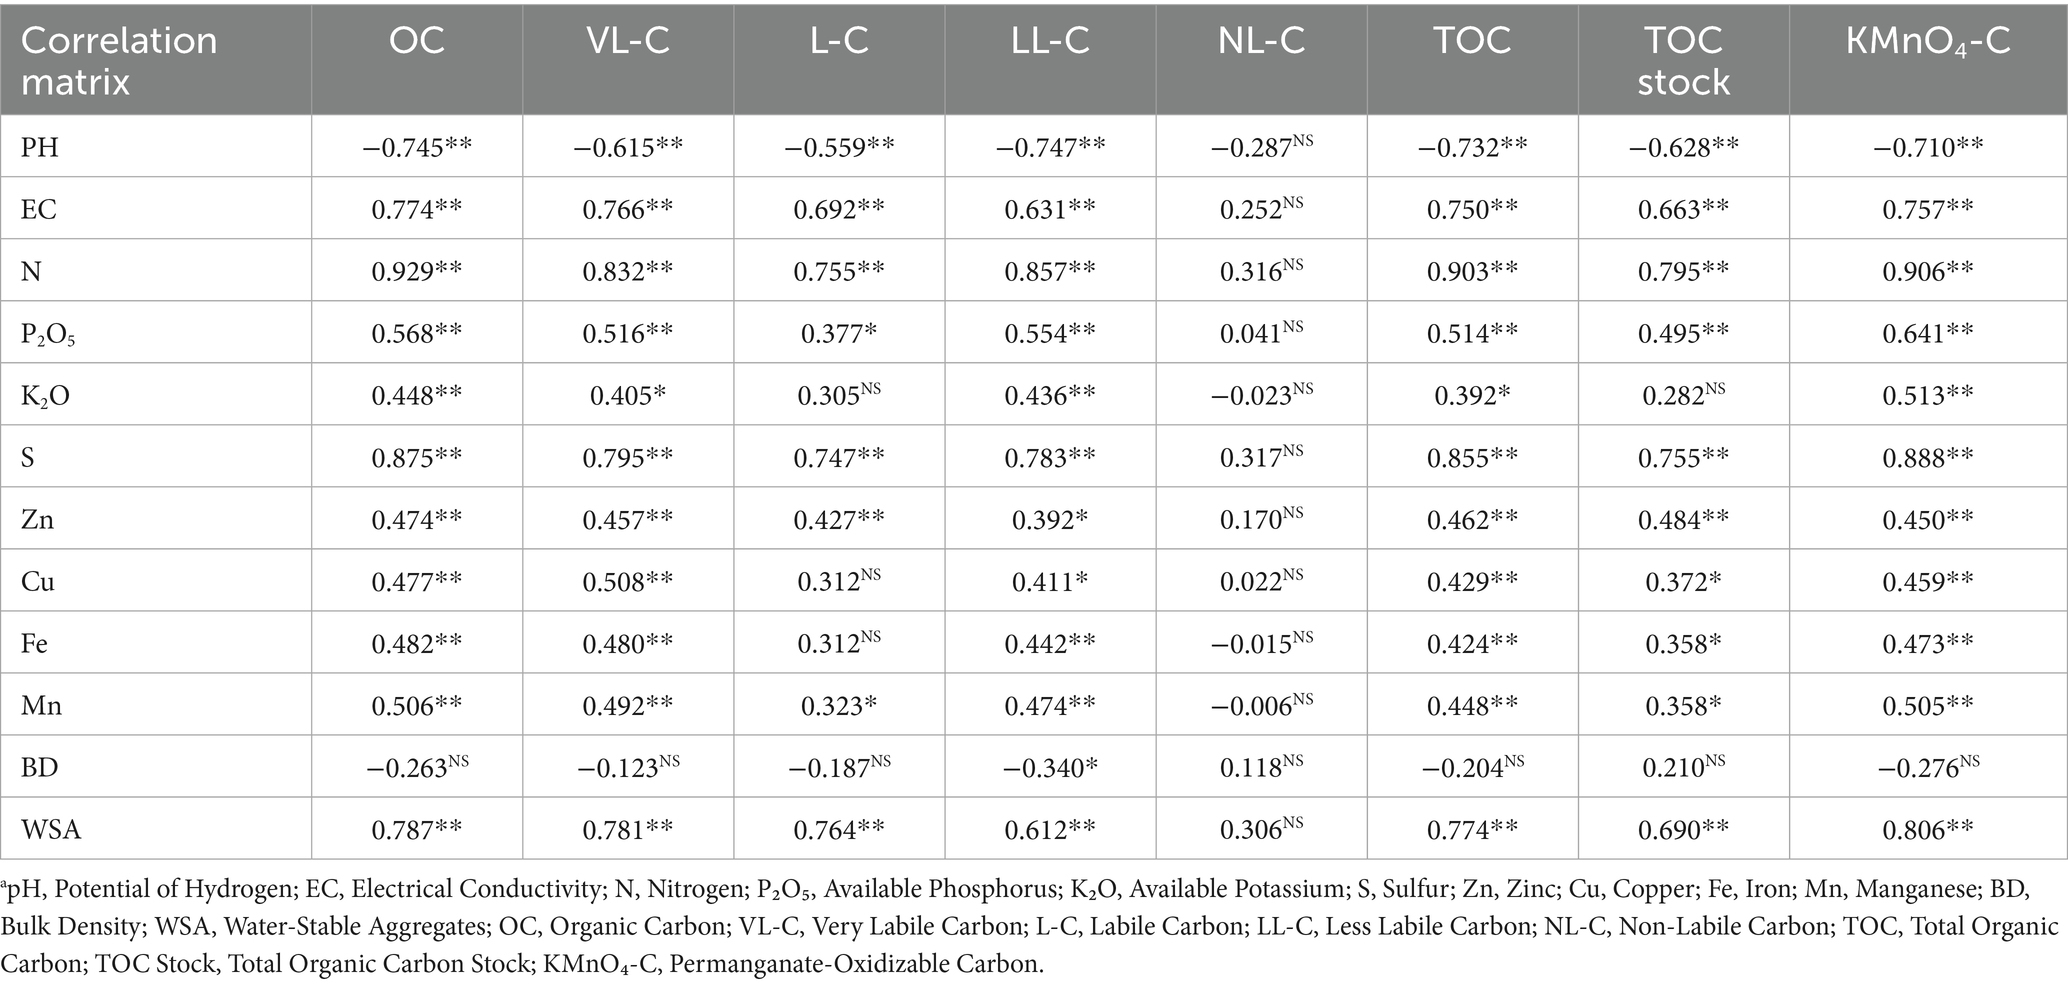
Table 5. Correlation matrix between soil health parameters and soil carbon pools (0–15 cm soil depth).a
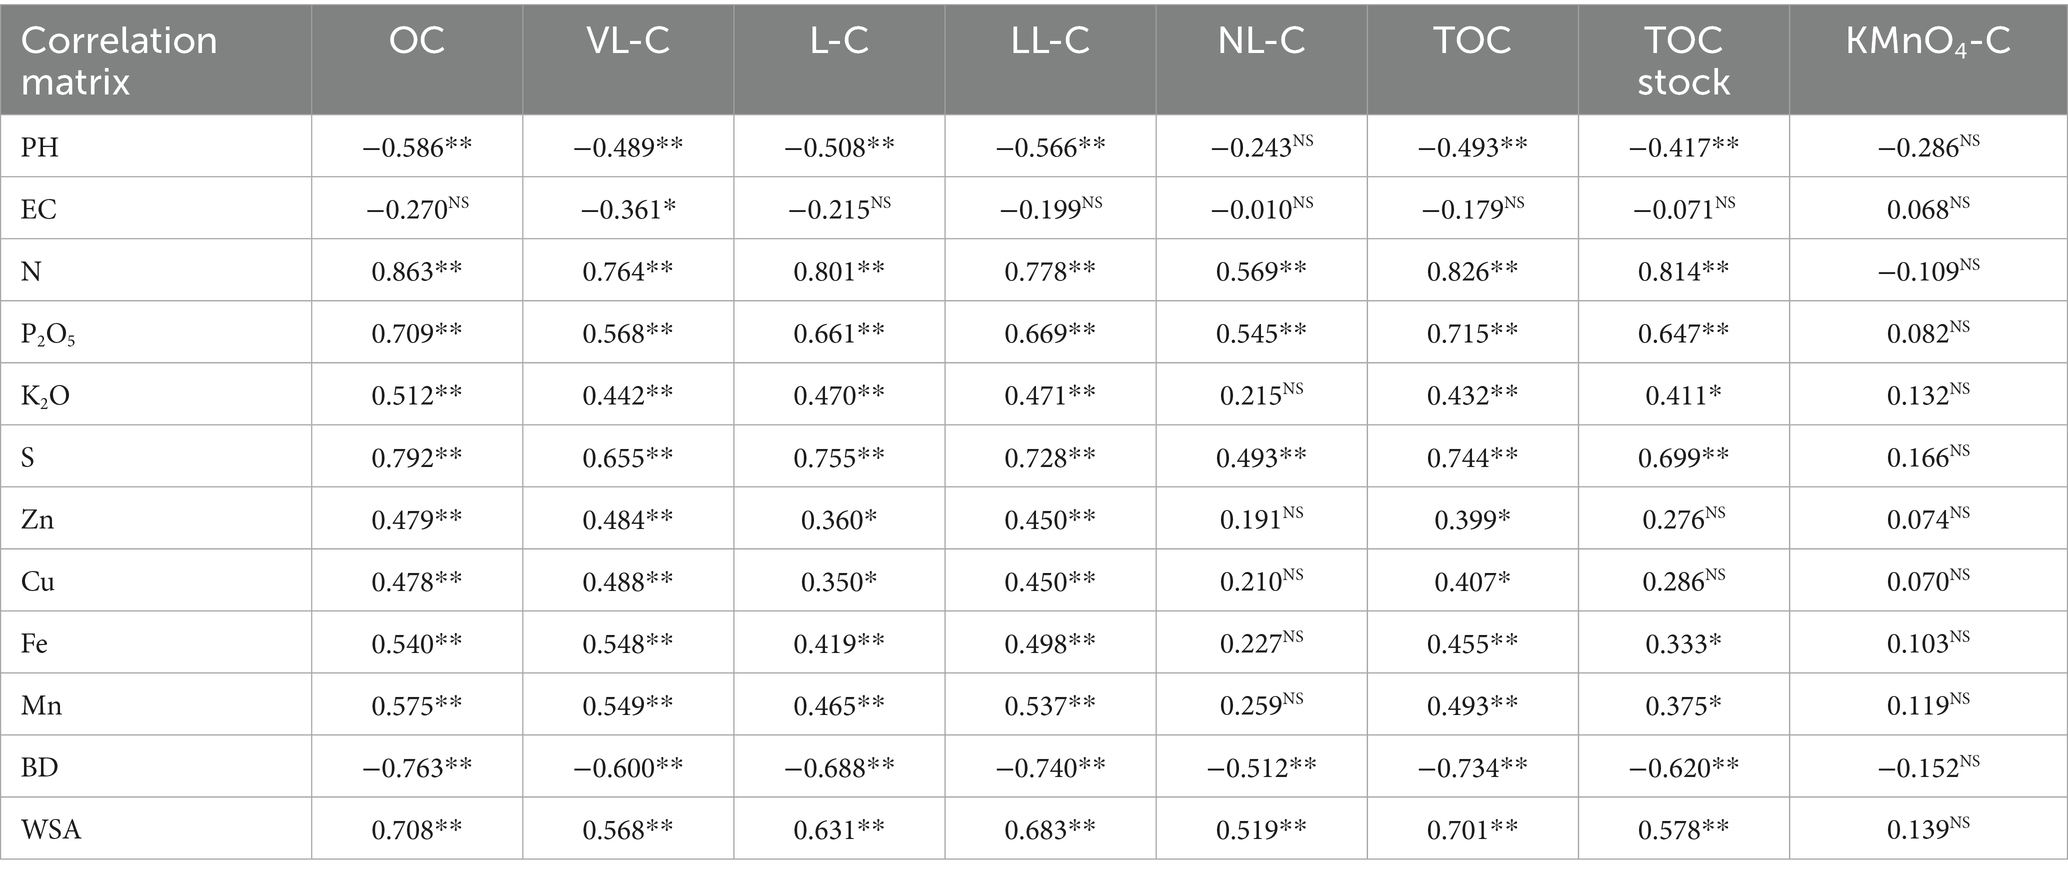
Table 6. Correlation matrix between soil health parameters and soil carbon pools (15–30 cm soil depth).
4 Policy recommendation
The policy recommendations in this study focus on promoting diversified cropping systems, encouraging the use of organic inputs, and implementing precision agriculture for effective carbon management (Figure 4). These strategies directly support key Sustainable Development Goals (SDGs). Improving soil health through crop rotations and organic practices directly supports SDG 2 (Zero Hunger) by increasing yields and promoting sustainable food production. At the same time, SDG 13 (Climate Action) is addressed through reduced carbon footprints and enhanced carbon sequestration, contributing to climate change mitigation. Additionally, improved soil management practices that enhance biodiversity and promote sustainable land use align with SDG 15 (Life on Land), contributing to ecosystem resilience in sugarcane cultivation areas.
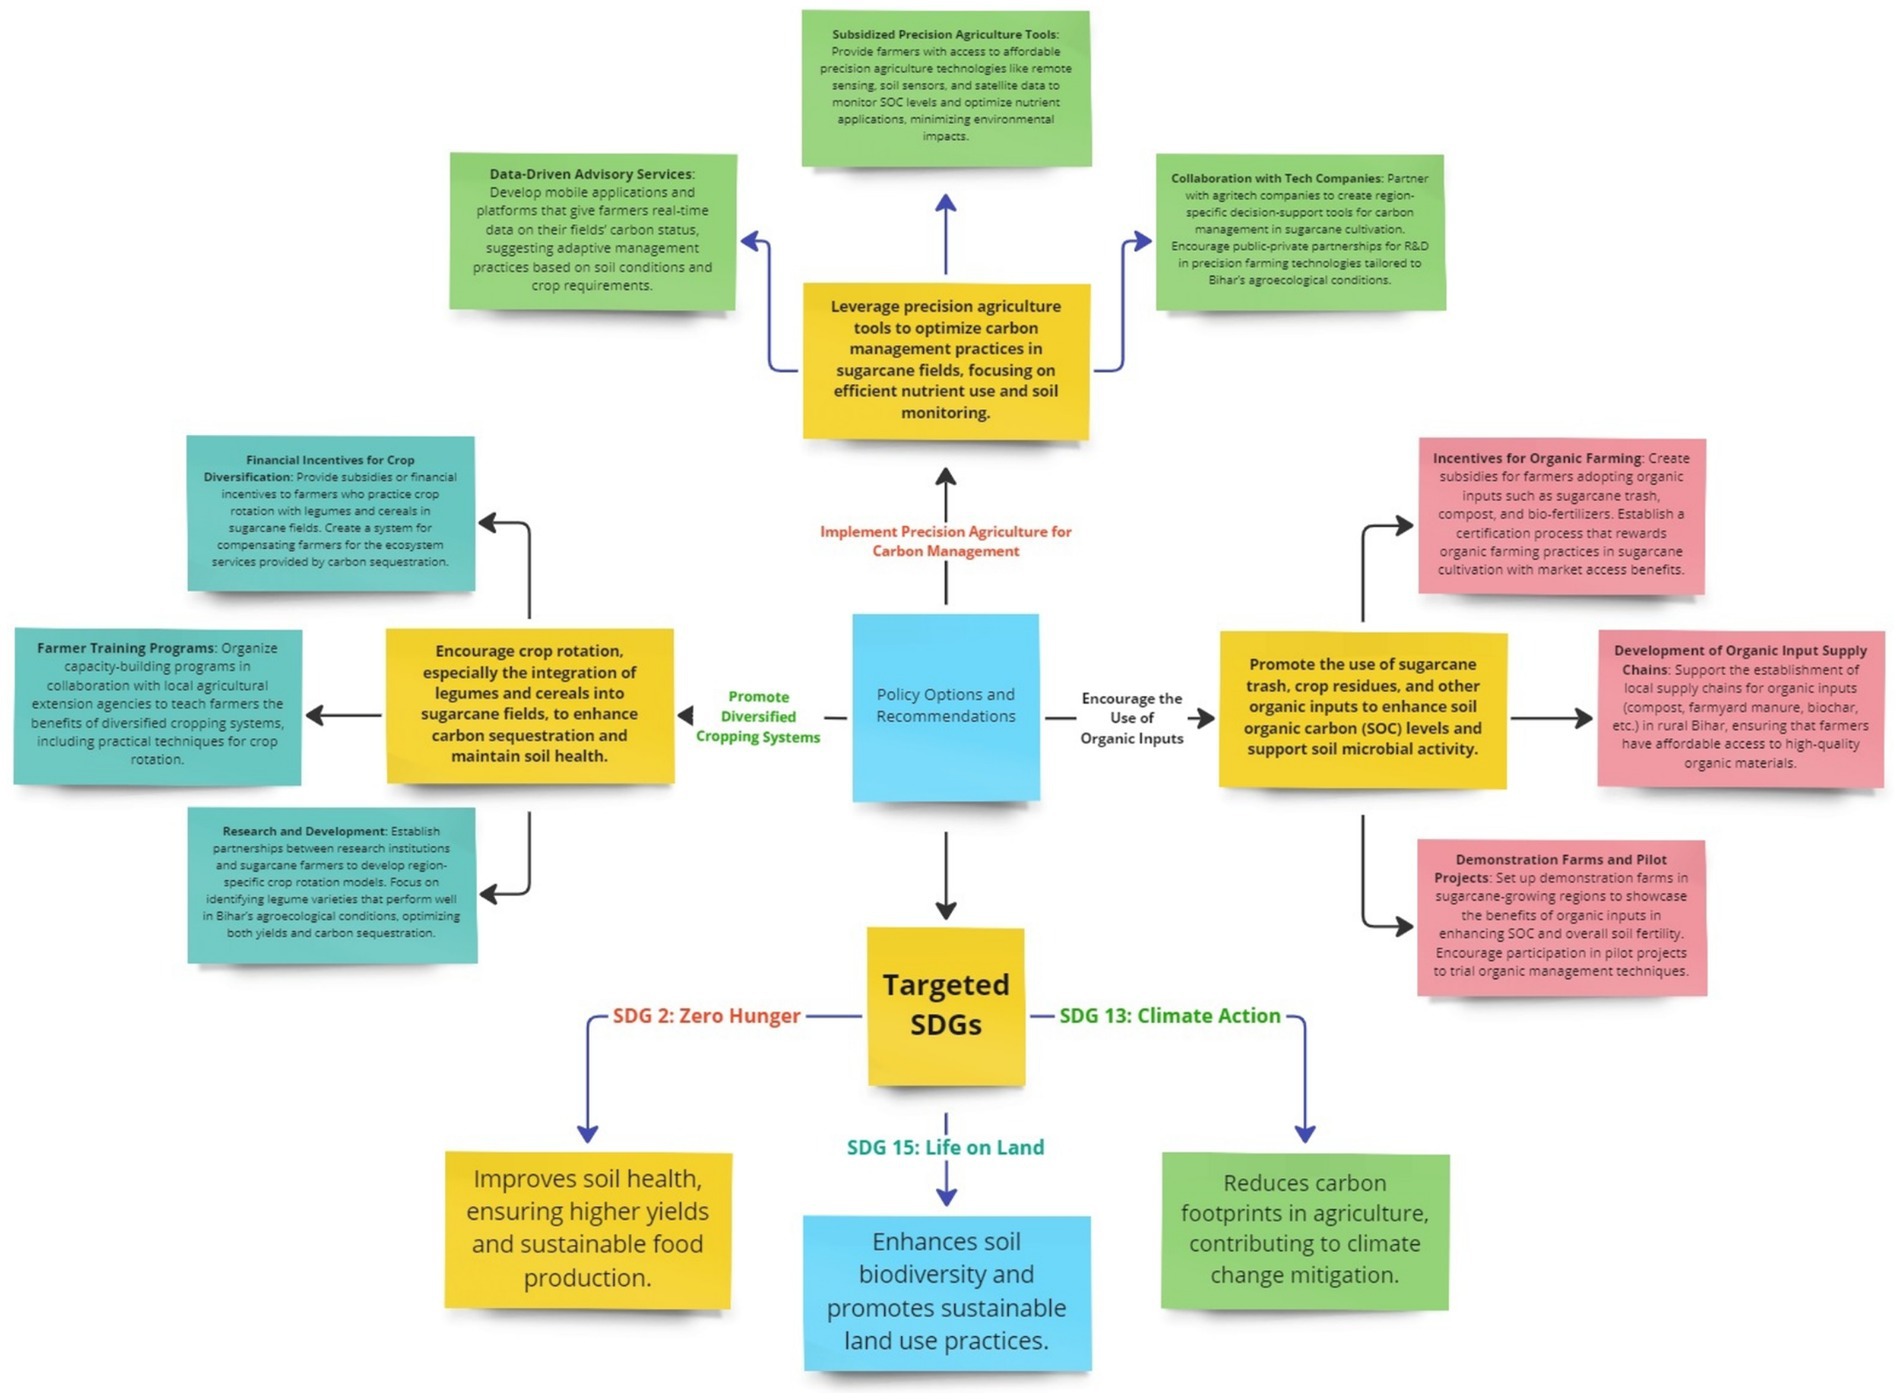
Figure 4. Policy recommendations for sugarcane cultivation: linking sustainable practices to SDGs.
5 Conclusion
This study offers valuable insights into the dynamics of SOC in sugarcane cultivation under the agroecological conditions of Bihar, India. The findings revealed that carbon fractions are more concentrated in the surface soil layer, indicating the strong influence of adaptive management practices on enhancing carbon sequestration in the topsoil. The observed patterns in TOC and labile carbon pools emphasize the importance of targeted soil depth-specific interventions for improving soil health. These results underscore the potential of diversified practices to improve SOC distribution and contribute to sustainable land management and climate mitigation strategies. Crop rotations involving cereals and legumes showed enhanced biological activity, increased active carbon pools, and improved nutrient availability compared to continuous sugarcane cultivation, emphasizing the benefits of diversified cropping systems for sustainable soil health. These findings highlight the importance of diversified cropping systems to improve carbon fractions, boost biological activity, and ensure sustainable soil health long term.
Data availability statement
The original contributions presented in the study are included in the article/Supplementary material, further inquiries can be directed to the corresponding authors.
Author contributions
BK: Investigation, Writing – original draft, Writing – review & editing. SM: Methodology, Project administration, Supervision, Validation, Writing – original draft, Writing – review & editing. AK: Resources, Supervision, Visualization, Writing – review & editing. VM: Formal analysis, Methodology, Resources, Software, Supervision, Visualization, Writing – original draft, Writing – review & editing. RL: Supervision, Writing – review & editing.
Funding
The author(s) declare that no financial support was received for the research and/or publication of this article.
Conflict of interest
The authors declare that the research was conducted in the absence of any commercial or financial relationships that could be construed as a potential conflict of interest.
The author(s) declared that they were an editorial board member of Frontiers, at the time of submission. This had no impact on the peer review process and the final decision.
Generative AI statement
The authors declare that no Gen AI was used in the creation of this manuscript.
Any alternative text (alt text) provided alongside figures in this article has been generated by Frontiers with the support of artificial intelligence and reasonable efforts have been made to ensure accuracy, including review by the authors wherever possible. If you identify any issues, please contact us.
Publisher’s note
All claims expressed in this article are solely those of the authors and do not necessarily represent those of their affiliated organizations, or those of the publisher, the editors and the reviewers. Any product that may be evaluated in this article, or claim that may be made by its manufacturer, is not guaranteed or endorsed by the publisher.
Supplementary material
The Supplementary material for this article can be found online at: https://www.frontiersin.org/articles/10.3389/fsufs.2025.1535741/full#supplementary-material
References
Adhikari, S., Moon, E., Paz-Ferreiro, J., and Timms, W. (2024). Comparative analysis of biochar carbon stability methods and implications for carbon credits. Sci. Total Environ. 914:169607. doi: 10.1016/j.scitotenv.2023.169607
Basanta, M. V., Dourado-Neto, D., Reichardt, K., Bacchi, O. O. S., Oliveira, J. C. M., Trivelin, P. C. O., et al. (2003). Management effects on nitrogen recovery in a sugarcane crop grown in Brazil. Geoderma 116, 235–248. doi: 10.1016/S0016-7061(03)00103-4
Batjes, N. H., Ribeiro, E., and van Oostrum, A. (2020). Standardised soil profile data to support global mapping and modelling (WoSIS snapshot 2019). Earth Syst. Sci. Data 12, 299–320. doi: 10.5194/essd-12-299-2020
Benbi, D. K., Brar, K., Toor, A. S., and Singh, P. (2015). Total and labile pools of soil organic carbon in cultivated and undisturbed soils in northern India. Geoderma 237-238, 149–158. doi: 10.1016/j.geoderma.2014.09.002
Bokhtiar, S. M., Paul, G. C., and Alam, K. M. (2008). Effects of organic and inorganic fertilizer on growth, yield, and juice quality and residual effects on ratoon crops of sugarcane. J. Plant Nutr. 31, 1832–1843. doi: 10.1080/01904160802325545
Bonsucro (2023). The climate cane tracker: setting reduction targets for ghg emissions in sugarcane production. Available online at: https://www.bonsucro.com/climatecane-tracker/ (Accessed 6 March, 2025).
Bouma, J. (1989). “Using soil survey data for quantitative land evaluation” in Advances in soil science. ed. B. A. Stewart, vol. 9 (New York, NY: Springer), 177–213.
Brejda, J. J., Moorman, T. B., Karlen, D. L., and Dao, T. H. (2000). Identification of regional soil quality factors and indicators i. central and southern High Plains. Soil Sci. Soc. Am. J. 64, 2115–2124. doi: 10.2136/sssaj2000.6462115x
Chan, K. Y. (2001). Soil particulate organic carbon under different land use and management. Soil Use Manag. 17, 217–221. doi: 10.1111/j.1475-2743.2001.tb00030.x
Chen, C., Riley, W. J., Prentice, I. C., and Keenan, T. F. (2022). CO 2 fertilization of terrestrial photosynthesis inferred from site to global scales. Proc. Natl. Acad. Sci. USA 119:e2115627119. doi: 10.1073/pnas.2115627119
Cherubin, M. R., Carvalho, J. L. N., Cerri, C. E. P., Nogueira, L. A. H., Souza, G. M., and Cantarella, H. (2021). Land use and management effects on sustainable sugarcane-derived bioenergy. Land 10:72. doi: 10.3390/land10010072
Cherubin, M. R., Karlen, D. L., Franco, A. L. C., Tormena, C. A., Cerri, C. E. P., Davies, C. A., et al. (2016). Soil physical quality response to sugarcane expansion in Brazil. Geoderma 267, 156–168. doi: 10.1016/j.geoderma.2016.01.004
Choudhary, R. L., Wakchaure, G. C., Minhas, P. S., and Singh, A. K. (2017). Response of ratoon sugarcane to stubble shaving, off-barring, root pruning and band placement of basal fertilizers with a multipurpose drill machine. Sugar Tech 19, 33–40. doi: 10.1007/s12355-016-0438-x
Datta, A., Basak, N., Chaudhari, S. K., and Sharma, D. K. (2015). Soil properties and organic carbon distribution under different land uses in reclaimed sodic soils of north-West India. Geoderma Reg. 4, 134–146. doi: 10.1016/j.geodrs.2015.01.006
de la Rosa, D., and Sobral, R. (2008). “Soil quality and methods for its assessment” in Land use and soil resources. eds. A. K. Braimoh and P. L. G. Vlek (Dordrecht: Springer), 167–200.
de Oliveira, I. N., Souza, Z. M., Bolonhezi, D., Totti, M. C. V., de Moraes, M. T., Lovera, L. H., et al. (2022). Tillage systems impact on soil physical attributes, sugarcane yield and root system propagated by pre-sprouted seedlings. Soil Tillage Res. 223:105460. doi: 10.1016/j.still.2022.105460
Ding, G., Liu, X., Herbert, S., Novak, J., Amarasiriwardena, D., and Xing, B. (2006). Effect of cover crop management on soil organic matter. Geoderma 130, 229–239. doi: 10.1016/j.geoderma.2005.01.019
Amaral, W. A. N.do, Marinho, J. P., Tarasantchi, R., Beber, A., and Giuliani, E. (2008). Environmental sustainability of sugarcane ethanol in Brazil. In M. R. L. V. Leal and A. M. Walter (Eds.), Sugarcane ethanol (pp. 113–138). Wageningen, Netherlands: Wageningen Academic Publishers.
Dotaniya, M. L., Datta, S. C., Biswas, D. R., and Kumar, K. (2014). Effect of organic sources on phosphorus fractions and available phosphorus in Typic Haplustept. J. Indian Soc. Soil Sci. 62, 80–83.
Ensinas, S. C., Serra, A. P., Marchetti, M. E., Da Silva, E. F., Ferreira do Prado, E. A., Lourente, E. R. P., et al. (2015). Effects of sugarcane cropping on organic carbon properties of the soil. Aust. J. Crop. Sci. 9, 1042–1048.
Fan, L., Wigneron, J. P., Ciais, P., Chave, J., Brandt, M., Sitch, S., et al. (2023). Siberian carbon sink reduced by forest disturbances. Nat. Geosci. 16, 56–62. doi: 10.1038/s41561-022-01087-x
Gadge, S. K., Powar, M. S., and Jadhav, B. D. B. (2017). Sugarcane trash management for residue recycling and higher production. Indian Farm. 67, 45–46.
Gunarathna, M. H. J. P., Sakai, K., Nakandakari, T., Momii, K., Onodera, T., Kaneshiro, H., et al. (2018). Optimized subsurface irrigation system: the future of sugarcane irrigation. Water 10:314. doi: 10.3390/w10030314
Hanson, E., Nwakile, C., and Hammed, V. O. (2025). Carbon capture, utilization, and storage (CCUS) technologies: evaluating the effectiveness of advanced CCUS solutions for reducing CO₂ emissions. Results Surf Interfaces 18:100381. doi: 10.1016/j.rsurfi.2024.100381
Hassink, J. (1997). The capacity of soils to preserve organic C and N by their association with clay and silt particles. Plant Soil 191, 77–87. doi: 10.1023/A:1004213929699
Hillier, J., Hawes, C., Squire, G., Hilton, A., Wale, S., and Smith, P. (2009). The carbon footprints of food crop production. Int. J. Agric. Sustain. 7, 107–118. doi: 10.3763/ijas.2009.0419
IPCC (2006) Guidelines for national greenhouse gas inventories. Available online at: https://www.ipcc-nggip.iges.or.jp/public/2006gl/ (Accessed January 12, 2025).
IPCC (2021). Climate change the physical science basis. Contribution of working group I to the sixth assessment report of the intergovernmental panel on climate change. Available online at: https://www.ipcc.ch/report/ar6/wg1/ (Accessed March 6, 2025).
Islam, K. R., and Weil, R. R. (2000). Land use effects on soil quality in a tropical forest ecosystem of Bangladesh. Agric. Ecosyst. Environ. 79, 9–16. doi: 10.1016/S0167-8809(99)00145-0
ISO (2022) International sugar organization (ISO). Climate change and sugarcane: impacts and adaptation strategies. Available online at: https://www.isosugar.org/publications (Accessed January 11, 2025).
Jha, C. K., Sinha, S. K., and Thakur, S. K. (2017). Enhancing soil fertility, nutrient uptake and sugarcane productivity through integrated use of Fe and organics in sub-tropical system. Indian J. Ecol. 44, 521–525.
Karlen, D. L., Mausbach, M. J., Doran, J. W., Cline, R. G., Harris, R. F., and Schuman, G. E. (1997). Soil quality: a concept, definition, and framework for evaluation (a guest editorial). Soil Sci. Soc. Am. J. 61, 4–10. doi: 10.2136/sssaj1997.03615995006100010001x
Knoepp, J. D., and Swank, W. T. (1997). Forest management effects on surface soil carbon and nitrogen. Soil Sci. Soc. Am. J. 61, 928–935. doi: 10.2136/sssaj1997.03615995006100030031x
Kumar, N., Singh, A. K., Kamat, D. N., Kumar, A., Minnatullah, M. D., Kumar, A., et al. (2023). Sustainable sugarcane production and utilization: Issues and initiatives (souvenir-cum-edited book). Annual group Meet-2023, all India coordinated research project on sugarcane, October 26–27, 2023. SRI, RPCAU, Pusa, Bihar, India, 1–256.
Lal, R. (2004). Soil carbon sequestration impacts on global climate change and food security. Science 304, 1623–1627. doi: 10.1126/science.1097396
Lu, M., Wang, M., Sun, Y., Sun, G., Zhao, D., San, S., et al. (2024). Low rather than high level nitrogen additions accelerate carbon release process and inhibit recalcitrant carbon allocation via stirring soil enzymatic activities in plateau meadows. J. Soil Sci. Plant Nutr. 24, 3087–3099. doi: 10.1007/s42729-024-01734-9
Majumder, B., Mandal, B., and Bandyopadhyay, P. K. (2008). Soil organic carbon pools and productivity in relation to nutrient management in a 20-year-old rice–berseem agroecosystem. Biol. Fertil. Soils 44, 451–461. doi: 10.1007/s00374-007-0226-6
Meena, V. S., Ghosh, B. N., Singh, R. J., Bhattacharyya, R., Sharma, N. K., Alam, N. M., et al. (2021). Land use types and topographic position affect soil aggregation and carbon management in the mountain agro-ecosystems of the Indian Himalayas. Land Degrad. Dev. 32, 3992–4003. doi: 10.1002/ldr.3864
Meena, V. S., Mondal, T., Pandey, B. M., Mukherjee, A., Yadav, R. P., Choudhary, M., et al. (2018). Land use changes: strategies to improve soil carbon and nitrogen storage pattern in the mid-Himalaya ecosystem, India. Geoderma 321, 69–78. doi: 10.1016/j.geoderma.2018.02.002
Meena, R. S., Pradhan, G., Singh, K., Kumar, S., Singh, A. K., Shashidhar, K. S., et al. (2024). Agriculture models for restoring degraded land to enhance CO₂ biosequestration and carbon credits in the Vindhyan region of India. Sci. Total Environ. 929:172661. doi: 10.1016/j.scitotenv.2024.172661
Mir, Y. H., Ganie, M. A., Shah, T. I., Aezum, A. M., Bangroo, S. A., Mir, S. A., et al. (2023). Soil organic carbon pools and carbon management index under different land use systems in northwestern Himalayas. PeerJ 11:e15266. doi: 10.7717/peerj.15266
More, N. B., Bhalerao, V. P., Phalke, D. H., Patil, A. V., and Bhoi, P. G. (2007). Nitrogen economy by using green manuring intercrops in pre seasonal sugarcane. Indian Sugar 57, 39–45.
Mthimkhulu, S. S., Modi, A. T., and Mabhaudhi, T. (2016). The effect of integrated soil fertility management on maize (Zea mays L.) yield and soil chemical properties in a smallholder farming system in South Africa. Nutr. Cycl. Agroecosyst. 106, 43–57. doi: 10.1007/s10705-016-9781-4
Needelman, B. A., Wander, M. M., Bollero, G. A., Boast, C. W., Sims, G. K., and Bullock, D. G. (1999). Interaction of tillage and soil texture biologically active soil organic matter in Illinois. Soil Sci. Soc. Am. J. 63, 1326–1334. doi: 10.2136/sssaj1999.6351326x
Nie, X., Wang, H., Wang, J., and Liu, S. (2024). Natural forests exhibit higher organic carbon concentrations and recalcitrant carbon proportions in soil than plantations: a global data synthesis. J. For. Res. 35:90. doi: 10.1007/s11676-024-01739-1
Ozlu, E., Arriaga, F. J., Bilen, S., Gozukara, G., and Babur, E. (2022). Carbon footprint management by agricultural practices. Biology 11:1453. doi: 10.3390/biology11101453
Paustian, K., Six, J., Elliott, E. T., and Hunt, H. W. (2000). Management options for reducing CO2 emissions from agricultural soils. Biogeochemistry 48, 147–163. doi: 10.1023/A:1006271331703
PIB (2022). India emerges as world’s largest sugar producer and consumer. Press Information Bureau, Government of India. https://www.pib.gov.in/PressReleasePage.aspx?PRID=1865320 (Accessed October 5, 2022).
Poeplau, C., and Don, A. (2015). Carbon sequestration in agricultural soils via cultivation of cover crops – a meta-analysis. Agric. Ecosyst. Environ. 200, 33–41. doi: 10.1016/j.agee.2014.10.024
Powar, R. V., Patil, D. B., Powar, T. R., and Bandgar, P. S. (2021). Assessment of farmers' knowledge and perception towards the usage of sugarcane trash and environmental safety. Res. Squ. doi: 10.21203/rs.3.rs-1210067/v1
Ravikumar, V., Vijayakumar, G., Šimůnek, J., Chellamuthu, S., Santhi, R., and Appavu, K. (2011). Evaluation of fertigation scheduling for sugarcane using a vadose zone flow and transport model. Agric. Water Manag. 98, 1431–1440. doi: 10.1016/j.agwat.2011.04.012
Regnier, P., Resplandy, L., Najjar, R. G., and Ciais, P. (2022). The land-to-ocean loops of the global carbon cycle. Nature 603, 401–410. doi: 10.1038/s41586-021-04339-9
Rezapour, S., and Samadi, A. (2012). Assessment of soil quality indicators in different agricultural lands in northwest of Iran. J. Soil Sci. Plant Nutr. 12, 689–705. doi: 10.4067/S0718-95162012005000006
Shanthy, T. R., Gurumurthy, D., and Saravanan, L. (2020). Trash management practices in sugarcane cultivation: A socio-economic analysis. Indian Res. J. Extens. Educ. 20, 1–8. doi: 10.29005/irjee.2020.20.4.1
Sherrod, L. A., Peterson, G. A., Westfall, D. G., and Ahuja, L. R. (2005). Soil organic carbon pools after 12 years in no-till dryland agroecosystems. Soil Sci. Soc. Am. J. 69, 1600–1608. doi: 10.2136/sssaj2003.0266
Sinha, S. K., Jha, C. K., Kumar, V., and Pandey, S. S. (2017a). Yield and soil organic carbon pool in relation to soil fertility of sugarcane (Saccharum species hybrid complex) plant-ratoon system under integrated nutrient management. Indian J. Agron. 62, 25–30. doi: 10.59797/ija.v62i1.4269
Sinha, S. K., Kumar, V., and Jha, C. K. (2017b). Effect of integrated use of bio-compost and nitrogen on productivity and soil properties of sugarcane plant–ratoon system in calcareous soil. Sugar Tech. 19, 485–491. doi: 10.1007/s12355-016-0501-7
Smith, P., Martino, D., Cai, Z., Gwary, D., Janzen, H., Kumar, P., et al. (2008). Greenhouse gas mitigation in agriculture. Philos. Trans. R. Soc. B Biol. Sci. 363, 789–813. doi: 10.1098/rstb.2007.2184
Solomon, S. (2016). Sugarcane production and development of sugar industry in India. Sugar Tech 18, 588–602. doi: 10.1007/s12355-016-0494-2
Suma, R., and Savitha, C. M. (2015). Integrated sugarcane trash management: a novel technology for sustaining soil health and sugarcane yield. Adv. Crop. Sci. Tech. 3, 1–4. doi: 10.4172/2329–8863.1000160
Surendran, U., Ramesh, V., Jayakumar, M., Marimuthu, S., and Sridevi, G. (2016). Improved sugarcane productivity with tillage and trash management practices in semi arid tropical agro ecosystem in India. Soil Tillage Res. 158, 10–21. doi: 10.1016/j.still.2015.10.009
Tubiello, F., Conchedda, G., Wanner, N. S., Federici, S., Rossi, S., and Grassi, G. (2021). Carbon emissions and removals from forests: new estimates, 1990–2020. Earth Syst. Sci. Data 13, 1681–1691. doi: 10.5194/essd-13-1681-2021
Tubiello, F. N., Salvatore, M., Cóndor Golec, R. D., Ferrara, A., Rossi, S., Biancalani, R., et al. (2014). Agriculture, forestry and other land use emissions by sources and removals by sinks (FAO statistics division working paper series No. 2) : Food and Agriculture Organization of the United Nations, 3–20.
Turmel, M. S., Speratti, A., Baudron, F., Verhulst, N., and Govaerts, B. (2015). Crop residue management and soil health: a systems analysis. Agric. Syst. 134, 6–16. doi: 10.1016/j.agsy.2014.05.009
Wakchaure, G. C., Minhas, P. S., Biswas, A. K., Meena, K. K., Pradhan, A., Gawhale, B. J., et al. (2025). Assessment of gains in productivity and water-energy-carbon nexus with tillage, trash retention and fertigation practices in drip irrigated sugarcane. Renew. Sustain. Energy Rev. 211:115294. doi: 10.1016/j.rser.2024.115294
Walkley, A., and Black, I. A. (1934). An examination of the Degtjareff method for determining soil organic matter, and a proposed modification of the chromic acid titration method. Soil Sci. 37, 29–38. doi: 10.1097/00010694-193401000-00003
Weil, R., Islam, K. R., Stine, M. A., Gruver, J. B., and Samson-Liebig, S. E. (2003). Estimating active carbon for soil quality assessment: a simple method for laboratory and field use. Am. J. Altern. Agric. 18, 3–17. doi: 10.1079/AJAA2003003
Wieder, W. R., Cleveland, C. C., Smith, W. K., and Todd-Brown, K. (2015). Future productivity and carbon storage limited by terrestrial nutrient availability. Nat. Geosci. 8, 441–444. doi: 10.1038/ngeo2413
Yang, X., Zhang, S., Wu, D., Huang, Y., Zhang, L., Liu, K., et al. (2024). Recalcitrant components accumulation in dissolved organic matter decreases microbial metabolic quotient of red soil under long-term manuring. Sci. Total Environ. 934:173287. doi: 10.1016/j.scitotenv.2024.173287
Keywords: sugarcane cultivation, agricultural sustainability, soil management, carbon sequestration, climate change
Citation: Kudi B, Meena SK, Kumar A, Meena VS and Laik R (2025) Effect of adaptive management practices on carbon footprint of sugarcane in the agroecological landscape of Bihar, India. Front. Sustain. Food Syst. 9:1535741. doi: 10.3389/fsufs.2025.1535741
Edited by:
Veerasamy Sejian, Indian Council of Agricultural Research (ICAR), IndiaReviewed by:
Syam Viswanath, Indian Council of Forestry Research and Education (ICFRE), IndiaKamran Haider, Huazhong Agricultural University, China
Copyright © 2025 Kudi, Meena, Kumar, Meena and Laik. This is an open-access article distributed under the terms of the Creative Commons Attribution License (CC BY). The use, distribution or reproduction in other forums is permitted, provided the original author(s) and the copyright owner(s) are credited and that the original publication in this journal is cited, in accordance with accepted academic practice. No use, distribution or reproduction is permitted which does not comply with these terms.
*Correspondence: Sunita Kumari Meena, c3VuaXRhLm1lZW5hQHJwY2F1LmFjLmlu; Ajeet Kumar, YWplZXRyYXVAZ21haWwuY29t; Vijay Singh Meena, dmlqYXlzc2FjLmJodUBnbWFpbC5jb20=