Abstract
Introduction:
As digital transformation accelerates globally, the digitalization of agricultural product circulation (DAPC) is becoming a key driver of rural revitalization and sustainable agricultural development.
Methods:
This study introduces a digital agriculture product circulation index (DAPCI) to assess the level of digitalization in agricultural product circulation and the influence of digitalization on rural modernization in China. Additionally, this study develops a rural agricultural modernization development index (RAMDI) to measure the extent of modernization across 30 provinces (from 2012–2023). The entropy weight method and a spatial error model are applied to capture both direct and indirect effects.
Results:
The findings reveal that digitalization significantly enhances rural agricultural modernization (RAM), particularly in technologically advanced regions, with strong spatial spillover effects benefiting neighboring areas. The results further reveal that the digitalization of agricultural circulation positively correlates with improved rural economic development; green innovation and industrial structure optimization emerge as key mechanisms for driving both environmental sustainability and economic growth.
Discussion:
This research contributes to understanding how digital tools can reshape agricultural practices, making those practices more resilient, efficient, and environmentally friendly. By demonstrating the impact of digitalization on rural agricultural sustainability, this study highlights the importance of integrated technological innovations and management strategies for advancing sustainable agricultural development and climate resilience in rural economies.
1 Introduction
The rapid digital transformation of agri-food systems is reshaping agricultural production, distribution, and consumption worldwide. Initiatives such as the European Union's common agricultural policy (CAP) integrate digital tools for sustainable farming (Kortleve et al., 2024; Ghazal et al., 2024). India's e-national agricultural market (eNAM) connects farmers with national buyers (Goyal and Kaur, 2021), and M-Farm in sub-Saharan Africa provides smallholders with real-time price and logistics data. All these initiatives demonstrate the potential of digitalization to enhance productivity, sustainability, and inclusiveness in agricultural markets (Walker, 2024). However, the abovementioned benefits are unevenly distributed. Many rural areas, especially in developing countries, face a persistent digital divide, which is caused by limited infrastructure, low digital literacy, and weak institutional capacity. Sustainable and inclusive rural development is gaining global attention (e.g., UN SDGs 9 and 12). It is therefore crucial to understand how digitalization in agricultural product circulation (DAPC)—which refers to the application of digital technologies in the storage, transportation, marketing, and trading of agricultural products—an drive rural and agricultural modernization (RAM). In practice, RAM encompasses technological upgrading, ecological sustainability, and rural revitalization. This study empirically investigates how DAPC influences RAM across different regions in China and also examines the transmission mechanisms through which digitalization shapes rural transformation.
Existing literature on rural modernization identifies a variety of factors that influence agricultural development, including economic, institutional, and technological factors. Most existing research has concentrated on the benefits of digital technologies in urban and developed areas, where improvements in infrastructure and innovation have markedly enhanced environmental efficiency and resource utilization (Huang et al., 2018; Tang et al., 2023; Zamani, 2022). However, the understanding of how these technologies shape rural agricultural practices, especially within the context of green innovation and sustainable development, is still limited (Zhu et al., 2024). Prior studies have largely examined the digital economy's impact on isolated aspects of rural development, such as inclusive finance and agribusiness (Cheng et al., 2024). However, very few studies have focused specifically on how DAPC contributes to RAM.
The digital transformation of rural agriculture encompasses multiple dimensions, including but not limited to technological innovation, improvements in production efficiency, and the adoption of sustainable practices (Cheng et al., 2024; Tang et al., 2023; Ma and Wang, 2024). Studies based on urban contexts have shown that digital infrastructure and policy incentives are crucial for enabling technological change (Cunningham et al., 2023; Li et al., 2022). However, rural areas frequently encounter structural challenges, such as inadequate infrastructure and limited access to advanced technologies (Zhou et al., 2023). Nonetheless, digitalization holds considerable promise in terms of driving rural economic development, advancing agricultural modernization, and supporting long-term sustainability goals.
Problematically, existing evaluation frameworks often rely on narrow economic indicators, or they lack the capacity to capture the multidimensional nature of rural agricultural modernization. To address this gap, this study proposes the RAMDI, a composite measure that integrates sustainability, infrastructure, productivity, and institutional resilience into a unified framework.
To further address the abovementioned gaps, this study aims to empirically examine the impact of DAPCI on rural and agricultural modernization across regions in China. Two composite indices are constructed to capture the core variables. First, DAPCI reflects the level of digitalization in agricultural product circulation, drawing on dimensions such as digital infrastructure, transaction efficiency, and logistics intelligence. Second, RAMDI represents the multidimensional progress of rural modernization, including technological innovation, sustainable development, and rural infrastructure.
Based on panel data from 30 Chinese provinces, autonomous regions, and municipalities, and spanning the period from 2012 to 2023, this study adopts the entropy-weighted technique for order of preference by similarity to ideal solution (TOPSIS) method to measure DAPCI and RAMDI. To account for regional spillover and spatial dependencies, a spatial Durbin model is further employed to analyze the spatially mediated effects of digitalization on rural modernization. This quantitative framework allows this study to uncover not only the direct effects of digital transformation in agricultural circulation but also how such effects vary and diffuse across geographic and economic contexts.
Moreover, by integrating a quantitative spatial econometric framework with multi-dimensional indices, this study offers a computational lens to understand how digital innovation in circulation systems shapes rural modernization in contextually diverse settings.
This study contributes to the extant literature on rural modernization and digital transformation in four key ways. First, two novel indices are developed—DAPCI and RAMDI—that capture key dimensions of digitalization and rural modernization, and entropy-TOPSIS and spatial Durbin models are applied for rigorous quantitative analysis. Second, using panel data from 30 Chinese provinces over the years 2012–2023, this study reveals spatial and temporal patterns that have been overlooked by prior research. Third, this study clarifies the transmission mechanisms linking digital agricultural product circulation to comprehensive rural modernization, thereby addressing a gap in existing studies. Finally, the spatial findings highlight regional spillovers, thereby informing targeted digital agriculture policies for underdeveloped rural areas.
The remainder of this paper is organized as follows: Section 2 develops the theoretical framework linking DAPC to RAM. Section 3 details the construction of the indices, the entropy-TOPSIS method, and the spatial Durbin model. Section 4 presents the empirical results, which highlight regional heterogeneity and digital impacts. Finally, Section 5 discusses policy implications and suggests directions for future research.
2 Literature review and theoretical mechanisms
2.1 Current research on agricultural digitalization and rural modernization
The digital transformation of agri-food systems has emerged as a strategic enabler of rural modernization. Global attention is increasingly focused on enhancing agricultural efficiency, sustainability, and market integration. International studies have shown that, through precision farming, supply chain analytics, and platform-based logistics, digital agriculture improves productivity and resource use efficiency in both developed and developing countries (Ghazal et al., 2024; Saini et al., 2025). For instance, the European Union's common agricultural policy (CAP) emphasizes digital innovation as a means to promote environmental sustainability (Manta et al., 2024), and India's eNAM platform digitally connects farmers to national markets, boosting market efficiency and inclusiveness (Chaudhary and Suri, 2022).
Despite these advances, existing literature has largely focused on the digital economy's impact in urban or highly-developed regions, where infrastructure and institutional support enable rapid technological diffusion (Tang et al., 2023). In contrast, rural and underdeveloped areas are facing structural barriers, such as limited digital literacy, weak logistics networks, and a lack of scalable technologies (Zhou et al., 2023). As a result, the digital transformation of agricultural product circulation—defined as the integration of digital platforms, data systems, and intelligent logistics into the agri-food supply chain—remains underexplored.
Recent domestic research from China shows that a digital upgrading of supply chains can foster innovation, reduce operational costs, and improve green total factor productivity in distribution (Ma and Wang, 2024; Gong et al., 2024). However, these findings are primarily firm-level or industry-specific; they lack a comprehensive understanding of how such digitalization contributes to rural and agricultural modernization (RAM) at the regional scale. Moreover, only limited empirical work has thus far addressed the spatial dimensions of these effects.
This gap in research calls for deeper investigation into the role of DAPC in shaping rural transitions, especially how digital tools affect regional disparities, sustainable innovation, and the structure of rural economies.
While prior studies have acknowledged the transformative effects of digitalization on agriculture, most have emphasized upstream applications, such as smart farming, precision inputs, or rural finance (Khan and Babar, 2024; Shamshiri et al., 2024; Yang et al., 2025). In contrast, the downstream segment—particularly the circulation of agricultural products involving logistics, storage, and—distributionremains comparatively underrepresented in empirical research (Tang et al., 2023; Zhou et al., 2023).
Specifically, several key gaps persist in literature. First, the mechanisms through which DAPC affects rural and agricultural modernization—whether through improved efficiency, technological spillovers, or institutional coordination—have yet to be systematically validated with regional data (Zhu et al., 2024). Second, few studies have addressed the considerable spatial heterogeneity in digital development, despite growing evidence that rural infrastructure and absorptive capacity vary significantly across regions (Ma and Wang, 2024). Third, while sustainability is now central to the modernization agenda, the potential of DAPC to support green transitions such as emissions reduction and circular agriculture has rarely been explored (Gong et al., 2024). Finally, spatial spillover effects, i.e., how digital investments in one region may affect neighboring areas through interlinked supply chains or market integration, remain a largely overlooked dimension in the field of digital agriculture (Tang et al., 2023; Zhou et al., 2023).
This study addresses all of these gaps by developing a spatially-informed, multi-dimensional framework that links DAPC to RAM, with heterogeneity, sustainability, and spatial externalities incorporated into the analysis.
2.2 Theoretical mechanisms linking DAPC and RAM
The relationship between DAPC and rural and agricultural modernization (RAM) can be understood through several complementary theoretical perspectives. First, the resource-based view (RBV) posits that unique, valuable, and hard-to-imitate resources—such as digital infrastructure and data capabilities—can enhance rural organizations' competitive advantage and efficiency (Barney et al., 2021). Second, diffusion of innovations theory explains how digital technologies spread through rural systems, promoting structural and institutional modernization as adoption progresses (Ma and Wang, 2024; Yang C. F. et al., 2024). Third, technical systems theory emphasizes the co-evolution of technological tools and organizational forms in shaping systemic transformations, particularly in sectors like agriculture that rely on complex interdependencies (Tian et al., 2023; Zhou et al., 2023). These theories jointly frame the analysis of how DAPC enables modernization through efficiency gains, green innovation, and spatial dynamics.
2.2.1 Efficiency enhancement mechanism
By reducing transaction costs, improving information symmetry, and integrating fragmented actors into cohesive value chains, DAPC enhances agricultural production and distribution efficiency. According to the RBV, digital infrastructure such as mobile trading apps, intelligent logistics, and traceability systems improves the allocation and utilization of rural resources (Barney et al., 2021). Empirical studies have demonstrated, for example, that digital platforms allow farmers to bypass traditional intermediaries, reach broader markets, and capture greater value (Chen and Long, 2024; Liu et al., 2022; Wang et al., 2022).
Additionally, digital circulation reduces post-harvest losses and improves storage and transportation efficiency, thus stabilizing prices and improving farmer income (Liu et al., 2024; Zhou et al., 2024). Zhou et al. (2023) further highlighted that rural areas with improved digital infrastructure experience more significant gains in supply chain coordination. Zhu and Li (2021) emphasized that digital capacity also fosters organizational innovation, enabling the modernization of business models and rural governance.
2.2.2 Green innovation mechanism
By facilitating green technological adoption and promoting environmental awareness, DAPC contributes to sustainable rural development. Drawing on technical systems theory, the integration of digital and ecological systems accelerates the transformation of traditional production methods toward greener alternatives (Tian et al., 2023). For example, digital monitoring tools and data analytics enable precision irrigation, smart fertilization, and route optimization in logistics, thereby reducing environmental footprints (Feng et al., 2022; Yuan et al., 2024).
These practices contribute to green total factor productivity (GTFP), a key metric of sustainable modernization (Zhou et al., 2024). Furthermore, Abdulai (2022) underscored that digital agriculture catalyzes the emergence of new industries (e.g., rural green logistics and agri-tech services), thereby enhancing rural employment and structural transformation.
2.2.3 Regional spillover mechanism
Digitalization transcends regional boundaries and fosters spatial linkages by enabling faster knowledge diffusion, price transmission, and supply chain integration. According to diffusion of innovations theory, innovations adopted in one area may catalyze change in neighboring regions through demonstration effects and institutional learning (Yang R. Y. et al., 2024). Tian et al. (2023) noted that, as one region reaps economic gains from digital transformation, those benefits can extend outward via mobile labor, technology migration, and interregional trade.
However, Peng and Dan (2023) cautioned that uneven digital infrastructure across regions may induce siphon effects. Specifically, advanced areas may attract resources and talent from less-developed areas, aggravating spatial inequalities. This highlights the importance of understanding regional heterogeneity in assessing DAPC's overall contribution to balanced rural development.
2.3 Theoretical framework and research hypotheses
Based on the mechanisms outlined above, this study constructs an integrated theoretical framework (Figure 1) to analyze how DAPC influences RAM. This framework incorporates RBV, diffusion of innovations theory, and technical systems theory to explain three core pathways, namely efficiency improvement, green innovation, and spatial spillover. Additionally, industrial structure optimization and regional disparities are considered as mediating and moderating factors.
Figure 1
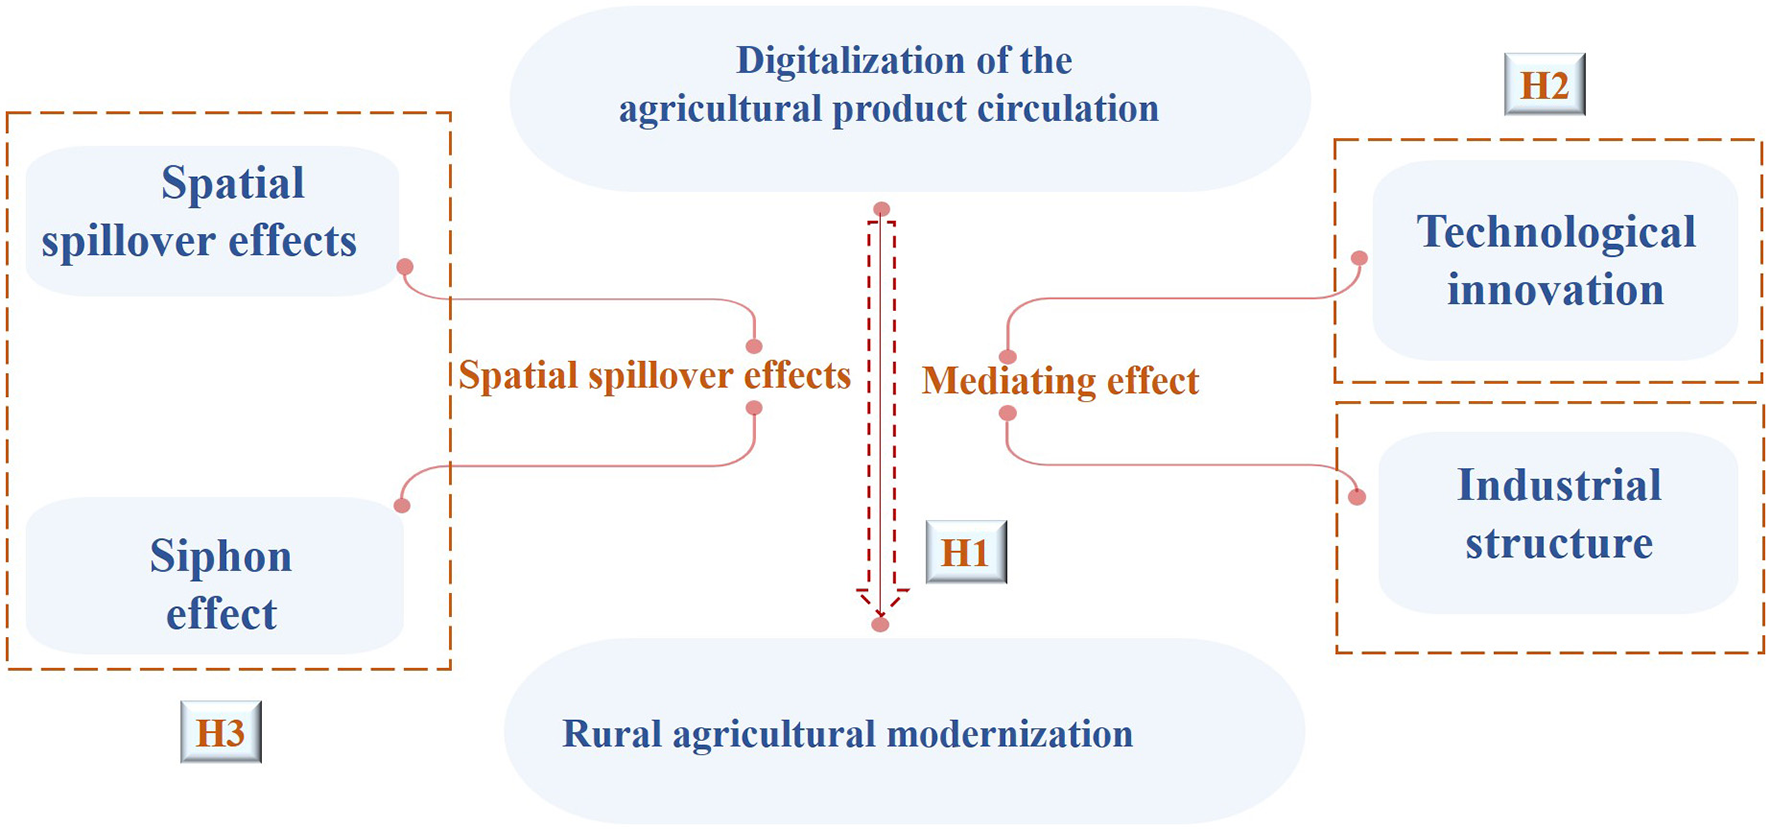
Mechanisms of digitalization in agricultural product circulation on RAM.
Accordingly, the following hypotheses are proposed:
-
Hypothesis 1: The digitization of agricultural product circulation directly contributes to achieving RAM.
-
Hypothesis 2: The digitalization of agricultural product circulation promotes innovative RAM by optimizing industrial structures and introducing new technologies.
-
Hypothesis 3: There exists a spatial spillover effect of the digitalization of agricultural product circulation on technological and organizational innovation in agriculture.
These hypotheses will be empirically evaluated through the construction of RAMDI and DAPCI indices and spatial econometric modeling in the subsequent sections.
3 Data, method and variables
3.1 Variables
3.1.1 Dependent variable: rural agricultural modernization development index (RAMDI)
This paper introduces a comprehensive index, the RAMDI, which has been designed to evaluate sustainable rural development. Drawing on the framework developed by Wang et al. (2023) and Yan et al. (2023), as well as the rural revitalization guidelines issued by the Chinese government, this study identifies key indicators that capture the critical dimensions of agricultural modernization in rural areas. The selected dimensions include industrial technology advancement, the degree of informatization, organizational innovation, rural development conditions, and environmentally sustainable practices. These five categories form the foundation of the proposed RAMDI system, which aims to assess the progress of rural development in a structured and consistent manner (see Table 1).
Table 1
| Level 1 | Level 2 | Level 3 | Direction | Weight |
|---|---|---|---|---|
| RAMDI | Agricultural productivity | Total agricultural machinery power per unit area (kW/ha) | + | 0.0346696 |
| Effective irrigation rate (%) | + | 0.0349459 | ||
| Grain yield per unit area (tons/ha) | + | 0.0269836 | ||
| Share of agricultural and related services in gross output (%) | + | 0.1563506 | ||
| Agricultural labor productivity (10,000 CNY/person) | + | 0.0272504 | ||
| Agricultural producer price index | + | 0.0091877 | ||
| Agricultural sustainability | Crop failure rate (%) | – | 0.0020414 | |
| Fertilizer application per unit area (tons/ha) | – | 0.0121519 | ||
| Pesticide application per unit Area (tons/ha) | – | 0.0024278 | ||
| Rural infrastructure and public services | Rural solar water heater installation area (10,000 m2) | + | 0.075345 | |
| Per capita electricity consumption in rural areas (kWh/person) | + | 0.172788 | ||
| Number of village committees per 10,000 people | + | 0.039969 | ||
| Number of health technicians per 1,000 people (persons/1,000) | + | 0.0329436 | ||
| Proportion of villages with sewage treatment (%) | + | 0.0750992 | ||
| Rural road hardening rate (%) | + | 0.0239486 | ||
| Rural culture and digital capability | Per capita expenditure on education, culture and recreation in rural areas (CNY/person) | + | 0.0122954 | |
| Number of township cultural stations | + | 0.0533297 | ||
| Population coverage rate of rural TV programs (%) | + | 0.0052504 | ||
| Number of computers per 100 rural households (units/100 households) | + | 0.0517405 | ||
| Proportion of rural residents covered by minimum living security (%) | – | 0.0080701 | ||
| Rural living standards | Per capita disposable income of rural households (CNY/person) | + | 0.0274564 | |
| Per capita housing area (m2/person) | + | 0.0297548 | ||
| Number of air conditioners per 100 rural households (units/100 households) | + | 0.0807794 | ||
| Engel coefficient of rural households (%) | – | 0.005221 |
Rural agricultural modernization development index (RAMDI).
To ensure consistency in index construction, the directionality of each indicator is explicitly defined. For positively oriented indicators (e.g., grain yield per unit area), higher values represent greater progress. Conversely, for negatively oriented indicators (e.g., fertilizer application per hectare or pesticide use), higher values suggest less sustainable outcomes. All indicators were directionally normalized prior to index aggregation.
To synthesize the multidimensional data into a robust composite score, the entropy-weighted TOPSIS method was applied. This approach combines objective weight assignment with the TOPSIS, which ranks observations by their relative closeness to an ideal benchmark. This integrated method not only avoids subjectivity but also ensures comparability across regions and over time. To ensure transparency and reproducibility, the full list of indicator sources, directionality, normalization procedures, entropy values, and resulting weights is provided in Table 1.
3.1.2 Key explanatory variable: digitalization of agricultural product circulation
As digital transformation progresses, the DAPC can be assessed through three main areas: the digitalization of demand, infrastructure, and organizational processes (Meng et al., 2023). Some researchers have suggested that a measurement system focused on the digitalization of infrastructure and distribution channels can serve as a key framework for analysis (Deng et al., 2024; Zhao et al., 2024).
Building on these insights, this paper proposes an index system that can be used to evaluate the digitalization levels within agricultural product circulation. The index includes three dimensions: digital infrastructure, industry-wide digital integration, and channel digitalization. Further details on this system are outlined in Table 2.
Table 2
| Level 1 | Level 2 | Direction | Weight |
|---|---|---|---|
| Digitalization of agricultural product circulation infrastructure | Per capita postal and telecommunications business volume (100 million CNY per 10,000 people) | + | 0.1733567 |
| Proportion of employees in the distribution sector (%) | + | 0.1552347 | |
| Proportion of distribution sector output in regional GDP (%) | + | 0.0221762 | |
| Digitalization of agricultural product circulation infrastructure | Number of broadband Internet connections (in 10,000 s) | + | 0.0832435 |
| Length of fiber optic cable (km) | + | 0.0898356 | |
| Mobile phone penetration rate (%) | + | 0.038591 | |
| Digitalization of agricultural product circulation channels | E-commerce sales as a percentage of regional GDP (%) | + | 0.1055079 |
| Value of distribution sector as a percentage of regional GDP (%) | + | 0.0383131 | |
| Wholesale-to-retail ratio (%) | - | 0.0063635 | |
| Digitalization of the agricultural product circulation industry | Per capita express delivery volume (items per person) | + | 0.2382773 |
| Depth of digital finance usage | + | 0.0491006 |
Digitalization index of agricultural product circulation.
“(+)” indicates a positive-oriented indicator (higher is better), and “(–)” indicates a negative-oriented indicator (higher is worse for digitalization).
3.1.3 Control variables
To ensure the robustness of the findings and mitigate the risk of omitted variable bias, this study incorporates several control variables that capture the key factors shaping rural modernization, including economic, infrastructural, and policy-related influences. Specifically, this study controls for regional economic development using the logarithm of regional GDP, infrastructure quality by the length of rural roads, and openness through the share of imports and exports in regional GDP. Additionally, local government strength is measured by the logarithm of local general budget revenue; basic investment levels are measured with the logarithm of the regional fixed asset price index. Missing data for 2020 and 2021 are interpolated, and to account for scale effects, all control variables are standardized.
3.1.4 Mediating variables
In this study, “green innovation” is defined as technological progress that enhances environmental sustainability and includes improvements in input-use efficiency, emission reductions, and ecological protection. While invention patents serve as a proxy due to data availability, this study acknowledges that not all innovations are inherently green.
Following the approach of Lu et al. (2024) and Sun (2022), this measure is cautiously interpreted here. This study emphasizes that digitalization indirectly fosters green innovation by creating incentives for environmental efficiency, lowering information asymmetries, and promoting eco-friendly practices via traceability and smart monitoring.
Technological innovation serves as an indicator of regional technological advancement and innovation vitality. Drawing on established research in this area (Tang et al., 2023), this paper measures technological innovation through the number of invention patents registered in each region.
Industrial structure indicates the degree of modernization and economic sustainability within a region. In this study, industrial structure is assessed using the ratio of output from the tertiary sector to that of the secondary sector, based on prior research (Zhou et al., 2024).
3.1.5 Instrumental variables
To address potential endogeneity among the variables, instrumental variables are applied for the endogeneity tests. Following the approach of Peng and Dan (2023), this study uses as instrumental variables the lagged one-period value of per capita postal and telecommunication services, multiplied by the Internet penetration rate.
3.2 Data sources
This study focuses on 30 provincial-level administrative regions in China, covering the period from 2012 to 2023. Tibet, Hong Kong, Macao, and Taiwan are excluded. The data are sourced from the China Statistical Yearbook, provincial statistical yearbooks, the China Energy Statistical Yearbook, the China Rural Statistical Yearbook, and the China Environmental Statistical Yearbook. Linear interpolation has been used to address missing values.
To ensure the reliability of the model, the first test was for multicollinearity. The results showed a maximum variance inflation factor of 2.66, indicating that there are no multicollinearity issues. Additionally, a panel unit root test was conducted on the explanatory variables to ensure data stability and avoid the risk of spurious regression. The results rejected the null hypothesis, thereby confirming the data's stability.
To explore the characteristics and trends of the variables, descriptive statistics were conducted, and the findings are summarized in Table 3.
Table 3
| Variables | Variables | Avg. | Std. Dev. | Min. | Max. |
|---|---|---|---|---|---|
| Dependent variable | DAPC | 0.24 | 0.06 | 0.14 | 0.51 |
| Independent variable | RAMI | 0.21 | 0.09 | 0.06 | 0.57 |
| Mediating variables | Technological innovation | 31,412.2 | 42,489 | 81 | 216,469 |
| Industrial structure | 1.225 | 0.69 | 0.52 | 5.31 | |
| Control variables | GDP | 4.28 | 0.4 | 3.18 | 5.38 |
| Fixed asset investment | 2.01 | 0.1 | 1.98 | 2.03 | |
| Rural road mileage | 149,252.3 | 79,837.06 | 12,084 | 394,371 | |
| Local fiscal revenue | 3.33 | 0.36 | 2.27 | 4.15 | |
| Degree of openness | 4.04 | 4.59 | 23.97 | 0.11 |
Descriptive statistics.
3.3 Method
3.3.1 Construction of RAMDI and DAPCI Using the entropy-weighted TOPSIS method
To comprehensively evaluate the degree of RAMDI and the level of DAPC, two composite indices are constructed using the entropy-weighted TOPSIS method. This approach integrates objective weighting based on information entropy with a multi-criteria ranking model, allowing for robust, data-driven synthesis of complex, multidimensional indicators.
Step 1: Indicator system and data matrix construction
The RAMDI and DAPCI indicators were selected based on theoretical relevance, data availability, and empirical validation in prior literature. For RAMDI, four core dimensions of rural modernization are incorporated: agricultural productivity, sustainability, structural upgrading, and rural living standards. For DAPCI, three dimensions are assessed: digital infrastructure, platform penetration, and digital transaction efficiency.
Tables 1, 2 list the specific indicators under each dimension, including positive (e.g., Internet penetration and green coverage rate) and negative (e.g., fertilizer intensity) indicators.
For each index, a decision matrix is constructed, where i represents a province-year observation, and j denotes an indicator. The RAMDI matrix spans 30 provinces over 12 years (2012–2023); the DAPCI matrix covers similar temporal and spatial dimensions.
Step 2: Data standardization
To ensure comparability, raw indicator values are normalized. For positive indicators (where higher values imply better outcomes):
For negative indicators (where lower values are preferable):
This yields a standardized matrix R = rij, with values ranging from 0 to 1.
Step 3: Entropy weight calculation
Entropy weights reflect the degree of dispersion for each indicator across observations:
Proportion of indicator j for object i:
Entropy value for indicator j:
Difference coefficient:
Final weight:
This objective weighting avoids researcher subjectivity and reflects the informational contribution of each variable.
Step 4: TOPSIS scoring and index construction
A weighted normalized matrix Zij = wj·rij is constructed. This study defines:
Positive ideal solution (PIS):
Negative ideal solution (NIS):
Then, calculate the Euclidean distance of each observation i to PIS and NIS:
A higher Ci value indicates a higher level of either RAMDI or DAPCI. These scores are finally normalized between 0 and 1.
The relative closeness to the ideal solution is computed as:
Step 5: Interpretation and application
The resulting indices, RAMDI and DAPCI, offer robust, interpretable measurements of modernization and digitalization across provinces and years. The entropy-weighted TOPSIS method enhances transparency and comparability by:
-
Capturing multidimensional performance,
-
Objectively assigning weights based on data variation,
-
Avoiding bias from arbitrary expert judgment.
These indices are subsequently used as core variables in this study's spatial econometric models, to explore the variables' interactions and spatial spillover effects.
3.3.2 Spatial autocorrelation modeling
Spatial weight matrix determination:
The digitalization of agricultural product circulation promotes the flow of production resources between provinces, which in turn affects RAM. Given that this impact exhibits strong spatial correlation, this study selects an adjacency matrix as the spatial weight matrix W. The construction method is straightforward: if region i is adjacent to region j, then Wij = 1; if they are not adjacent, then Wij = 0.
The obtained spatial weight matrix is used to test whether the core variables have spatial autocorrelation. In this paper, the widely-used Moran's index (Moran's I) is used to test the spatial autocorrelation, and the formula is as follows: Moran's I takes the value of [−1, 1]; if I>0, there is positive spatial correlation, and if I < 0, there is negative spatial correlation.
To examine spatial clustering around specific regions, this study also uses the local Moran's I. A positive local Moran's I value indicates spatial clustering in the vicinity of a region. Conversely, a negative value indicates the absence of such clustering.
3.3.3 Selection of spatial econometric model
To ensure the reliability of the empirical results, this study employs several tests to choose the appropriate spatial econometric model. The results are summarized in Table 4. First, both the Lagrange multiplier (LM) test and the robust LM test pass the significance level, suggesting the use of the spatial Durbin model (SDM). The Wald test further rejects the null hypothesis at the 1% level, confirming that the SDM is superior to both the spatial autoregressive model (SAR) and spatial error model (SEM). The likelihood ratio (LR) test also supports the use of the SDM, with all results significant at the 1% level, indicating that the SDM does not simplify into SAR or SEM models. Lastly, the Hausman test result (22.85, p = 0.044) leads to the selection of a fixed-effects model. Based on these tests, this paper adopts a spatial Durbin model with both time and provincial fixed effects.
Table 4
| Test | Value | P |
|---|---|---|
| LM-error | 14.038 | 0.006 |
| LM-lag | 51.037 | 0.001 |
| Robust LM-error | 10.058 | 0.000 |
| Robust LM-lag | 31.024 | 0.007 |
| Hausman test | 23.019 | 0.001 |
| Wald-spatial-error | 42.541 | 0.001 |
| Wald-spatial-lag | 24.083 | 0.036 |
| LR-spatial-error | 31.674 | 0.051 |
| LR-spatial-lag | 24.651 | 0.001 |
Spatial econometric model test results.
This study investigates how the digitalization of agricultural product circulation influences RAM, while accounting for spatial effects. The spatial Durbin model used in this analysis is specified as follows:
In the Equation (4), i and t represent provinces and years, respectively; Devruralj, t is the level of rural modernization and development; Si, t denotes the level of digitalization of agricultural product circulation; Xi, t represents control variables; ρ represents the autoregressive coefficients of the explanatory variables; β represents the coefficients of the spatial interaction terms of the explanatory variables; α represents the regression coefficients of the respective variables, and the spatial weighting matrices Wi, j, μ, λ, and ε represent the individual fixed effects, the time fixed effects, and the random disturbance terms, respectively.
4 Result
4.1 Spatial correlation tests
4.1.1 Global Moran's I
Before conducting spatial analysis, it is essential to assess whether the variables demonstrate spatial interaction and dependence. This can be evaluated using Moran's I, a widely-used measure of spatial correlation. Moran's I ranges from −1 to 1; positive values indicate spatial clustering, and negative values suggest spatial dispersion.
In this study, global Moran's I is applied to assess the spatial autocorrelation of DAPC and RAM, from 2012 to 2023. As shown in Table 5, the global Moran's I values for both variables are positive and statistically significant at the 5% level, indicating strong spatial correlation. This suggests that provinces with higher levels of DAPC tend to experience more advanced agricultural modernization.
Table 5
| Year | Moran's I | Z | P |
|---|---|---|---|
| 2012 | 0.577 | 3.287 | 0*** |
| 2013 | 0.454 | 2.007 | 0.045** |
| 2014 | 0.429 | 2.002 | 0.047** |
| 2015 | 0.505 | 2.516 | 0.011** |
| 2016 | 0.564 | 2.886 | 0.004*** |
| 2017 | 0.501 | 2.398 | 0.016** |
| 2018 | 0.471 | 2.191 | 0.036** |
| 2019 | 0.473 | 2.136 | 0.028** |
| 2020 | 0.486 | 2.225 | 0.035*** |
| 2021 | 0.526 | 2.627 | 0.005*** |
| 2022 | 0.554 | 2.701 | 0.018** |
| 2023 | 0.496 | 2.368 | 0.007*** |
Global Moran's I.
*** and ** represent significance levels of 1 and 5%, respectively.
Moreover, the temporal trend of Moran's I reveals that spatial correlation was strongest in 2012 and weakest in 2014. Despite these fluctuations, the overall spatial relationship between DAPC and RAM strengthened over the study period, reflecting ongoing improvements in both areas across China.
4.1.2 Local Moran's I
The local Moran's I is used to reflect the degree of spatial clustering between regions. This is typically illustrated with a scatter plot. To ensure the accuracy of the results, this study selected four specific years: 2012, which showed the strongest spatial correlation; 2014, which showed the weakest spatial correlation, and 2017 and 2020, which represented medium levels of spatial correlation. These years were chosen to provide a comprehensive understanding of spatial patterns over time.
In the scatter plot, the slope of the line represents the Moran's I. Points in the first and third quadrants indicate a positive spatial correlation, where similar values cluster together. In contrast, points in the second and fourth quadrants indicate a negative spatial correlation, where dissimilar values are adjacent.
In this study, the 30 provincial-level administrative regions in China are categorized into four major regions, based on their geographical location: east, central, west, and northeast. Figure 2 illustrates the distribution of agricultural modernization across these regions. Economically developed provinces, such as Beijing, Shanghai, Jiangsu, and Zhejiang, as well as some provinces in the central region, are situated in the first quadrant, indicating a “high-high” cluster. This suggests that, in these provinces, RAM benefits from strong synergies, with positive spillover effects across regions.
Figure 2
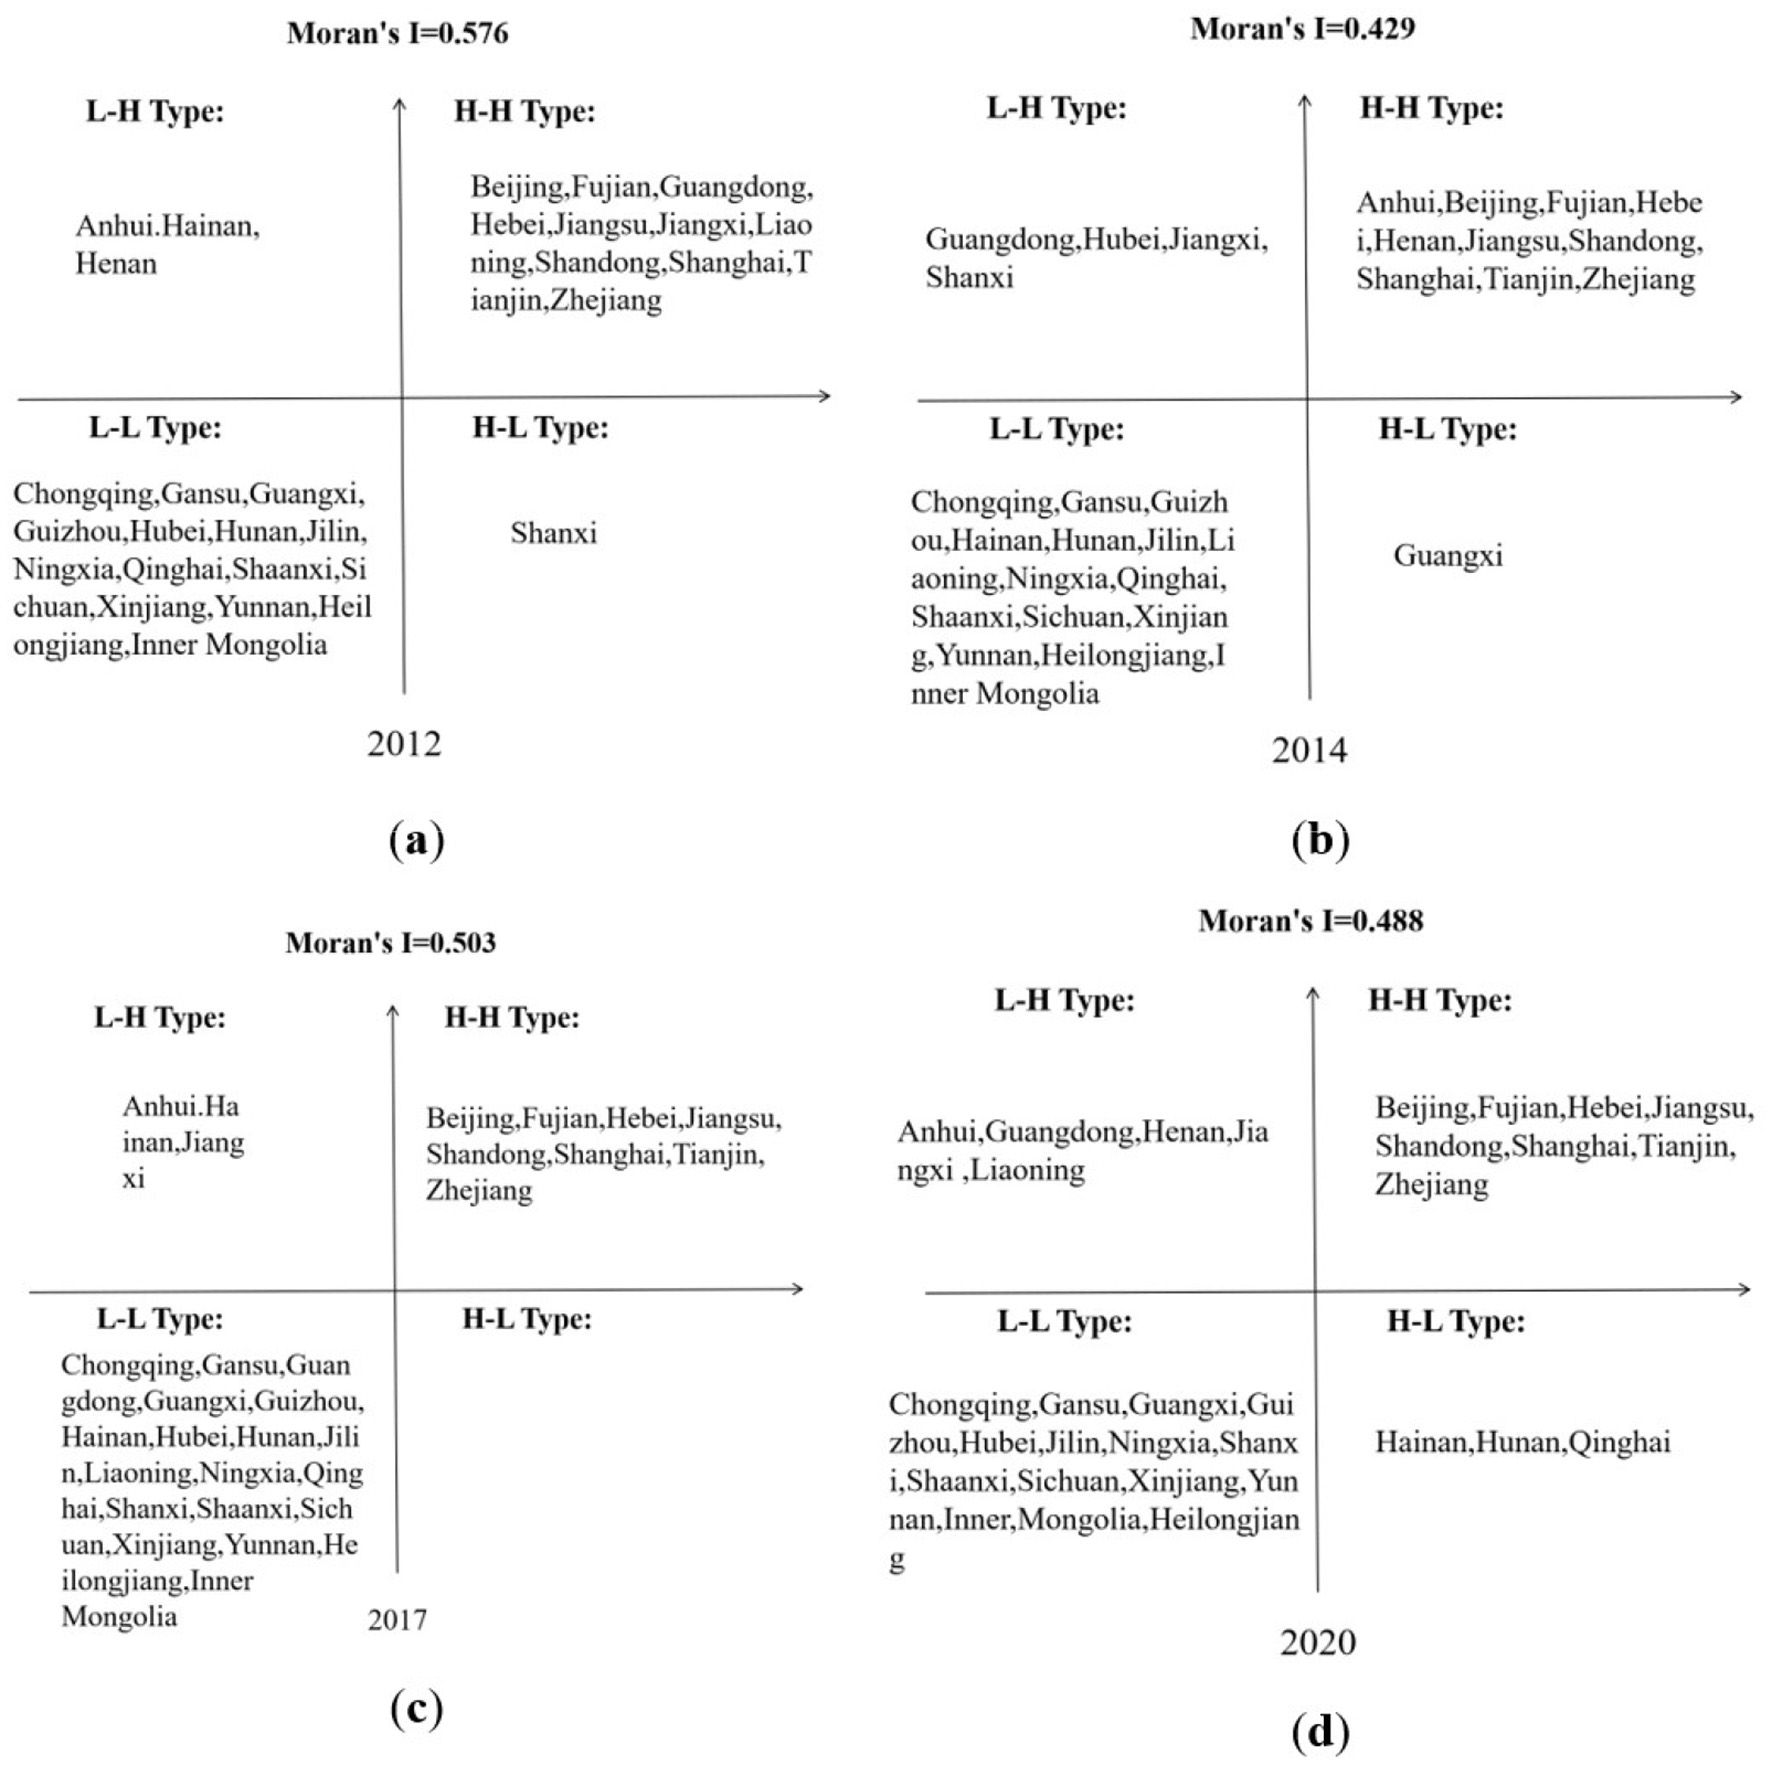
Distribution types of agricultural modernization in Chinese provincial regions (2012, 2014, 2017, and 2020). The four subplots show spatial distribution patterns for respective years, with global Moran's I statistics (top) and year labels (bottom) indicated for each subplot.
In contrast, Liaoning and Hainan appear closer to the origin. Their location on the periphery of China, combined with there being fewer neighboring provinces, likely limits these provinces' spatial influence. Most provinces in the western region and some in the central region are clustered in the third quadrant, reflecting weaker RAM. This pattern can be attributed to economic and environmental factors, such as challenging natural conditions and limited transportation infrastructure. The “low-low” concentration in these areas highlights the need for significant improvements in China's overall level of RAM.
4.2 Analysis of the empirical results
According to the results in the first column of Table 6, DAPC has a significant positive impact on advancing RAM in China, thus confirming Hypothesis 1. Specifically, the regression coefficient for the digitalization level is 0.149, which passes the hypothesis test at the 1% significance level. This suggests that, all else being equal, a 1% increase in the digitalization level of the distribution industry leads to a 0.149% rise in RAM. Thus, Hypothesis 1 is confirmed.
Table 6
| Variables | Uncontrol | Control | SDM |
|---|---|---|---|
| DAPC | 0.142*** (0.037) | 0.149*** (0.053) | 0.603*** (7.57) |
| W*DAPC | 0.09** (0.022) | ||
| Constant | 0.943*** (0.467) | 0.945*** (0.482) | 0.731* (0.466) |
| GDP | 0.078*** (0.020) | 0.028* (0.017) | |
| Fixed asset investment | −0.611*** (0.232) | −0.537*** (0.233) | |
| Rural road mileage | 0.493*** (1.298) | 0.096*** (0.022) | |
| Local fiscal revenue | 0.028* (0.017) | 0.016* (0.036) | |
| Degree of openness | 0.213* (0.232) | 0.441* (0.226) | |
| RΛ2 | 0.3941 | 0.5342 | 0.696 |
Spatial econometric model regression results.
***, **, and * represent significance levels of 1%, 5%, and 10%, respectively; standard errors are in parentheses.
To strengthen the empirical comparison, a benchmark regression was conducted, both without and with control variables, as shown in Columns (1) and (2) of Table 8. The findings confirm that the DAPC facilitates RAM. Although the coefficient for digitalization drops from 0.149 to 0.061 after adding control variables, the coefficient remains significant at the 1% level. This finding indicates that the effect of digitalization on modernization is robust, even after accounting for additional factors. This further confirms Hypothesis 1.
For further analysis, the spatial Durbin model is used to explore the spatial relationships between the variables across regions. The results, presented in Column (3) of Table 6, highlight the spatial spillover effects of digitalization. The coefficient of the spatial interaction term (W*DAPC) for the core explanatory variable is 0.021, which is significant at the 5% level. This finding indicates that regions with higher levels of DAPC positively influence neighboring areas. The spillover effect promotes trade circulation and factor mobility between provinces, contributing to a broader increase in DAPC. Consequently, this strengthens RAM across regions, which is consistent with Hypothesis H3.
4.3 Endogeneity test
The benchmark regression results confirm that DAPC positively influences RAM. However, given the broad scope of agricultural modernization and the complexity of its influencing factors, some control variables may have been omitted in this study. This omission could lead to endogeneity, potentially affecting the robustness of the regression outcomes.
To address this issue, following the approach used by Peng and Dan (2023), this study employs the per capita postal and telecommunications business Internet penetration rate (lagged by one period) as an instrumental variable. A two-stage least squares (2SLS) regression is then conducted to account for potential endogeneity.
As presented in Table 7, the instrumental variable is strongly correlated with the endogenous variable, with both passing significance at the 1% level. In the weak instrument test, the F-statistic is 63.8, exceeding the critical value of 10. This result rejects the null hypothesis of weak instruments. Additionally, the non-identification test yields a p-value of 0.000, rejecting the hypothesis of insufficient identification and thereby confirming that the instrumental variable is valid and well-chosen. The Column (2) of Table 7 presents the adjusted results, which remain significant at the 1% level. This finding confirms that endogeneity has been addressed, and the conclusion that DAPC drives RAM holds firm.
Table 7
| Variables | First stage (Dev. Rural) | Second stage (S) |
|---|---|---|
| Tool | 0.035*** (7.99) | |
| Dev. Rural | 0.520*** (4.76) | |
| Control | Included | Included |
| Wald F | 26.002*** | |
| Endogeneity Wald F | 63.8*** | |
| Weak instrument validity test (10%) | 16.38 | |
| Constant | −8.512*** (−29.20) | −6.772*** (−6.98) |
| R square | 0.897 | 0.876 |
Endogeneity test results.
*** represent significance level of 1%; standard errors are in parentheses.
4.4 Robustness test
To ensure the robustness of the results, this paper applies two verification methods. First, the weight matrix is replaced by a standard distance matrix for regression analysis. Second, recognizing that the quality of the labor force may influence the levels of DAPC and RAM, a control variable is introduced to account for the educational level of the rural labor force. Specifically, the proportion of the rural population with tertiary education or higher is used as a measure of labor force education (EDU).
The regression results in Table 8 indicate that both the coefficient for DAPC and the spatial interaction term remain significantly positive. These findings align with the main conclusions of this study, further supporting the robustness of the results.
Table 8
| Variables | 1 | 2 |
|---|---|---|
| DAPC | 0.082*** (0.044) | 0.852*** (0.052) |
| W* DAPC | 0.066*** (0.022) | 0.076*** (0.021) |
| Control | Yes | Yes |
| RΛ2 | 0.3941 | 0.5078 |
Robustness test results.
*** represent significance level of 1%; standard errors are in parentheses.
4.5 Mechanisms of influence from DAPC to RAM
To explore the driving mechanism of DAPC and its impact on RAM, this study conducts mediation tests using two selected mediator variables. To assess the mediation effects, a stepwise regression analysis is applied alongside the bootstrap method.
The mediation analysis uses both the non-parametric percentile bootstrap method and the bias-corrected percentile bootstrap method. A random sample size of 1,000 is used, with the confidence level set at 95%. Given that multiple mediators are involved, and the direct effect alone does not fully capture the mechanism, this study focuses on the indirect effects using the bootstrap method. The results of the mediation tests are summarized in Table 9.
Table 9
| Technological innovation | Industrial structure | |||
|---|---|---|---|---|
| Variables | lninvent | lnRural | Lnindustry | lnRural |
| DAPC | 0.687*** (8.20) | 0.052*(1.79) | 0.429*** (12.64) | 0.252***(6.50) |
| Constant | −8.291*** (−19.83) | −3.952***(−3.36) | −8.093*** (−21.09) | 5.768***(11.96) |
| Control | Yes | Yes | Yes | Yes |
| Fixed | Yes | Yes | Yes | Yes |
| R square | 0.809 | 0.817 | 0.866 | 0.543 |
| F | 270.8*** | 327.6*** | 72.15*** | 219.4*** |
| Bootstrap | [0.1046,0.1887] (P) | [−0.1073, −0.012] (P) | ||
| [0.1084,0.1924] (BC) | [−0.1036, −0.0089] (BC) | |||
Mechanisms of influence from DAPC to RAM.
*** and * represent significance levels of 1% and 10%; standard errors are in parentheses.
Columns (1) and (3) present the regression results examining the impact of the digitalization of DAPC on two mediator variables: technological innovation and industrial structure. In Column (1), the regression coefficient for the digitalization of the distribution sector on technological innovation is 0.678, which is significant at the 1% level. This finding suggests that digitalization significantly enhances the level of rural informatization and thereby drives technological advancements in the countryside.
Similarly, Column (3) shows that the regression coefficient for DAPC on industrial structure is 0.429, also significant at the 1% level. This finding indicates that digitalization plays a crucial role in diversifying rural industries and optimizing the rural industrial structure. The results highlight the transformative potential of digitalization in fostering rural development through both technological and industrial channels.
Columns (2) and (4) of Table 9 present the combined effect of DAPC and the mediating variables on RAM. Specifically, the influence of technological innovation on RAM is notable, with a coefficient of 0.21, significant at the 1% level. This underscores the importance of technological innovation as a key driver of rural agricultural development.
Additionally, the impact of industrial structure on RAM is reflected in a coefficient of 0.134, which is significant at the 5% level. This suggests that the optimization and upgrading of the industrial structure play a supportive role in promoting rural modernization.
The results of the stepwise regression analysis indicate that DAPC significantly promotes RAM. This effect is achieved through two key channels: technological innovation and the optimization of industrial structure. To further validate these findings, the mediation effect was tested using the bootstrap method.
The bootstrap test for a significant mediation effect requires that the observed confidence interval does not include 0. As shown in Table 9, the confidence intervals for the indirect effect of DAPC through technological innovation are [0.1046, 0.1887] and [0.1084, 0.1924] for the uncorrected and corrected methods, respectively, both of which exclude 0. Similarly, the confidence interval for the indirect effect through industrial structure optimization is [0.1046, 0.1887], which also does not include 0.
These results confirm that the mediation effects of both technological innovation and industrial structure optimization are significant. This finding provides strong evidence for the validity of this study's proposed mediation model by demonstrating that the digitalization of the distribution sector is a key driver of RAM. This result is consistent with Hypothesis H2.
4.6 Heterogeneity analysis
Given the varying stages of development and resource endowments across provinces, this paper conducts a regression analysis using the SDM for the eastern, central, and western regions. The results, presented in Table 10, indicate that DAPC has a different impact on RAM across these three macro-regions.
Table 10
| Variables | Spatial variability | ||
|---|---|---|---|
| East | Central | West | |
| DDI | 0.204*** (0.057) | 0.442*** (0.071) |
−0.019 (0.53) |
| W*DDI | 0.072*** | −0.299 | −0.421 |
| (0.026) | (1.019) | (0.242) | |
| R square | 0.936 | 0.938 | 0.932 |
| F | 124.5 | 82.58 | 81.67 |
| N | 120 | 100 | 90 |
Heterogeneity analysis.
*** represent significance levels of 1%; standard errors are in parentheses.
Specifically, in the eastern region, DAPC positively contributes to RAM, with notable spatial spillover effects. This can be attributed to the region's well-developed infrastructure, high market integration, and the collaborative and interconnected digital circulation systems, factors which create a conducive environment for agricultural advancement. The eastern provinces also benefit from early adoption of e-commerce platforms and strong rural-urban linkages, which facilitate knowledge and technology diffusion.
In the central region, digitalization has also promoted RAM; the positive effect is even stronger than in the eastern region. However, the spatial spillover effect is negative, suggesting that digital gains may be internalized rather than shared. This may reflect competitive dynamics, whereby resource-rich provinces absorb regional talent and capital, impeding positive externalities. The central region has a large agricultural base, and there is an ongoing transition from traditional to digital supply chains, meaning that the benefits are unevenly distributed and less portable across neighboring areas.
In contrast, in the western region, the impact of digitalization on RAM is statistically insignificant, as is the spatial spillover effect. Lagging digital infrastructure, fragmented distribution channels, and low adoption rates among rural producers may be the causes of this result. Infrastructural constraints – such as limited broadband coverage, poor transportation networks, and inadequate logistics – create barriers to fully realizing the benefits of digital transformation. In addition, competition for limited digital resources may lead to a “siphoning effect,” whereby advanced neighboring regions attract investment and talent, thereby reinforcing regional disparities. A spatial clustering analysis confirms this pattern, with western provinces exhibiting “low-low” spatial clusters, indicating that regions with lower levels of digitalization and agricultural modernization tend to be surrounded by similarly underperforming areas. This spatial autocorrelation suggests not only endogenous developmental constraints but also a lack of positive externalities from adjacent provinces.
As emphasized by Mohammed et al. (2025), the transformative effect of technology in rural areas is highly contingent on localized socioeconomic and infrastructural contexts. Therefore, the observed spatial structure reinforces the presence of a regional development trap, in which both internal limitations and external siphoning effects hinder the diffusion of digital transformation. These findings support Hypothesis 3, thereby highlighting the necessity of region-specific digitalization policies that address infrastructural and institutional bottlenecks.
5 Conclusion and discussion
This study investigates the relationship between the digitalization of the agricultural product circulation (DAPC) and rural agricultural modernization (RAM) across 30 provincial regions in China, using data from 2012 to 2023. By developing two composite indices and employing a spatial Durbin model, this study provides a nuanced and regionally differentiated understanding of these dynamics.
The study's findings reveal several key insights, as follows:
-
(1) Digitalization significantly enhances RAM, with positive spatial spillover effects. Provinces with more advanced digital circulation systems not only benefit locally, but they also exert influence on neighboring regions, highlighting the systemic nature of digital transformation in agriculture.
-
(2) The impact of digitalization is mediated by green innovation and industrial structure upgrading. These two mechanisms serve as critical channels linking digital progress to sustainable agricultural modernization.
Considerable regional heterogeneity exists in the effects of digitalization. While the eastern region benefits from strong direct and spillover effects, the central region experiences strong internal gains but negative external spillovers. In contrast, the results in the western region are insignificant, suggesting structural and institutional limitations.
To address the uneven impact of digitalization, regionally tailored strategies are essential. Specifically:
For regions experiencing negative spillovers, to reduce competitive exclusion, policies should be implemented that foster inter-regional collaboration, such as digital infrastructure sharing and inter-provincial logistics integration.
For digitally underdeveloped areas, targeted public investment is needed to improve broadband access, e-commerce training, and rural logistics infrastructure. Such developments can help alleviate the “siphoning effect” and enable inclusive participation in digital agricultural networks.
For less developed provinces, national-level frameworks should also support data standardization, platform interoperability, and talent retention programs.
While this study focuses on the supply and distribution side of agricultural modernization, achieving true sustainability also requires attention to demand-side factors, especially cultural and generational influences on food choices. Recent studies (Cisternas et al., 2024) have shown that generational cohorts and cultural norms play a pivotal role in shaping consumer acceptance of digitally marketed or sustainably produced agricultural products. In the context of rural e-commerce, younger consumers are more likely to embrace digital platforms for purchasing sustainable food. Conversely, older generations may exhibit lower trust or digital literacy. Recognizing these socio-cultural dynamics is crucial for maximizing the market potential and social acceptance of digitalized agricultural supply chains.
Compared with existing literature, this study offers several novel contributions. First, while prior works (Lu et al., 2024; Sun, 2022) have examined digitalization and green transformation in isolation, this study proposes an integrated analytical framework linking digital circulation, green innovation, and spatial spillovers. The development of RAMDI and DAPCI also offers a replicable, multi-dimensional approach to measurement, thereby advancing both methodological rigor and practical utility.
Nevertheless, some limitations remain. The proxies for green innovation (e.g., invention patents) used in this study may not fully reflect the ecological quality of innovations. The analysis is also confined to the Chinese context, which may limit the findings' generalizability. Future research could further explore demand-side behavior, including digital trust, generational technology adoption, and consumer preferences for sustainability, to complement the supply-side focus of the current work.
Statements
Data availability statement
The datasets presented in this study can be found in online repositories. The names of the repository/repositories and accession number(s) can be found below: https://www.stats.gov.cn/english/Statisticaldata/yearbook/.
Author contributions
HW: Conceptualization, Data curation, Formal analysis, Funding acquisition, Methodology, Supervision, Validation, Writing – original draft, Writing – review & editing. LZ: Investigation, Methodology, Software, Writing – review & editing. ZA: Resources, Supervision, Validation, Writing – review & editing.
Funding
The author(s) declare that financial support was received for the research and/or publication of this article. This research was funded by the General Research Grant of the Commerce Statistical Society of China (CSSC), grant number 26, and the Research Project of the Laboratory of South-Central Minzu University, grant number SYYJ2025023.
Conflict of interest
The authors declare that the research was conducted in the absence of any commercial or financial relationships that could be construed as a potential conflict of interest.
Generative AI statement
The author(s) declare that no Gen AI was used in the creation of this manuscript.
Correction Note
A correction has been made to this article. Details can be found at: 10.3389/fsufs.2025.1684762.
Publisher’s note
All claims expressed in this article are solely those of the authors and do not necessarily represent those of their affiliated organizations, or those of the publisher, the editors and the reviewers. Any product that may be evaluated in this article, or claim that may be made by its manufacturer, is not guaranteed or endorsed by the publisher.
Supplementary material
The Supplementary Material for this article can be found online at: https://www.frontiersin.org/articles/10.3389/fsufs.2025.1538024/full#supplementary-material
References
1
Abdulai A. R. (2022). A New Green Revolution (GR) or Neoliberal Entrenchment in Agri-food Systems? Exploring narratives around digital agriculture (DA), food systems, and development in Sub-Sahara Africa. J. Dev. Stud.58, 1588–1604. 10.1080/00220388.2022.2032673
2
Barney J. B. Ketchen D. J. Wright M. (2021). Resource-based theory and the value creation framework. J. Manage.47, 1936–1955. 10.1177/01492063211021655
3
Chaudhary S. Suri P. K. (2022). Modelling the enablers of e-trading adoption in agricultural marketing: a TISM-based analysis of eNAM. Vision-the J. Bus. Perspect.26, 65–79. 10.1177/0972262920977979
4
Chen M. Long Y. A. (2024). Empowering rural revitalization: unleashing the potential of e-commerce for sustainable industrial integration. J. Knowl. Econ.10.1007/s13132-024-01813-3
5
Cheng Y. M. Zeng B. Lin W. X. (2024). Heterogenous effects of inclusive digital economy and resource distribution mismatch on corporate ESG performance in China. Res. Policy92:104973. 10.1016/j.resourpol.2024.104973
6
Cisternas F. Sun C. Contador C. A. Anders S. Chu M. Phan N. et al . (2024). Cultural and generational factors shape Asians, sustainable food choices: insights from choice experiments and information nudges. Cell Rep. Sustain. 1:100020. 10.1016/j.crsus.2024.100020
7
Cunningham J. A. Damij N. Modic D. Olan F. (2023). MSME technology adoption, entrepreneurial mindset and value creation: a configurational approach. J. Tech. Transfer48, 1574–1598. 10.1007/s10961-023-10022-0
8
Deng X. Q. Huang M. S. Peng R. (2024). The impact of digital economy on rural revitalization: evidence from Guangdong, China. Heliyon10:e28216. 10.1016/j.heliyon.2024.e28216
9
Feng S. L. Chong Y. Yang Y. Hao X. R. (2022). Digitization and total factor productivity: evidence from China. Singap Econ. Rev.4, 1–33. 10.1142/S0217590822500771
10
Ghazal S. Munir A. Qureshi W. S. (2024). Computer vision in smart agriculture and precision farming: techniques and applications. Artif. Intell. Agric.13, 64–83. 10.1016/j.aiia.2024.06.004
11
Gong S. Y. Sun Z. Y. Wang B. Yu Z. G. (2024). Could digital literacy contribute to the improvement of green production efficiency in agriculture?Sage Open14:232789. 10.1177/21582440241232789
12
Goyal M. Kaur A. (2021). Status and performance appraisal of electronic national agricultural markets (e-NAM) in Punjab. Indian J. Econ. Dev. 17, 647–652. 10.35716/IJED/21012
13
Huang P. Tafti A. Mithas S. (2018). Platform sponsor investments and user contributions in knowledge communities: the role of knowledge seeding. Mis Quart.42, 213–240. 10.25300/MISQ/2018/13490
14
Khan N. Babar M. A. (2024). Innovations in precision agriculture and smart farming: Emerging technologies driving agricultural transformation. Innov. Emerg. Tech.11:2430004. 10.1142/S2737599424300046
15
Kortleve A,. J. Mogollón J. M. Harwatt H. Behrens P. (2024). Over 80% of the European union's common agricultural policy supports emissions-intensive animal products. Nat. Food5, 288–292. 10.1038/s43016-024-00949-4
16
Li T. H. Wen J. Y. Zeng D. W. Liu K. (2022). Has enterprise digital transformation improved the efficiency of enterprise technological innovation? A case study on Chinese listed companies. Math. Biosci. Eng.19, 12632–12654. 10.3934/mbe.2022590
17
Liu L. L. Qin S. B. Xing F. Y. Zou J. P. Al-Ethawi A. (2022). Research on the influencing factors of agricultural product purchase willingness in social e-commerce situation. Appl. Math. Nonlinear Sci.7, 999–1012. 10.2478/amns.2021.2.00210
18
Liu S. Jin Y. H. Zheng F. T. (2024). Did product certification and e-commerce benefit agricultural producers in China?Food Policy127:102688. 10.1016/j.foodpol.2024.102688
19
Lu S. Zhuang J. Sun Z. Huang M. (2024). How can rural digitalization improve agricultural green total factor productivity: empirical evidence from counties in China. Heliyon10:e35296. 10.1016/j.heliyon.2024.e35296
20
Ma L. N. Wang T. C. (2024). The impact of digital economy on the high quality development of agricultural enterprises: evidence from listed agricultural enterprises in China. Sage Open14:257358. 10.1177/21582440241257358
21
Manta A. G. Doran N,. M. Badircea R,. M. Badareu G. Ghertescu C. Lapadat C. V. M. (2024). Does common agricultural policy influence regional disparities and environmental sustainability in European Union Countries?Agriculture-Basel14:2242. 10.3390/agriculture14122242
22
Meng T. T. Yu D. Ye L. D. Yahya M. H. Zariyawati M. A. (2023). Impact of digital city competitiveness on total factor productivity in the commercial circulation industry: evidence from China's emerging first-tier cities. Human. Soc. Sci. Commun.10:927. 10.1057/s41599-023-02390-7
23
Mohammed U. A. Abubakar A. U. Yunus T. T. Eleke U. P. Sennuga O. S. Nnanna U. A. (2025). The role of technology in transforming rural social systems: an insightful review. J. Nutr. Food Proces. 8:281. 10.31579/2637-8914/281
24
Peng Z. Z. Dan T. (2023). Digital dividend or digital divide? Digital economy and urban-rural income inequality in China. Telecommun. Policy47:102616. 10.1016/j.telpol.2023.102616
25
Saini A,. K. Yadav A,. K. Dhiraj (2025). A comprehensive review on technological breakthroughs in precision agriculture: IoT and emerging data analytics. Eur. J. Agro.163:127440. 10.1016/j.eja.2024.127440
26
Shamshiri R,. R. Sturm B. Weltzien C. Fulton J. Khosla R. Schirrmann M. et al . (2024). Digitalization of agriculture for sustainable crop production: a use-case review. Front. Environ. Sci.12:1375193. 10.3389/fenvs.2024.1375193
27
Sun Y. (2022). Environmental regulation, agricultural green technology innovation, and agricultural green total factor productivity. Front. Environ. Sci. 10:955954. 10.3389/fenvs.2022.955954
28
Tang M. G. Liu Y. L. Hu F. X. Wu B. J. (2023). Effect of digital transformation on enterprises' green innovation: empirical evidence from listed companies in China. Energy Econ.128:107135. 10.1016/j.eneco.2023.107135
29
Tian Y. Liu Q. Ye Y. T. Zhang Z. F. Khanal R. (2023). How the rural digital economy drives rural industrial revitalization-case study of China's 30 provinces. Sustainability15:6923. 10.3390/su15086923
30
Walker C. (2024). Limited growth in smallholder farm productivity in sub-Saharan Africa. Nat. Plants10, 834–834. 10.1038/s41477-024-01736-6
31
Wang E. P. Liu Z. Z. Gao Z. F. Wen Q. Geng X. H. (2022). Consumer preferences for agricultural product brands in an E-commerce environment. Agribusiness38, 312–327. 10.1002/agr.21732
32
Wang Y. F. Peng Q. Y. Jin C. Ren J. Fu Y. Y. Yue X. F. (2023). Whether the digital economy will successfully encourage the integration of urban and rural development: a case study in China. Chin. J. Popul. Res. Environ.21, 13–25. 10.1016/j.cjpre.2023.03.002
33
Yan Z. F. Peng L. W. Wu X. (2023). Evaluation system for agricultural and rural modernization in China. Agric-Basel13:1930. 10.3390/agriculture13101930
34
Yang C. F. Ji X. Cheng C. M. Liao S. Bright O. Zhang Y. F. (2024). Digital economy empowers sustainable agriculture: implications for farmers' adoption of ecological agricultural technologies. Ecol. Indic.159:111723. 10.1016/j.ecolind.2024.111723
35
Yang R. Y. Liu J. F. Cao S. S. Sun W. Kong F. T. (2024). Impacts of agri-food e-commerce on traditional wholesale industry: Evidence from China. J. Integr. Agric.23, 1409–1428. 10.1016/j.jia.2023.10.020
36
Yang X. J. Liu K. Li W. (2025). Symbiotic relationship and attribution analysis of digitalization in agriculture, rural, and finance: evidence from China. Front. Sustain Food Syst.9:1545548. 10.3389/fsufs.2025.1545548
37
Yuan Y. Guo X. Y. Shen Y. (2024). Digitalization drives the green transformation of agriculture-related enterprises: a case study of a-share agriculture-related listed companies. Agriculture-Basel14:1308. 10.3390/agriculture14081308
38
Zamani S. Z. (2022). Small and medium enterprises (SMEs) facing an evolving technological era: a systematic literature review on the adoption of technologies in SMEs. Eur. J. Innov. Manag.25, 735–757. 10.1108/EJIM-07-2021-0360
39
Zhao G. L. Deng Z. J. Liu C. (2024). Assessment of the coupling degree between agricultural modernization and the coordinated development of black soil protection and utilization: a case study of Heilongjiang province. Land13:288. 10.3390/land13030288
40
Zhou W. H. Zhang X. Y. Wu X. M. (2024). Digital inclusive finance, industrial structure, and economic growth: an empirical analysis of Beijing-Tianjin-Hebei region in China. PLoS ONE19:e0299206. 10.1371/journal.pone.0299206
41
Zhou X. J. Du M. Dong H. (2023). Spatial and temporal effects of China's digital economy on rural revitalization. Front. Energy Res.11:1061221. 10.3389/fenrg.2023.1061221
42
Zhu J. H. Li Z. H. (2021). Can digital financial inclusion effectively stimulate technological Innovation of agricultural enterprises?-A case study on China. Nat. Account. Rev.3, 398–421. 10.3934/NAR.2021021
43
Zhu P. H. Li Z. X. Meng X. H. Chen Z. Y. (2024). Information infrastructure and environmental, social, and governance performance of the enterprise: a quasi-experimental analysis. Emerg. Markets Finance Trade.60, 2768–2782. 10.1080/1540496X.2024.2324188
Summary
Keywords
rural agricultural modernization, agricultural product circulation digitalization, spatial spillover effects, green innovation, industrial structure optimization
Citation
Wang H, Zhang L and An Z (2025) Digital transformation in agricultural circulation: enhancing rural modernization and sustainability through technological innovation. Front. Sustain. Food Syst. 9:1538024. doi: 10.3389/fsufs.2025.1538024
Received
02 December 2024
Accepted
27 June 2025
Published
08 August 2025
Corrected
29 August 2025
Volume
9 - 2025
Edited by
Rose Nyikal, University of Nairobi, Kenya
Reviewed by
Jiquan Peng, Jiangxi University of Finance and Economics, China
Francisco Cisternas Vera, The Chinese University of Hong Kong, China
Updates
Copyright
© 2025 Wang, Zhang and An.
This is an open-access article distributed under the terms of the Creative Commons Attribution License (CC BY). The use, distribution or reproduction in other forums is permitted, provided the original author(s) and the copyright owner(s) are credited and that the original publication in this journal is cited, in accordance with accepted academic practice. No use, distribution or reproduction is permitted which does not comply with these terms.
*Correspondence: Zhongyin An anzhongyin@mail.scuec.edu.cn
Disclaimer
All claims expressed in this article are solely those of the authors and do not necessarily represent those of their affiliated organizations, or those of the publisher, the editors and the reviewers. Any product that may be evaluated in this article or claim that may be made by its manufacturer is not guaranteed or endorsed by the publisher.