 Tinashe Lindel Dirwai
 Aidan Senzanje
 Tafadzwanashe Mabhaudhi
- 1International Water Management Institute, Harare, Zimbabwe
- 2Centre for Transformative Agricultural and Food Systems, School of Agricultural, Earth and Environmental Sciences, University of KwaZulu-Natal, Pietermaritzburg, South Africa
- 3School of Engineering, University of KwaZulu-Natal, Pietermaritzburg, South Africa
- 4Centre for Water Resources Research (CWRR), University of KwaZulu-Natal, Pietermaritzburg, South Africa
- 5Centre on Climate Change and Planetary Health, London School of Hygiene and Tropical Medicine London, London, United Kingdom
- 6United Nations University, Institute for Water, Environment and Health (IWEH), Richmond Hill, ON, Canada
- 7Institute for Natural Resources (INR), Pietermaritzburg, South Africa
Introduction: Understanding nitrate distribution and leaching under various irrigation strategies is critical for optimizing nitrogen use efficiency and minimizing environmental losses. While previous studies have explored wetting patterns under Moistube Irrigation (MTI) and discussed qualitative nitrate retention, few have quantitatively simulated nitrate transport through variably saturated zones with fine temporal-spatial resolution.
Methods: A field experiment was conducted in a 20 m × 8 m naturally ventilated greenhouse using three irrigation regimes: (i) full irrigation (100% ETc), (ii) optimal deficit irrigation (75% ETc), and (iii) extreme deficit irrigation (55% ETc). Each regime was replicated across four 2 m × 1 m plots, physically and hydrologically separated by 1 m buffers. Fertilizer was applied at 210 ppm in two split applications. Soil samples were collected both adjacent to and 15 cm away from MTI laterals at multiple depths before and at 2 h, 4 h, 24 h, 48 h, and 72 h post-fertigation. HYDRUS 2D/3D was used to simulate solute transport, while nitrogen use efficiency was evaluated using the partial factor productivity of applied nitrogen (PFPN).
Results: The 55% ETc regime showed the highest nitrate leaching, followed by the 75% ETc regime. Full and optimal deficit irrigation regimes achieved yields ≥ 1.15 ton.ha−1 and PFPN values of 1.72 kg.kg−1 and 1.29 kg.kg−1, respectively. HYDRUS 2D/3D accurately simulated solute transport for full and optimal DI regimes with performance metrics [nRMSE ≤ 0.24, EF ≤ 0.54, PBIAS ≤ −7.41%], but performed poorly under the extreme deficit irrigation.
Discussion: The findings suggest that optimal deficit irrigation under MTI enables effective fertigation with minimal yield penalties, offering a balance between water savings and nutrient retention. MTI, combined with precise fertigation scheduling, shows promise as a climate-smart agriculture solution, particularly in nitrate-sensitive zones. The study confirms the feasibility of using MTI beyond laboratory settings, with implications for sustainable intensification in semi-arid regions.
Introduction
The burgeoning world population requires intensified agriculture to maintain and increase food security. Irrigation and fertilization are important factors that facilitate intensified crop production (Bar-Yosef, 1999). Fertigation has reported advantages over the conventional broadcasting methods, and these advantages include flexibility in nutrient application, minimal fluctuations under fertigation systems to ensure uniform nutrient application. Precise application using micro-irrigation technology avoids excesses in the application and targets points where there is high root density (Bar-Yosef, 1999). Irrigation and fertilization are intrinsically linked thus, improved irrigation technology promotes efficient liquid nutrient application. Gärdenäs et al. (2005) posited that micro-irrigation systems such as drip emitters, drip tape and micro-sprinklers could potentially apply water and nutrients with precision, thus promoting uniformity.
Vegetable crops such as canola has economic importance. Fertigation is an important agronomic practice that ensures that spatial and temporal nutrient supply is maintained thus, averting yield penalties (Incrocci et al., 2017). Irrigation frequency plays a critical role in many soluble fertilizers. For example, Urea, which is a highly soluble fertilizer, does not adhere to colloids but has free movement aided by irrigation duration until its eventual transformation to (Hanson et al., 2006; Incrocci et al., 2017). The distribution is also a function of soil texture. Henceforth, for sub-surface irrigation and fertigation systems, soil texture and accurate irrigation schedules are requested to prevent excessive leaching and vadose zone contamination.
Vadose zone contamination due to nitrates poses a threat to groundwater sources. This requires fertigation technologies that minimize nitrate leaching. Literature has revealed that drip fertigation significantly reduces nitrogen (N) leaching by 90% compared to conventional flood irrigation (Lv et al., 2019). Some studies by Clothier and Sauer (1988) and Mmolawa and Or (2000a) have investigated fertilizer distribution around a dripline, and both studies emphasized that solute movement is largely driven by convection flow as influenced by the wetting geometry. Hanson et al. (2006) modeled fertilizer distribution under surface drip, and subsurface drip tape and Ajdary et al. (2007) investigated nitrogen leaching from an onion field under drip fertigation and both studies revealed that fertigation efficiency was a function of soil properties, irrigation scheduling and fertilizer placement. The studied underpinned the importance of integrated nutrient management for optimal fertilization which minimizes leaching in drip system. Given these circumstances, there exists a gap on Moistube Irrigation (MTI) given the limited knowledge on soil wetting geometries for the different soils. Although Dirwai et al. (2022) developed wetting geometry equation for heavy clays and fine sand, the work has not been extended to fertigation under MTI.
Sun et al. (2019a) performed a soil bin experiment to investigate the infiltration capacity and the distribution characteristics of fertilizer solution in wetted soils under Moistube irrigation (MTI) and revealed that (i) the soil-biomass mixture improved infiltration rate and (ii) the functional relationship between the cumulative infiltration of fertilizer solution and infiltration time followed the Kostiakov infiltration model (Parhi et al., 2007; Zakwan, 2017). Another study by Liu et al. (2017) investigated MTI water salinity distribution under different soils and pressure heads and revealed that water and salt distribution were a function of pressure head and bulk density. The study further postulated that higher pressure heads and lower bulk densities promoted deeper water infiltration and broader salt dispersion, affecting the uniformity of wetting and salinity control. Although numerous irrigation technologies have been used for fertigation, there exists a detailed gap in data on fertigated industrial crop production such as canola using MTI under field conditions. Furthermore, whilst studies (Sun et al., 2019b; Yang et al., 2023), have characterize MTI wetting geometries and the impacts on solute movement, data on solute movement and nitrate leaching remains limited. Current research largely overlooks the interaction between MTI, fertigation timing, and nitrate retention efficiency under deficit irrigation, thus limiting the capacity to evaluate MTI as a sustainable fertigation tool in nitrate-sensitive environment. Considering that MTI is a relatively new irrigation technology, exploring this research will provide an important opportunity to advance understanding of the effects of deficit irrigation (DI) on root nutrient uptake and fertilizer leaching under MTI.
Understanding nitrate movement in the vadose zone facilitates controlled fertilizer application and groundwater remediation. Optimal application rates and conditions (irrigation method) are required to prevent under-application and most importantly over-application. Exceeding the maximum and minimum thresholds results in poor crop growth and unwarranted environmental degradation (Agostini et al., 2010; Incrocci et al., 2017). Anthropogenic activities such as industrialization and intensified crop production have promoted N's excessive and perpetual input into the soil, consequently promoting groundwater contamination (Xin et al., 2019). Modeling tools such as HYDRUS 2D/3D have been used and adapted to develop irrigation and fertigation support tools for farmers (Šimunek et al., 1999; Gärdenäs et al., 2005; Hanson et al., 2006). Modeling tools are time-saving and break down the complex dynamics of water and nutrient uptake and movement in the vadose zone (Hanson et al., 2006).
This study aimed to demonstrate the nitrate distribution in the soil profile and nitrate leaching under MTI, furthermore, few soil guidelines exist for designing and managing fertigation under MTI. The study was based on the hypothesis that MTI emission results in no nitrate leaching. We demonstrated the capability of HYDRUS 2D/3D to model solute movement in the soil profile.
Materials and methods
A brief description of Moistube Irrigation (MTI)
MTI is a low-pressure continuous irrigation method whose discharge is controlled by soil matric potential. The inner membrane closely simulates the vascular plant tissue. It uses the soil-moisture gradient for advection (Yang et al., 2008), and it assumes a line source infiltration mechanism during irrigation (Fan et al., 2018b). Table 1 summarizes the membrane properties. The technology optimizes irrigation field water use efficiency (fWUE) since it utilizes on-demand water application (Jun et al., 2012; Kanda et al., 2019).
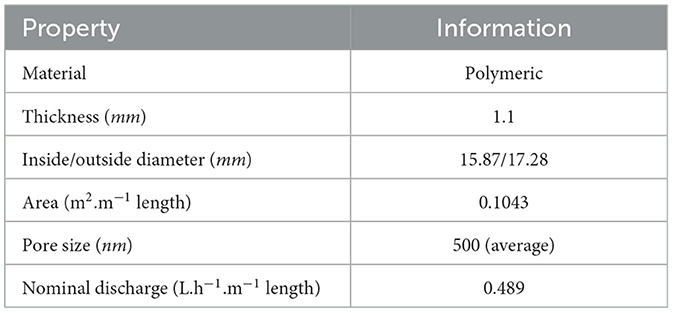
Table 1. 3rd generation Moistube membrane properties.
Model description
HYDRUS-2D was used to model the solute movement in the variably saturated soil profile zone. HYDRUS-2D robustness facilitates the simultaneous modeling of multiple independent solutes or nitrogen species whose solutes go through first-order degradation reactions (Hanson et al., 2006). Coupled water flow and solute transport equations were applied. Richard's equation (Equation 1) (Richards, 1931; Šimunek et al., 2012) was used to compute the spatially distributed soil moisture and the subsequent volumetric fluxes. For this study, we adopted the x (lateral)- z (vertical) spatial directions.
Where: θ = volumetric water content [L3.L−3], h = pressure head [L], S = sink term [L3.L−3.T−1] representing root water uptake as a function of spatial position and time, xi = spatial coordinates [L], t = time [T], and Kij and Kij = components of the hydraulic conductivity tensor [L.T−1]. The root water uptake was determined by the Vrugt model (Vrugt et al., 2001). Chemical transport of solutes in a variably saturated zone is governed by the linear partial differential equations (Equations 2, 3).
Where: ci and si = solute concentrations in the liquid [M.L−3] and solid [M.M−1] phase respectively, qi = ith component of volumetric flux density [L.T−1], μw and μs = first order rate constants for solutes in the liquid and solid phase [T−1] respectively, ρ = soil bulk density [M.L−3], S = sink term [L3.L.3T−1] in the water flow equation, Cr = concentration of the sink term [M.L−3], Dij = dispersion coefficient tensor [L2.T−1] for the liquid phase, k = kth chain number, ns = number of solutes involved in the reaction, Kd, k = distribution coefficient of species k [L3.M−1], and ck and sk = adsorption isotherms.
Equation 4 was applied to capture how HYDRUS simulates solute behavior in the vadose zone:
Where: Sk = the dimensionless sorbed concentration of solute k on the solid phase [M.M−1] representing how much of the solute is retained or adsorbed by the soil matrix, Kd, k = the distribution coefficient for solute k, which quantifies the ratio of the amount of solute adsorbed to the soil to the amount dissolved in the pore water, thus reflecting soil–solute interaction [L3.M−1], and Ck = aqueous concentration of solute k in the liquid phase [M.L−3].
Experimental design
Study site and soil hydraulic properties
The experiment was conducted at the Ukulinga Research Farm at the University of KwaZulu-Natal in Pietermaritzburg, South Africa (29°39′44.8“S 30°24′18.2”E, 636 m a.s.l.). The site had predominantly silty clay loam soil (39 % clay, 44% silt, 17% sand). The soil was sampled at depths of 10-, 20-, 30-, 40-, and 50 cm. The maximum selected depth was informed by literature (Gan et al., 2011; Cutforth et al., 2013; Luce et al., 2016). A study by Kanda et al. (2020b) at the Ukulinga Research Farm sampled to a similar depth because of an impermeable layer at a depth of 60 cm. The soil hydraulic characteristics are shown in Table 2.
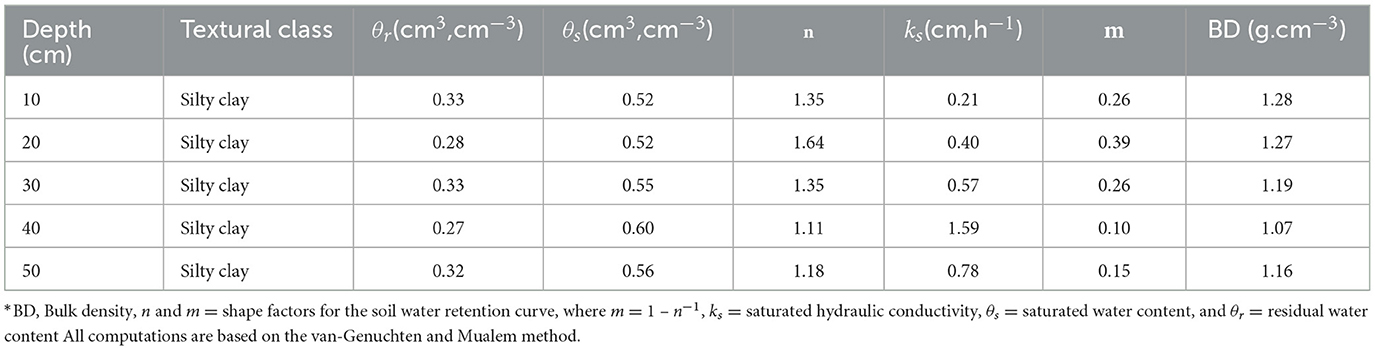
Table 2. Soil textural and soil hydraulic parameters.
Saturated hydraulic conductivity was determined by the constant head permeability apparatus (Wilkinson, 1968; Fwa et al., 1998), whilst other hydraulic parameters (θr, θs, n, ks and α) were determined using the soil-water retention pressure method (Klute, 1986; Cresswell et al., 2008; Kanda et al., 2020c). The methods were selected based on the reliability of results and also equipment availability. The soil hydraulic properties closely concurred with those of Rawls et al. (1982) and Vogel et al. (2000) for silty clay soils.
Weather data
HOBO temperature and relative humidity (RH) sensors (Onset Computer Corporation, USA) were installed in the Greenhouse for additional data collection (Figure 1, Table 3). The ETo for the local conditions (within) the Greenhouse were calculated using the evapotranspiration calculator (FAO, 1998). Some variables required for calculating ETo were obtained from the automatic weather station (AWS) situated 100 m away from the Greenhouse The AWS uses the CS-500 Vaisala probe (Campbell Scientific, United States of America, Logan, UT) to measure temperature and relative humidity (converted into vapor pressure deficit), L1-200 pyranometer (Campbell Scientific, Unites States of America, Logan, UT) to measure solar radiation, and the Penman-Monteith equation to calculate reference evapotranspiration. The signal was transmitted wirelessly, and downloadable files made available from the South African Sugarcane Research Institute (SASRI) weather data portal.
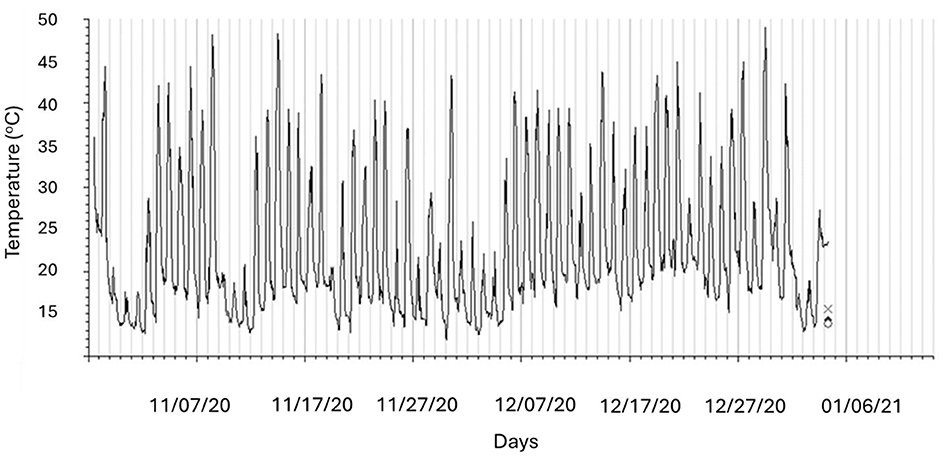
Figure 1. Average maximum and minimum temperatures recorded in the Greenhouse during the 2020/2021 growing season.
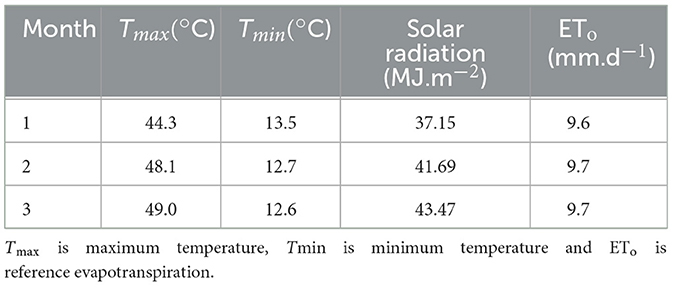
Table 3. Summarized meteorological conditions for the 2020 growing seasons.
The weather data comprised of daily minimum and maximum temperature, and solar radiation. The solar radiation data was input into the ETo calculator (FAO, 1998) for computing ETo.
Controlled environment experiment
The experiment was carried out over one growing season (Sept 2020–early Jan 2021). The study was a one-factor experiment: with three water application treatments. The canola (TT variety) was irrigated at full irrigation (100% ETc), optimal deficit irrigation (75% ETc), and extreme deficit irrigation (55% ETc). The ETc levels were computed according to Equation 5 (Doorenbos and Kassam, 1979; Kafle et al., 2025).
where:
ETc = crop water requirement, %DI = Designated level of deficit irrigation i.e., the proportion of full crop water needs that is deliberately supplied, ETo = reference evapotranspiration, and Kc = canola crop coefficient value. Irrigation water supplied at a pressure of 100 KPa, which translated to 1.8 l.hr−1.m−1 length of Moistube (Kanda et al., 2018). Thus, per each two meter lateral, the total discharge was 3.6 l.hr−1.m−1. Irrigation water supply followed a standard irrigation schedule which incorporated the crop growth parameter (Appendix Table 1).
The study design was a randomized block design in which each water treatment consisting of four plots measuring 2 m × 1 m, consisting of three equidistant laterals spaced at 0.33 m apart. Each plot was hydrologically separated from another by a 1 m buffer wherein 250-microns thick plastic film buried vertically to a depth of 1.0 m. The plot separation ensured the creation of irrigation management specific zones (IMSZ). It is worth mentioning that the experiment was done in a controlled Greenhouse facility. For each water application treatment, all plots were utilized for samples collection. The study applied a mix of two fertilizers, namely CALMAG N and new generation coastal blend fertilizer obtained from GROMOR fertilizers in Cato Ridge South Africa (29°42′53.7“S 30°28′33.3”E). The nutrient composition of each fertilizer is summarized in Table 4.
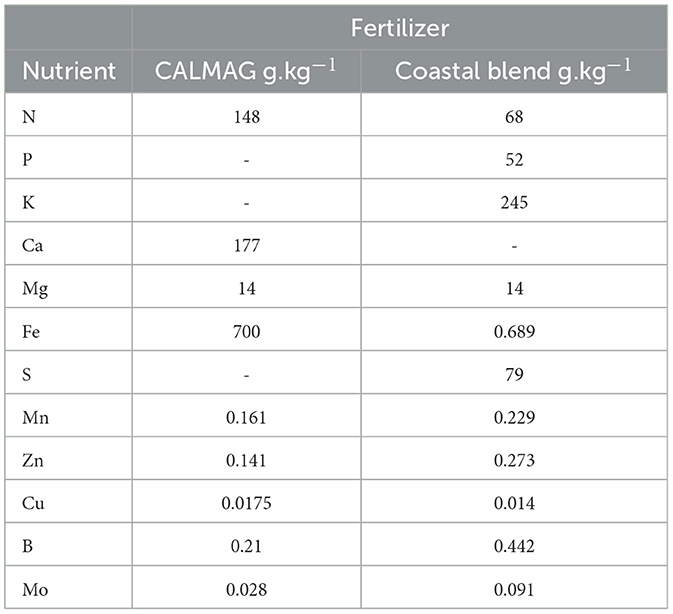
Table 4. Nutrient composition of the applied fertilizers.
The fertilizers were mixed in 1,000 liters of solution to obtain: N 210 ppm, P 44 ppm, K 245 ppm, Ca 117 ppm, Mg 28 ppm, S 79 ppm, Fe 1.39 ppm, Mn 0.46 ppm, Zn 0.41 ppm, Cu 0.03 ppm, B 0.65 ppm, and Mo 0.12 ppm. Recommended canola fertilization rates range from 90 kg N ha−1 to 150 kg N ha−1 (Coetzee, 2017). The dilute fertilizer was applied continuously for 1 h in each plot at a rate of 0.2 L.min−1. Thus, each fertigation session per split application applied 12 liters of fertilizer solution per hour per lateral, which amounted to 36 liters of fertilizer solution per plot. The fertilizer was applied over two split applications, with the first application done on 19/11/2020 and the second application on 16/12/2020.
All three irrigation water treatments (100% ETc, 75% ETc, and 55% ETc) and the subsequent replicates received the same amount of fertilizer. The fertilizer application coincided with the canola vegetative stage, which is considered a critical growing stage for the crop because canopy formation and the subsequent canopy photosynthesis process competes with pod formation, setting and seed filling (Zhang and Flottmann, 2018).
Data collection
Soil samples were collected from various depths of 10-,20-, 30-, 40-, and 50 cm directly at the emitter (MTI) and cm from the emitter. The observed data represented the spatial and temporal solute movement during the growing season under MTI. The soil samples were air-dried and analyzed using the Leco Carbon/Nitrogen/Sulfur analyzer (Leco TRUMAC CNS Model No: 630-300-400, Serial No: 4093, St Joseph, Michigan, USA). The tube auger was used to collect soil samples after 2-, 4-, 24-, 48- and 72 h of fertigation at 20-, 30-, 40-, and 50 cm depths respectively. Above ground (ABG) plant samples were also collected, oven-dried and analyzed for N. Upon destructive sampling for N analysis in ABG plant samples, the canola stalk, leaves and the seed were dried at 30°C and ground to pass through a 1 mm sieve. Total N concentration was determined by dry combustion using the MICRO cube equipment (Elementer Americas).
Modeling domain and nitrogen reactions
MTI is a porous line source irrigation method; thus, the modeling domain assumed a rectangular geometry (Hanson et al., 2006) (Figure 2). Since the fertigation occurred under active plant uptake, the modeling domain consisted of the area occupied by roots. The effective maximum root zone depth for canola was set at 1.0 m. The transport domain consisted of 33 cm by 100 cm, with the MTI lateral buried at a depth of 20 cm. The 33 cm by 100 cm was selected as the space occupied by the fertigating MTI lateral within a single plot consisting of 3 evenly spaced laterals. The transport domain (finite element (FE) mesh) was discretized into 5,000 nodes on the boundary curve and 200,000 FE-mesh nodes with finer grid around the Moistube lateral and coarser grid in the remaining surface. The default smoothing factor of 1.3 was adopted.
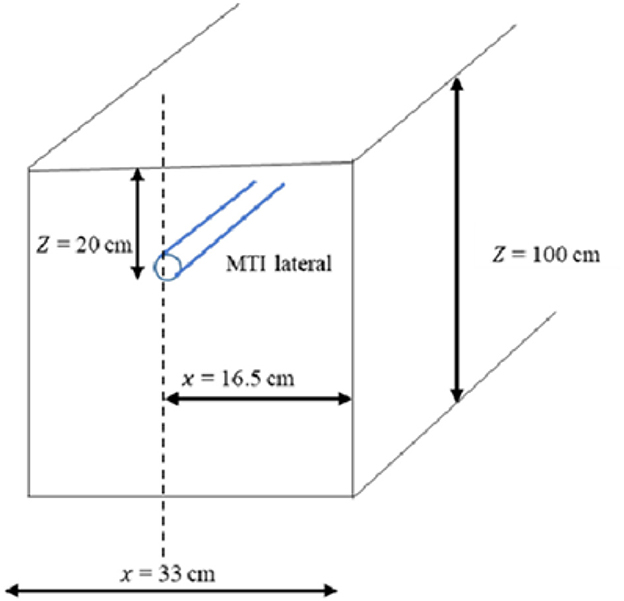
Figure 2. Modeling domains for MTI lateral.
Model calibration
The model was calibrated by adjusting the initial soil hydraulic properties (Table 2) and dispersivity values until the model closely matched the observed N concentration values (Kanda et al., 2020a). The dataset from the second fertigation exercise was used for model validation.
Model input parameter values
Since the fertilizer contained ammonium and nitrate, Equations 2, 3 were considered for simulating nitrogen species. The nitrates were assumed to be available in the dissolved phase; hence distribution coefficient (Kd) was assigned a value of 0 cm3.g−1, and ammonium was assumed to adsorb to the solid phase using an Kd of 3.5 cm3.g−1. The other parameter values are summarized in Table 5.
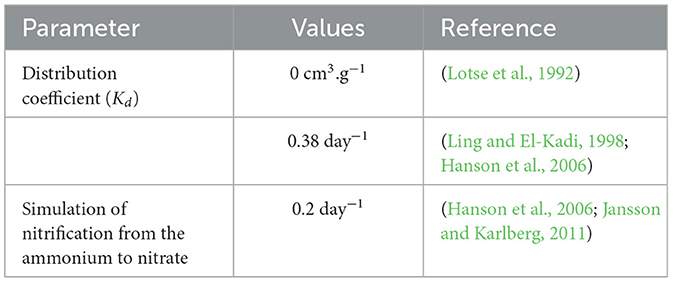
Table 5. Summarized conservative model input parameter values.
The volatilization of ammonium and its gaseous diffusion was neglected for ease of modeling because the solutes were applied in full and variably saturated medium (underground). Thus the study adopted the hydrodynamic solute dispersion phenomenon. Table 6 presents a summary of other parameter values. Default longitudinal and transverse dispersivity values were initially set to 0.5 m and 0.1 m, respectively. Other non-conservative input parameter (soil) values were θr, θs, and ks (see Table 2).
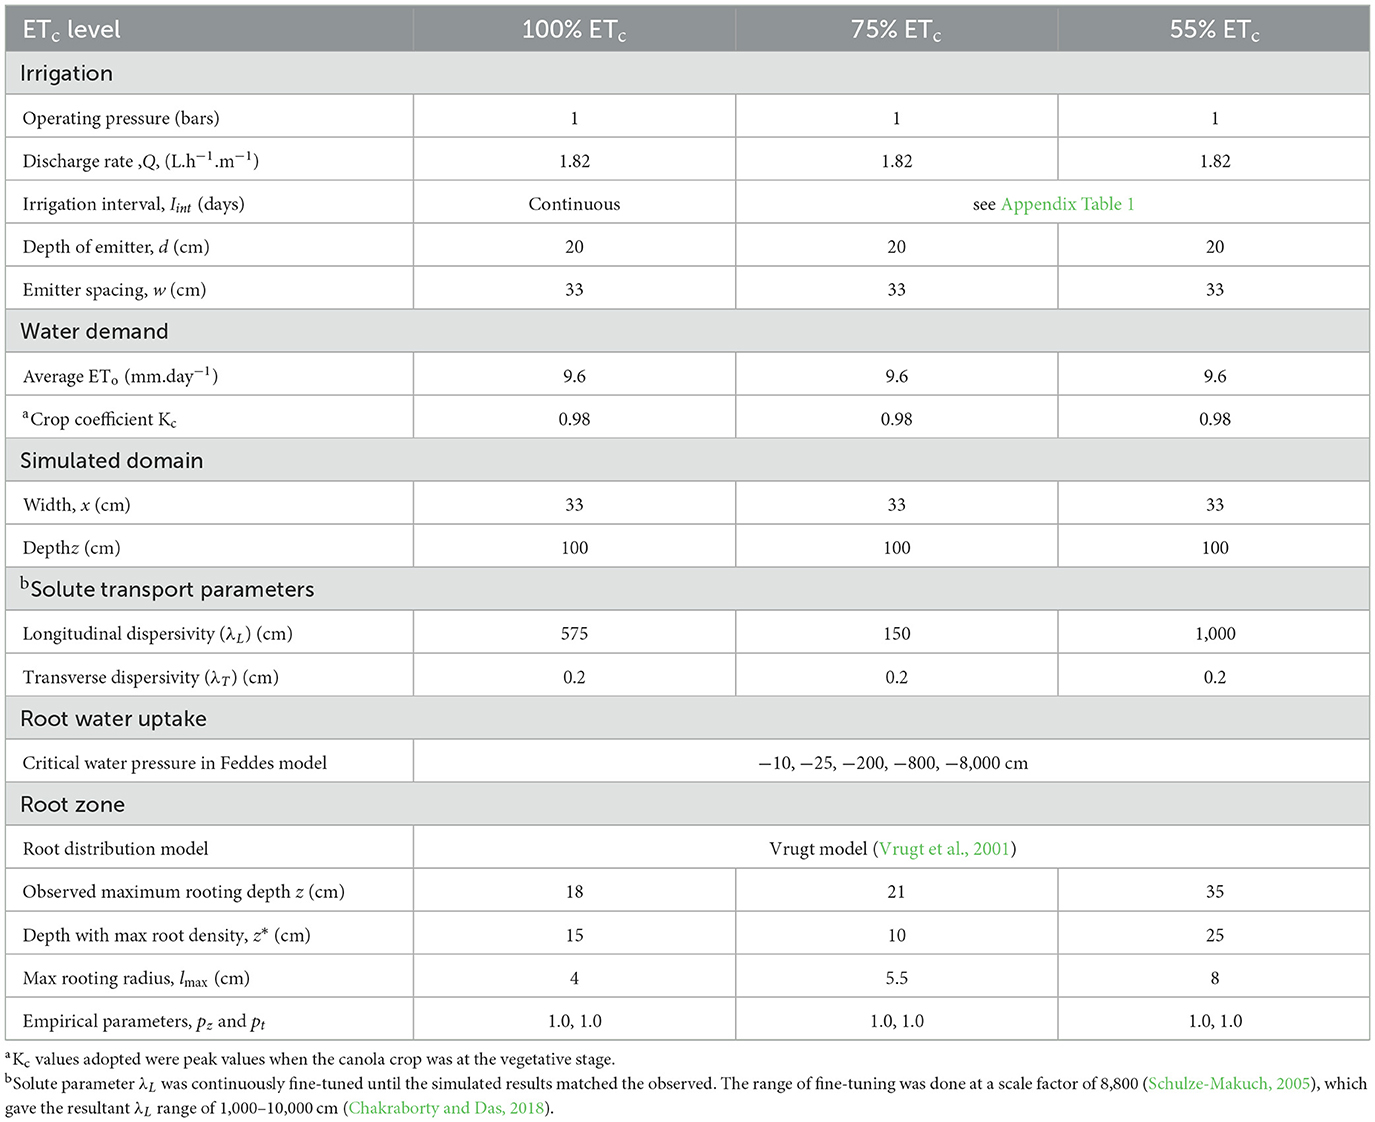
Table 6. Irrigation information and non-conservative model parameters.
Initial and boundary conditions
The canola was first transplanted and irrigated using MTI for a continuous 30 days to prevent transplant shock and provide a pseudo-equilibrium condition. The average rooting depth at transplanting was 0.6 m. The first fertigation exercise took place after 30 days of irrigation which coincided with the tail end of the crop's vegetative stage. Initial NPK soil level measures were documented and adopted as the initial solute conditions. The variable flux boundary condition (q) was placed at 20 cm, where the MTI lateral was buried. The q was defined by Equation 6 (Skaggs et al., 2004; Elasbah et al., 2019; Kanda et al., 2020a).
Where q = variable flux, Q = MTI nominal discharge at 1 bar, and A = surface area of the cylindrical MTI tube.
All boundaries were considered to be no flow except for the bottom boundary of the soil profile and the boundary representing MTI lateral, which was considered a free drainage boundary (Figure 3). To generate the FE-mesh, the free drainage boundary was placed at z = 100 cm. However, the observation nodes on the generated FE-mesh were scattered to a depth of 60 cm, thus rendering the drainage effect zero. During non-fertigation periods, the flux was kept at zero. Root distribution was assumed to follow the Vrugt model (Vrugt et al., 2001), and the root water uptake was also assumed to follow Feddes' model (Feddes, 1982).
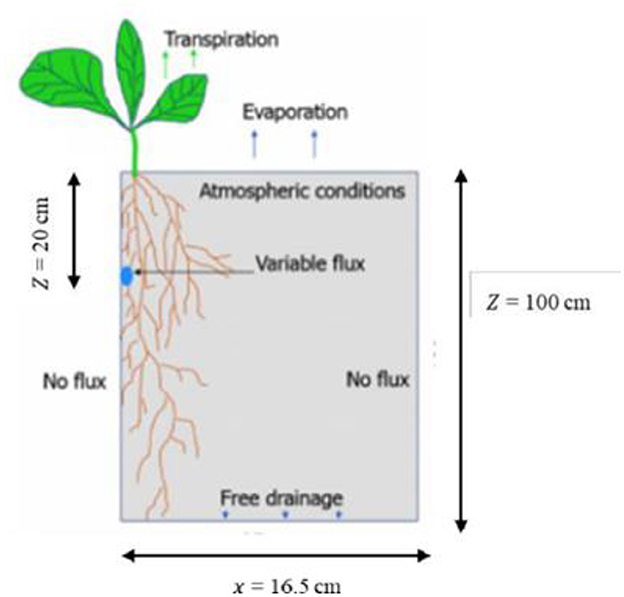
Figure 3. Boundary conditions adopted from Kanda et al. (2020a).
Nitrogen use efficiency
Nitrogen use efficiency can be quantified using the following indices; partial factor productivity (PFPN), agronomic efficiency (AE), physiological efficiency (PE), and recovery efficiency (RE) (Gupta and Khosla, 2012). For this study, we adopted the partial factor productivity of applied N (PFPN) as a proxy for nitrogen use efficiency (NUE) because the output was harvestable canola grain yield. In addition, the PFPN provides a clear indication of indigenous and applied N in a system (Dobermann, 2005). The PFPN was computed using Equation 7 (Dobermann, 2005).
Where: YN = crop yield with applied N (kg.ha−1), FN = amount of (fertilizer) N applied (kg.ha−1), and Si = average initial nitrogen concentration (kg.ha−1) in the soil profile (0–60 cm).
The Si for the 100% ETc, 75% ETc, and 55% ETc plots were 390.43 kg.ha−1, 418.66 kg.ha−1, and 432.77 kg.ha−1.
Nitrogen budget
The nitrogen budget was computed for each fertilizer application. The input was from the N supplied by fertigation. The outputs were N measured from grain and plant, N obtained from the soil sample directly at the MTI lateral. In addition, 10% of the applied fertilizer was set to account for volatilization (Ventura et al., 2008).
Model validation
HYDRUS 2D/3D is a physical-based model (Simunek et al., 2012). The validation process was done over a split sampling approach whereby the dataset for the second fertigation session for each irrigation regime was used to assess the model's performance. The split approach enabled the training of the model using the first fertigation session's dataset to better adjust for local conditions. This enabled the model to perform the validation process with considerable accuracy and precision. The validation process maintained the “conservative” values (longitudinal dispersivity and soil hydraulic properties). The conservative and non-conservative parameters applied during model validation are summarized in Table 7.
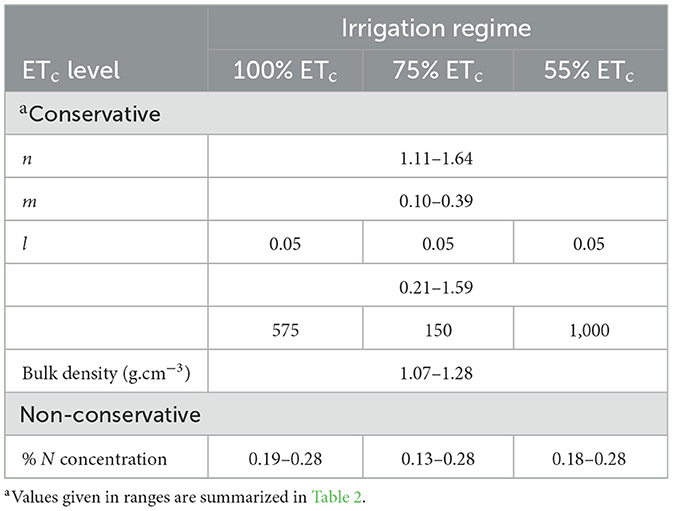
Table 7. Summarized conservative and non-conservative parameters for model validation.
Statistical analysis and model evaluation
For the field experiment data, a normality test was undertaken on the solute concentration, yield and biomass data for each respective irrigation regime using the Shapiro-Wilk normality test followed by a one-way ANOVA test. All statistical analyzes were done using R Studio© (R Core-Team, 2017).
Model evaluation was done using the following criteria: normalized root mean square error (nRMSE), Model Efficiency (EF), and percentage bias (PBIAS). The selected criteria are presented in Equations 8–10. The performance evaluation statistics were selected based on robustness (Moriasi et al., 2007).
Where Oi and Pi = observed and predicted value(s), respectively, Oi = mean observed data, and x = number of observations. nRMSE defined the simulation model's accuracy, whilst the EF statistic measured the residual variance vs the measured data variance. The statistic (EF) ranges from −∞ to 1 (Moriasi et al., 2007), however, Yang et al. (2014) asserted there exists a positive and scattered correlation between EF and the index of agreement thus when estimating soil water content, a satisfactory agreement can be considered when EF≥−1. PBIAS measured the tendency of the simulated data to either under-estimate or overestimate the observed values. Table 8 summarizes the general performance rating for the selected evaluation criteria.
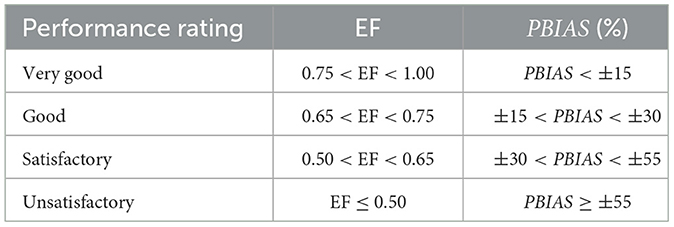
Table 8. General performance rating for model evaluation statistics (Moriasi et al., 2007).
Results and discussion
The normality test for solute concentration values followed a normal distribution as revealed by the Shapiro-Wilks test (p > 0.05).
Effects of different irrigation regimes on solute mobility under canola crop
Under the full irrigation regime (100% ETc), maximum solute movement occurred at t = 2 h. The depth (D) vs. solute movement curves followed a similar trajectory under the respective times, as exhibited by Figures 4a, b. There, however, was a significant variation in N concentration at t = 24 h and t = 72 h at D = 40 cm and 50 cm, respectively (p < 0.05). The respective concentrations were 0.05 g.kg−1 and 0.10 g.kg−1. Maximum accumulation (~0.13 g.kg−1) was uniform at D = 20 cm both directly at the emitter (E) and away from the emitter (Ae) localities. This could be attributed to the MTI lateral placement depth of 20 cm that influenced solute accumulation at the near placement depth.
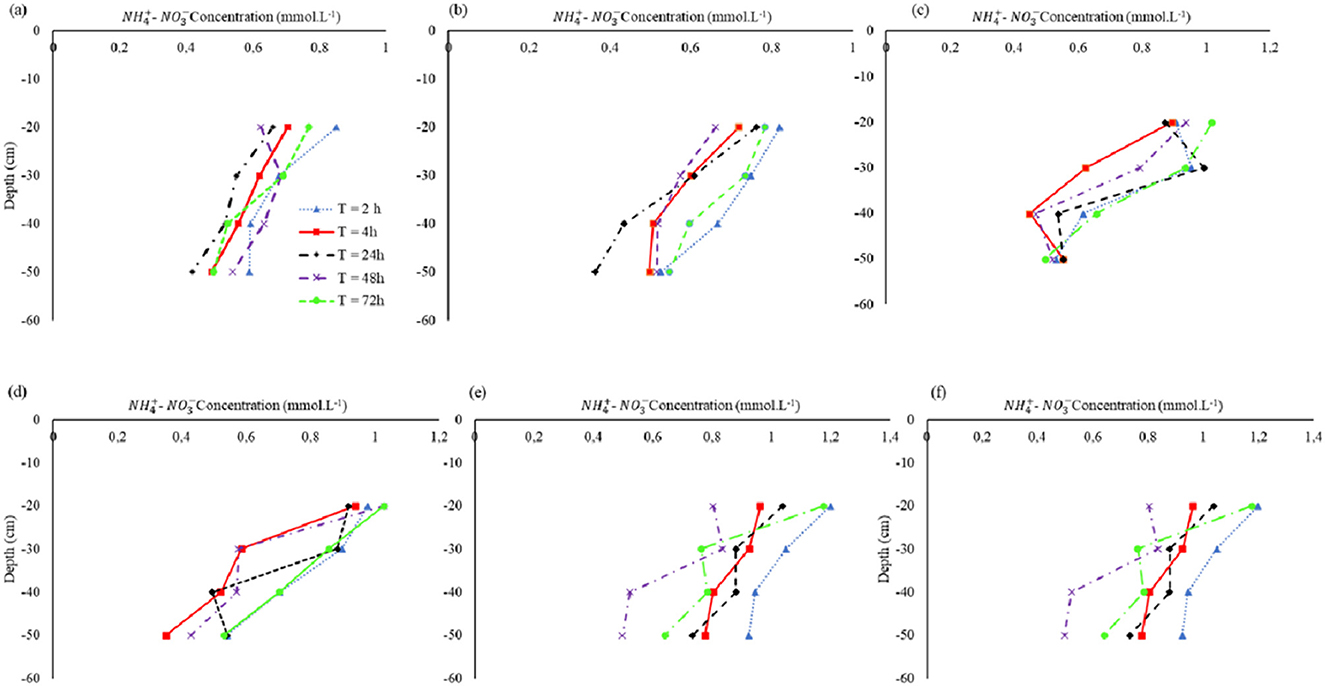
Figure 4. First fertigation exercise: vertical movement at (a) emitter at 100% ETc, (b) 15 cm away from emitter at 100%ETc, (c) emitter at 75% ETc, (d) 15 cm away from emitter at 75% ETc, (e) emitter at 55% ETc, and (f) 15 cm away from emitter at 55% ETc.
Under the optimal deficit irrigation (DI) regime (75% ETc), maximum concentration (0.17 g.kg−1) was at D = 30 cm after t = 24 h (Figure 3c). Under 55% ETc, the solute movement curves at E and Ae followed a similar trajectory. Maximum accumulation was at D = 30 cm for all irrigation regimes at localities E and Ae, albeit at different times. This implied that full irrigation (100% ETc) and the optimal irrigation (75% ETc) had no significant effect on solute movement both at E and Ae in the variably saturated zones (p> 0.05).
Under 100% ETc, peak accumulation at the E scenario occurred at t = 55 h (approx.) at D = 30 cm (Figure 4a) whereas under the Ae locality, peak accumulation occurred at t = 20 h at D = 20 cm and it plateaued at -concentration of 0.12–0.13 g.kg−1 (Figure 5b). There was no significant difference between the concentrations at the respective depth (p > 0.05). This observation can be attributed to the soil characteristics. However, fine-textured soils exhibit lateral movement (Fan et al., 2018a), the soil in question did not have pronounced lateral movement than the vertical movement. Active root nutrient uptake (RNU) could have also potentially influenced the lag in peak concentration at the E locality compared to Ae. Mmolawa and Or (2000b) noted a solute concentration decline under a cropped field compared to an uncropped one under drip irrigation.
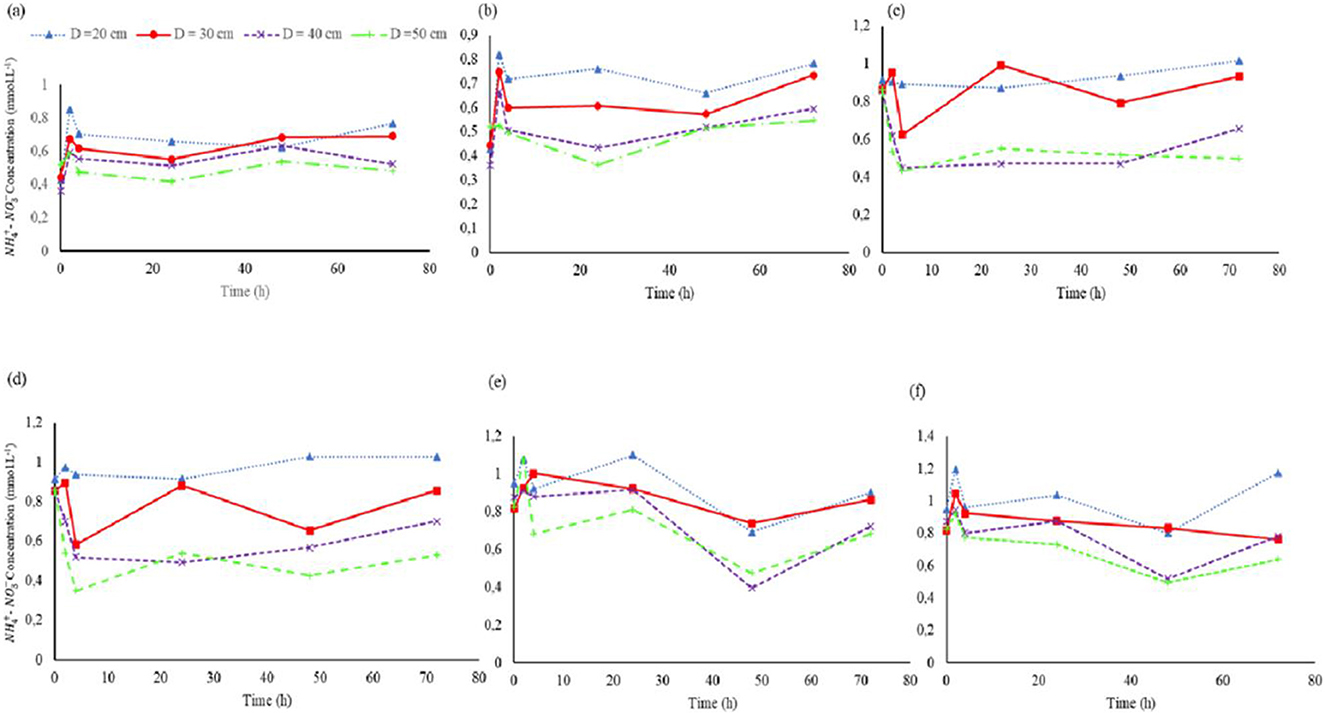
Figure 5. Cumulative breakthrough curves at (a) 20-, 30 -,40-, 50 cm at emitter at 100% ETc irrigation regime, (b) 20-, 30 -,40-, 50 cm at 15 cm away from emitter at 100% ETc irrigation regime, (c) at 20-, 30 -,40-, 50 cm at emitter at 75% ETc irrigation regime, (d) 20-, 30 -,40-, 50 cm at 15 cm away from emitter at 75% ETc irrigation regime, (e) 20-, 30 -,40-, 50 cm at emitter at 55% ETc irrigation regime, and (f) 20-, 30 -,40-, 50 cm at 15 cm away from emitter at 55% ETc irrigation regime. The plots include active root nutrient uptake.
For the three irrigation regimes, the solute infiltration rate was high at the initial phase (t = 1 h to approx. t = 2.5 h) at both locations (E and Ae). This could be attributed to the availability of micro and macro pores that could accommodate solutes during the initial phases of fertigation. The availability of pore space in fully irrigated plots was potentially made possible by gravity-assisted drainage. There was a significant difference (p < 0.05) in concentration at various depths under the 100% ETc regime between localities E and Ae. The highest concentration levels were recorded at D = 30 cm and 20 cm respectively at E and Ae during t = 50 h (approx.) (see Figures 5a, b). Gravity assisted solute movement was experienced at E; thus, a high concentration at D = 30 cm, whereas the effect of lateral buried depth acted on the high concentrations at location Ae, D = 20 cm.
Under the 75% ETc DI at the E locality, peak accumulation at D = 30 cm occurred at t = 25 h (Figure 5c), which was half the time it took for the 100% ETc irrigation regime to reach peak salt accumulation at the same depth. Similarly, under the 55% ETc irrigation regime, peak salt accumulation occurred at t = 25 h and D = 20 cm. The phenomenon revealed how DI potentially aided the imbibition of the nitrate solutes, thus promoting mobility. Partially dry soils imbibe solutes compared to their saturated counterparts (Youngs and Leeds-Harrison, 1990).
Under the extreme DI regime (55% ETc), nitrate concentration levels were uniform and D = 30 cm and D = 40 cm at t = 72 h (Figure 4f). Nitrate mobility was not as pronounced because of imbibing water's unavailability—due to preferential vertical flow—to transport the solutes. Interestingly, the extreme DI regime had a high concentration accumulation at D = 40 cm and 50 cm, t = 50 h and at locality E where-as, at; locality Ae the high concentration was recorded at t = 55 h (Figures 5e, f), one would argue that preferential flow was dominant in the extreme DI regime resulting in a favored vertical movement as compared to lateral. Merdun et al. (2008) argued that there is a preferential flow for a relatively dry soil favoring vertical solute movement compared to lateral movement.
Peak concentrations were observed in the depth range of D = 20 cm and D = 30 cm at time range of 20 h to 30 h (approx.) at both localities (E and Ae) under the full irrigation regime (p> 0.05, CV > 15%) and optimal irrigation regimes (p> 0.05, CV > 15%). For both irrigation regimes, the concentration plateaued for t = 20 h. This prolonged resident time presented an opportunity for active nutrient utilization by the canola. Thus, fertigation using MTI at optimal DI conditions (75% ETc) minimizes nutrient leaching and promotes crop beneficial nutrient uptake.
Modeling results
MTI solute movement without active root water uptake
The modeling domain for applying the HYDRUS 2D/3D model considered the impermeable layer found at a depth of 0.6 m in the Greenhouse. The fertigation wetting pattern was ellipsoid in shape, similar to what was reported by Sun et al. (2019a) under MTI fertigation. Under the 100% ETc, there were no solute contours observed from the period t = 0 h−60 h (Figure 6). The irrigation regime was characterized by continuous irrigation, hence there was potential dilution. Nitrate concentrations can be increasingly diluted for irrigation scenarios that have prolonged post-fertigation freshwater application (Gärdenäs et al., 2005). Solute concentrations were minimal (0.953 mmol.cm−3) at t = 120 h and t = 156 h under the 100% ETc irrigation regime. The low concentrations resulted from the continuous solute dilution. Under the 100% ETc the model successfully simulated the solute movement under MTI (nRMSE = 0.13, EF = 0.54), although it slightly over-estimated solute mobility (PBIAS = −0.22%). This shows that HYDRUS 2D/3D can simulate solute movement under full MTI regimes.
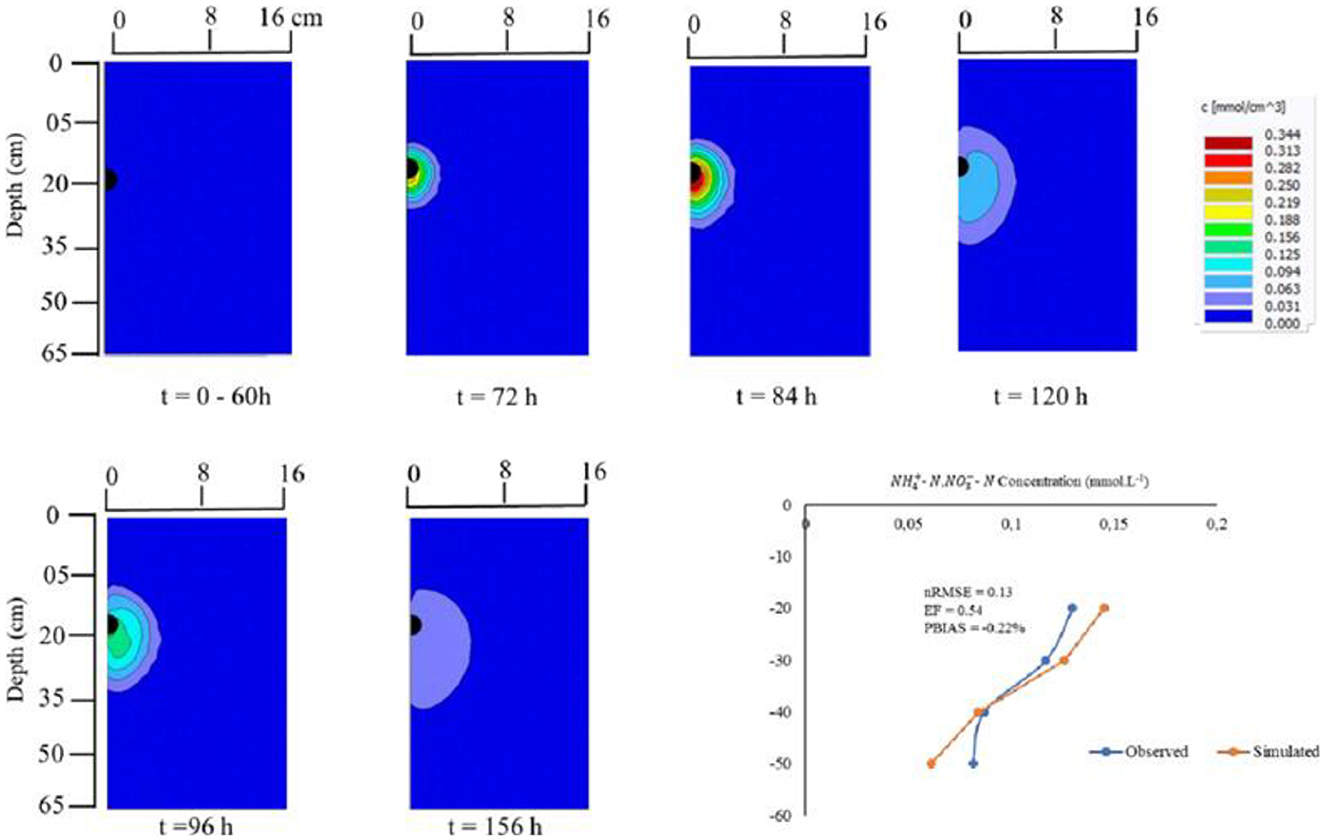
Figure 6. Simulated distribution of at 100% ETc irrigation regime from t = 12 h to t = 156 h.
Under the 75% ETc irrigation regime, the model successfully simulated the observed breakthrough curve (Figure 7). There was also an over-estimation instance. The simulation results revealed a nRMSE = 0.24, EF = 0.23, and a PBIAS = −7.41%. HYDRUS 2D/3D can simulate MTI solute mobility under optimal DI strategies. Solute movement was pronounced during the t = 12 h to t = 96 h. Moistube infiltration rates in a partially wet/dry soil profile are pronounced during a similar period (Shen et al., 2020). The solute concentration became more dilute at t = 120 h and t = 168 h, this phenomenon can be attributed to the dilution effect that was similarly observed under the 100% ETc irrigation regime.
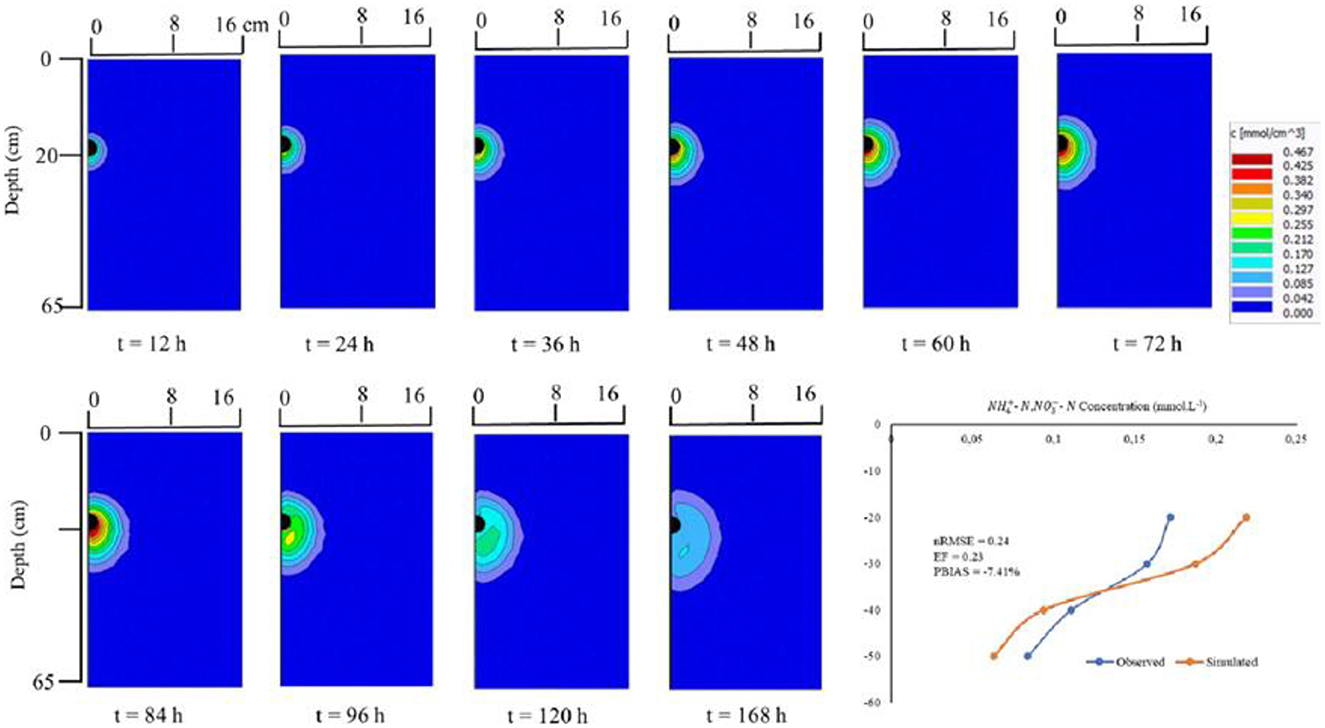
Figure 7. Simulated distribution of at 75% ETc irrigation regime from t = 12 h to t = 168 h.
Under the 55% ETc DI strategy, the model poorly simulated nitrate leaching at the E locality (nRMSE = 0.77, EF = −2.05, and PBIAS = 76%) as compared to the Ae locality (nRMSE = 0.35, EF = −1, and PBIAS = 18.78%) (see Figures 8, 9). Similar to the 75% ETc irrigation regime, solute infiltration was high, albeit less pronounced under the 75% ETc irrigation regime. The 55% ETc irrigation regime plots exhibited pronounced lateral nitrate movement. The observed contour map revealed high leachate concentration beyond the 40 cm depth. The high mobility was attributed to the availability of air-filled micro and macropores in a partially dry soil. The air-filled pores effected preferential flow in the extreme DI plots. The 55% ETc showed horizontal dispersivity of solutes. The lateral dispersivity can be described as a function of the relatively low initial soil moisture (0.353 m3.m−3) as compared to the 75% ETc (0.363 m3.m−3) and 100% ETc (0.408 m3.m−3).
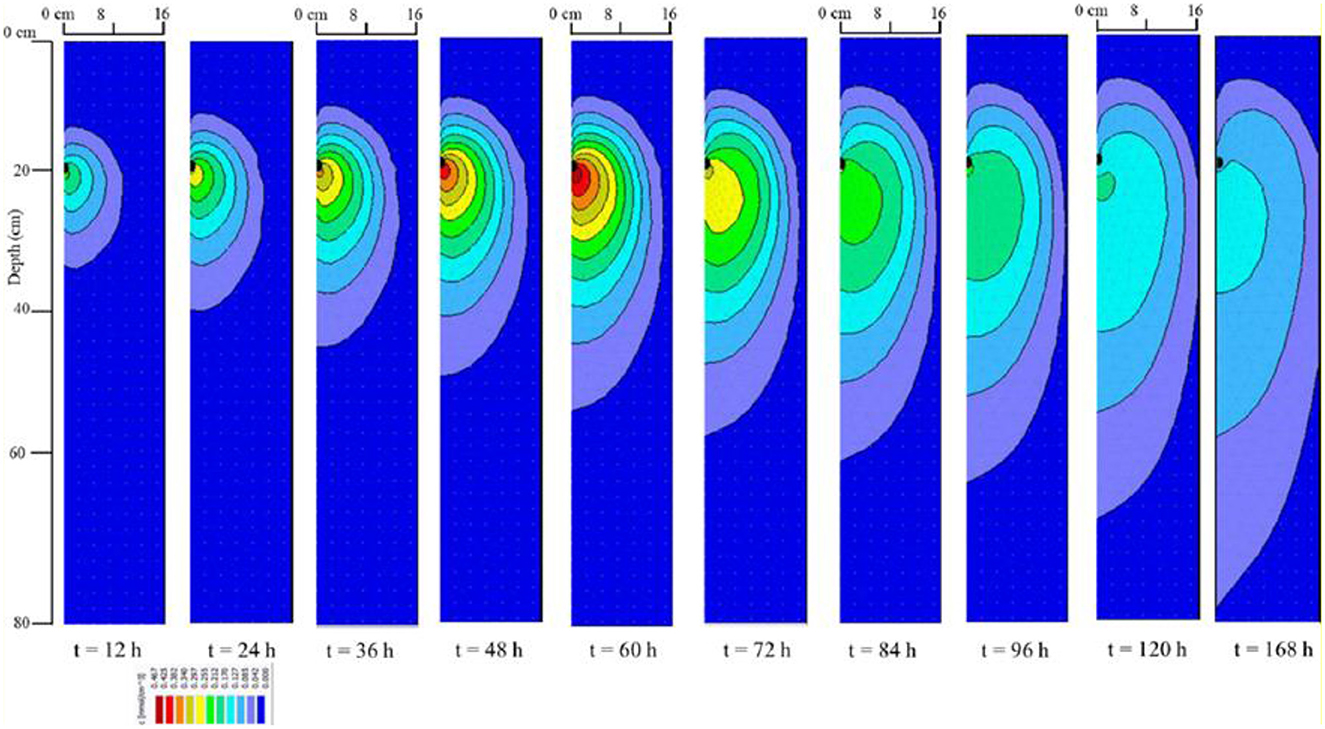
Figure 8. Simulated distribution of at 55% ETc irrigation regime from t = 12 h to t = 168 h.
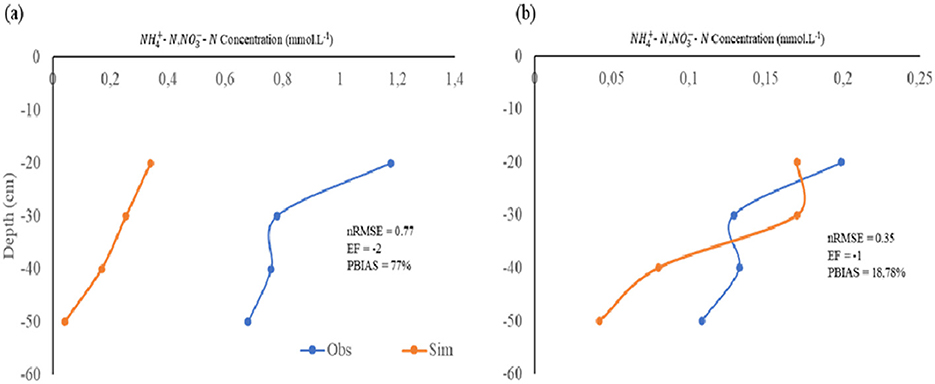
Figure 9. observed vs simulated calibration results for the 55% ETc irrigation regime over a 72 h period (a) at emitter and (b) 15 cm away from the emitter.
Figure 6 Simulated distribution of at 100% ETc irrigation regime from t = 12 h to t = 156 h.
Second fertigation exercise and model validation
There was no significant difference (p > 0.05) between solute concentrations at localities E and Ae for the 100% ETc and 75% ETc irrigation regimes. However, there was a significant difference (p < 0.05) in solute concentrations at locality E between the extreme DI regime and the other two irrigation regimes (full irrigation and optimal DI). There was also a significant difference (p < 0.05) at locality Ae between the full and extreme irrigation regimes, the latter had high solute concentrations at D = 20 cm and D = 40 cm. This was attributed to drier conditions in the 55% ETc irrigation regime. The solute movement curves at E for all irrigation regimes were generally smoother than the Ae solute curves.
The solute curves followed a similar trajectory under the 100% ETc and 75% ETc (Figures 9a, b). Under the 55% ETc irrigation regime, locality E's solute movement was a near-perfect vertical line. In contrast, the movement at locality Ae was curvilinear (Figure 10e). The observed phenomenon under the 55% ETc was attributed to the extreme deficit irrigation conditions imposed on the treatment, which presented available air spaces that could accommodate solutes.
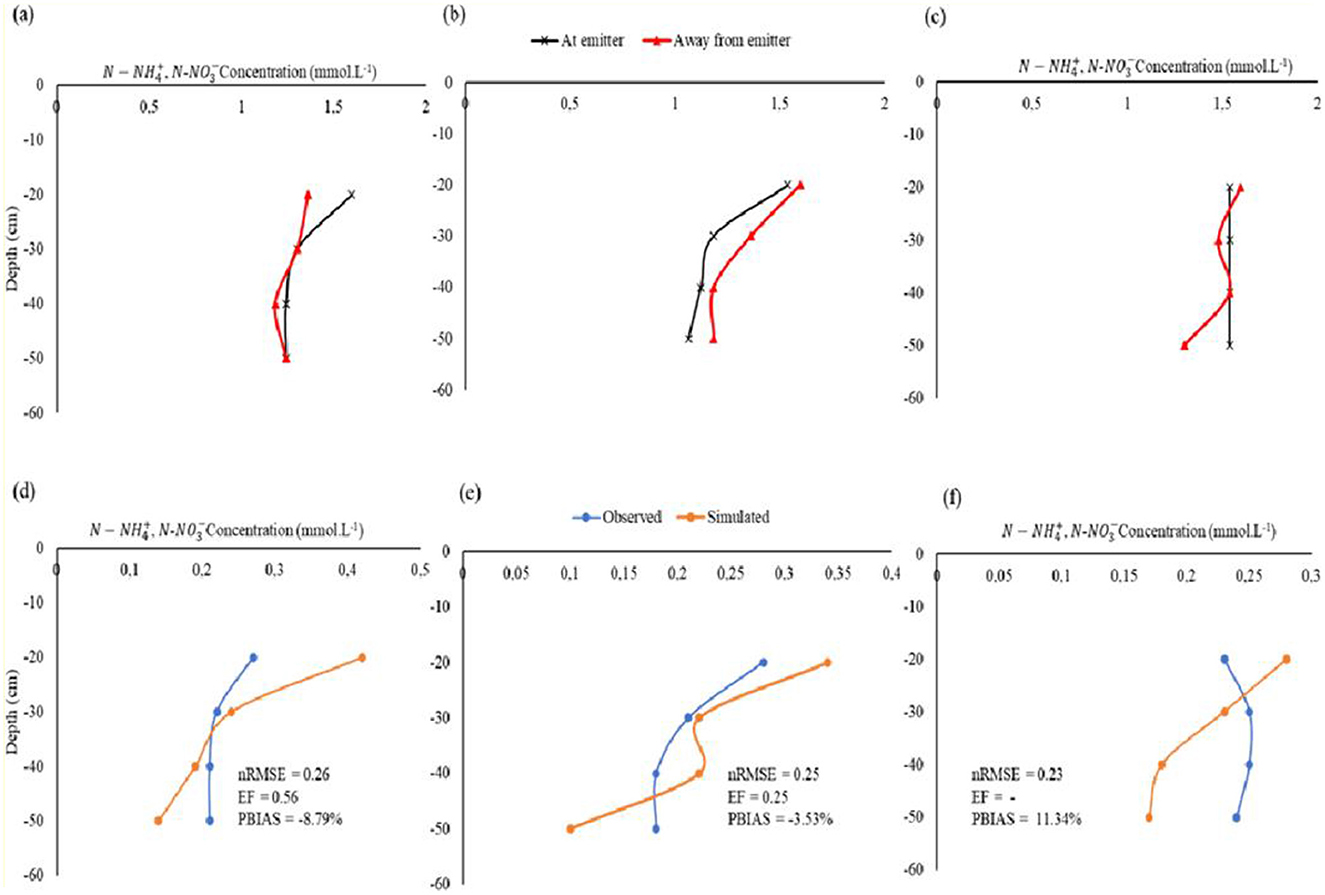
Figure 10. Second fertigation exercise movement at E and Ae for (a) 100% ETc -, (b) 75% ETc -, and (c) 55% ETc irrigation regimes after t = 72 h and observed vs simulated movement at (d) 100% ETc -, (e) 75% ETc -, and (f) 55% ETc irrigation regimes.
A separate second fertigation dataset was used to validate the model. The HYDRUS 2D/3D validation results are shown in Figures 10d, e. The model successfully simulated the solute movement under the three irrigation regimes (100% ETc, 75% ETc, and 55% ETc). The model showed an overestimation instance under the 100% ETc and 75% ETc irrigation regime with a PBIAS of −8.79% and 3.53%, respectively. The model under-estimated solute concentration across the 55% ETc irrigation regime (PBIAS = 11.34%). Also, under the 55% ETc model efficiency was low, thus reflecting underprediction solute movement (Table 9) likely due to delayed redistribution and reduced leaching flux in extremely dry conditions. These finding are consistent with findings by Zhang et al. (2022) who stated that in dry soil conditions, nitrate movement lags behind water movement, leading to a delayed nitrate peak in the soil profile. The nRMSE (nRMSE ≤ 26%) was within acceptable ranges. However, the model efficiency (EF) was average for the 100% ETc irrigation regime and poor for the two DI regimes (75% ETc and 55% ETc). This was potentially due to the DI strategy (75% ETc and 55% ETc) under the heavy clay Ukulinga soils. Javadzadeh et al. (2017) revealed how HYDRUS 2D/3D poorly simulated solute movement in clay textured soils. Considering that this experiment was carried out under field conditions, the effect of the inherent heterogeneity of the Ukulinga soil profile cannot be ignored in contributing to the poor EF. Also, model fitting procedures potentially affect the model performance. Merdun (2012) also attributed the low coefficient of model efficiency (CME) of HYDRUS to parameter value determination and fitting procedures.
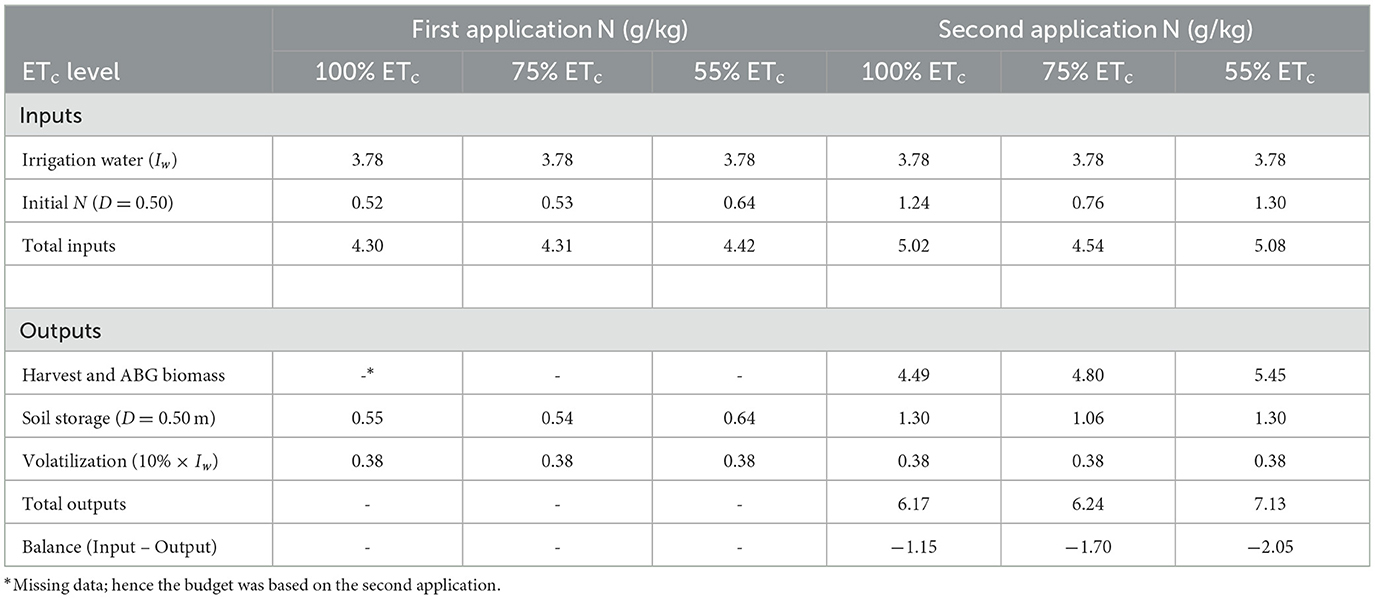
Table 9. Nitrogen balance for the two N split applications.
Root nutrient uptake
The relative plant root distributions and the subsequent solute () concentrations are shown in Figure 11. The simulation was extended beyond the t = 72 h mark to t = 168 h. It is worth mentioning that actual field measurements were done up to t = 72 h. The 100% ETc irrigation regime's solute concentration was the highest in the 0–10 cm depth profile. For the 75% ETc irrigation regime, the solutes were concentrated in the 5–15 cm depth range. Under the 55% ETc irrigation regime, active solute uptake went beyond the emitter placement depth. The implication is for a fully saturated soil (100% ETc), and at optimal deficit irrigation strategies (75% ETc), most of the applied nutrients are readily available for plant uptake. The plant actively absorbs the nutrients because active RNU happens in the canola plant's effective rooting zone depth (ERD). The active water uptake occurs in the default 40%, 30%, 20%, and 10% pattern of the top surface to the lower ends of the ERD (Steduto et al., 2009; Kanda et al., 2020a). The study observed that the root-zones for the respective irrigation regimes (100% ETc and 75% ETc) were concentrated in the 0–20 cm region close to the MTI lateral. This is supported by the observation made from rooting patterns from the destructive plant samples. Thus, irrigators need to take note of lateral placement depth as deep-buried lateral can potentially limit RNU. Under the 55% ETc, solute mobility was pronounced due to preferential flow. Partially dry soils exhibit pronounced solute infiltration (Figures 10a–c).
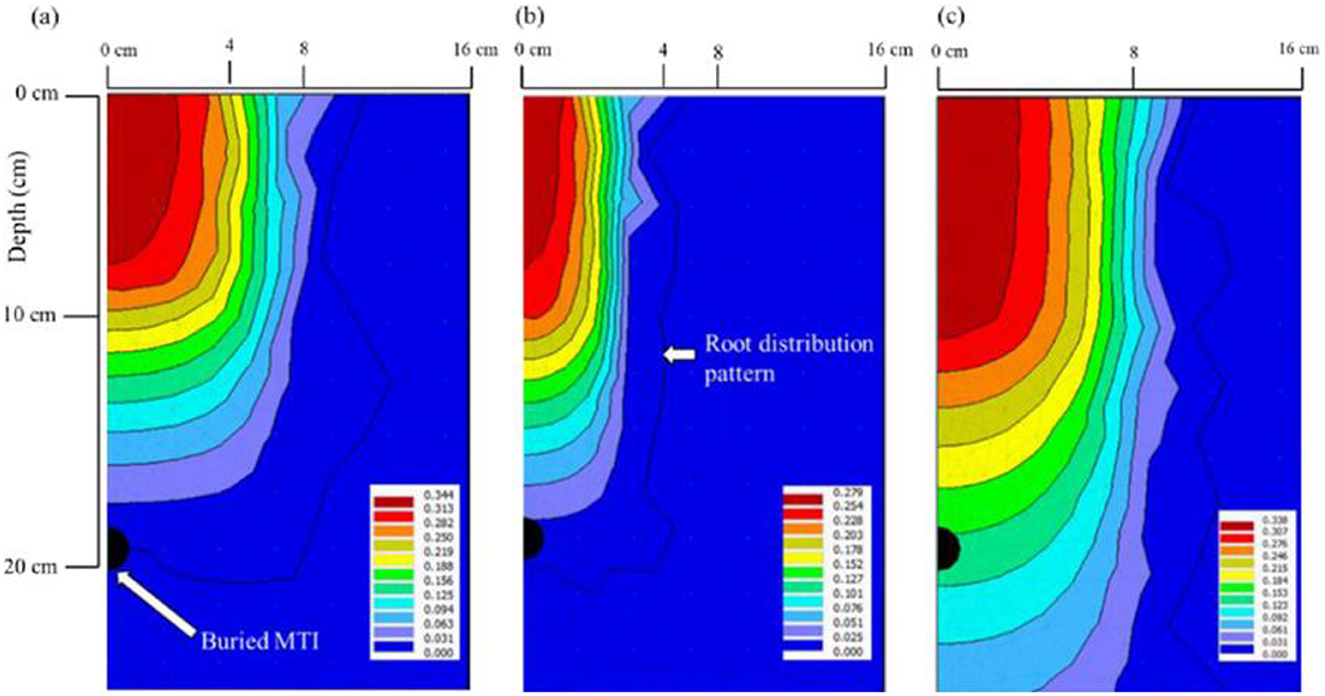
Figure 11. Simulated concentration (mmol.cm−3) contours during active RNU by plants at (a) 100% ETc, (b) 75% ETc, and (c) 55% ETc.
Minute solute concentration leached beyond the emitter placement depth. The lateral movement was pronounced under the 100% ETc and 55% ETc irrigation regimes, a phenomenon consistent with fine-textured soils. The model also displayed a wider root distribution pattern under the 100 ETc and 55% ETc irrigation regimes (Figure 11). Sun et al. (2019a), in their MTI laboratory experiment, observed high solute concentrations within the horizontal distance range of 5−13 cm. Interestingly, the observed lateral spread of solute concentration was minimal under the 75% ETc irrigation. The observation mimicked a well-drained soil scenario. Continued fertigation under extreme DI strategies (55% ETc) promotes solute leaching, leading to salinization. For high fertilizer demand crops, full and optimal DI under MTI requires periodic flushing to prevent near-surface salinization, potentially affecting directly sown crops. Also, the two irrigation regimes present an opportunity to maintain fertilizer concentrations at the near-surface and potentially below the emitter to reduce the risk of groundwater contamination (see Figure 9 simulation).
The reduced predictive accuracy of HYDRUS 2D/3D under the 55% ETc regime highlights a model sensitivity zone associated with low water flux. A one-at-a-time sensitivity analysis revealed that soil dispersivity (λ), sorption coefficient, and root nitrate uptake had the greatest influence on nitrate transport predictions, particularly under deficit conditions. Hydraulic parameters such as residual water content and saturated conductivity also significantly affected solute redistribution. These sensitivities suggest that nitrate transport in dry soil profiles is highly dependent on precise calibration of solute and hydraulic parameters, consistent with field-based observations of delayed nitrate mobility under arid conditions (Zhang et al., 2022). While the model captured overall trends, limitations in simulating late-time nitrate retention and vertical leaching in extreme deficit scenarios should be considered when applying HYDRUS for MTI design under water-constrained environments.
Nitrogen balance and partial factor productivity (PFPN)
The nitrogen budget is shown in Table 9. The major output was plant uptake for all three treatments. The net N balance for the 100% ETc, 75%ETc, and 55% ETc treatments were −1.15, −1.70, and −2.05 g/kg respectively. The observations support the simulated results that showed that the 55% ETc treatment exhibited pronounced leaching.
The observed concentrations in the plant material were 4.49-, 4.80-, and 5.45g.kg−1 for the 100% ETc, 75% ETc, and 55% ETc irrigation regimes, respectively. The plant samples were collected on day 7 after the last fertigation exercise. The crops grown under deficit irrigation (DI) scenarios had high concentrations. The phenomenon can be attributed to the plants triggering a stress-coping mechanism that facilitates maximum storage of nutrients to counter the loss of turgor pressure and maintain transpiration. This concurs with a study by Eissa and Roshdy (2018) that revealed high fertilizer concentration in maize plants grown under optimal deficit (75% ETc) drip irrigation conditions. Table 10 summarizes nitrogen concentrations and the subsequent yield and biomass values for each irrigation regime. Another possible explanation could be that the deep penetrating roots under the extreme DI regime (55% ETc) had access to the leached fertilizer in the deep wetter parts of the soil.
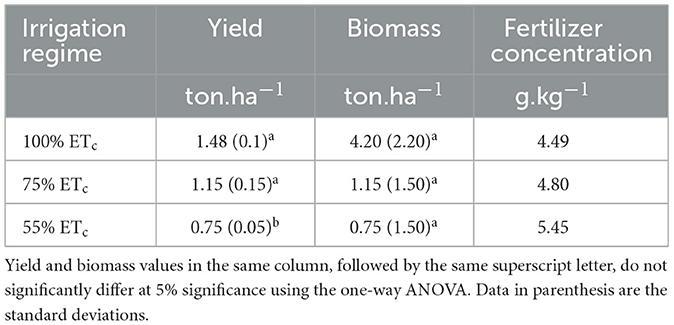
Table 10. Plant - N, - N concentrations and the resultant yields and biomass.
The partial factor productivity of applied N (PFPN) used as a proxy for NUE was computed as per Equation 7. The PFPN values are summarized in Table 11. The PFPN values ranged from 0.83 to 1.72 kg of grain.kg−1 of N. Similar values were obtained by Ma and Herath (2016) for spring canola planted under Canada's drought conditions. The PFPN values declined linearly with the decline in water availability under MTI; this concurred with a similar observation by Rathore et al. (2021). Yield penalties were incurred under the 55% ETc irrigation regime because of the imposed deficit irrigation (DI). This means that extreme MTI DI strategies are not suitable for canola production, as water stress reduces the mobility of the and the assimilate. Full irrigation (100% ETc) and optimal DI (75% ETc) recorded relatively high yields compared to the 55% ETc irrigation regime. The observation is attributed to the availability of irrigation water for improved N utilization. Maaz et al. (2016) attributed good canola oilseed yield to optimal irrigation strategies. Biomass did not show a significant statistical difference because extreme deficit irrigation scenarios constrained reproductive efficiency rather than overall plant growth, likely through effects on flowering, seed set, or assimilate partitioning (Rathke et al., 2006; Ellis et al., 2020).
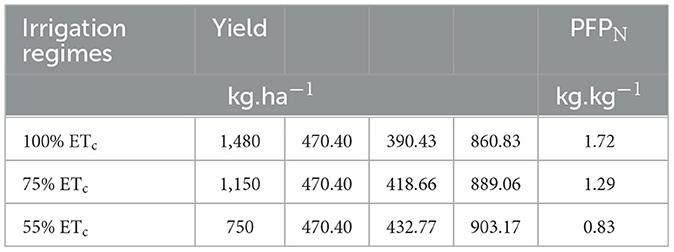
Table 11. PFPN as a proxy to NUE for the respective irrigation regimes.
The PFPN values observed in this study align well with agronomic benchmarks reported for canola systems in both global and semi-arid contexts. A study by Rathke et al. (2006), on global canola N response trials, noted PFPN values typically range from 1.2 to 2.0 kg grain per kg N applied, with diminishing returns under excessive N inputs. Additionally, Ellis et al. (2020) further confirmed that in dryland or semi-arid environments, PFPN values between 1.0 and 1.5 kg.kg−1 are considered efficient. In this study, PFPN values of 1.72 kg.kg−1 under full irrigation and 1.29 kg.kg−1 under moderate deficit (75% ETc) fall squarely within these ranges. These results suggest that MTI-supported fertigation can maintain high nitrogen use efficiency, even under water-conserving regimes, offering a balanced agronomic-environmental trade-off.
Summary, conclusions and recommendations
The study sought to demonstrate nitrate distribution in a silty clay loam soil profile and nitrate leaching under MTI. We further employed HYDRUS 2D/3D to simulate solute mobility under three irrigation regimes, namely, full irrigation (100% ETc) and two deficit irrigation (DI) regimes (75% ETc and 55% ETc). The results revealed that under full irrigation and optimal DI strategies, maximum nutrient utilization is evidenced by high yields. These findings resonate with the study by Muhammad et al. (2022) which reducing irrigation water availability to 60% of field capacity improved nitrogen metabolism and significantly decreased nitrate leaching in maize. This study observed that passive, soil moisture-responsive water delivery under moderate deficit conditions (75% ETc) restricted nitrate transport beyond the root zone. Additionally, Ayars et al. (2020) revealed that controlled and slow release of urea as how MTI operates, reduces nitrate loss and aligns nitrogen availability with crop demand, thereby enhancing nitrogen use efficiency (NUE). By mimicking a controlled, low-flux fertigation environment, MTI effectively supports both environmental protection goals and agronomic performance.
Under extreme DI conditions, the canola crop absorbs the fertilizer as a coping mechanism. The coping mechanism is a trade-off for yield and biomass accumulation. The nitrogen budget revealed minimal leaching and increased NUE under full irrigation regimes (100% ETc) and optimal deficit irrigation regimes (75% ETc). Extreme deficit methods under MTI are unfavorable for nitrogen availability for the canola crop. The study concluded that nitrate distribution under full and optimal irrigation regimes provided nutrients for the plants, whereas the extreme DI strategy promotes nutrient leaching.
This study provides the first comprehensive modeling-based analysis of nitrate movement under Moistube Irrigation using HYDRUS 2D/3D, calibrated with field observations. By simulating nitrate fluxes under varying deficit irrigation levels, we demonstrate that MTI's self-regulating discharge promotes nitrate retention within the root zone, particularly under mild deficits (e.g., 75% ETc), thus minimizing leaching risk. The integration of solute transport metrics with agronomic indicators such as partial factor productivity of nitrogen (PFPN) offers a dual-lens perspective on both environmental and efficiency outcomes. Unlike prior MTI studies that focused primarily on wetting front dynamics, this study quantifies the leaching trajectories, identifies model sensitivity zones (through temporal residual patterns, boundary condition influence, and comparative statistical performance), and presents a validation framework for MTI-nutrient interaction modeling. These findings support MTI's role in low-emission, high-efficiency irrigation strategies and offer actionable insights for optimizing fertigation scheduling in water-scarce and nitrate-vulnerable systems.
The study therefore concluded that:
i. HYDRUS 2D/3D successfully simulated the solute movement under full irrigation (100% ETc) and optimal irrigation (75% ETc) conditions.
ii. HYDRUS 2D/3D poorly simulates solute movement for canola crop grown under extreme DI strategy (55% ETc).
iii. The nitrogen use efficiency (NUE) as measured by partial factor productivity of applied N (PFPN) is considerably high for full irrigation and optimal DI strategies.
The study was carried out under a controlled environment; therefore, it is recommended that it be done under rainfed field conditions and assess the relative solute mobility for the respective irrigation regimes.
Data availability statement
The raw data supporting the conclusions of this article will be made available by the authors upon reasonable request.
Author contributions
TD: Conceptualization, Data curation, Formal analysis, Investigation, Methodology, Writing – original draft, Writing – review & editing. AS: Conceptualization, Funding acquisition, Project administration, Supervision, Writing – review & editing. TM: Conceptualization, Funding acquisition, Project administration, Resources, Supervision, Writing – review & editing.
Funding
The author(s) declare that financial support was received for the research and/or publication of this article. This research was supported by the National Research Foundation (NRF) of South Africa (Grant Number 131377). This study was partly funded by the CGIAR Sustainable Farming Science Programme.
Conflict of interest
The authors declare that the research was conducted in the absence of any commercial or financial relationships that could be construed as a potential conflict of interest.
Generative AI statement
The author(s) declare that no Gen AI was used in the creation of this manuscript.
Publisher's note
All claims expressed in this article are solely those of the authors and do not necessarily represent those of their affiliated organizations, or those of the publisher, the editors and the reviewers. Any product that may be evaluated in this article, or claim that may be made by its manufacturer, is not guaranteed or endorsed by the publisher.
References
Agostini, F., Tei, F., Silgram, M., Farneselli, M., Benincasa, P., and Aller, M. (2010). “Decreasing nitrate leaching in vegetable crops with better N management,” in Genetic Engineering, Biofertilisation, Soil Quality and Organic Farming (Cham: Springer), 147–200.
Ajdary, K., Singh, D., Singh, A. K., and Khanna, M. (2007). Modelling of nitrogen leaching from experimental onion field under drip fertigation. Agricult. Water Managem. 89, 15–28. doi: 10.1016/j.agwat.2006.12.014
Ayars, J. E., Phene, C. J., and Hutmacher, R. B. (2020). Controlled-release urea improves crop yields and mitigates nitrate leaching in irrigated agriculture. Agricult. Water Managem. 230:105925. doi: 10.1016/j.agwat.2019.105925
Bar-Yosef, B. (1999). Advances in fertigation. Adv. Agron. 65, 1–77. doi: 10.1016/S0065-2113(08)60910-4
Chakraborty, P., and Das, B. S. (2018). Measurement and modeling of longitudinal dispersivity in undisturbed saturated soil: an experimental approach. Soil Sci. Soc. Am. J. 82, 1117–1123. doi: 10.2136/sssaj2018.05.0176
Clothier, B., and Sauer, T. (1988). Nitrogen transport during drip fertigation with urea. Soil Sci. Soc. Am. J. 52, 345–349. doi: 10.2136/sssaj1988.03615995005200020008x
Coetzee, A. (2017). Rate and timing of nitrogen fertilisation for canola production in the Western Cape of South Africa (Unpublished MSc thesis). Agronomy, Stellenbosch University, Stellenbosch, South Africa.
Cresswell, H. P., Green, T. W., and McKenzie, N. J. (2008). The adequacy of pressure plate apparatus for determining soil water retention. Soil Sci. Soc. Am. J. 72, 41–49. doi: 10.2136/sssaj2006.0182
Cutforth, H., Angadi, S., McConkey, B., Miller, P., Ulrich, D., Gulden, R., et al. (2013). Comparing rooting characteristics and soil water withdrawal patterns of wheat with alternative oilseed and pulse crops grown in the semiarid Canadian prairie. Can. J. Soil Sci. 93, 147–160. doi: 10.4141/cjss2012-081
Dirwai, T. L., Senzanje, A., and Mabhaudhi, T. (2022). Development and validation of a model for soil wetting geometry under Moistube Irrigation. Sci. Rep. 12:2737. doi: 10.1038/s41598-022-06763-x
Dobermann, A. R. (2005). Nitrogen use Efficiency-State of the Art. Nebraska: Agriculture and Horticulture Department, University of Nebraska - Lincoln.
Doorenbos, J., and Kassam, A. H. (1979). Yield Response to Water. Rome: Food and Agriculture Organization of the United Nations.
Eissa, M. A., and Roshdy, N. M. K. (2018). Effect of nitrogen rates on drip irrigated maize grown under deficit irrigation. J. Plant Nutr. 42, 127–136. doi: 10.1080/01904167.2018.1549676
Elasbah, R., Selim, T., Mirdan, A., and Berndtsson, R. (2019). Modeling of fertilizer transport for various fertigation scenarios under drip irrigation. Water 11, 893. doi: 10.3390/w11050893
Ellis, G. D., Knowles, L. O., and Knowles, N. R. (2020). Developmental and postharvest physiological phenotypes of engineered potatoes (Solanum tuberosum L.) grown in the Columbia Basin. Field Crops Res. 250, 107775. doi: 10.1016/j.fcr.2020.107775
Fan, Y.-W., Huang, N., Zhang, J., and Zhao, T. (2018a). Simulation of Soil Wetting Pattern of Vertical Moistube-Irrigation. Water 10:601. doi: 10.3390/w10050601
Fan, Y.-W., Huang, N., Zhang, J., and Zhao, T. (2018b). Simulation of soil wetting pattern of vertical moistube-irrigation. Water 10:601. doi: 10.3390/w10050601
FAO (1998). Crop evapotranspiration - Guidelines for computing crop water requirements. FAOIrrigation and Drainage paper 56. Rome: FAO.
Fwa, T., Tan, S., and Chuai, C. (1998). Permeability measurement of base materials using falling-head test apparatus. Transport. Res. Record 1615, 94–99. doi: 10.3141/1615-13
Gan, Y., Liu, L., Cutforth, H., Wang, X., and Ford, G. (2011). Vertical distribution profiles and temporal growth patterns of roots in selected oilseeds, pulses and spring wheat. Crop Pasture Sci. 62, 457–466. doi: 10.1071/CP10406
Gärdenäs, A., Hopmans, J., Hanson, B., and Šimunek, J. (2005). Two-dimensional modeling of nitrate leaching for various fertigation scenarios under micro-irrigation. Agricult. Water Managem.74, 219–242. doi: 10.1016/j.agwat.2004.11.011
Gupta, M., and Khosla, R. (2012). “Precision nitrogen management and global nitrogen use efficiency,” in Proceedings of the 11th International Conference on Precision Agriculture, Indianapolis, USA (International Society of Precision Agriculture (ISPA)).
Hanson, B. R., Šimunek, J., and Hopmans, JW. (2006). Evaluation of urea–ammonium–nitrate fertigation with drip irrigation using numerical modeling. Agricult. Water Managem. 86, 102–113. doi: 10.1016/j.agwat.2006.06.013
Incrocci, L., Massa, D., and Pardossi, A. (2017). New trends in the fertigation management of irrigated vegetable crops. Horticulturae 3:37. doi: 10.3390/horticulturae3020037
Jansson, P., and Karlberg, L. (2011). Coupled Heat and Mass Transfer Model for Soil-Plant-Atmosphere Systems. Stockholm: Royal Institute of Technology, Dept of Civil and Environmental Engineering.
Javadzadeh, F., Khaledian, M., Navabian, M., and Shahinrokhsar, P. (2017). Simulations of both soil water content and salinity under tape drip irrigation with different salinity levels of water. Geosystem Engineering 20, 231–236. doi: 10.1080/12269328.2017.1298478
Jun, Z., Wenquan, N., Linlin, Z., and Liyan, S. (2012). Experimental study on characters of wetted soil in moistube irrigation. Sci. Soil Water Conserv. 10, 32–38.
Kafle, B., Momen, B., and Leskovar, D. I. (2025). Influence of deficit irrigation and biochar amendment on growth, physiology, and yield of cucumber in West Texas. Sci. Rep. 15:94113. doi: 10.1038/s41598-025-94113-y
Kanda, E. K., Mabhaudhi, T., and Senzanje, A. (2018). Hydraulic and clogging characteristics of Moistube irrigation as influenced by water quality. J. Water Supply: Res. Technol.-Aqua 67, 438–446. doi: 10.2166/aqua.2018.166
Kanda, E. K., Niu, W., Mabhaudhi, T., and Senzanje, A. (2019). Moistube irrigation technology: a review. Agricult. Res. 9, 139–147. doi: 10.1007/s40003-019-00448-0
Kanda, E. K., Senzanje, A., and Mabhaudhi, T. (2020a). Modelling soil water distribution under Moistube irrigation for cowpea (Vigna unguiculata (L.) Walp.) crop. Irrigat. Drain. 69, 1116–1132. doi: 10.1002/ird.2505
Kanda, E. K., Senzanje, A., and Mabhaudhi, T. (2020b). Soil water dynamics under Moistube irrigation. Phys. Chem. Earth 115:102836. doi: 10.1016/j.pce.2020.102836
Kanda, E. K., Senzanje, A., and Mabhaudhi, T. (2020c). Soil water dynamics under Moistube irrigation. Phys. Chem. Earth 115:102836. doi: 10.1016/j.pce.2020.102836
Klute, A. (1986). Water Retention: Laboratory Methods. Madison: American Society of Agronomy-Soil Science Society of America.
Ling, G., and El-Kadi, A. I. (1998). A lumped parameter model for nitrogen transformation in the unsaturated zone. Water Resour. Res. 34, 203–212. doi: 10.1029/97WR02683
Liu, X., Zhu, Y., Yu, X., Li, Y., Tang, J., and Yu, L. (2017). Water-salinity distribution characteristics in wetted soil of moistube irrigation under different pressure heads and soil bulk densities. Trans. Chin. Soc. Agric. Mach 48, 194–202.
Lotse, E., Jabro, J., Simmons, K., and Baker, D. (1992). Simulation of nitrogen dynamics and leaching from arable soils. J. Contam. Hydrol. 10, 183–196. doi: 10.1016/0169-7722(92)90060-R
Luce, M. S., Grant, C. A., Ziadi, N., Zebarth, B. J., O'Donovan, J. T., Blackshaw, R. E., et al. (2016). Preceding crops and nitrogen fertilization influence soil nitrogen cycling in no-till canola and wheat cropping systems. Field Crops Res. 191, 20–32. doi: 10.1016/j.fcr.2016.02.014
Lv, H., Lin, S., Wang, Y., Lian, X., Zhao, Y., Li, Y., et al. (2019). Drip fertigation significantly reduces nitrogen leaching in solar greenhouse vegetable production system. Environm. Pollut. 245, 694–701. doi: 10.1016/j.envpol.2018.11.042
Ma, B. L., and Herath, A. W. (2016). Timing and rates of nitrogen fertilizer application on seed yield, quality and nitrogen-use efficiency of canola. Crop Past. Sci. 67, 167–180. doi: 10.1071/CP15069
Maaz, T., Pan, W., and Hammac, W. (2016). Influence of soil nitrogen and water supply on canola nitrogen use efficiency. Agron. J. 108, 2099–2109. doi: 10.2134/agronj2016.01.0008
Merdun, H. (2012). Effects of different factors on water flow and solute transport investigated by time domain reflectometry in sandy clay loam field soil. Water Air Soil Pollut. 223, 4905–4923. doi: 10.1007/s11270-012-1246-x
Merdun, H., Meral, R., and Riza Demirkiran, A. (2008). Effect of the initial soil moisture content on the spatial distribution of the water retention. Eurasian Soil Sci. 41, 1098–1106. doi: 10.1134/S1064229308100128
Mmolawa, K., and Or, D. (2000a). Root zone solute dynamics under drip irrigation: a review. Plant Soil Sci. 222, 163–190. doi: 10.1023/A:1004756832038
Mmolawa, K., and Or, D. (2000b). Water and solute dynamics under a drip-irrigated crop: experiments and analytical model. Trans. ASAE 43, 1597–1608. doi: 10.13031/2013.3060
Moriasi, D. N., Arnold, J. G., Van Liew, M. W., Bingner, R. L., Harmel, R. D., and Veith, T. L. (2007). Model evaluation guidelines for systematic quantification of accuracy in watershed simulations. Trans. ASABE 50, 885–900. doi: 10.13031/2013.23153
Muhammad, I., Rehim, A., Wang, J., Abid, M., and Dehghanisanij, H. (2022). Low irrigation water availability limits nitrate nitrogen losses in maize by improving nitrogen metabolism and soil fertility. BMC Plant Biol. 22:546. doi: 10.1186/s12870-022-03548-2
Parhi, P. K., Mishra, S. K., and Singh, R. (2007). A modification to Kostiakov and modified Kostiakov infiltration models. Water Resour. Managem. 21, 1973–1989. doi: 10.1007/s11269-006-9140-1
R Core-Team (2017). R: A Language and Environment for Statistical Computing. Vienna: R Foundation for Statistical Computing.
Rathke, G.-W., Behrens, T., and Diepenbrock, W. (2006). Integrated nitrogen management strategies to improve seed yield, oil content and nitrogen efficiency of winter oilseed rape (Brassica napus L.): a review. Agricult. Ecosyst. Environm. 117, 80–108. doi: 10.1016/j.agee.2006.04.006
Rathore, V. S., Nathawat, N. S., Bhardwaj, S., Yadav, B. M., Kumar, M., Santra, P., et al. (2021). Optimization of deficit irrigation and nitrogen fertilizer management for peanut production in an arid region. Sci. Rep. 11, 1–14. doi: 10.1038/s41598-021-82968-w
Rawls, W. J., Brakensiek, D. L., and Saxtonn, K. (1982). Estimation of soil water properties. Trans. ASAE 25, 1316–1320. doi: 10.13031/2013.33720
Richards, L. A. (1931). Capillary conduction of liquids through porous mediums. In: Physics. American Physical Society. doi: 10.1063/1.1745010
Schulze-Makuch, D. (2005). Longitudinal dispersivity data and implications for scaling behavior. Ground Water 43, 443–456. doi: 10.1111/j.1745-6584.2005.0051.x
Shen, L., Zhang, Y., Yang, M., and Liu, R. (2020). Effects of alternate moistube-irrigation on soil water infiltration. Int. J. Agricult. Biol. Eng. 13, 151–158. doi: 10.25165/j.ijabe.20201304.5297
Šimunek, J., Šejna, M., and Van Genuchten, M. T. (1999). “The HYDRUS-2D software package for simulating to-dimensional movement of water, heat, and multiple solutes in variable saturated media,” in Version 2.0. IGWMC-TPS-53 (Colorado: International Ground Water Modeling Center, Colorado School of Mines).
Šimunek, J., van Genuchten, M. T., and Šejna, M. (2012). The HYDRUS-1D Software Package for Simulating the One-Dimensional Movement of Water, Heat, and Multiple Solutes in Variably-Saturated Media. Riverside: Department of Environmental Sciences, University of California RiversideSA.
Simunek, J., van Genuchten, R., and Sejna, M. (2012). HYDRUS: Model Use, Calibration, and Validation. Trans. ASABE 55, 1263–1276. doi: 10.13031/2013.42239
Skaggs, T. H., Trout, T. J., Šimunek, J., and Shouse, PJ. (2004). Comparison of HYDRUS-2D simulations of drip irrigation with experimental observations. J. Irrigat. Drain. Eng. 130, 304–310. doi: 10.1061/(ASCE)0733-9437(2004)130:4(304)
Steduto, P., Hsiao, T. C., Raes, D., and Fereres, E. (2009). AquaCrop-the FAO crop model to simulate yield response to water: I. concepts and underlying principles. Agron. J. 101, 426–437. doi: 10.2134/agronj2008.0139s
Sun, G., Li, Y., Liu, X., Cui, N., Gao, Y., and Yang, Q. (2019a). Effect of Moistube Fertigation On Infiltration And Distribution Of Water-Fertilizer In Mixing Waste Biomass Soil. Sustainability 11:6757. doi: 10.3390/su11236757
Sun, Y., Yang, Y., and Liu, W. (2019b). Effect of moistube fertigation on infiltration and distribution of water and nitrogen in soil. Sustainability 11:6757. doi: 10.3390/su11236757
Ventura, M., Scandellari, F., Ventura, F., Guzzon, B., Pisa, P. R., and Tagliavini, M. (2008). Nitrogen balance and losses through drainage waters in an agricultural watershed of the Po Valley (Italy). Eur. J. Agron. 29, 108–115. doi: 10.1016/j.eja.2008.05.002
Vogel, T., Van Genuchten, M. T., and Cislerova, M. (2000). Effect of the shape of the soil hydraulic functions near saturation on variably-saturated flow predictions. Adv. Water Resour. 24, 133–144. doi: 10.1016/S0309-1708(00)00037-3
Vrugt, J., Hopmans, J., and Šimunek, J. (2001). Calibration of a two-dimensional root water uptake model. Soil Sci. Soc. Am. J. 65:1027–1037. doi: 10.2136/sssaj2001.6541027x
Wilkinson, W. (1968). Constant head in situ permeability tests in clay strata. Geotechnique 18, 172–194. doi: 10.1680/geot.1968.18.2.172
Xin, J., Liu, Y., Chen, F., Duan, Y., Wei, G., Zheng, X., et al. (2019). The missing nitrogen pieces: A critical review on the distribution, transformation, and budget of nitrogen in the vadose zone-groundwater system. Water Res. 165:114977. doi: 10.1016/j.watres.2019.114977
Yang, J., Yang, J., Liu, S., and Hoogenboom, G. (2014). An evaluation of the statistical methods for testing the performance of crop models with observed data. Agric. Syst. 127, 81–89. doi: 10.1016/j.agsy.2014.01.008
Yang, W., Tian, L., Du, T., Ding, R., and Yang, Q. (2008). Research Prospect of the Water-saving Irrigation by Semi-permeable Film. J. Water Resour. Water Eng. 6:016.
Yang, Y., Zhang, X., Sun, Y., and Liu, W. (2023). Dynamics of Moistube discharge, soil-water redistribution, and wetting patterns under different emitter pressures. Agricult. Water Managem. 271:107777. doi: 10.1016/j.agwat.2023.108285
Youngs, E. G., and Leeds-Harrison, P. B. (1990). Aspects of transport processes in aggregated soils. J. Soil Sci. 41, 665–675. doi: 10.1111/j.1365-2389.1990.tb00235.x
Zakwan, M. (2017). Assessment of dimensionless form of Kostiakov model. Aquademia 1:01. doi: 10.20897/awet.201701
Zhang, H., and Flottmann, S. (2018). Source-sink manipulations indicate seed yield in canola is limited by source availability. Eur. J. Agron. 96, 70–76. doi: 10.1016/j.eja.2018.03.005
Zhang, H., Zhang, L., Liu, M., and Yang, Z. (2022). Dynamic transport of nitrate under different irrigation regimes in arid conditions. Agricult. Water Managem. 260:107243. doi: 10.1016/j.agwat.2022.107243
Appendix I. Irrigation schedule
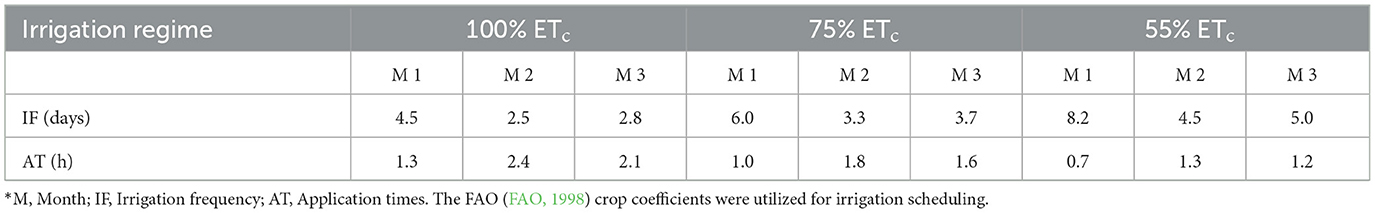
Table A1. Irrigation frequencies and application times.
Keywords: diffusion, hydrodynamic dispersion, leaching, Moistube irrigation, nitrogen use efficiency
Citation: Dirwai TL, Senzanje A and Mabhaudhi T (2025) Two-dimensional modeling of nitrate transport in canola field under Moistube irrigation using HYDRUS 2D/3D. Front. Sustain. Food Syst. 9:1538750. doi: 10.3389/fsufs.2025.1538750
Received: 03 December 2024; Accepted: 09 June 2025;
Published: 17 July 2025.
Edited by:
Shah Jahan Leghari, Northwest A&F University, ChinaReviewed by:
Ghulam Raza Sargani, Northwest A&F University, ChinaUmed Ali, Mir Chakar Khan Rind University, Pakistan
Rajesh Kumar Soothar, Sindh Agriculture University, Pakistan
Copyright © 2025 Dirwai, Senzanje and Mabhaudhi. This is an open-access article distributed under the terms of the Creative Commons Attribution License (CC BY). The use, distribution or reproduction in other forums is permitted, provided the original author(s) and the copyright owner(s) are credited and that the original publication in this journal is cited, in accordance with accepted academic practice. No use, distribution or reproduction is permitted which does not comply with these terms.
*Correspondence: Tinashe Lindel Dirwai, dC5kaXJ3YWlAY2dpYXIub3Jn; Tafadzwanashe Mabhaudhi, VGFmYWR6d2FuYXNoZS5NYWJoYXVkaGlAbHNodG0uYWMudWs=