 Zenghui Huo
 Yuhui Yang1
 Mei Zhang
- 1College of Economics and Management, China Jiliang University, Hangzhou, China
- 2College of Economics and Management, Huazhong Agricultural University, Wuhan, China
- 3Nanxun Innovation Institute, Zhejiang University of Water Resources and Electric Power, Hangzhou, China
Introduction: Given China’s vast geographic diversity and significant regional development disparities, it is crucial to explore whether the livelihood strategies of rural households in different regions influence relative poverty outcomes spatially.
Methods: This study utilizes survey data from 892 rural households to investigate the agglomeration of relative poverty among rural households, employing both global and local Moran’s I indices. Additionally, a geographically weighted regression (GWR) model is used to analyze the spatial differentiation of the impact of livelihood strategies on rural households’ relative poverty.
Results and discussion: A positive spatial autocorrelation exists between relative poverty and livelihood strategy variables, indicating an overall trend of high-value clustering. The local Moran’s I index shows significant spatial clustering of relative poverty among rural populations, with distinct characteristics across regions. In economically developed areas, relative poverty among rural populations exhibits a “low-low” agglomeration pattern, whereas in economically underdeveloped areas, it manifests as a “high-high” agglomeration. The GWR results reveal that the impact of various livelihood strategies differs significantly. The business-oriented livelihood strategy has a substantial inhibitory effect on relative poverty, whereas the employment-based strategy tends to exacerbate it. In contrast, the agriculture-based livelihood strategy exhibits a dual effect. The kernel density of regression coefficients illustrates spatial differentiation in the impacts of different livelihood strategies. In rural areas closer to markets, business livelihood strategies can reduce relative poverty among rural populations. Additionally, in rural areas close to economically developed cities, income from employment is more effective in helping families overcome poverty. Engaging in specialty agricultural production can also help diminish relative poverty; however, rural households in remote mountainous areas, who lack access to specialty agriculture, may find that traditional agricultural practices further exacerbate their relative poverty.
1 Introduction
Over the past few decades, global economic transformations and social restructuring have significantly alleviated absolute poverty. However, relative poverty has increasingly emerged as a core issue in global development. The United Nations’ 2030 agenda for Sustainable Development explicitly aims to ‘end poverty in all its forms everywhere’. Due to its concealed and dynamic nature, relative poverty presents a more profound challenge to achieving this goal (Jolliffe and Prydz, 2021). Emerging economies such as China, have achieved rapid economic growth but are simultaneously confronted with rising income inequality. This has resulted in a ‘quick exit, quick relapse’ cycle among relatively poor populations (Wan et al., 2021). According to the World Bank (2020), approximately 80% of the world’s poor reside in rural areas. As one of the world’s most dynamic economies, China eradicated absolute poverty in 832 counties, 128,000 villages, and among 98.99 million rural residents a decade ahead of schedule under the current poverty line (Sun and Yin, 2025). This achievement contributed to over 70% of the global poverty reduction during the same period (World Bank, 2021). Nevertheless, due to the fragility of livelihoods and the limited coverage of social safety nets, the elimination of absolute poverty does not signify the end of poverty governance (Li and Xu, 2018). On the contrary, addressing relative poverty presents more complex challenges, including multifaceted poverty drivers, difficulties in identifying the poor, a large population of relatively disadvantaged groups (Gao and Tang, 2024), and insufficient intrinsic motivation for sustainable poverty alleviation (Bu, 2018).
The sustainable livelihoods framework highlights that livelihood strategies offer a crucial perspective for understanding relative poverty among rural households. Different livelihood capitals and strategies lead to varying poverty outcomes. Fundamentally, poverty reduction depends on individuals or households engaging in productive economic activities to secure adequate and stable livelihoods (Sharaunga and Mudhara, 2021). Studies show that households that diversify their income sources into non-agricultural activities have a significantly higher probability of escaping poverty compared to those relying solely on agriculture (Tran, 2016). However, livelihood strategies vary across households. The existing research pays insufficient attention to the spatial heterogeneity of these strategies and their impact on the spatial distribution of rural poverty. Specifically, do differences in household livelihood strategies exhibit spatial clustering or spatial differentiation? More importantly, how do these spatial characteristics influence the spatial distribution of relative poverty among rural households? A deeper exploration of this issue not only helps reveal the micro-level mechanisms behind the spatial differentiation of rural relative poverty but also provides a theoretical basis for formulating differentiated regional poverty alleviation policies.
Analyzing poverty from a spatial perspective is a critical topic within poverty research. Extant literature primarily approaches this issue from two angles: spatial dependence and spatial heterogeneity. Spatial dependency refers to the phenomenon where poverty in a given area is influenced by the poverty status of neighboring areas (Khan and Sloboda, 2023). This characteristic aligns with the First Law of Geography, which posits that ‘everything is related to everything else, but near things are more related than distant things’. Empirical studies have demonstrated significant spatial clustering of rural poverty (Pei et al., 2024), with various influencing factors such as household characteristics, institutional frameworks, and environmental conditions exhibiting spillover effects (Liu W. et al., 2023; Ullah and Majeed, 2023). For example, the poverty level in one region is closely linked to that of the surrounding areas, and this implies that reducing poverty in a particular community can have positive spillover effects in the neighboring areas (Crandall and Weber, 2004). At the individual level, the so-called ‘bad neighbor effect’ constrains people’s ability to escape poverty, especially for those residing in persistently impoverished areas (Bird, 2019). Due to the influence of overall regional development and group dependency, they often have low investment intentions and poor returns.
In China, the existing research mainly investigates the distribution law of relative poverty in different spatial scales from the prefecture-level scale, county-level scale, and village-level scale. From the perspective of municipal spatial scale, in the six reservoir areas of the upper reaches of the Yangtze river, the multidimensional poverty of migrants presents a certain spatial distribution heterogeneity (He et al., 2019). In the middle and upper reaches of the Yellow river basin, the poverty vulnerability of urban and rural residents has regional spillover (Zhang et al., 2022). From the perspective of county spatial scale, in the North China Plain, there is a significant difference in the spatial distribution of county relative poverty degree in the Hebei Province, and the counties with high relative poverty degree are mainly distributed in northwest, central and southern Hebei (Cai et al., 2019). On the Qinghai-Tibet Plateau, the counties in Tibet and four provinces with similar relative poverty are clustered in space (Li and Su, 2021). From the perspective of the township and village spatial scale, the administrative village scale is a better angle to understand the poverty pattern and its causes in the Liupanshan region of Gansu Province (Ma et al., 2022).
Factors influencing the spatial differentiation of poverty have also been a key focus of research. Traditional causal analyses often rely on ordered, homogeneous linear relationships, overlooking the spatial attributes of human agency (Gotham, 2003). The importance of different factors varies across regions (Okwi et al., 2007; Xu et al., 2021). Firstly, natural factors such as the distance from rural to urban areas and soil types are important predictors of regional poverty rates (Salvacion, 2020). Secondly, economic and social factors—including employment growth (Crandall and Weber, 2004) and social security expenditures (Dong et al., 2021), have been proven by many scholars to have a significant impact on poverty alleviation in regions. Thirdly, some scholars have conducted comprehensive analyses of spatial impact differences at various administrative scales, such as villages and counties (Wang et al., 2021). Additionally, other studies have further examined how the regional heterogeneity of individual characteristics influences relative poverty (Zhang et al., 2020).
However, the existing studies exhibit several notable limitations. First, with respect to the scale of analysis, most current spatial poverty research tends to focus on macro levels such as the provincial and county levels, while overlooking the household as the fundamental micro-level decision-making unit where poverty originates. Such absence of micro-scale analysis hampers the ability to uncover the underlying mechanisms driving spatial differentiation of poverty. Second, regarding the influencing mechanisms, although some studies have recognized that household livelihood strategies—such as ecological farming and the adoption of organic agriculture—exhibit spatial dependence (Shao et al., 2021; Lu et al., 2022), there remains a lack of systematic investigation into how the spatial heterogeneity of these livelihood strategies affects the distribution of relative poverty among farming households. In particular, the heterogeneous impacts of livelihood strategies on relative poverty across different regional contexts have yet to be thoroughly explored.
Building on this, the present study takes China as a case and utilizes survey data from six provinces to examine the spatial clustering of relative poverty at the household level through spatial analysis methods. It further investigates how livelihood strategies affect the spatial differentiation of relative poverty among farming households. First, the relative poverty scores for households are calculated based on Chinese rural household survey data and the Item Response Theory (IRT) model. Then, the global Moran’s I statistic is used to examine the spatial distribution characteristics of the relative poverty index. Next, the local Moran’s I index is applied to identify the types of spatial clustering of relative poverty across different regions. Third, a Geographically Weighted Regression (GWR) model is employed to identify key factors influencing the household relative poverty. Kernel density estimation is also applied. It analyzes how different livelihood strategies impact relative poverty across regions.
This article offers several potential contributions. First, using survey data from rural households across six provinces in eastern, central, and western China, it examines the spatial heterogeneity of relative poverty from the perspective of regional development imbalances, providing empirical evidence to inform differentiated regional poverty reduction policies. Second, by refining the unit of analysis to the micro-level household scale, the study expands the spatial dimension of relative poverty research, addressing gaps in the existing literature regarding poverty identification scales and offering a more precise analytical framework for accurately identifying impoverished groups. Third, employing spatial econometric methods, the article explores the spillover effects of livelihood strategies on household relative poverty, thereby deepening the micro-level understanding of the mechanisms driving poverty formation.
The organizational structure of this article is as follows. Section 2 introduces the research data and variables, while section 3 presents the analytical methods. Section 4 reports the research findings and section 5 discusses the results. Finally, section 6 presents the conclusion of the study.
2 Materials and methods
2.1 Study area
China’s multidimensional relative poverty shows an uneven distribution, increasing gradually from east to northeast, central, and west (Wang et al., 2023). The study region (Figure 1) includes Zhejiang Province on the east coast of China, Hubei, Hebei, and Jiangxi provinces in the central region, and Guizhou and Yunnan provinces in the west, focusing on the relative poverty situation of rural populations. The basic information of each research region is as follows: (1) Zhejiang Province has a relatively developed economy, a higher income level of rural residents, and a lower income gap between urban and rural areas. In 2020, the per capita disposable income of rural residents in the province was as high as 31,930 yuan, and the urban–rural income multiplier difference was about 1.96. Among the respondents in Zhejiang, Jingning County, and Suichang County are located in remote mountainous areas of Lishui City, Zhejiang Province, while other families are located in more developed rural areas along the coast. (2) The economic development level of the three provinces in the central region is average, and the residents’ income level is relatively high. In 2020, the per capita disposable income of the rural residents in the three provinces was slightly higher than 16,000 yuan, and the urban–rural income multiplier difference was about 2.25. (3) The economic development level of Yunnan Province and Guizhou Province is low, and the income level of rural residents is relatively low. In 2020, the disposable income of rural residents was 12,842 yuan and 11,642 yuan respectively, and the double income difference between urban and rural areas was as high as 2.92 and 3.10. In addition, these two provinces have a relatively large population of ethnic minorities, including Miao, Dai, Dong, and other ethnic minorities, which are the subjects of our survey.
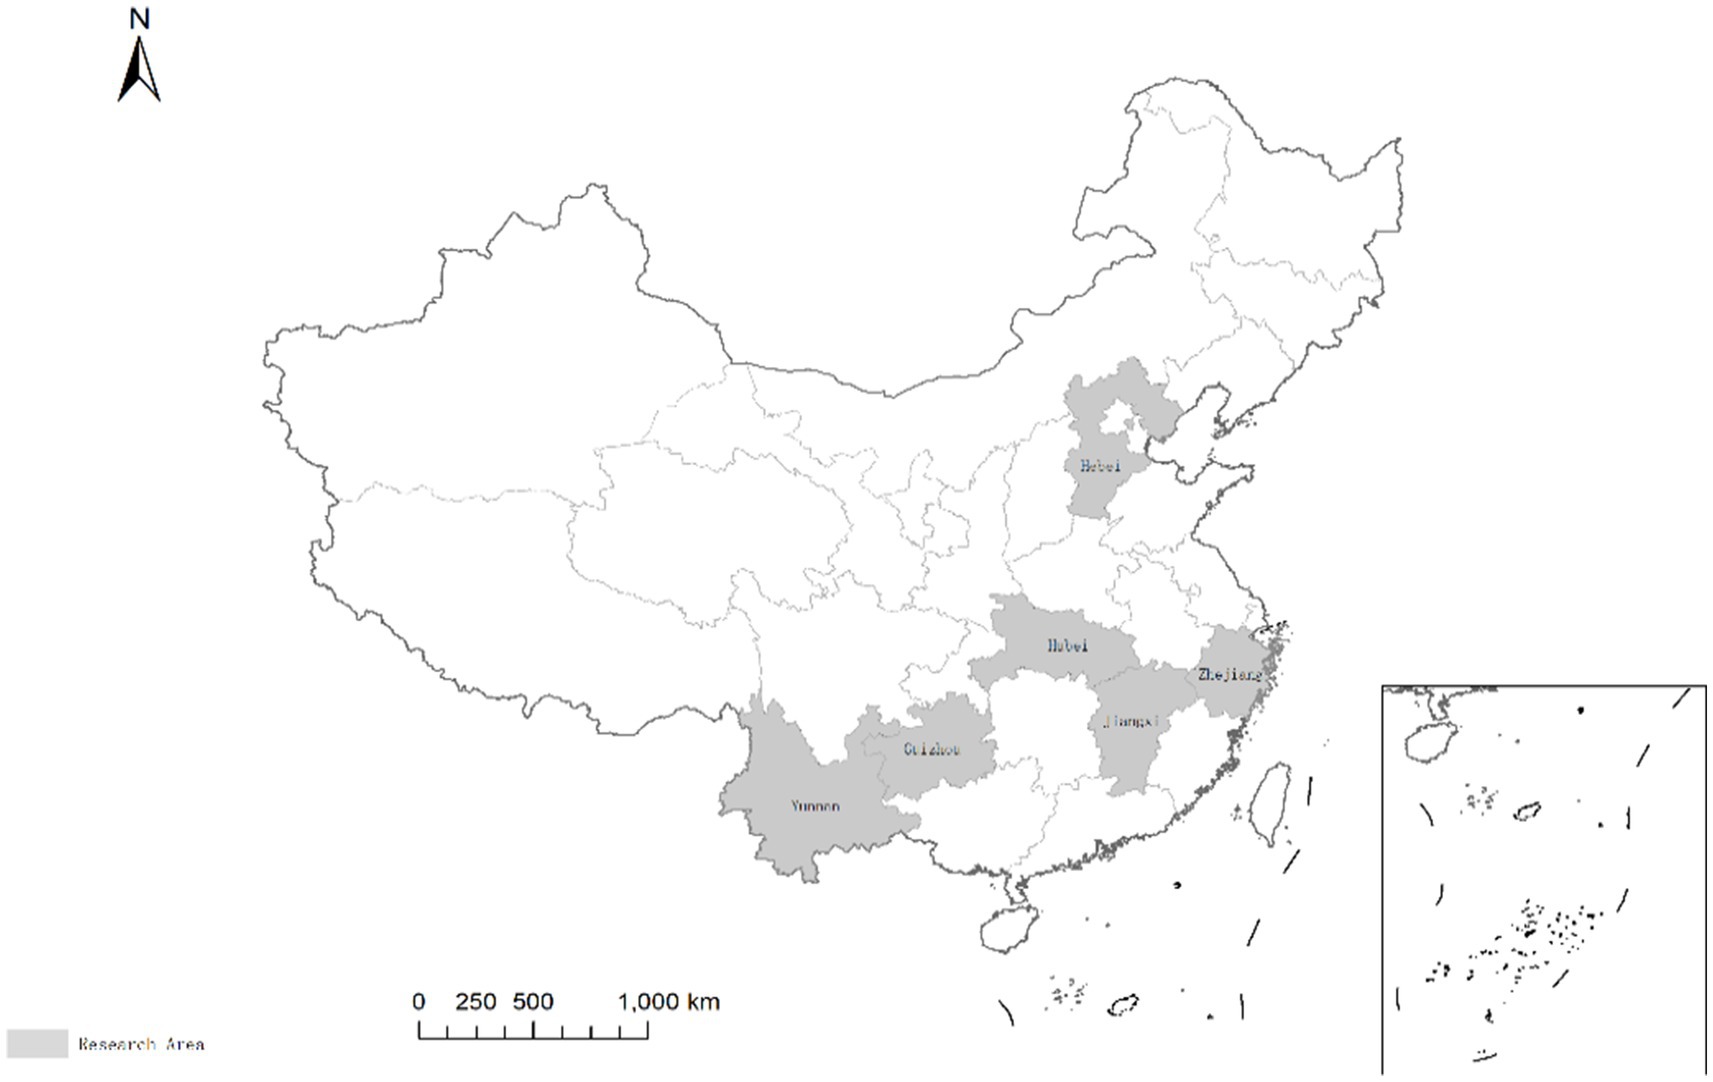
Figure 1. The study area.
2.2 Data source
The data for this study primarily come from a rural household survey conducted by the research team between July and August 2020. The survey employed a combination of stratified random sampling and structured purposive sampling. First, the team determined the survey areas based on geographical distribution and economic development levels: the economically developed eastern region (Zhejiang Province), the moderately developed central region (Hubei, Hebei, and Jiangxi Provinces), and the less developed western region (Yunnan and Guizhou Provinces). Given the study’s focus on regional comparisons, county-level sampling used structured purposive sampling. Within each province, based on per capita GDP, one high-income county or district, two to three middle-income counties or districts, and one to two low-income counties or districts are selected. Within each county or district, one village is then selected for the survey. Since income variation in rural areas in the eastern region is relatively small, this article focuses on examining disparities in the central and western regions. It is acceptable to survey only farmers in eight counties and districts in Zhejiang Province. Within each village, based on the household registration list provided by the village committee, 25 to 30 households were selected in each village using systematic random sampling. In total, 892 valid household responses were collected, with 285 from the western region, 354 from the central region, and 253 from the eastern region. Table 1 details the distribution of the surveyed counties and districts. The survey gathered data on household demographics, living expenditures, and residents’ aspirations for an improved quality of life.
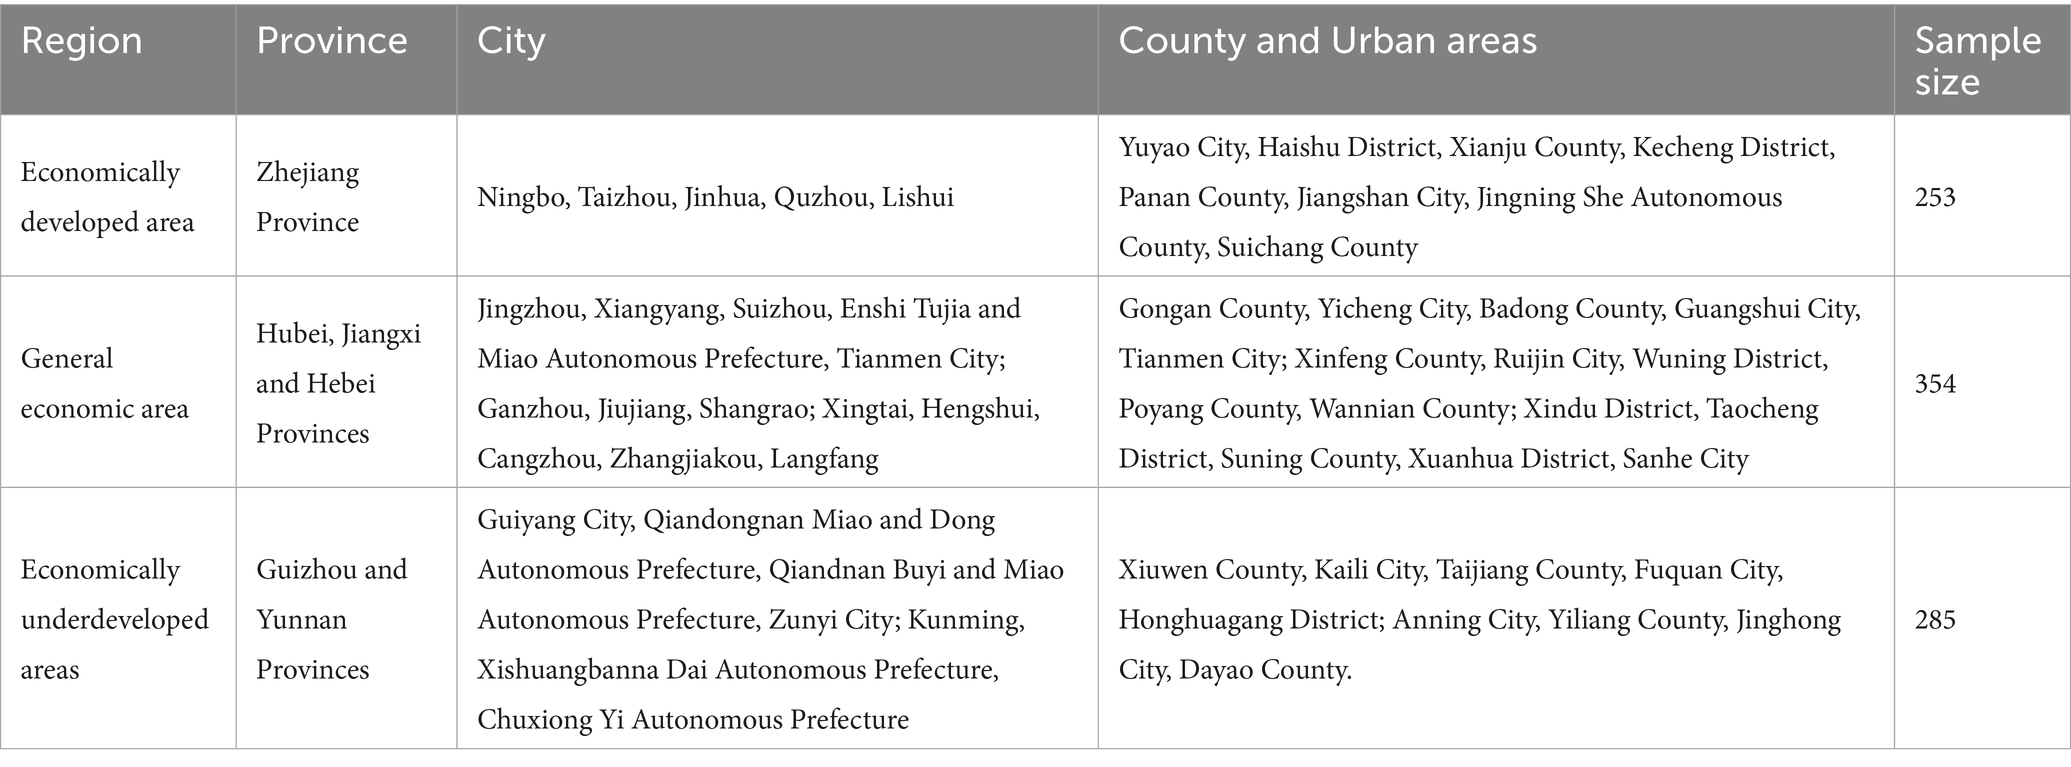
Table 1. Distribution of counties and districts where the sample villages are located.
2.3 Variable selection
2.3.1 Explained variable
Standardized relative poverty. Relative poverty standards include income standards and multidimensional standards, and multidimensional relative poverty is more scientific than income poverty (Liu Y. et al., 2023). This study takes the main contradictions in Chinese society in the new era as the entry point, aims at the needs of rural households for a better life, and selects 25 indicators of social cognitive necessities considered by more than 50% of the respondents according to the evaluation indicators of material needs, social security needs, and social participation needs proposed by Huo and Zhang (2023). Among them, material needs include 10 explicit indicators, such as food, new clothes, washing machines, refrigerators, air conditioners, cars, mobile phones, the Internet, and emergency deposits. Social needs include basic public services such as healthcare, education, and elderly care, as well as express delivery, banking, and garbage disposal services in villages, with a total of 9 explicit indicators. Social participation needs to include six explicit indicators: cultural activities in the village, red envelopes during Spring Festival, mutual assistance among neighbors, gift money in daily communication, dining out, and tourism. When respondents believe that a certain need item is necessary but they are unable to pay, we consider that the need has not been met. At this point, if this need is deprived, it is assigned a value of 1. In other cases, the value is assigned to 0, which means that the need is not deprived. This article considers relative poverty among rural households as a potential structure and uses the project response theory model to estimate the relative poverty index for 25 deprivation indicators. The specific process is as follows. The first step is to use the project response theory model for parameter estimation. The second step is to use the Bayesian expected posterior estimation method to obtain the relative poverty index Theta of rural households. Finally, we standardized Theta. This is mainly because standardized processing can eliminate inconsistencies in the distribution of the original data and can visually show the position of each observation object relative to the overall average. At the same time, standardized processing can also reduce the influence of outliers on the analysis results.
2.3.2 Explanatory variable
Livelihood strategy. A livelihood strategy is a combination of different livelihood activities to achieve specific livelihood goals (DFID, 2000). The Sustainable Livelihood Framework (SLF) emphasizes livelihood strategies that adapt dynamically to changes in the capital assets owned by households, aiming to achieve income growth. Depending on the level of regional development, rural households’ income sources have gradually shifted from predominantly agricultural activities to non-agricultural income. Based on differences in income structure, rural households’ livelihood strategies can be divided into agricultural management strategies, non-agricultural management strategies, non-agricultural dominant strategies, and diversification strategies (An and Fan, 2018). The proportion of income from various sources is a key criterion for distinguishing the livelihood strategies (Soltani et al., 2012). The main livelihood strategies of Chinese rural households include agricultural livelihood (Chen et al., 2020) and migrant worker livelihood (Zhu et al., 2016), among others. Therefore, this study focuses on the shares of income from business, wage labor, and farming within total household income to highlight differences in livelihood strategies (Huo and Zhang, 2023). By incorporating these explanatory variables, the study aims to more comprehensively understand the spatial heterogeneity in how livelihood strategies influence the risk of rural households falling into relative poverty.
2.3.3 Control variables
Age of householder, logarithm of salary, and family risk, among others. The age of the householder is related to his or her work experience, knowledge level, and health level, which directly affect his or her employment opportunities and earning potential. The wage level is an important index to measure family income, and it is treated logarithmically. Family risk reflects the livelihood uncertainty faced by households due to various reasons (such as serious illness, loss of labor force, loss of job opportunities, etc.), and is a comprehensive indicator that can capture information about the economic vulnerability of households.
3 Research method
3.1 Spatial autocorrelation test
3.1.1 Global Moran ‘s I
This index is used to analyze the distribution characteristics of the relative poverty index of rural households and judge whether it is spatially clustered or discrete. This study examines the spatial dependence of poverty by constructing a geographic distance weight matrix based on the inverse of the geographic distances between sample points, following the methodologies of Wei et al. (2025) and Pei et al. (2024) for weighting. The global Moran ‘s I index formula is shown as Equation 1:
Where, is the total number of sample households, and are the observed relative poverty values of the and households, respectively, are the spatial weight values of the households, and is the mean value of the relative poverty of rural households. In this article, the Fixed Distance Method is used to construct the spatial weight matrix. Specifically, the weights of adjacent elements within the specified critical distance (Distance_Band_or_Threshold_Distance) are assigned to 1, the weights of adjacent elements outside the specified critical distance are assigned to 0, and the spatial weight matrix is row normalized. In terms of critical distance, the shortest Euclidean distance of each element with at least one adjacent element is taken as the distance threshold.
The value of Moran ‘s I range from [−1, 1]. If Moran ‘s I is greater than 0, there is a positive spatial correlation between relative poverty among the rural population. Meanwhile, a higher I value represents a stronger spatial correlation of relative poverty. If Moran’s I is less than 0, there is a negative spatial correlation between relative poverty in rural households. Meanwhile, a lower I value indicates a stronger spatial heterogeneity of relative poverty.
3.1.2 Local Moran ‘s I
In this article, local spatial autocorrelation analysis is used to investigate the degree of spatial agglomeration of relative poverty in sub-regions. The local Moran ‘s I index formula is shown as Equation 2:
When the local Moran’s I is positive, it means that the relatively poor households of high value are adjacent to the relatively poor households of high value, and the relatively poor households of low value are adjacent to the relatively poor households of low value. When the local Moran’s I is negative, it means that the relatively poor households with high values are adjacent to the relatively poor households with low values.
3.2 Kernel density estimation
Kernel Density Estimation (KDE) is a kind of point data spatial analysis of parameter estimation methods (Chu, 2007). KDE results indicate that the probability of events occurring in regions with clustered points is high, while the probability of events occurring in regions with sparse points is low (Wang et al., 2020). In the kernel density estimation graph, the depth of color is used to represent the distribution density of relative poverty values. The darker the color, the higher the concentration of relative poverty values in the region, that is, the deeper the degree of relative poverty. The specific formula is shown as Equation 3:
Where, is the kernel density equation, is the threshold value, is the number of points within the search range, and is the data dimension.
3.3 Geographically weighted regression
The distribution law of relative poverty of rural households and its influencing factors is due to the different geographical locations of observation points, that is, there is spatial non-stationarity (Zhang et al., 2020). To avoid distortion of the estimation results due to the unsatisfied homogeneity hypothesis, the Geographical Weighted Regression model (GWR) is needed to solve the heterogeneity dilemma (Wang and Cui, 2021). The GWR is an improved spatial linear regression model, which allows variable coefficients to change according to different spatial locations, and extends the traditional global regression model by changing global parameters into local parameters (Cai and Deng, 2020). Regarding the model assumptions, this study employs the ADAPTIVE method to construct the kernel function, where a denser distribution of elements corresponds to a smaller spatial environment. Conversely, a sparser distribution corresponds to a larger spatial environment. The optimal bandwidth is determined by selecting the minimum corrected Akaike Information Criterion (AICc) value, following Tang et al. (2022).
Hypothesis is the first 𝑖 space point location, as sample households in the observation position observations, 1, represents the 𝑑 - dimensional explanatory variable at the observation position as corresponding response variables. Geographical weighted regression model GWR is shown as Equation 4:
represents the regression coefficients of the explanatory variables of the -th household at . represents the independent random error, its mean is zero and its variance is .
4 Results
4.1 Spatial autocorrelation results analysis
4.1.1 Global spatial autocorrelation
It can be seen from the results shown in Table 2 that the standardized relative poverty value and the Moran ‘s I index of explanatory variables are positive at the significance level of 1%. This indicates that all variables have a positive spatial autocorrelation, that is, there is a spatial clustering trend, and the variables as a whole show a high-value clustering trend. However, due to the scattered coverage area of the collected data, the Moran ‘s I index values of each index ranged from 0.03 to 0.3, indicating that there was a certain spatial positive correlation among the indicators.
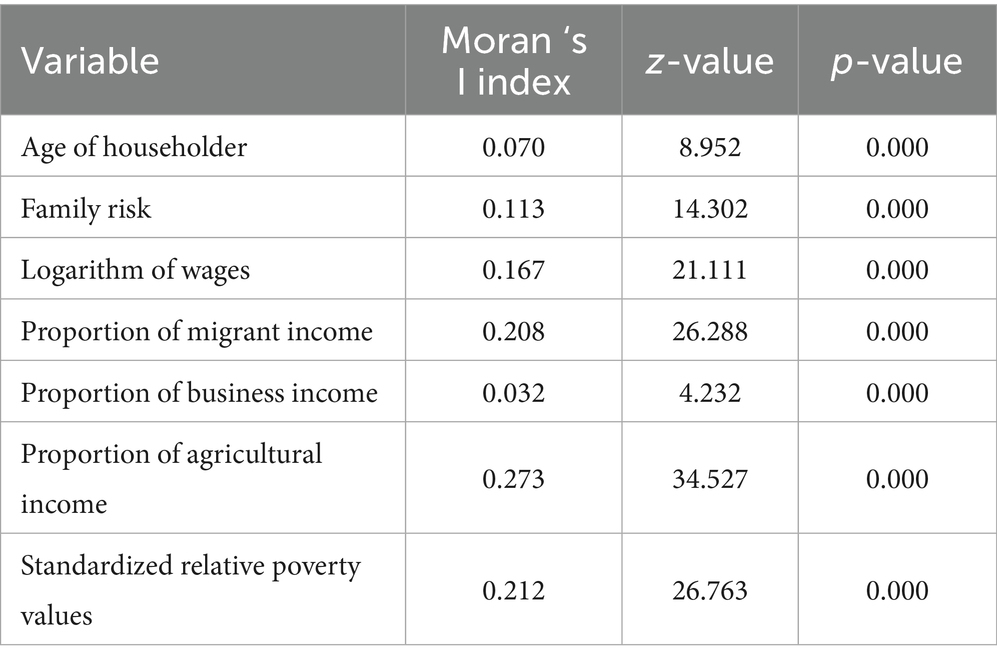
Table 2. Global Moran ‘s I index results.
4.1.2 Cluster analysis of relative poverty based on local Moran ‘s I index
Since the global Moran’s I index cannot intuitively represent the clustering of specific regions, we further analyze the local Moran’s I index and divide the relative poverty clusters into four types: “High-High” clusters, “Low-Low” clusters, “High-Low” anomalies, and “Low-High” anomalies. The range of standardized relative poverty value is (0.1), the average relative poverty value is 0.24, and the global Moran’s I index is 0.21, indicating a certain degree of agglomeration. By analyzing the local agglomeration (Figure 2), it is found that the adjusted regions mostly present “High-High” agglomeration and “Low-Low” agglomeration.
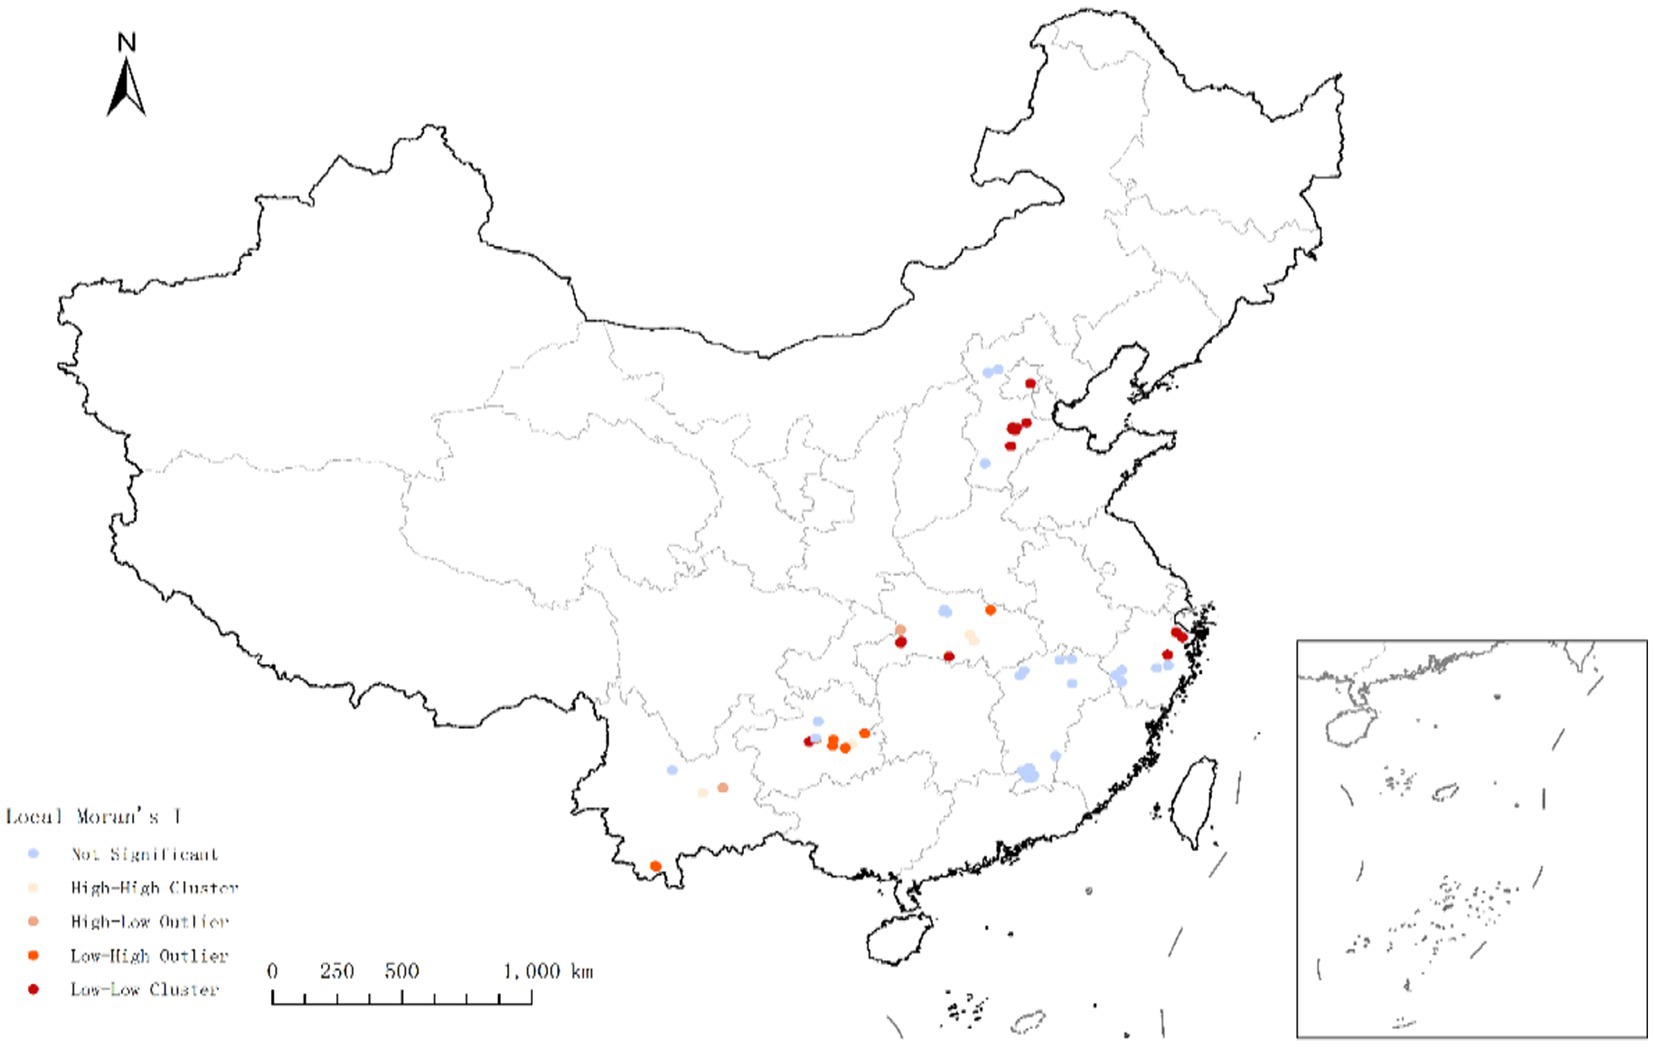
Figure 2. Standardized relative poverty clustering analysis.
The rural households of “High-High” clusters were mainly distributed in the villages in Guizhou, Yunnan, and Hubei provinces, including Taijiang County in Qiandongnan Prefecture, Fuquan City in Qiannan Buyi and Miao Autonomous Prefecture of Guizhou Province, Anning city in Kunming City of Yunnan Province, and Tianmen City in Hubei Province. In addition, 48, 65 and 64% of respondents in Kaili City, Qiandongnan Prefecture, Jinghong City, Xishuangbanna Prefecture, Yunnan Province, and Guangshui City, Suizhou City, Hubei Province, respectively, showed “High-High” clustering. The results show that the relative poverty level of rural households in these areas is generally higher, and the relative poverty level of rural households around them is also higher.
The rural households of “Low-Low” clusters mainly distributed in villages in Zhejiang, Hebei and Hubei Province, including Yuyao City of Ningbo City, Panan County of Jinhua City (76%), Haishu District of Ningbo City, Taocheng district of Hengshui City of Hebei Province, Yanjiao District of Langfang City, Suning County of Cangzhou City, Gong’an County of Jingzhou City of Hubei Province and other places. The results show that the relative poverty level of rural households in these areas is generally low, and the relative poverty level of rural households around them is also low.
The “High-Low” abnormal households are mainly distributed in Yiliang County, Kunming City, Yunnan Province (30%) and Panan County, Jinhua City, Zhejiang Province (24%). A small number of rural households in these villages have a high relative poverty level, while the relative poverty level of their surrounding rural households is low. The “Low-High” anomaly was mainly distributed in Guangshui City, Suizhou City, Hubei Province (36%), Jinghong City, Xishuangbanna, Yunnan Province (35%), and Kaili City, Qiandongnan Prefecture, Guizhou Province (52%). A few rural households in these areas had a low relative poverty level, while their surrounding rural households had a high relative poverty level.
4.2 Spatial pattern analysis of regression coefficient of GWR model
4.2.1 Regression coefficient descriptive statistics
The violin diagram (Figure 3) of the distribution of the regression coefficients of the GWR model reflects the overall impact of each explanatory variable on relative poverty. Among the variables of livelihood strategy, the proportion of migrant income has a positive impact on relative poverty in general, which indicates that the higher the proportion of migrant workers’ income, the more likely rural households are to fall into relative poverty. The proportion of business income has a negative impact, which indicates that the higher the proportion of household business income, the lower the probability of rural households falling into relative poverty, that is, the business livelihood strategy has a significant poverty suppression effect. The results show that the regression coefficient of agricultural income share is roughly 0, and the distribution range is between 0.5 and 1.25, with a large standard deviation. This suggests that the relationship between the share of farm income and relative poverty varies from place to place. Among the control variables, the age of the householder and family risk have a positive impact on relative poverty overall, while the logarithm of wages mainly has a negative impact.
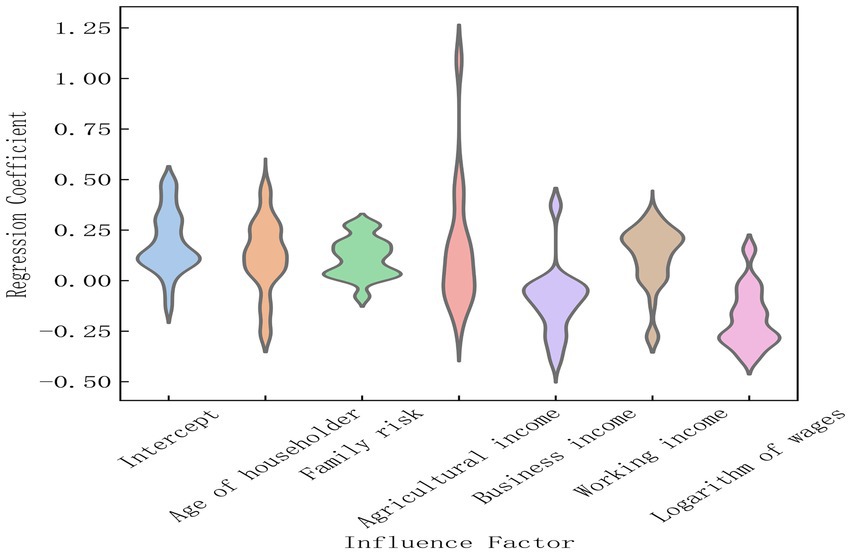
Figure 3. The GWR model regression coefficient distribution violin plot.
4.2.2 Spatial regression robustness test
To verify the robustness of the classification system, this study conducts tests using two approaches: (1) Changing the explanatory variables. According to the livelihood strategy classification by Chen and Gan (2023), a household is assigned a value of 1 if agricultural income accounts for more than 75%, and 0 otherwise. In this case, the household’s livelihood mode is considered as primarily farming-based. Similarly, the labor and business livelihood strategies are redefined. The continuous livelihood strategy variables are converted into dummy variables and used in Geographically Weighted Regression (GWR) to examine the spatial variation of the coefficients. (2) Adjusting the model bandwidth. In the GWR model, the optimal bandwidth is determined using cross-validation (CV) to further test the model’s robustness. The results are presented in Table 3.
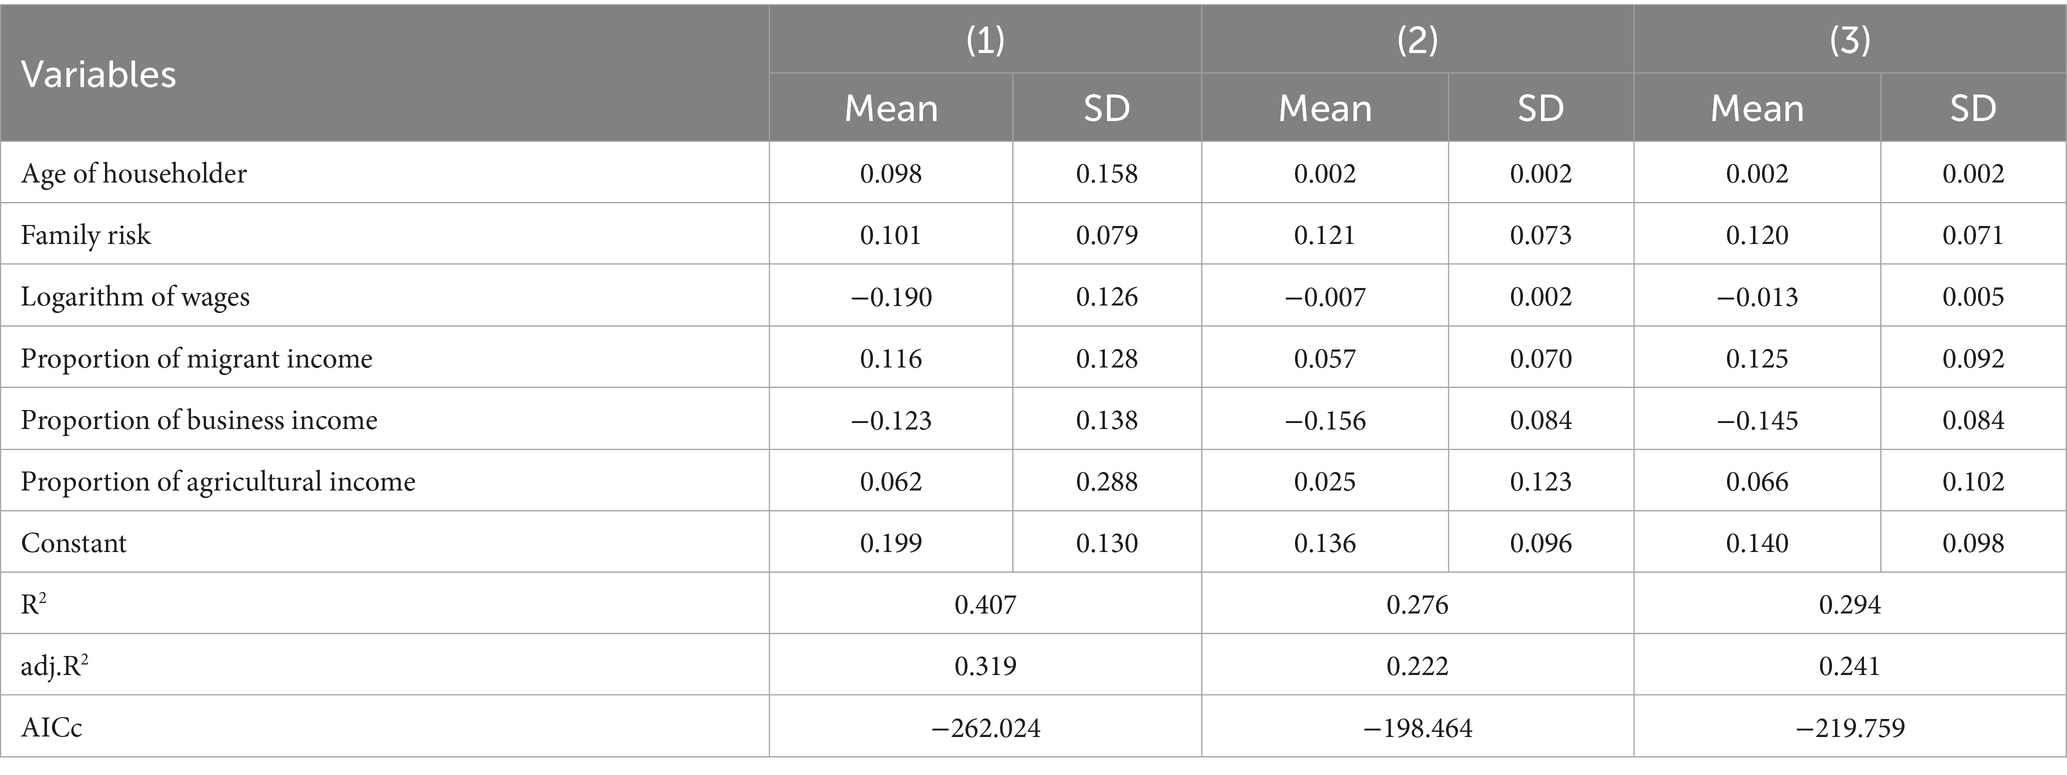
Table 3. Robustness test of GWR regression results.
Model (1) presents the baseline GWR regression results, including the mean and standard deviation of the coefficients for each variable, as well as the model’s explanatory power. Models (2) and (3) show the results of GWR tests with modified explanatory variables and bandwidths selected by cross-validation (CV), respectively. The table indicates that adopting a business-based livelihood strategy helps households escape poverty, while a farming-based strategy has a modest positive effect. In contrast, the labor-based livelihood strategy does not significantly help farmers escape relative poverty. These are consistent with the benchmark GWR results, indicating that the results are reasonably robust.
4.2.3 Spatial differentiation of the impact of livelihood strategies on relative poverty
The advantage of GWR method is that it can dig out the difference in the influence of explanatory variables on explained variables in different regions, that is, the “difference in effect level” (Wang et al., 2022). Using the regression results of the GWR model, the article compares and analyzes the difference in the impact of three livelihood strategies: “business income proportion,” “agricultural income proportion” and “migrant income proportion,” and discusses the spatial pattern characteristics of the impact of different livelihood strategies on relative poverty.
4.2.4 The spatial differentiation of the impact of business livelihood strategies on relative poverty
The results (Figure 4) show that the relationship between the proportion of business income and the degree of relative poverty varies significantly across different regions. In Guizhou, Hubei, and Hebei provinces, the business livelihood strategy can significantly alleviate their relative poverty level, while in Zhejiang, the business livelihood strategy cannot significantly alleviate their relative poverty level.
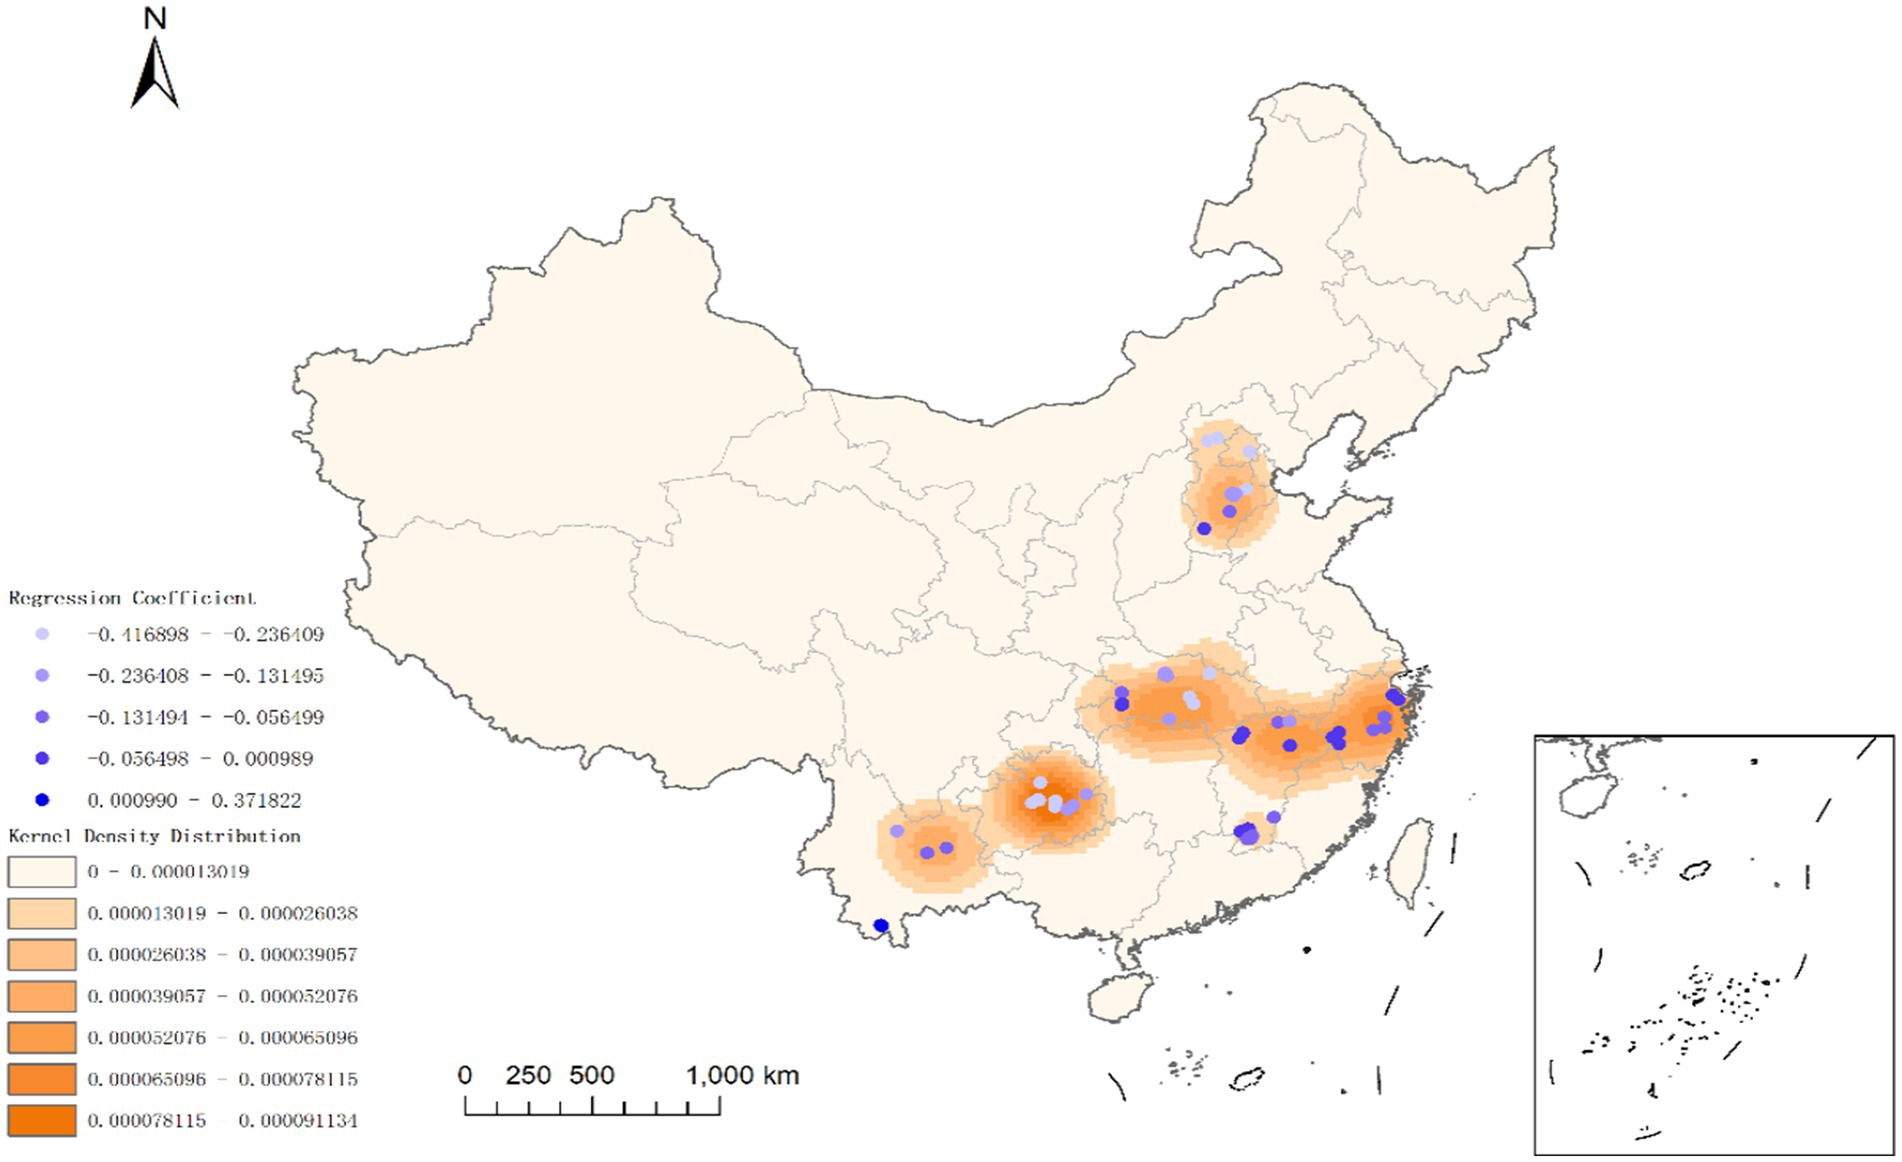
Figure 4. Kernel density distribution of the share of income from business and the spatial distribution of its regression coefficients.
The proportion of the business income of the respondents in Dubao Village, Liutun Township, Xiuwen County, Guiyang, Guizhou Province, and Pingqiao Village, Honghuagang District, Zunyi City is relatively high, and the effect of rural households ‘business activities on reducing poverty is relatively obvious. Dubao Village is the seat of the Liutun Township government, selected as the national “one village, one product” demonstration village list, also operates tea, and is a Chinese herbal medicine base. Some rural households operate agricultural materials, restaurants, and other productive and living service activities. The township area is rich in tourism resources, which also provides business opportunities for rural households. Pingqiao Village is a typical suburban village, 8 km away from the center of Zunyi. The level of industrial development in the village is high, and the Pingqiao new material base is built. The Southern Song Dynasty soothed the Yang Can Tomb Museum located in the mouth of Pingqiao Village Emperor’s grave. The advantages of suburban location, industrial agglomeration in industrial parks, and tourism resources provide rural households rural households with opportunities to get close to the market and engage in commercial activities to get rid of poverty.
Among the respondents in Yanjiao Economic Development Zone of Langfang City can significantly reduce the relative poverty level through their business activities, while the respondents in other areas cannot significantly reduce poverty through their business livelihood strategies. Among the respondents in Hubei Province, those close to Wuhan have business livelihood strategies that can effectively reduce relative poverty. The possible explanation is that these areas are located in the central economic belt, and with the transportation advantages of the Yangtze River and the industrial and commercial vitality of Wuhan city, rural households can more easily integrate into the urban economy and obtain more business opportunities.
The proportion of business income of the respondents in Zhejiang Province is also high. However, it is worth noting that the business livelihood strategy of rural households in Ningbo and Taizhou, located in coastal areas, has no significant impact on the relative poverty level. It may be explained that the overall relative poverty level (0.089) of the respondents in these two places is much lower than the average level (0.237), and the respondents basically do not suffer from deprivation of material needs, only a few rural households suffer from deprivation of individual needs such as difficulties in paying for serious diseases and inconvenient express delivery services. In contrast, the business livelihood strategies of rural households in southern Jiangxi have no significant impact on relative poverty, possibly because the economic structure of the region is relatively unitary and the market and business opportunities in rural areas are limited.
4.2.5 The spatial differentiation of the impact of working livelihood strategies on relative poverty
As can be seen from Figure 5, workers’ livelihood strategies are generally not high in the sample regions, but their impact on relative poverty varies significantly among regions. Specifically, in the rural areas near economically developed cities, the migrant worker livelihood strategy can significantly reduce the relative poverty level of rural households. In rural areas located in remote mountainous areas, the migrant livelihood strategy may increase the risk of rural households falling into relative poverty.
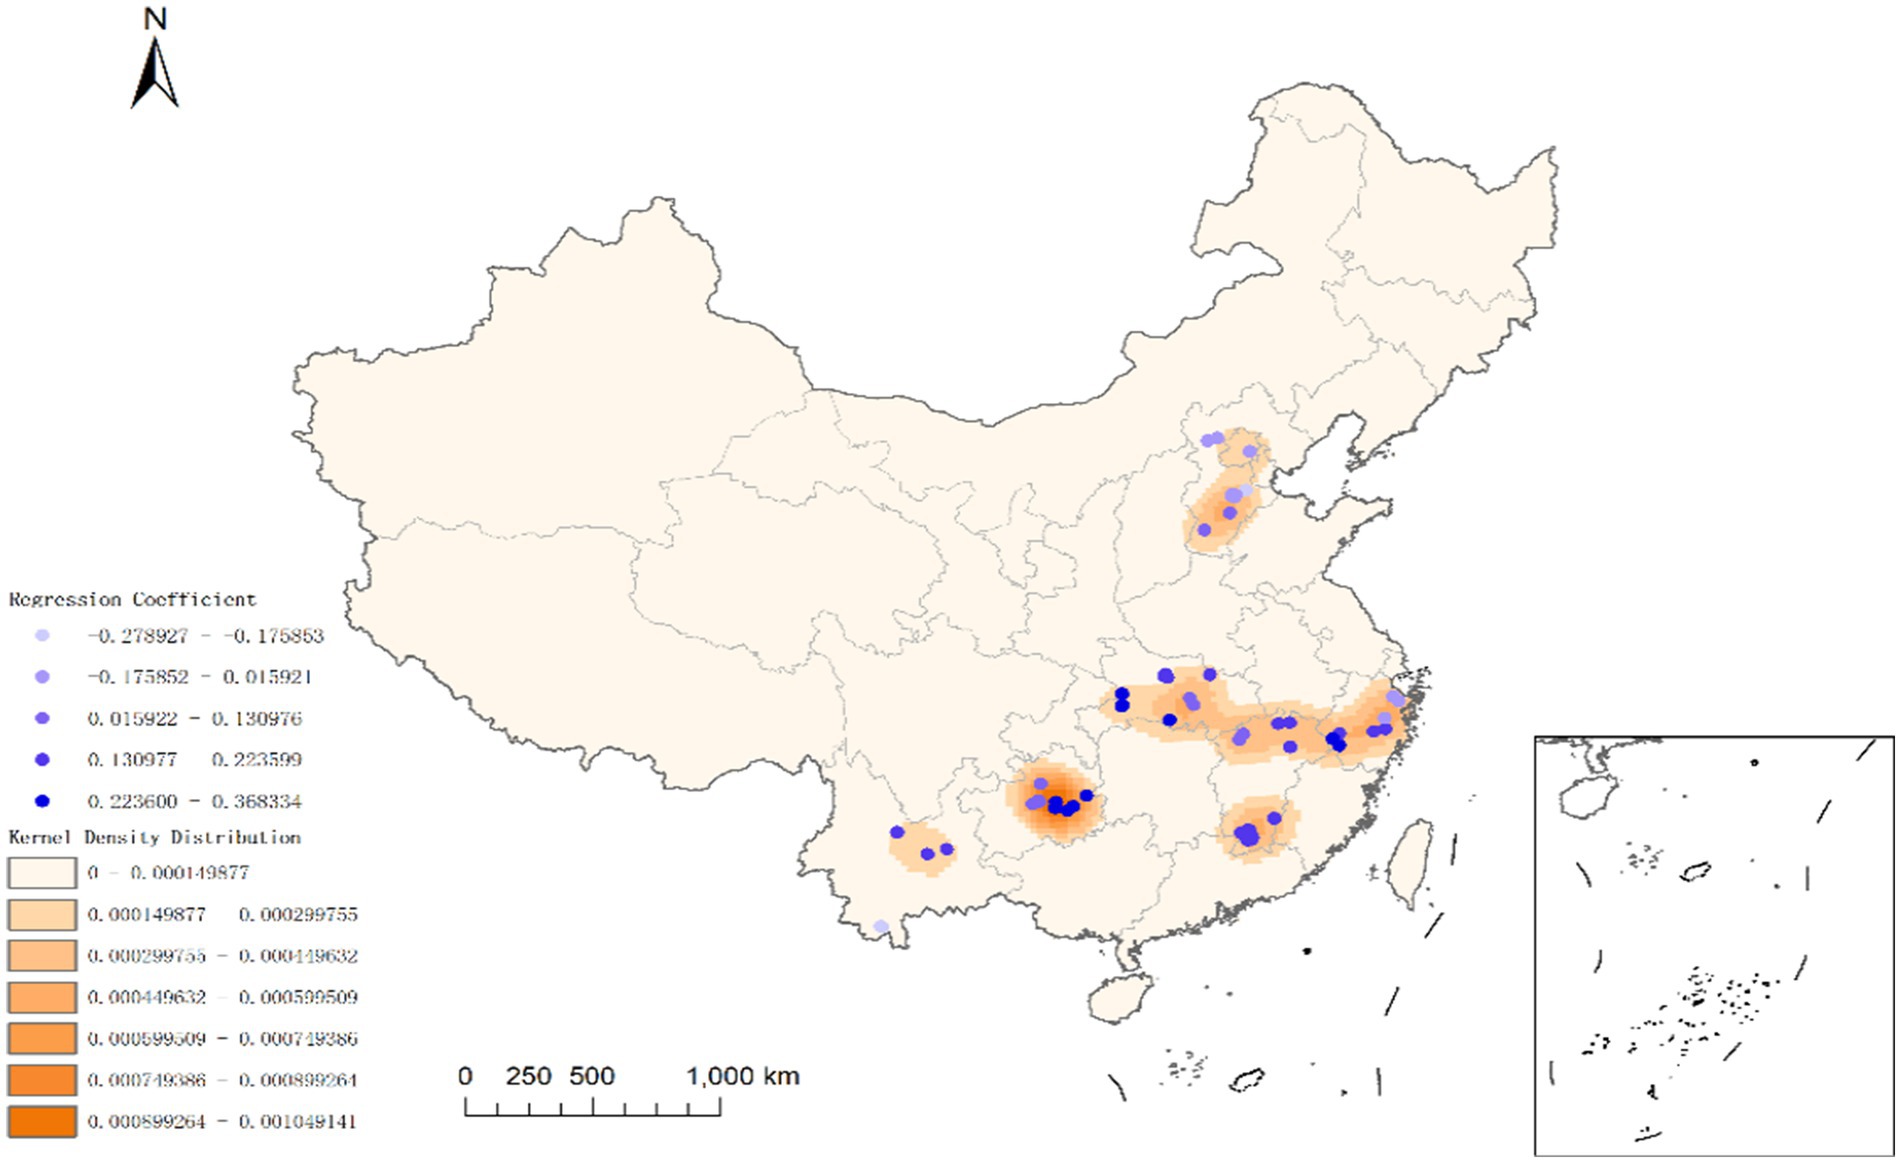
Figure 5. Kernel density distribution of the share of income from work and the spatial distribution of its regression coefficients.
Among the respondents in Guizhou, due to the scarcity of land resources and the low level of agricultural production income, many rural households choose to go out for work. The survey found that rural households often move to economically developed areas in search of better employment opportunities, and migrant income provides an important source of income for these rural households, which helps to alleviate material poverty. Among the respondents in Yunnan, Xishuangbanna Prefecture has developed characteristic agriculture, and rural households may be more inclined to engage in local agricultural production rather than go out for work. In the northern and central rural areas of Hebei Province, where the local economy is relatively slow and there are few opportunities for them to work in the city, rural households rely more on traditional agriculture and take part-time jobs.
In typical mountainous rural areas, such as Badong County in Hubei Province, most areas in Yunnan Province, Lishui in Zhejiang Province, Kaili City in Guizhou Province, and Taijiang County in Guizhou Province, migrant work has significantly increased the relative poverty level of rural households. The possible explanation is that although migrant workers can increase the economic income of the family, they continue to meet the material needs of the family. However, migrant work may mean that family members leave their hometown, and there are problems such as children’s education and elderly support. In addition, these areas face inadequate provision of education, health care and public services. In general, the relative poverty of rural households in these mountainous areas is not a matter of income poverty, but deprivation of social security and social participation needs.
4.3 The spatial differentiation of the impact of agricultural livelihood strategies on relative poverty
As can be seen from Figure 6, the impact of agricultural livelihood strategies on the relative poverty of rural households has obvious spatial differentiation characteristics, which may be closely related to the scale of local agricultural production and market opportunities. In the sample villages of Xishuangbanna in Yunnan Province, Hebei Province, and Jianghan Plain in Hubei Province, agricultural livelihood strategies reduced the risk of rural households falling into relative poverty. In rural Zhejiang and Guizhou, agricultural livelihood policies may increase the risk of rural households falling into relative poverty.
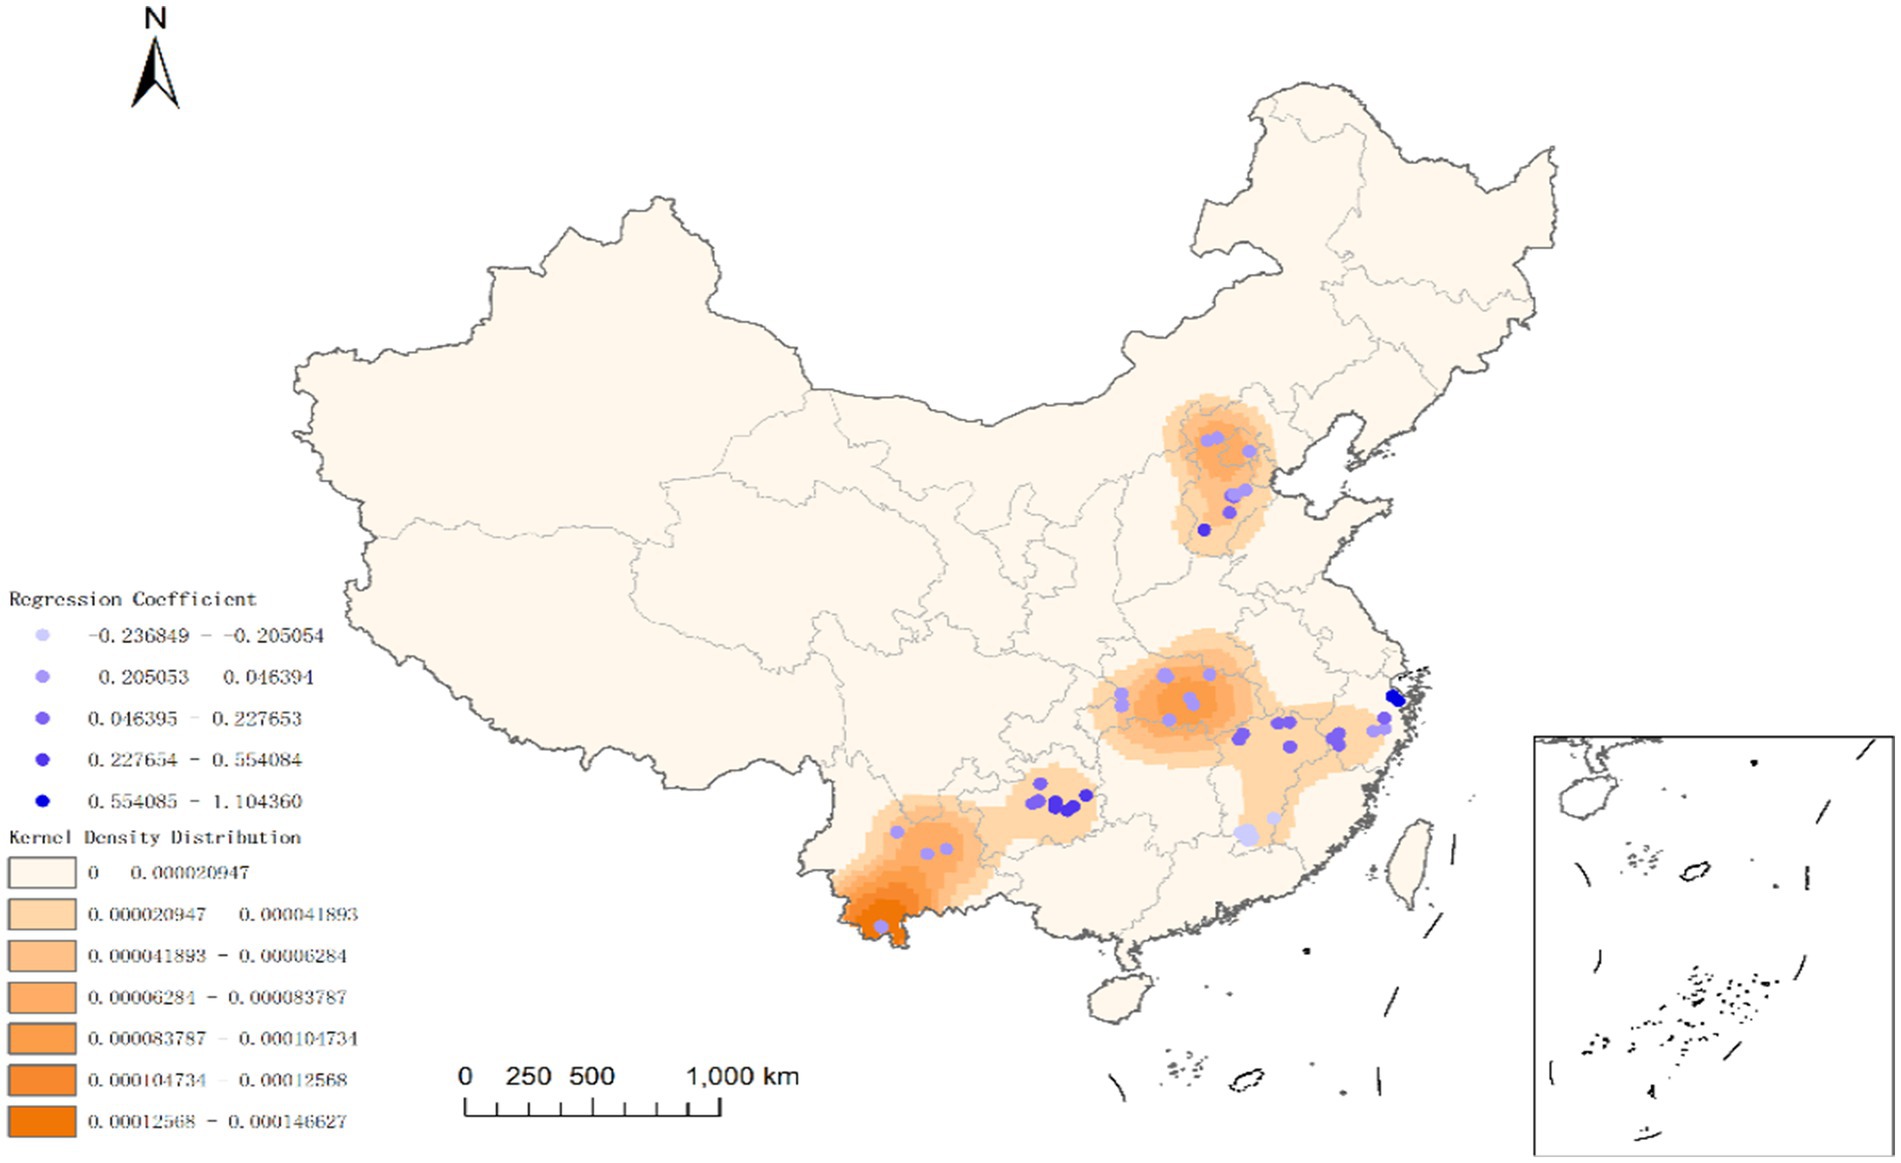
Figure 6. Kernel density distribution of agricultural income shares and the spatial distribution of their regression coefficients.
In Manjingfa and Manlonggang villages of Xishuangbanna Prefecture, Yunnan Province, rural households mainly plant cash crops such as rubber and jujube, and the planting area is also relatively large. Given the higher income of characteristic agricultural cash crops, rural households do not have to go out to work, but can take into account the education of children and the elderly. At the same time, due to the village’s proximity to urban areas, the level of basic public services is well supplied. As a result, they are more satisfied with the needs of a good life. In addition, most of the respondents in Hebei Province are located in plain area, with relatively large, cultivated land area, planting crops such as corn and cotton, or planting vegetables, watermelon, apples, and other fruits, and can obtain relatively high level of agricultural income. Therefore, agricultural production activities have a significant positive effect on alleviating the relative poverty level of these respondents. In Hubei Province, the proportion of the total agricultural income of the respondents is also relatively high, especially in Jianghan Plain, rural households engaged in agricultural production can effectively alleviate the relative poverty level. The possible explanation is that these respondents live in the middle and lower reaches of the Yangtze River, have rich water resources, operate special agricultural industries, and their income level is relatively high, allowing them to satisfy their social needs.
The proportion of agricultural income in the sample villages in Guizhou Province is relatively low, and rural households engaged in agriculture are more likely to fall into poverty. It may be explained that, on the one hand, due to the low education level of the labor force, some middle-aged and elderly labor force cannot speak Chinese, hence they will not go out to work, and can only make a living from the local agricultural activities. On the other hand, due to the mountainous terrain, relatively poor land resources, low agricultural production efficiency and transportation efficiency, rural households are faced with challenges such as high labor input, low output, and difficulties in logistics and transportation.
Agricultural production in Zhejiang may increase the risk of falling into poverty. In the survey samples, rural households with a high proportion of agricultural income are mainly concentrated in Jingning She Autonomous County in Lishui City and two mountain villages in Suichang County. They are restricted by their education level and lack of land and other livelihood capital constraints. Rural households mainly grow grain and a small amount of cash crops, such as watermelon, white tea, and kiwi fruit. The low relative income of rural households is the main cause of relative poverty. In addition, the local is far from the county, and primary and secondary school education services are relatively backward. In addition, the basic public facilities are relatively insufficient, there are not enough funds to buy commercial pension insurance to supplement the means of old-age care, and their overall satisfaction is low.
5 Discussion
Spatial characteristics of rural households’ relative poverty. Existing studies pay more attention to the spatial agglomeration of rural relative poverty in provincial, municipal, and county areas, and a small number of studies also pay attention to the spatial differences and agglomeration characteristics of poor villages (Wang et al., 2020; Ma et al., 2022). The differentiation of relative poverty at the scale of rural households is a more noteworthy perspective. This study finds that there is a significant spatial clustering phenomenon of relative poverty in rural households, and this clustering presents spatial differences, which is similar to the research findings of rural households in Hainan Province (Zhang et al., 2020). The marginal contribution of this study is to investigate the spatial characteristics of relative poverty of rural households in regions with different economic development levels, such as the western, central and eastern regions, and find that relative poverty is “High-High” concentrated in the western rural areas, which is similar to the conclusion of the research at the provincial level (Wang et al., 2023). The spatial research of relative poverty is extended to the scale of rural households, which enriches the research content and empirical evidence of spatial poverty.
Influencing factors of spatial differentiation of relative poverty of rural households. Existing studies have paid more attention to the impact of macro factors on the spatial agglomeration of relative poverty, such as the multifunctional level of county land use (Yuan et al., 2024) and macroeconomic and social factors (Li and Su, 2021; Zhang et al., 2020). At the same time, there are spatial differences in the gender of the head of household, the education level of the head of household, the proportion of the female labor force, and the dependency ratio, among others, which are the family factors leading to the spatial characteristics of relative poverty (Zhang et al., 2020). This study further focused on the impact of different livelihood strategies on relative poverty, and found the spatial differentiation of poverty reduction effects of different livelihood strategies. In rural areas closer to the market, business livelihood strategies can significantly reduce the relative poverty of rural households. The closer a rural area is to an economically developed city, the more income a worker earns to lift a family out of poverty. Livelihood strategies that engage in characteristic agriculture can help reduce relative poverty, while agricultural production by rural households in remote mountainous areas without characteristic agriculture can further increase relative poverty. These findings provide a new perspective for understanding the mechanism of poverty reduction of rural households in different regions by different livelihood strategies, and provide a scientific basis for formulating targeted poverty reduction strategies.
6 Conclusion
Using survey data from 892 rural households in six provinces, this study adopted global and local Moreland index to test and identify the overall spatial correlation between rural households’ relative poverty index and livelihood strategies. The geographically weighted regression model was used to explore the spatial differentiation of the impact of livelihood strategies on rural households’ relative poverty. The main conclusions are as follows:
On the whole, the relative poverty level and livelihood strategies of rural households have significant spatial autocorrelation, and there is an obvious spatial clustering trend. The relative poverty of rural households is not only determined by their own characteristics, but also affected by the poverty of surrounding rural households to some extent. At the same time, rural households’ livelihood strategies and poverty levels are affected by regional factors, resulting in regional heterogeneity.
From the local point of view, the relative poverty of rural households presents the characteristics of spatial differentiation. The “High-High” cluster is mainly distributed in Guizhou, Yunnan and other villages. The “Low-Low” cluster is mainly distributed in Zhejiang Province, Hebei Province, and the other villages.
Different livelihood strategies have different effects on the relative poverty of rural households. The business livelihood strategy has a significant inhibitory effect on the relative poverty of rural households, while the migrant livelihood strategy significantly aggravates the relative poverty risk, and the impact of the agricultural livelihood strategy on the relative poverty level is unstable.
There are spatial differences in the effects of different livelihood strategies. In rural areas close to markets, business livelihood strategies can play a role in alleviating relative poverty. In rural areas close to economically developed cities, the migrant livelihood strategy can significantly reduce the relative poverty risk of households. Livelihood strategies that engage in distinctive agricultural production can help reduce relative poverty, while rural households in remote mountainous areas that lack distinctive agricultural production are more likely to fall into relative poverty.
This study has the following limitations. First, due to constraints related to data collection costs and availability, the analysis is based solely on survey data from six provinces in China, limiting the generalizability of the findings to these specific regions. To enhance the applicability of future research, researchers should consider utilizing more representative nationwide survey data. Second, regarding the sampling design, the sample from the economically developed Zhejiang Province constitutes a relatively large proportion. Although we deliberately included less developed counties such as Suichang, Jingning, Pan’an, and Jiangshan within Zhejiang to improve sample representativeness, some sampling bias may still exist. To improve estimation accuracy, subsequent studies will apply post-stratification weighting methods based on the regional rural population distribution.
Data availability statement
The raw data supporting the conclusions of this article will be made available by the authors, without undue reservation.
Author contributions
ZH: Conceptualization, Data curation, Funding acquisition, Methodology, Resources, Supervision, Writing – original draft, Writing – review & editing. YuY: Software, Visualization, Writing – original draft. YiY: Formal analysis, Validation, Writing – original draft. JZ: Writing – review & editing. MZ: Conceptualization, Investigation, Writing – original draft, Writing – review & editing.
Funding
The author(s) declare that financial support was received for the research and/or publication of this article. This research was funded by the Zhejiang Province Science and Technology Plan Project General Soft Science Research Project (2024C35091), Basic Research Funds for Universities in Zhejiang Province (2023YW79), and Project of the “the Belt and Road” Regional Standardization Research Center of China Jiliang University (BRZK07B).
Conflict of interest
The authors declare that the research was conducted in the absence of any commercial or financial relationships that could be construed as a potential conflict of interest.
Generative AI statement
The authors declare that no Gen AI was used in the creation of this manuscript.
Publisher’s note
All claims expressed in this article are solely those of the authors and do not necessarily represent those of their affiliated organizations, or those of the publisher, the editors and the reviewers. Any product that may be evaluated in this article, or claim that may be made by its manufacturer, is not guaranteed or endorsed by the publisher.
References
An, S., and Fan, X. (2018). Analysis of farmers' livelihood strategy and its influencing factors based on income source--a case study of Henan province. Econ. Surv. 35, 29–34. doi: 10.15931/j.cnki.1006-1096.20171129.007
Bird, K. (2019). “Addressing spatial poverty traps” in Chronic poverty advisory network. ed. K. Bird (London: Overseas Development Institute).
Bu, H. (2018). Research on the establishment and operation of the preventive mechanism. J. Jiangsu Norm. Univ. 44, 1–9. doi: 10.16095/j.cnki.cn32-1833/c.2018.06.001
Cai, Z., and Deng, Z. (2020). An analysis of China's spatial urbanization level and its influencing factors: based on geographically weighted regression model of Chinese provinces. J. Zhengzhou Univ. 53, 48–54.
Cai, X., Liang, Y., Huang, Z., and Ge, J. (2019). Analysis of relative poverty degree of the counties of Hebei Province and its influencing factors. J. Southwest Univ. 41, 62–71. doi: 10.13718/j.cnki.xdzk.2019.10.009
Chen, L., Ding, S., and Chen, Y. (2020). Study on dynamics of rural household livelihood strategy and its influencing factors --based on CFPS micro data. Collect. Essays Finance Econ. 36, 12–21. doi: 10.13762/j.cnki.cjlc.20190218.001
Chen, C., and Gan, C. (2023). The nexus between livelihood goals and livelihood strategy selection: Evidence from rural China. Appl. Econ. 56, 5012–5034. doi: 10.1080/00036846.2023.2227420
Crandall, S., and Weber, A. (2004). Local social and economic conditions, spatial concentrations of poverty, and poverty dynamics. Am. J. Agric. Econ. 86, 1276–1281. doi: 10.1111/j.0002-9092.2004.00677.x
DFID (2000). Sustainable livelihoods guidance sheets. London: Department for International Development.
Dong, Y., Jin, G., Deng, X., and Feng, W. (2021). Multidimensional measurement of poverty and its spatiotemporal dynamics in China from the perspective of development geography. J. Geogr. Sci. 31, 130–148. doi: 10.1007/s11442-021-1836-x
Gao, J., and Tang, K. (2024). Governance of relative poverty in rural areas under the goal of common prosperity. J. Yanbian Party Sch. 40, 50–55. doi: 10.16332/j.cnki.cn22-1302/d.2024.02.012
Gotham, F. (2003). Toward an understanding of the spatiality of urban poverty: the urban poor as spatial actors. Int. J. Urban Reg. Res. 27, 723–737. doi: 10.1111/1468-2427.00478
He, S., Zeng, W., and Zhuang, T. (2019). Spatial distribution characteristics and influencing factors of multi-diversity poverty of large-scale reservoir areas in the upper reaches of the Yangtze. J. Sichuan Normal Univ. 46, 63–71. doi: 10.13734/j.cnki.1000-5315.2019.03.007
Huo, Z., and Zhang, M. (2023). Multidimensional deprivation and subgroup heterogeneity of rural households in China: empirical evidence from latent variable estimation methods. Soc. Indic. Res. 165, 975–997. doi: 10.1007/s11205-022-03018-0
Jolliffe, D., and Prydz, E. B. (2021). Societal poverty: a relative and relevant measure. World Bank Econ. Rev. 35, 180–206. doi: 10.1093/wber/lhz018
Khan, S. U., and Sloboda, B. W. (2023). Spatial analysis of multidimensional poverty in Pakistan: do income and poverty score of neighboring regions matter? GeoJournal 88, 2823–2849. doi: 10.1007/s10708-022-10781-7
Li, B., and Su, C. (2021). Spatial differences and influencing factors for relative poverty in severely impoverished areas: based on empirical research in Tibet and Tibet-related counties in four provinces. J. South-Cent. Minzu Univ. 41, 37–44. doi: 10.19898/j.cnki.42-1704/C.2021.0406
Li, X., and Xu, H. (2018). Several thoughts on the poverty issue after 2020. J. Chin. Acad. Gov. 1, 62–66. doi: 10.14063/j.cnki.1008-9314.20180130.005
Liu, W., Li, J., and Zhao, R. (2023). The effects of rural education on poverty in China: a spatial econometric perspective. J. Asia Pac. Econ. 28, 176–198. doi: 10.1080/13547860.2021.1877240
Liu, Y., Yao, Y., Liao, H., and He, T. (2023). Measurement and characterization of multidimension relative poverty in poverty-shaken off rural areas in the new era: case study in Chongqing. J. Arid Land Res. Environ. 37, 19–25. doi: 10.13448/j.cnki.jalre.2023.252
Lu, Y., Xiang, P., and Yu, L. (2022). Influencing factors and spatial effects of organic agriculture adoption: based on survey data of farmers in Xinjiang. Chin. J. Eco-Agric. 30, 153–165. doi: 10.12357/cjea.20210587
Ma, Z., Jia, Z., Chang, G., Su, X., and Chen, X. (2022). Spatial dependence, spatial variation and scale effect in the formation of rural poverty pattern. Econ. Geogr. 42, 210–221. doi: 10.15957/j.cnki.jjdl.2022.03.022
Okwi, P. O., Ndeng'e, G., Kristjanson, P., Arungaa, M., Notenbaerta, A., Omoloa, A., et al. (2007). Spatial determinants of poverty in rural Kenya. Proc. Natl. Acad. Sci. USA 104, 16769–16774. doi: 10.1073/pnas.0611107104
Pei, P., Zhang, S., and Zhou, G. (2024). Digital inclusive finance, spatial spillover effects and relative rural poverty alleviation: evidence from China. Appl. Spat. Anal. Policy 17, 1129–1160. doi: 10.1007/s12061-024-09580-z
Salvacion, A. R. (2020). Spatial pattern and determinants of village level poverty in Marinduque Island, Philippines. GeoJournal 85, 257–267. doi: 10.1007/s10708-018-9944-6
Shao, X., Huang, H., Chen, M., Xie, X., and Huang, J. (2021). Research on spatial differentiation of factors influencing ecological farming among farmers in Jiangxi Province. Resour. Environ. Yangtze Basin. 30, 2792–2800.
Sharaunga, S., and Mudhara, M. (2021). Analysis of livelihood strategies for reducing poverty among rural women's households: a case study of KwaZulu-Natal, South Africa. J. Int. Dev. 33, 127–150. doi: 10.1002/jid.3516
Soltani, A., Angelsen, A., Eid, T., Naieni, M. S. N., and Shamekhi, T. (2012). Poverty, sustainability, and household livelihood strategies in Zagros, Iran. Ecol. Econ. 79, 60–70. doi: 10.1016/j.ecolecon.2012.04.019
Sun, B., and Yin, H. (2025). Non-cognitive ability and relative poverty in farmer households: an empirical study from rural China. Front. Psychol. 16:1558546. doi: 10.3389/fpsyg.2025.1558546
Tang, Y., Xie, S., Huang, L., Liu, L., Wei, P., Zhang, Y., et al. (2022). Spatial estimation of regional PM2.5 concentrations with GWR models using PCA and RBF interpolation optimization. Remote Sens. 14:5626. doi: 10.3390/rs14215626
Tran, V. Q. (2016). Income diversity and poverty transitions: evidence from Vietnam. World Food Policy 2, 104–120. doi: 10.18278/wfp.2.2.3.1.7
Ullah, K., and Majeed, M. T. (2023). District-level multidimensional poverty and human development in the case of Pakistan: does institutional quality matter? GeoJournal 88, 561–581. doi: 10.1007/s10708-022-10600-z
Wan, G., Hu, X., and Liu, W. (2021). China's poverty reduction miracle and relative poverty: focusing on the roles of growth and inequality. China Econ. Rev. 68:101643. doi: 10.1016/j.chieco.2021.101643
Wang, H., and Cui, C. (2021). Fiscal decentralization and interprovincial labor market integration in China: analysis based on GTWR model. Econ. Probl. 5, 55–62. doi: 10.16011/j.cnki.jjwt.2021.05.009
Wang, J., Gao, Y., and Gao, Y. (2023). The spatial pattern and dynamic governance of multidimensional relative poverty in China under the goal of common prosperity in rural areas. Statist. Decis. 39, 55–60. doi: 10.13546/j.cnki.tjyjc.2023.11.009
Wang, X., Gong, J., Meng, X., Wang, H., and Li, S. (2020). Spatial differentiation of poor villages in the middle reaches of the Yangtze River. Resour. Environ. Yangtze Basin. 29, 2136–2145.
Wang, Y., Jiang, L., Wang, M., and Yu, Z. (2022). Multi-scales spatial patterns and differentiation mechanisms of relative-poverty villages in Hunan Province. Econ. Geogr. 42, 152–159. doi: 10.15957/j.cnki.jjdl.2022.01.018
Wang, Y., Jiang, Y., Yin, D., Liang, c., and Duan, f. (2021). Examining multilevel poverty-causing factors in poor villages: a hierarchical spatial regression model. Appl. Spat. Anal. Policy 14, 969–998. doi: 10.1007/s12061-021-09388-1
Wei, B., Cui, Z., Wu, Q., Guo, S., Li, W., Wang, X., et al. (2025). Investigating the spatiotemporally heterogeneous effects of macro and micro built environment on sexual violence against women: a case study of Mumbai. Humanit. Soc. Sci. Commun. 12, 1–17. doi: 10.1057/s41599-025-04838-4
World Bank (2020). Poverty and shared prosperity 2020: reversals of fortune. Washington, DC: The World Bank.
World Bank (2021) Poverty & equity brief: China Available online at: https://databank.worldbank.org/data/download/poverty/987B9C90-CB9F-4D93-AE8C-750588BF00QA/AM2020/Global_POVEQ_CHN.pdf (Accessed March 25, 2021).
Xu, L., Deng, X., Jiang, Q., and Fengkui, M. (2021). Identification and alleviation pathways of multidimensional poverty and relative poverty in counties of China. J. Geogr. Sci. 31, 1715–1736. doi: 10.1007/s11442-021-1919-8
Yuan, M., Xie, B., Tian, L., et al. (2024). Spatiotemporal coupling relationship between multi-function land use and multi-dimension relative poverty in Liupanshan, Gansu Province. Arid Land Geogr. 10, 1–14. Available at: http://kns.cnki.net/kcms/detail/65.1103.X.20241008.1134.001.html
Zhang, J., Lin, D., Zhou, X., Yu, Z., Song, W., and Chen, Y. (2020). Spatial difference of multidimensional poverty and its influencing factors in the rural areas of Hainan Province. Prog. Geogr. 39, 1013–1023. doi: 10.18306/dlkxjz.2020.06.011
Zhang, W., Zhao, L., Shi, J., and Xie, P. (2022). Vulnerability to multidimensional poverty and its spatial agglomeration within urban and rural households in the middle and upper reaches of the Yellow River. J. Arid Land Res. Environ. 36, 9–15. doi: 10.13448/j.cnki.jalre.2022.167
Keywords: rural households, relative poverty, livelihood strategy, spatial heterogeneity, GWR model
Citation: Huo Z, Yang Y, Yang Y, Zhou J and Zhang M (2025) How livelihood strategies affect spatial differentiation of relative poverty of rural households: evidence of Chinese rural areas based on the GWR model. Front. Sustain. Food Syst. 9:1540911. doi: 10.3389/fsufs.2025.1540911
Edited by:
Nicolas Federico Martin, University of Illinois at Urbana-Champaign, United StatesReviewed by:
Honggang Lu, Zhejiang Agriculture and Forestry University, ChinaNingze Yang, Zhejiang Sci-Tech University, China
Copyright © 2025 Huo, Yang, Yang, Zhou and Zhang. This is an open-access article distributed under the terms of the Creative Commons Attribution License (CC BY). The use, distribution or reproduction in other forums is permitted, provided the original author(s) and the copyright owner(s) are credited and that the original publication in this journal is cited, in accordance with accepted academic practice. No use, distribution or reproduction is permitted which does not comply with these terms.
*Correspondence: Mei Zhang, emhhbmdtQHpqd2V1LmVkdS5jbg==