 Mohamad Alnafissa
 Yosef Alamri
 Alaa Kotb
 Emad S. Aljohani
- Department of Agricultural Economics, Collage of Food and Agricultural Sciences, King Saud University, Riyadh, Saudi Arabia
This study investigates the influence of various macroeconomic variables on point-of-sale (POS) systems within the restaurant, café, and food & beverage sectors in Saudi Arabia, analyzing trends in both the total number and value of POS transactions from Q1 2016 to Q4 2023. The research utilized path regression analysis, following initial tests that revealed multicollinearity issues in a standard OLS model. The study was based on secondary data from the Saudi Central Bank and the General Authority for Statistics. The results reveal a positive correlation between several factors and POS sales: per capita income, population, the number of POS devices, credit card loan values, and the COVID-19 crisis, with increases in these factors contributing to higher POS sales. Conversely, higher inflation and the implementation of VAT were associated with a decrease in POS sales. These findings align with economic expectations. In terms of relative importance, the variables were ranked based on their impact on POS sales as follows: Population had the most significant influence, contributing 56.64%, followed by the COVID-19 crisis at 17.62%, inflation at 16.67%, credit card loans at 5.95%, per capita income at 1.69%, VAT at 1.26%, and the number of POS devices at 0.18%. The study offers important insights for policymakers and business leaders regarding strategies to support the expansion of cashless transactions and enhance sectoral resilience amid economic fluctuations.
1 Introduction
Over the past decade, Saudi Arabia’s economy has undergone significant transformation, driven mainly by the government’s Vision 2030 initiative. This strategic program is designed to diversify the economy and foster sustainable growth, focusing on developing key sectors like hospitality and food services (Saudi Vision 2030, 2023). The hospitality sector, especially restaurants and cafés, has witnessed rapid growth, supported by demographic shifts, evolving consumer preferences, and policy reforms aligned with Vision 2030 objectives (Abha Chamber, 2024). Point-of-Sale (POS) systems have emerged as critical tools supporting this sector’s expansion. Shaba et al. (2024) demonstrated that POS services significantly facilitated financial transactions for rice farmers in rural Niger State, Nigeria, enhancing their access to agricultural inputs and improving market participation. Although their study focuses on agricultural contexts, it highlights the broader potential of POS systems to enable economic resilience and sectoral growth. This growth is reflected in the goals set by the Quality-of-Life program, which envisions a substantial increase in restaurants and cafés. In 2016, Saudi Arabia had just 2,000 restaurants and 171 cafés per million people, far behind global benchmarks like Japan’s 16,000 restaurants per million people (HorizoonX, 2023). The Quality-of-Life program aims to boost these numbers to 3,000 restaurants and 1,032 cafés per million people by 2030, reflecting the importance of the hospitality sector in enhancing both the economy and the country’s social fabric (6Wresearch, 2023).
The importance of POS systems extends beyond payment facilitation to strategic business management. A case study by Hidayati et al. (2023) analyzing a coffee shop in Indonesia revealed that implementing POS systems contributed significantly to operational efficiency, real-time inventory control, financial transparency, and enhanced customer loyalty programs. Despite facing external threats such as growing competition and data security risks, the study emphasized that POS systems can be vital for maintaining competitiveness in the food and beverage industry. In recent years, the Saudi restaurant and café market has seen an influx of international chains and an expanding variety of vegetarian, healthy dining options. This aligns with the evolving preferences of a diverse customer base, while a growing interest in traditional Saudi cuisine has spurred the development of local restaurants. This shift in consumer tastes is driving the broader growth of the food services sector, which is projected to reach a market value of USD 27.18 billion by 2024, with expectations of reaching USD 42.48 billion by 2029 (Market Research, 2024). Particularly among Saudi youth, who represent a significant and dynamic demographic, there is a strong appetite for international cuisine and high-quality dining experiences. In line with this trend, the number of new restaurant registrations in Saudi Arabia surged in 2023, with 4,000 new establishments contributing to a 5% increase in total restaurants, bringing the total to 70,000 (Abha Chamber, 2024). POS systems are no longer mere technological upgrades but have become enablers of consumer engagement and transaction growth. Mahathir et al. (2025) emphasized that redesigning POS systems to prioritize user efficiency, cross-platform compatibility, and security significantly improves retail and food and beverage operational outcomes. Their findings illustrate that the digital performance of POS systems, such as user experience, data integration, and cybersecurity, plays a critical role in shaping customer interactions and transaction volumes. Globally, the rise of the food services industry reflects broader shifts in consumer behavior. In the UK, for example, the frequency of daily café visits increased from one in nine people in 2009 to one in five by 2013 (Allegra Strategies, 2013). An overview of the UK café industry demonstrates that the food services sector continues to grow irrespective of economic conditions (Ferreira, 2017). This rise in demand is likely attributed to the increasing trend of dining out during workdays at establishments such as restaurants, cafés, and cafeterias, as well as the heightened usage of hotel services during vacations and business trips (Denysenko and Budiakova, 2020). Similarly, the growing number of restaurants and cafés in Saudi Arabia mirrors these global trends, highlighting the sector’s importance as a driver of economic and social development. As dining out and café culture become increasingly integral to modern life, the restaurant and café sector in Saudi Arabia is poised to play a central role in the nation’s future economic landscape.
Since 2018, regulatory changes such as introducing and increasing the value-added tax (VAT) have influenced consumer behavior in Saudi Arabia. The VAT adjustment, from 5 to 15% in 2020, altered purchasing patterns by increasing the cost of dining out, which directly impacted the volume and value of Point-of-Sale (POS) transactions in the restaurant, café, and food & beverage sectors (Altawyan, 2022). Thus, VAT adjustments represent a critical macroeconomic factor in understanding shifts in POS data trends (Khan, 2020). Therefore, VAT adjustments represent a significant macroeconomic driver in this study’s analysis of POS transaction trends. At the same time, the COVID-19 pandemic has had a profound effect on global economies, including in Saudi Arabia. The pandemic is consistent with the influence of widespread shifts in consumer behavior, particularly in the food services sector. New health and safety requirements, such as social distancing, hand sanitization, and the adoption of cashless payments, were implemented to protect consumers and employees. Consumer habits also changed, with many opting for food delivery services or preparing meals at home. Studies from various countries, including Poland and Kuwait, show a rise in food delivery usage and home meal consumption, alongside a decline in dining out. These changes had significant consequences for restaurants and cafés, with many establishments experiencing steep declines in dining (Dunn et al., 2021; Czarniecka-Skubina et al., 2021; AlTarrah et al., 2021). For example, reports from the US, Sweden, and Denmark during the pandemic indicated widespread consumer spending and economic activity reductions, with the food services sector particularly hard-hit (Andersen et al., 2020; Lewis et al., 2020).
The pandemic also accelerated the shift toward digital payments. Integrating digital payment innovations has substantially reshaped consumer behavior in the food and beverage sectors. Susilo et al. (2024) found that digital payment methods and point-based marketing strategies significantly enhanced consumer shopping experiences, customer engagement, and loyalty in the culinary industry. Their findings underline consumers increasingly prefer cashless transactions due to convenience, speed, and added value through loyalty programs. As cash usage declined, credit and debit cards and digital wallets on smartphones and watches became more prevalent. This shift was further facilitated by the rise in online ordering, which has become a key driver of trade across many sectors. In Saudi Arabia, Point-of-Sale (POS) statistics from the Central Bank have become essential for tracking economic trends (Saudi Central Bank, 2024). These data provide valuable insights into the performance of various sectors, including food and beverages, and help policymakers make informed decisions on licensing and regulation. Recent POS data reveal fluctuating trends in the volume and value of transactions in the food and beverage sector. For instance, the relative importance of POS transactions in this sector rose from 38.5% in early 2016 to a peak of 55.14% in 2021 before stabilizing at around 52.64% in 2023. Similarly, the share of POS sales value for the food services sector followed a similar pattern, peaking in mid-2020 before experiencing a decline and then rising again toward the end of 2023. These fluctuations underscore the need for a deeper analysis of the factors influencing POS data, such as consumer behavior, economic policies, and broader market conditions, to better understand the economy’s dynamics and inform future decision-making.
While the existing literature has increasingly addressed the role of Point-of-Sale (POS) systems in economic activity, most studies have primarily focused on technology adoption, transaction facilitation, or broad retail trends. There remains a significant research gap regarding the direct impact of macroeconomic variables—such as inflation, per capita income, population dynamics, the expansion of credit facilities, VAT adjustments, and crisis events like COVID-19—on the total sales volume captured through POS transactions within the restaurant, café, and food and beverage sectors in Saudi Arabia. This study addresses this gap by offering an empirical investigation of sector-specific POS performance in the context of Saudi Arabia’s economic diversification initiatives under Vision 2030.
The novelty of this study lies in its integrated analysis of actual POS sales data across regions of Saudi Arabia, combined with key macroeconomic drivers over the period Q1 2016 to Q4 2023. Unlike previous studies that generalize across industries or regions, this research targets explicitly the dynamic and rapidly evolving food services sector, providing granular insights into the economic behaviors that influence POS performance. Theoretically, the study contributes to the literature by demonstrating the relative importance of different macroeconomic factors in shaping consumer transaction activity in emerging economies. Based on identified economic trends and external shocks, the findings offer actionable insights for policymakers, investors, and business owners on optimizing strategic decisions, such as resource allocation, pricing strategies, and technology deployment.
2 Materials and methods
This study employed Path Analysis as the primary methodological approach to achieve the research objectives. Path Analysis was selected after detecting multicollinearity issues using the variance inflation factors (VIFs) when initially testing a multiple linear regression model using the ordinary least squares (OLS) method. Rather than relying on OLS, Path Analysis captured the complex direct and indirect relationships between macroeconomic variables and Point-of-Sale (POS) sales values, while addressing the multicollinearity problem (Mokhtarian and Ory, 2009). The model was specified as follows (Table 1):
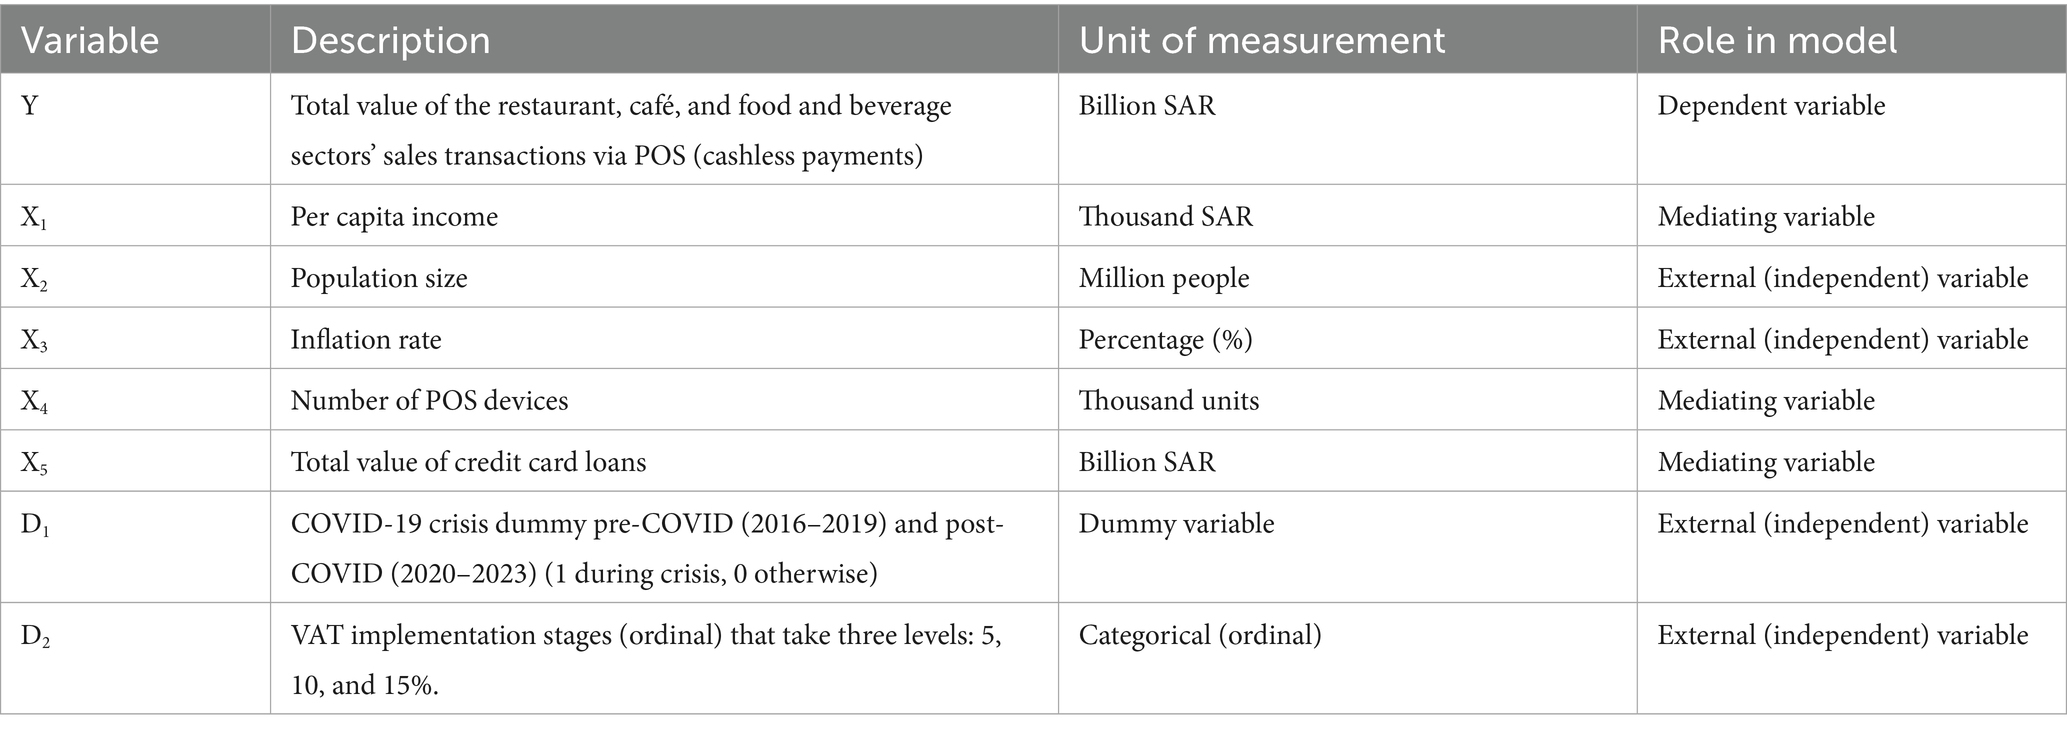
Table 1. Study variables.
Path analysis extends multiple regression analysis to address multicollinearity among variables. It assumes: (1) linear, unidirectional causal relationships; (2) no interactions between variables (additive relationships); (3) uncorrelated residuals; (4) no correlation between residuals and other variables; (5) error-free measurement of variables; and (6) variables can be measured at interval, nominal, or ordinal levels (Bassiouni and Bassiouni, 2021). These assumptions ensure the validity of the model in analyzing variable relationships.
To conduct path analysis, variables were categorized as follows according to economic theory assumptions:
External (independent) variables: Population (X2), inflation rate (X3), a dummy variable for the COVID-19 crisis (D1), and an ordinal variable for VAT (D2).
Mediating variables:
• Per capita income (X1) acts as a mediator for external variables such as population (X2), inflation rate (X3), and the COVID-19 dummy variable (D1).
• Credit card loan value (X5) serves as a mediator for external variables such as per capita income (X1), inflation rate (X3), and population (X2).
• The number of POS devices (X4) is a mediator for external variables such as population (X2) and VAT (D2).
These mediating variables (X1, X5, X4) also act as external variables for the dependent variable, total POS sales value (Y).
Since understanding the relationships between independent variables and their impact on the dependent variable is essential, path analysis considers both direct and indirect effects through other variables (mediating variables) on the dependent variable.
The interpretation of the model’s variables is grounded in established economic theories. In the domain of consumer economics, variables like population size and per capita income align with Engel’s Law and the Life-Cycle Hypothesis, both of which suggest that rising income and demographic expansion increase discretionary consumption, including dining out (Deaton, 2005). From a fiscal policy perspective, inflation and VAT reduce real purchasing power and can suppress consumption, consistent with Keynesian theory on how taxation and price levels influence aggregate demand (Stiglitz and Rosengard, 2015). Behavioral finance contributes to understanding the role of the COVID-19 crisis, where uncertainty and perceived risk shifted consumer behavior toward digital and contactless payments (Thaler and Sunstein, 2008). Lastly, credit card loans and POS device expansion reflect liquidity access theory and technology adoption models, emphasizing how access to credit and digital infrastructure facilitates spending (Venkatesh et al., 2012).
To apply path analysis, several assumptions were tested based on a previous study (Bassiouni and Bassiouni, 2021). These assumptions include Linearity of Relationships, Normality of Residuals, Independence of Residuals, and Homoscedasticity of the Random Error Term.
Each variable included in the model is grounded in economic theory and expected to influence Point-of-Sale (POS) transactions. Per capita income (X1) is anticipated to have a positive effect, as higher disposable income generally promotes greater consumer spending, particularly in discretionary sectors such as food services. Population size (X2) is expected to correlate positively with transaction volumes, reflecting broader market size and demand potential. Inflation rate (X3) is theorized to have a negative impact on POS sales, as rising prices may erode consumers’ purchasing power. The number of POS devices (X4) is a proxy for payment infrastructure availability; greater device density is presumed to facilitate more transactions. Credit card loan values (X5) indicate consumer access to credit, which can stimulate spending behavior, especially in sectors relying on discretionary expenditure. The COVID-19 crisis dummy (D1) captures the disruptive effects of the pandemic, with an initially expected negative impact due to lockdowns. However, later stages might show a shift toward digital and delivery transactions. The VAT implementation variable (D2) reflects tax policy shocks, which are generally associated with reduced spending immediately following tax rate increases. These assumptions guide the expectations for the directionality and strength of the relationships tested in the Path Analysis model.
To achieve its research objectives, this study utilizes quarterly time series data from Q1 2016 to Q4 2023, sourced from the Saudi Central Bank and the General Authority for Statistics (2024). The data encompasses key variables such as sales values for the restaurant and café sector and the food and beverage sector (Y), focusing on debit card transactions provided by the Saudi Central Bank. This data has become increasingly accessible in recent years and has been widely adopted in economic research, given its ability to capture purchasing behaviors across various commodity groups and economic sectors. The shift from cash to cashless transactions, accelerated by the COVID-19 pandemic, has made debit card data even more significant for analyzing consumer spending patterns (Pallathadka and Pallathadka, 2022; Wisniewski et al., 2024). The widespread use of debit card transactions as a proxy for consumer behavior is evident in studies such as Dunn et al., which examined the impact of the pandemic on consumer spending (Dunn et al., 2021; Seiler, 2020) explored issues like weighting bias and inflation during the COVID-19 period. Given the increased reliance on digital payment methods during the pandemic, this data provides valuable insights into shifting consumer habits, offering a reliable means for understanding economic phenomena in the post-pandemic era.
3 Results
Analyzing Point-of-Sale (POS) transactions and sales values in Saudi Arabia from Q1 2016 to Q4 2023 highlights significant growth trends across sectors (Table 2). On average, total transactions across all sectors amounted to 879.51 million, with a sales value of SAR 90.84 billion. The number of transactions ranged from 115.65 million in Q1 2016 to 2.44 billion in Q4 2023, while sales values fluctuated between SAR 43.1 billion and SAR 157.7 billion. The coefficient of variation for transaction volume (88.71%) indicates substantial fluctuations, while sales value showed a more stable trend (44.18%). The general trend analysis suggests a statistically significant annual growth rate of 11% for transactions and 4.7% for sales value, highlighting steady expansion in the market.
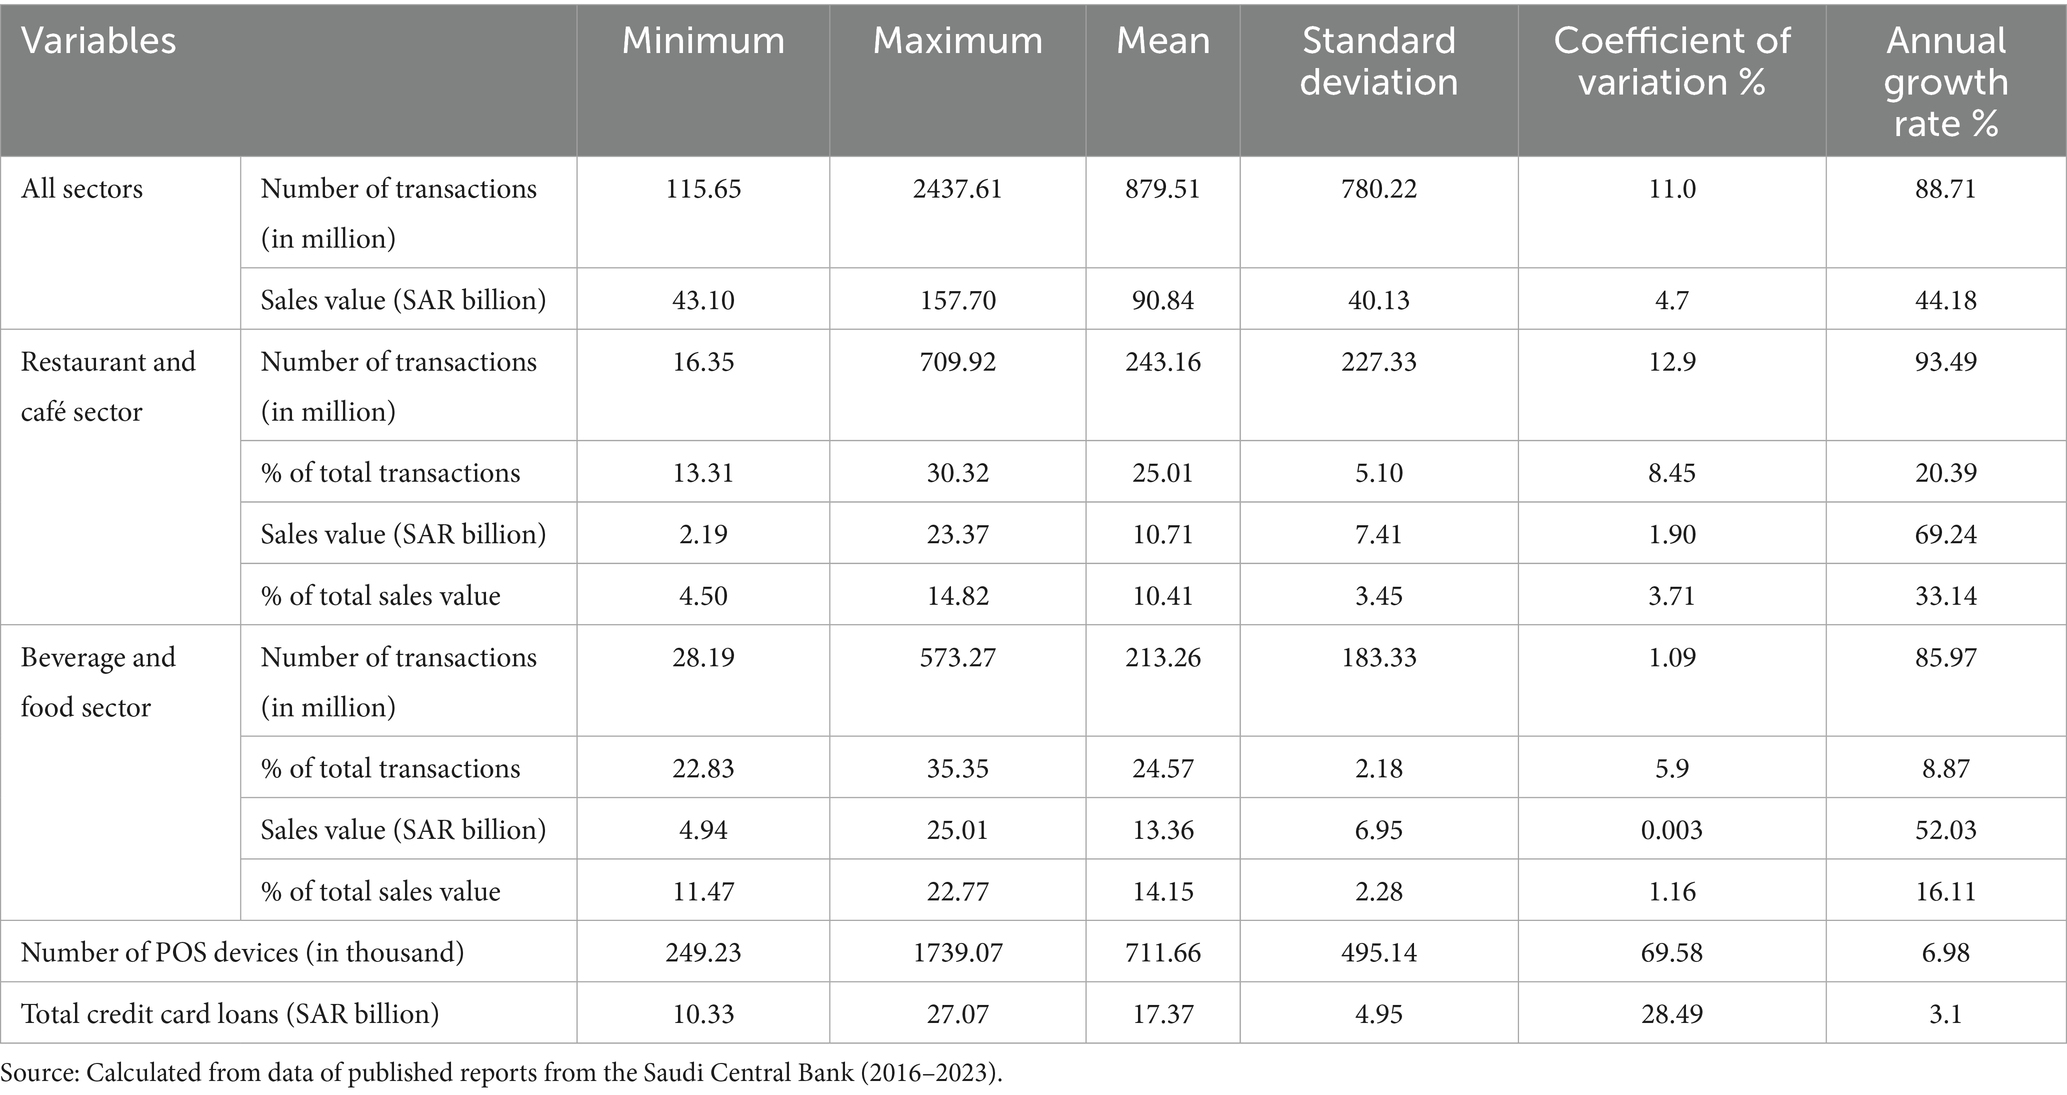
Table 2. Descriptive analysis of transactions, sales value, and some related variables by sector (Q1 2016 - Q4 2023).
For the restaurant and café sector, the average number of transactions was 243.16 million, comprising 25.01% of the total, with an average sales value of SAR 10.71 billion, or 10.41% of total sales. The standard deviation for these values indicates considerable variation, particularly in the latter years of the study. This sector exhibited a strong annual growth rate of 12.9% in transactions and 8.45% in sales value, confirming its dynamic expansion.
The beverages and food sector displayed a slightly smaller average number of transactions (213.26 million), accounting for 24.57% of total POS transactions, and an average sales value of SAR 13.36 billion (14.15% of total sales). Despite higher dispersion rates, coefficients of variation exceeding 50%, the sector maintained a steady growth in sales value 5.9% annually. This reflects growth in consumer spending, although its relative importance in total transactions remained broadly stable.
The expansion in the number of POS devices was notable, with an annual growth rate of 6.98%, reflecting the broader adoption of digital payment infrastructure, particularly after the COVID-19 pandemic. Total credit card loans grew steadily at 3.1% annually, suggesting stable credit expansion supporting consumer spending. The results emphasize the increasing importance of POS systems and credit access in shaping consumer behavior and supporting the growth of Saudi Arabia’s food services economy.
3.1 Econometric estimation of key economic variables’ impact on total POS sales in the restaurant and café sector and beverage and food sector
The model estimation in Table 3 shows that the Variance Inflation Factor (VIF) (Kelly, 2024) values indicate the presence of multicollinearity among the independent variables, the value of (vif) coefficient reached 23.96, 20.32, 12.48 for variables X1, X5, D2, respectively, and all of those values are greater than 10, which complicates the use of regression analysis. Therefore, an alternative statistical method accommodating multicollinearity among independent variables was required. Path analysis was the most suitable approach (Mokhtarian and Ory, 2009). Path analysis was employed to estimate macroeconomic variables’ direct and indirect effects on POS sales values. The model’s assumptions regarding linearity, normality, independence, and homoscedasticity confirmed its robustness.
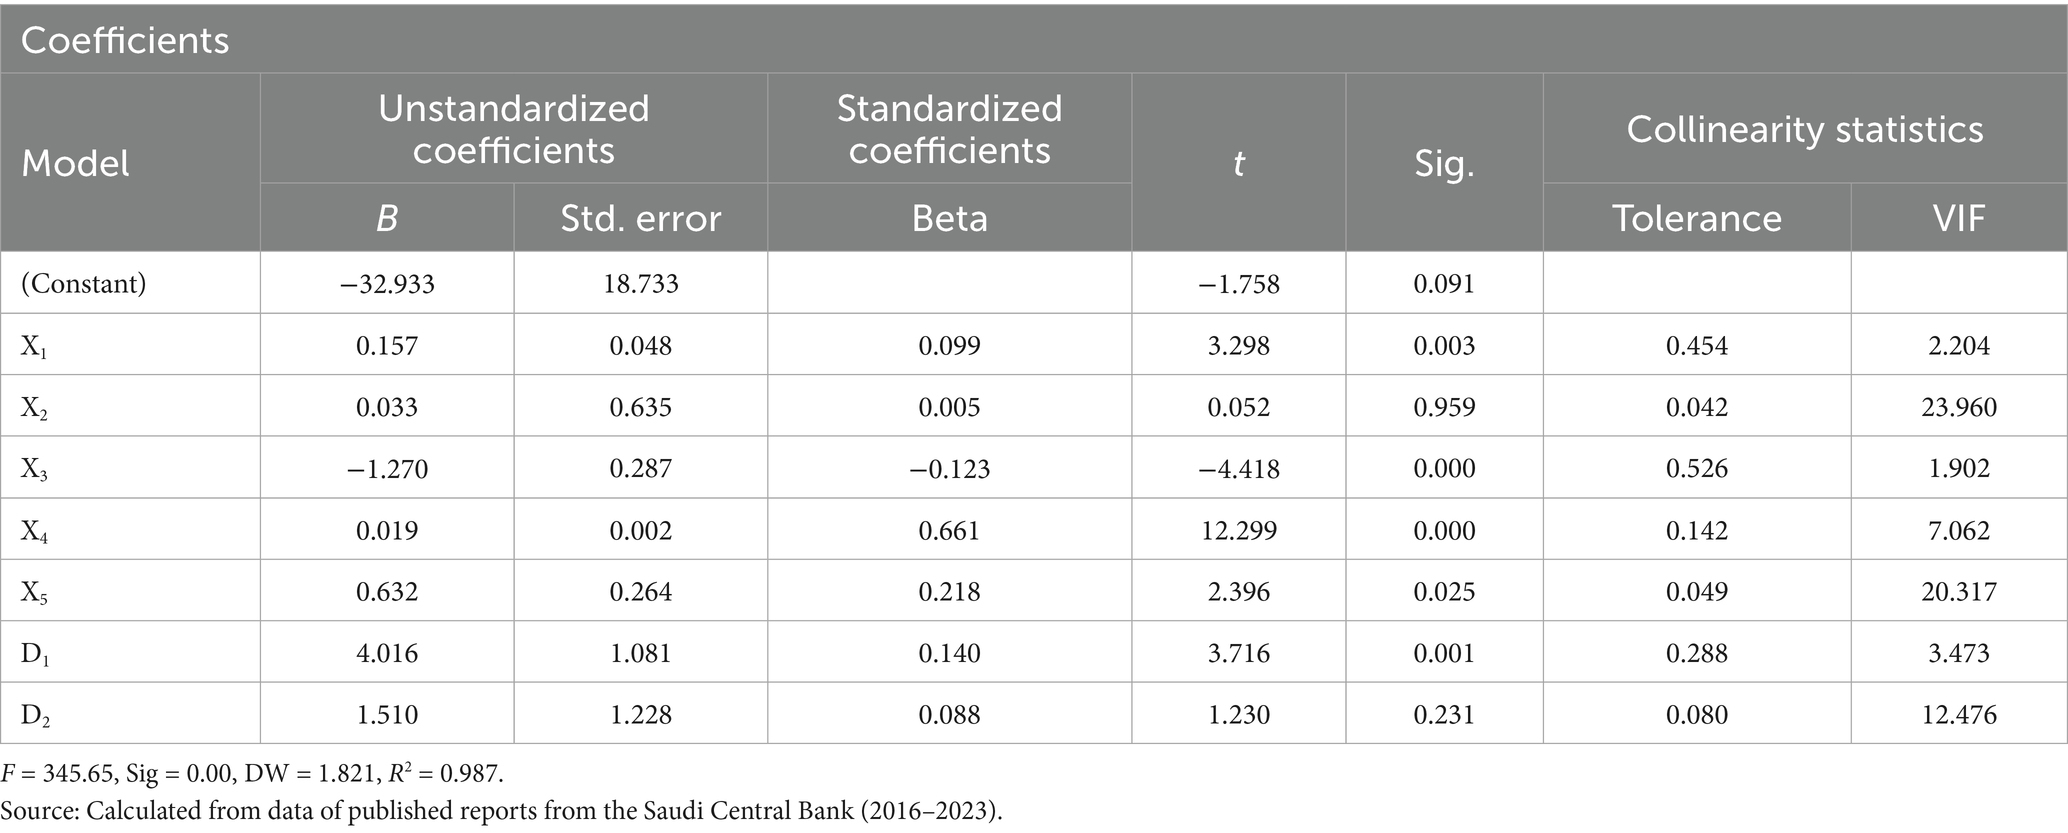
Table 3. Impact of key economic factors on POS sales value in food sectors in Saudi Arabia.
The path analysis model was validated by testing several key assumptions. First, the linearity of relationships between variables was confirmed with a significant F-statistic of 345.65 (p-value = 0.00), rejecting the null hypothesis of no linear relationship. Second, the normality of residuals was verified through Kolmogorov–Smirnov and Shapiro–Wilk tests, yielding p-values below 0.05, confirming normal distribution. Third, the Durbin-Watson statistic 1.821 indicated no autocorrelation in the residuals, falling between the critical values of 0.794 and 1.788. Lastly, homoscedasticity of the error term was confirmed, with the F-statistic and Chi-square test showing no significance, supporting the assumption of constant error variance. These results affirm the reliability of the model’s assumptions and its suitability for analysis.
3.2 Path analysis results
After verifying the assumptions of the regression model, which align with the assumptions of path analysis, except that path analysis allows for multicollinearity among external variables, Figure 1 displays the calculated path coefficients based on regression analysis. The overall model fit indicators for the estimated structural model, with values of Chi-square = 0.132, CMIN/DF = 0.134, Goodness-of-Fit Index (GFI) = 1.00, and Root Mean Square Error of Approximation (RMSER) = 0.00, all point to a high level of model accuracy. These indicators confirm that the proposed structural model accurately explains the relationships and can be reliably used for interpretation. Additional validation procedures were conducted to enhance model credibility. Residual diagnostics, including standardized and studentized residuals, Cook’s Distance, and leverage values, indicated the absence of influential outliers. Furthermore, the Durbin–Watson statistic (DW = 1.821) confirmed the absence of serial correlation in residuals. To further assess robustness, a sensitivity analysis was performed by re-estimating the model after excluding outliers and splitting the sample into two periods: pre-COVID (2016–2019) and post-COVID (2020–2023). The structural relationships remained consistent in direction and significance across both samples. These results reinforce the stability of the path model and its validity in interpreting the structural relationships.
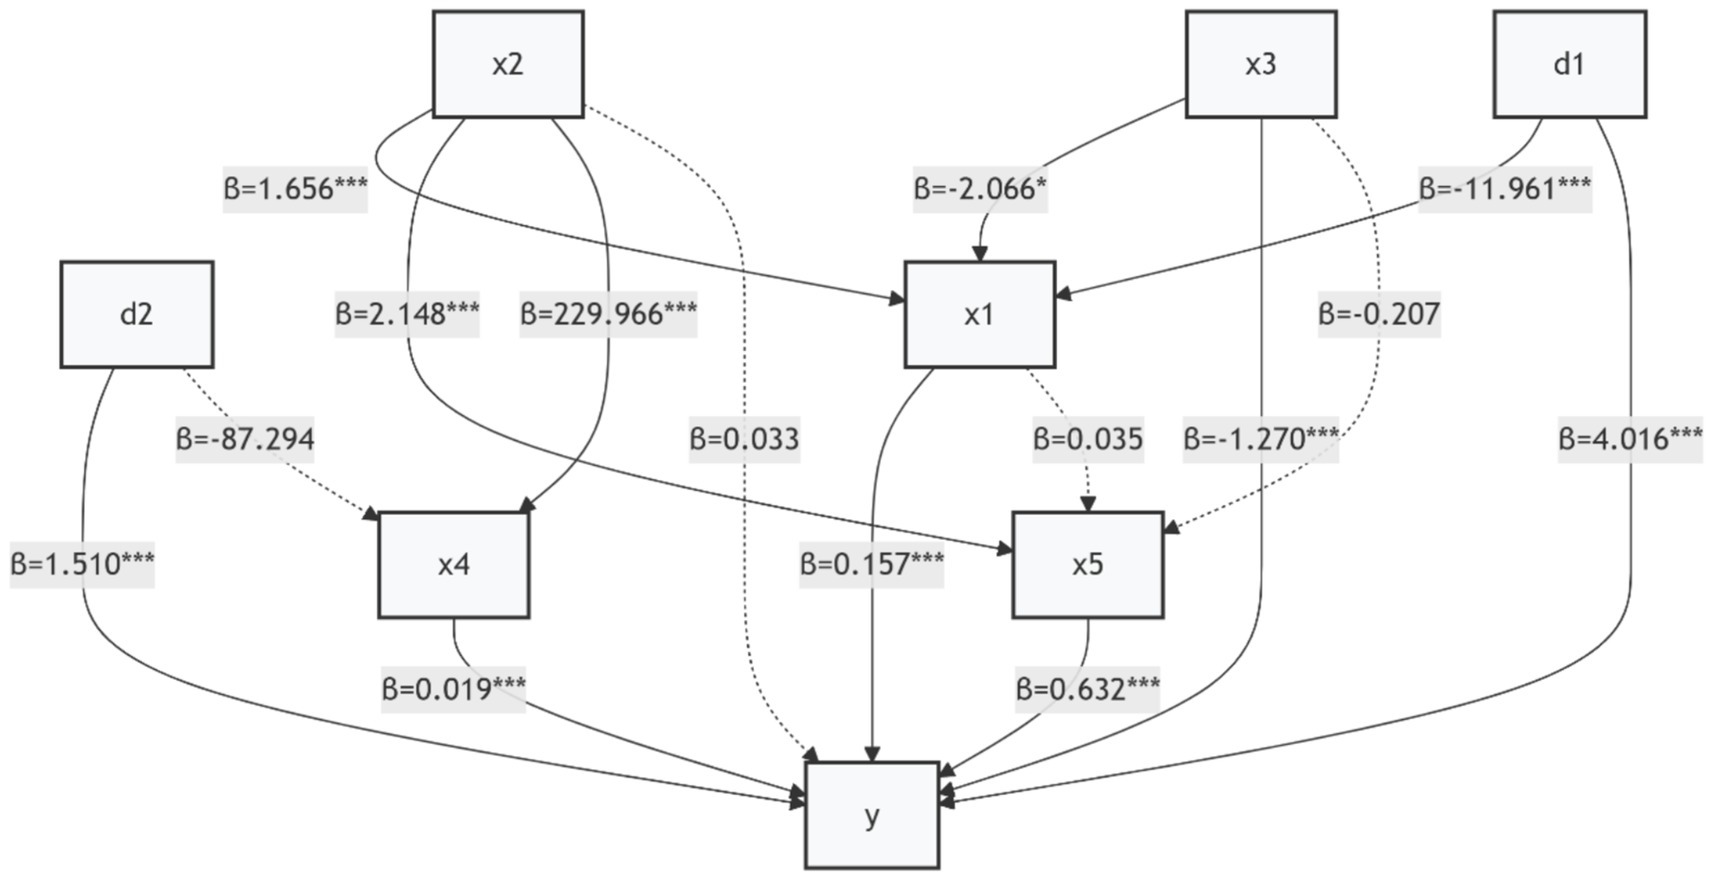
Figure 1. Path diagram illustrating path analysis coefficients.
We conducted robustness and sensitivity analyses to address concerns regarding potential overstatement of causality. The model was re-estimated after removing high-leverage observations and splitting the period into pre-COVID (2016–2019) and post-COVID (2020–2023) subperiods. The structural relationships remained consistent across these subsamples, indicating stability. However, the interpretation of effects, particularly those related to the COVID-19 crisis and VAT, is cautiously approached, and causal terms were deliberately avoided in favor of structural or associative language.
The study derived four structural equations based on the results in Tables 3, 4, revealing significant relationships between key variables. Per capita income (X1) was found to be an intermediary variable influenced by population (X2), inflation rate (X3), and the COVID-19 crisis (D1), explaining about 57% of its variation. The number of POS devices (X4) was influenced by population (X2) and value-added tax (D2), with population having a significant direct effect and VAT showing no significant impact, explaining 83% of its variation. The value of credit card loans (X5) acted as an intermediary for per capita income (X1), inflation rate (X3), and population (X2), explaining 93% of its variation, with significant relationships between X5 and population, and an inverse relationship with inflation. For the POS sales value (Y), significant direct relationships were observed with per capita income (X1), number of POS devices (X4), credit card loans (X5), COVID-19 crisis (D1), and VAT (D2), while an inverse relationship with inflation rate (X3) was also significant. The model explains 99% of the variation in sales value (Y).
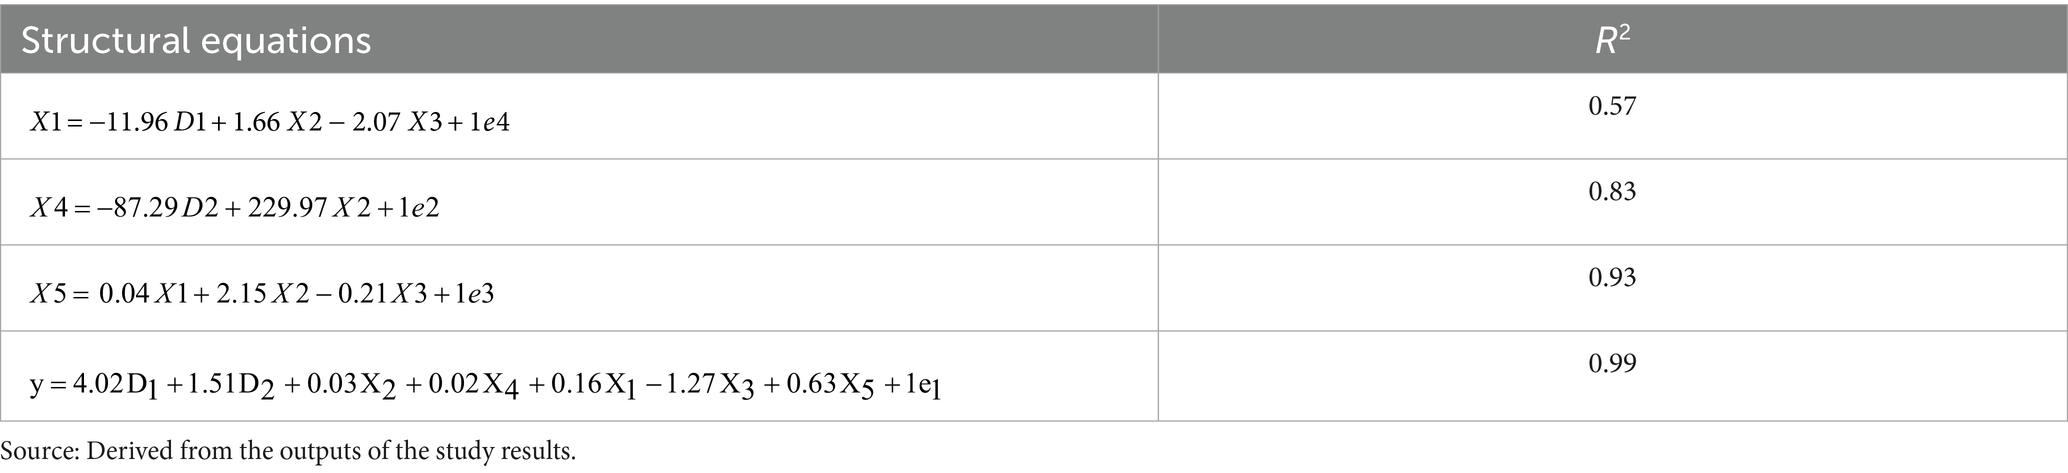
Table 4. Results of structural equations comprising the path analysis model.
Partial effects on POS sales were found for per capita income, population, and inflation, as they impacted intermediary variables like X5. Total effects were identified for the number of POS devices and the value of credit card loans, both directly influencing sales value (Y). Additionally, the COVID-19 crisis (D1) partially affected per capita income. In contrast, VAT (D2) had a total effect on sales value through its direct relationship with Y, despite its lack of impact on POS devices. These results highlight the complex interplay of economic factors influencing the restaurant and café sector in Saudi Arabia.
3.3 Estimation of the indirect effect
The path analysis results indicate several indirect effects of economic variables on the value of credit card loans and point-of-sale (POS) (Table 5). First, a positive relationship is observed between population (X2) and the value of credit card loans (X5), where a one-unit increase in population leads to a 0.058 increase in credit card loans, driven by rising per capita income as the workforce expands. Conversely, an increase in the inflation rate (X3) and the occurrence of the COVID-19 crisis (D1) negatively affect credit card loans, with the former leading to a decrease of 0.0727 and the latter a larger decrease of 0.421. These effects are consistent with the negative impact of inflation and the pandemic on individual income.
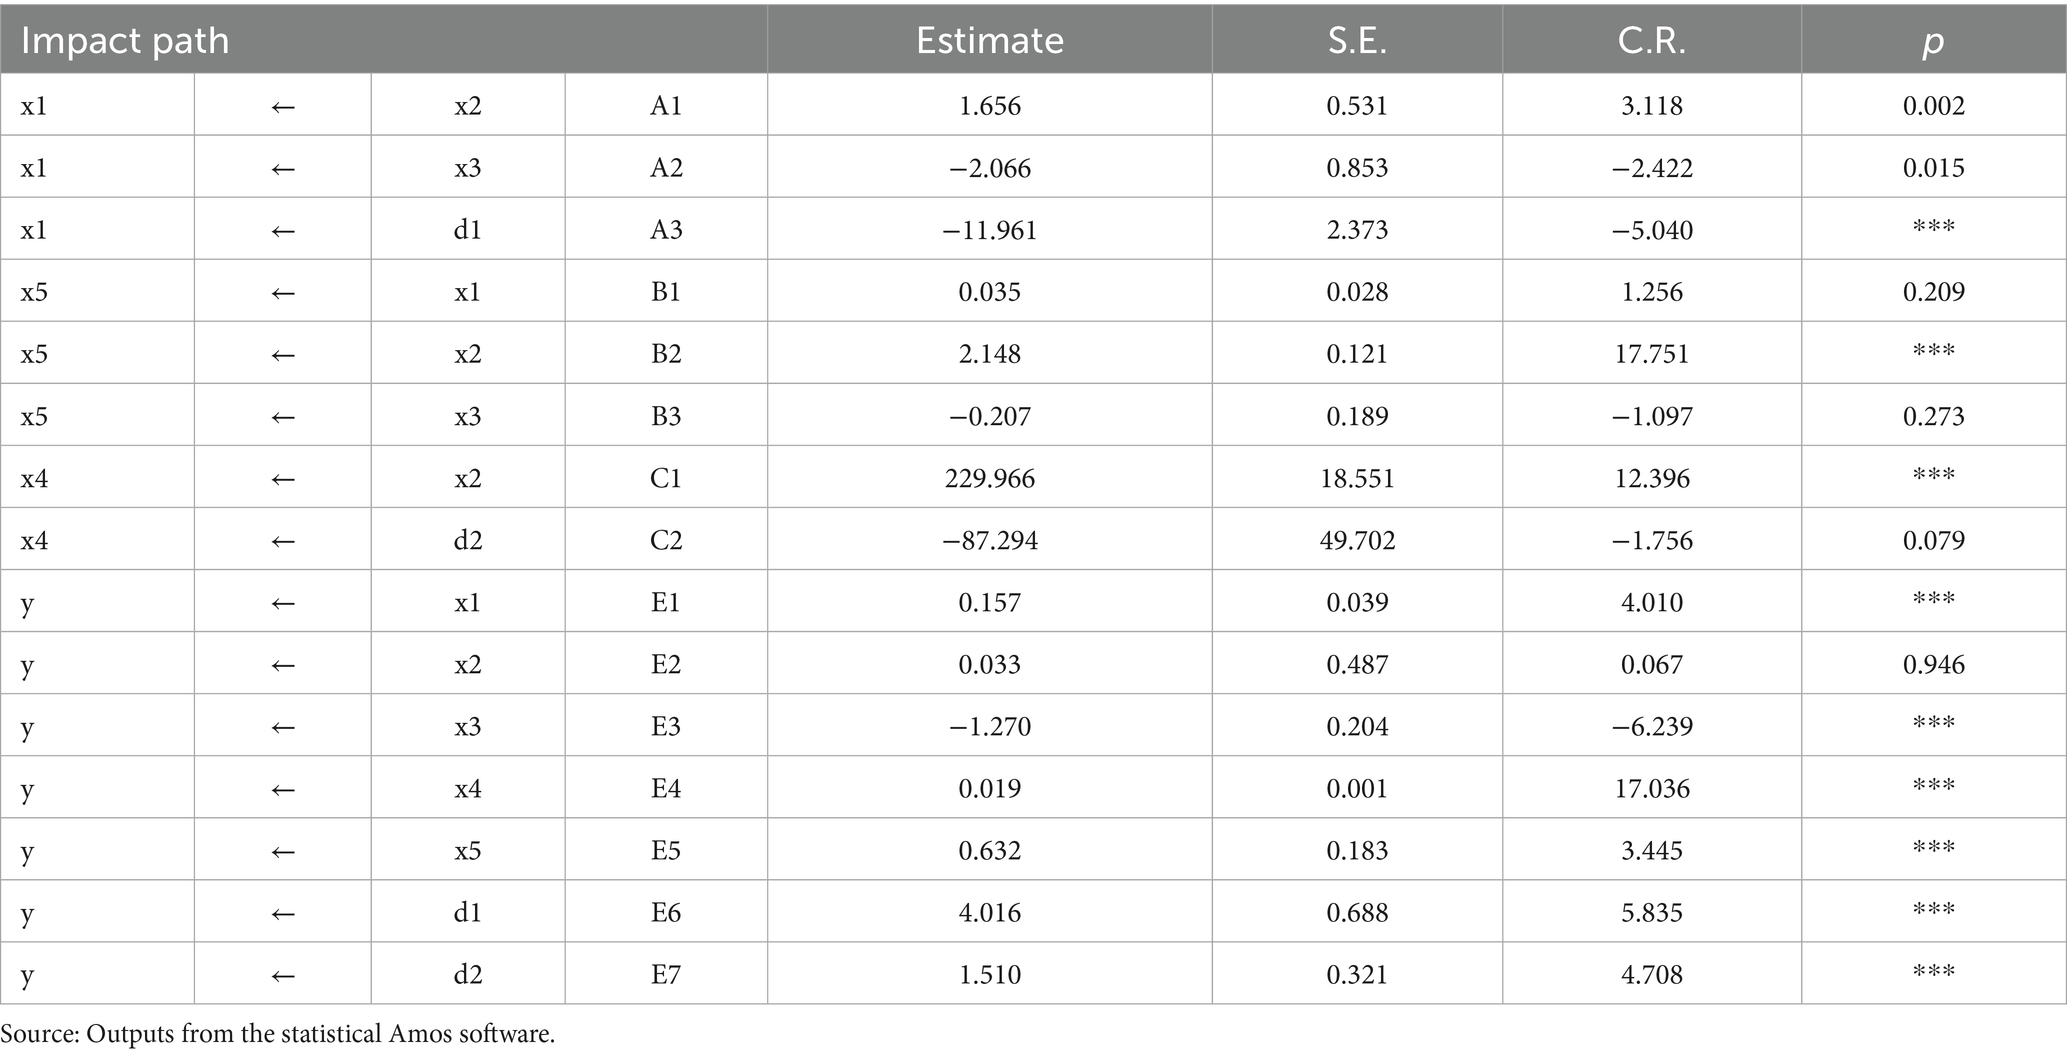
Table 5. Results of the path analysis model for study variables.
For POS sales (Y), per capita income (X1) and population (X2) positively influence sales, with a one-unit increase in income leading to an indirect rise of 0.0222 billion SAR, and a one-unit increase in population resulting in an increase of 5.984 billion SAR in POS sales. On the other hand, higher inflation (X3), the COVID-19 crisis (D1), and the value-added tax (D2) all contribute to a decrease in POS sales, with reductions of 0.501, 2.144, and 1.643 billion SAR, respectively.
No indirect effects were found for the number of POS devices (X4) or the value of credit card loans (X5) on POS sales. Based on the relative impact of these variables on POS sales, population (X2) ranks highest with a 58.13% influence, followed by the COVID-19 crisis (D1) at 20.83%, value-added tax (D2) at 15.96%, inflation (X3) at 4.87%, and per capita income (X1) at 0.22%. This analysis highlights the significant role of population growth and external shocks like COVID-19 in influencing the performance of the hospitality sector in Saudi Arabia.
3.4 Estimation of direct effects
In addition, the study focuses on interpreting the direct effects on the dependent variable (value of POS). The results in Table 6 indicate a positive relationship between each of the variables: per capita income (X1), population (X2), number of POS devices (X4), and value of credit card loans (X5). An increase of one unit in any of these variables leads to a direct increase in the value of POS sales by approximately 0.157, 0.0328, 0.0188, 0.6320, 4.0157, and 1.5098 billion Riyals, respectively. There is also an inverse relationship between the inflation rate (X3) and POS sales value, where a 1% increase in the inflation rate in Saudi Arabia would decrease approximately 1.2699 billion Saudi Riyals in the value of POS sales. All relationships align with economic rationale.
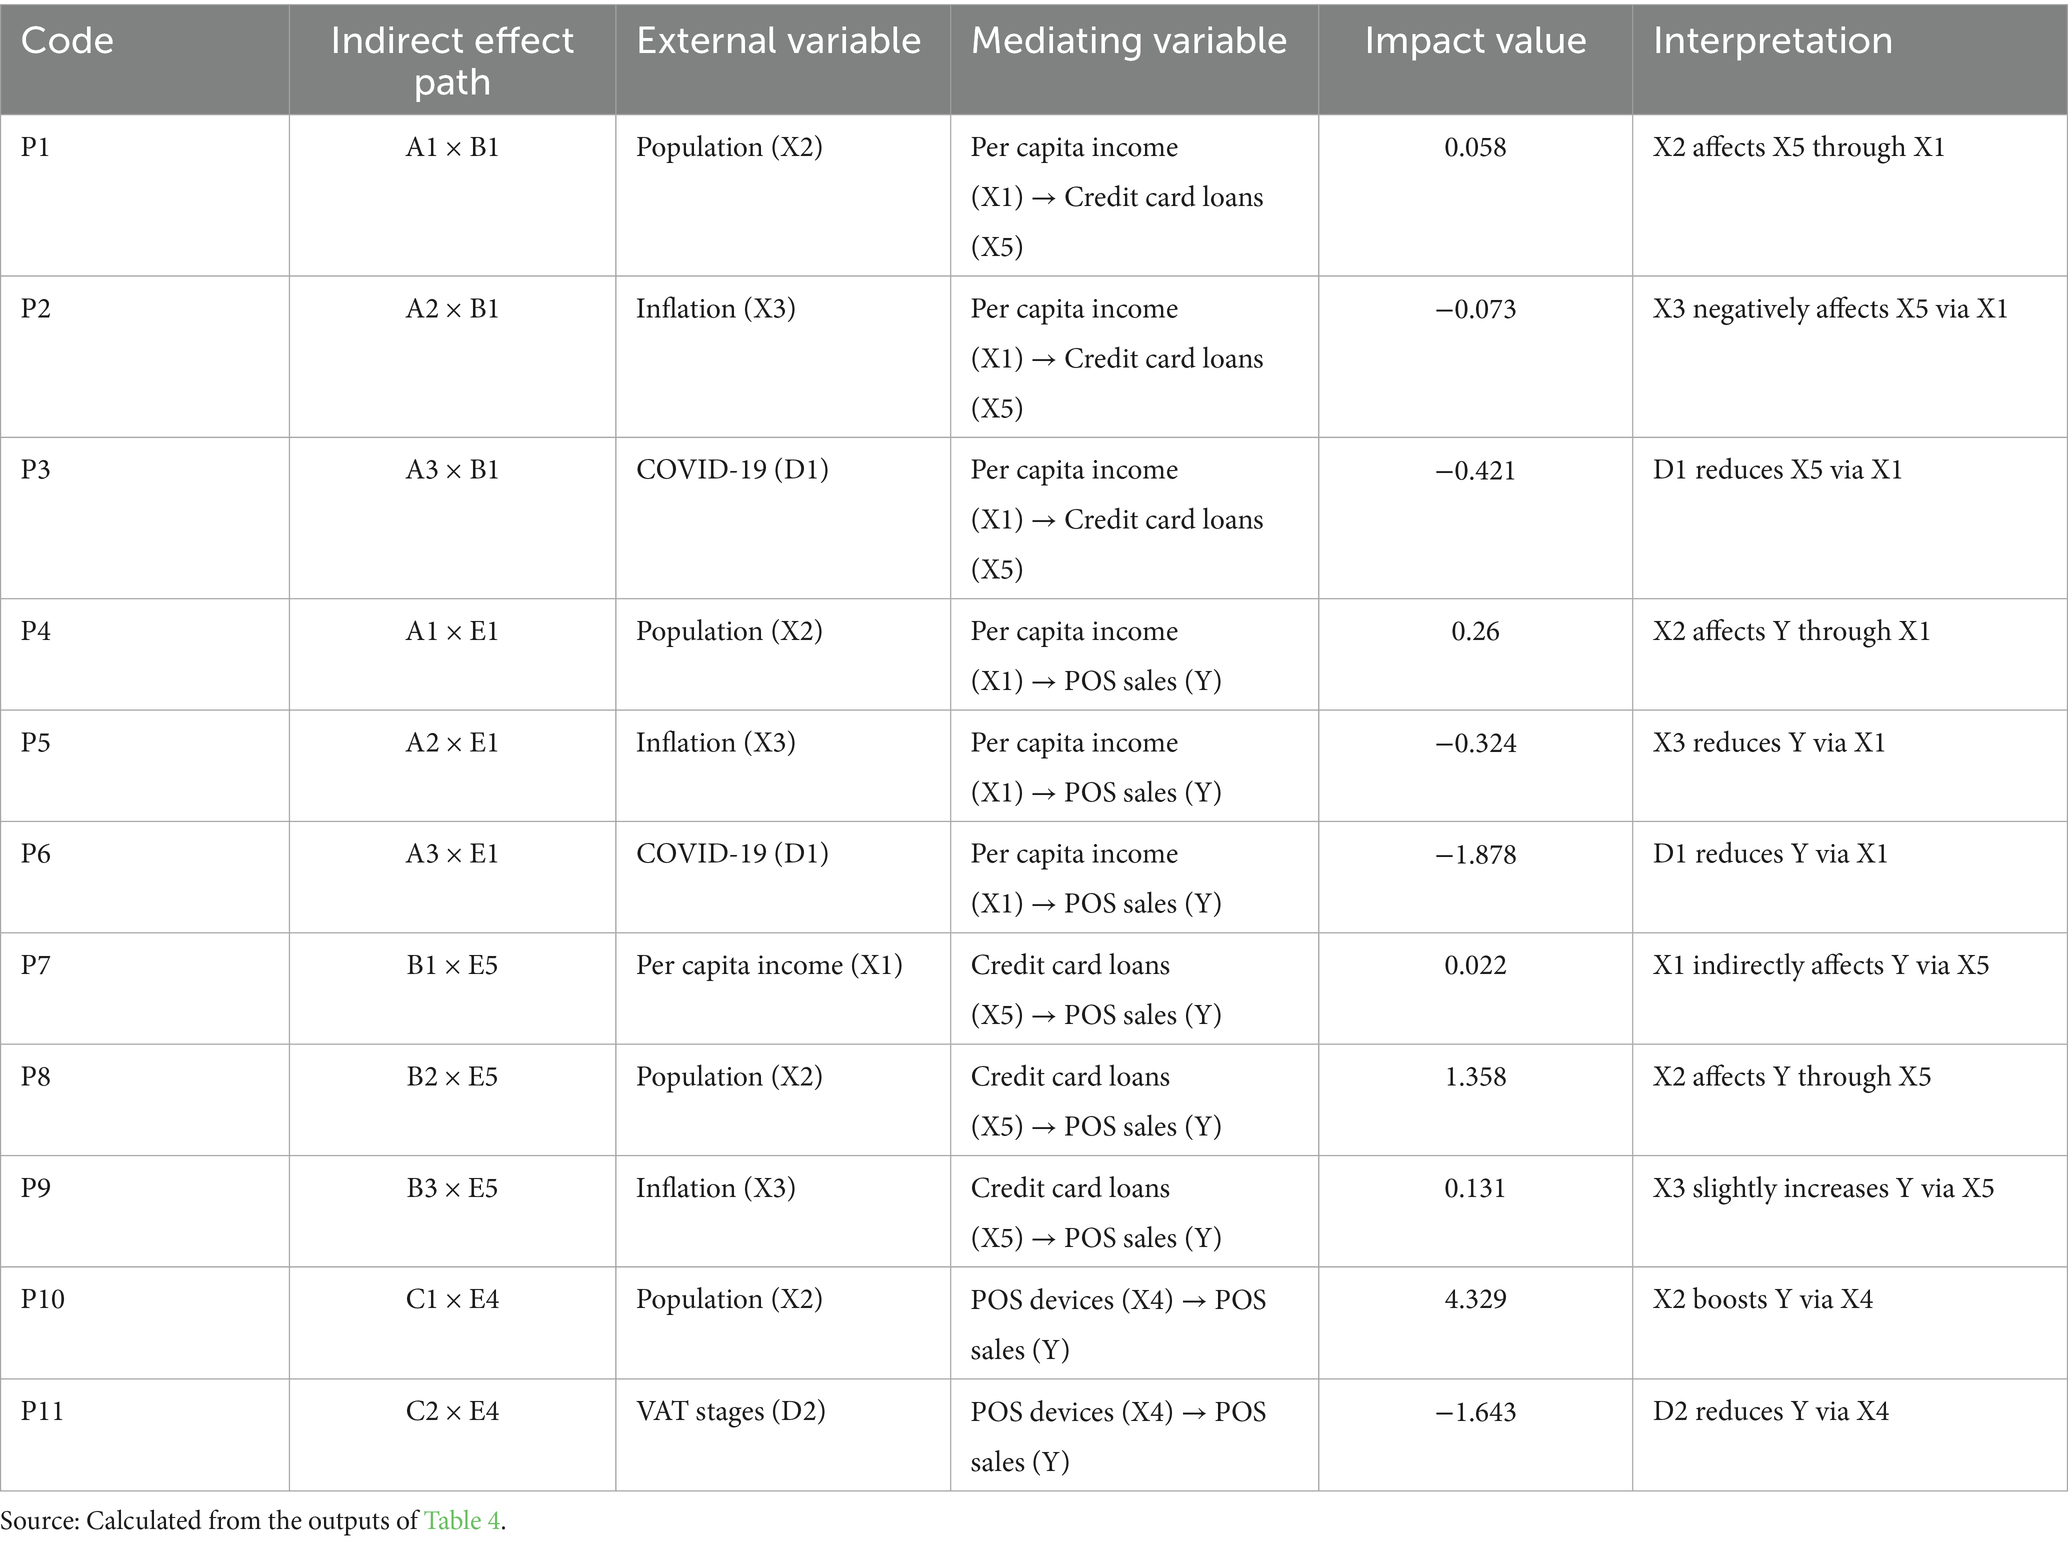
Table 6. Indirect effects of external variables on the internal variable.
Based on the above, the ranking of external variables by their relative importance in direct impact on the value of POS sales, as presented in Table 7, is as follows: the COVID-19 crisis variable (D1) ranks first, followed by the value-added tax variable (D2), then the inflation rate (X3), credit card loan value (X5), per capita income (X1), population (X2), and lastly, the number of POS devices (X4), with relative importance percentages of 52.59, 19.77, 16.63, 8.28, 2.06, 0.43, and 0.25%, respectively.
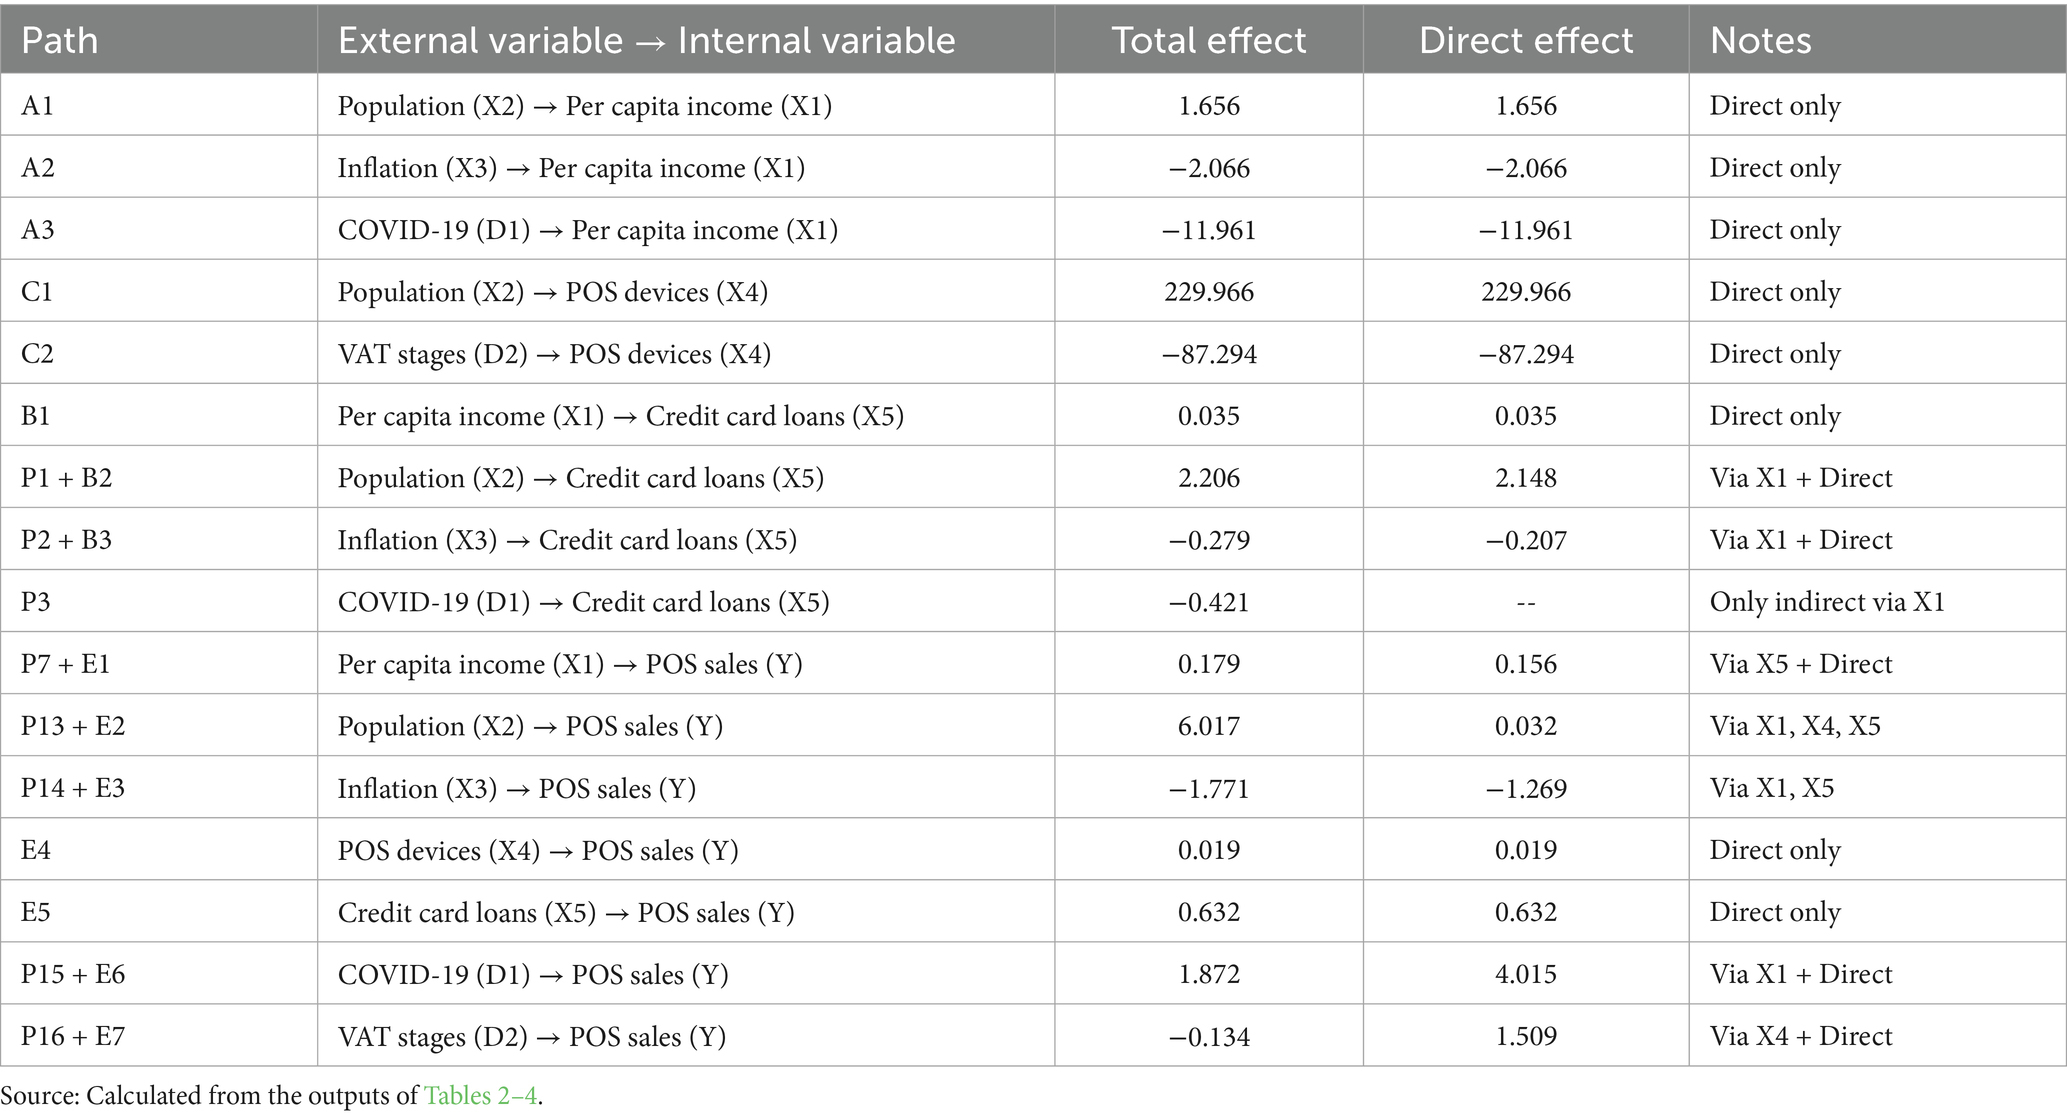
Table 7. Amount of impact of direct and indirect external variables on internal variables.
3.5 Estimation of total effects (direct and indirect)
The study focuses on interpreting the total effect on the dependent variable (value of POS sales). The results in Table 8 indicate a positive relationship between each of the following variables: per capita income (X1), population (X2), number of POS devices (X4), credit card loan value (X5), and the COVID-19 crisis variable (D1). Increasing one unit in any of these variables would increase the value of POS sales by approximately 0.179, 6.017, 0.01883, 0.632, and 1.872 billion Saudi Riyals, respectively. Additionally, there is an inverse relationship between both the inflation rate (X3) and value-added tax (D2) and the POS sales value, where an increase of one unit in inflation rate and value-added tax in the Kingdom would result in a decrease in the POS sales value by approximately 1.771 and 0.134 billion Saudi Riyals, respectively. All the results are consistent with economic rationale.
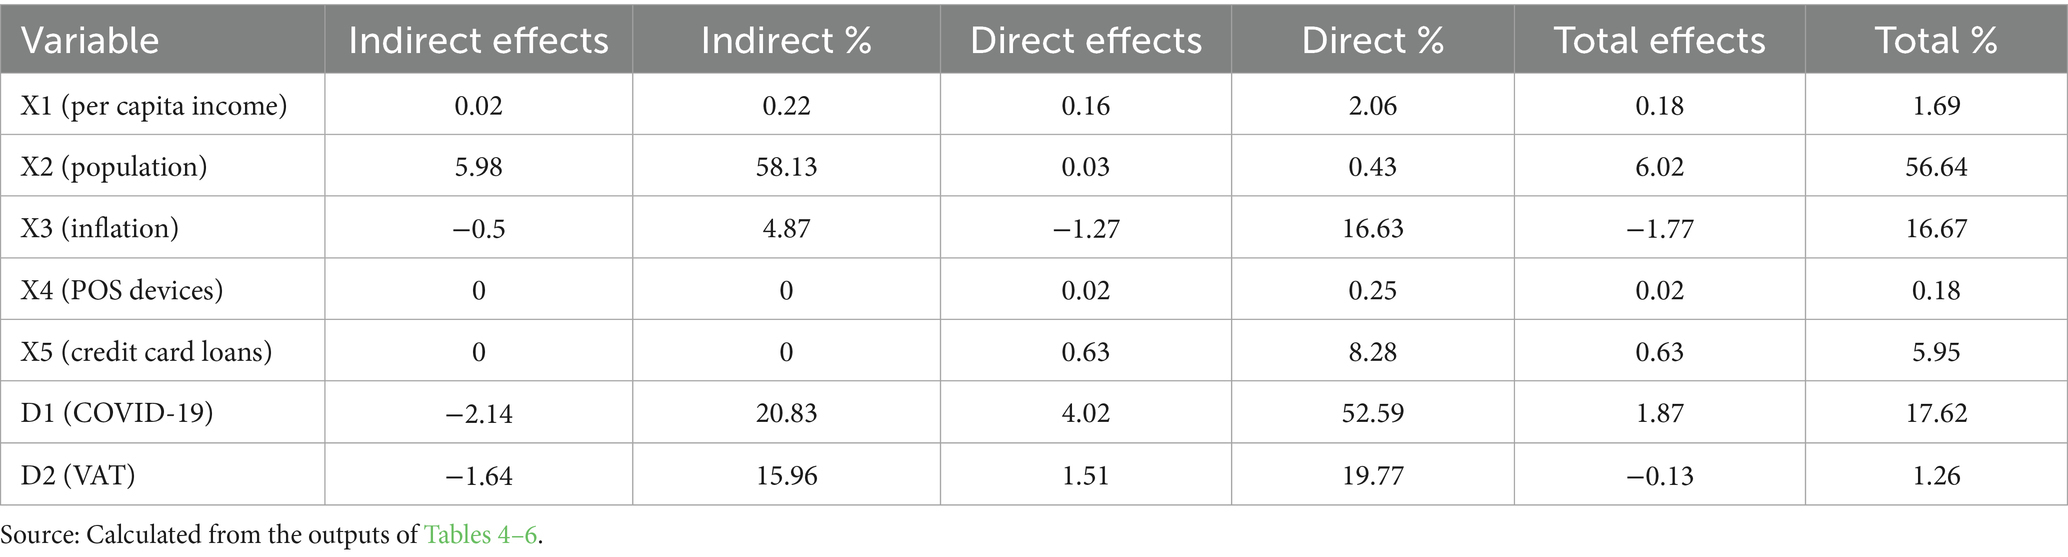
Table 8. Percentage impact of external variables on the internal variable (value of POS sales, Y).
Based on the above, the ranking of external variables according to their relative importance in total impact on the value of POS sales, as shown in Table 8, is as follows: population (X2) ranks first with a relative importance of 56.64%, followed by the COVID-19 crisis variable (D1) at 17.62%, then the inflation rate (X3) at 16.67%, credit card loan value (X5) at 5.95%, per capita income (X1) at 1.69%, followed by value-added tax (D2) at 1.26%, and lastly, the number of POS devices (X4) at 0.18%.
Path regression analysis revealed several significant relationships. A positive correlation was found between per capita income (X1), population (X2), the number of POS devices (X4), credit card loan values (X5), and the COVID-19 crisis variable (D1) with POS sales. Increases in these factors may have contributed to a rise in POS sales by 0.179, 6.017, 0.01883, 0.632, and 1.872 billion SAR, respectively. On the other hand, an increase in inflation (X3) and VAT (D2) is associated with a decrease in POS sales by 1.771 and 0.134 billion SAR, respectively. These results align with economic expectations. The relative importance of these external variables on POS sales is ranked as follows: population (X2) had the most significant impact, contributing 56.64%, followed by the COVID-19 crisis (D1) at 17.62%, inflation (X3) at 16.67%, credit card loans (X5) at 5.95%, per capita income (X1) at 1.69%, VAT (D2) at 1.26%, and the number of POS devices (X4) at 0.18%.
Based on these findings, the study recommends leveraging population growth by targeting new market segments and offering services like express delivery. It also suggests promoting e-commerce through better online platforms and health protocols, especially during crises like COVID-19. To counter inflation, businesses should enhance operational efficiency to keep prices competitive. Additionally, optimizing the number and placement of POS devices in high-demand areas can boost sales. These strategies will help sustain and grow the sector in Saudi Arabia.
4 Discussion
The results of this study offer important insights into how macroeconomic variables shape Point-of-Sale (POS) activity in Saudi Arabia’s food service sectors from Q1 2016 to Q4 2023. The findings show that population growth and rising per capita income positively drive POS sales, consistent with the expectations in emerging economies, where larger populations and increasing incomes lead to greater consumption of non-essential goods and services. This supports the work of Mokhtarian and Ory (2009), who observed that demographic expansion leads to higher discretionary spending, and aligns with Pallathadka and Pallathadka (2022), who emphasized the role of income growth in boosting consumer spending on dining and leisure activities.
In contrast, inflation and VAT increases negatively impact POS sales, a finding in line with Ferreira (2017), who reported that rising indirect taxes discourage consumption, especially in discretionary sectors like food services. Inflation reduces real disposable income, making consumers more cautious about dining out, a behavior consistent with broader international patterns. The COVID-19 pandemic initially disrupted POS activity, reflecting the findings of Dunn et al. (2021) and Seiler (2020), who documented declines in consumer spending during lockdowns. However, the pandemic also accelerated the adoption of digital payments, leading to a recovery in POS transaction volumes, particularly in sectors adapted to online ordering and cashless environments. This shift highlights the resilience and adaptability of the food services sector in response to external shocks.
The positive association between credit card loan expansion and POS sales illustrates the growing role of financial credit in facilitating consumption, a trend observed across digital economies. This supports the findings of Wisniewski et al. (2024), who noted that greater access to consumer credit promotes sustained transaction growth, particularly in economies undergoing rapid digital transformation. The expansion of POS devices emerged as a significant sales driver, confirming that payment infrastructure investment is critical to supporting cashless economies. This finding echoes the goals of Saudi Arabia’s Vision 2030, which emphasizes developing digital payment ecosystems to reduce cash dependency.
The implications of these findings are substantial. For policymakers, promoting widespread availability of POS devices and ensuring access to affordable digital payment solutions can stimulate economic activity in the food services sector. Targeted fiscal policies that mitigate the adverse effects of inflation and VAT increases could further support consumer spending. Additionally, enhancing financial inclusion through broader access to credit could strengthen resilience against future economic shocks.
5 Conclusion
This study used Path Analysis to examine key macroeconomic variables’ impact on Point-of-Sale (POS) sales in Saudi Arabia’s restaurant, café, and food and beverage sectors from Q1 2016 to Q4 2023. The findings showed that population growth and the expansion of digital payment infrastructure were the strongest drivers of POS sales, while inflation and VAT increases constrained spending activity. Practically, the study highlights the importance of supporting digitalization efforts and managing inflationary pressures to sustain consumer spending in the food services sector.
Theoretically, the study contributes to the growing body of literature emphasizing the interplay between macroeconomic factors and consumer behavior in emerging economies. It reinforces findings from previous global research while adding localized evidence from Saudi Arabia’s unique Vision 2030 transformation context. This study is not without limitations. It focuses on aggregated national-level data, limiting insights into regional or micro-level consumer behavior variations. Additionally, the reliance on secondary data restricts the ability to explore psychological or sociocultural drivers behind consumer choices.
Future research should explore regional disparities in POS sales performance within Saudi Arabia, investigate the role of digital platforms and mobile applications in shaping consumption behavior, and examine generational differences in adopting cashless payment technologies. Longitudinal studies beyond 2024 will also be essential to capturing the evolving impact of ongoing economic reforms and global financial fluctuations on consumer spending dynamics.
However, this study has several limitations that warrant consideration. First, while Path Analysis addresses multicollinearity and captures direct and indirect effects, it does not fully resolve potential endogeneity issues, such as reverse causality between POS expansion and consumer demand. Second, the use of aggregated national-level data restricts our ability to assess regional or consumer-segment-level variations. Third, treating the food services sector as a homogenous entity overlooks possible heterogeneity across restaurants, cafés, and beverage-focused businesses. Future research should also consider models that account for dynamic feedback effects, employ regional or firm-level data, and disaggregate sectoral analysis to better understand divergent consumer behavior and economic responsiveness patterns.
Data availability statement
Publicly available datasets were analyzed in this study. This data can be found at: https://www.sama.gov.sa/en-US/Indices/pages/pos.aspx.
Author contributions
MA: Conceptualization, Data curation, Formal analysis, Funding acquisition, Investigation, Methodology, Project administration, Resources, Software, Supervision, Validation, Visualization, Writing – original draft, Writing – review & editing. YA: Conceptualization, Data curation, Formal analysis, Resources, Writing – review & editing. AK: Conceptualization, Data curation, Formal analysis, Resources, Writing – review & editing, Investigation, Methodology, Software, Writing – original draft. EA: Conceptualization, Investigation, Methodology, Writing – review & editing.
Funding
The author(s) declare that financial support was received for the research and/or publication of this article. This work was supported by Ongoing Research Funding program (ORF-2025-932), King Saud University, Riyadh, Saudi Arabia.
Conflict of interest
The authors declare that the research was conducted in the absence of any commercial or financial relationships that could be construed as a potential conflict of interest.
Generative AI statement
The authors declare that no Gen AI was used in the creation of this manuscript.
Publisher’s note
All claims expressed in this article are solely those of the authors and do not necessarily represent those of their affiliated organizations, or those of the publisher, the editors and the reviewers. Any product that may be evaluated in this article, or claim that may be made by its manufacturer, is not guaranteed or endorsed by the publisher.
References
6Wresearch. (2023). GCC cafe and coffee market. Available online at: https://www.6wresearch.com/industry-report/gcc-cafe-and-coffee-market (Accessed 15 June, 2024).
Abha Chamber. (2024). Study of the reasons for project closures in the Asir region: a case study of the restaurant and café sector. Available online at: https://www.abhacci.org.sa (Accessed June 15, 2024).
Allegra Strategies (2013). Project cafe - executive summary. Available online at: https://www.allegrastrategies.com/Files/AllegraStrategies/ProjectCafe13EU/Bulgaria543788/Allegra%20Strategies%20Project%20Cafe13%20EU%20-%20Executive%20Summary%20-%20Bulgaria.pdf (Accessed November, 2013).
AlTarrah, D., AlShami, E., AlHamad, N., AlBesher, F., and Devarajan, S. (2021). The impact of coronavirus COVID-19 pandemic on food purchasing, eating behavior, and perception of food safety in Kuwait. Sustain. For. 13:8987. doi: 10.3390/su13168987
Altawyan, A. A. (2022). Subjecting net profit to Zakāt in Saudi law. Arab Law Q. 36, 1–16. doi: 10.1163/15730255-bja10107
Andersen, A.L., Hansen, E.T., Johannesen, N., Sheridan, A., and Johannesen, N. (2020) Pandemic, shutdown and consumer spending: lessons from Scandinavian policy responses to COVID-19. arXiv preprint arXiv:2005.04630. doi: 10.48550/arXiv.2005.04630
Bassiouni, N. R., and Bassiouni, A. R. (2021). Using the path analysis method to determine factors affecting Egypt's inflation rate. J. Financ. Commer. Res. 22:39. doi: 10.21608/jsst.2021.66703.1231
Czarniecka-Skubina, E., Pielak, M., Sałek, P., Głuchowski, A., Kobus-Cisowska, J., and Owczarek, T. (2021). Use of food services by consumers in the SARS-CoV-2 pandemic. How the eating habits of consumers changed in view of the new disease risk factors? Nutrients 13:2760. doi: 10.3390/nu13082760
Deaton, A. (2005). ‘Franco Modigliani and the life-cycle theory of consumption’, Banca Naz. Lav. Q., Banca Nazionale del Lavoro, 58, 91–107. doi: 10.2139/ssrn.686475
Denysenko, M., and Budiakova, O. (2020). Features of economic development of hotel and restaurant business. Економіка та держава, 19–23.
Dunn, A., Hood, K., Batch, A., and Driessen, A. (2021). Measuring Consumer Spending Using Card Transaction Data: Lessons from the COVID-19 Pandemic. AEA Papers and Proceedings 111: 321–25. doi: 10.1257/pandp.20211049
Ferreira, J. (2017). Café nation? Exploring the growth of the UK café industry. Area 49, 69–76. doi: 10.1111/area.12285
General Authority for Statistics. (2024). Official website. Available online at: https://www.stats.gov.sa/ (Accessed June 15, 2024).
Hidayati, I., Sudarmiatin, S., and Hermawan, A. (2023). Analysis of point of sale system implementation in coffee shop. Jurnal Pendidikan dan Kewirausahaan 11, 932–947. doi: 10.47668/pkwu.v11i3.881
HorizoonX. (2023). Glimpse into the number of restaurants and cafes in Saudi Arabia. Available online at: https://horizoonx.com/en/news/glimpse-into-the-number-restaurants-and-cafes-in-saudi-arabia (Accessed June 15, 2024).
Kelly, R.C. (2024) 'Variance Inflation Factor (VIF)', Investopedia. Available online at: https://www.investopedia.com/terms/v/variance-inflation-factor.asp (Accessed June 27, 2024).
Khan, R. (2020). Economic growth stimulation under VAT or GST regime; case study of Saudi Arabia and India. Int. J. Econ. Commer. Res. 10, 17–28.
Lewis, D., Mertens, K., and Stock, J. H. (2020). US economic activity during the early weeks of the SARS-Cov-2 outbreak (No. w26917) : National Bureau of Economic Research.
Mahathir, A. A. B., Dass, S. M., Mahalingam, S. R., Lun, D. C. K., Ghaleb, A. A. F., Alsukhailah, A. A., et al. (2025). Enhancing store hub POS system: a user-centric redesign to improve efficiency, compatibility, and security for retail and F&B sectors. Preprints :2025041736. doi: 10.20944/preprints202504.1736.v1
Market Research (2024). Saudi Arabia Foodservice - Market Share Analysis, Industry Trends & Statistics, Growth Forecasts 2017 - 2029. Mordor Intelligence Inc. 204 p.
Mokhtarian, P.L., and Ory, D.T. (2009). Structural equation models. In: Kitchin, R., Thrift, N. (eds.) International Encyclopedia of Human Geography, (Oxford: Elsevier), 10–17.
Pallathadka, H., and Pallathadka, L. K. (2022). Impact of COVID adoption of cashless methods among general public in India. J. Appl. Sci. Res. 10, 56–64.
Saudi Central Bank (2024). Official website. Available online at: https://www.sama.gov.sa/ar-sa/Pages/default.aspx
Saudi Vision 2030 (2023). Annual report. Available online at: https://www.vision2030.gov.sa/media/xi2jlj0y/english_vision2030_annual_report_2023.pdf (Accessed June 15, 2024).
Seiler, P. (2020). Weighting bias and inflation in the time of COVID-19: evidence from Swiss transaction data. Swiss J. Econ. Stat. 156, 1–11. doi: 10.1186/s41937-020-00057-7
Shaba, Y.A., Umar, I.S., and Mohammed, H. (2024). Effects of point of sale (POS) services on rice farming activities in rural communities of Niger State, Nigeria, In Proceedings of the 3rd International Conference of School of Agriculture and Agricultural Technology, pp. 280–287.
Stiglitz, J. E., and Rosengard, J. K. (2015). Economics of the public sector. 4th Edn: W.W. Norton & Company.
Susilo, A., Gami, E. R. P., Surentu, Y. R., and Jufri, E. D. H. (2024). The effect of digital payment innovation and point giving marketing strategy on consumer shopping experience in the culinary industry. Int. J. Bus. Econ. Res. 2, 133–142. doi: 10.62794/ijober.v2i3.2500
Thaler, R. H., and Sunstein, C. R. (2008). Nudge – Improving decisions about health, wealth, and happiness. New Haven and London: Yale University Press.
Venkatesh, V., Thong, J. Y. L., and Xu, X. (2012). Consumer acceptance and use of information technology: extending the unified theory of acceptance and use of technology. MIS Q. 36, 157–178. doi: 10.2307/41410412
Keywords: food sector, restaurants and cafés, point of sale, inflation rate, value-added tax, COVID-19 crisis, variance inflation factors, path analysis
Citation: Alnafissa M, Alamri Y, Kotb A and Aljohani ES (2025) Economic factors affecting point-of-sale systems in Saudi Arabia’s food sectors. Front. Sustain. Food Syst. 9:1543833. doi: 10.3389/fsufs.2025.1543833
Edited by:
Min-Kyu Kwak, Eulji University, Republic of KoreaReviewed by:
Giulia Chiaraluce, Università Politecnica delle Marche, ItalyJuan Manuel Vargas-Canales, University of Guanajuato, Mexico
Copyright © 2025 Alnafissa, Alamri, Kotb and Aljohani. This is an open-access article distributed under the terms of the Creative Commons Attribution License (CC BY). The use, distribution or reproduction in other forums is permitted, provided the original author(s) and the copyright owner(s) are credited and that the original publication in this journal is cited, in accordance with accepted academic practice. No use, distribution or reproduction is permitted which does not comply with these terms.
*Correspondence: Mohamad Alnafissa, bWFsbmFmaXNzYUBrc3UuZWR1LnNh
†These authors share first authorship