 Xiaoming Li
 Jinhai Xu2*
- 1Agricultural College, Yangzhou University, Yangzhou, China
- 2Business School, Yangzhou University, Yangzhou, China
- 3School of Architectural Engineering, Shandong Polytechnic College, Jining, China
Background: This study explores the spatiotemporal characteristics and key driving factors of intensive cropland green innovation transitions in the Yangtze River Delta region (YRD) from 2000 to 2020. The aim is to understand how urbanization, agricultural restructuring, and green productivity improvements have influenced cropland sustainability.
Methods: A comprehensive analytical framework was constructed from three dimensions: landscape attributes, structural attributes, and production attributes. Using landscape pattern indices, Shannon diversity index, and green total factor productivity (GTFP) calculated via data envelopment analysis (DEA), this study quantified changes in cropland use and agricultural practices over two decades.
Results: The findings revealed significant cropland reduction, particularly in highly urbanized areas such as Shanghai and Jiangsu, driven by rapid urban expansion and industrialization. Agricultural diversity improved in cities like Ningbo and Nantong, while Shanghai experienced a decline in planting diversity. GTFP significantly increased across most cities due to technological advancements, especially in Nanjing and Hangzhou. However, regions such as Hefei showed limited progress in green technological adoption. Intensive Cropland is undergoing rapid transformation, and there are obvious signs of internal differentiation in economically developed regions, with more pronounced changes in regions.
Conclusion: This study concludes that region-specific strategies are necessary to balance urban growth with cropland preservation, optimize agricultural structures, and promote green agricultural technologies to ensure sustainable agricultural development in the YRD.
1 Introduction
Sustainable agricultural development is essential to address the food security challenges posed by climate change, ecosystem degradation, and population growth (Abbasi and Zhang, 2024). Many countries, particularly developed countries, have focused on agricultural transformation and land use efficiency (Amanullah and Khalid, 2020). These efforts include the adoption of green agricultural technologies and optimization of land resources (Hristov et al., 2020).
As one of the most populous nations, China faces immense pressure on its arable land and food security, exacerbated by rapid urbanization and economic growth. In recent decades, changes in land use have led to a significant decline in arable land (He et al., 2017). The national “green development” strategy promotes sustainable agriculture through green technologies, land protection policies, and land use optimization (Shen et al., 2020). The Yangtze River Delta (YRD) is of particular importance due to its high level of urbanization and industrialization. YRD is not only critical to China’s food security, but also serves as a model for other developing regions. While policies in YRD have improved agricultural diversity and cropping patterns (Li and Cui, 2024). Disparities remain, with some cities facing significant land loss and limited crop diversity (Fan et al., 2024). Therefore, a detailed analysis of YRD cropland, its spatial and temporal changes, and the drivers of green innovation is needed to guide agricultural transitions in similar urbanizing regions.
Green innovation is the key to sustainable agriculture (Zhang W. et al., 2024). However, balancing economic growth with sustainable land use and reducing environmental impacts while maintaining production efficiency remains a challenge. While many studies focus on improving production efficiency through technological progress, limited attention has been paid to the spatial and temporal patterns of green land transformation and regional differences (Preusse et al., 2024). Landscape fragmentation, reduced crop diversity, and regional differences in production efficiency pose significant barriers to the greening of agricultural land. Qiu et al. showed how landscape fragmentation promotes crop diversification (Qiu et al., 2020), while Yin et al. identified regional differences in intensification. Intensive land use can also improve energy efficiency (Yin et al., 2019). Promoting technological innovation, optimizing cropping patterns, and improving resource efficiency can significantly improve agricultural sustainability (Xu et al., 2020; Monteleone et al., 2018).
Therefore, it is imperative to integrate the analysis of landscape change, the structure of agricultural cropping, and production efficiency to investigate their impact on the green transformation of cropland and the underlying driving mechanisms. The establishment of a comprehensive research framework is essential to attain a profound comprehension of the dynamic shifts in the utilization of cropland and the driving factors that precipitate them. The main objective of this paper is to develop an analytical framework based on ‘landscape attributes’, ‘structural attributes’ and ‘production attributes’ to study the spatial and temporal characteristics of green innovation in intensive farmland in the YRD region from 2000 to 2020. This research integrates the landscape pattern index, the Shannon diversity index, and the Malmquist index of productivity (MI) from the DEA model to assess the green transformation of agriculture. By combining statistical and spatial analysis, these methods provide a comprehensive view of the evolution of green innovation in intensive agriculture and identify the driving forces behind this transformation.
This study addresses key questions: (1) What are the spatial and temporal characteristics of intensive agricultural land in the YRD region? (2) How does the cropping structure evolve across regions? (3) What are the pathways and regional differences in green total factor productivity? (4) What factors drive the green innovation transformation of cropland? These questions are effectively explored through the application of the selected models. The landscape pattern index helps to assess the spatial dynamics of farmland, including fragmentation and connectivity, which are essential for sustainable land use. The Shannon diversity index shows how cropping structures change over time and space, reflecting the biodiversity and complexity of farming practices. The Malmquist index of productivity (MI) tracks changes in productivity, allowing assessment of technological advances and efficiency improvements in agricultural practices. These models are key to answering the research questions because they allow for a robust, multifaceted analysis of the spatial and temporal dynamics of farmland transformation and the factors influencing green innovation.
This research not only provides empirical support for green agricultural transformation in the YRD, but also offers valuable insights for land use management and policy making in other similar regions, contributing new perspectives and policy recommendations for enhancing agricultural sustainability and improving resource efficiency.
2 Materials and methods
2.1 Study area
The YRD region is located in the eastern part of China (30°20′ to 32°30′ north latitude and 119°24′ to 122°30′ east longitude). It is an important intersection of the “Belt and Road” and the “Yangtze River Economic Belt,” and the region is one of the most economically active, open and innovative regions in China. The region is characterized by a distinctive natural geography, with a humid subtropical monsoon climate, four distinct seasons, and simultaneous rain and heat, which is suitable for the development of a variety of agricultural production methods. The region’s abundant water resources, derived from numerous rivers and lakes, have contributed to its status as a prominent agricultural production base in China. This distinction is particularly noteworthy in the context of China’s ongoing modernization and development, underscoring the area’s significance in supporting agricultural activities over an extended period (Wang et al., 2022; Liu et al., 2015).
In this study, we divide the research area by the administrative boundaries of cities. According to the definition of the Outline of the Plan for the Integrated Development of the YRD, the YRD region has a total area of about 358,000 square kilometers, which covers all of Shanghai Municipality and the three provinces (Jiangsu, Zhejiang, and Anhui), with a total of 41 cities. LULC indicators and other agricultural production panel data are integrated according to urban attributes (Figures 1–5 and Tables 1–9).
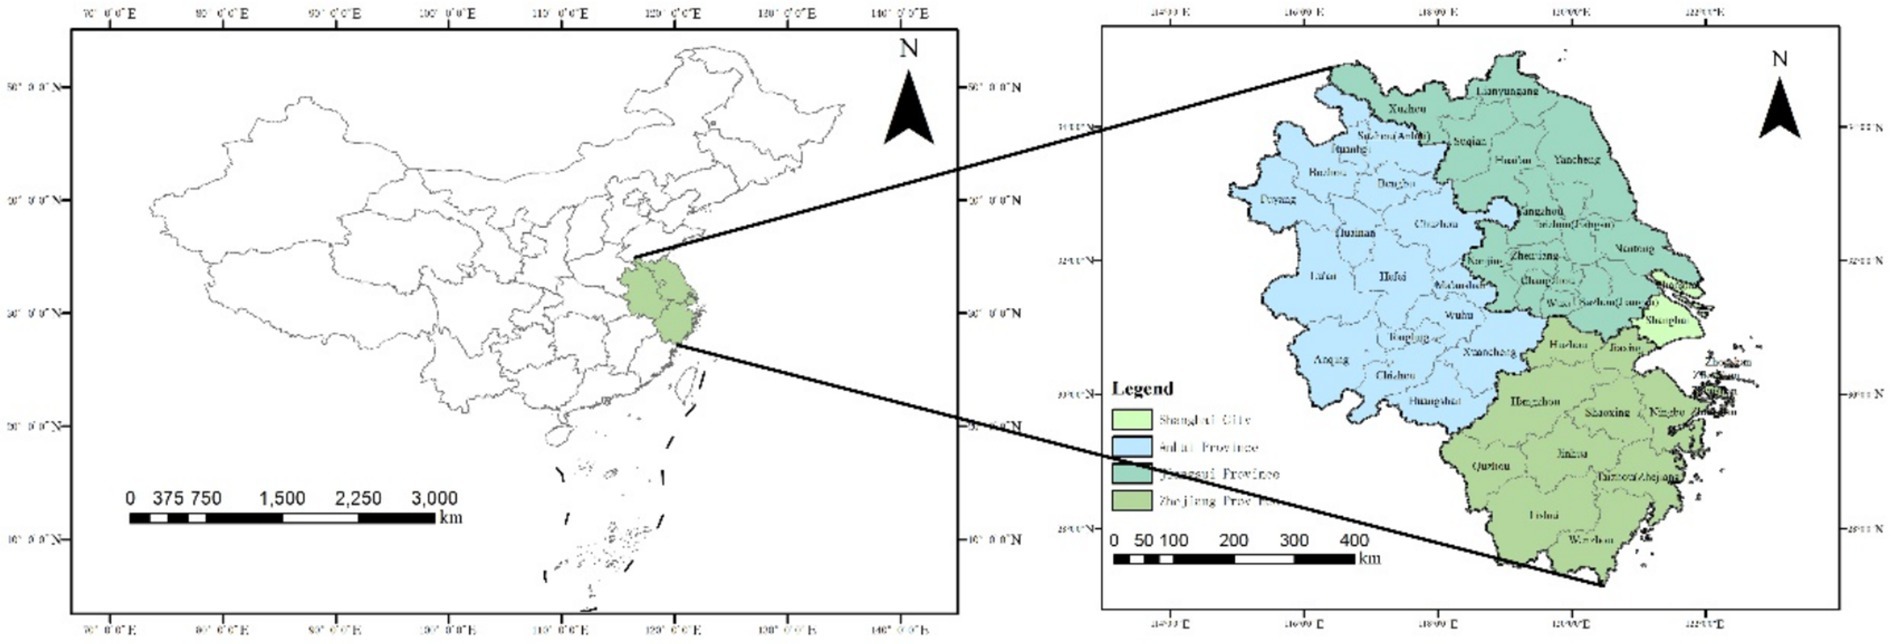
Figure 1. Scope of the study.
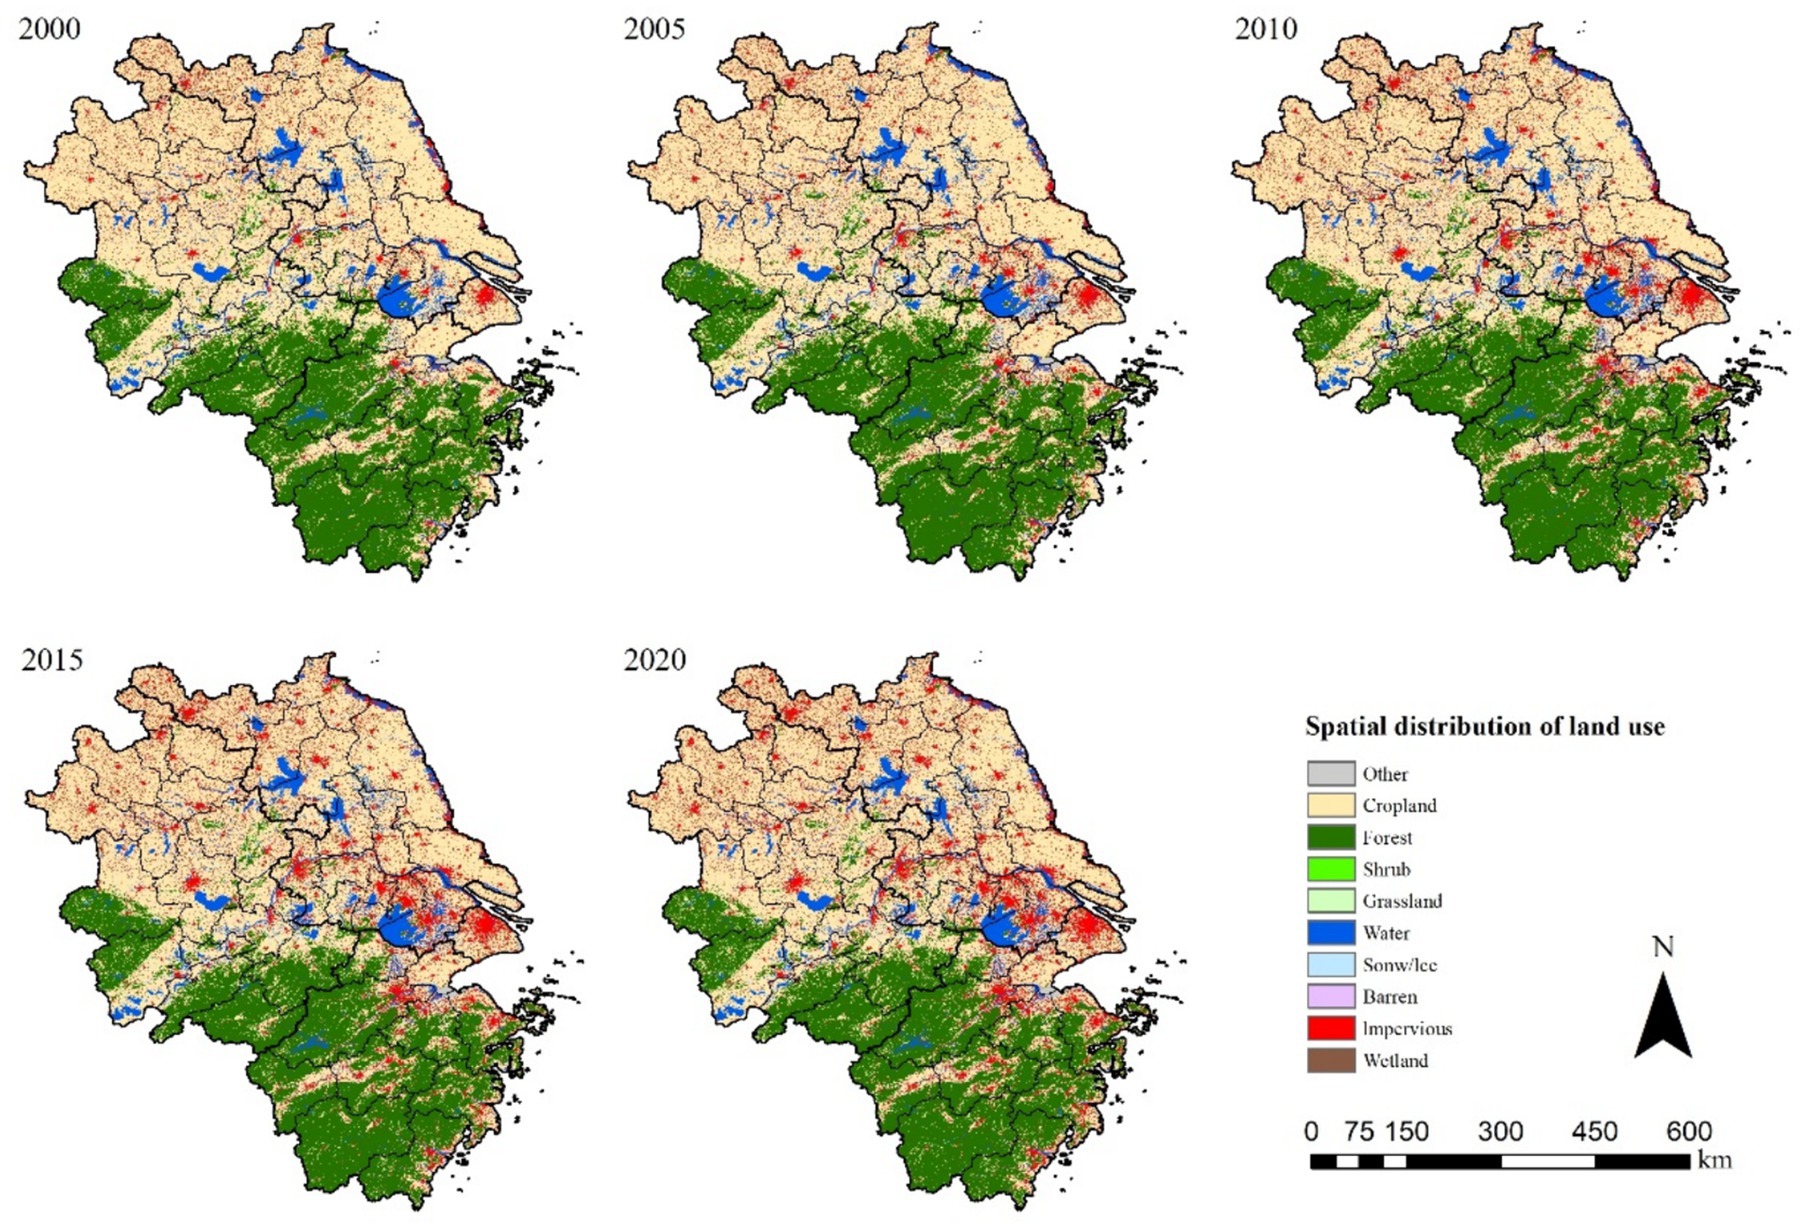
Figure 2. Spatial and temporal pattern of land use in the YRD region: 2000–2020.
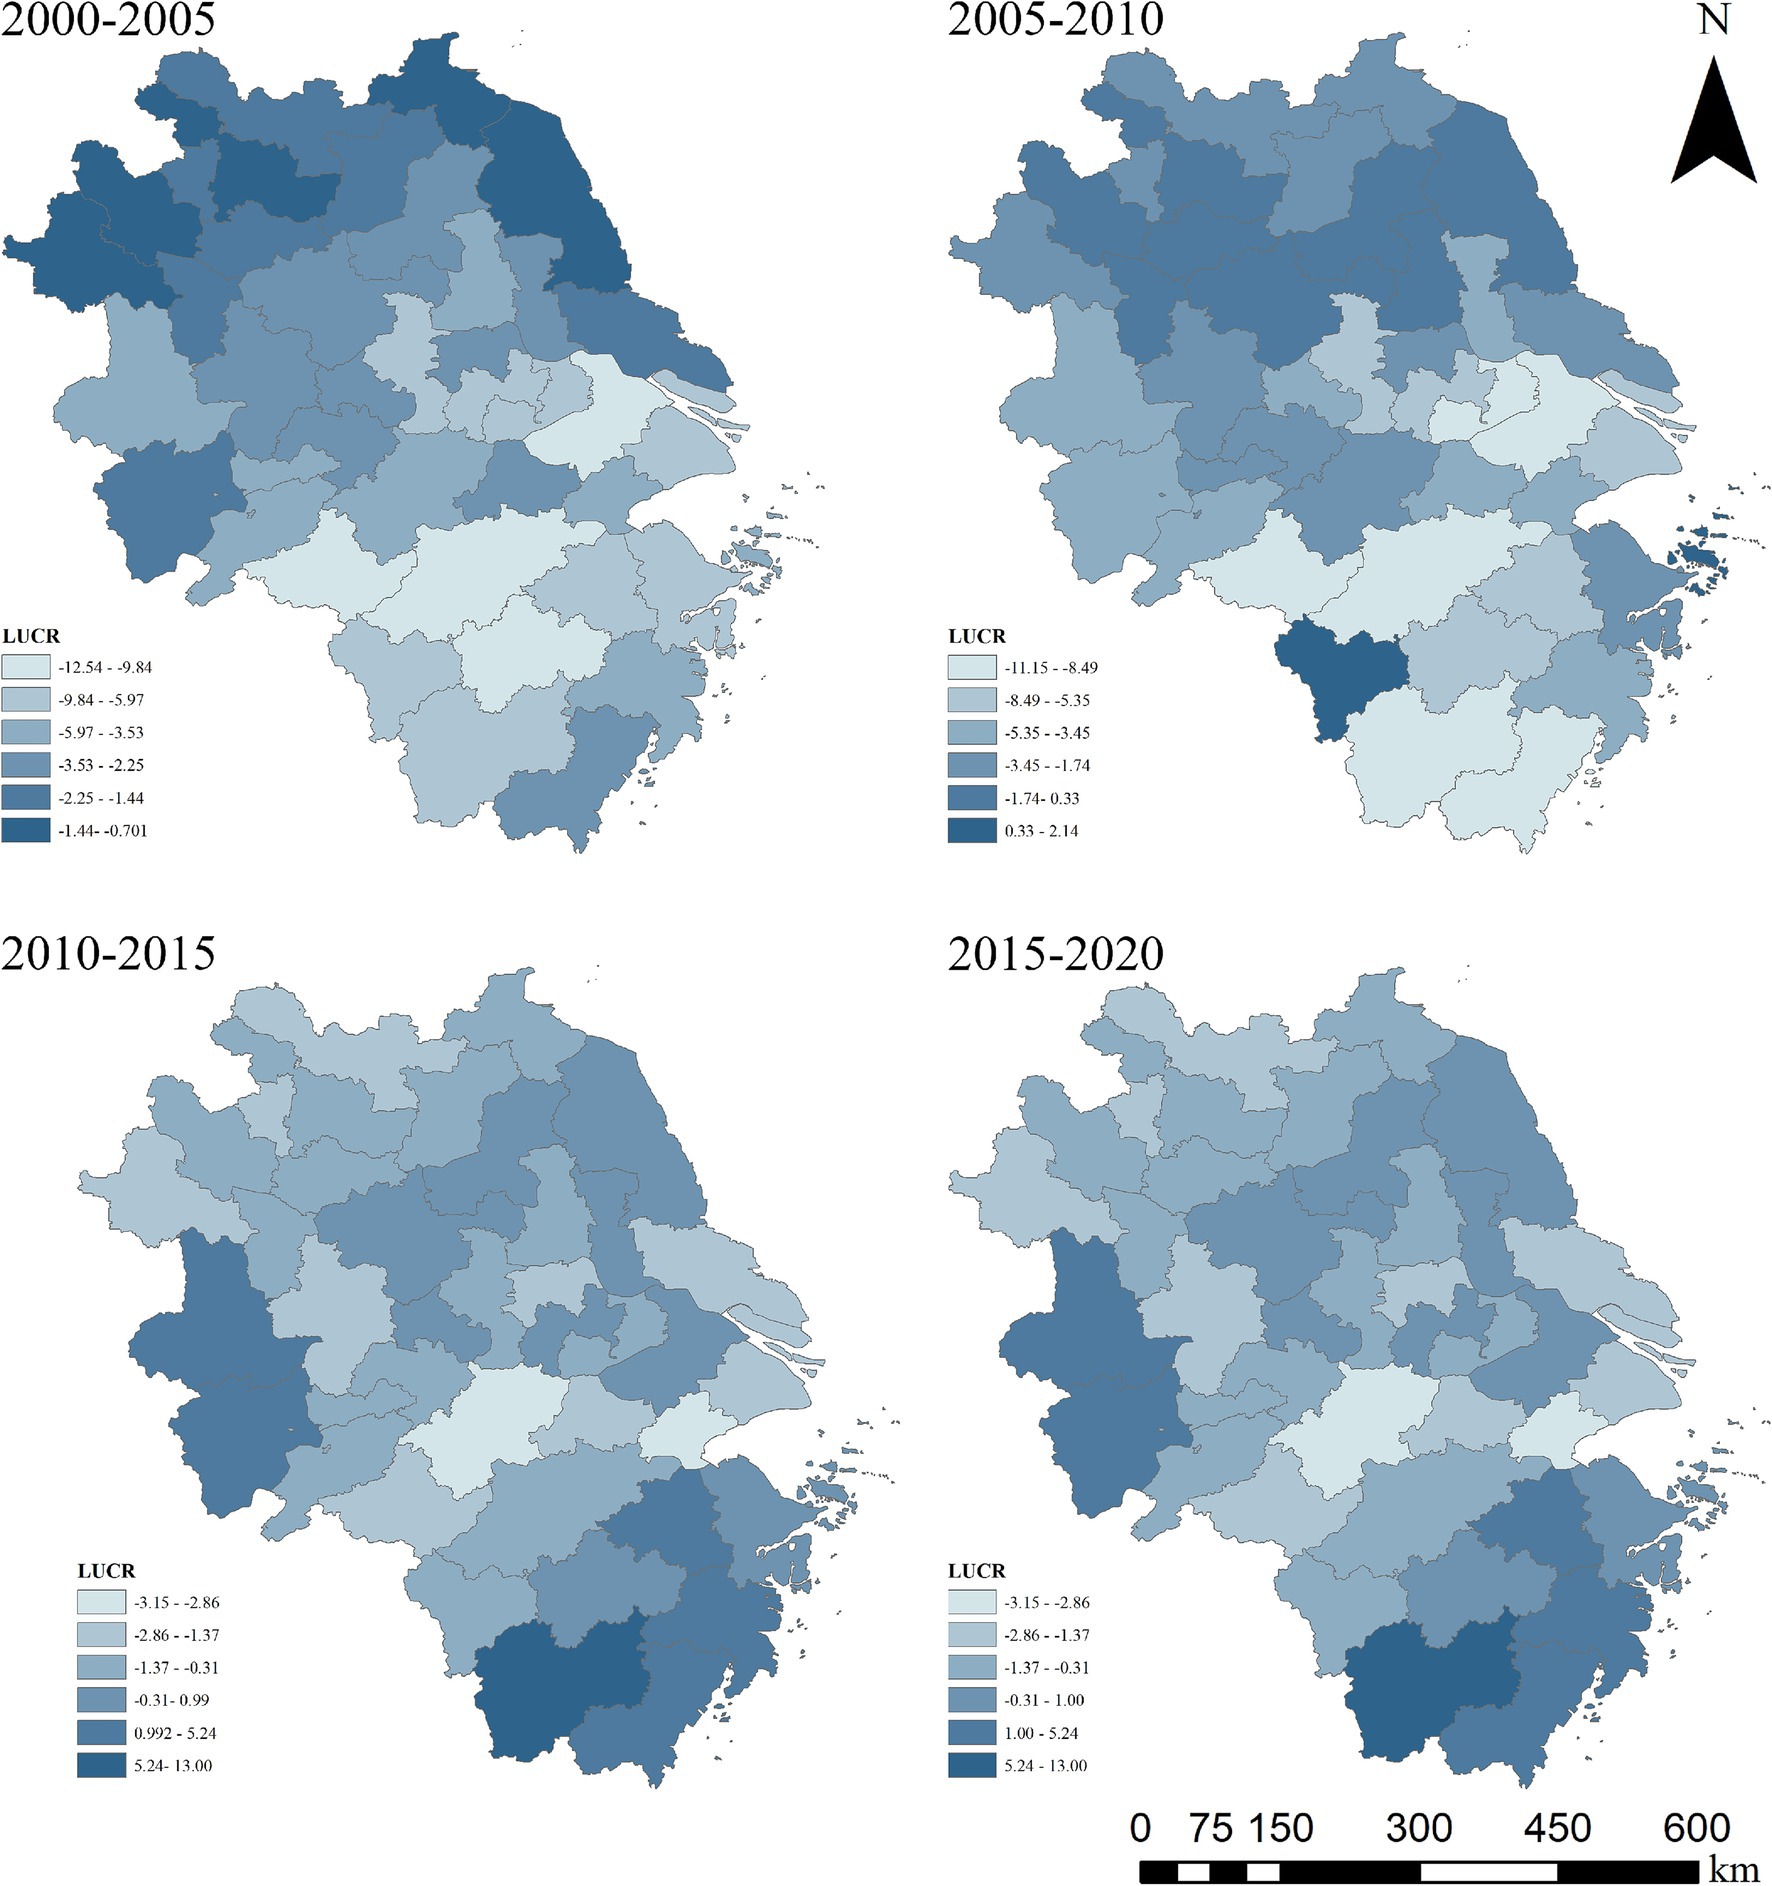
Figure 3. Rate of change of cropland utilization in the YRD region: 2000–2020.
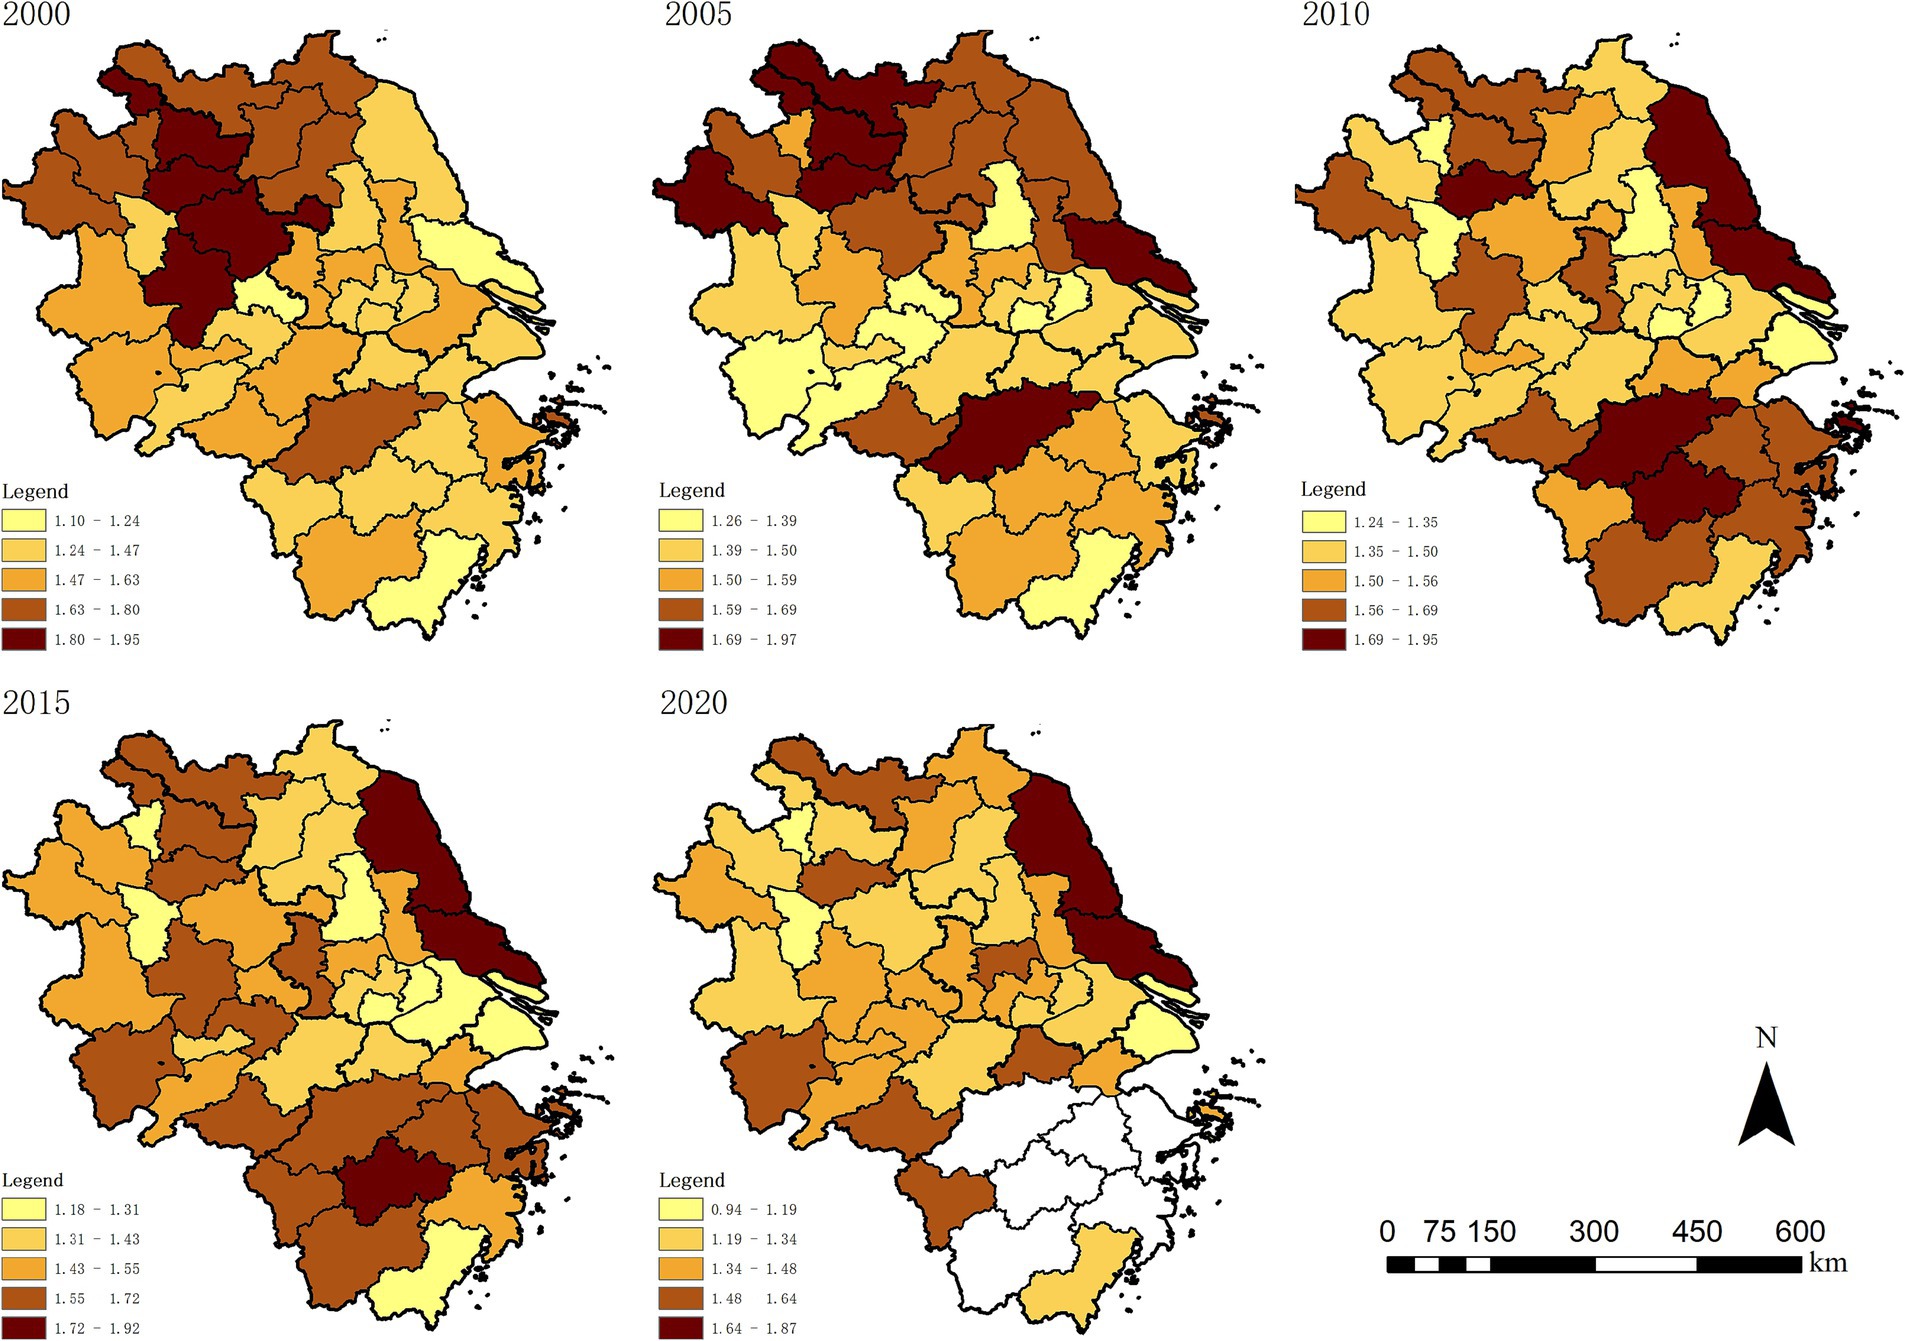
Figure 4. Evolution of spatial and temporal patterns of the Shannon diversity index for major crops sown in the YRD region: 2000–2020.
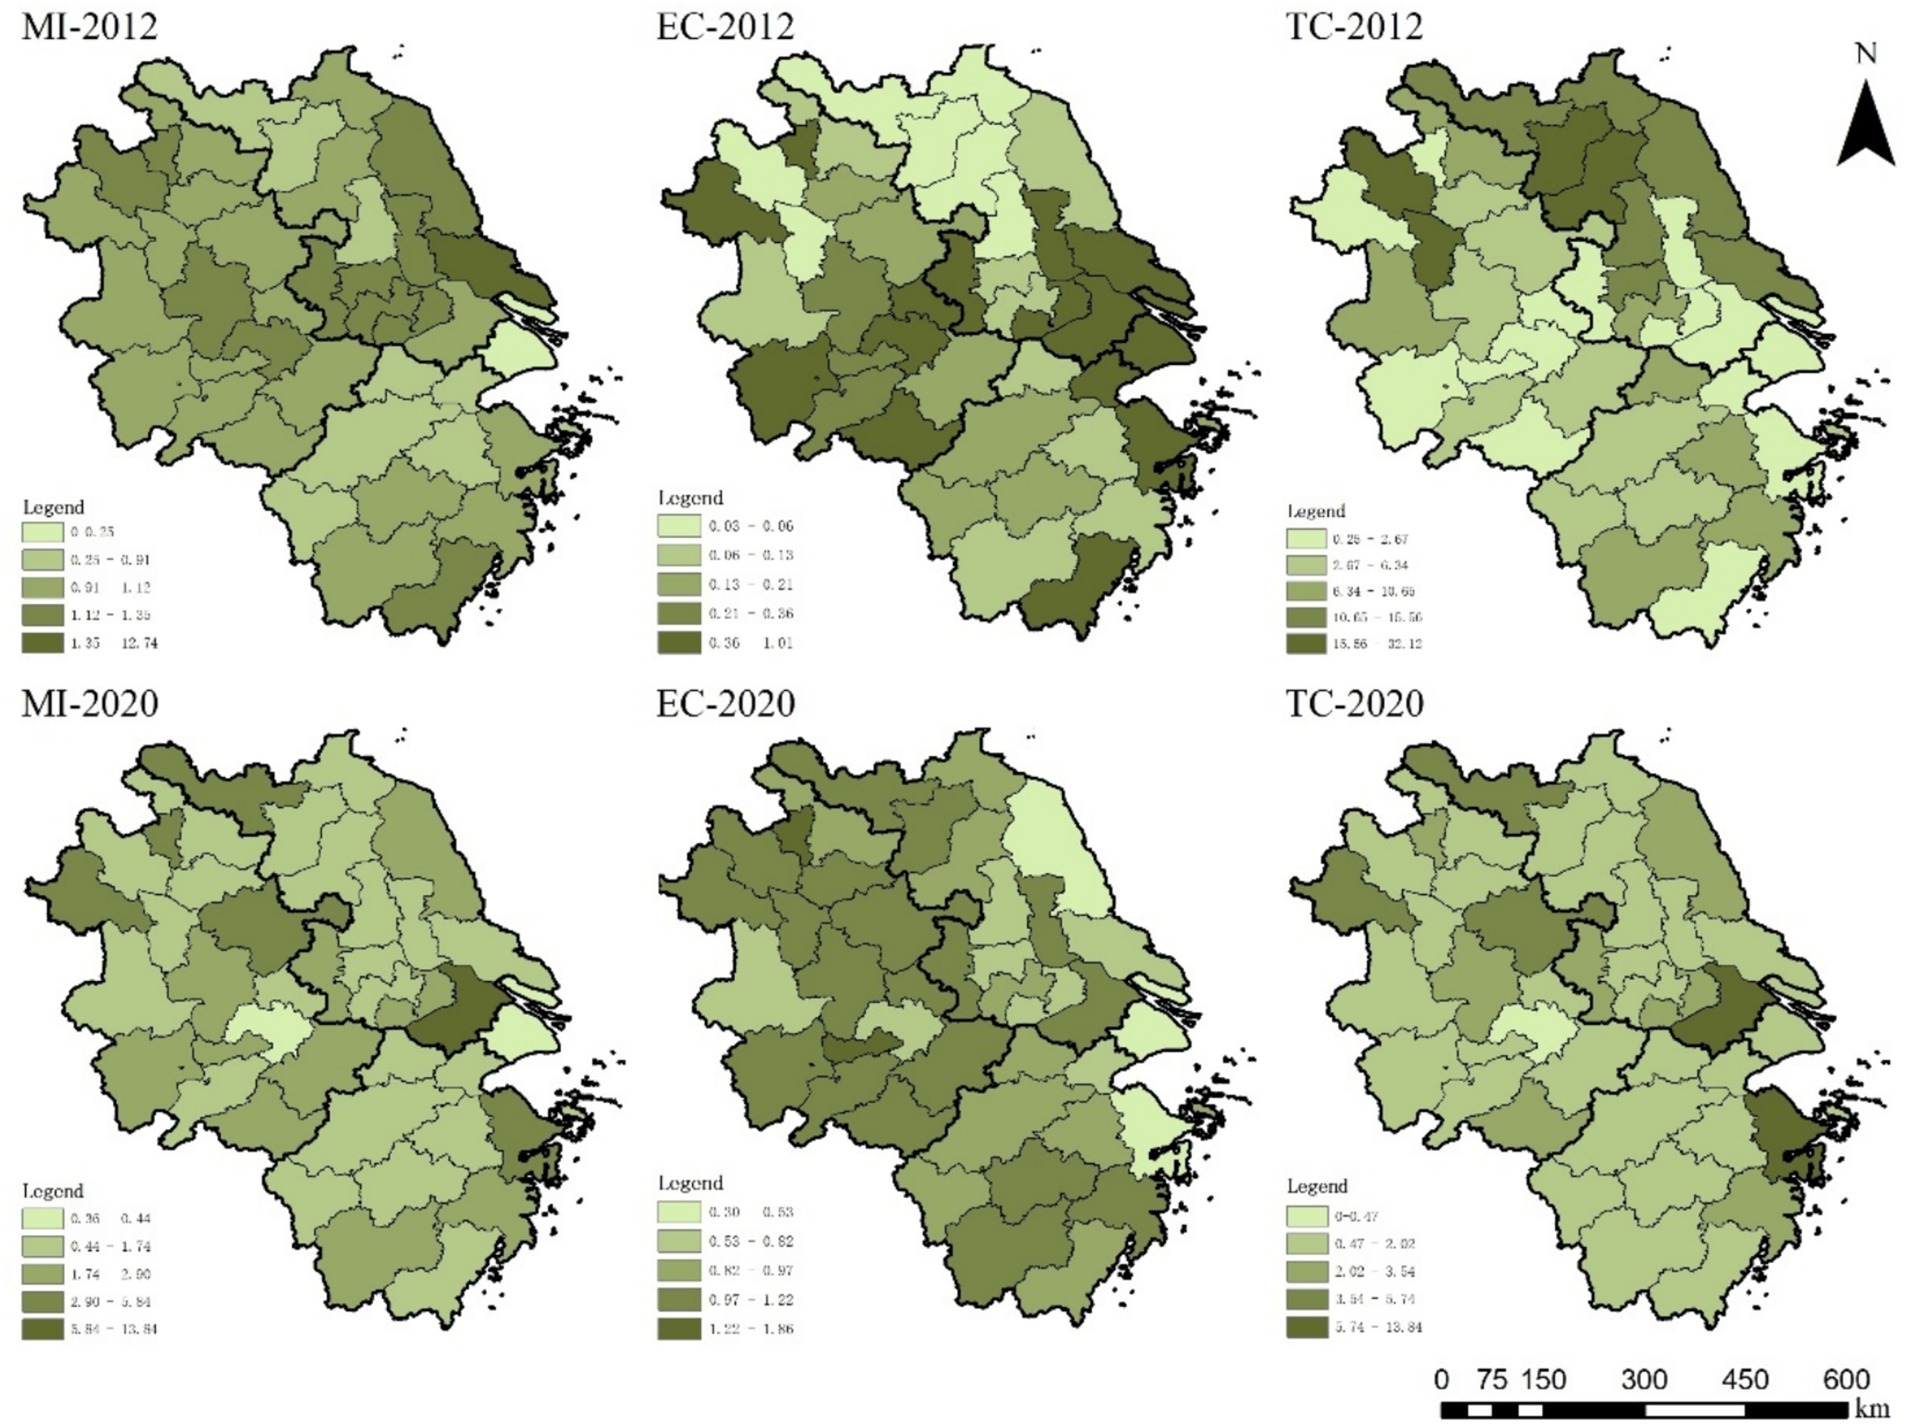
Figure 5. Spatial and temporal pattern of green total factor productivity in agriculture in the YRD 2011–2020.
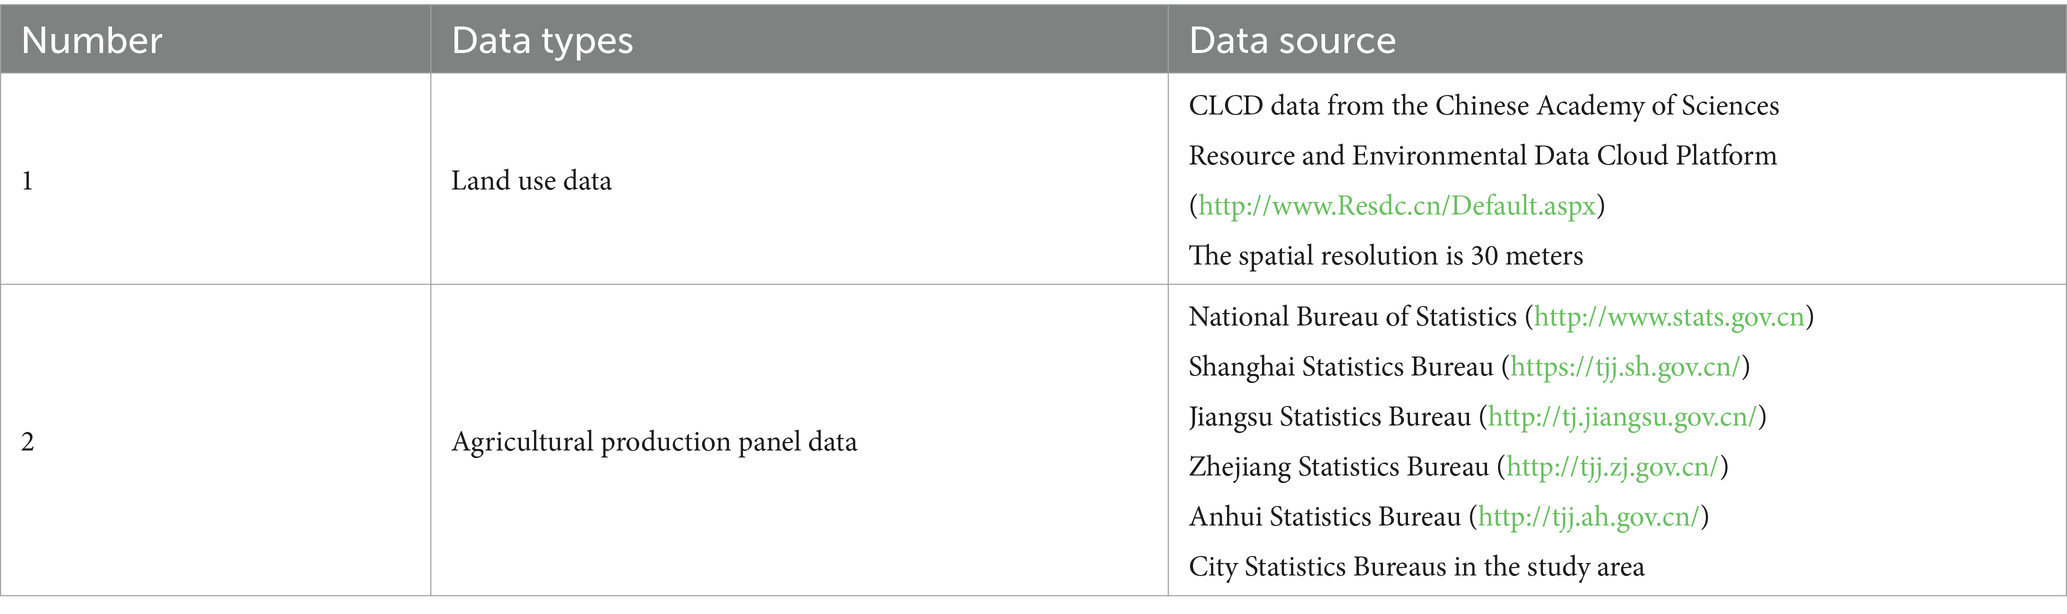
Table 1. Data source.
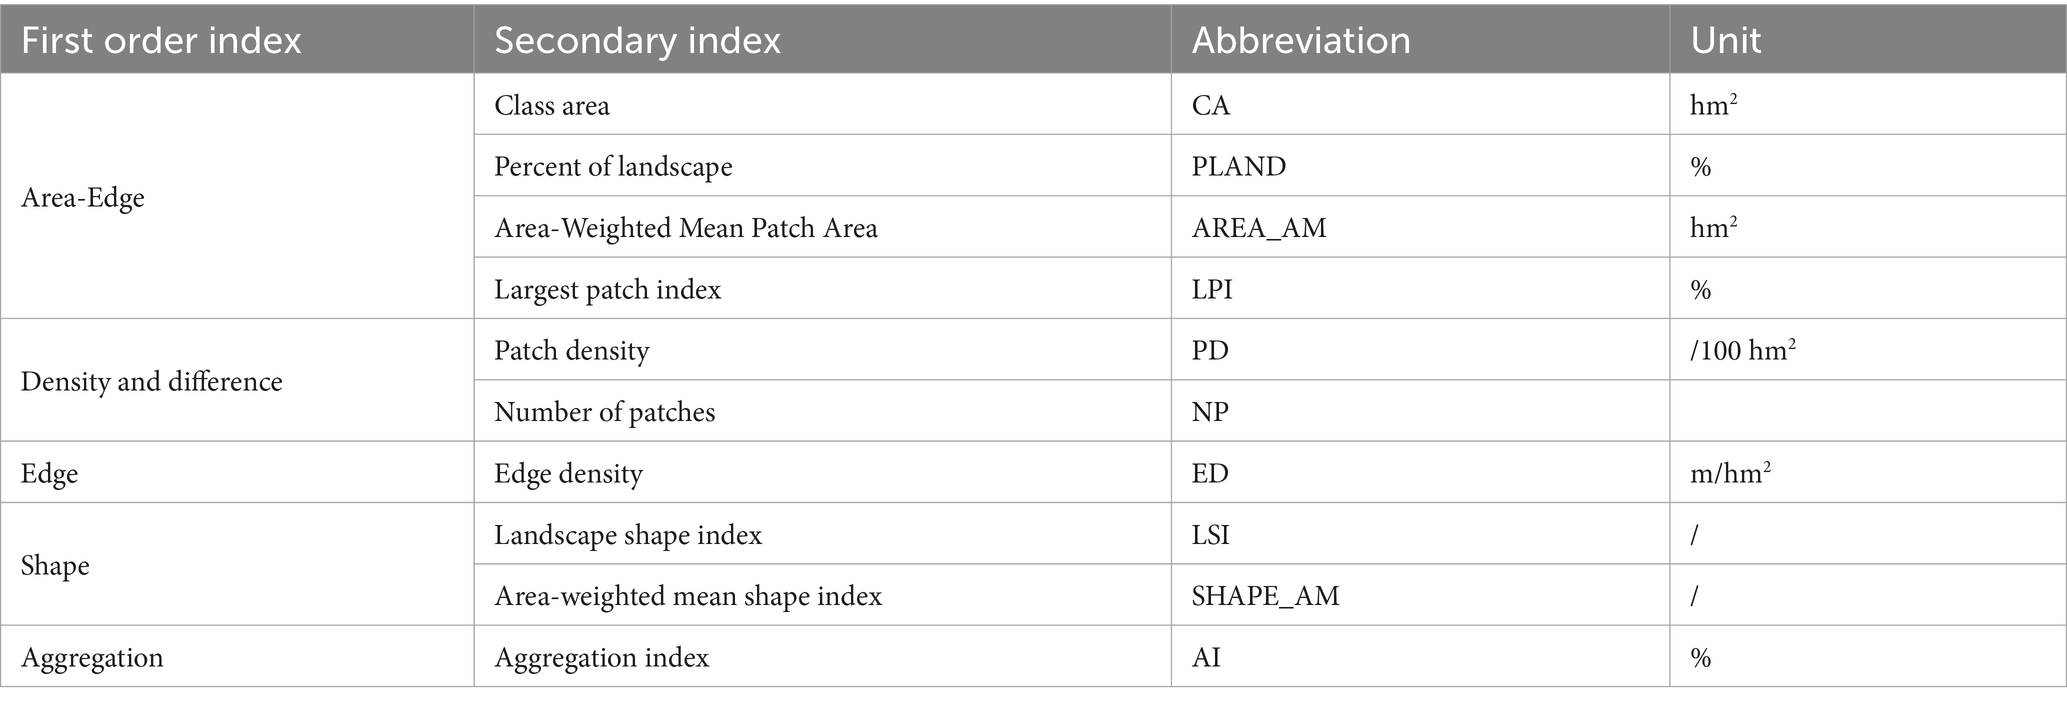
Table 2. Landscape pattern indices.
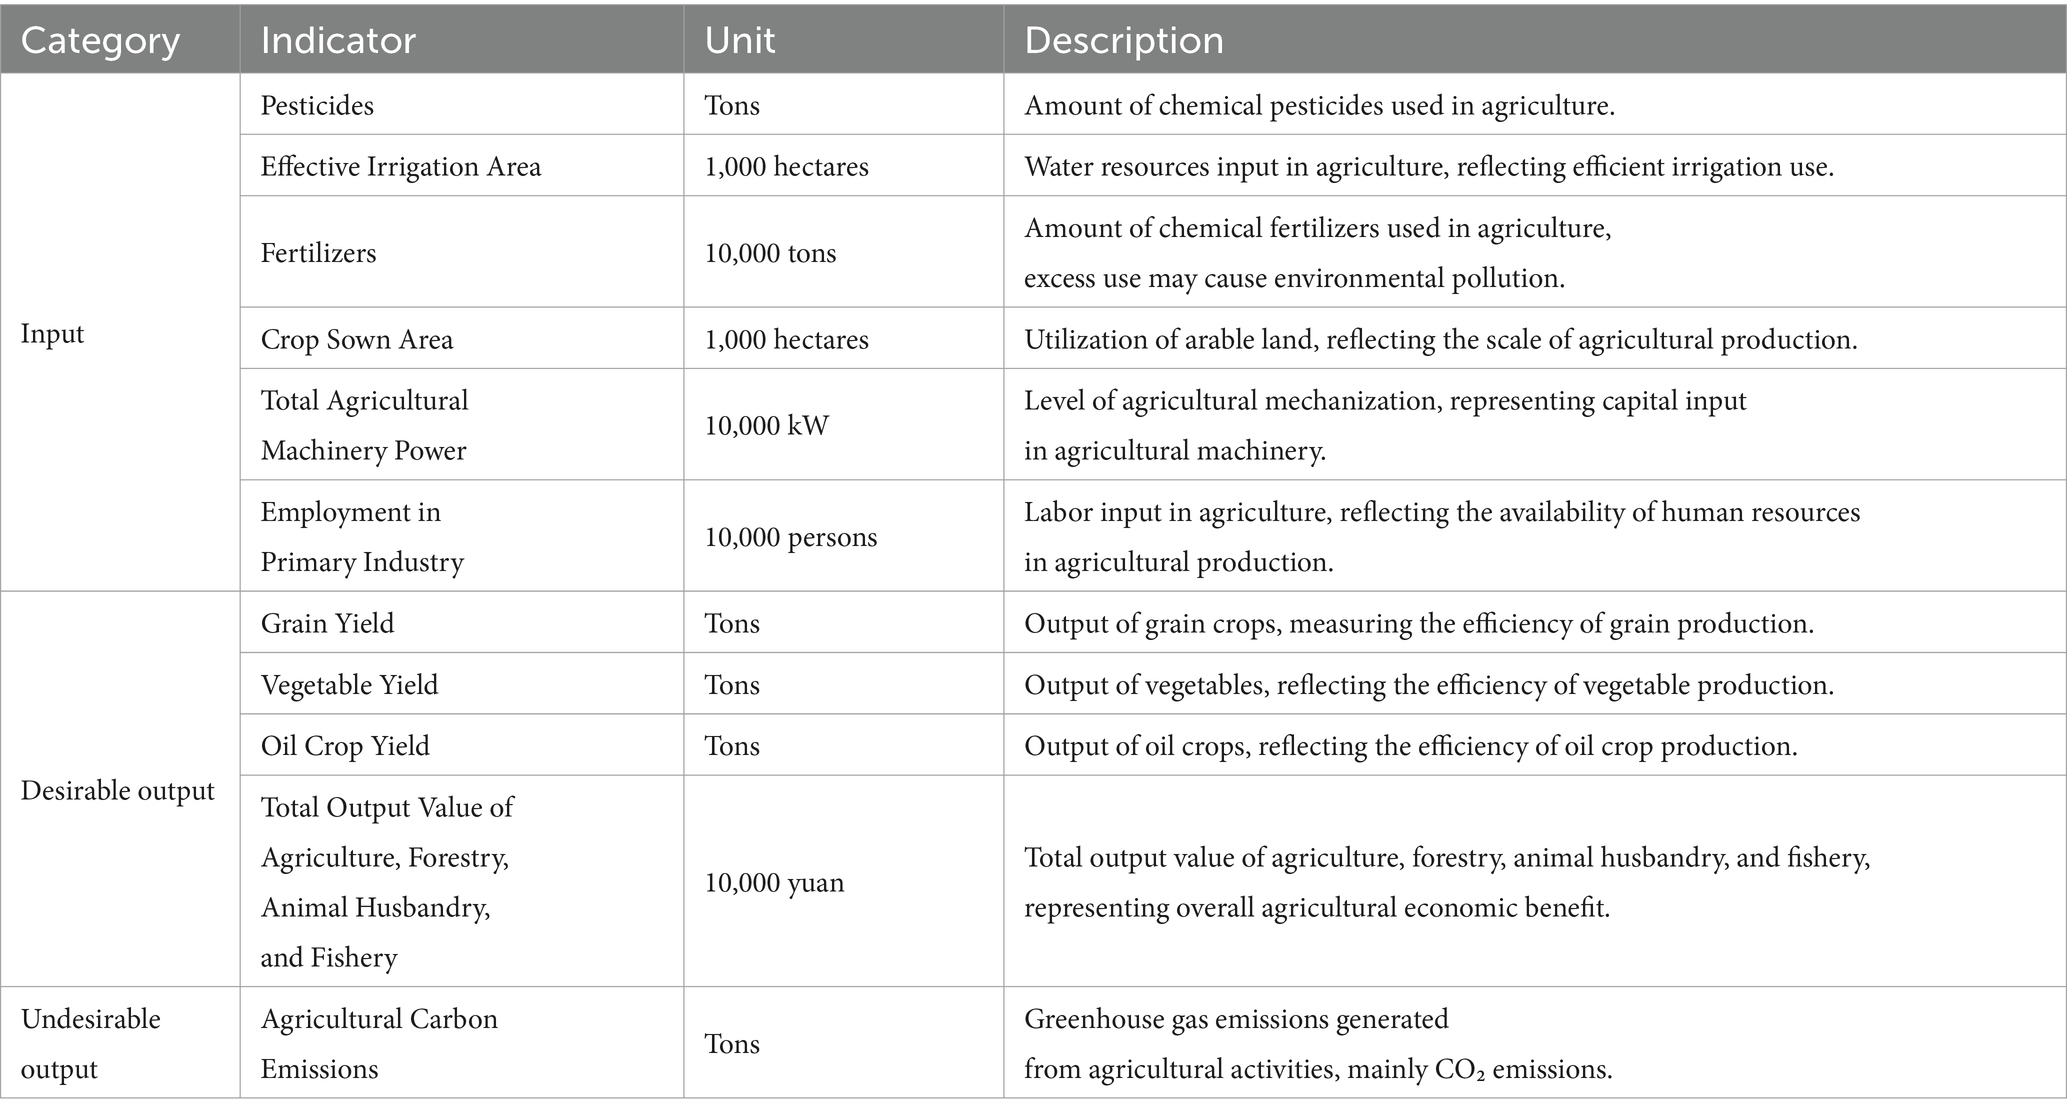
Table 3. Indicators for the calculation of GTFP.
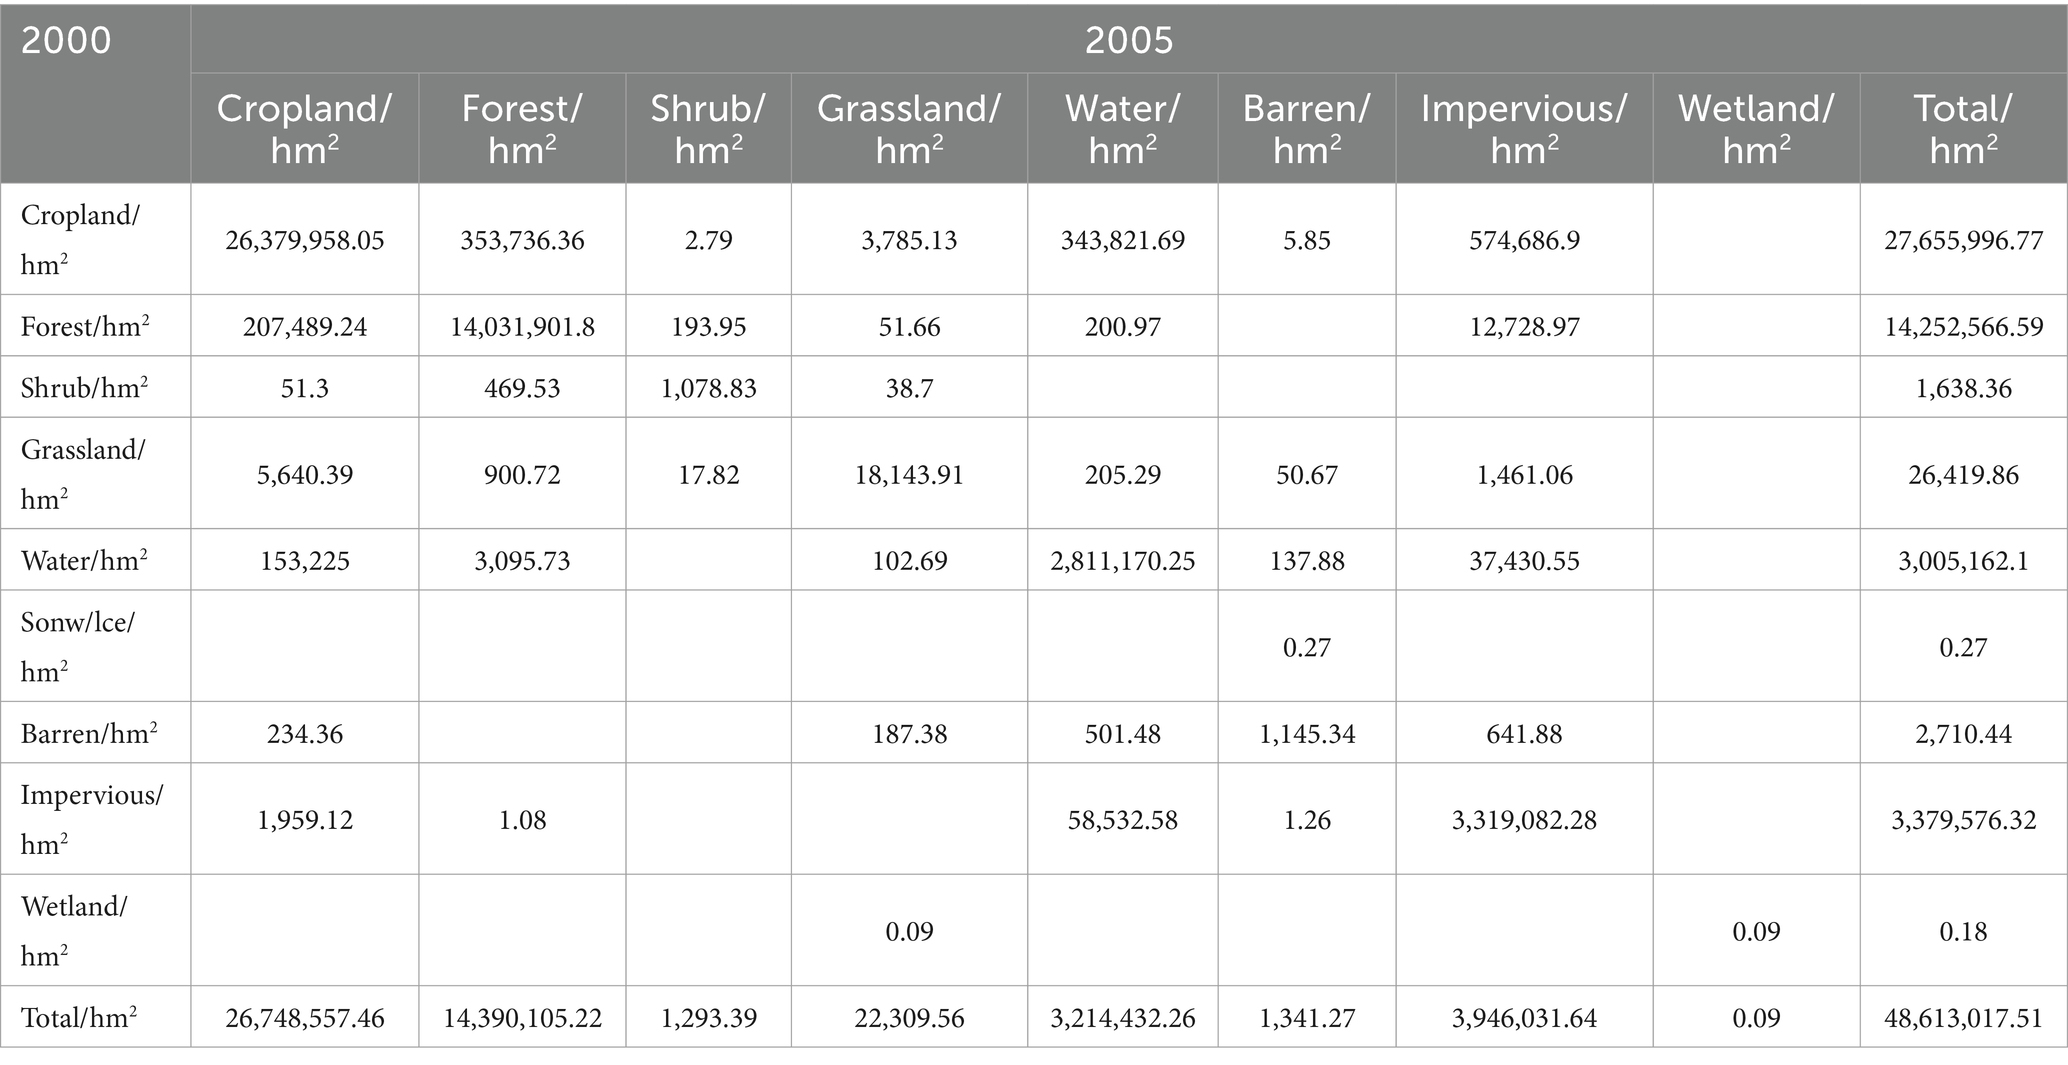
Table 4. Cropland utilization transfer moments in YRD: 2000–2005.
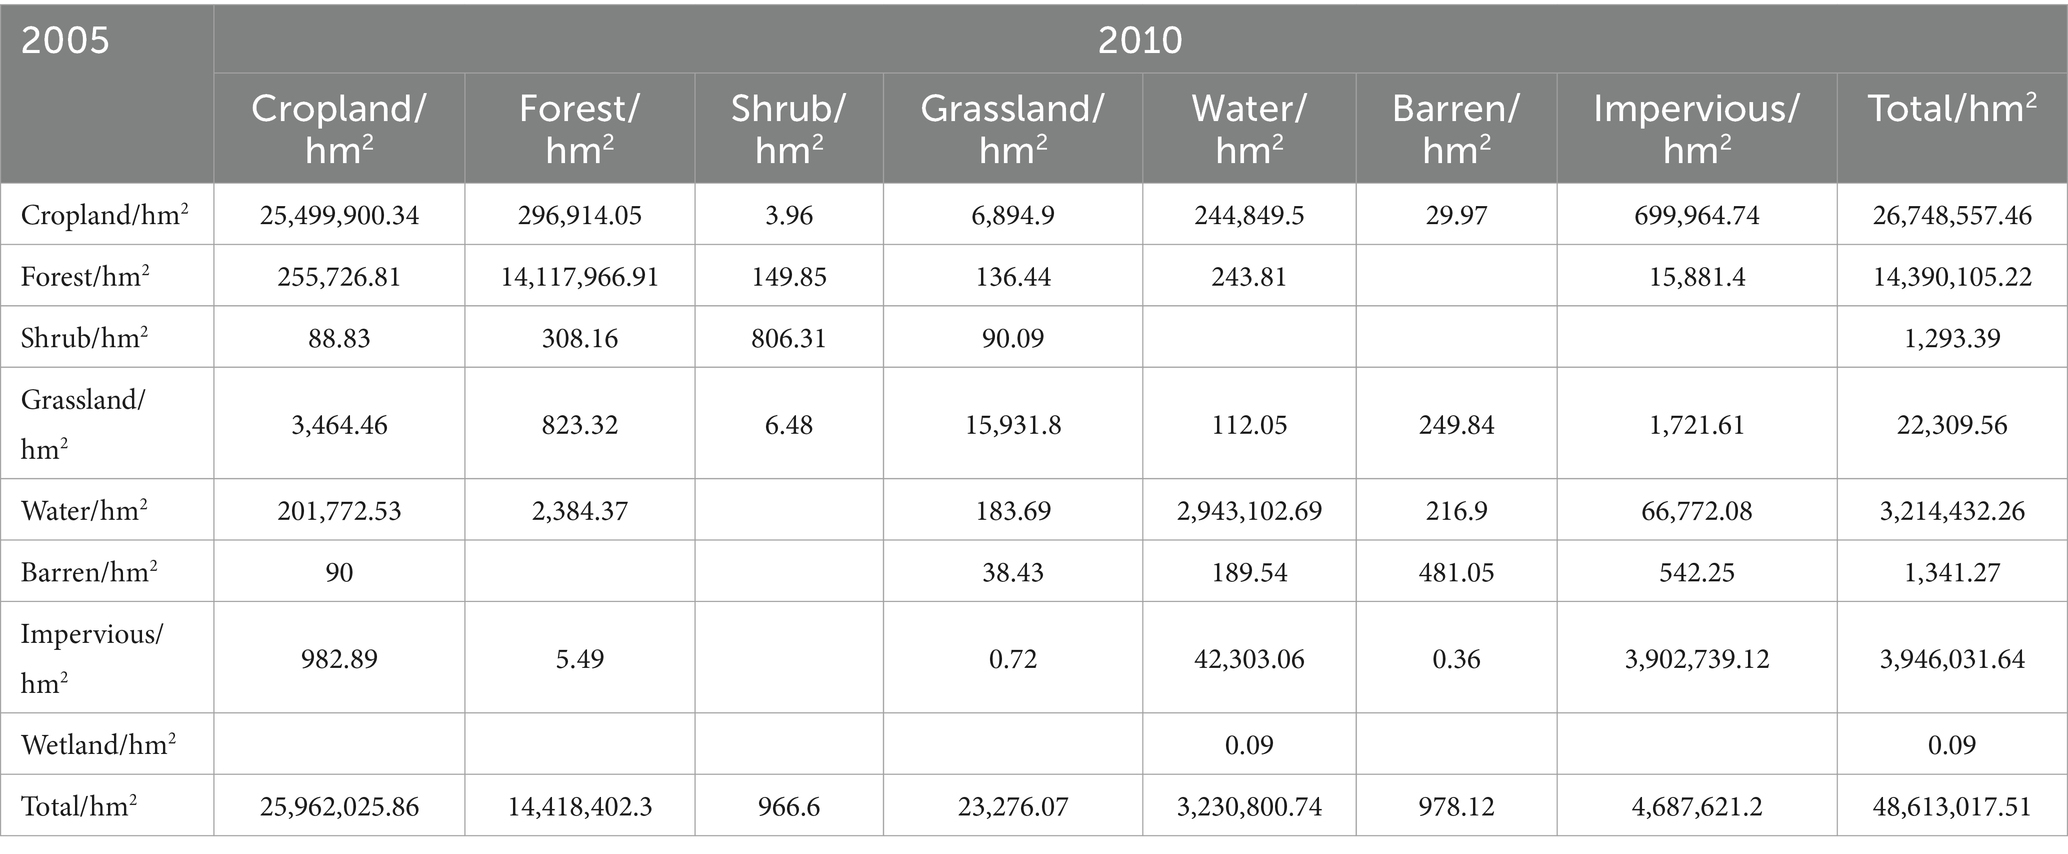
Table 5. Cropland utilization transfer moments in YRD: 2005–2010.
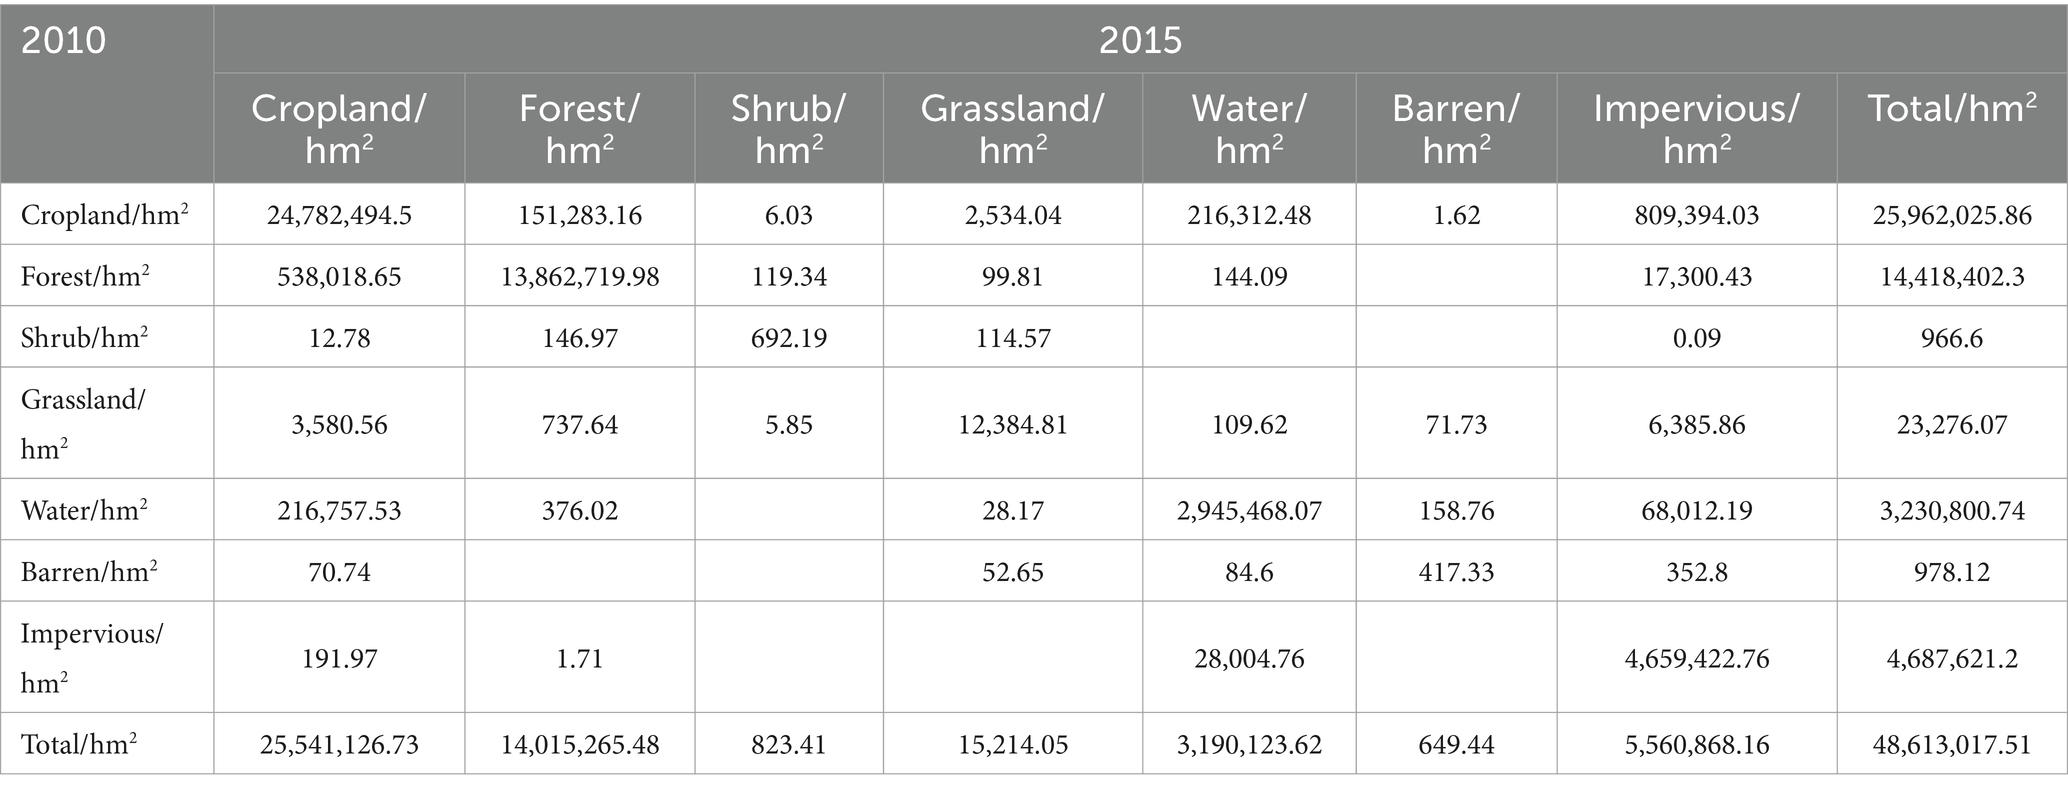
Table 6. Cropland utilization transfer moments in YRD: 2010–2015.
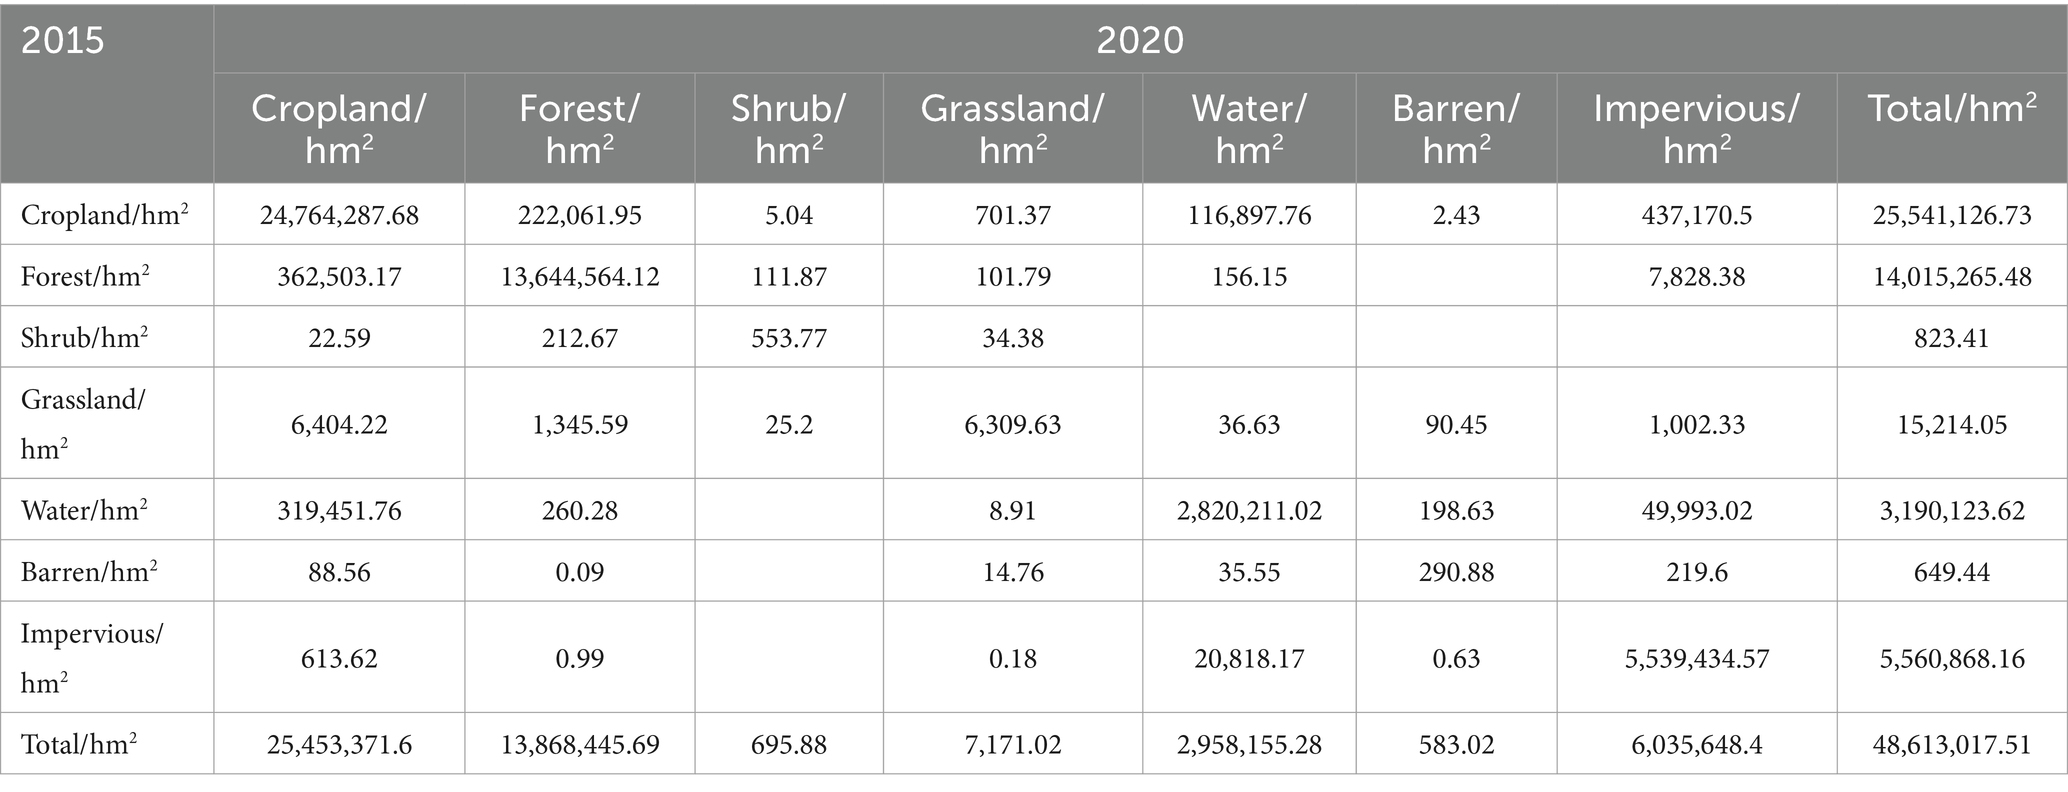
Table 7. Cropland utilization transfer moments in YRD: 2015–2020.
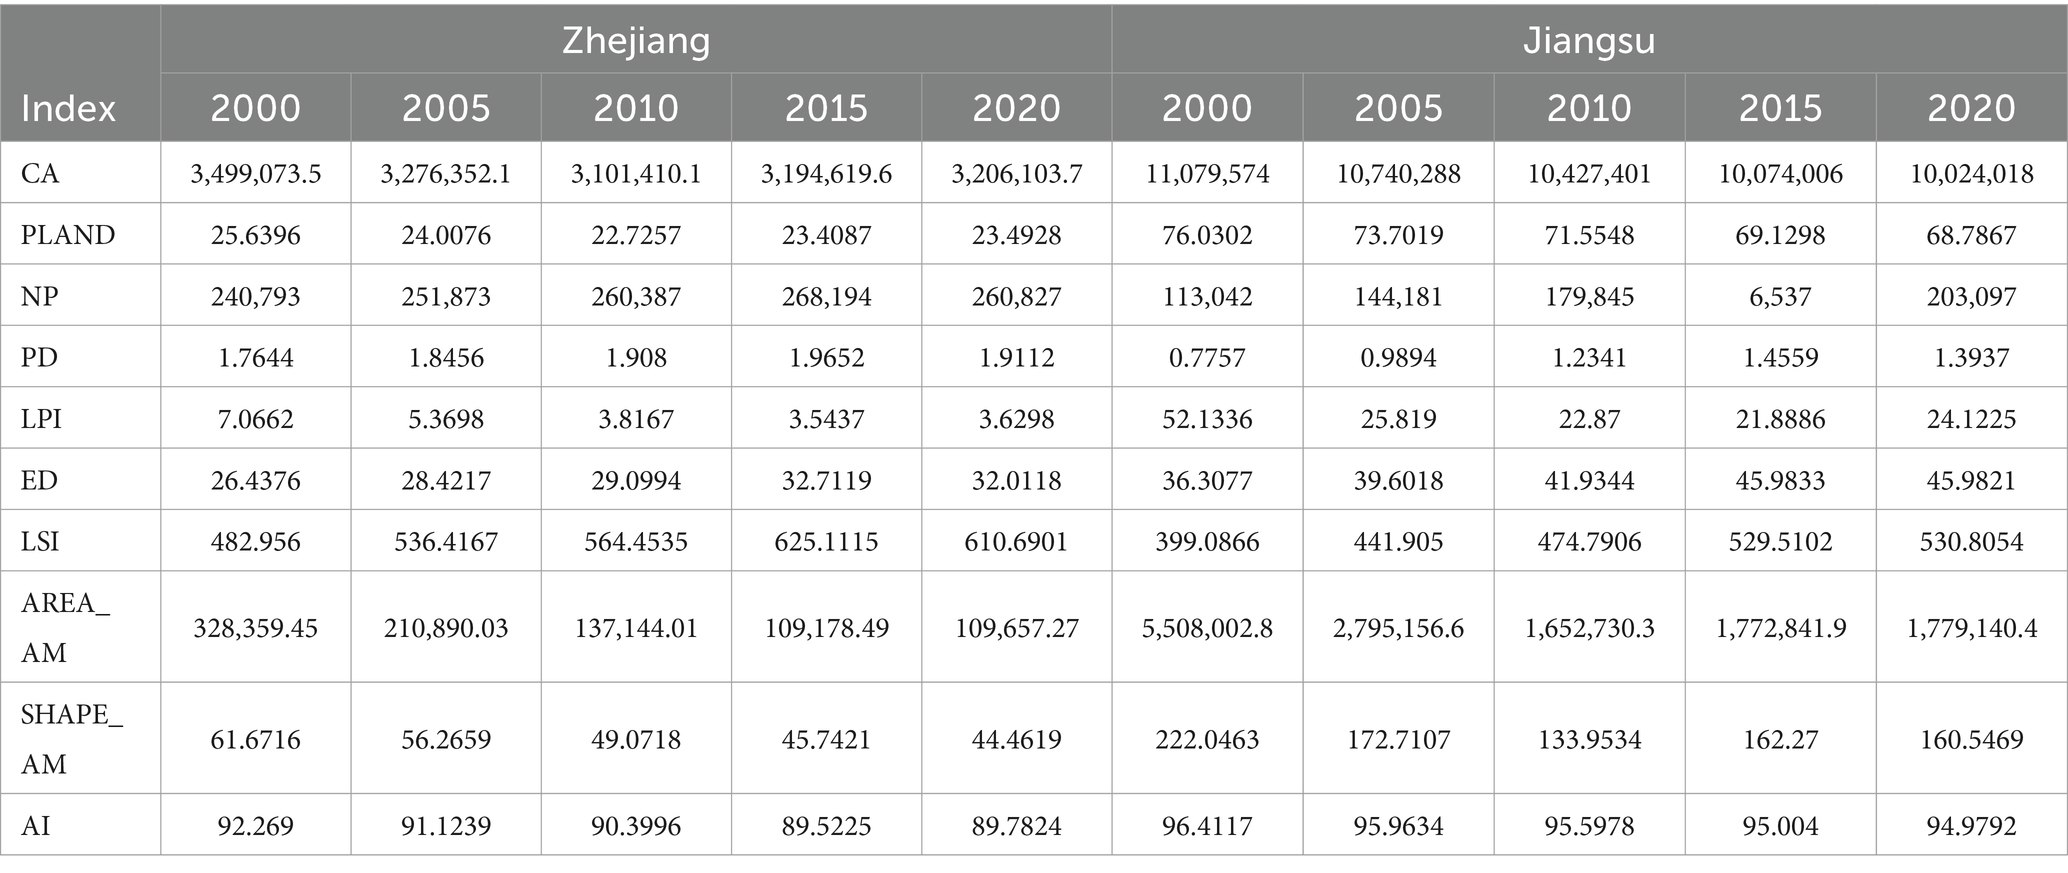
Table 8. Cropland landscape pattern index (Zhejiang and Jiangsu provinces: 2000–2020).
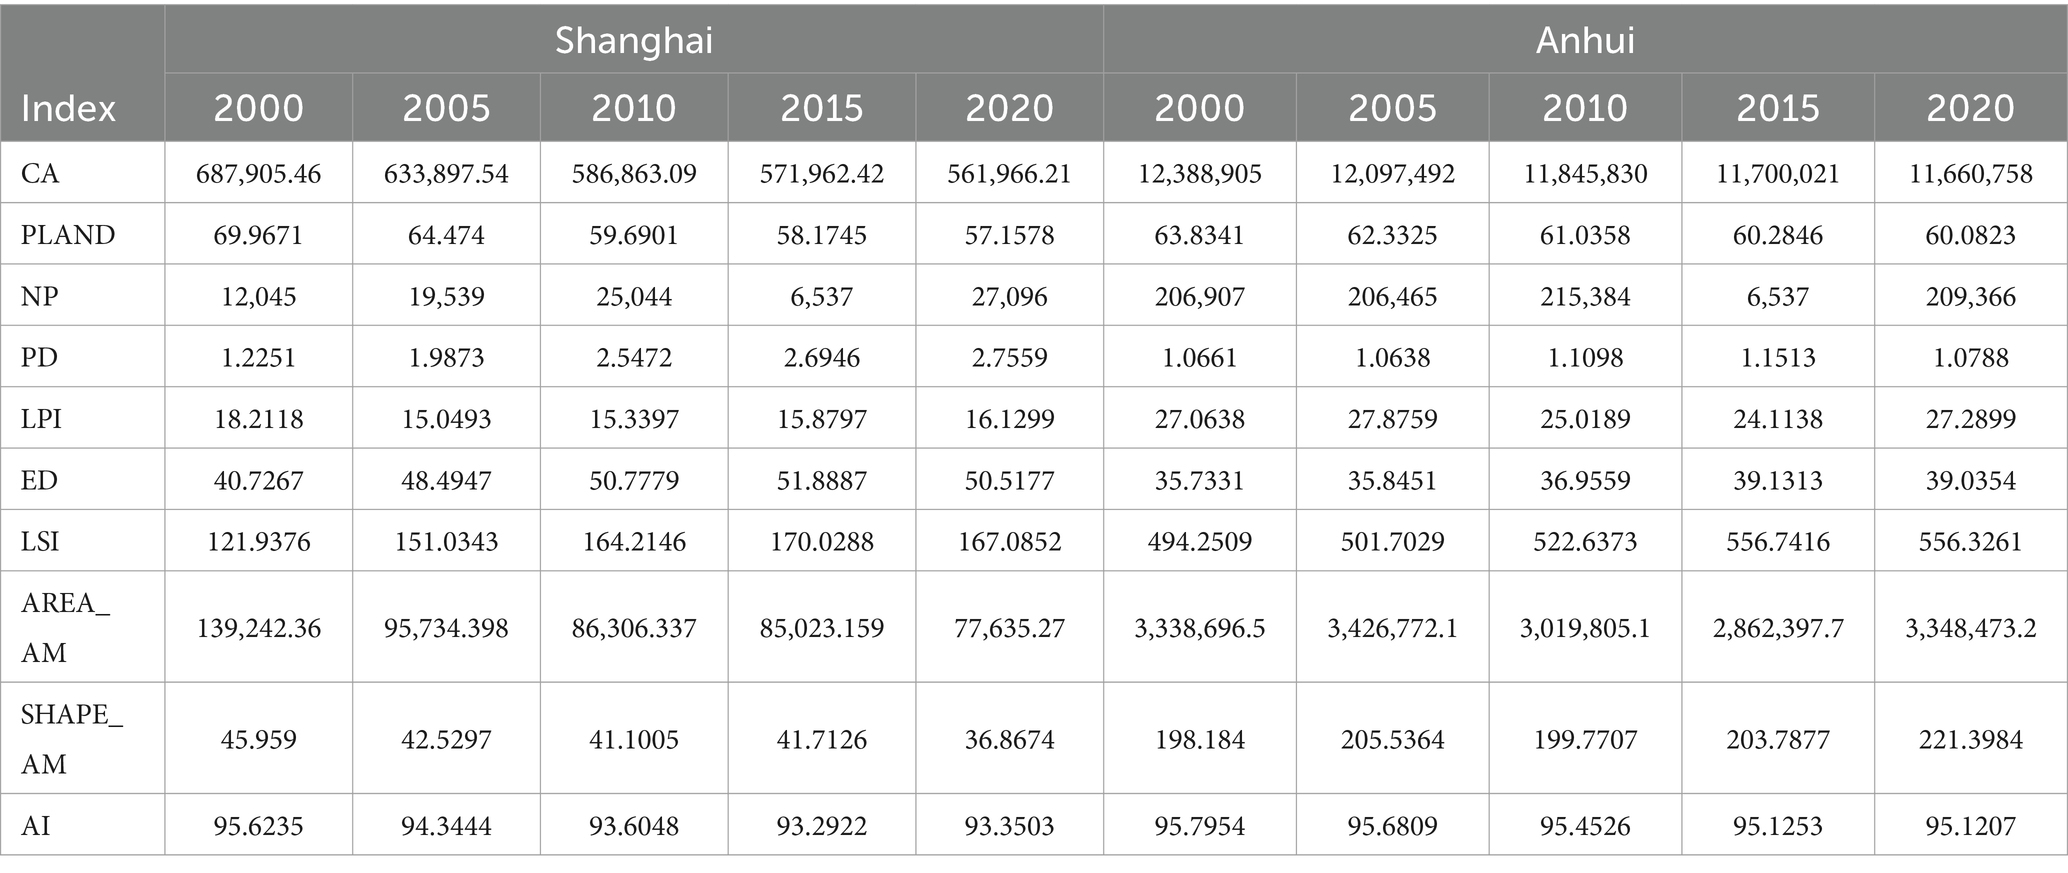
Table 9. Cropland landscape pattern index (Shanghai and Anhui Province: 2000–2020).
2.1.1 Data sources
The data used in this paper cover sub-regional land use data and agricultural production panel data in the YRD region from 2000 to 2020, and combined with panel statistics, mapping and spatial analysis methods, it provides a solid data foundation for the study of green innovation and transformation of municipal intensive farmland ecosystems in the YRD.
1. Land-use data: The land-use data used in this paper come from the CLCD data of the Cloud Platform for Resource and Environmental Data of the Chinese Academy of Sciences,1 with a spatial resolution of 30 meters, and the recognition accuracy of various land-use types is higher than 90%. The data includes nine major land use types such as cropland, forest land, construction land, etc., which can effectively reflect the trend of land use changes in the YRD region between 2000 and 2020 (Luo et al., 2017).
2. Agricultural production panel data: Sourced from the National Bureau of Statistics of China2 Shanghai Statistics Bureau,3 Jiangsu Provincial Bureau of Statistics,4 Zhejiang Provincial Bureau of Statistics5 and Anhui Provincial Bureau of Statistics,6 as well as the statistical bureaus of prefecture level cities. This data provides important support for assessing the utilization intensity of farmland ecosystems and changes in agricultural production patterns (Liu et al., 2020).
In order to ensure the accuracy and reliability of the data, this paper validates the subregional grain sown area and production data through the data provided by provincial and municipal statistical bureaus. The amalgamation of these multi-source data sets provides a robust foundation for spatial analysis, exploration of spatiotemporal characteristics, and study of influencing factors in this paper.
2.2 Research methodology
2.2.1 Land use change rate (LUCR)
The objective of this study is to assess the magnitude and speed of the dynamic changes of various land use types in the YRD region during the period of 2000–2020. To this end, the Land Use Change Rate (LUCR) method is employed. The LUCR has been demonstrated to quantitatively describe the trend and intensity of land use change between different points in time by calculating the magnitude of change of various land use types in adjacent time periods (Ning et al., 2018). Land Use Change Rate (LUCR).
The rate of land use change is calculated by the Equation 1:
Among them:
• is the area of a land use type at time t1;
• is the area of the type at time t2;
• LUCR is the rate of change (%) of the type over the t1 and t2 time periods.
This formula is employed to evaluate the intensity and rate of change of each land-use type between two specified points in time. A positive value of LUCR signifies an increase in the area of a specific land use type, while a negative value denotes a decrease in that area. The calculation of LUCR enables this study to make a comprehensive quantitative assessment of the different types of land use change.
2.2.2 Land-use transfer matrix
This study employs the land use transfer matrix method to quantitatively analyze the interconversion relationship between cropland and other land use types over different time periods. The land use transfer matrix is a quantitative tool that can reveal the dynamic change process between land use types by showing the interconversion of a certain type of land use at different points in time (Zhang and Lu, 2021; Niu et al., 2022).
The construction of land use transfer matrices for the following time periods was undertaken: 2000–2005, 2005–2010, 2010–2015, and 2015–2020. The objective of this undertaking was to comprehensively reveal the dynamics of cropland in the YRD region at different stages. By analyzing the inter-transformation of different land types, the long-term impacts of urban expansion, agricultural transformation, and ecological restoration on cropland patterns in the region can be assessed.
2.2.3 Landscape pattern index analysis
This study quantitatively analyzes the spatial distribution and quantitative scale of cropland by means of the Landscape Pattern Index (Lamine et al., 2018). Combined with the actual situation of intensive cropland in the YRD region, the following types of landscape pattern indices were selected for analysis in this study:
The remote sensing image data were first processed to obtain the spatial distribution of cropland at five time points (2000, 2005, 2010, 2015, and 2020). Image classification technology was used to categorize land use types at each time point, extracting the spatial information of cropland patches. Landscape pattern indices for these cropland patches were then calculated using FRAGSTATS4.2, which allowed the assessment of spatial patterns and fragmentation over time. Finally, the results of the pattern index were analyzed in combination with spatial and temporal trends in cropland use patterns in the YRD region over the past 20 years, revealing the evolutionary characteristics of cropland quantity, area, shape, and distribution during the urbanization process.
2.2.4 Shannon diversity index
In order to study the changes in the diversity of major crop planting structures during the green innovation transformation of agriculture in the YRD, this study introduced the Shannon Diversity Index (SDI) as a core indicator to measure the diversity of crop planting structures (Konopiński, 2020).
The Shannon diversity index (H′) was calculated as Equation 2:
Among them:
• H′: Shannon Diversity Index, larger values indicate higher diversity.
• S: Total number of crop species in the region.
• : The relative proportion of area occupied by crop i in the region, i.e., the proportion of area planted with crop i to the total area planted with the crop.
• : Take the natural logarithm of the relative area of the crop.
The index takes into account not only the number of crop species, but also the proportion of area planted with different crops, thus reflecting the abundance and evenness of distribution of crop species. In this study, five time points, 2000, 2005, 2010, 2015, and 2020, were selected to collect data on the area planted to major crops. Major crops include cereals (e.g., rice, wheat, corn, beans, sweet potatoes), oilseeds (e.g., peanuts, rapeseed), cotton, hemp, sugar, and vegetables.
2.2.5 Green Total Factor Productivity (GTFP) calculation
Green Total Factor Productivity (GTFP) is an important indicator of technological progress and management efficiency change in the production system. The present study employs the Malmquist productivity index in conjunction with technical efficiency change (EC) and technological change (TC) to facilitate an exhaustive examination of agricultural production efficiency in disparate years and metropolitan areas (Liu et al., 2021).
The GTFP calculation method is predicated on the Data Envelopment Analysis (DEA) model and the Malmquist Productivity Index. It has the capacity to assess the increase or decrease in agricultural productivity in different regions at different times, especially after the introduction of environmental costs (undesired outputs) on the application of green technologies and the development of environmentally friendly agriculture (Yang et al., 2022). In this study, the following input, desired output and non-desired output indicators were selected in the GTFP calculation:
Based on multi-city and multi-year agricultural production data, this study used the Malmquist Index (MI) to measure the green total factor productivity of agricultural production in 41 cities in the YRD region during the period 2011–2020. The Malmquist Index (MI) was calculated as Equation 3:
Among them:
MI denotes changes in total factor productivity. EC denotes changes in technical efficiency, reflecting changes in resource allocation and management levels across cities. TC denotes technological progress, reflecting advances and innovations in production technology.
3 Results
3.1 Characteristics of spatial and temporal transformation of arable land use
3.1.1 Spatial and temporal characteristics of arable land utilization
Between 2000 and 2020, the arable land area of the four provinces and cities in the YRD region (Anhui, Jiangsu, Zhejiang, and Shanghai) generally decreased, especially in Jiangsu and Shanghai. Overall, economic development, urban expansion and industrialization in the YRD region have brought about significant impacts on arable land resources.
Despite the relatively slow rate of urbanization in Anhui Province, the area of arable land has been encroached upon as a result of the accelerated process of industrialization. Moreover, the pursuit of economic growth and the development of infrastructure have exerted persistent pressure on arable land resources. Jiangsu Province has witnessed the most substantial contraction in cropland area, with a decline of 7,571.76 hm2 over the span of two decades. Jiangsu Province, a prominent economic powerhouse within the YRD region, has undergone rapid urbanization and industrialization, placing substantial pressure on its arable land resources. Specifically, between 2000 and 2010, Jiangsu experienced a substantial decrease of approximately 4,647 hm2 in arable land area, primarily attributable to demands for urban expansion and industrial zone construction. In comparison, Zhejiang Province witnessed a decline in cropland from 26,619.47 hm2 in the year 2000 to 24,583.35 hm2 in 2020, marking an approximate reduction of 2,036 hm2. In comparison with Jiangsu Province, the decline in arable land in Zhejiang Province is comparatively modest. Zhejiang Province has adopted a diversified economic development model, one that emphasizes high-value-added industries while implementing stringent measures to protect its arable land. Conversely, Shanghai, a leading economic hub in China, has witnessed a substantial decline in its arable land, amounting to approximately 17% over the past two decades. The city’s arable land decreased from 5,102.58 hm2 in the year 2000 to 4,229.34 hm2 in 2020. This decline is attributable to the rapid urbanization of Shanghai, which has led to significant encroachment of urban expansion onto arable land. A particularly notable period occurred from 2000 to 2010, when arable land in Shanghai decreased at an accelerated rate of approximately 690 hm2 per decade.
3.1.2 Rate of change in cropland utilization
Overall from 2000 to 2020, most cities in the YRD region show a significant trend of decreasing arable land. In particular, the occupation of arable land by the rapid expansion of urbanization was more significant during the periods 2000–2005 and 2005–2010. The main reasons for the reduction of arable land include urban expansion, industrialization, infrastructure construction and changes in land use patterns.
2000–2005 and 2005–2010: The decrease in arable land is particularly significant, with the rate of change of arable land in some cities, such as Suzhou, Hangzhou and Wuxi, exceeding −10 per cent, demonstrating the strong demand for land resources as a result of urbanization. Especially in these economically developed areas, arable land resources are under greater pressure, and land resources are gradually being transformed to non-agricultural uses.
2010–2015 and 2015–2020: The decline in arable land has slowed down, and there is even a trend toward the recovery of arable land in some areas. With the implementation of ecological restoration policies and the promotion of green agricultural development, the area of Cropland in some cities has recovered, especially in some areas of Zhejiang Province.
From the time dimension, the trend of arable land reduction in the YRD shows obvious phase changes. In the early period (2000–2010), the rate of arable land reduction is relatively fast, reflecting the strong impetus of urbanization and industrialization. In the later period (2010–2020), on the other hand, the rate of cropland reduction tends to slow down, and cropland recovery occurs in some areas, indicating a gradual adjustment of land use policies. In the entire YRD region, the economically developed cities in Jiangsu and Zhejiang provinces (e.g., Suzhou, Hangzhou, Wuxi, and Wenzhou) experienced the most significant reduction in arable land. The rate of change of arable land in these cities is generally low, especially during the period 2000–2010, and the large reduction of arable land area is directly related to their rapid urbanization and expansion. As the core cities of the YRD, these cities have a greater demand for land due to population growth, industrial development and urban infrastructure construction, resulting in the gradual replacement of arable land resources by urban construction land and industrial land.
The trend of arable land reduction in cities such as Suzhou, Hangzhou, and Wuxi was most obvious during the period 2000–2010, with the rate of change of arable land once reaching more than −10%. Although the rate of arable land reduction slowed down in the later period (2015–2020), and some cities, such as Suzhou, even experienced arable land recovery, overall, the arable land resources in these areas are still under continuous pressure.
In contrast, some inland cities in Zhejiang Province (e.g., Quzhou, Shaoxing, Jinhua, and Lishui) had positive rates of change in cropland during 2010–2020, showing a significant trend of cropland restoration. This may be related to local ecological restoration projects, returning farmland to forests, and government policies to protect agricultural land.
Lishui (+36.83%) and Wenzhou (+12.67%): these cities have seen significant recovery of their arable land during 2010–2020, possibly due to policy support as well as the implementation of ecological restoration. Although the relative economic development of these regions is slow, their land use policies are tilted toward green transformation and ecological restoration, which promotes the recovery of arable land resources.
There are significant differences in the changes in cropland utilization between Jiangsu and Anhui provinces. Most cities in Jiangsu Province experienced a relatively large reduction in arable land during 2000–2010, which is closely related to the rapid urbanization and industrialization of the province as the core region of economic development in the YRD. Even in the later period (2015–2020), the trend of arable land reduction still exists, especially in Xuzhou and Jiaxing, where the reduction of arable land is still large. In contrast, some cities in Anhui Province (e.g., Hefei and Anqing) have relatively smoother changes in cropland utilization during 2015–2020, and some cities even show a trend of cropland recovery. This may be related to the relatively slow rate of urbanization in Anhui Province and the high degree of dependence on arable land resources for agricultural development in the province.
Shanghai, as a municipality directly under the central government, is relatively unique in terms of changes in arable land use: between 2000 and 2010, arable land in Shanghai declined significantly, and the rapid expansion of urban construction resulted in a large amount of arable land being converted to urban land. However, between 2015 and 2020, the rate of arable land reduction in Shanghai has slowed down, indicating that with the tightening of land resources, Shanghai may have adopted more stringent land management measures and optimized land use.
3.1.3 Cropland utilization transfer matrix
Cropland in the YRD region shows a clear decreasing trend between 2000 and 2020, which is categorized into the following stages.
2000–2005: initial phase of arable land reduction.
Cropland decreased 1,276,038.72 hm2 in 2005, a decrease of approximately 880,957.71 hm2. Of this, 353,736.36 hm2 of arable land was converted to forest, 343,821.69 hm2 of arable land was converted to water, and 574,686.9 hm2 was converted to Impervious land.
2005–2010: Continued reduction of arable land and increased pressure of urbanization.
Cropland decreased by 1,248,657.12 hm2 in these 5 years, of which 699,964.74 hm2 was converted into Impervious land, 296,914.05 hm2 into forests and 244,849.5 hm2 into water.
2010–2015: Decline in arable land slowing down.
Cropland area decreased by 1,179,531.36 hm2, of which 809,394.03 hm2 was converted into Impervious land, 216,312.48 hm2 was converted into water, and 151,283.16 hm2 was converted into forest.
2015–2020: arable land decline continues to slow, but urbanization persists.
Cropland area decreased by 776,839.05 hm2, of which 437,170.5 hm2 was converted into Impervious land, 222,061.95 hm2 into forests, 116,897.76 hm2 into water.
3.1.4 Landscape pattern of arable land
Cultivated landscapes in all four provinces have experienced significant fragmentation and decentralization over the past 20 years, especially in Jiangsu Province and Shanghai Municipality, where urban expansion has had a strong impact on cultivated landscapes, leading to a decrease in cultivated area, an increase in the number of patches, a rise in shape complexity, and a gradual fragmentation of the landscape. However, the cultivated landscapes in Anhui Province are relatively stable, and although the trend of fragmentation and decentralization exists, the magnitude of its change is relatively small, and the Cropland still maintains a high degree of aggregation. This suggests that the agricultural landscape in Anhui Province is less affected by urbanization, and still maintains a high degree of Cropland connectivity and a low degree of landscape fragmentation.
Cultivated landscapes in Jiangsu Province and Shanghai have suffered the most significant reduction in area, especially in Shanghai, which has been squeezed by high urbanization. As urban expansion intensifies, the area of cultivated landscapes is gradually replaced by other land use types. Zhejiang Province, too, has seen a decline in its cropland area, though the rate of change is less pronounced than in Jiangsu and Shanghai. Conversely, the cultivated landscapes in Anhui Province have undergone a decline, yet they have maintained a relatively high degree of stability. The most pronounced fragmentation of cropland landscapes was observed in Jiangsu and Shanghai, as evidenced by a significant increase in the number of patches (NP) and patch density (PD). This indicates that cropland landscapes in these regions have become fragmented into smaller, more dispersed patches. This fragmentation may have negative ramifications for landscape connectivity, ecosystem services, and the sustainability of agricultural production. The trend of landscape fragmentation was also more pronounced in Zhejiang Province, but the degree of fragmentation was slightly lower than in Jiangsu and Shanghai. Conversely, the landscape fragmentation process of cropland in Anhui Province exhibited a more moderate trend, with the landscape maintaining a high degree of continuity and aggregation. Specifically, the following indicators reflect in detail the characteristics of the spatial and temporal transformation of cropland utilization.
Area-edge indicator:
CA (Class Area): Jiangsu and Anhui provinces have the largest areas of cultivated land, 10,042,018.38 ha and 11,660,757.57 ha, respectively, indicating that they are still predominantly agricultural provinces. However, the area of Cropland in all four provinces has declined over the 20-year period, especially in Shanghai, from 687,905.46 ha in 2000 to 561,966.21 ha in 2020, indicating that urbanization has squeezed the area of Cropland most significantly.
PLAND (Percent of Landscape): The proportion of arable land in the landscape area shows a decreasing trend in all provinces. The PLAND values of Jiangsu and Anhui provinces are 68.79 and 60.08%, respectively, in 2020, while those of Zhejiang and Shanghai decrease to 23.49 and 57.16% respectively, indicating that the proportion of arable land in the overall land use in these regions is gradually decreasing, especially in Shanghai, which is strongly affected by urban expansion.
AREA_MN (Mean Patch Area): Anhui Province has the highest AREA_MN value of 139,242.33 square meters in 2020, indicating that its cropland landscapes are relatively intact and less fragmented. In contrast, Shanghai has the lowest AREA_MN value of 77,635.27 square meters, indicating that the arable land is divided into smaller units with the most serious fragmentation.
LPI (Largest Patch Index): The LPI values of the four provinces show a decreasing trend, especially in Jiangsu Province, from 52.13 in 2000 to 24.12 in 2020, indicating that the dominant position of the largest patches of Cropland in the landscape is gradually weakening, and the landscape is becoming more fragmented. The LPI value of Shanghai also declined from 18.21 to 16.12, reflecting that urbanization has a greater impact on the importance of the dominant patches of cropland landscapes.
Density and difference indicator (Density and difference):
NP (Number of Patches): The NP values for Jiangsu Province and Shanghai Municipality increase significantly, from 113,042 and 12,045 to 203,097 and 27,096, respectively, indicating increasing fragmentation of cultivated landscapes. The NP value also increased in Zhejiang Province, which was 260,827 in 2020, showing further fragmentation of cropland. In contrast, the NP value in Anhui Province is relatively stable at 209,366 in 2020, indicating a more moderate trend of cropland fragmentation in the province.
PD (Patch Density): Shanghai’s PD value increases from 1.23 in 2000 to 2.76 in 2020, reflecting the most significant landscape fragmentation. The PD value of Jiangsu Province increases from 0.78 to 1.39, showing that the degree of fragmentation is also increasing. Zhejiang Province has a relatively high PD value, indicating that the number of its cropland patches is increasing. The PD value of Anhui Province, on the other hand, changed less, indicating that the cropland landscape was relatively stable.
Edge indicator (Edge):
ED (Edge Density): The ED value of Jiangsu Province increased from 36.31 in 2000 to 45.98 in 2020, indicating that the complexity of the landscape boundaries of arable land increased significantly and landscape fragmentation intensified. The ED value of Shanghai increased from 40.72 to 50.52, indicating that urbanization led to the increasing complexity of the boundaries of cropland patches. The ED value of Zhejiang Province increased from 26.44 to 32.01, with a smaller change, while the ED value of Anhui Province increased from 35.73 to 39.05, showing that the boundary complexity of its cropland landscapes increased more gently.
Shape indicator (Shape):
LSI (Landscape Shape Index): The LSI values of the four provinces have increased, especially the LSI values of Jiangsu and Zhejiang provinces have increased significantly, from 399.09 and 482.96 in 2000 to 530.81 and 610.69 in 2020, respectively, indicating that the shapes of cropland patches are becoming more complex and irregular. The LSI value of Shanghai is relatively small, but it also increases from 151.04 to 167.08, showing the change in the shape of cropland due to urbanization. The LSI value of Anhui Province increased from 494.25 to 556.33, showing that the complexity of its patch shape is gradually increasing, but the change is relatively mild.
SHAPE_AM (Mean Shape Index): The mean shape index (SHAPE_AM) reflects the uniformity of patch shape. Zhejiang Province’s SHAPE_AM decreases from 61.67 in 2000 to 44.46 in 2020, indicating that the shape of its cropland tends to be simpler. SHAPE_AM also decreased in Jiangsu and Shanghai, indicating that the complexity of the shape of the patches was simplified in some aspects. SHAPE_AM in Anhui Province, on the other hand, remained relatively stable.
Aggregation indicator (Aggregation):
AI (Aggregation Index): The AI values of Jiangsu Province and Shanghai Municipality decreased from 96.41 and 95.62 in 2000 to 94.98 and 93.35 in 2020, indicating the gradual dispersion of cultivated landscapes and increased fragmentation. The AI value of Zhejiang Province decreased from 92.27 in 2000 to 89.78 in 2020, indicating the gradual dispersion of cropland patches and the obvious trend of landscape fragmentation. The AI value of Anhui Province has the smallest change, decreasing from 95.80 to 95.12, indicating that its cultivated landscapes still maintain a high degree of aggregation.
3.2 Characteristics of the transformation of the structure of agricultural production
Based on the Shannon Diversity Index of the agricultural cropping structure of 41 cities in the YRD from 2000 to 2020, this study will analyze these data from three aspects: the overall trend of change, regional differences, and the specific situation of each city.
Overall trend of Shannon’s diversity index
General trend: The Shannon Diversity Index for most cities shows a fluctuating trend between 2000 and 2020. The index has increased in some cities, indicating a wider variety of crops and a more balanced cropping structure in these areas, while the index has decreased in some cities, indicating a homogenization of the cropping structure.
Changes in 2020 compared to 2000: Overall, the Shannon Diversity Index in 2020 shows a varying degree of increase compared to 2000, especially in some large cities and areas with faster economic development, where the diversity of the planting structure has been enhanced.
Analysis of regional differences
Cities in Jiangsu Province (e.g., Nanjing, Wuxi, Suzhou, Xuzhou, etc.) have significant differences in the diversity of planting structures: the Shannon Index in Nanjing is 1.44 in 2020, which overall has remained stable since 2000 with small fluctuations, indicating that the agricultural structure in Nanjing is relatively stable. The value of the index in Wuxi changed less in 20 years and was 1.32 in 2020, showing that the agricultural structure in Wuxi did not change significantly, which may be related to the high degree of urbanization and industrialization in Wuxi, with a relatively homogeneous agricultural cultivation structure. The Shannon Diversity Index of Nantong and Yancheng is 1.79 and 1.87 in 2020, showing a more diverse planting structure, especially in Yancheng, where the Shannon Index has increased significantly since 2000, indicating a gradual increase in the diversity of crop species.
The Shannon Diversity Index of cities in Zhejiang Province shows an overall high level: in 2020, the Shannon Diversity Index of Hangzhou reached 1.73, maintaining a high level, showing that Hangzhou’s agricultural cultivation structure is more diverse. The index reaches 1.66 in 2020, steadily increasing since 2000, indicating a gradual diversification of agricultural cropping structures in Ningbo. Although the Shannon Diversity Index was high (1.43) in 2000, it declined after 2015 to 1.39 in 2020, showing that Jiaxing’s cropping structure tends to be more homogenized.
Cities in Anhui Province show significant changes in cropping structure: the Shannon Index in Hefei decreases from 1.95 in 2000 to 1.42 in 2020, indicating a trend of concentration in the agricultural structure, probably due to accelerated urbanization and the transformation of agricultural production methods. The Shannon Index of Bengbu is 1.57 in 2020, decreasing compared to 1.94 in 2000, indicating a gradual centralization of the cropping structure over the past 20 years. Huangshan’s Shannon Index is relatively stable, at 1.59 in 2020, and the diversity of agricultural planting structures remains at a high level.
Shanghai’s Shannon Diversity Index was 1.45 in 2000 and declined to 0.94 in 2020, a large decrease. As a highly urbanized area, Shanghai’s agricultural cropping structure tends to be extremely concentrated, probably due to the expansion of urban land, the shrinkage of agricultural land, and the gradual homogenization of cropping structure.
3.3 Transformative performance of green production in agriculture
From the perspective of the four provincial capital cities, the MI value of Shanghai improves from 0.25381 to 1.4683 from 2012 to 2020, meanwhile, the TC value is higher in the later period. It shows that in the late period Shanghai has significantly improved in technological progress. The MI value of Nanjing increases significantly from 1.1580 to 4.0458, which shows great technological progress and indicates that Nanjing adopts more advanced technologies in the agricultural production process. Hangzhou’s MI value grew from 1.1956 to 1.8895, indicating good performance in technological progress, which drove total factor productivity growth. In 2016, Hefei’s MI value was 0.8202, indicating mediocre technological efficiency performance and slower technological progress in that year. By 2020, the MI value has risen to 1.1229, with a TC value of 1, indicating enhanced technical progress and a steady increase in total factor productivity.
The cities of Nanjing, Wuxi, and Xuzhou in Jiangsu Province showed stable performance in terms of technical efficiency and gradually enhanced technical progress after 2016, with a significant increase in MI. This is related to the promotion of local agricultural technology and the optimization of resource management. Cities such as Nantong and Suzhou have relatively stable total factor productivity growth, and the TC value shows greater technological progress, indicating better continuity in the adoption of agricultural technologies. Cities such as Hangzhou, Ningbo, and Wenzhou in Zhejiang Province show strong technological progress, with MI values improving after 2016, indicating significant results in technological innovation and technology diffusion. Shaoxing and Jiaxing fluctuated slightly in terms of technical efficiency, but the overall trend was positive, indicating that the allocation of resources in regional agricultural production was gradually optimized.
Cities in Anhui Province, such as Hefei and Wuhu, perform better overall in terms of MI values, especially in terms of technological progress (TC), and technological efficiency and total factor productivity have improved with the upgrading of agricultural production technologies and policy support. The MI values of Anqing and Fuyang, among others, have increased significantly in 2020, indicating that technological innovation has made significant progress in the region, especially in the application of modern agricultural machinery and new technologies.
4 Discussion
4.1 Urbanization and industrialization as key drivers of cropland dynamics
The spatiotemporal characteristics of farmland use in the YRD region are mainly driven by urbanization and industrialization. As the regional economy grows rapidly, especially in Jiangsu and Shanghai, large-scale conversion of farmland into urban and industrial land has been a significant consequence. This urban expansion, driven by the need for infrastructure, residential and commercial areas, has directly compressed agricultural land, affecting both the area and distribution of farmland.
In Shanghai, urbanization and industrial growth led to a 17% reduction in arable land between 2000 and 2010. Similarly, Jiangsu experienced significant land loss as infrastructure and industrial zones expanded, often at the expense of farmland. Conversely, Zhejiang has been more effective in reducing farmland loss through rigorous land use planning and ecological restoration, demonstrating that strong policy enforcement and long-term planning can mitigate the impact of urbanization and industrialization on farmland (Gao et al., 2023).
4.2 Impact of economic development and policy on cropland changes
The rapid economic development and government policy trends have further influenced the urbanization and industrialization of the YRD region. A particularly salient period of this phenomenon transpired from 2000 to 2010, a time marked by a substantial surge in urban construction, infrastructural expansion, and an escalating demand for industrial land. This dynamic, in turn, precipitated a considerable occupation of arable land resources. This trend was most evident in the economically developed regions of Jiangsu and Zhejiang. In response to these challenges, the government has implemented policies aimed at managing land resources, including initiatives to restore ecological balance and to return farmland to forests. These measures have contributed to a decrease in the area of arable land in certain regions (e.g., the inland cities of Zhejiang) has been restored during the 2010–2020 period.
Furthermore, advancements in agricultural technology and the optimization of land use have contributed to the recovery of arable land in select cities. The utilization of cropland is directly influenced by disparities in regional economic development (Chen et al., 2021). Economically developed regions exhibit a higher demand for construction land, which results in a reduction of arable land. Conversely, regions experiencing slower economic development prioritize the protection of arable land in their land utilization strategies, given the persistent role of agriculture as a significant economic sector (Miao et al., 2021).
Changes in cropland utilization in the YRD region show obvious spatial and temporal heterogeneity. In the context of intensive agricultural transformation and green innovation, rational optimization of land use, improvement of agricultural production efficiency and implementation of effective ecological restoration measures are the keys to achieving green and sustainable agricultural development in the YRD region in the future (Deng et al., 2015).
4.3 Landscape fragmentation and connectivity: effects of urban expansion on cropland
Analysis of the landscape fragmentation indicators shows that the highly urbanized landscape of Shanghai showed significant changes over 20 years, with CA decreasing by nearly 20% and PLAND decreasing from 69.96 to 57.15%, reflecting the impact of urban expansion on farmland. Increased NP and PD values indicated higher landscape fragmentation, but the AI value remained relatively stable, suggesting that connectivity within the farmland landscape was somewhat preserved. In contrast, Quzhou in Zhejiang Province showed decreased NP and PD values, indicating more integrated and concentrated farmland landscapes due to intensive agricultural management.
In all four provinces, landscape boundary complexity (ED) and patch shape irregularity (LSI) increased, with Jiangsu and Zhejiang showing greater fragmentation and disturbance. In Shanghai and Anhui, these indices also increased, but to a lesser extent, reflecting the impact of urbanization on farmland configuration. The decline in AI in all provinces highlights increased fragmentation, particularly in Jiangsu and Shanghai, where it has led to reduced connectivity between patches and potential ecological degradation. Anhui, however, maintained a higher degree of aggregation with minimal fragmentation.
To address fragmentation and ecosystem degradation, the YRD region needs to strengthen policies to conserve farmland and enhance ecosystem functions. This includes adopting intensive agricultural practices, integrating green technologies such as land consolidation, and establishing ecological compensation mechanisms (Zhang X. et al., 2024). Jiangsu and Shanghai need proactive policies to restore and integrate fragmented landscapes, while Anhui should focus on conserving its arable land while promoting green innovation for sustainable agricultural development (Wu et al., 2018).
4.4 Structural shifts in agricultural practices: modernization and policy influence
The Shannon Diversity Index in certain cities, including Hefei, Bengbu, and Suzhou, has undergone a gradual decline, suggesting that the agricultural cultivation structure in these regions has undergone a process of concentration. This phenomenon is likely associated with the accelerated modernization of agriculture and the expansion of urbanization (Jafari et al., 2022). These regions have undergone a transition from small-scale, diversified planting patterns to large-scale, intensive agricultural production methods. The increasing trend of the Shannon Diversity Index in Yancheng, Ningbo, and Nantong indicates a diversification of the agricultural cropping structure, which may be attributable to policy-driven agricultural restructuring or the gradual adoption of a more diverse array of cash crops by local farmers. In highly urbanized cities such as, such as Shanghai, Wuxi and Suzhou, the Shannon Diversity Index showed a clear downward trend, indicating once again that the urbanization process has had a significant impact on agricultural land and cropping structure, and agricultural activities have gradually concentrated on a few high-efficiency crops.
The Shannon Diversity Index of most cities experienced fluctuations during the 20-year period, with some areas showing diversification of planting structures, while some highly urbanized areas showed a trend of concentration of planting structures. In the future, while continuing to promote the modernization of agriculture in the YRD region, how to balance urbanization and the diversity of agricultural production will be an important issue for the sustainable development of regional agriculture.
4.5 Technological innovation and agricultural sustainability in green production
Over the past 20 years, most cities have been relatively slow to improve their technical efficiency, and technological progress has been the main driver of total factor productivity (Xiao et al., 2022). Cities have made some progress in technological innovation and technology diffusion, especially Nanjing, Wuxi and Hangzhou, which have shown significant technological progress in the later period. Despite the outstanding performance of some cities, technological progress in some cities still lags behind, such as Hefei and Zhoushan, and other regions, which should strengthen technological training and agricultural innovation capacity to promote high-quality agricultural development in the future.
A study of provincial-level units across China shows that technological innovations such as precision agriculture and biotechnology can increase agricultural productivity while maintaining environmental sustainability (Huang and Wang, 2024). The main barriers to the implementation of green agricultural technologies include issues such as economic costs and lack of incentives, social issues such as implementation cycles and risk perceptions, and practical challenges such as infrastructural constraints and regulatory barriers (Mao et al., 2021; Do et al., 2023). Taking Jiangsu and Zhejiang as examples. Jiangsu Province has promoted the development of new agricultural productivity by developing project agriculture, facility agriculture, smart agriculture and green agriculture. Key measures include: introducing key projects, improving facility agriculture mechanization, building smart agricultural parks and digital farms, and taking the lead in establishing an agricultural green development monitoring system in the Taihu Lake area to promote the scientific and technological support of green agriculture and the quality and safety supervision of agricultural products, and have achieved remarkable results. Zhejiang Province has achieved remarkable results by developing efficient ecological agriculture and implementing green agricultural reforms. Measures include: promoting integrated rice-fish farming, implementing real-name purchase and quota application of fertilizers and pesticides, promoting the reform of the “two systems of fertilizers and pesticides,” strengthening the resource utilization of livestock and poultry manure, and promoting standardized agricultural production and green technology support. In addition, digital reforms and the “Zhejiang Agricultural Code” traceability system have promoted the coordination of production and marketing, and improved the quality and safety of agricultural products and their market competitiveness. These ongoing green agricultural transformation measures further demonstrate the importance of green innovation transition of intensive cropland in the new agricultural production system.
In view of the differences in technical efficiency in different regions, local governments should coordinate financial and technical support for technologically backward regions in the future, especially in the promotion of agricultural mechanization and smart agricultural technology, to promote the overall improvement of technical efficiency. At the same time, increase the fixed-point docking policy for developed regions, complement each other’s advantages, and drive development one-to-one.
5 Conclusion
This study analyzes the green innovation transformation of intensive farmland in the YRD region from 2000 to 2020. The key findings are as follows:
(1) Landscape attributes: fragmentation and aggregation of cropland
Cropland landscapes have become more fragmented over the past 20 years, especially in Jiangsu and Shanghai, due to urbanization and industrial expansion. Although some areas, like Anhui, maintain higher aggregation, policies should focus on reducing fragmentation and improving landscape connectivity.
(2) Structural attributes: cropping structure diversity and optimization
Regions like Nantong and Yancheng have successfully diversified their cropping structures. In contrast, urbanized areas like Shanghai show concentrated cropping patterns. Future policies should promote crop diversification in developed regions and guide areas with homogenized cropping structures toward more diverse practices.
(3) Production attributes: green productivity and technological progress
Green total factor productivity (GTFP) has improved in most cities, driven by technological advancements, especially in Nanjing and Hangzhou. However, some regions still lag behind. These areas should invest more in agricultural technology and provide incentives for green tech adoption to enhance sustainability.
The green transformation of cropland in the YRD region has varied significantly. Regional policies should focus on technological innovation, agricultural structure optimization, and landscape protection to promote sustainable agricultural development. In the future, the YRD region can achieve complementary and synergistic development of regional advantages and promote high-quality economic integration by strengthening policy coordination, optimizing the division of labor in the industry, promoting green development, upgrading infrastructure connectivity, enhancing cooperation in science and technology innovation, and facilitating the flow of talents.
Data availability statement
The original contributions presented in the study are included in the article/supplementary material, further inquiries can be directed to the corresponding author.
Author contributions
XiaL: Conceptualization, Methodology, Software, Writing – original draft, Writing – review & editing. JX: Conceptualization, Funding acquisition, Methodology, Project administration, Validation, Writing – original draft, Writing – review & editing. JL: Data curation, Investigation, Resources, Supervision, Writing – original draft. XinL: Formal analysis, Methodology, Software, Writing – original draft.
Funding
The author(s) declare that financial support was received for the research and/or publication of this article. This work was supported by The Ministry of Education’s Philosophy and Social Science Research Major Project “Study on the Rural Revitalization Strategy and the Three Rural Issues in the New Era (Sub-theme ‘Exploration of Rural Revitalization Paths in the Main Grain Producing Areas: Guaranteeing National Food Security and Achieving Farmers’ Income Increase.’)” (20JZD031).
Conflict of interest
The authors declare that the research was conducted in the absence of any commercial or financial relationships that could be construed as a potential conflict of interest.
Generative AI statement
The authors declare that no Gen AI was used in the creation of this manuscript.
Publisher’s note
All claims expressed in this article are solely those of the authors and do not necessarily represent those of their affiliated organizations, or those of the publisher, the editors and the reviewers. Any product that may be evaluated in this article, or claim that may be made by its manufacturer, is not guaranteed or endorsed by the publisher.
Footnotes
References
Abbasi, K. R., and Zhang, Q. (2024). Augmenting agricultural sustainability: investigating the role of agricultural land, green innovation, and food production in reducing greenhouse gas emissions. Sustain. Dev. 32, 6918–6933. doi: 10.1002/sd.3060
Amanullah,, and Khalid, S. (2020). Agronomy-food security-climate change and the sustainable development goals. Agronomy - climate change food security.
Chen, L., Zhao, H., Song, G., and Liu, Y. (2021). Optimization of cultivated land pattern for achieving cultivated land system security: a case study in Heilongjiang Province, China. Land Use Policy 108:105589. doi: 10.1016/j.landusepol.2021.105589
Deng, X., Huang, J., Rozelle, S., Zhang, J., and Li, Z. (2015). Impact of urbanization on cultivated land changes in China. Land Use Policy 45, 1–7. doi: 10.1016/j.landusepol.2015.01.007
Do, M. H., Huang, Y.-F., and Phan, V.-D.-V. (2023). Analyzing the barriers to green supply chain management implementation: a case study of the Vietnamese agriculture sector. J. Enterp. Inf. Manag. 37, 125–147. doi: 10.1108/JEIM-10-2021-0459
Fan, Y., Ning, W., Liang, X., Wang, L., Lv, L., Li, Y., et al. (2024). Spatial–temporal characteristics and influencing factors of eco-efficiency of cultivated land use in the Yangtze River Delta region. Land 13:219. doi: 10.3390/land13020219
Gao, Q., Chen, H., Zhao, M., and Zeng, M. (2023). Research on the impact and spillover effect of green agricultural reform policy pilot on governmental environmental protection behaviors based on quasi-natural experiments of China’s two provinces from 2012 to 2020. Sustain. For. 15:2665. doi: 10.3390/su15032665
He, C., Liu, Z., Xu, M., Ma, Q., and Dou, Y. (2017). Urban expansion brought stress to food security in China: evidence from decreased cropland net primary productivity. Sci. Total Environ. 576, 660–670. doi: 10.1016/j.scitotenv.2016.10.107
Hristov, J., Clough, Y., Sahlin, U., Smith, H. G., Stjernman, M., Olsson, O., et al. (2020). Impacts of the Eu's common agricultural policy “greening” reform on agricultural development, biodiversity, and ecosystem services. Appl. Econ. Perspect. Policy 42, 716–738. doi: 10.1002/aepp.13037
Huang, W., and Wang, X. (2024). The impact of technological innovations on agricultural productivity and environmental sustainability in China. Sustain. For. 16:8480. doi: 10.3390/su16198480
Jafari, L., Asadi, S., and Asgari, A. (2022). Temporal and regional shifts of crop species diversity in rainfed and irrigated cropland in Iran. PLoS One 17:e0264702. doi: 10.1371/journal.pone.0264702
Konopiński, M. K. (2020). Shannon diversity index: a call to replace the original Shannon’s formula with unbiased estimator in the population genetics studies. PeerJ 8:e9391. doi: 10.7717/peerj.9391
Lamine, S., Petropoulos, G. P., Singh, S. K., Szabó, S., Bachari, N. E. I., Srivastava, P. K., et al. (2018). Quantifying land use/land cover spatio-temporal landscape pattern dynamics from Hyperion using SVMs classifier and FRAGSTATS®. Geocarto Int. 33, 862–878. doi: 10.1080/10106049.2017.1307460
Li, R., and Cui, W. (2024). Spatial–temporal evolution and influencing factors of arable land green and low-carbon utilization in the Yangtze River Delta from the perspective of carbon neutrality. Sustain. For. 16:6889. doi: 10.3390/su16166889
Liu, G., Zhang, L., Zhang, Q., and Musyimi, Z. (2015). The response of grain production to changes in quantity and quality of cropland in Yangtze River Delta, China. J. Sci. Food Agric. 95, 480–489. doi: 10.1002/jsfa.6745
Liu, D., Zhu, X.-Y., and Wang, Y. (2021). China's agricultural green total factor productivity based on carbon emission: an analysis of evolution trend and influencing factors. J. Clean. Prod. 278:123692. doi: 10.1016/j.jclepro.2020.123692
Liu, Y.-S., Zou, L., and Wang, Y. (2020). Spatial-temporal characteristics and influencing factors of agricultural eco-efficiency in China in recent 40 years. Land Use Policy 97:104794. doi: 10.1016/j.landusepol.2020.104794
Luo, L.-H., Zhang, Y., Ma, W., and Zhuang, Y. (2017). System for land surface model applications based on cloud computing. IEEE Access 5, 12041–12048. doi: 10.1109/ACCESS.2017.2718002
Mao, H., Zhou, L., Ying, R., and Pan, D. (2021). Time preferences and green agricultural technology adoption: field evidence from rice farmers in China. Land Use Policy 109:105627. doi: 10.1016/j.landusepol.2021.105627
Miao, Y., Liu, J., and Wang, R. Y. (2021). Occupation of cultivated land for urban–rural expansion in China: evidence from National Land Survey 1996–2006. Land 10:1378:12. doi: 10.3390/land10121378
Monteleone, M., Cammerino, A. R. B., and Libutti, A. (2018). Agricultural “greening” and cropland diversification trends: potential contribution of agroenergy crops in Capitanata (South Italy). Land Use Policy 70, 591–600. doi: 10.1016/j.landusepol.2017.10.038
Ning, J., Liu, J., Kuang, W., Xu, X., Zhang, S., Yan, C., et al. (2018). Spatiotemporal patterns and characteristics of land-use change in China during 2010–2015. J. Geogr. Sci. 28, 547–562. doi: 10.1007/s11442-018-1490-0
Niu, H., Zhao, X., Xiao, D., Liu, M., An, R., and Fan, L. (2022). Evolution and influencing factors of landscape pattern in the Yellow River Basin (Henan section) due to land use changes. Water 14:3872. doi: 10.3390/w14233872
Preusse, V., Nölke, N., and Wollni, M. (2024). Urbanization and adoption of sustainable agricultural practices in the rural-urban interface of Bangalore, India. Can. J. Agric. Econ./Revue canadienne d'agroeconomie. 72, 167–198. doi: 10.1111/cjag.12355
Qiu, L., Zhu, J., Pan, Y., Wu, S., Dang, Y., Xu, B.-G., et al. (2020). The positive impacts of landscape fragmentation on the diversification of agricultural production in Zhejiang Province, China. J. Clean. Prod. 251:119722. doi: 10.1016/j.jclepro.2019.119722
Shen, J., Zhu, Q., Jiao, X., Ying, H., Wang, H., Wen, X., et al. (2020). Agriculture green development: a model for China and the world. Front. Agric. Sci. Eng. 7, 5–13. doi: 10.15302/J-FASE-2019300
Wang, F., Wang, H., Liu, C., Xiong, L., and Kong, F. (2022). Does economic agglomeration improve agricultural green total factor productivity? Evidence from China's Yangtze river delta. Sci. Prog. 105. doi: 10.1177/00368504221135460
Wu, X., Wang, S., Fu, B., Liu, Y., and Zhu, Y. (2018). Land use optimization based on ecosystem service assessment: a case study in the Yanhe watershed. Land Use Policy 72, 303–312. doi: 10.1016/j.landusepol.2018.01.003
Xiao, S., He, Z., Zhang, W., and Qin, X. (2022). The agricultural green production following the technological Progress: evidence from China. Int. J. Environ. Res. Public Health 19:9876. doi: 10.3390/ijerph19169876
Xu, W., Jin, X., Liu, J., and Zhou, Y. (2020). Impact of cultivated land fragmentation on spatial heterogeneity of agricultural agglomeration in China. J. Geogr. Sci. 30, 1571–1589. doi: 10.1007/s11442-020-1800-1
Yang, Y., Ma, H., and Wu, G. (2022). Agricultural green total factor productivity under the distortion of the factor market in China. Sustain. For. 14:9309. doi: 10.3390/su14159309
Yin, G., Lin, Z., Jiang, X., Yan, H., and Wang, X. (2019). Spatiotemporal differentiations of arable land use intensity — a comparative study of two typical grain producing regions in northern and southern China. J. Clean. Prod. 208, 1159–1170. doi: 10.1016/j.jclepro.2018.10.143
Zhang, W., Li, Z., Wagan, S. A., and Tan, S. (2024). The green transformation of agricultural production: evaluating the spatial role of agricultural industrial structure innovation in Guangdong, China. Front. Sustain. Food Syst. 8:1384358. doi: 10.3389/fsufs.2024.1384358
Zhang, R., and Lu, J. (2021). Simulation of land use pattern evolution from a multi-scenario perspective: a case study of Suzhou City in Anhui Province, China. Int. J. Environ. Res. Public Health 18:13336. doi: 10.3390/ijerph182413336
Keywords: cropland green innovation, spatiotemporal analysis, the Yangtze River Delta region, agricultural sustainability, green total factor productivity
Citation: Li X, Xu J, Lu J and Li X (2025) Green innovation transition of intensive cropland: a spatial and temporal characterization in the Yangtze River Delta region, China. Front. Sustain. Food Syst. 9:1551146. doi: 10.3389/fsufs.2025.1551146
Edited by:
Xueru Zhang, Hebei University of Economics and Business, ChinaReviewed by:
Zaheer Abbas, Sun Yat-sen University, ChinaJiameng Yang, Nanjing Forestry University, China
Conghong Huang, Nanjing Agricultural University, China
Copyright © 2025 Li, Xu, Lu and Li. This is an open-access article distributed under the terms of the Creative Commons Attribution License (CC BY). The use, distribution or reproduction in other forums is permitted, provided the original author(s) and the copyright owner(s) are credited and that the original publication in this journal is cited, in accordance with accepted academic practice. No use, distribution or reproduction is permitted which does not comply with these terms.
*Correspondence: Jinhai Xu, eHVqaEB5enUuZWR1LmNu