 Katya M. Busenitz
 Ryan B. Schmid
 Jonathan G. Lundgren
- Ecdysis Foundation, Estelline, SD, United States
Rangelands support managed and endemic pollinator communities, but the way that cattle are managed in these habitats affects floral resources and habitat suitability. We placed honey bee colonies on continuously and regeneratively grazed rangelands. Regenerative rangelands had relatively higher stocking rates, animals were moved into new paddocks more frequently, and the rangeland was allowed to rest after grazing for longer than continuously grazed areas. Rangeland plant community characteristics measured monthly during the growing season included forage biomass, flowering species richness, and abundance of flowers. Monthly measurements of colony weight gain, brood production, and Varroa mite abundance were recorded. Regeneratively managed rangelands had more flowering species and greater flower abundance, and floral species richness was correlated with colony weight gain. Specifically, minimum floral species richness (indicative of periods of resource scarcity) were more influential to hive weight gain than periods of greater floral richness. Plant biomass was positively associated with brood production, and negatively associated with Varroa incidence. Rangeland pasture management was associated with the abundance and composition of the flowering plant communities, which in turn were associated with the health and productivity of honey bee colonies stationed at these sites. Our results suggest that regeneratively managed rangelands offer a tool for conserving and promoting honey bees in this region.
Introduction
Managed pollinators are in decline in the United States ([NASS] National Agricultural Statistics Service, 2025). These declines have led to insufficient pollination of human food crops (Reilly et al., 2020). Beekeepers have reported annual hive losses of 59% over the past 50 years (Reilly et al., 2020). To compensate for these losses, beekeepers devote more resources into requeening, splitting colonies and starting new colonies. The result is that the number of colonies globally has been maintained to accommodate the increased demand for pollination (Potts et al., 2010), but many large, commercial beekeepers struggle to stay in business. European honey bees (Apis mellifera L.) are social insects and rely exclusively on flowers for nectar and pollen, and thus are strongly influenced by habitat management that affects floral resources (Winston, 1991). Relative to other bee species, honey bees are generalist feeders, and while they have distinct floral preferences, they generally benefit from non-specific floral resource increases. Rangelands are an important habitat that supports honey bees better than other agricultural landscapes (Smart et al., 2016). Indeed, one of the stressors on honey bee populations and the beekeeping industry is habitat loss (Potts et al., 2010), and rangeland management practices that simplify resident plant communities contribute to this habitat loss (Zhang et al., 2018; Teague and Kreuter, 2020).
More than one quarter of the planet’s land area is used for livestock grazing (Asner et al., 2004; Hulvey et al., 2021). Because lands devoted to grazing are so extensive and require fewer mechanical and chemical inputs compared to cropland, they provide different ecosystem services through their support of wildlife and humans (Power, 2010). Season-long or year-long stocking is a common form of livestock management on rangelands in the U.S. (Teague et al., 2011). This continuous grazing is characterized by low stocking rates of livestock that are allowed to freely disperse within an entire pasture, which ranges in size from a few acres to many thousands of acres (Teague and Kreuter, 2020). Continuous grazing is commonly implemented due to its relatively low investments in labor, water, fencing, and transportation (James, 2011). In addition to low input costs, evidence suggests that cattle (Bos taurus) gain weight more quickly when allowed access to their preferred forage in a continuously grazed pasture, which in turn may increase profits for ranchers (Augustine et al., 2022). However, sustained continuous grazing can lead to the degradation of ecosystem services that healthy rangelands may provide to wildlife, such as species richness, esthetic value, soil health, and pollination services (Asner et al., 2003; Teague et al., 2011; Brenton, 2015; Divinsky et al., 2017; Enri et al., 2017; Mosier et al., 2021, 2022). Ultimately, long-term usage of continuous grazing can lead to land degradation through desertification, woody encroachment, or deforestation (Asner et al., 2004).
Regenerative grazing employs a series of farm-adapted practices that emulate the role of grazers in natural systems in ways that promote sustainability, soil health, and wildlife conservation (Teague and Kreuter, 2020; Campbell and King, 2022; Schmid et al., 2024, 2025). This approach to grazing incorporates elements of various rotational grazing systems, (e.g., adaptive multi-paddock grazing; planned grazing, holistic grazing), that allow intensively grazed areas to subsequently rest and recover (Pecenka and Lundgren, 2019; Fenster et al., 2021). Regenerative grazing management relies on the division of larger pastures into smaller paddocks, allowing the rancher more control over where and when cattle exert grazing pressure onto the plant communities. Paddock placement allows for finer control and can help exclude cattle from sensitive ecosystems such as riparian zones (Hulvey et al., 2021). A central component of such systems is the limiting of grazing pressure long enough to allow plant communities to recuperate within a growing season.
Regenerative rangeland management may build soil carbon (Alemu et al., 2019), increase water infiltration rates (Hulvey et al., 2021), and reverse the damage done by continuous stocking through improved plant community diversity (Teague et al., 2011). This style of rangeland management may also enhance ecosystem services such as dung pat degradation and parasite reductions (Pecenka and Lundgren, 2019; Teague and Kreuter, 2020; Schmid et al., 2024, 2025). Furthermore, increasing flowering plant diversity in rangelands through grazing practices can support biodiversity, including insects (Goosey et al., 2019; Schmid et al., 2024; Welch et al., 2025), birds (Leal et al., 2019), and mammals (Cao et al., 2016). Previous work has shown that rangeland management that encourages flower communities increases pollinator abundance (Enri et al., 2017), which may increase the relevance of grazing lands in pollinator conservation and promotion (Black et al., 2011). The interplay between rangeland management and associated floral resources on honey bees remains poorly understood.
Here we examined the effects of rangeland management on honey bee colony health and productivity in the Northern Great Plains region of the U.S. Many of the nation’s honey bee colonies spend the summer in the Northern Great Plains (i.e., North and South Dakota) (Bond et al., 2021). The eastern portion of the Northern Plains was historically tallgrass prairie (Gartner and Sieg, 1996). While much of the tallgrass prairie has been converted into cropland (Wright and Wimberley, 2013), over half of South Dakota remains in rangeland, many of which are still short- mixed-, and tall-grass prairies ([NASS] National Agricultural Statistics Service, 2025). South Dakota grasslands support 9.6% of the nation’s domestic honey production ([NASS] National Agricultural Statistics Service, 2025). In turn, honey bees and native pollinators help to promote plant diversity (Ollerton et al., 2011) that supports livestock health (Garrett et al., 2021). In this study, we tested the hypotheses that (1) floral community structure (floral abundance, species richness, and plant biomass) differs between two rangeland management regimes, (2) honey bee colony health and productivity (hive weight gain, Varroa mite [Varroa destructor] abundance, and brood abundance) varies among regenerative and continuously grazed rangelands, and (3) we tested whether floral community structure was correlated with honey bee health and productivity.
Materials and methods
Site selection
In 2021 and 2022, rangeland sites included in the study represented a range of management practices that were categorized into regenerative (n = 6; 3 in 2021 and 3 in 2022) and continuous (n = 10; 3 in 2021 and 7 in 2022) grazing systems based on a scoring system (Pecenka and Lundgren, 2019; Fenster et al., 2021). Scores for each site ranged between 0 points (continuously grazed with low stocking densities) and 8 points (maximum regenerative practices); for this study, we designated all scores 4 and above as regenerative. The design was unbalanced because site selection was made at the beginning of the growing seasons based on preliminary management discussions with the ranchers. But scores were assigned at the end of the season, and sometimes management differed from the early season plans. In regenerative management, there were often multiple short grazing periods during a season, and the relative timing of these grazing events within the span of regenerative rangelands may have affected the biological communities that were observed. Specific management situations and mean regenerative scores for these two treatments are presented in Table 1, and locations of participating ranches are presented in Figure 1. Participating ranchers (n = 12) managed their stocking density, paddock size, and cattle breed in order to best fit their management goals, and the stocking rate was comparable between grazing treatments on average. Rainfall in this region is approximately 715 mm annually, and average annual temperature is approximately 12.9°C. Ranchers did not plant pasture species as a normal part of their management, relying on existing plants of the region. Historic vegetation of the region was characterized as a transition between Northern mixed-and tall-grass prairies, and exotic cool-season grasses (Bromus inermis and Poa pratensis) have come to dominate many rangelands of the region (Johnson and Larson, 2007).
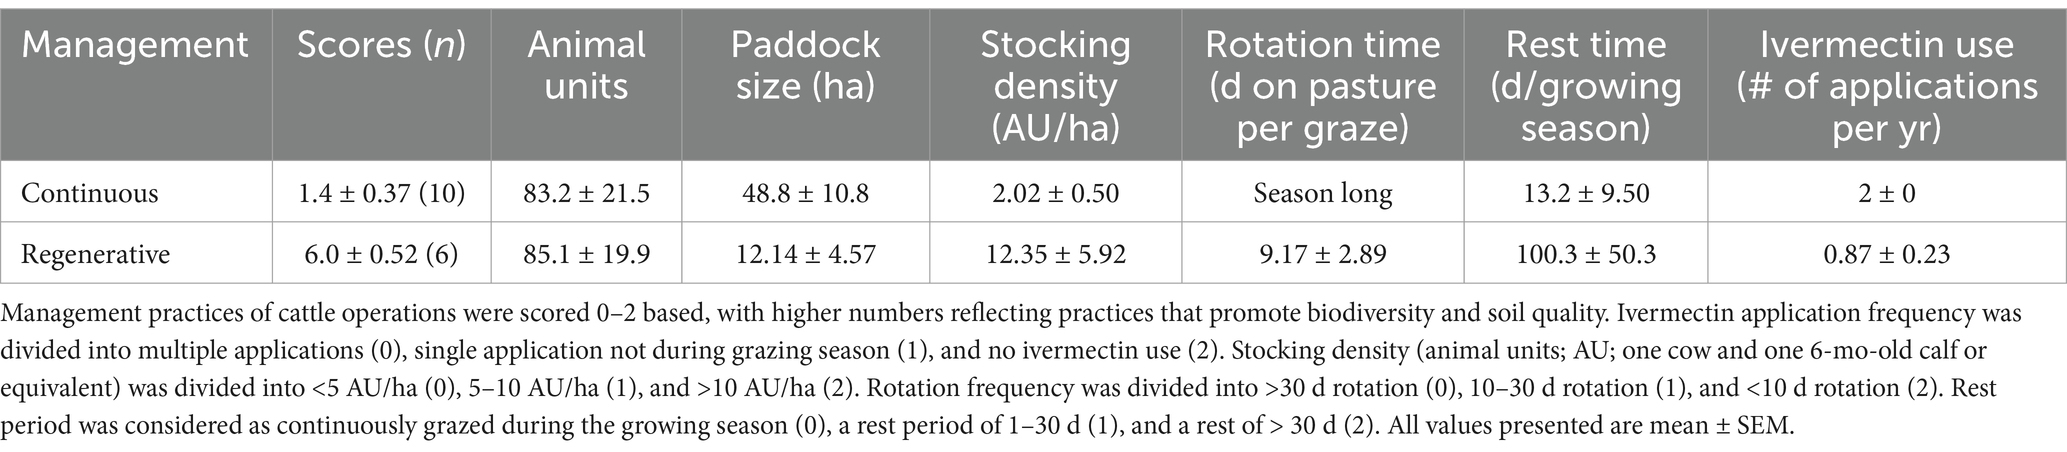
Table 1. Distinguishing characteristics of regenerative and continuously grazed rangelands.
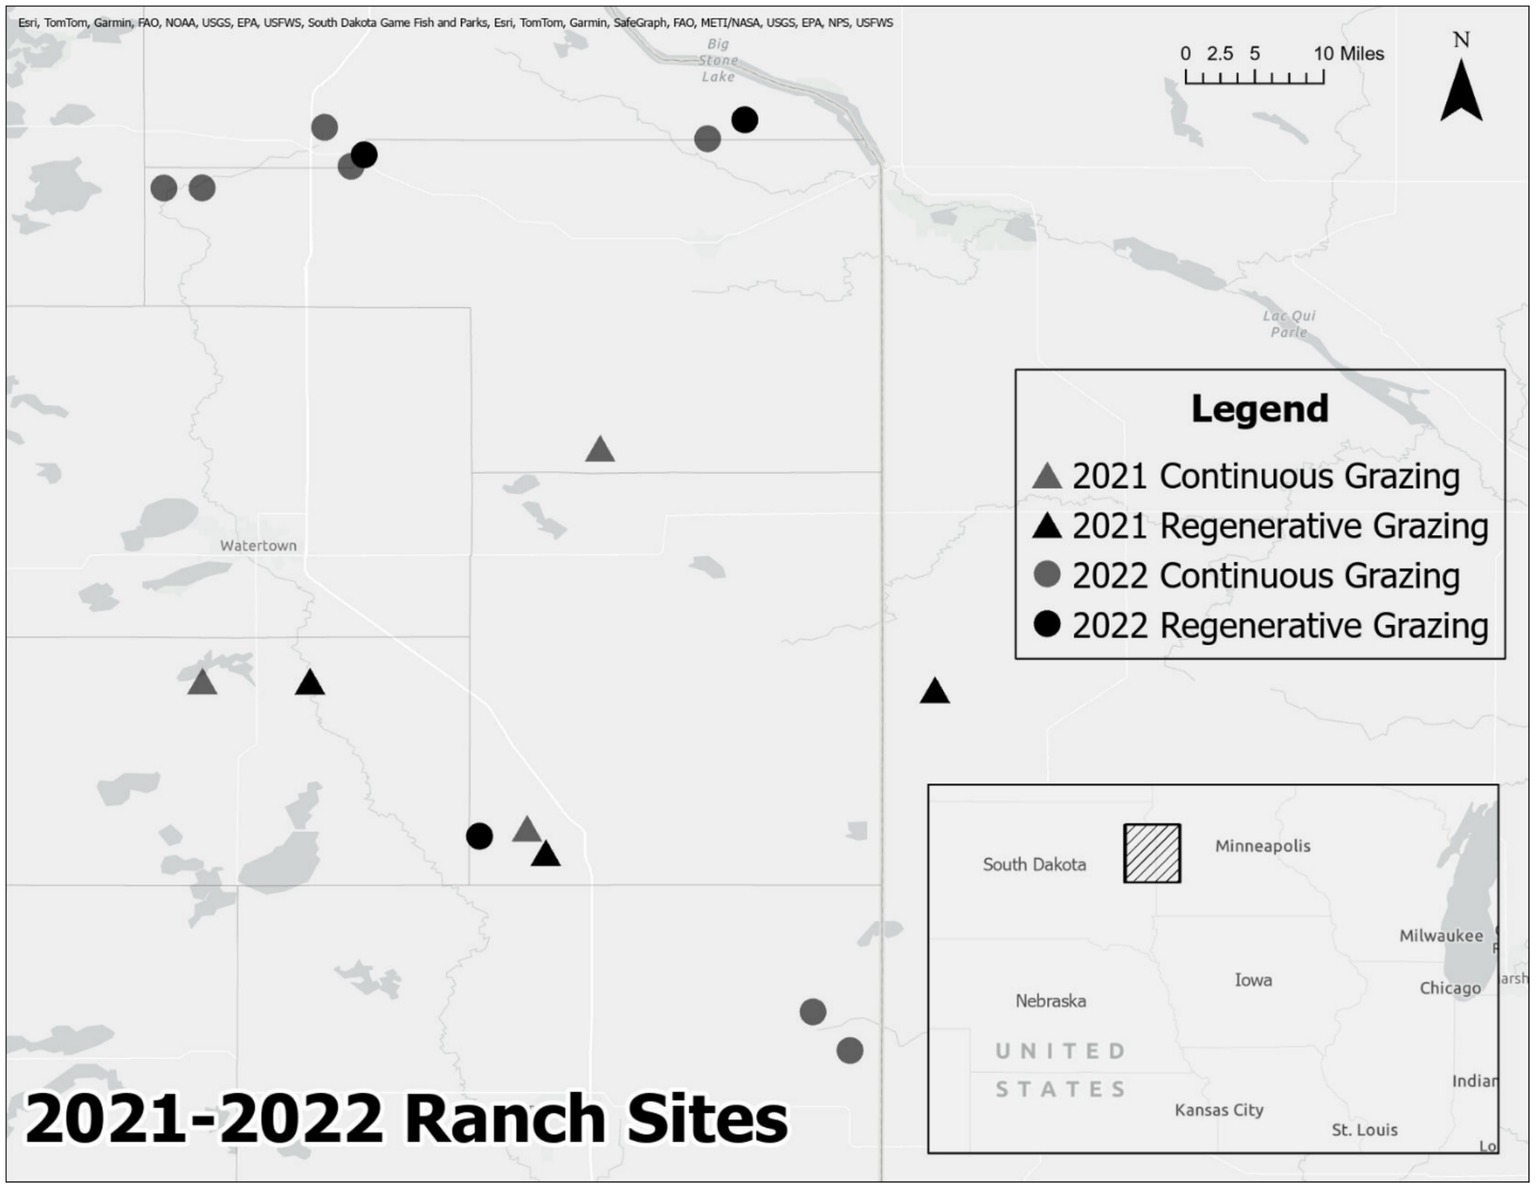
Figure 1. Rangeland pasture locations. Pastures were centralized in eastern South Dakota. Grazing management was defined for the sample year and are presented in Table 1.
Rangeland plant community assessments
Within each site, four areas were randomly selected for floral counts that were at least 25 m from the rangeland margin, and at least 25 m from each other. Coinciding with monthly hive assessments from June–September, a 50 m transect was placed in each of the four areas; transects were spaced at least 25 m from each other and any rangeland margin. Floral resources were assessed along each transect using a modified Pollard walk technique (Pollard, 1977). The number of flowers and buds open or estimated to open within 5 days was enumerated, within 1 m on either side of the transect line. Each individual bud and flowerhead on plants such as Echinacea spp. were counted as individual flowers, and composite flowers such as Solidago were counted as one flower. For more detail on floral counts performed in this manner, see Graham et al. (2021). Flowers that had lost their petals or begun to brown were not counted. To generate floral species richness and abundance, each flowering plant was identified to the lowest taxonomic level possible (typically species) (Johnson and Larson, 2007). In addition to flowering plant stem counts, plant biomass was estimated monthly from July–September using a drop plate meter (Robertson et al., 2023). Readings (n = 25) were recorded every 2 m along each 50 m transect.
Honey bee colony management and assessments
In 2021, 90 colonies of European honey bee (Apis mellifera L.) were in equal abundance on the six sites (n = 15 replicate hives per site) across central Eastern South Dakota (Figure 1). In 2022, 80 colonies were in equal abundance on 10 new sites. Prior to this, 5-frame nucleus colonies (Bird and the Bees LLC, Iola, WI, USA) were transferred to standardized 10-frame Langstroth deep boxes and comb (25 cm tall) and provisioned with feeder frames at Blue Dasher Farm, Estelline, SD. Colonies were transported to the sites in early June 2021 and 2022. Colonies were assigned to sites to ensure that initial hive weights were equivalent between treatments; the disparity between initial mean weights of colonies at a site was <5%. Colony sets were then randomly assigned and deployed to each site. Colony measurements, including the area of capped (pupating) brood, Varroa mite infestation rate, and colony weight were assessed monthly from June through September. Colonies were not treated for Varroa mites throughout the summer of either year. In 2021, bees were fed 500 mL 1:5 honey water every 2 weeks, and bees in 2022 were not given supplemental feed. Shallow honey supers (15 cm tall) were added every 2 weeks throughout the season as needed, and no honey was removed prior to weighing.
Brood assessments
Brood strength (i.e., the area of capped brood in each colony) was estimated by adapting the scoring system of the Bee Informed Partnership’s Commercial Beekeeping Guide to the three central frames of the brood box (Bee Informed Partnership, 2022). Capped brood populations on both sides of the frame were rated 0–5. Frames received a ranking of 0 if no capped worker brood was present, and up to a score of 5 if the frame was covered in capped worker brood. During brood assessments, the presence of a queen or eggs (indicative of a queen) was also recorded. Drone brood was not included in the brood assessment. A summed brood ranking per colony per sampling date was generated from these observations.
Varroa infestation rate assessments
Varroa mites were counted in each hive using ether rolls (2021) or alcohol wash (2022) methods (Dietemann et al., 2013). Bees (n ≈ 100 per hive) were collected from the outer-most frame of the brood box. If no bees were present on this frame, bees were collected from the penultimate frame. Bees were gently scraped into a 118 mL plastic cup that contained a small quantity of ether (SuperTech engine starting fluid, Dunn, NC, USA). Samples for the alcohol-wash method were frozen at −20°C, after which Varroa mites were washed from the dead bees into 120 mL of 70% ethanol. The bees were separated from the Varroa mites using a 3 mm sieve, allowing mites to wash through. The number of bees and mites were counted, and the number of Varroa per 100 bees (percent infestation rate) was calculated.
Hive weights
Each colony was weighed individually using a digital hanging scale (Modern Step, ASIN B01N25OC6P, Seattle, WA, USA) mounted onto a custom lift. The weight of the hive and the number of honey supers were recorded each month. The summed weight of honey, bees, and wax was later estimated by subtracting the average weight of the empty equipment.
Data analysis
The effects of rangeland management on seasonal flowering plant community characteristics (flower stem abundance, flowering plant species richness, and plant biomass) and hive health and productivity parameters (colony weight gain, Varroa infestation rate, and brood strength) were examined per site first using rm-ANOVA with sample date as the within-subjects factor and rangeland management as the between-subjects factor. In these analyses, sites from the two sample years were pooled. In some cases, we pooled response variables across sample dates to generate a single, season-long perspective of the data that was assessed using a linear mixed model on hive-level data, with treatment as a fixed factor and site as a random factor. For plant communities and hive health and productivity, maximum and minimum values refer to the seasonal maximum peak and minimum trough in the different response variables. In cases of seasonal sums, within a site the data were averaged for a particular month, and these dates were aggregated into a seasonal sum. Univariate linear regression analysis was used to compare trends in hive performance and plant community characteristics on these season-wide parameters (results not presented in the text are presented in Table 2). For all statistical tests, results were accepted as significant at α = 0.05, and marginal significance was assigned as α = 0.10. All data were analyzed using Systat 13.1 (Grafiti, Palo Alto, CA, USA).
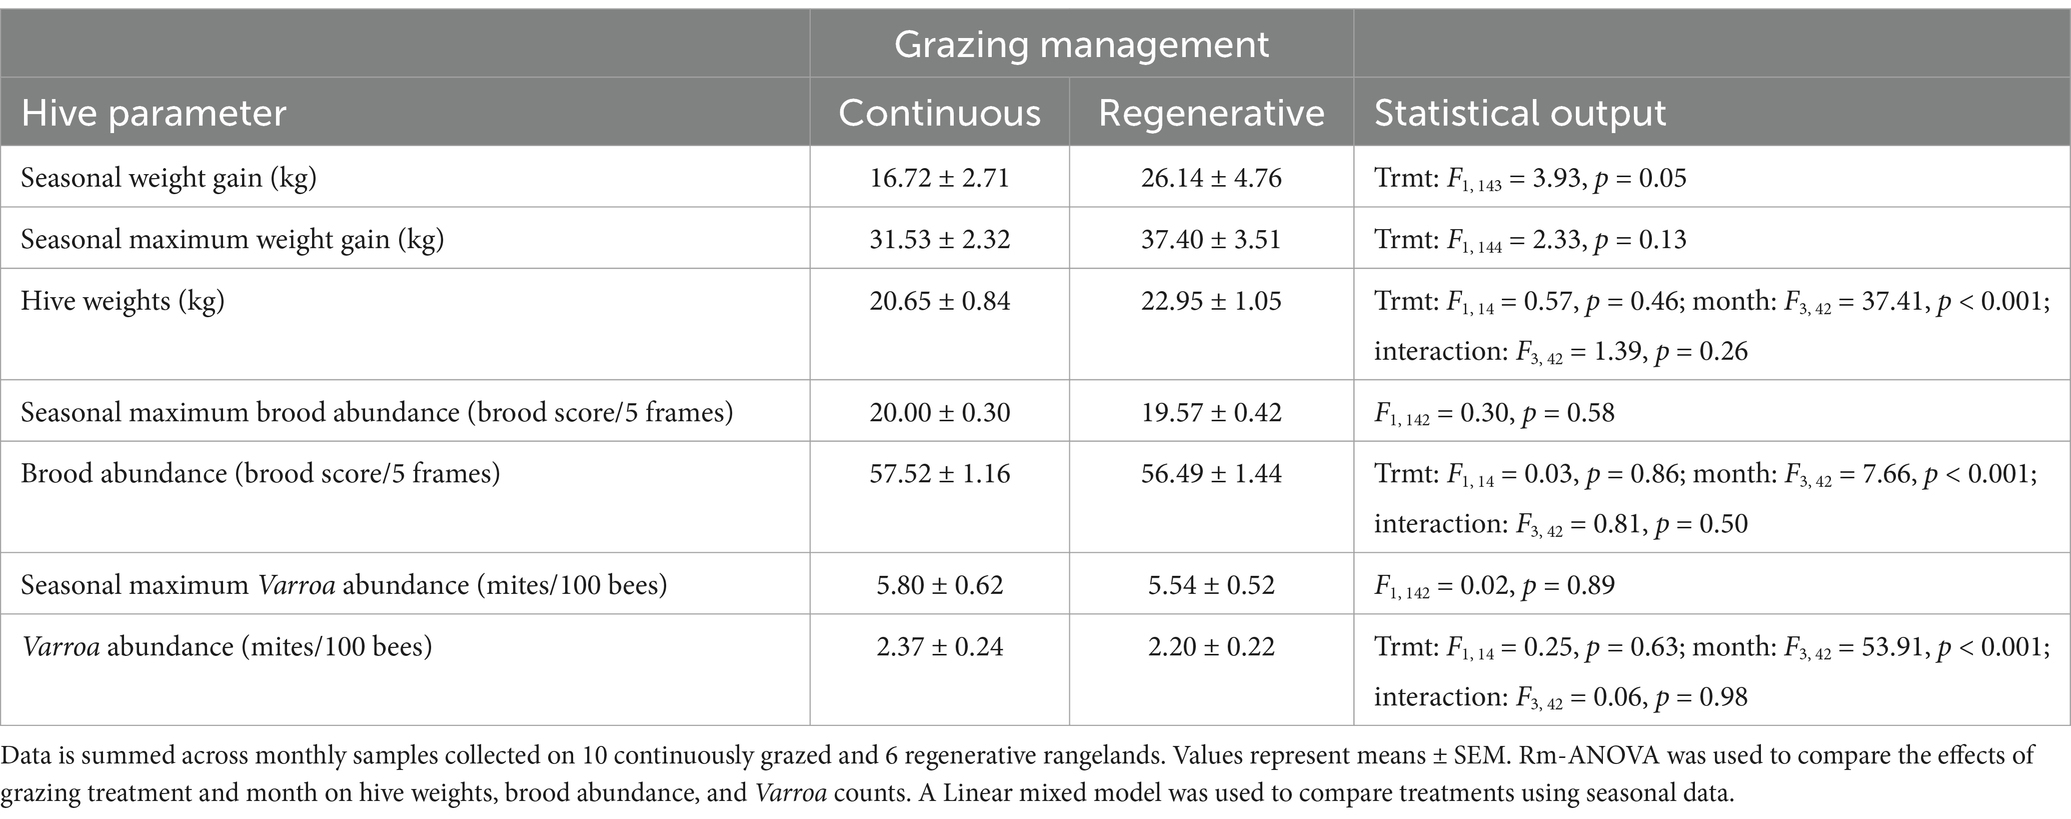
Table 2. The effects of grazing management on hive health and performance in rangelands of eastern South Dakota.
Results
Grazing management and plant community response
Over the 2 years of sampling, more than 176,979 flowers from 142 taxa were enumerated from these plant communities. The most frequently encountered taxa (those found at 12 or more sites) were white heath aster (Aster ericoides), Canada thistle (Cirsium arvense), musk thistle (Carduus nutans), black medick (Medicago lupulina), gumweed (Grindelia squamosa), and Canada goldenrod (Solidago canadensis). The five most frequently encountered flowers on continuously grazed sites were alfalfa (Medicago sativa; 18.89% of flowers), Canada goldenrod (15.05%), Canada thistle (11.77%), leafy spurge (Euphorbia esula; 8.97%), heath aster (6.59%); on regenerative sites they were heath aster (16.19%), Canada goldenrod (13.31%), white sweet clover (Melilotus albus; 10.49%), alfalfa (8.64%), and black medick (5.52%). Floral abundance and flowering species richness were higher in regeneratively grazed sites than in continuously grazed sites (Figure 2), and floral species richness significantly decreased later in the season on regenerative sites but species richness increased on continuously grazed sites as the season progressed (Figure 2; Table 3). Plant biomass was unaffected by grazing management (Table 3). There was a positive linear relationship between pasture rest and number of flowering species counted (Linear regression: F1,14 = 20.17; p = 0.001).
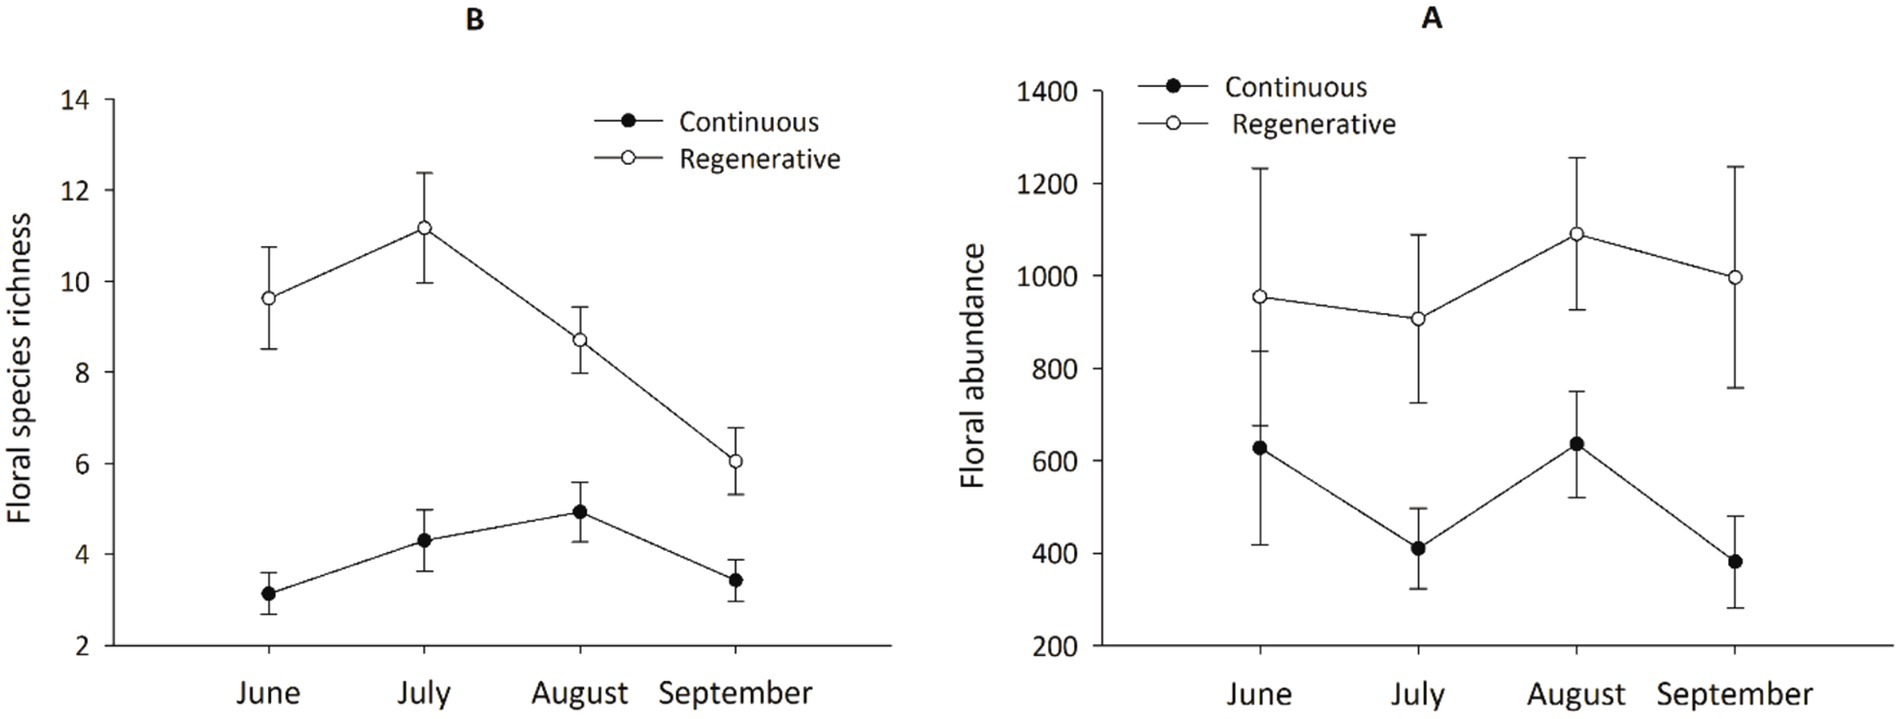
Figure 2. Floral abundance and plant species richness (mean ± SEM) per month by grazing management treatment. (A) Floral abundance as mean number of flowers counted per site at continuously grazed pastures (n = 10) and at regeneratively grazed pastures (n = 6). (B) Mean floral species richness per site between the two treatments. Output of the rm-ANOVA analysis, along with monthly data statistical outputs are presented along with seasonal means in Table 3.
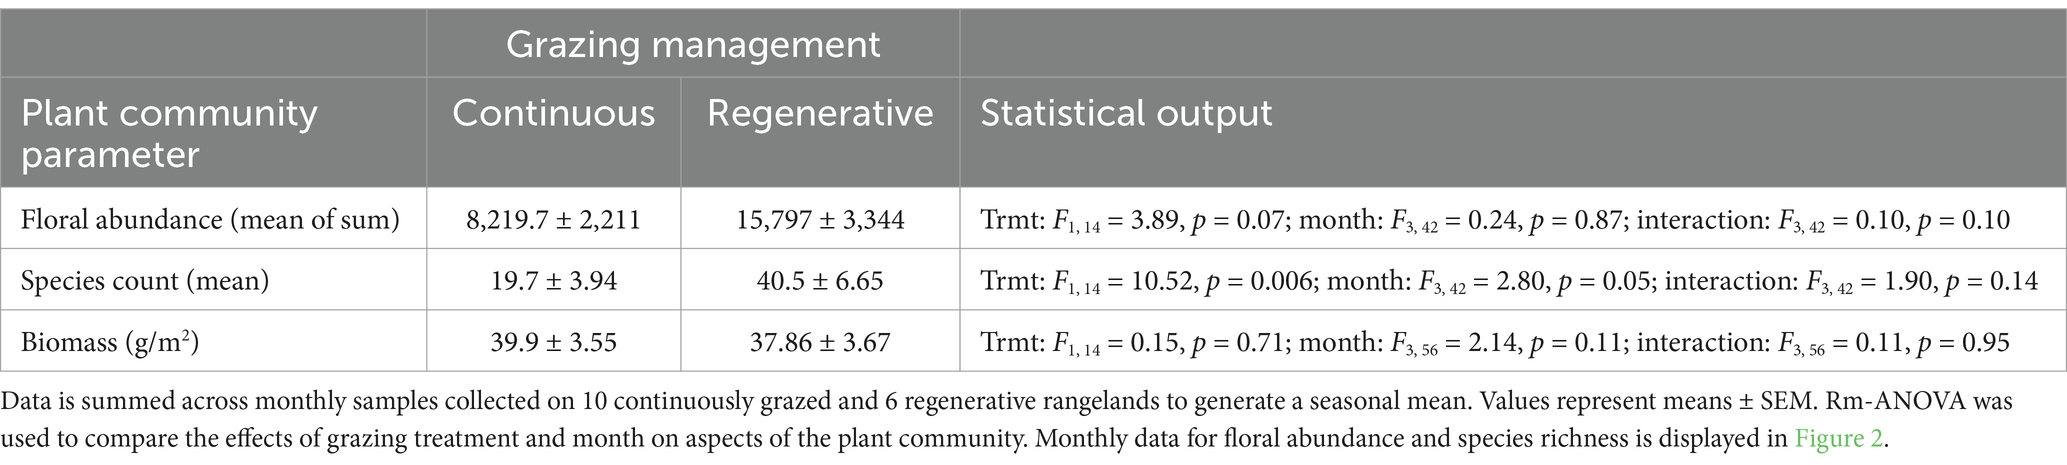
Table 3. The effects of grazing management on floral community characteristics in rangelands of eastern South Dakota.
Grazing management and colony health and productivity
Hives on regeneratively managed sites had marginally greater weight gain over the season than those raised on continuously grazed sites. Local grazing management did not affect monthly honey bee hive weights between continuously and regeneratively grazed sites (Table 3). Brood and Varroa mite abundances were unaffected by grazing management, but varied significantly over the season (Table 2). Peak brood production occurred in July (mean ± SEM; 14.20 ± 0.46, 15.84 ± 0.48, 14.66 ± 0.44, and 10.72 ± 0.47 were the brood scores on three frames in June, July, August, and September, respectively). Varroa abundance started low and steadily increased as the season progressed (1.21 ± 0.14, 1.14 ± 0.16, 2.02 ± 0.22, and 5.12 ± 0.43 Varroa mites/100 bees in June, July, August, and September, respectively). The maximum brood and Varroa abundances attained over the season were unaffected by grazing management (Table 2).
Plant community and honey bee health and productivity
Minimum plant species richness and minimum plant biomass were correlated with hive weight gain, and plant biomass was correlated with brood and Varroa mite abundances (Table 4). Minimum plant species richness was positively correlated with seasonal hive weight gain, and increasing minimum plant biomass was correlated with diminishing hive weight gain. When we examined the relationships between floral species richness on hive weight gain independently for the two treatments, there was a significant positive effect of floral richness in the continuously grazed rangelands, but this same relationship was not seen in the regenerative rangelands (Figure 3). Plant biomass had a positive relationship with capped brood abundance, and a negative correlation with Varroa mite abundance (Figure 4). Floral abundances, and maximum and mean plant floral richnesses were not correlated with hive health or performance. Maximum and mean plant biomass did not have a significant impact on hive weight gains.
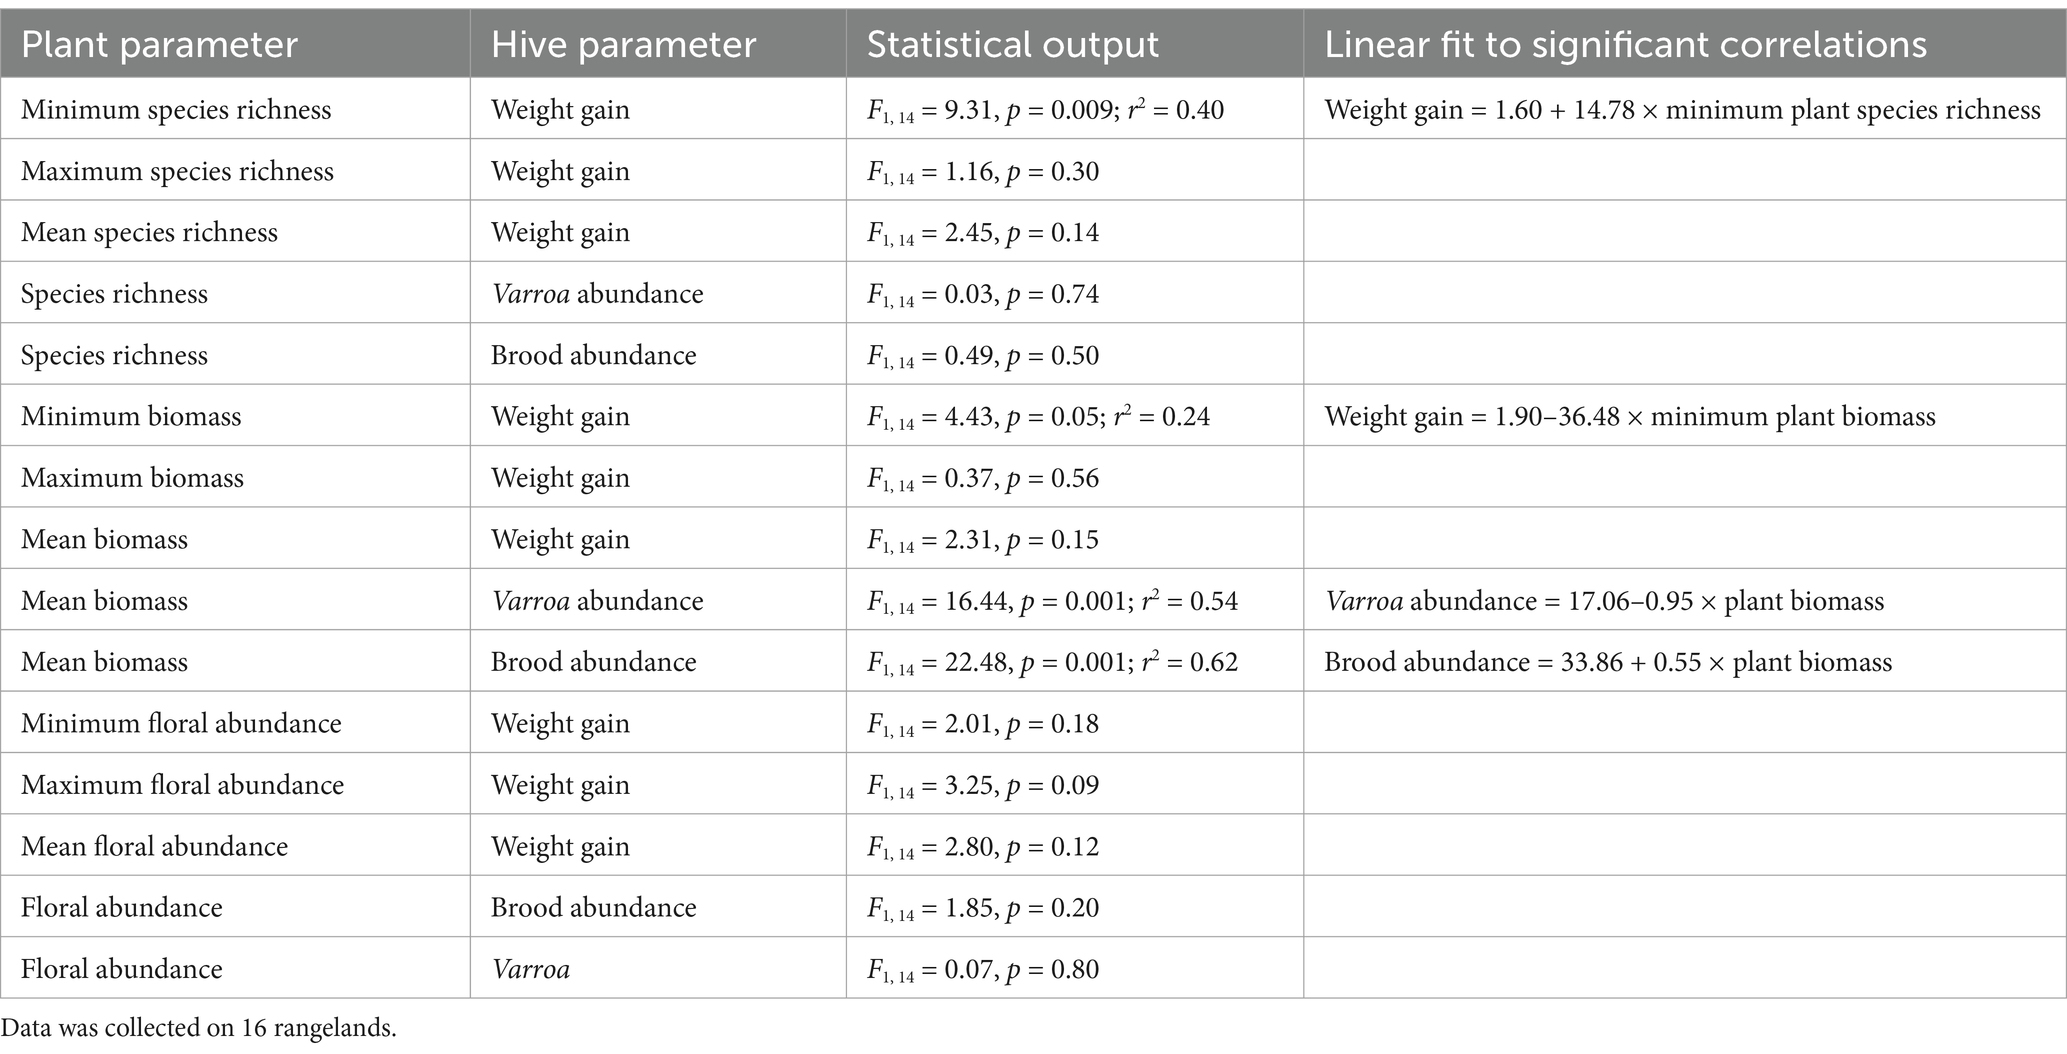
Table 4. Relationships between plant community structure and hive performance on different rangelands in eastern South Dakota.
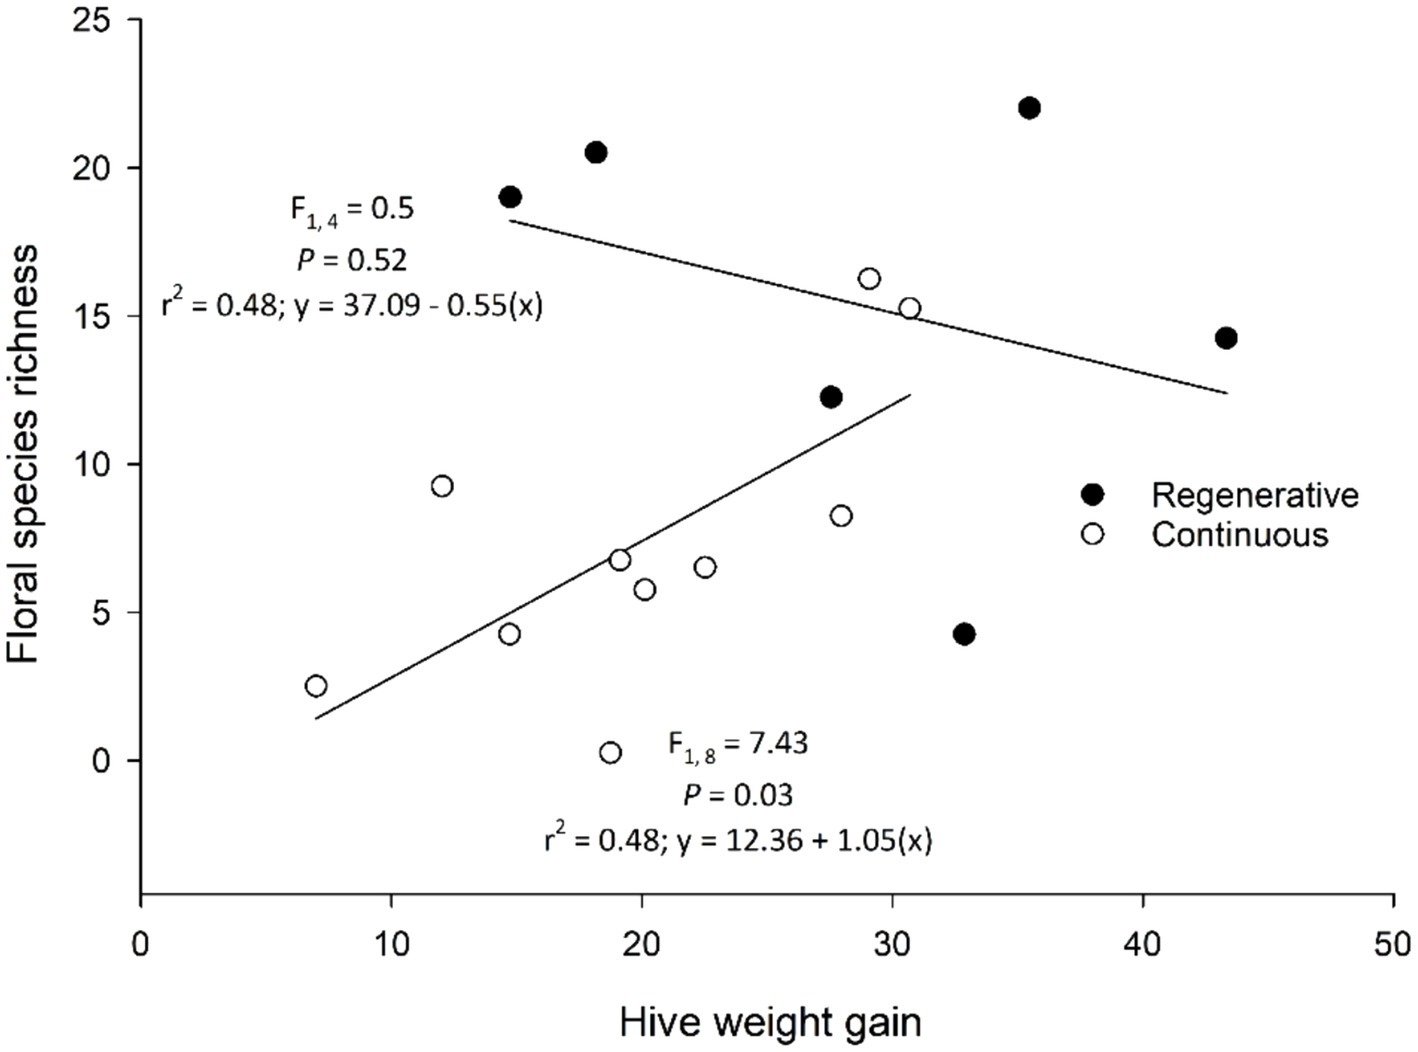
Figure 3. Floral species richness and hive weight gain on regenerative and continuously grazed rangelands in eastern South Dakota. Mean hive weight gain (kg) by site for both years pooled (2021, 2022) was positively correlated with the number of flowering species in continuously grazed pastures (n = 10 open circles), but was unrelated to floral species count among regenerative pastures (n = 6; closed circles) with higher floral richness.
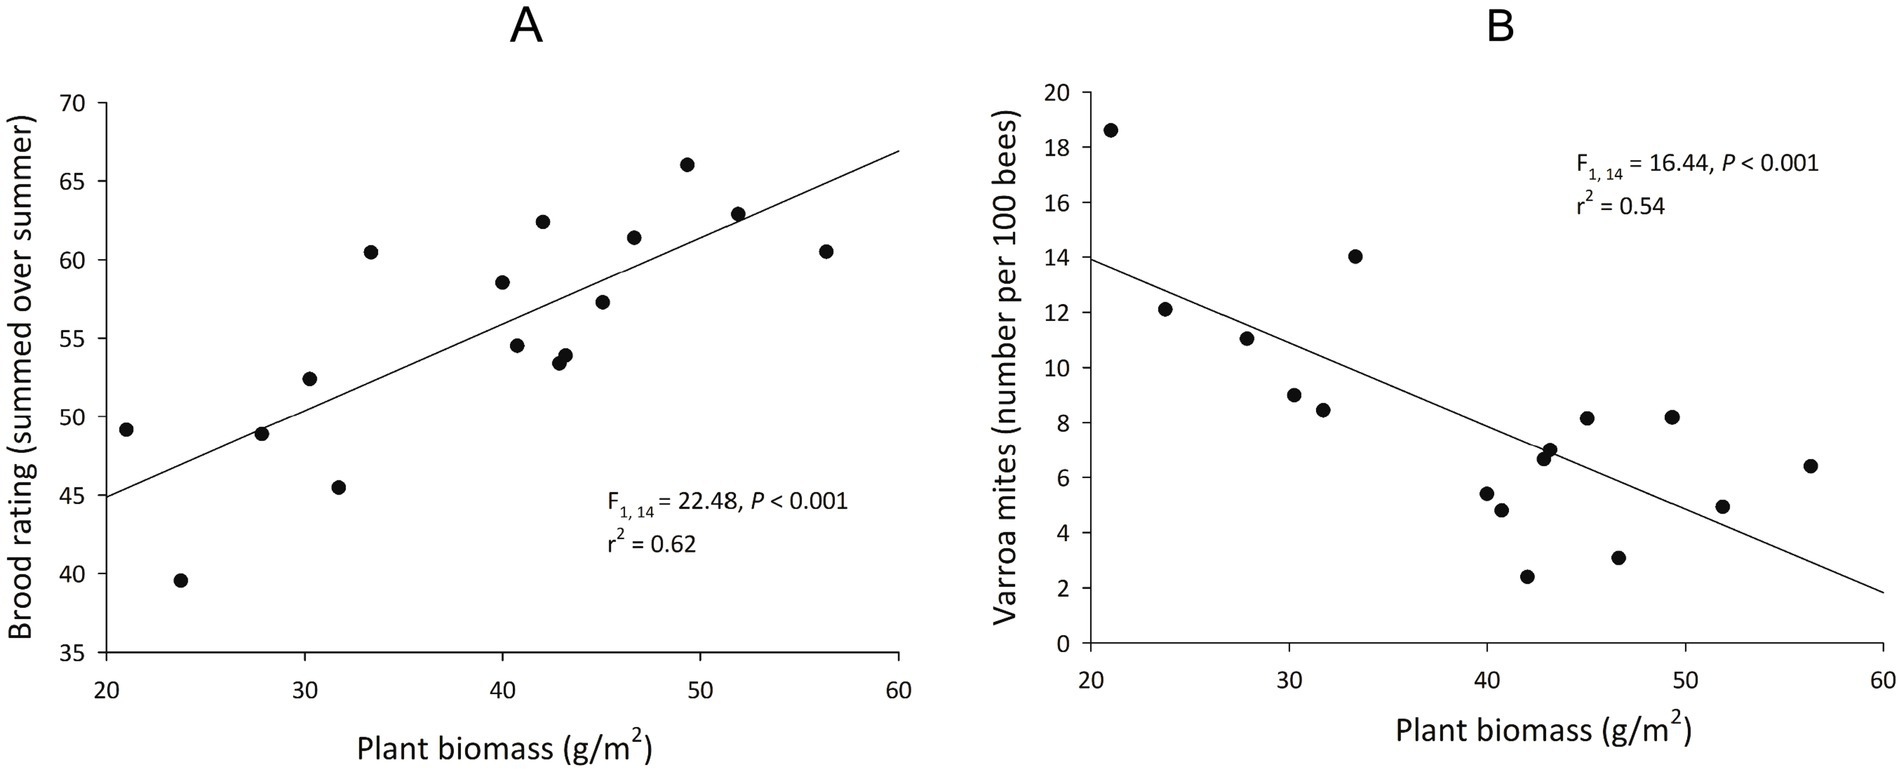
Figure 4. The effects of plant biomass on honey bee brood production and Varroa mite counts in hives raised on rangelands (n = 16) of eastern South Dakota. (A) Mean of summed brood rating by site correlated positively with mean plant biomass by site. (B) Mean Varroa by sites correlated negatively with mean plant biomass by site.
Discussion
We found positive effects of rangeland management and associated plant communities on hive performance and health. Regenerative rangelands were associated with more species rich and abundant floral communities, but forage biomass was unaffected by rangeland management. We also found that honey bee colonies had greater weight gain when they were raised on regeneratively grazed rangelands, but Varroa and brood abundance were unaffected by rangeland management. Finally, hive weight increased as the minimum floral species richness observed over the season in a pasture increased. And as plant biomass on sites increased, hives had greater brood production and lower pest densities. This research reinforces the importance of rangelands in supporting honey bee health (Smart et al., 2016, 2019), but adds to the dialogue that regenerative rangeland management increases the magnitude of benefit.
Grazing management was distinct between treatments. Compared to continuously grazed rangelands, regeneratively grazed sites had smaller, more densely stocked paddocks which were grazed for a shorter duration, and these paddocks experienced more rest from grazing during the growing season. The rested regenerative pastures responded with an increased number of flowering plant species, an overall increase in flowers, and a distinct floral community dominated by a different suite of species. Increased flower abundance is positively tied to pollinator performance (Kaminer et al., 2010; Brenton, 2015; Shapira et al., 2020). Regenerative grazing practices can increase bloom abundance and richness through at least two mechanisms: first by directly stimulating plant reproduction and regrowth (Sjödin, 2007; Wentao et al., 2023), and indirectly by improving soil health (Mosier et al., 2021). Intense grazing for short durations promotes the grazing-adapted plant communities that populated the prairie ecosystems, and opens new niches and microclimates necessary for plant diversification (Hickman et al., 2004; Teague et al., 2013; Schmid et al., 2024). The saliva of animals is a growth stimulant for some of these plant species (Parnell et al., 2024), and the intensity of grazing can help to reduce invasive, weedy species that reduce diversity on pastures (Teague et al., 2011; Zhang et al., 2018). Resting the pasture allows members of the plant community to reach flowering life stages that often are not attainable in continuously grazed operations (Teague and Kreuter, 2020). As there may be a cumulative grazing effect over time, grazing over the past 5–10 years could have an important effect on a focal year’s plant community; all ranches here were managed for at least 5 years in a similar way as the study year to help reduce this variability. Simpler plant communities were observed on continuously grazed pastures, and a decrease in forbs that reached a flowering stage (approximately half the flowers were present in continuously grazed sites versus regenerative sites; Table 3). Regenerative grazing can also improve soil health metrics such as water infiltration rate, soil organic carbon sequestration, soil structure, and nutrient retention (Mosier et al., 2021, 2022), all of which support plant diversification and health (Johnson et al., 2022).
Although floral resources were greater on regeneratively grazed sites, the amount of forage biomass available to grazers was not affected through regenerative grazing. This was supported by Enri et al. (2017), who found no differences in forage biomass between rotationally grazed plots (with greater biodiversity) and continuously grazed plots. Although Enri et al.’s (2017) rotational grazing system was not entirely representative of regenerative grazing, the trends in forage biomass are consistent with our observations. This similarity in forage biomass between grazing systems may have been a caveat in how we measured biomass using a compression plate. We observed that dead plant matter (duff) was generally greater in continuously grazed pastures. This is an observation that was made in another study as well (Orr et al., 2023). Duff was included in the measurement of forage biomass, and it is possible that regenerative pastures produced more living biomass than continuously grazed ones, despite similar overall plant biomass quantities between treatments.
The floral communities associated with regenerative rangeland management were correlated with greater season-long, cumulative honey bee health and productivity. Seasonal weight gain per hive over the season was greater on the regenerative sites. We hypothesize that hive health and performance is particularly influenced by whether there was scarcity in floral species richness over the season; periods of famine had season-long effects on honey bee colony growth. This concept is supported by our data that showed a significant positive relationship between minimum floral species richness and hive weight gain over the season, particularly in continuously grazed rangelands that had lower floral species richness (Figure 3). Thus, when resources are scarce, minimum floral abundances may be a more important predictor of hive growth than average floral abundances. Others have found that floral resource availability was correlated with improved honey production in rangelands and other agroecosystems (Brenton, 2015; Dolezal et al., 2016; Giacobino et al., 2017). Also, when the area and quality of floral resources are increased (using pollinator strips), colonies gain more weight (Baden-Böhm et al., 2022). These increases in floral abundance may also improve the physiological status of the colony (Vaudo et al., 2015), and influence colony outcomes of pathogen and parasite exposures (Di Pasquale et al., 2013; Zhang et al., 2020). In contrast, we found that plant biomass, but not floral richness nor abundance, was correlated with fewer Varroa mites and increased brood production (Figure 4). Brood production and honey bee immune responses are often tied to pollen availability and quality (Winston, 1991; Di Pasquale et al., 2013); if plant communities with greater biomass produced more pollen than nectar (e.g., grass dominated), then it is possible that we did not capture the full diversity of pollen availability in these habitats. In turn, this might explain why brood production would increase with plant biomass, and hive weight (i.e., honey) might be more sensitive to floral resource availability. Finally, in addition to affecting the overall flowering community, we hypothesize that regenerative grazing patterns increased the abundance of plant species that are particularly important in the nutritional ecology of honey bees. While we did not assess the nutritional differences of pollen types, certain plants (e.g., sunflower; Helianthus annuus) confer Varroa mite resistance and tolerance in honey bees (Palmer-Young et al., 2023). The floral communities on regeneratively managed rangelands had greater dominance by sweet clover and Canada goldenrod than continuously grazed sites.
In sum, management of the rangelands significantly altered flowering plant communities, and these flowering plant communities were associated with honey bee health and productivity. Regenerative grazing selected for more diverse and abundant flowering communities, with comparable plant biomass and forage quantity for cattle. This response in floral species richness in turn was associated with greater season-long, cumulative colony weight gain, and forage biomass was closely associated with increased colony productivity and reduced mite infestations. These associations are correlations that could be bi-directional in nature. We hypothesize a positive feedback loop exists in this system that is mediated by the plant community, where regenerative grazing management produces a more robust plant community that supports honey bee health, and these honey bees in turn support a stronger plant community that increases livestock performance. Future research in this system should explore the potential of this positive feedback loop to understand how honey bees may help support healthy plant communities.
Data availability statement
The raw data supporting the conclusions of this article will be made available by the authors without undue reservation.
Ethics statement
The manuscript presents research on animals that do not require ethical approval for their study.
Author contributions
KB: Project administration, Visualization, Validation, Formal analysis, Conceptualization, Data curation, Investigation, Methodology, Writing – review & editing, Writing – original draft. RS: Writing – review & editing, Conceptualization, Supervision, Investigation, Methodology, Writing – original draft, Project administration, Formal analysis, Resources, Data curation. JL: Formal analysis, Funding acquisition, Writing – review & editing, Resources, Writing – original draft, Data curation, Methodology, Validation, Visualization, Project administration, Conceptualization, Supervision.
Funding
The author(s) declare that financial support was received for the research and/or publication of this article. This research was supported by a grant from #NoRegrets Initiative.
Acknowledgments
We thank Ecdysis Foundation staff for helping to collect data and process samples, and the ranchers for allowing us to sample their operations and answering questions regarding their management. We thank two reviewers for comments on earlier drafts of the paper. Drs. Autumn Smart and Thomas Weissling provided comments on earlier drafts of the manuscript. Mark F. Longfellow gave statistical oversight.
Conflict of interest
The authors declare that the research was conducted in the absence of any commercial or financial relationships that could be construed as a potential conflict of interest.
Generative AI statement
The authors declare that no Gen AI was used in the creation of this manuscript.
Publisher’s note
All claims expressed in this article are solely those of the authors and do not necessarily represent those of their affiliated organizations, or those of the publisher, the editors and the reviewers. Any product that may be evaluated in this article, or claim that may be made by its manufacturer, is not guaranteed or endorsed by the publisher.
References
Alemu, A. W., Kröbel, R., McConkey, B. G., and Iwaasa, A. D. (2019). Effect of increasing species diversity and grazing management on pasture productivity, animal performance, and soil carbon sequestration of re-established pasture in Canadian prairie. Animals 9:127. doi: 10.3390/ani9040127
Asner, G. P., Borghi, C. E., and Ojeda, R. A. (2003). Desertification in Central Argentina: changes in ecosystem carbon and nitrogen from imaging spectroscopy. Ecol. Appl. 13, 629–648. doi: 10.1890/1051-0761(2003)013[0629:DICACI]2.0.CO;2
Asner, G. P., Elmore, A. J., Olander, L. P., Martin, R. E., and Harris, A. T. (2004). Grazing systems, ecosystem responses, and global change. Annu. Rev. Environ. Resour. 29, 261–299. doi: 10.1146/annurev.energy.29.062403.102142
Augustine, D. J., Raynor, E. J., Kearney, S. P., and Derner, J. D. (2022). Can measurements of foraging behavior predict variation in weight gains of free-ranging cattle? Anim. Prod. Sci. 62, 926–936. doi: 10.1071/AN21560
Baden-Böhm, F., Thiele, J., and Dauber, J. (2022). Response of honey bee colony size to flower strips in agricultural landscapes depends on areal proportion, spatial distribution, and plant composition. Basic Appl. Ecol. 60, 123–138. doi: 10.1016/j.baae.2022.02.005
Bee Informed Partnership. (2022). Commercial beekeeping guide. Web-based document. Available online at: https://beeinformed.org/wp-content/uploads/2022/02/2022_BIP-Inspection-CheatsheetsBP.pdf (Accessed September 10, 2024).
Black, S. H., Shepherd, M., and Vaughan, M. (2011). Rangeland management for pollinators. Rangelands 33, 9–13. doi: 10.2111/1551-501X-33.3.9
Bond, J. K., Hitaj, C., Smith, D., Hunt, K., Perez, A., Ferreira, G., et al. (2021). Honey bees on the move: from pollination to honey production and back. USDA Miscellaneous 312286. Washington, DC: United States Department of Agriculture.
Brenton, S. (2015). Effects of livestock grazing on honey production in a mediterranean rangeland system. (Master’s thesis): University of Michigan.
Campbell, A., and King, A. E. H. (2022). Choosing sustainability: decision making and sustainable practice adoption with examples from U.S. great plains cattle grazing systems. Animals 12:3. doi: 10.3390/ani12030286
Cao, C., Shuai, L.-Y., Xin, X.-P., Liu, Z.-T., Song, Y.-L., and Zeng, Z.-G. (2016). Effects of cattle grazing on small mammal communities in the Hulunber meadow steppe. PeerJ 4:e2349. doi: 10.7717/peerj.2349
Di Pasquale, G. D., Salignon, M., Conte, Y. L., Belzunces, L. P., Decourtye, A., Kretzschmar, A., et al. (2013). Influence of pollen nutrition on honey bee health: do pollen quality and diversity matter? PLoS One 8:e72016. doi: 10.1371/journal.pone.0072016
Dietemann, V., Nazzi, F., Martin, S. J., Anderson, D. L., Locke, B., Delaplane, K. S., et al. (2013). Standard methods for Varroa research. J. Apic. Res. 52, 1–54. doi: 10.3896/IBRA.1.52.1.09
Divinsky, I., Becker, N., and Bar (Kutiel), P. (2017). Ecosystem service tradeoff between grazing intensity and other services—a case study in Karei-Deshe experimental cattle range in northern Israel. Ecosyst. Serv. 24, 16–27. doi: 10.1016/j.ecoser.2017.01.002
Dolezal, A. G., Carrillo-Tripp, J., Miller, W. A., Bonning, B. C., and Toth, A. L. (2016). Intensively cultivated landscape and Varroa mite infestation are associated with reduced honey bee nutritional state. PLoS One 11:e0153531. doi: 10.1371/journal.pone.0153531
Enri, S. R., Probo, M., Farruggia, A., Lanore, L., Blanchetete, A., and Dumont, B. (2017). A biodiversity-friendly rotational grazing system enhancing flower-visiting insect assemblages while maintaining animal and grassland productivity. Agric. Ecosyst. Environ. 241, 1–10. doi: 10.1016/j.agee.2017.02.030
Fenster, T. L. D., LaCanne, C. E., Pecenka, J. R., Schmid, R. B., Bredeson, M. M., Busenitz, K. M., et al. (2021). Defining and validating regenerative farm systems using a composite of ranked agricultural practices. F1000Research 10:115. doi: 10.12688/f1000research.28450.1
Garrett, K., Beck, M. R., Marshall, C. J., Fleming, A. E., Logan, C. M., Maxwell, T. M. R., et al. (2021). Functional diversity vs. monotony: the effect of a multiforage diet as opposed to a single forage diet on animal intake, performance, welfare, and urinary nitrogen excretion. J. Anim. Sci. 99:skab058. doi: 10.1093/jas/skab058
Gartner, F. R., and Sieg, C. H. (1996). South Dakota rangelands: more than a sea of grass. Rangelands 18, 212–216.
Giacobino, A., Pacini, A., Molineri, A., Bulacio Cagnolo, N., Merke, J., Orellano, E., et al. (2017). Environment or beekeeping management: what explains better the prevalence of honey bee colonies with high levels of Varroa destructor? Res. Vet. Sci. 112, 1–6. doi: 10.1016/j.rvsc.2017.01.001
Goosey, H. B., Smith, J. T., O’Neill, K. M., and Naugle, D. E. (2019). Ground-dwelling arthropod community response to livestock grazing: implications for avian conservation. Environ. Entomol. 48, 856–866. doi: 10.1093/ee/nvz074
Graham, M., Ates, S., Melathopolous, A. P., Moldenke, A. R., DeBano, S. J., Best, L. R., et al. (2021). Partial shading by solar panels delays bloom, increases floral abundance during the late-season for pollinators in a dryland, agrivoltaics ecosystem. Sci. Rep. 11:7452. doi: 10.1038/s41598-021-86756-4
Hickman, K. R., Hartnett, D. C., Cochran, R. C., and Owensby, C. E. (2004). Grazing management effects on plant species diversity in tallgrass prairie. J. Range Manag. 57, 58–65. doi: 10.2307/4003955
Hulvey, K. B., Mellon, C. D., and Kleinhesselink, A. R. (2021). Rotational grazing can mitigate ecosystem service trade-offs between livestock production and water quality in semi-arid rangelands. J. Appl. Ecol. 58, 2113–2123. doi: 10.1111/1365-2664.13954
James, R. E. (2011). “Replacement management in cattle growth diets” in Encyclopedia of dairy sciences. ed. J. W. Fuquay. 2nd ed (Cambridge, MA: Academic Press), 403–409.
Johnson, J. R., and Larson, G. E. (2007). Grassland plants of South Dakota and the northern Great Plains. South Dakota State Univ. Bull. B 566:288 pps.
Johnson, D. C., Teague, R., Apfelbaum, S., Thompson, R., and Byck, P. (2022). Adaptive multi-paddock grazing management’s influence on soil food web community structure for: increasing pasture forage production, soil organic carbon, and reducing soil respiration rates in southeastern USA ranches. PeerJ 10:e13750. doi: 10.7717/peerj.13750
Kaminer, A., Kigel, J., Dag, A., and Henkin, Z. (2010). An assessment of short-term cattle grazing effects on honey bee forage potential in Mediterranean rangelands. Contrib. Grasslands Conserv. Mediterr. Biodiv. 92, 205–208.
Leal, A. I., Acácio, M., Meyer, C. F. J., Rainho, A., and Palmeirim, J. M. (2019). Grazing improves habitat suitability for many ground foraging birds in Mediterranean wooded grasslands. Agric. Ecosyst. Environ. 270-271, 1–8. doi: 10.1016/j.agee.2018.10.012
Mosier, S., Apfelbaum, S., Byck, P., Calderon, F., Teague, R., Thompson, R., et al. (2021). Adaptive multi-paddock grazing enhances soil carbon and nitrogen stocks and stabilization through mineral association in southeastern U.S. grazing lands. J. Environ. Manag. 288:112409. doi: 10.1016/j.jenvman.2021.112409
Mosier, S., Apfelbaum, S., Byck, P., Ippolito, J., and Cotrufo, M. F. (2022). Improvements in soil properties under adaptive multipaddock grazing relative to conventional grazing. Agron. J. 114, 2584–2597. doi: 10.1002/agj2.21135
[NASS] National Agricultural Statistics Service (2025). Web-based document. Available online at: https://downloads.usda.library.cornell.edu/usda-esmis/files/hd76s004z/hm50wd54j/fq979h127/hony0324.pdf (Accessed March 28, 2025).
Ollerton, J., Winfree, R., and Tarrant, S. (2011). How many flowering plants are pollinated by animals? Oikos 120, 321–326. doi: 10.1111/j.1600-0706.2010.18644.x
Orr, D. A., Bates, J. D., and Davies, K. W. (2023). Grazing intensity effects on fire ignition risk and spread in sagebrush steppe. Rangel. Ecol. Manag. 89, 51–60. doi: 10.1016/j.rama.2022.08.004
Palmer-Young, E. C., Malfi, R., Zhou, Y., Joyce, B., Whitehead, H., Van Wyk, J. I., et al. (2023). Sunflower-associated reductions in Varroa mite infestation of honey bee colonies. J. Econ. Entomol. 116, 68–77. doi: 10.1093/jee/toac196
Parnell, D., Merchant, A., and Ingram, L. (2024). Is animal saliva a prominent factor in pasture regrowth? Crop Pasture Sci. 75:CP23201. doi: 10.1071/CP23201
Pecenka, J. R., and Lundgren, J. G. (2019). Effects of herd management and the use of ivermectin on dung arthropod communities in grasslands. Basic Appl. Ecol. 40, 19–29. doi: 10.1016/j.baae.2019.07.006
Pollard, E. (1977). A method for assessing changes in the abundance of butterflies. Biol. Conserv. 12, 115–134. doi: 10.1016/0006-3207(77)90065-9
Potts, S. G., Biesmeijer, J. C., Kremen, C., Neumann, P., Schweiger, O., and Kunin, W. E. (2010). Global pollinator declines: trends, impacts and drivers. Trends Ecol. Evol. 25, 345–353. doi: 10.1016/j.tree.2010.01.007
Power, A. G. (2010). Ecosystem services and agriculture: tradeoffs and synergies. Philos. Trans. Roy. Soc. B 365, 2959–2971. doi: 10.1098/rstb.2010.0143
Reilly, J. R., Artz, D. R., Biddinger, D., Bobiwash, K., Boyle, N. K., Brittain, C., et al. (2020). Crop production in the USA is frequently limited by a lack of pollinators. Proc. R. Soc. B Biol. Sci. 287:20200922. doi: 10.1098/rspb.2020.0922
Robertson, S. M., Schmid, R. B., and Lundgren, J. G. (2023). Estimating plant biomass in agroecosystems using a drop-plate meter. PeerJ 11:e15740. doi: 10.7717/peerj.15740
Schmid, R. B., Welch, K. D., and Lundgren, J. G. (2025). Regenerative management increases the efficacy of dung arthropod communities. Front. Sustain. Resour. Manag. 4:1523963. doi: 10.3389/fsrma.2025.1523963
Schmid, R. B., Welch, K. D., Teague, R., and Lundgren, J. G. (2024). Adaptive multipaddock (AMP) pasture management increases arthropod community guild diversity without increasing pests. Rangel. Ecol. Manag. 94, 141–148. doi: 10.1016/j.rama.2024.03.001
Shapira, T., Henkin, Z., Dag, A., and Mandelik, Y. (2020). Rangeland sharing by cattle and bees: moderate grazing does not impair bee communities and resource availability. Ecol. Appl. 30:e02066. doi: 10.1002/eap.2066
Sjödin, N. E. (2007). Pollinator behavioral responses to grazing intensity. Biodivers. Conserv. 16, 2103–2121. doi: 10.1007/s10531-006-9103-0
Smart, M., Otto, C. R. V., and Lundgren, J. G. (2019). Nutritional status of honey bee (Apis mellifera L.) workers across an agricultural land-use gradient. Sci. Rep. 9:16252. doi: 10.1038/s41598-019-52485-y
Smart, M., Pettis, J., Euliss, N., and Spivak, M. (2016). Land use in the northern Great Plains region of the U.S. influences the survival and productivity of honey bee colonies. Agric. Ecosyst. Environ. 230, 139–149. doi: 10.1016/j.agee.2016.05.030
Teague, W. R., Dowhower, S. L., Baker, S. A., Haile, N., DeLaune, P. B., and Conover, D. M. (2011). Grazing management impacts on vegetation, soil biota and soil chemical, physical and hydrological properties in tall grass prairie. Agric. Ecosyst. Environ. 141, 310–322. doi: 10.1016/j.agee.2011.03.009
Teague, R., and Kreuter, U. (2020). Managing grazing to restore soil health, ecosystem function, and ecosystem services. Front. Sustain. Food Syst. 4:534187. doi: 10.3389/fsufs.2020.534187
Teague, W. R., Provenza, F., Kreuter, U., Steffens, T., and Barnes, M. (2013). Multi-paddock grazing on rangelands: why the perceptual dichotomy between research results and rancher experience? J. Environ. Manag. 128, 699–717. doi: 10.1016/j.jenvman.2013.05.064
Vaudo, A. D., Tooker, J. F., Grozinger, C. M., and Patch, H. M. (2015). Bee nutrition and floral resource restoration. Curr. Opin. Insect Sci. 10, 133–141. doi: 10.1016/j.cois.2015.05.008
Welch, K. D., Wilson, M. E., and Lundgren, J. G. (2025). Evaluation of a software platform for AI-assisted bioinventories of arthropods. J. Anim. Ecol. in press
Wentao, M., Shiming, T., Le, Q., Weibo, R., Fry, E. L., De Long, J. R., et al. (2023). Grazing reduces plant sexual reproduction but increases asexual reproduction: a global meta-analysis. Sci. Total Environ. 879:162850. doi: 10.1016/j.scitotenv.2023.162850
Wright, C. L., and Wimberley, M. C. (2013). Recent land use change in the western corn belt threatens grasslands and wetlands. Proc. Natl. Acad. Sci. U.S.A. 110, 4134–4139. doi: 10.1073/pnas.1215404110
Zhang, C., Dong, Q., Chu, H., Shi, J., Li, S., Wang, Y., et al. (2018). Grassland community composition response to grazing intensity under different grazing regimes. Rangel. Ecol. Manag. 71, 196–204. doi: 10.1016/j.rama.2017.09.007
Keywords: adaptive multi-paddock grazing, Apis mellifera, cattle, flowers, rotational grazing
Citation: Busenitz KM, Schmid RB and Lundgren JG (2025) Regenerative rangeland management improves honey bee health and productivity. Front. Sustain. Food Syst. 9:1555238. doi: 10.3389/fsufs.2025.1555238
Edited by:
Robert Hunter Manson, Instituto de Ecología (INECOL), MexicoReviewed by:
Eric Vides-Borrell, El Colegio de la Frontera Sur, MexicoSandra DeBano, Oregon State University, United States
Scott Mitchell, Oregon State University, United States, in collaboration with reviewer SD
Copyright © 2025 Busenitz, Schmid and Lundgren. This is an open-access article distributed under the terms of the Creative Commons Attribution License (CC BY). The use, distribution or reproduction in other forums is permitted, provided the original author(s) and the copyright owner(s) are credited and that the original publication in this journal is cited, in accordance with accepted academic practice. No use, distribution or reproduction is permitted which does not comply with these terms.
*Correspondence: Jonathan G. Lundgren, am9uYXRoYW4ubHVuZGdyZW5AZWNkeXNpcy5iaW8=