 L. R. Thompson
 M. R. Beck
 H. Larson3
 K. R. Stackhouse-Lawson
- 1Department of Animal Science and Industry, Kansas State University, Manhattan, KS, United States
- 2Department of Animal Science, Texas A&M University, College Station, TX, United States
- 3Kansas State University, Olathe, KS, United States
- 4Department of Animal Science, Michigan State University, East Lansing, MI, United States
- 5Department of Animal Sciences, AgNext, Colorado State University, Fort Collins, CO, United States
The objective of this review and modeling effort is to define climate neutrality as it relates to beef and dairy production, and to introduce accounting methods that will help guide the livestock industry’s ability to achieve climate targets, to summarize emission mitigation strategies, and present potential scenarios to achieve climate neutral emissions for the beef and dairy industries. The global target to limit global warming to 1.5°C above pre-industrial levels by 2050 has resulted in many companies, including agribusiness companies, setting voluntary emission reduction targets. The main concept behind these goals is that GHG emissions do not exceed the GHG removed from the atmosphere by GHG sinks. Where multiple greenhouse gases are involved, the quantification of climate neutral emissions depends on the climate metric and time horizon chosen to place these gases on an equivalent basis (e.g., global warming potential, and global warming potential-star). As the ruminant supply chain emits both short-lived (methane; CH4) and long-lived (carbon dioxide and nitrous oxide) GHGs, how companies choose to account for these gases will impact their progress toward these goals. Further, mitigation strategies for beef and dairy systems have predominantly focused on enteric CH4 emissions and soil C sequestration. However, several hurdles still exist to reduce emissions by the magnitude required to realistically achieve a net zero supply chain. Determining the ability of a system to be climate neutral is a complicated and complex process and will not be achieved by a “silver bullet” approach. The scientific community will need to develop multiple mitigation strategies that are regionally and contextually adaptable.
1 Introduction
As the climate change crisis becomes more pressing, the call for companies and individuals to act has intensified. Atmospheric carbon dioxide (CO2) levels have been rising rapidly since the start of the industrial revolution and were higher in 2019 than any time in the last 2 million years (IPCC, 2021). In a recent re-analysis of climate change over the last 24,000 years, Osman et al. (2021) reported that the current rate and change of global temperature is unprecedented. They indicated in the last 200 years there was an approximate 2°C increase in global mean surface temperature, which is a 180 times greater rate of change compared to the 0.5°C increase in global mean surface temperature increase from the 9,000 years prior (Osman et al., 2021). There is little uncertainty that human influence (i.e., anthropogenic emissions) is a primary driver of this change, and that continued impact is projected as global fossil fuel use continues to rise (IPCC, 2021). Increased atmospheric greenhouse gas (GHG) concentration has resulted in increased global mean surface temperature, greater variability in temperature and precipitation extremes and more frequent adverse weather events (IPCC, 2021; USGCRP, 2018). This trajectory led to the ratification of the Paris Climate Accord, which originally set a temperature target of a maximum 2.0°C rise in global average temperature—relative to a pre-industrial revolution baseline—and a more aggressive target of a maximum 1.5°C rise by 2,100 (UNFCCC, 2015). Further targets have been set since the ratification of the Paris Climate Accord, including the Global Methane pledge which aims to reduce global methane emissions by at least 30% by 2030, relative to a 2020 baseline. Such targets have major ramifications for livestock production, as enteric CH4 emissions represent 5% of global anthropogenic GHG emissions and 27% of anthropogenic CH4 emissions according to the IPCC sixth assessment report (Dhakal et al., 2023).
Historically, considerable effort has been directed at improving production efficiency. Resulting from this increased production efficiency, the carbon footprint (i.e., GHG emissions per unit of product) have been reduced substantially (Beauchemin et al., 2020). However, while improved efficiency is beneficial, a reduction in absolute emissions must occur to prevent further climate change, especially to achieve the targets set by the Paris Climate Accord and other climate pledges. These pledges necessitate a quantitative limit on the amount of CO2 that can be emitted, requiring all sectors—regardless of relative contribution – to reduce their emissions to meet the goals (Rogelj et al., 2016). In the United States during 2022, the agriculture sector was responsible for 9.4% of all GHG, while transportation was responsible for 28.4%, electricity generation was responsible for 25%, and industry (cement, iron, steel, aluminum, etc.) was responsible for 23% (EPA, 2024). The only two sectors emitting fewer GHG emissions in 2022 than agriculture were the commercial (7.3%) and residential (6.2%) sectors (EPA, 2024). In 2022, agricultural soil management accounted for 49% and enteric methane (CH4) accounted for 32.5% of U.S. agricultural GHG emissions, indicating priority focus should be given to reducing emissions from these sources (EPA, 2024). Beef and dairy enteric CH4 represented 2.2% and 0.8% of all GHG emissions in the US in 2024, respectively (EPA, 2024). Despite contributing a relatively small portion of the United States’ emissions, animal agriculture must reduce emissions to meet the previously mentioned climate pledges such as that of the global methane pledge.
Outside of inter-governmental agreements, many food and agriculture companies have made commitments to reduce GHG emissions and increase offsets to reduce their contribution to climate change. Beef and dairy supply-chain and producer organizations in the U.S. have begun to make “net zero” or “climate neutral” or similar commitments. What these specific commitments mean, and their implications will be discussed in detail in later sections. These goals, while laudable, will require considerable economic investment, producer buy-in and scientific research to aid policy makers and stakeholders in developing roadmaps toward achieving such goals. However, no clear roadmap “net zero” or “climate neutral” currently exists and organizational climate goal definitions can be inconsistent. Therefore, the purpose of this review is to set the table for achieving climate goals by drawing from scientific literature, special reports, and white papers to define net zero and climate neutral, outlining current mitigation strategies, and discussing potential pathways for the U.S. beef and dairy industry to achieve net zero.
2 Emission changes over time
Agriculture is a direct contributor of GHG emissions, with CH4, nitrous oxide (N2O), and CO2 being the primary GHG produced (EPA, 2024; Figures 1, 2). In 2022, the U.S. agriculture sector produced a total of 8,595 kt of CO2, 9,885 kt of CH4, and 1,162 kt of N2O (EPA, 2024). Greenhouse gas emissions can be considered in absolute emissions amounts, such as kt of the specific gas emitted as presented in the prior sentence, or in amounts of carbon dioxide equivalents (CO2-e). Carbon dioxide equivalents allow for comparison of the radiative forcing ability of different gases and equate it to the radiative forcing ability of CO2 (termed the global warming potential; GWP). As such, CO2 always has a CO2-e of 1, and for GWP on a 100-year time-horizon (GWP100), CH4 and N2O have CO2-e of 28–36 and 265–298, respectively (IPCC, 2021). Therefore, the U.S. agriculture sector emitted 593.4 MMT of CO2-e from CO2, CH4, and N2O. This represents approximately 9.4% of total U.S. GHG emissions (EPA, 2024).
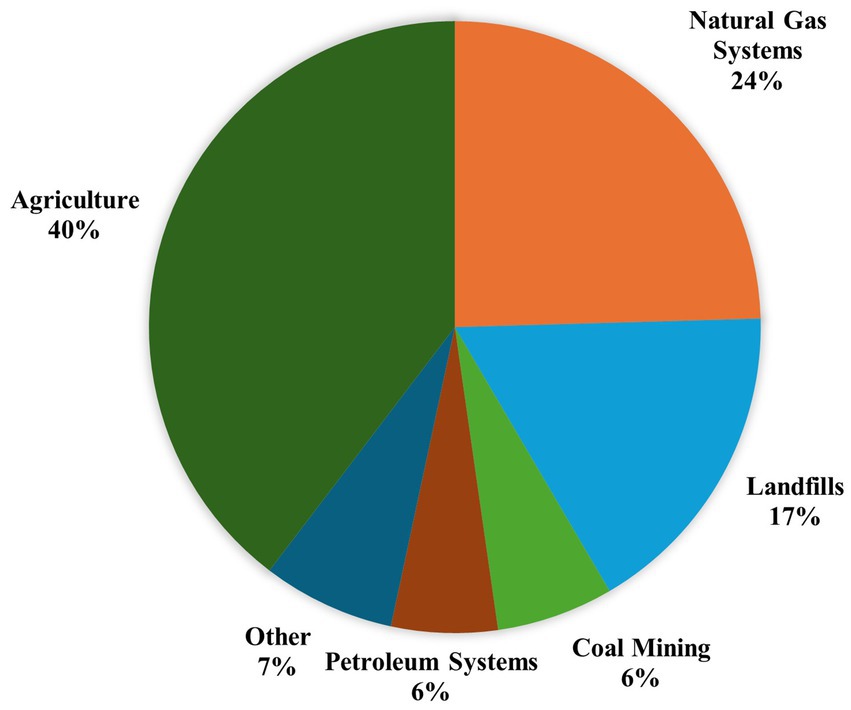
Figure 1. U.S. CH4 emissions by Source, 2022 (percent of MMT CO2eq.) adapted from EPA (2024).
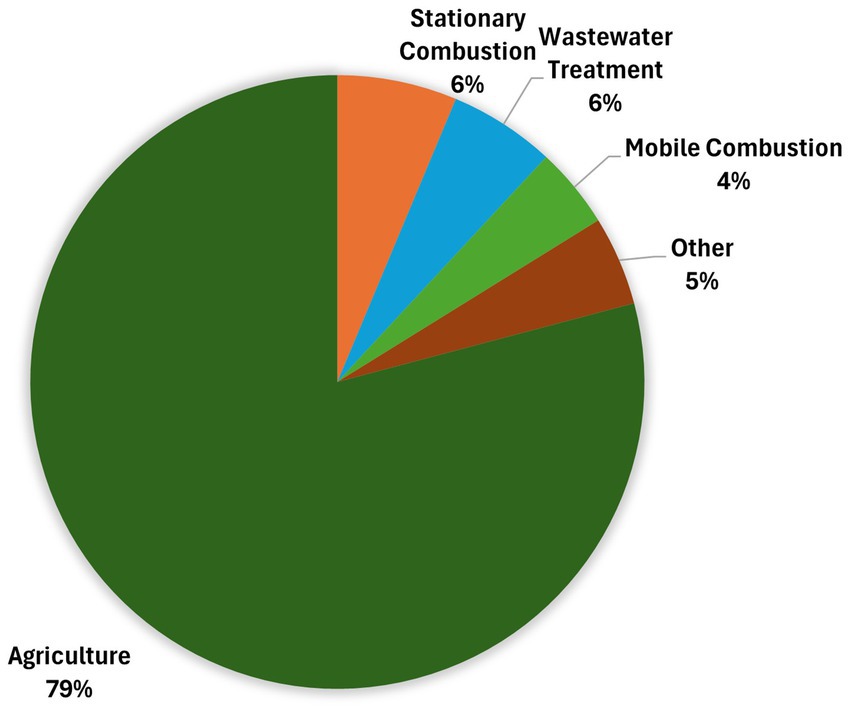
Figure 2. U.S. N2O emissions by Source, 2022 (percent of MMT CO2eq.) adapted from EPA (2024).
Since 1970, there has been a 1.4-fold increase in the global number of cattle, buffalo, sheep, and goats, which is closely linked to trends in reported CH4 emissions from enteric fermentation of ruminants (Beck et al., 2023a; IPCC, 2014). However, for achieving net zero, global statistics do not provide insight into place-specific emissions profiles, causes for those emissions, and options for mitigation. As such, it is important to consider U.S. specific trends. From 1990 to 2022, GHG from U.S. agriculture has increased by 7.2%, due to increased demand for food products from growing populations, increase in N2O emissions from management of soils, and increased CH4 and N2O emissions from manure management systems (EPA, 2024). Emissions from enteric fermentation have also increased by 5% from 1990 to 2022 (EPA, 2024). However, while absolute emissions have increased, emissions per unit of product produced have been decreasing which indicates increased efficiency of production of animal products (EPA, 2024; Crawford et al., 2022; Capper et al., 2009).
Historically, wild ruminant populations—specifically Bison—may have been large enough that their methane emissions were near the current emissions from livestock until their extermination in the mid-1800s (Hristov, 2012; Kelliher and Clark, 2009). To date, minimal research has examined emissions of wild ruminant herds or historic populations, but wild ruminants have always inhabited North America and how this may help contextualize emissions from contemporary livestock production, which has since replaced wild ruminants (Hristov, 2012). Hristov (2012) estimated the historic enteric methane emissions from wild ruminants in the U.S. and compared them to present day farmed ruminants and reported emissions were approximately 86% of today’s emissions when the bison population was estimated to be 50 million. Similarly, Kelliher and Clark (2009) used IPCC tier 2 methodology to estimate emissions from the historic Northern Great Plains bison and compared them to today’s farmed ruminants across the same landscape. They reported the historic herd produced 2.2 MMT/CH4 yr.−1 compared to 2.5 MMT/CH4 yr.−1 from today’s ruminants. Smith et al. (2015) investigated the historical extirpation or reduction of large herbivores including that of the American bison and the subsequent biogeochemical effects of these events. The authors found that while the emission reduction from this event was not as significant as others from the historical record, their estimate was like Kelliher and Clark (2009) with a reduction of 2.2 MMT/CH4 yr.−1. While these studies provide an example of the magnitude of emissions that may have arisen from wild ruminants, more work is needed to understand how these historic populations influenced short-term temperature change. Such research would help contextualize how alterations in modern emissions rates from the beef and dairy sectors may impact global temperatures. Additionally, many of the animals today are fed in confinement operations, and therefore have different impacts with the surrounding ecosystems (e.g., water quality, air quality, etc.) than historic herbivores.
Recent data shows that the beef and dairy sectors have succeeded in reducing environmental impacts per unit of product produced compared to historical estimates (Crawford et al., 2022; Capper and Cady, 2019; Capper, 2011; Capper et al., 2009). Over time, animal agriculture has increased its efficiency by producing more products with less resources, resulting in a lower GHG emissions footprint per unit of product (Rotz et al., 2021; Capper, 2011; Capper et al., 2009). In a comparative analysis of the U.S. dairy industry, emission estimates from 1944 to 2007 were compared and it was found that the environmental impact of milk production was overall reduced by 37%, with a 64% reduction in dairy cattle population and a 57% reduction in CH4 per unit of product produced (referred to as emission intensity—GHG per unit of product produced; Capper et al., 2009). Advances in dairy cattle nutrition, genetics, management, and health have led to greater efficiency and productivity (Capper and Cady, 2019). Through this, U.S. dairy can produce more milk, with fewer resources, meaning fewer animals requiring less feedstuffs, less water, and less land (Capper et al., 2009). In dairy systems, total manure output has also decreased by 20.6% from 1944 to 2007 (Capper and Cady, 2019). This results in lower CH4 and N2O emissions from manure and manure storage. Furthermore, Cole and Van Raden (2011) reported that there is still genetic potential for improvements in milk yield and milk production does not appear to be approaching a biological maximum.
Similarly, the U.S. beef industry has seen improvements between historic and modern emission intensity estimates (Capper, 2011). In 2007, beef production systems produced 81.9% of the manure, 82.3% of the CH4, and 88.0% of N2O per beef produced relative to 1977 (Capper, 2011). Additionally, it required only 69.9% of the animals, 67% of the land and reduced the C footprint by 16.3% relative to 1977. In a more recent comparative analysis, Crawford et al. (2022) compared the carbon footprint of finishing cattle during 1990 and 2020. They reported that in 2020 the carbon footprint was 4.4% lower, with 47.5% more body weight gain, and 1.4% less cattle relative to 1990. However, absolute emissions in CO2-e were increased by 39.5% over this period. This increase in absolute GHG emissions by the feedlot sector was due in part to an increased number of days on feed and subsequent increasing dry matter intake. The authors argue that by increasing days spent in the feedlot and decreasing days spent in the cow-calf and stocker sectors should decrease the overall carbon footprint of the beef industry (Crawford et al., 2022). This agreed with Stackhouse-Lawson et al. (2012) who reported that if the stocker sector was removed, absolute emissions in CO2-e may be reduced by 6.5% in California. However, increasing reliance on diets high in starch would reduce the advantage that ruminant species have in converting complex carbohydrates and untillable land into human-edible protein (Carvalho et al., 2018). Further, this would require an increase in feed production from cropping systems, which is already a challenge in many regions due to drought and shrinking aquifer levels.
It is important to consider the difference between absolute emissions and emission intensity and their implications for climate related pledges made by governments and companies. Emission intensity is the GHG emitted per unit of product, whereas absolute emissions are the total emissions of a production system. Both absolute emissions and emission intensities need to be reduced to meet climate goals while also balancing other complex issues like global food supply, rural livelihoods, and cultural values. To meet the growing population’s demand for food products, agriculture will have to continue to increase production. If the necessary decreases in emissions intensity occur at a similar rate to the needed increase in production, the absolute emissions will remain constant (Ungerfeld et al., 2022). If absolute emissions remain constant, the set climate goals will not be met. As such, improving animal productivity and emissions intensity is not enough to achieve the necessary reductions in absolute emissions (Ungerfeld et al., 2022). Historically, animal agriculture has been producing more products more efficiently through reducing emissions intensity, but has increased absolute emissions (Crawford et al., 2022). Therefore, there are still considerable improvements that need to occur to reduce both emissions intensity and absolute emissions if the industry is going to meet its climate goals as described in the following section.
3 What is net zero and climate neutral?
There are numerous terms used in the sustainability space to describe climate goals (Table 1). Net zero, net zero carbon, net zero emissions, climate neutrality, and carbon neutrality are all interrelated terms that have slightly differing definitions and implications. The main concept behind these goals is that GHG emissions (of one or many gases) from sources do not exceed the GHG removed from the atmosphere by sinks. However, different stakeholders may choose to use one term over another to be more specific or highlight a difference in their specific goals toward lower impact production.
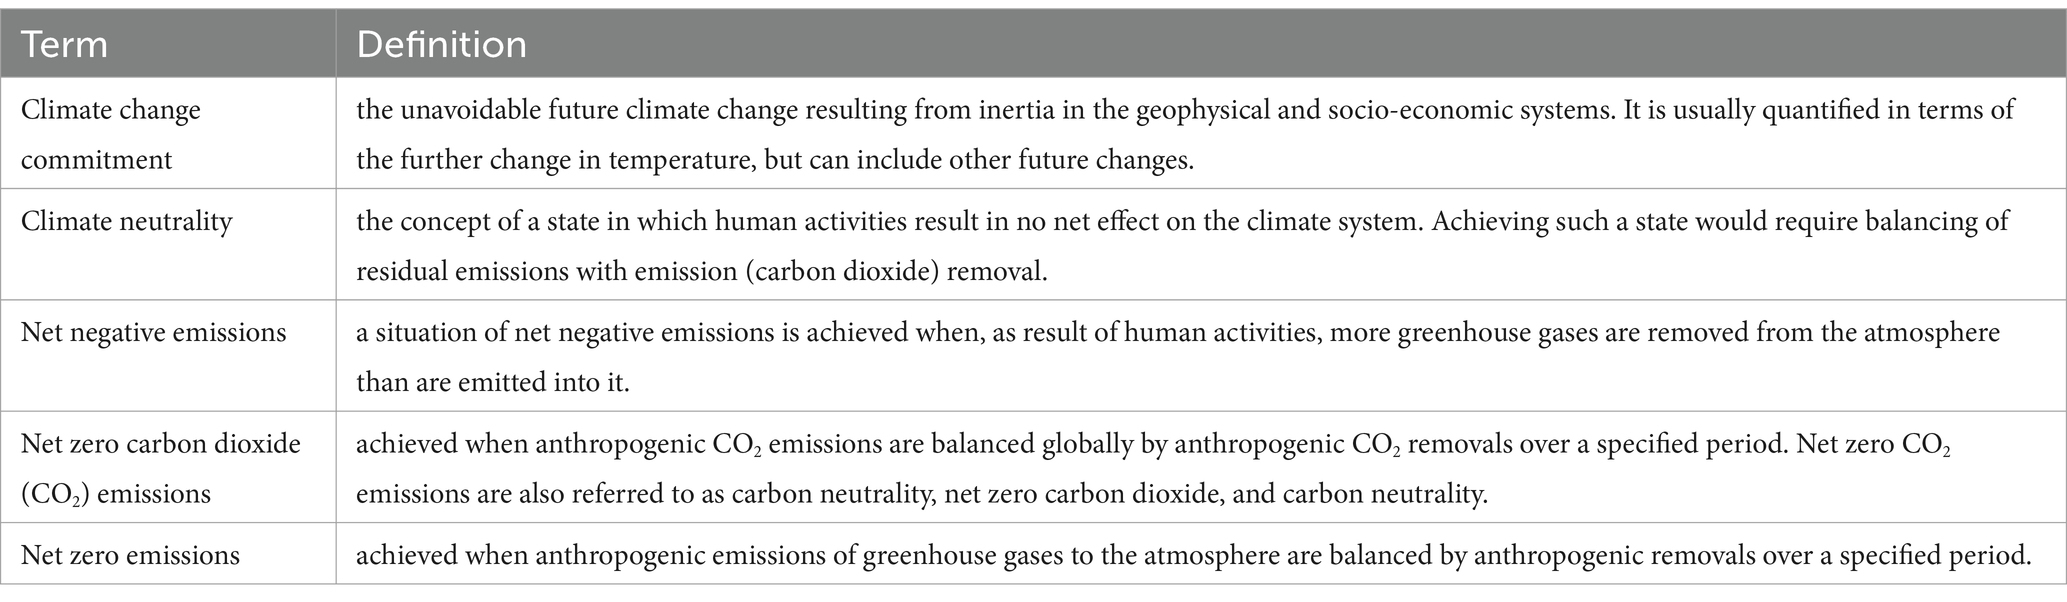
Table 1. IPCC (2018) definitions related to climate goals.
All organizations have a balance between their positive and negative impacts on the environment, and their actions to counteract any negative externalities. This balance is either net negative, net zero, or net positive. In other words, overall impacts and counteractions will result in either an overall negative impact on the environment (net negative), an overall positive impact on the environment (net positive), or overall no impact on the environment (net zero).
According to the EPA (2021), net zero and net positive strategies are long-term solutions for sustainability and help build resilience by meeting environmental objectives. These strategies represent sustainability in action (EPA, 2021), although we have yet to see how the public and political systems will react to an organization’s failure to achieve climate benchmarks due to the long-time horizon companies have given themselves to achieve their commitments. The EPA focuses net zero and net positive strategies on water, energy, and waste. However, many organizations only focus on net zero GHG emissions, whether that be net zero emissions or net zero carbon. Of note, some company commitments are not transparent in what their target is (i.e., absolute vs. emission intensity) or what plans are in place to achieve these emissions. Additionally, in the future, it may be important to expand past emission goals and consider water, energy, and waste goals as well.
Net zero can be broken down further into net zero emissions (all GHG) and net zero carbon (CO2). Net zero emissions were defined by the IPCC (2018) as: when anthropogenic emissions of greenhouse gases to the atmosphere are balanced by anthropogenic removals over a specified time. Net zero emissions including all greenhouse gas (GHG) emissions adds complexity to accounting and determining net zero.
Net zero carbon also known as net zero CO2 emissions or carbon neutrality were defined by the IPCC (2018) as: when anthropogenic CO2 emissions are balanced by anthropogenic CO2 removals over a specified time. The IPCC (2021) states that achieving global net zero CO2 emissions is necessary to stabilize the CO2-induced global climate change.
Climate neutrality was defined by the IPCC (2018) as a state in which human activities result in no net effect on the climate system. Achieving climate neutrality would require reducing emissions and balancing any remaining emissions with emission removal (IPCC, 2018).
3.1 Goals of industry
Numerous net zero and climate neutrality commitments have been made by countries, private sector companies, as well as producer organizations along the agriculture/food system value chain (Ungerfeld et al., 2022). For example, the National Cattlemen’s Beef Association has set a goal to “demonstrate the climate neutrality of U.S. cattle production by 2040” and U.S. Dairy has created an initiative to “achieve GHG neutrality” by 2050 (NCBA, 2021; U.S. Dairy, 2020). As seen in Table 2 commitments differ greatly among different companies and organizations, varying in terms used, definitions, baseline year, and goal year. This choice of terminology can reflect vastly different outcomes and can lead to confusion for stakeholders. For example, the original commitment made by the Innovation Center for U.S. Dairy was to achieve carbon neutrality (U.S. Dairy, 2020), which is now changed to GHG neutrality (U.S. Dairy, 2023). According to the IPCC definitions, the original goal would have been only focused on anthropogenic CO2 emissions, but not inclusive of CH4 which is the primary GHG from the dairy industry. However, their updated choice of terms is now inclusive of all GHG emissions. With respect to the U.S. supply chain, most organizations have aligned internal commitments with those of the producer organizations. The chosen term and definition for a net zero or climate neutrality goal, as well as the scope, and the accounting metrics utilized to determine both baseline and progress, greatly impacts the ability of any stakeholder to achieve a set goal. Globally, Seneviratne et al. (2021) states with high confidence that reaching and sustaining global net zero CO2 emissions and reducing non-CO2 emissions radiative forcing would halt human-caused climate change. As such, achieving net zero CO2 emissions is required and should be included in all net zero and climate neutral goals. This indicates for many non-agriculture companies that current work toward net zero should focus heavily on CO2 emissions being at least equal to CO2 sequestration and offsets, and then toward mitigating non-CO2 emissions. However, for ruminant livestock this would obviously not hold true due to the predominate emission source being enteric CH4 production.
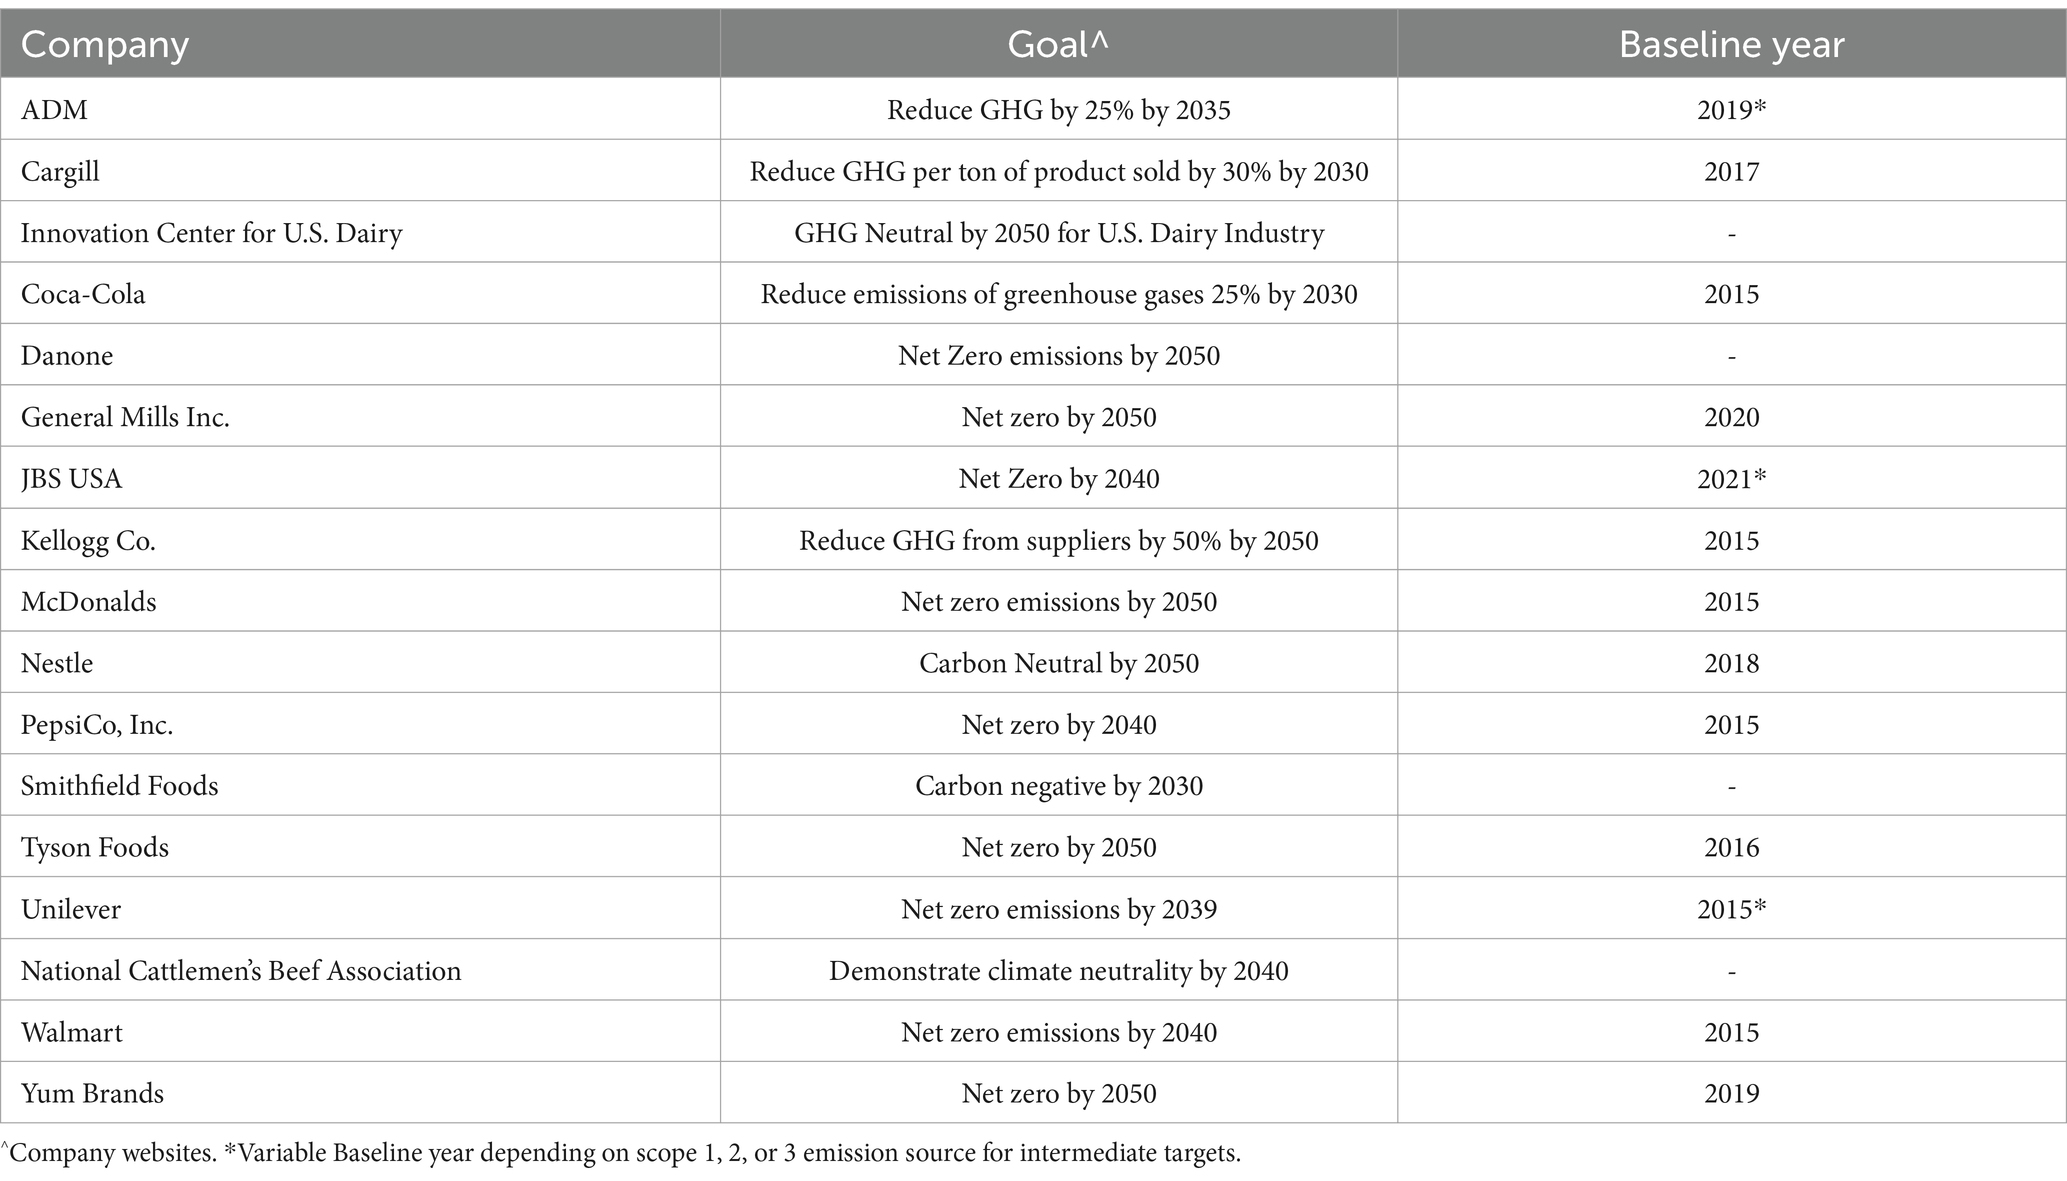
Table 2. Current company climate commitments.
While not reflected in Table 2 many of the food and beverage company commitments have variable intermediate targets set to benchmark and, ultimately, achieve their larger, more ambitious targets. These intermediate targets are typically differentiated by scope, i.e., Scope 1 (direct emissions from operations), Scope 2 (indirect emissions from company activities but not controlled by the company), and Scope 3 (indirect emissions related to their products) (WRI and WBCSD, 2004). For agriculture companies, the largest source of emissions, typically, comes from scope 3 emission sources. That is, emissions that arise in the rearing and production of livestock animals, which is often greater than 50% of the company GHG emissions, although not every company reports these emissions directly due to the complexity of a global food supply chain and product sourcing (JBS, 2023; Tyson, 2023). This has manifested a new reality for the beef and dairy supply chain, in that these company commitments alongside global markets will shape livestock production methods for the producers within their supply chains (Leahy et al., 2020), and will likely increase the need for traceability of products and animals.
4 Accounting metrics
Carbon dioxide, CH4 and N2O are the predominant contributing GHG to global climate change and beef and dairy systems are important contributors of CH4 and N2O. For accounting of climate impacts between companies, industries, etc., it is necessary to relate different GHG to an equivalent basis. Typically, non-CO2 emissions are reported using GWP100 with CO2 as the reference gas. As the reference gas CO2 has a GWP100 of 1, CH4 has a GWP100 of 28–36, and N2O has a GWP100 of 265–298 (IPCC, 2021). By using a static weighting factor based on the radiative forcing of different gases over the selected time horizon, the GWP100 approach implements a simplified means to relate different GHG to an equivalent basis. While providing consistent reporting, this type of metric has inherent flaws due to the differing dynamics of these gases in the atmosphere (Lynch et al., 2021). The use of the GWP100 metric, while the standard for several decades, has long been debated due to its inability to accurately capture the atmospheric behavior of, particularly, short-lived climate forcers (SLCF), also referred to as flow gases (O’Neill, 2000; Fuglestvedt et al., 2003; Shine et al., 2005, 2007). Methane is one such SLCF and has an atmospheric residence time of about 12 years, while N2O, the second predominant GHG relevant to beef and dairy production, has a residence time of approximately 114 years (EPA, 2024). Carbon dioxide is a stock gas and has an atmospheric residence time of over 1,000 years. As such, the relationship between cumulative CO2 emissions and CO2-induced warming is near linear (Cain et al., 2021). This relationship does not hold true for the cumulative warming effects of CH4 due to its short-lived behavior in the atmosphere (Smith et al., 2012). For N2O emissions, however, the atmospheric half-life is long enough that traditional GWP100 accounting may sufficiently model its impact as public policy is typically set for the years 2050 or 2100 (Lynch et al., 2021).
As GWP100 incorrectly accounts for the warming potentials of short-lived GHGs, there has been a long history of alternative metrics that have been developed including global temperature potential (GTP; Shine et al., 2005). This climate metric sought to improve upon the known issues of GWP, and is calculated as the ratio of a gases absolute GTP to that of CO2. Absolute GTP is determined for each gases species as the global-mean temperature change at a given time horizon from a 1 kg pulse of the gas (Shine et al., 2005; Boucher et al., 2009). One newer strategy, GWP*, more accurately accounts for the warming potential of flow gases such as methane. This method utilizes emissions rates of a given year and relates them to previous emission rates, typically 20 years prior, to calculate a CO2 warming equivalence (CO2-we). The benefit of using a “step-pulse” metric like GWP*, is that it better captures the climate impact of methane in the short-term before it is broken down in the atmosphere without overestimating its impact in the long-term (Cain et al., 2019). This means that CH4 has the potential to reach a sustained equilibrium where ongoing emissions can be matched by natural removals to the point that continued climate warming is not occurring and can lead to reversing warming in a few decades. This metric has been demonstrated to relate closely to actual temperature responses using the “Finite Amplitude Impulse Response” (FaIR) simple climate model, which is not achieved when using GWP100. In fact, Lynch et al. (2021) found that GWP100 overestimated climate impacts when CH4 emissions were constant or decreasing. Therefore, flow gases should not be accounted for like stock gases (Liu et al., 2021), and success should not be measured via an abstract and highly ambiguous reporting unit whose primary virtue is customary use (GWP100) (Lynch et al., 2021).
The importance of capturing rate change, both increasing and decreasing, for CH4 emissions was demonstrated by Beck et al. (2023b). In that paper, U.S. EPA methane emission estimates from livestock between 1990 to 2020 were re-analyzed using GWP* compared to the traditional GWP100 used by EPA (2024). Emission sources were separated by species (beef, dairy, swine, and poultry) and source (enteric or manure) and the CO2-we were calculated from 2010 to 2020 both on a yearly basis and cumulatively. It was observed that enteric emissions were relatively constant across years, whereas manure emissions, particularly from dairy production have been increasing significantly at a rate of 0.03-MMT/year. When calculated using GWP100, enteric CH4 was the predominate GHG source at 191-MMT CO2-e from 2010 to 2020 with manure emissions only accounting for 62.3 MMT CO2-e during that same time. However, when using GWP* it was observed that manure CH4 was the larger contributor to climate warming rather than enteric CH4 (90.8 MMT CO2-we vs. 89.2 MMT CO2-we, respectively). This was due to changes in manure management and population that lead to divergent rate changes between these two emissions sources which is unappreciated when solely examining emissions using GWP100. Similarly, it was observed by Beck et al. (2022) and del Prado et al. (2023) that a small, 0.32% annual reduction in CH4 emission rates would stabilize the cattle sectors impact on climate warming and further reductions could reverse historical contributions. However, this rate change metric does mean that as emission rates increase, which is typically associated with growing animal populations, the climate warming impact would increase more than GWP100. In fact, if emission rates increase annually at a rate greater than 1.01%, GWP* would produce a larger estimate than GWP100 (Beck et al., 2022). Therefore, mitigation strategies that reduce animal performance and subsequently result in producers increasing animal numbers to maintain or increase output may not actually result in any reduction in climate impact. It should be noted, that GWP100 is still the default accounting metric for GHG, and how best to apply these other metrics is unclear. For example, at what level at which GWP* could be applied is up for debate (e.g., production systems vs. national inventory). Currently, the majority of its use has been in larger inventories which are less sensitive to short term changes that can impact the annual CO2-we values.
5 Mitigation strategies
The following sections will highlight some promising mitigation strategies for relevant agricultural GHG’s, but more depth can be found in the papers highlighted in Tables 3, 4. To date, mitigation strategies for beef and dairy systems have predominantly focused on enteric CH4 emissions and improved soil management. However, several hurdles still exist to reduce emissions by a large enough magnitude to realistically achieve a net zero supply chain.
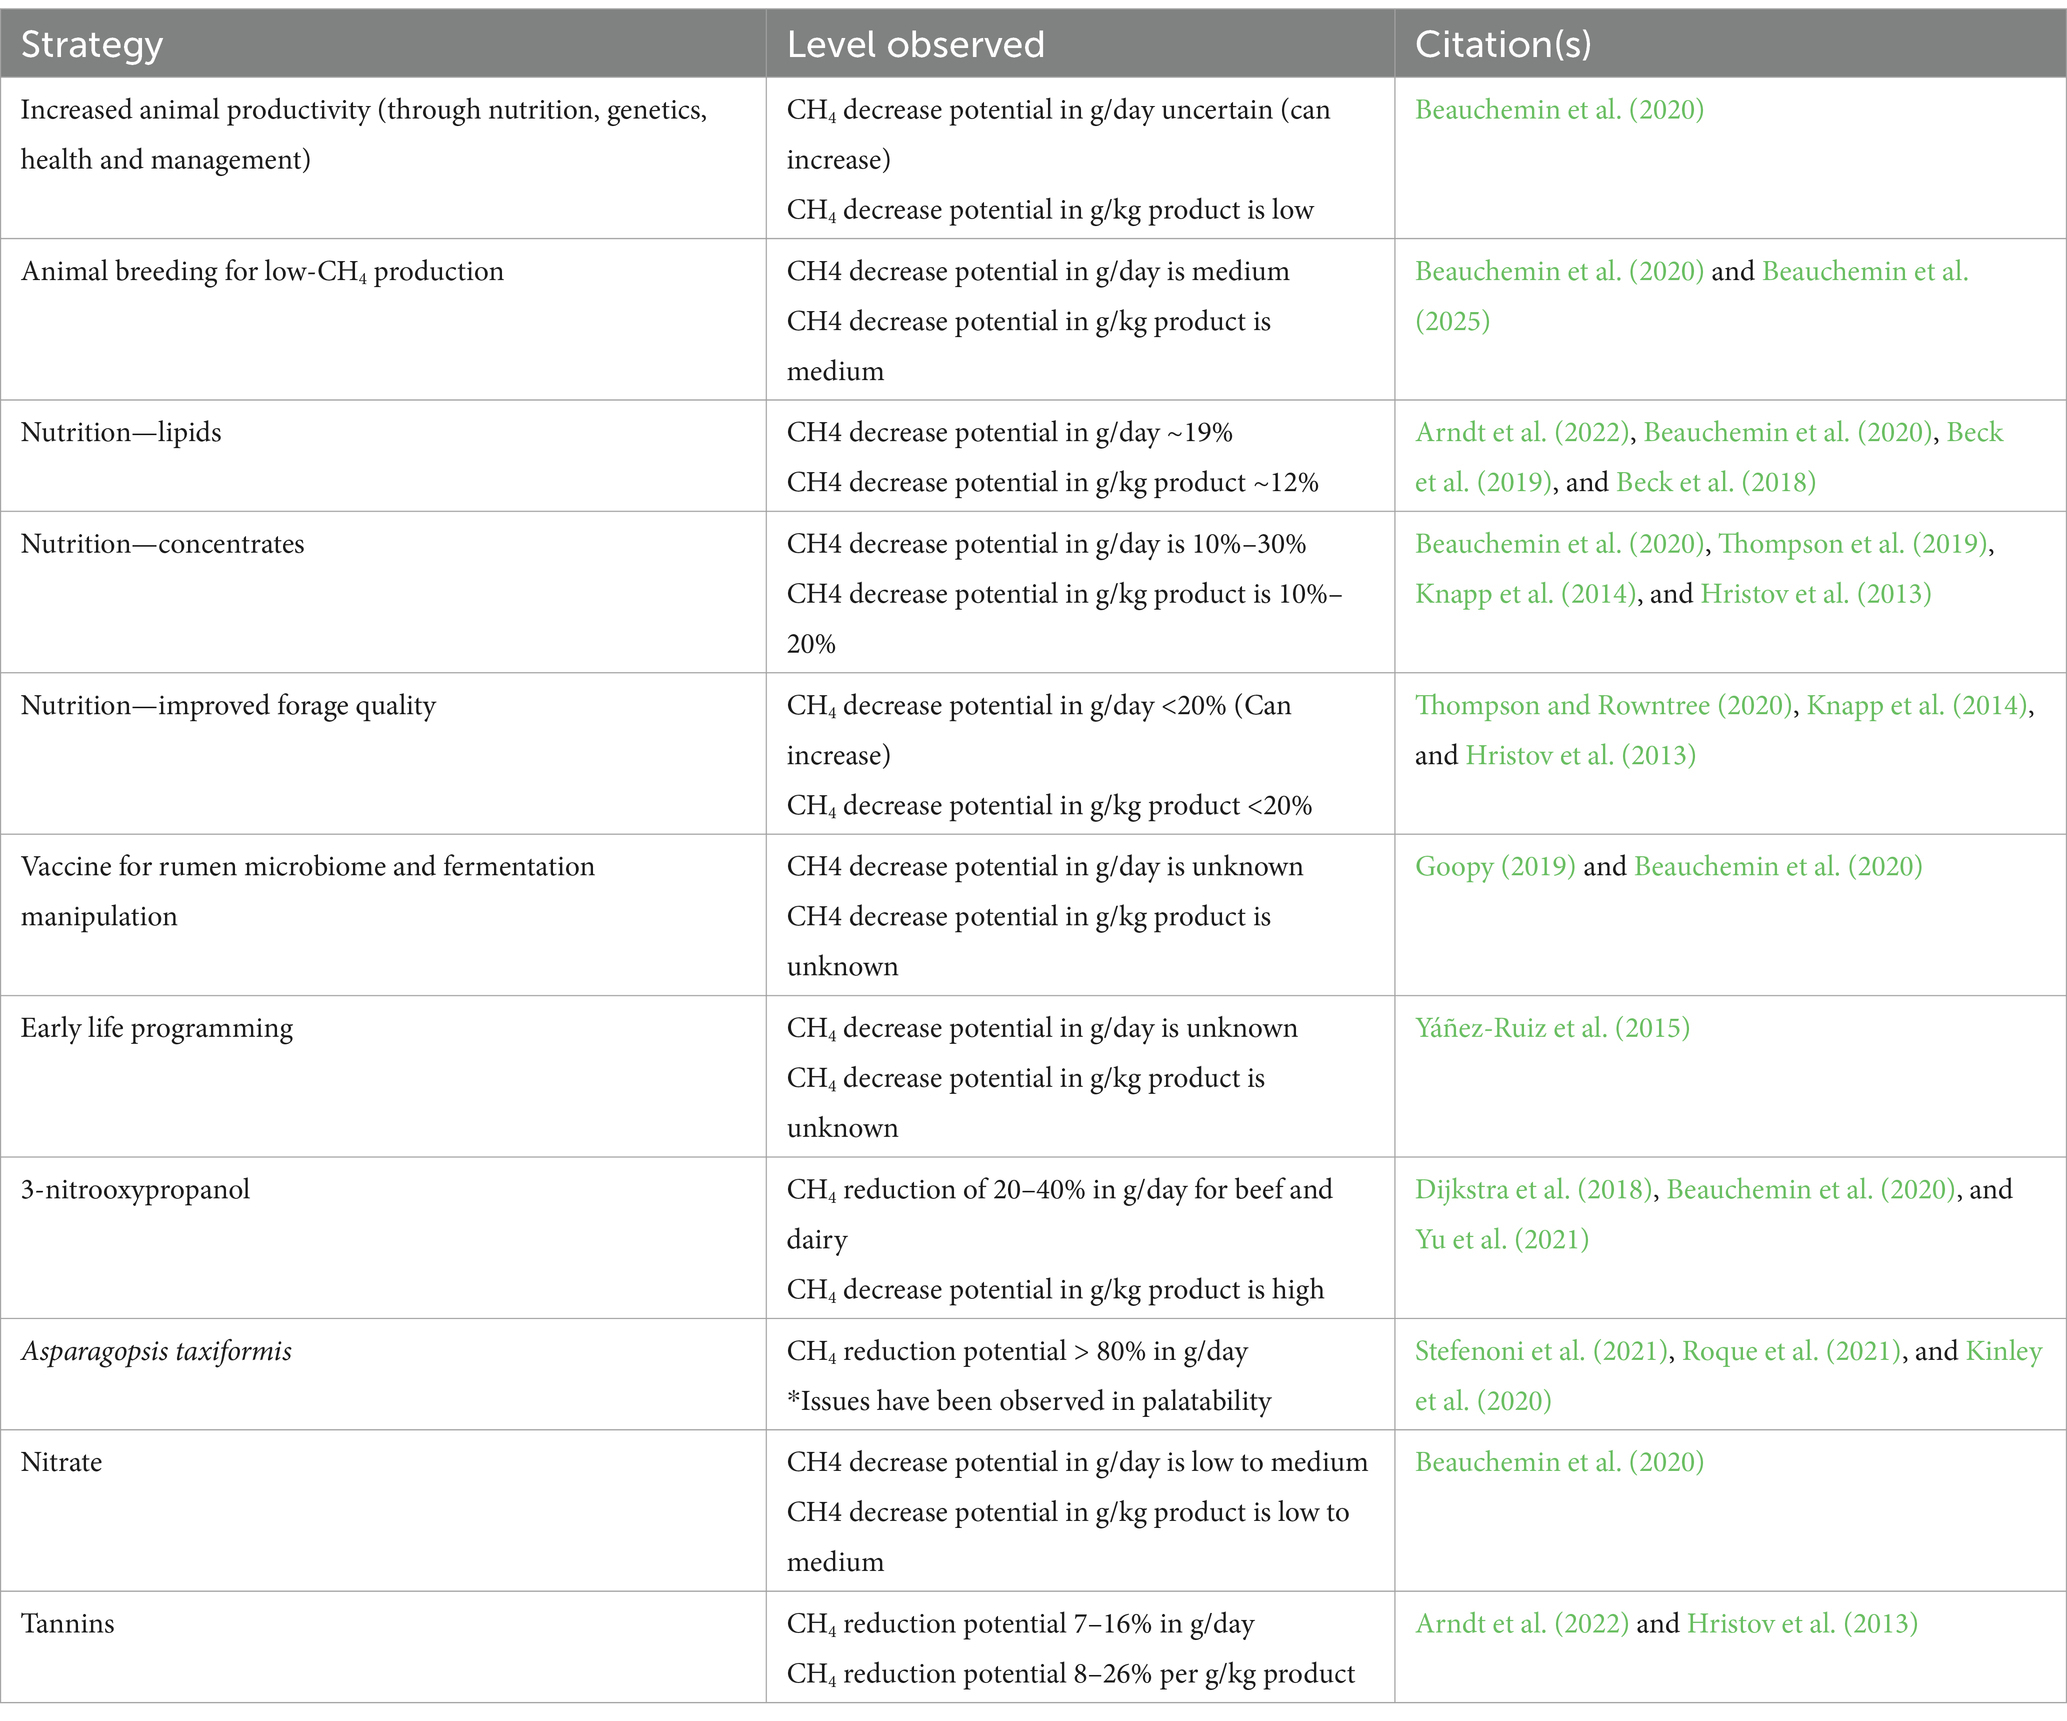
Table 3. Methane mitigation strategies and potentials for beef and dairy production.
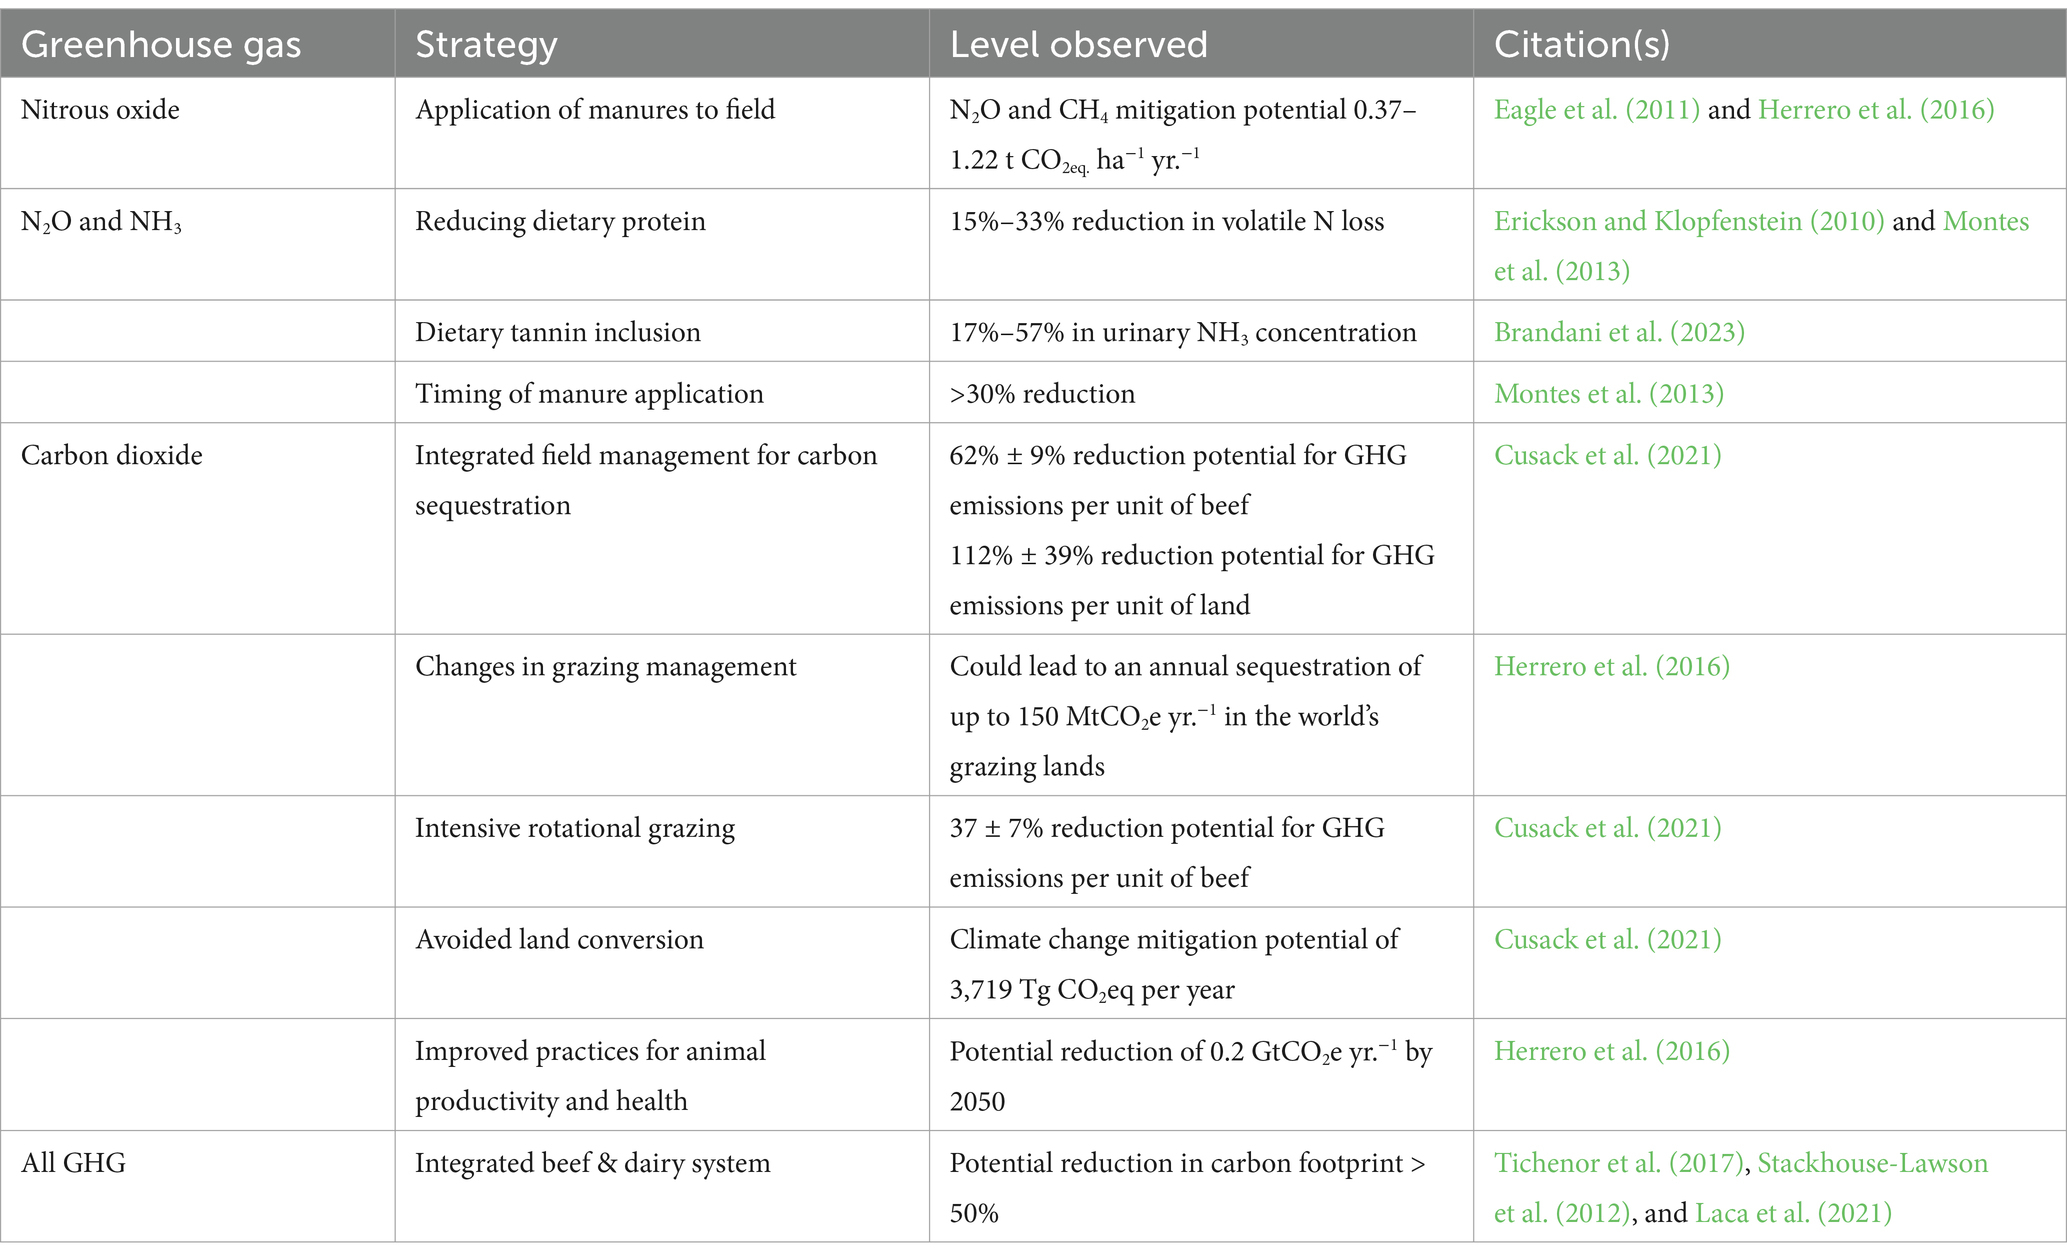
Table 4. Nitrogen and carbon dioxide mitigation strategies and potentials for beef and dairy production.
For enteric emissions, two additives have been identified that achieve greater than 20% reductions in emission and one that supplies at least 10%: (1) 3-Nitrooxypropanol (3-NOP: DSM Nutritional Products Ltd., Kaiseraugst, Switzerland), (2) Asparagopsis taxiformis and (3) Nitrate (10% or more reductions) (Hegarty et al., 2021; Beauchemin et al., 2020). While it has previously been thought that reducing enteric CH4 emissions would increase animal performance, these three feed additives have not demonstrated consistent improvements in this area. Furthermore, most research to date has focused on feedlot or total mixed ration (TMR) diets where these compounds are fed at a consistent rate and little is known about modes of supplementation in more extensive systems where the compounds would be “pulse” fed (Beck et al., 2023b; Hegarty et al., 2021). These research gaps must be addressed in the future if net zero is to be achieved as most emissions, particularly in the beef industry, occur from grazing animals (Rotz et al., 2019; Alemu et al., 2017). The magnitude of emission reductions are such that a 30% reduction in enteric CH4 from pastoral systems would offset over 200% of feedlot produced enteric CH4 and 74% of dairy produced enteric CH4 (Chowdhury et al., 2024).
Regional and management variability impact the footprint of individual producers and will impact their ability to mitigate their emissions (Rotz et al., 2021; Rotz et al., 2019; Rotz et al., 2015; Stackhouse-Lawson et al., 2012). Producers must examine mitigation strategies to determine viability of adoption based on their own operation. Environmental variability to consider includes differences in soil type, local climate, and management constraints of that system (Rotz et al., 2021). Recent life cycle assessment (LCA) literature demonstrates how variable carbon footprints can be across the U.S. for beef and dairy producers due to environmental and management decisions (Rotz et al., 2019; Rotz et al., 2021; Pelletier et al., 2010; Stanley et al., 2018; Liang et al., 2017). In a National LCA on beef production broken down by geographic region, Rotz et al. (2019) reported GHG footprints ranging from a mean of 20.2 in the southwest to 28.9 kg CO2-e./kg carcass weight in the southeastern U.S. They found areas with higher footprints were driven primarily by greater precipitation and use of fertilizers. Similarly, large variation was reported from the dairy industry by Rotz et al. (2021). Within a region variation can be quite large as well based on a particular management practice. For example, Liang et al. (2017) found that increasing soybean in the ration of Wisconsin dairy farms increased emissions per unit of energy corrected milk. However, by including soybean in the crop rotation, producers were able to reduce field N2O emissions. This finding also demonstrates that potential pollution swapping must be considered for the beef and dairy industries to achieve net zero. Pelletier et al. (2010) reported another example how different production practices can influence emissions within a given region. It was reported that cattle finished in a feedlot have smaller GHG footprints than those finished through other systems in the same region. Due to this regional complexity, local ecosystem variability, and influence of management decisions, reaching net zero for every operation may not be feasible.
Economic constraints and social impacts must be considered when designing and implementing mitigation strategies. Often, research is focused on environmental impacts, but without co-benefits that positively impact the economic viability of an operation other motivations will need to occur (Hegarty et al., 2021). These motivations could be carbon credits through offsets, legislative requirements for market access, or access to low carbon markets (Hegarty et al., 2021). An in depth discussion of individual strategies is outside of the scope of this manuscript, rather the authors encourage interested readers to utilize the citations provided. However, readers are referred to Tables 3, 4 for a synopsis of mitigation strategies and for some references to recent review and research papers.
5.1 Offsets to achieve net zero
While mitigation of emissions is necessary this will not be enough to achieve net zero. As with all livestock food products, beef and dairy production achieving zero emissions is an unrealistic goal. However, a net zero footprint may be realized through mitigation in conjunction with offsets. Agriculture could offset emissions and implement insetting programs. Insetting is where a company or system implements CO2e emission reduction or sequestration creating programs within their system or value chain. Inset program options in animal agriculture systems include, but are not limited to, improving soil carbon sequestration, utilizing manure digesters, and implementing renewable energy generating technology.
Soil management for increased C sequestration was identified by Cusack et al. (2021) as having the largest potential to reduce beef cattle emissions globally, both per unit of product and per unit of land. This includes utilizing silvopastoral beef production, which has already resulted in niche carbon neutral beef products such as the Viva branded beef products in Brazil. This was developed through a joint effort by Marfrig Beef and the Brazilian Agriculture Research Corporation (Embrapa, 2020). In the U.S., research examining livestock-induced changes in soil C and its impact on the C footprint of beef and dairy production has been minimal (Cusack et al., 2021; Reinhart et al., 2021; Rowntree et al., 2020; Stanley et al., 2018). However, in some regions utilizing improved grazing management practices have resulted in net zero or reduced C footprints (Rowntree et al., 2020; Stanley et al., 2018) but more research is needed to understand the potential for these practices across different regions, particularly in more arid environments where soil C stocks may be at a long-term equilibrium (Derner et al., 2019; Sanderson et al., 2020). In the higher rainfall study area of Rowntree et al. (2020), a 20-year chronosequence on soil C stocks found an average sequestration rate of 2.29 Mg C ha−1 yr.−1. In more arid environments, studies that have shown the potential for grazing to increase soil C is low, with rates ranging from 0.05 to 0.50 Mg C ha−1 yr.−1, or may have no sequestration potential at all (Schuman et al., 2002; Henderson et al., 2015). For example, in an analysis of 74-year-old moderately grazed and grazing exclosures across a shortgrass steppe ecosystem in northeast Colorado, grazing was not found to have an impact on total soil C, rather it is hypothesized that moisture was the primary limitation in this ecosystem (Derner et al., 2019; Burke et al., 1998). In these environments, it may be more important to protect these soils from conversion into marginal cropland, as this has resulted in substantial loss of soil C (Ihori et al., 1995). This would require, however, alternative mitigation strategies if producers in these regions are going to reach net zero emissions.
For confined beef and dairy production, feed production is a significant contributor to its carbon footprint (Rotz et al., 2019; Wattiaux et al., 2019; Rotz et al., 2021). Therefore, shifting management of crop production practices to minimal or no-till, improved crop rotations, utilization of cover crops, and precision farming may result in reduced soil C losses and GHG emissions from soils (Venterea et al., 2012; Sanford et al., 2012; Wattiaux et al., 2019). In a study on Pennsylvania dairies, Dell et al. (2008) examined the impact of no-till and rye cover crops on soil C and N pools. They reported increased C and N pools in the no-till fields, with an estimated sequestration rate of 0.5 Mg ha−1 yr.−1. Similarly, in a synthesis of Eagle et al. (2011) reported that conversion from conventional to no-till would result in 1.08 t CO2 -e. ha−1 yr.−1. Furthermore, integration of livestock into cropping systems may result in similar soil C retention and GHG loss (Savian et al., 2014; Figueiredo et al., 2017; Moraes et al., 2017). However, the time horizon for soil C sequestration rates to occur after changes to management is unsettled, and soil’s may reach a saturation point (Hassink, 1997).
Anaerobic manure digesters are a closed system that take animal manure and utilize microbial fermentation to break down organic material into biogas which can be used as a source of natural gas, which can be used to generate electricity (Montes et al., 2013). The digestate, e.g., livestock bedding, fertilizer, and soil amendments, can be used on farm or sold as co-products. The biogas is captured, and the energy produced from that gas can be used for heat, electricity, and vehicle fuel. In the beef industry, emissions from manure management are relatively small in comparison with enteric CH4, however manure management accounts approximately 45% of direct emissions from dairy cattle (EPA, 2024). This has largely been driven by a shifting in dairy operations to liquid manure handling systems (Lee et al., 2013). Manure management protocols to quantify baseline and project emissions with the equation: Offsets = Baseline emissions – (project emissions + leakage emissions) (Lee et al., 2013). Leakage, i.e., methane lost through digestor walls and piping, can be a significant source of emissions, which requires producers to invest in ongoing maintenance costs (Montes et al., 2013).
The amount of offsets produced per project depends greatly on the protocols used. For on farm applications, there are several different types of commercial digesters (Roos et al., 2004; Sharvelle and Loetscher, 2011; EPA, 2021). The simplest and most common is covered lagoons, which utilize manure with less than 3% solid content, and have longer hydraulic retention times relative to other systems (Montes et al., 2013; EPA, 2021). However, this type of digester is not practical in colder climates as too little CH4 is generated (Sharvelle and Loetscher, 2011). Another common digester is plug-flow digesters (EPA, 2021). These digesters utilize manure with a solids content around 12%–15%, are typically heated to 30°C–38°C mesophilic temperature, and yield higher amounts of CH4 (EPA, 2021; Steward et al., 2021; Montes et al., 2013). Lastly, complete mix digesters are another common digester type that utilizes a medium level of solids content (Steward et al., 2021). This digester is similarly heated to 30°C–38°C and mixes the manure content to spread the nutrients evenly throughout the reactor (Sharvelle and Loetscher, 2011). The type of manure and co-product inputs as well as type of digester being utilized, and number of animals results in a wide range of measured emission reductions (EPA, 2021). Of the digesters in the EPA AgStar database, the estimated range of annual emission reductions is 4 to 390,000 Mt. CO2 -e. yr.−1 (EPA, 2021). However, DeVuyst et al. (2011), in an economic analysis of a feedlot installing a manure digester found that the infrastructure investment required to install a manure digester was unfeasible for beef cattle. Cowley and Brorsen (2018) found that for dairy producers, economic feasibility was achieved when marketing co-products but not for CH4 production alone. In the United States, the largest driver in digester installation has been the California Low Carbon Fuel Standard which has provided some regional incentives but is limited nationally (AcMoody and Sousa, 2020). This economic feasibility may be a roadblock in beef systems but potentially as pressure to act on climate change increases it may become more economically feasible for more operations. While anaerobic manure digesters are a viable option for insetting within animal agriculture systems to produce offsets, the barriers for adoption are currently limiting widespread adoption unless producers are being incentivized to install them.
Renewable energy can be implemented in a variety of systems and ways (Rosa and Gabrielli, 2023), and provides an avenue for producers to also receive monetary payments for their use outside of only offsetting climate impacts. Options include agrivoltaics systems, where crops are grown and/or animals are grazed below solar panels, other voltaic systems to produce solar energy, or wind turbines to produce wind energy (Chel and Kaushik, 2011). Currently, many of these technologies applications in agricultural systems are not widely adopted but decarbonization has the potential to reduce agricultural emissions globally by 720 MMT of CO2-e per year (Rosa and Gabrielli, 2023). It should be mentioned, however, that a carbon myopic focus and drive toward renewable energy development in agriculture should not come at the cost of functional landscapes.
5.2 Pathways to climate neutral
It is possible that animal agriculture could achieve climate neutrality with both increased utilization of mitigation strategies and increased use of offsets. The ability to reach climate neutrality greatly depends on the individual system, and the accuracy of implementation of mitigation management strategies. If one defines net zero as net zero CO2 emissions, then animal agriculture is likely capable of reaching net zero. Reducing only CO2 emissions is an achievable goal for animal agriculture because the industry primarily produces CH4 and N2O. Reaching net zero CO2 would involve switching from fossil fuels to renewables and offsetting any additional CO2 emissions with carbon sequestration. However, for net zero emissions, or climate neutrality, this would include enteric CH4, and manure N2O and CH4 would require substantial reductions and offsets (Ungerfeld et al., 2022). The potential to achieve this goal for cattle production will also greatly depend on the choice of metric (e.g., GWP100 or GWP*). Metric selection will be heavily scrutinized if GWP* is the metric of choice, regardless of the accuracy of that metric (Meinshausen and Nicholls, 2022). If this is the chosen metric, cumulative CO2-we should be utilized as the year-to-year volatility of a rate-based metric leaves it highly susceptible to manipulations making a single year not reflective of the long-term direction of emissions. Further, the ability to achieve climate neutrality also depends on the scale of production. Climate neutrality for each individual small producer may not be possible, but climate neutrality for larger systems, companies in the supply chain, or countries may be possible. Some regions may also have a greater ability to reduce emissions or become net zero than other regions. For instance, as detailed in the discussion above, areas with high rainfall and productive grasslands may have a greater ability to offset emissions of the final product through C sequestration compared to more arid regions.
As both the U.S. beef and dairy industries have stated goals to achieve climate neutrality (or net zero emissions) emissions by 2040 and 2050, respectively, it is worth exploring how these sectors can realistically reach these targets. While these industries are both dependent on ruminant animals, they have vastly different emission profiles and therefore need different tools and strategies to achieve their goals. For example, in 2022 the U.S. dairy sector emitted 48.94 MMT CO2-e emissions from enteric CH4 and 44.34 MMT CO2-e emissions from manure CH4, compared to 136.94 and 4.31 MMT CO2-e emissions from beef cattle enteric and manure CH4, respectively (EPA, 2024). These statistics are only reflective of direct emissions, yet they indicate that reductions in enteric CH4 will be critical for the beef industry, whereas the dairy industry needs to focus on both enteric and manure emission sources simultaneously. As discussed previously, the rates change in dairy manure emissions indicates this source may be the lead climate warming contributor from their supply chain (Beck et al., 2023a). Additionally, the choice of metric will be highly influential and likely dictate whether these goals are met.
To examine pathways to net zero emissions for both U.S. beef and dairy production, we utilized U.S. EPA (2024) estimates for direct CH4 and N2O emissions from 1990 to 2022. It should be reinforced, the emission data is from direct emissions from enteric and manure sources alone and does not encompass all emission sources from beef and dairy production. All data was reanalyzed using GWP* like the approach of Beck et al. (2023a) and is reported as both GWP100 and GWP*. While these pathway scenarios only include direct emissions, these emission sources are the largest for each sector and the EPA database provides the most robust time series data from which to project emissions into future years (Rotz et al., 2019; Rotz et al., 2021). Information on the database and EPA methods for emissions estimates is reported in Beck et al. (2023b). For GWP* and GWP100 estimates, 2010 was utilized as the baseline year for each scenario to calculate cumulative warming estimates to provide an equal representation of emissions impacts using both climate metrics. For future emissions from 2023 through 2050, annual estimates were calculated for each year based on the regression lines associated with each emission source (enteric CH4, manure CH4, and manure N2O) for both beef and dairy cattle. For these sources, all emissions, with the exception of enteric CH4 from beef cattle, are projected to increase in future years at rates of: Dairy enteric CH4 = 9.3 kt CH4/yr.; Dairy manure CH4 = 23.9 kt CH4/yr.; Dairy manure N2O = 0.0898 kt N2O/yr.; Beef enteric CH4 = −6.4 kt CH4/yr.; Beef manure CH4 = 3.7 kt CH4/yr.; Beef manure N2O = 0.058 kt N2O/yr. Year 2050 was chosen as the end date for projections as this would encompass both the U.S. Beef industry and U.S. Dairy industry climate commitments as outlined in Table 2.
We examined 5 different future scenarios (Table 5) for each beef (Figure 3) and dairy (Figure 4): (1) Business as usual (BAU) with only projected future emissions and no mitigation, (2) Scenario with an instantaneous 23% reduction in enteric CH4 only (Sc1), (3) Sc1 stacked with an additional instantaneous 10% reduction in enteric CH4 (Sc2), (4) Sc2 stacked with an instantaneous 30% reduction in manure emissions from both CH4 and N2O (Sc3), and (5) Plausible mitigation reductions over time (Sc4; described further below). Sc4 is unique for each beef and dairy production, based on literature estimates for realistic emission mitigation from all sources. For the beef industry (Sc4-Beef), the scenario was modeled to include a 23% reduction in enteric emissions by 2040 relative to 2022 (Place et al., 2022; Thompson and Rowntree, 2020) that was applied annually at a rate of 1.27%. No manure emission mitigation was included in this scenario due to their relatively small contributions (EPA, 2024; Rotz et al., 2019). For the dairy scenario (Sc4-Dairy), the same 23% reduction in enteric CH4 was included by 2040. For manure emissions, CH4 was modeled to achieve an 85% reduction by 2033 under the assumption all potential dairies who could adopt this technology do so (EPA, 2018). Under this same assumption, N2O emissions were modeled to be reduced 70% over this same period (Montes et al., 2013). After the first 10 years, manure emissions were projected to continue the annual change as described above. These Sc4 scenarios were developed to be “realistic” to reflect slow adoption rates of new technologies and were like pathway estimates done previously (Place et al., 2022), with the difference being the forecasted emission rates in the future. Further, all scenarios examined here provide insights into the choice of metric selected when an organization goal sets and how this choice influences their ability to meet such goals. The methods used to achieve these reductions will likely come from multiple avenues such as changes in feed/forage quality, changes in genetics, and use of new technologies, to name a few. There will likely not be a single “silver bullet” approach that fits the all the production environments and methods that exist in the U.S. for both the beef and dairy sector.
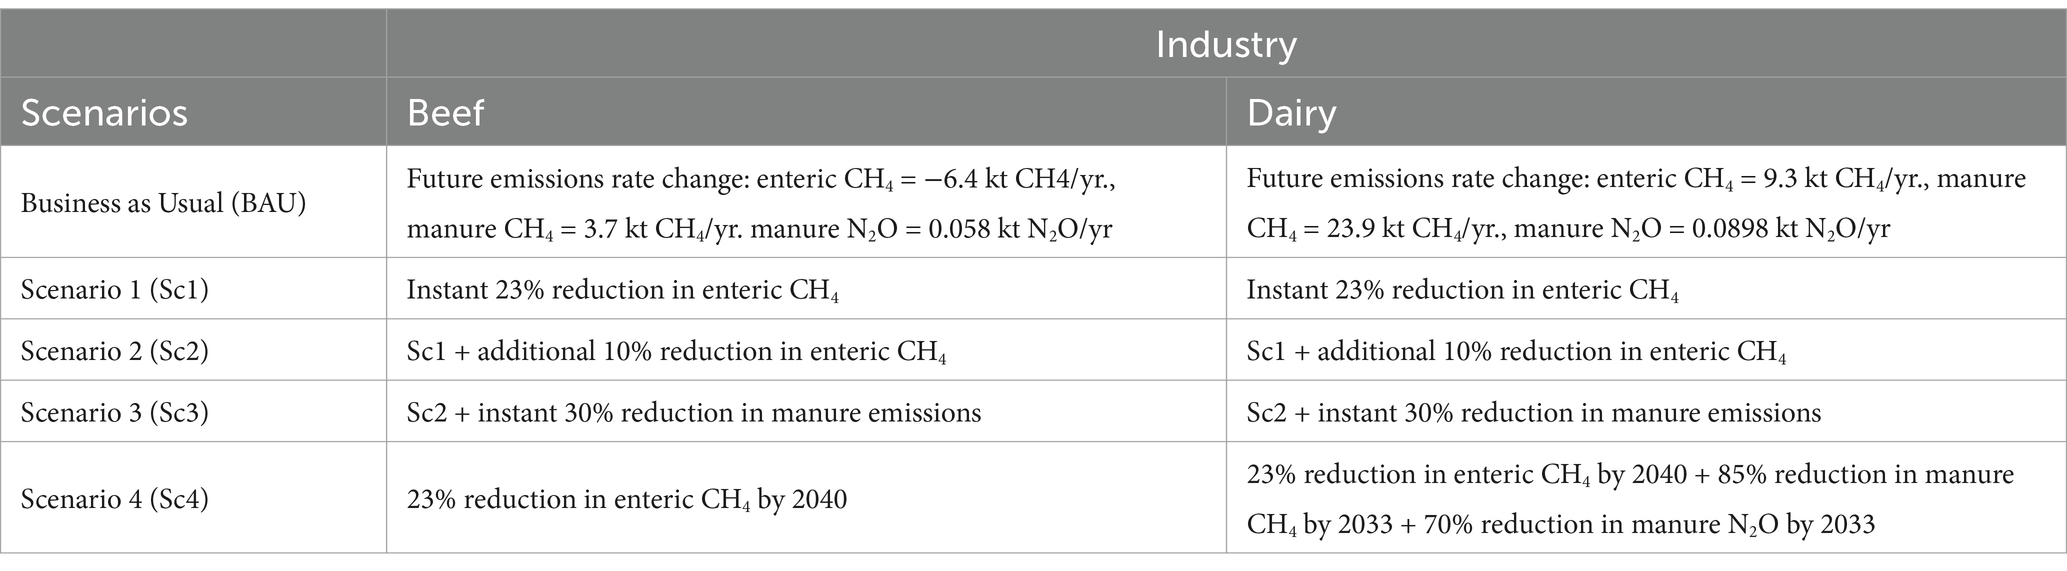
Table 5. Emission mitigation scenarios for U.S. beef and dairy.
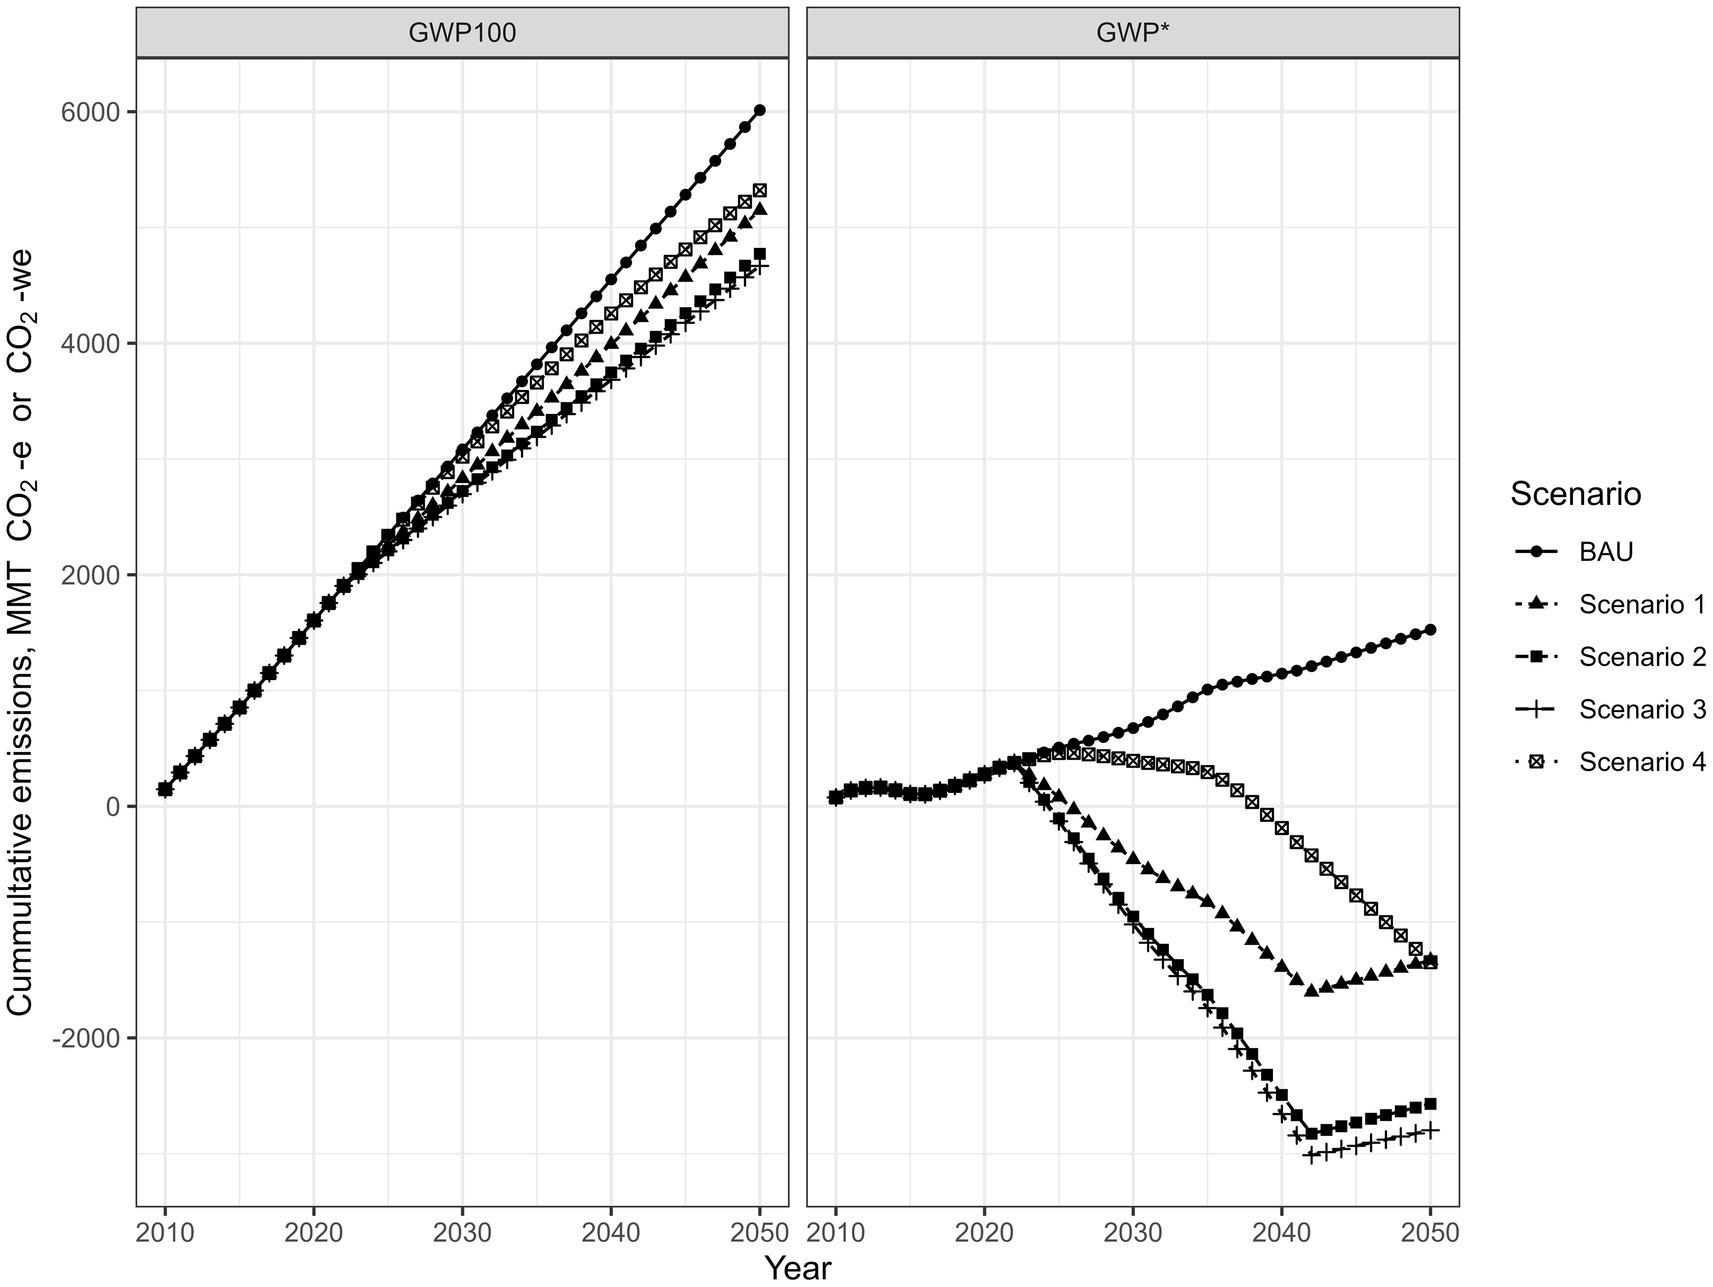
Figure 3. U.S. beef modeled climate scenarios. Business as usual (BAU) = only projected future emissions and no mitigation; Sc1 = a 23% reduction in enteric CH4 only; Sc2 = Sc1 stacked with an additional 10% reduction in enteric CH4; Sc3 = Sc2 stacked with a 30% reduction in manure emissions from both CH4 and N2O; Sc4-Beef = Plausible mitigation reductions over time, modeled to include a 23% reduction in enteric emissions by 2040 relative to 2022 (Place et al., 2022; Thompson and Rowntree, 2020) that was applied annually at a rate of 1.27%. No manure emission mitigation was included.
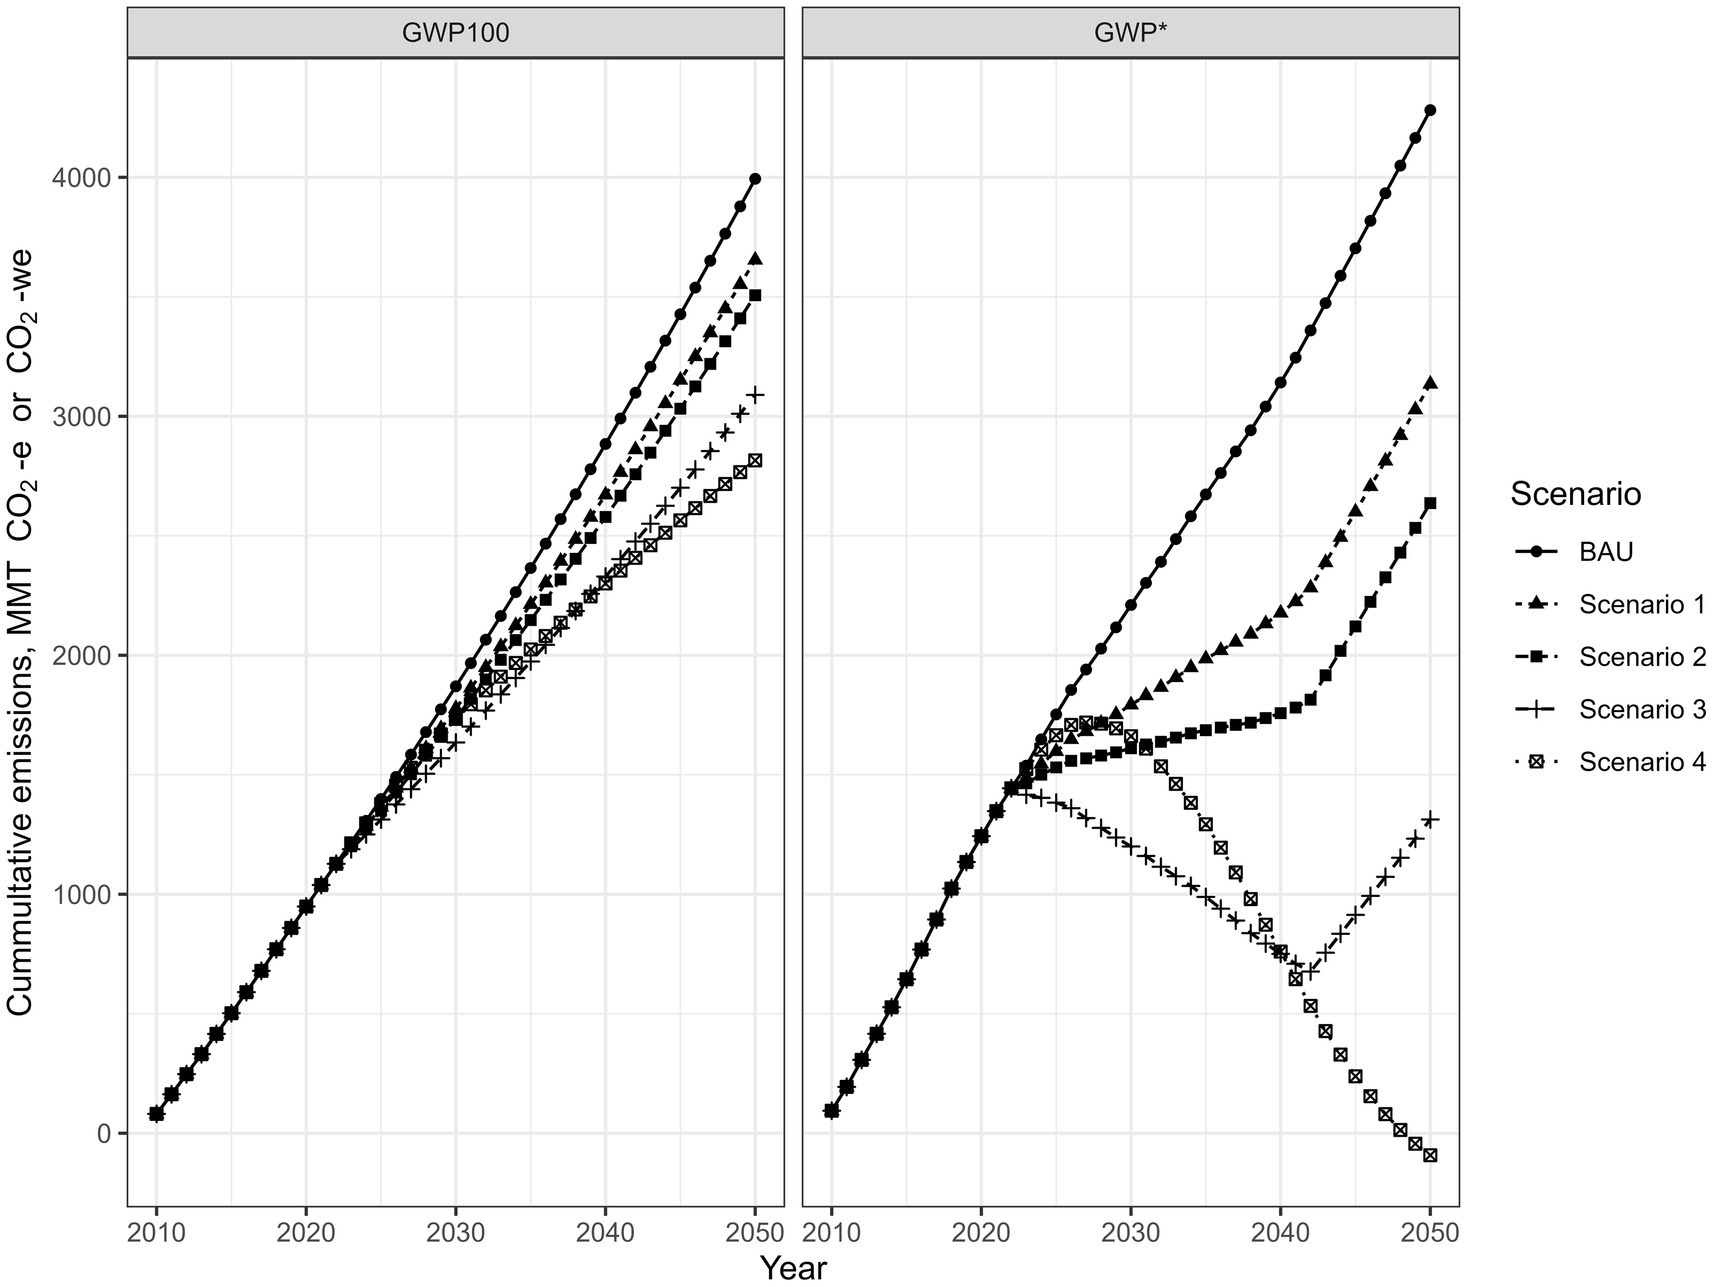
Figure 4. U.S. dairy modeled climate scenarios. Business as usual (BAU) = only projected future emissions and no mitigation; Sc1 = a 23% reduction in enteric CH4 only; Sc2 = Sc1 stacked with an additional 10% reduction in enteric CH4; Sc3 = Sc2 stacked with a 30% reduction in manure emissions from both CH4 and N2O; Sc4-Dairy = Plausible mitigation reductions over time, 23% reduction in enteric CH4 by 2040. For manure emissions, CH4 was modeled to achieve an 85% reduction by 2033 under the assumption all potential dairies who could adopt this technology do so (EPA, 2018). Under this same assumption, N2O emissions were modeled to be reduced 70% over this same period (Montes et al., 2013).
For beef cattle (Figure 3), under the BAU scenario both cumulative CO2-e. and CO2-we emissions increase consistently, although the implied warming impact is considerably lower when using CO2-we compared to CO2-e. This is reflected in the beef industry goal setting year of 2040 with a CO2-e. of 4,551.18 MMT/CO2-e. vs. 1,146.18 MMT/CO2-we. For CO2-we, beginning in 2042 the annual change in climate warming becomes consistent year over year with an annual increase of approximately 40 MMT CO2-we. For Sc1 through Sc3, all results were similar with respect to CO2-e. and CO2-we; however, there were marked differences between the two metrics. As one would expect when using the traditional GWP100 metric when calculating CO2-e. the cumulative impact of beef emissions continued to rise through the end of the scenarios in 2050 for each of Sc1, Sc2, and Sc3. However, when using the GWP* approach, the cumulative CO2-we reached negative values in 2026, 2025, and 2025 for Sc1, Sc2, and Sc3, respectively. This indicates that a sudden switch in management (indicative of policy and technology converging to cause producers to suddenly change management across the industry) can result in the beef industry quickly providing a net positive effect. However, this is not a permanent solution and will change as the industry would have reached a new baseline for emissions which can be found in year 2042 for all three scenarios. After this year, warming impacts begin to rise through 2050 and if this were to be projected out further, additional interventions would eventually be required as the industry would again become a net emitter at a future point.
The sudden changes in management described by Sc1–Sc3 are not likely to occur, and therefore Sc4-Beef was utilized to explore a more realistic, slow adoption of new technologies. For Sc4-Beef, CO2-e. followed similar trends as Sc1 through Sc3, increasing consistently through 2050 and cumulatively was the second highest CO2-e. scenario behind BAU. For CO2-we, the cumulative warming increased slightly after emission reductions began, peaking in 2026, then began to decline and ultimately achieved a negative CO2-we value in the year 2039. This demonstrates that by modest yearly reductions in enteric CH4, the U.S. beef industry can realistically achieve neutral CO2-we by 2040 in accordance with industry goals, however, this is not true when using CO2-e emissions. Therefore, choice of accounting metric will be important when analyzing goal success and whether emission reductions or emission offsetting/insetting will be required.
Similar for the beef industry, for dairy (Figure 4), under the BAU scenario, both CO2-e. and CO2-we emissions increased consistently through the end of the modeled scenarios. However, one key difference relative to beef cattle, is that cumulative CO2-we were actually greater throughout this scenario compared with CO2-e. This was due, in part, to the large increase in emission changes year-over-year, particularly the increase of 23.9 kt of manure CH4 each year, and no downward trends from any emission sources. Interestingly, while cumulative CO2-e. was still lower than that of beef cattle in 2050 (3,993.75 vs. 6,013.49 MMT, for dairy and beef, respectively) the CO2-we was roughly 180% higher for dairy cattle that same year (4,281.21 vs. 1,525.76, for dairy and beef, respectively). For Sc1 through Sc3, the behavior of CO2-e. and CO2-we metrics were similar within the metric of choice, but had divergent directional trends and rates of change. For CO2-e., the cumulative impact of emissions continued to rise throughout the modeled scenarios as one would expect, with the more aggressive Sc3 having the lowest cumulative CO2-e. For Sc1 and Sc2, cumulative CO2-we never reduced, but did slow down slightly through the year 2042. After this year, annual changes to cumulative CO2-we began to increase and continued to do so through 2050. However, for Sc3, cumulative CO2-we did decrease year-over-year from 2023 through 2042, although negative cumulative CO2-we were never achieved (676.65 MMT CO2-we in 2042; Figure 4). After 2042, the new baseline had been achieved and cumulative CO2-we began to rise again.
As described above, the Sc4-Dairy scenario was designed differently than what was used for beef to achieve more reductions from manure emission sources, which have been increasing in recent years. While CO2-e. followed similar trends to other scenarios, the CO2-we did result in the lowest cumulative warming impact of all scenarios, and continued to decrease, albeit at a diminishing rate, through the end of the modeled years. However, where this scenario in beef resulted in negative values by 2039, Sc4-Dairy did not achieve negative values until 2049 and reached a low in 2050 at −91.96 MMT CO2-we. This change in time horizon for dairy represents the significance of both enteric and manure emission sources for this industry, relative to beef production, and the need to reduce both sources simultaneously to meet industry goals.
5.3 Roadblocks to climate neutrality
As outlined in the above section, Sc.4-Beef and Sc.4-Dairy were able to achieve the industry stated goals of climate neutrality by the goal year from direct emission sources, 2040 and 2050 for beef and dairy, respectively. This section will discuss the roadblocks that are underlying for each respective industry and knowledge gaps that must be addressed for these goals to be achieved. As the U.S. beef and dairy industries are inherently different in their management and production design, roadblocks will be discussed for each separately.
Starting with beef cattle, a 23% reduction in enteric CH4 emissions by the year 2040 applied at a constant annual change of 1.27% reduction per year was able to achieve climate neutrality from direct emissions. This relatively small reduction in emissions appears plausible at face value with efficacy of 3-NOP appearing purpose fit for such a reduction. However, as outlined in a LCA of U.S. beef production, Rotz et al. (2019) found that approximately 75% of methane emissions arose from the cow-calf sector and an additional approximately 12% come from stocker/backgrounding operations. These are predominantly grazing based production systems, where technologies such as 3-NOP have not been widely studied. This same logic applies to all similar mitigation options. Little is understood on how best to dose/supplement these technologies to maximize emission reduction in pasture, and therefore the magnitude of emission reductions is unclear for these sectors. Additionally, interest in soil carbon sequestration in grazing landscapes has increased considerably over recent years. As highlighted in the above section on offsets and insets, soil carbon sequestration potential is highly variable and not all landscapes hold the same potential for carbon storage, and changes to management can lead to small changes in soil carbon sequestration (Bai et al., 2019; Minasny et al., 2017). Furthermore, rangeland soils have been observed to have more heterogeneity than cropland soils which makes measuring and monitoring changes over time incredibly challenging (Stanley et al., 2023). For meaningful soil carbon sequestration rates to occur, more research needs to be conducted to improve soil carbon measurement protocols across different landscape types, and locally specific management scenarios to improve recommendations to producers. Lastly, while manure emissions were not required to be reduced from the beef specific climate neutrality scenario (Sc.4), manure gaseous losses such as ammonia still represent negative environmental externalities beyond GHG emissions including eutrophication of waterways, leaching into ground water, wet nitrogen deposition, and air pollution. These other externalities should not be in absentia in the larger conversation on climate neutrality. Progress needs to occur across all areas if environmental sustainability is to be truly achieved.
For dairy cattle production, the recent announcement on the approval of 3-NOP for dairy usage in the U.S. represents a feasible pathway to reduce emissions in the rates modeled here. Additionally, as this sector is largely fed in confinement in the U.S. less unknowns exist with its reduction potential. However, the adoption rates and potential for digester installation on dairy farms could hinder progress for this sector. In a recent survey of U.S. dairy producers, those who did not have digesters highlighted belief that the costs exceeded the benefits, and that they viewed their operations as being too small and there being no system designed for their scale (Cowley and Brorsen, 2018).
There has been success at the state level with the California Department of Agriculture funding dairy digester projects. However, the current rate of adoption for digesters is still limited by economics across the U.S., which is driven by renewable energy programs (Greene et al., 2024). The economic limitation represents a large roadblock to adoption. Further incentives programs will be needed to facilitate adoption across different regions and a range of production sizes. Digester technology improvements will be necessary to remove the gap in emission reduction potential that occurs across regions, as highlighted by Greene et al. (2024). A range of 58.1%–79.8% emission reduction potential was observed for large dairies across different regions. While this range was within that modeled here, improving digester usage in less efficient regions will aid the industry in achieving climate neutrality. Additionally, when digester installation is not practical, alternative manure management practices need to be incentivized to further reduce emissions where digesters are unavailable (McCabe et al., 2023).
6 Conclusion
Determining the ability of a system to be climate neutral is a complex and complicated process and will not be achieved by a “silver bullet” approach. Rather, the scientific community has, and will need to continue to, develop multiple producer friendly mitigation tools and approaches will need to be tailored based on region and producer context, which was outside of the scope of the modeled scenarios presented here. For example, producers in regions with higher rainfall with the ability to sequester soil C may not need as drastic of reductions in other emission sources as those in more arid environments where soil C is at a long-term equilibrium (Derner et al., 2019; Rowntree et al., 2020). Additionally, to truly determine if a system is climate neutral or not requires more accurate modeling of GHG emissions.
From the modeled scenarios presented here, climate neutrality is feasible for both the U.S. beef and dairy sectors but will not be without its challenges. For the beef sector, reduction in enteric CH4 emissions at an annual rate 1.27% will result in climate neutrality by the industry stated goal of 2040. However, the lack of research on mitigation in grazing sectors will limit the near-term potential for reductions in the sector that producers the majority of enteric CH4 emissions. For the dairy sector, the near equivalent enteric and manure CH4 emissions will require simultaneous reductions from both sources to meet the industry stated goal of 2040. Further, with the rapid rate of increase in manure CH4 emissions, concomitant rapid reductions from this source will aid reducing achieving the target when using GWP*.
The choice of metric will also play an important role in achieving climate neutrality. No scenario was able to achieve neutrality with emission reductions alone when using GWP100, making mitigation efforts of limited use even in the most aggressive mitigation scenarios. If this accounting method remains the primary metric, considerable offsets will be required to achieve neutrality for the beef and dairy industries. If GWP* is utilized to account for more accurate warming impacts, both industries will have a pathway for neutrality and to offset historic emissions from 2010 and potentially beyond. However, this choice could be met with criticism by opponents of this metric, who have highlighted the high degree of variability in annual GWP* values (Meinshausen and Nicholls, 2022). The scenarios presented in this paper have climate neutrality relative to a baseline year (when EPA data is able to be used with GWP*) with cumulative emissions equal to zero being considered as neutrality. This is likely more aggressive than industry commitments lend themselves, but demonstrate that realistic emission reduction targets for U.S. beef and dairy can offset past and ongoing warming impacts via mitigation strategies. Lastly, achieving climate neutral emissions does not equate to a sustainable production system, as it only encompasses GHG emissions, rather it is crucial to consider social and economic impacts of management changes (the other two pillars of sustainability) to achieve long term success. Making a change to reduce environmental impact that also decreases income or social wellbeing is not a sustainable system (Jablonski et al., 2020). Therefore, the progress to climate neutral must balance this target with social and economic outcomes.
Author contributions
LT: Conceptualization, Data curation, Investigation, Resources, Writing – original draft, Writing – review & editing. MB: Data curation, Investigation, Resources, Software, Visualization, Writing – review & editing. HL: Writing – review & editing. JR: Writing – review & editing. SP: Conceptualization, Investigation, Writing – review & editing. KS-L: Conceptualization, Investigation, Methodology, Supervision, Writing – original draft, Writing – review & editing.
Funding
The author(s) declare that no financial support was received for the research and/or publication of this article.
Conflict of interest
The authors declare that the research was conducted in the absence of any commercial or financial relationships that could be construed as a potential conflict of interest.
Generative AI statement
The authors declare that no Gen AI was used in the creation of this manuscript.
Publisher’s note
All claims expressed in this article are solely those of the authors and do not necessarily represent those of their affiliated organizations, or those of the publisher, the editors and the reviewers. Any product that may be evaluated in this article, or claim that may be made by its manufacturer, is not guaranteed or endorsed by the publisher.
References
AcMoody, A., and Sousa, P.. (2020). Interest in California dairy manure methane digesters follows the Money. Available online at: https://www.cobank.com/documents/7714906/7715329/Interest-in-California-Dairy-Manure-Methane-Digesters-Follows-the-Money-Aug2020.pdf/be11d7d6-80df-7a7e-0cbd-9f4ebe730b25?t=1603745079998. (Accessed January 6, 2025)
Alemu, A. W., Amiro, B. D., Bittman, S., MacDonald, D., and Ominski, K. H. (2017). Greenhouse gas emission of Canadian cow-calf operations: A whole-farm assessment of 295 farms. Agric. Syst. 151, 73–83. doi: 10.1016/j.agsy.2016.11.013
Arndt, C., Hristov, A. N., Price, W. J., and Yu, Z. (2022). Full adoption of the most effective strategies to mitigate methane emissions by ruminants can help meet the 1.5°C target by 2030 but not 2050. PNAS 119:e2111294119. doi: 10.1073/pnas.2111294119
Bai, X., Huang, Y., Ren, W., Coyne, M., Jacinthe, P. A., Tao, B., et al. (2019). Responses of soil carbon sequestration to climate-smart agriculture practices: A meta-analysis. Glob Chang Biol. 25, 2591–2606. doi: 10.1111/gcb.14658
Beauchemin, K. A., Kebreab, E., Cain, M., and Vande Haar, M. J. (2025). The path to net-zero in Dairy Production: are pronounced decreases in enteric methane achievable? Annual Rev Anim Anim Biosci 13, 325–341. doi: 10.1146/annurev-animal-010324-113703
Beauchemin, K. A., Ungerfeld, E. M., Eckard, R. J., and Wang, M. (2020). Review: Fifty years of research on rumen methanogenesis: lessons learned and future challenges for mitigation. Animal 14, s2–s16. doi: 10.1017/S1751731119003100
Beck, M. R., Proctor, J. A., Long, N. S., Gouvea, V. N., and Thompson, L. R.. (2023b). Enteric methane emissions: why we should care, where we currently stand, and mitigation strategies. In: Proceeding of Plains Nutrition Council Symposium.
Beck, M. R., Thompson, L. R., Campbell, T. N., Stackhouse-Lawson, K. A., and Archibeque, S. L. (2022). Implied climate warming contributions of enteric methane emissions are dependent on the estimate source and accounting methodology. Appl. Anim. Sci. 38, 639–647. doi: 10.15232/aas.2022-02344
Beck, M. R., Thompson, L. R., Rowntree, J. E., Thompson, T. N., Koziel, J. A., Place, S. E., et al. (2023a). U.S. manure methane emissions represent a greater contributor to implied climate warming than enteric methane emissions using the global warming potential* methodology. Front. Sustain. Food Syst. 7:1209541. doi: 10.3389/fsufs.2023.1209541
Beck, M. R., Thompson, L. R., White, J. E., Williams, G. D., Place, S. E., Moffet, C. A., et al. (2018). Whole cottonseed supplementation improves performance and reduces methane emission intensity of grazing beef steers. Prof. Anim. Sci. 34, 339–345. doi: 10.15232/pas.2018-01722
Beck, M. R., Thompson, L. R., Williams, G. D., Place, S. E., Gunter, S. A., and Reuter, R. R. (2019). Fat supplements differing in physical form improve performance but divergently influence methane emissions of grazing beef cattle. Anim. Feed Sci. Technol. 254:114210. doi: 10.1016/j.anifeedsci.2019.114210
Boucher, O., Friedlingstein, P., Collins, B., and Shine, K. P. (2009). The indirect global warming potential and global temperature change potential due to methane oxidation. Environ. Res. Lett. 4:044007. doi: 10.1088/1748-9326/4/4/044007
Brandani, C. B., Lee, M., Auvermann, B. W., Parker, D. B., Casey, K. D., Crosman, E. T., et al. (2023). Mitigating ammonia deposition derived from open-lot livestock facilities into Colorado’s rocky mountain national park: State of the Science. Atmosphere 14:1469. doi: 10.3390/atmos14101469
Burke, I. C., Lauenroth, W. K., Vinton, M. A., Hook, P. B., Kelly, R. H., Epstein, H. E., et al. (1998). Plant-soil interactions in temperate grasslands. Biogeochemistry 42, 121–143. doi: 10.1007/978-94-017-2691-7_7
Cain, M., Jenkins, S., Allen, M. R., Lynch, J., Frame, D. J., Macey, A. H., et al. (2021). Methane and the Paris Agreement temperature goals. Phil. Trans. R. Soc. A 380:20200456. doi: 10.1098/rsta.2020.0456
Cain, M., Lynch, J., Allen, M. R., Fuglestvedt, J. S., Frame, D. J., and Macey, A. H. (2019). Improved calculation of warming equivalent emissions for short-lived climate pollutants. NPJ Clim Atmos. Sci. 2, 1–7. doi: 10.1038/s41612-019-0086-4
Capper, J. L. (2011). The environmental impact of beef production in the United States: 1977 compared with 2007. J. Anim. Sci. 89, 4249–4261. doi: 10.2527/jas.2010-3784
Capper, J., and Cady, R. A. (2019). The effects of improved performance in the U.S. dairy cattle industry on environmental impacts between 2007 and 2017. J. Anim. Sci. 98:skz291. doi: 10.1093/jas/skz291/5581976
Capper, J. L., Cady, R. A., and Bauman, D. E. (2009). The environmental impact of dairy production: 1944 compared with 2007. J. Anim. Sci. 87, 2160–2167. doi: 10.2527/jas.2009-1781
Carvalho, P. C., Peterson, C. A., Nunes, P. A. A., Martins, A. P., de Souza Filho, W. S., Bertolazi, V. T., et al. (2018). Animal production and soil characteristics from integrated crop-livestock systems: Toward sustainable intensification. J. Anim. Sci. 96, 3513–3525. doi: 10.1093/jas/sky085
Chel, A., and Kaushik, G. (2011). Renewable energy for sustainable agriculture. Agron. Sustain. Dev. 31, 91–118. doi: 10.1051/agro/2010029
Chowdhury, R., Frazier, A. N., Koziel, J. A., Thompson, L. R., and Beck, M. R. (2024). Computational approaches for enteric methane mitigation research: From fermi calculations to artificial intelligence paradigms. Anim. Front. 14, 33–41. doi: 10.1093/af/vfae025
Cole, J. B., and Van Raden, P. M. (2011). Use of haplotypes to estimate Mendelian sampling effects and selection limits. J. Anim. Breed. Genet. 128, 446–455. doi: 10.1111/j.1439-0388.2011.00922.x
Cowley, C., and Brorsen, B. W. (2018). Anaerobic digester production and cost functions. Ecol. Econ. 152, 347–357. doi: 10.1016/j.ecolecon.2018.06.013
Crawford, D. M., Hales, K. E., Smock, T. M., Cole, N. A., and Samuelson, K. L. (2022). Effects of changes in finishing diets and growth technologies on animal growth performance and the carbon footprint of cattle feeding: 1990 to 2020. Appl. Anim. Sci. 38, 47–61. doi: 10.15232/aas.2021-02199
Cusack, D. F., Kazanski, C. E., Hedgpeth, A., Chow, K., Cordeiro, A. L., Karpman, J., et al. (2021). Reducing climate impacts of beef production: A synthesis of life cycle assessments across management systems and global regions. Glob Change Biol. 27, 1721–1736. doi: 10.1111/gcb.15509
del Prado, A., Lindsay, B., and Tricarico, J. (2023). Retrospective and projected warming equivalent emissions from global livestock and cattle calculated with an alternative climate metric denoted GWP*. PLoS One 18:e0288341. doi: 10.1371/journal.pone.0288341
Dell, C. J., Salon, P. R., Franks, C. D., Benham, E. C., and Plowden, Y. (2008). No-till and cover crop impacts on soil carbon and associated properties on Pennsylvania dairy farms. J. Soil Water Conserv. 63, 136–142. doi: 10.2489/jswc.63.3.136
Derner, J. D., Augustine, D. J., and Frank, D. A. (2019). Does grazing matter for soil organic carbon sequestration in the Western North American Great Plains? Ecosystems 22, 1088–1094. doi: 10.1007/s10021-018-0324-3
DeVuyst, E. A., Pryor, S. W., Lardy, G., Eide, W., and Wiederholt, R. (2011). Cattle, ethanol, and biogas: Does closing the loop make economic sense? Agric. Syst. 104, 609–614. doi: 10.1016/j.agsy.2011.06.003
Dhakal, S., Minx, J. C., Toth, F. L., Abdel-Aziz, A., Meza, M. J., Hubacek, K., et al. (2023). Emissions Trends and Drivers. In: P. R. Shukla, J. Skea, R. Slade, A. KhourdajieAl, R. Diemenvan, and D. McCollum, et al., editors. Climate Change 2022: Mitigation of Climate Change. Contribution of Working Group III to the Sixth Assessment Report of the Intergovernmental Panel on Climate Change. Cambridge University Press, Cambridge, UK. p. 215–294.
Dijkstra, J., Bannik, A., France, J., Kebreab, E., and van Gastelen, S. (2018). Short communication: Antimethanogenic effects of 3-nitrooxypropoanl depend on supplementation dose, dietary fiber content, and cattle type. J. Dairy Sci. 101, 9041–9047. doi: 10.3168/jds.2018-14456
Eagle, A. J., Henry, L. R., Olander, L. P., Haugen-Kozyra, K. H., Millar, N., and Robertson, G. P.. (2011). Greenhouse gas mitigation potential of agricultural land management in the United States: a synthesis of the literature. Second edition. Nicholas Institute for Environmental Policy Solutions, Durham, North Carolina, USA. Available online at: https://lter.kbs.msu.edu/docs/robertson/eagle+et+al.+2011+nicholas+inst.pdf (Accessed March 18, 2022).
EPA (2018). Market opportunities for biogas recovery systems at U.S. livestock facilities. Washington, DC: Environmental Protection Agency.
EPA (2021). AgSTAR: Livestock Anaerobic Digester Database. Washington, DC: Environmental Protection Agency.
EPA (2024). Inventory of U.S. greenhouse gas emissions and sinks: 1990–2022. Washington, DC: Environmental Protection Agency.
Erickson, G., and Klopfenstein, T. (2010). Nutritional and management methods to decrease nitrogen losses from beef feedlots. J. Anim. Sci. 88, E172–E180. doi: 10.2527/jas.2009-2358
Figueiredo, E. B., Jayasundara, S., Bordonal, R. D. O., Berchielli, T. T., Reis, R. A., Wagner-Riddle, C., et al. (2017). Greenhouse gas balance and carbon footprint of beef cattle in three contrasting pasture-management systems in Brazil. J. Clean. Prod. 142, 420–431. doi: 10.1016/j.jclepro.2016.03.132
Fuglestvedt, J. S., Berntsen, T. K., Godal, O., Sausen, R., Shine, K. P., and Skodvin, T. (2003). Metrics of climate change: assessing radiative forcing and emission indices. Clim. Chang. 58, 267–331. doi: 10.1023/A:1023905326842
Goopy, J. (2019). Creating a low enteric methane emission ruminant: what is the evidence of success to the present and prospects for developing economies? Anim. Prod. Sci. 59, 1769–1776. doi: 10.1071/AN18457
Greene, J. M., Wallace, J., Williams, R. B., Leytem, A. B., Bock, B. R., McCully, M., et al. (2024). National Greenhouse Gas emission reduction potential from adopting anaerobic digestion on large-scale dairy farms in the U.S. Environ. Sci. Technol. 58, 12409–12419. doi: 10.1021/acs.est.4c00367
Hassink, J. (1997). The capacity of soils to preserve organic C and N by their association with clay and silt particles. Plant Soil 191, 77–87. doi: 10.1023/A:1004213929699
Hegarty, R. S., Cortez Passetti, R. A., Dittmer, K. M., Wang, Y., Shelton, S., Emmet-Booth, J., et al. (2021). An evaluation of emerging feed additives to reduce methane emissions from livestock. Edition 1. A report coordinated by Climate Change, Agriculture and Food Security (CCAFS) and the New Zealand Agricultural Greenhouse Gas Research Centre (NZAGRC) initiative of the Global Research Alliance (GRA).
Henderson, B. B., Gerber, P. J., Hilinski, T. E., Falcucci, A., Ojima, D. S., Salvatore, M., et al. (2015). Greenhouse gas mitigation potential of the world’s grazing lands: Modeling soil carbon and nitrogen fluxes of mitigation practices. Agric. Ecosyst. and Environ. 207, 91–100. doi: 10.1016/j.agee.2015.03.029
Herrero, M., Henderson, B., Havlík, P., Thornton, P. K., Conant, R. T., Smith, P., et al. (2016). Greenhouse gas mitigation potentials in the livestock sector. Nat. Clim. Chang. 6, 452–461. doi: 10.1038/nclimate2925
Hristov, A. N. (2012). Historic, pre-European settlement, and present-day contribution of wild ruminants to enteric methane emissions in the United States. J. Anim. Sci. 90, 1371–1375. doi: 10.2527/jas.2011-4539
Hristov, A. N., Oh, J., Firkins, J. L., Dijkstra, J., Kebreab, E., Waghorn, G., et al. (2013). Special Topics–Mitigation of methane and nitrous oxide emissions from animal operations: I. A review of enteric methane mitigation options. J. Anim. Sci. 91, 5045–5069. doi: 10.2527/jas.2013-6583
Ihori, T., Burke, I. C., Lauenroth, W. K., and Coffin, D. P. (1995). Effects of cultivation and abandonment on soil organic matter in northeastern Colorado. Soil Sci. Soc. Am. J. 59, 1112–1119. doi: 10.2136/sssaj1995.03615995005900040024x
IPCC (2014). “Climate Change 2014: Mitigation of Climate Change” in Contribution of Working Group III to the Fifth Assessment Report of the Intergovernmental Panel on Climate Change. eds. O. Edenhofer, R. Pichs-Madruga, Y. Sokona, E. Farahani, S. Kadner, and K. Seyboth, et al. (Cambridge, United Kingdom: Cambridge University Press).
IPCC. (2018). Annex I: Glossary. [J. B. R. Matthews (ed.)]. In: Global Warming of 1.5°C. An IPCC Special Report on the impacts of global warming of 1.5°C above pre-industrial levels and related global greenhouse gas emission pathways, in the context of strengthening the global response to the threat of climate change, sustainable development, and efforts to eradicate poverty [V. Masson-Delmotte, P. Zhai, H.-O. Pörtner, D. Roberts, J. Skea, and P. R. Shukla, et al. (eds.)]. Cambridge University Press: Cambridge, UK and New York, NY, USA. Pp. 541–562.
IPCC (2021). “Summary for Policymakers” in Climate Change 2021: The Physical Science Basis. Contribution of Working Group I to the Sixth Assessment Report of the Intergovernmental Panel on Climate Change. eds. V. Masson Delmotte, P. Zhai, A. Pirani, S. L. Connors, C. Péan, and S. Berger, et al. (Cambridge, United Kingdom and New York, NY, USA: Cambridge University Press).
Jablonski, K. E., Dillon, J. A., Hale, J. W., Jablonski, B. B. R., and Carolan, M. S. (2020). One place doesn’t fit all: improving the effectiveness of sustainability standards by accounting for place. Front. Sustain. Food Syst. 4:557754. doi: 10.3389/fsufs.2020.557754
Kelliher, F. M., and Clark, H. (2009). Methane emissions from bison—An histortic herd estimate for the North American Great Plans. Agric. For. Meteorol. 150, 473–477. doi: 10.1016/j.agrformet.2009.11.019
Kinley, R. D., Martinez-fernandez, G., Matthews, M. K., De Nys, R., Magnusson, M., and Tomkins, N. W. (2020). Mitigating the carbon footprint and improving productivity of ruminant livestock agriculture using a red seaweed. J. Clean. Prod. 259:120836. doi: 10.1016/j.jclepro.2020.120836
Knapp, J. R., Laur, G. L., Vadas, P. A., Weiss, W. P., and Tricarico, J. M. (2014). Invited Review: Enteric methane in dairy cattle production: Quantifying the opportunities and impact of reducing emissions. J. Dairy Sci. 97, 3231–3261. doi: 10.3168/jds.2013-7234
Laca, A., Laca, A., and Diaz, M. (2021). Environmental advantages of coproducing beef meat in dairy systems. Environ. Technol. 44, 446–465. doi: 10.1080/09593330.2021.1974577
Leahy, S., Clark, H., and Reisinger, A. (2020). Challenges and Prospects for agricultural greenhouse gas mitigation pathways consistent with the paris agreement. Front. Sustain. Food Syst. 4:69. doi: 10.3389/fsufs.2020.00069
Lee, C. M., Lazarus, M., Smith, G. R., Todd, K., and Weitz, M. (2013). A ton is not only a ton: A road-test of landfill, manure, and afforestation/reforestation offset protocols in the U.S. carbon market. Environ. Sci. Pol. 33, 53–62. doi: 10.1016/j.envsci.2013.05.002
Liang, D., Sun, F., Wattiaux, M. A., Cabrera, V. E., Hedtcke, J. L., and Silva, E. M. (2017). Effect of feeding strategies and cropping systems on greenhouse gas emission from Wisconsin certified organic dairy farms. J. Dairy Sci. 100, 5957–5973. doi: 10.3168/jds.2016-11909
Liu, S., Proudman, J., and Mitloehner, F. (2021). Rethinking methane from animal agriculture. CABI Agric. Biosci. 2:22. doi: 10.1186/s43170-021-00041-y
Lynch, J., Cain, M., Frame, D., and Pierrehumbert, R. (2021). Agriculture’s Contribution to Climate Change and Role in Mitigation Is Distinct From Predominantly Fossil CO2-Emitting Sectors. Front. Sustain. Food Syst. 4:518039. doi: 10.3389/fsufs.2020.518039
McCabe, C. J., El Mashad, H. M., and Mitloehner, F. M. (2023). The path to climate neutrality for California dairies. CABI Rev. 18:1. doi: 10.1079/cabireviews.2023.0015
Meinshausen, M., and Nicholls, Z. (2022). GWP* is a model, not a metric. Environ. Res. Lett. 17:041002. doi: 10.1088/1748-9326/ac5930
Minasny, B., Malone, B. P., McBratney, A. B., Angers, D. A., Arrouays, D., Chambers, A., et al. (2017). Soil Carbon 4 per mille. Geoderma 292, 59–86. doi: 10.1016/j.geoderma.2017.01.002
Montes, F., Meinen, R., Dell, C., Rotz, A., Hristov, A. N., Oh, J., et al. (2013). Special Topics-Mitigation of methane and nitrous oxide emissions from animal operations: II. A review of manure management mitigation options. J. Anim. Sci. 91, 5070–5094. doi: 10.2527/jas.2013-6584
Moraes, J. C. D., Lal, R., Cerri, C. C., Lorenz, K., Hungria, M., and Carvalho, P. C. D. F. (2017). Low-carbon agriculture in South America to mitigate global change and advance food security. Environ. Int. 98, 102–112. doi: 10.1016/j.envint.2016.10.020
NCBA. (2021). Commitment to Building a Sustainable Legacy. Available online at: https://www.ncba.org/ (Accessed August 22, 2024).
O’Neill, B. C. (2000). The jury is still out on global warming potentials. Clim. Chang. 44, 427–443. doi: 10.1023/A:1005582929198
Osman, M. B., Tierney, J. E., Zhu, J., Tardif, R., Hakim, G. J., King, J., et al. (2021). Globally resolved surface temperatures since the Last Glacial Maximum. Nature 599, 239–244. doi: 10.1038/s41586-021-03984-4
Pelletier, N., Pirog, R., and Rasmussen, R. (2010). Comparative life cycle environmental impacts of three beef production strategies in the Upper Midwestern United States. Agirc. Syst. 103, 380–389. doi: 10.1016/j.agsy.2010.03.009
Place, S. E., McCabe, C. J., and Mitloehner, F. M. (2022). Symposium review: defining a pathway to climate neutrality for US dairy cattle production. J. Dairy Sci. 105, 8558–8568. doi: 10.3168/jds.2021-21413
Reinhart, K. O., Sanni Worogo, H. S., Rinella, M. J., and Vermeire, L. T. (2021). Livestock increase soil organic carbon in the Northern Great Plains. Rangel. Ecol. Manag. 79, 22–27. doi: 10.1016/j.rama.2021.07.006
Rogelj, J., Elzen, M. D., Hohne, N., Fransen, T., Fekete, H., Winkler, H., et al. (2016). Paris Agreement climate proposals need a boost to keep warming well below 2°C. Nature 534, 631–639. doi: 10.1038/nature18307
Roos, K. F., Martin, J. H., and Moser, M. A. (2004). AgSTAR handbook: A manual for developing biogas systems at commercial farms in the United States. 2nd Edn. Washington, DC: Environmental Protection Agency.
Roque, B. M., Venegas, M., Kinley, R. D., De Nys, R., Duarte, T. L., Yang, X., et al. (2021). Red seaweed (Asparagopsis taxiformis) supplementation reduces enteric methane by over 80 percent in beef steers. PLoS One 16:e0247820. doi: 10.1371/journal.pone.0247820
Rosa, L., and Gabrielli, P. (2023). Achieving net-zero emissions in agriculture: a review. Environ. Res. Lett. 18:063002. doi: 10.1088/1748-9326/acd5e8
Rotz, C. A., Asem-Hiablie, S., Dillon, J., and Bonifacio, H. (2015). Cradle-to-farm gate environmental footprints of beef cattle production in Kansas, Oklahoma, and Texas. J. Anim. Sci. 93, 2509–2519. doi: 10.2527/jas2014-8809
Rotz, C. A., Asem-Hiablie, S., Place, S., and Thoma, G. (2019). Environmental footprints of beef cattle production in the United States. Agric. Syst. 169, 1–13. doi: 10.1016/j.agsy.2018.11.005
Rotz, A., Stout, R., Leytem, A., Feyereisen, G., Waldrip, H., Thoma, G., et al. (2021). Environmental assessment of United States dairy farms. J. Clean. Prod. 315:128153. doi: 10.1016/j.jclepro.2021.128153
Rowntree, J. E., Stanley, P. L., Maciel, I. C. F., Thorbecke, M., Rosenzweig, S. T., Hancock, D. W., et al. (2020). Ecosystem impacts and productive capacity of a multi-species pastured livestock system. Front. Sustain. Food Syst. 4:544984. doi: 10.3389/fsufs.2020.544984
Sanderson, J. S., Beutler, C., Brown, J. R., Burke, I., Chapman, T., Conant, R. T., et al. (2020). Cattle, conservation, and carbon in the western Great Plains. J. Soil Water Conserv. 75, 5A–12A. doi: 10.2489/jswc.75.1.5A
Sanford, G. R., Posner, J. L., Jackson, R. D., Kucharik, C. J., Hedtcke, J. L., and Lin, T. L. (2012). Soil carbon lost from mollisols of the north central U.S.A. with 20 years of agricultural best management practices. Agricult, Ecosyst Environ. 162, 68–76. doi: 10.1016/j.agee.2012.08.011
Savian, J. V., Neto, A. B., de David, D. B., Bremm, C., Schons, R. M. T., and Genro, T. C. M. (2014). Grazing intensity and stocking methods on animal production and methane mission by grazing sheep: Implications for integrated crop-livestock system. Agric. Ecosyst. Environ. 190, 112–119. doi: 10.1016/j.agee.2014.02.008
Schuman, G. E., Janzen, H. H., and Herrick, J. E. (2002). Soil carbon dynamics and potential carbon sequestration by rangelands. Environ. Pollut. 116, 391–396. doi: 10.1016/S0269-7491(01)00215-9
Seneviratne, S. I., Zhang, X., Adnan, M., Badi, W., Dereczynski, C., Di Luca, A., et al. (2021). “Weather and Climate Extreme Events in a Changing Climate” in Climate Change 2021: The Physical Science Basis. Contribution of Working Group I to the Sixth Assessment Report of the Intergovernmental Panel on Climate Change. eds. V. Masson Delmotte, P. Zhai, A. Pirani, S. L. Connors, C. Péan, and S. Berger, et al. (Cambridge, United Kingdom and New York, NY, USA: Cambridge University Press).
Sharvelle, S., and Loetscher, L.. (2011). Anaerobic digestion of animal wastes in Colorado. Colorado State University Extension. Fact sheet No. 1.227. Available online at: https://extension.colostate.edu/docs/pubs/livestk/01227.pdf. (Accessed December 20, 2021).
Shine, K. P., Berntsen, T. K., Fuglestvedt, J. S., Skeie, R. B., and Stuber, N. (2007). Comparing the climate effect of emissions of short-and long-lived climate agents. Philos. Trans. R. Soc. A Math. Phys. Eng. Sci. 365, 1903–1914. doi: 10.1098/rsta.2007.2050
Shine, K. P., Fuglestvedt, J. S., Hailemariam, K., and Stuber, N. (2005). Comparing climate impacts of emissions of greenhouse gases. Clim. Chang. 68, 281–302. doi: 10.1007/s10584-005-1146-9
Smith, F. A., Hammond, J. I., Balk, M. A., Elliott, S. M., Lyons, S. K., Pardi, M. I., et al. (2015). Exploring the influence of ancient and historic megaherbivore extirpations on the global methane budget. PNAS 113, 874–879. doi: 10.1073/pnas.1502547112
Smith, S. M., Lowe, J. A., Bowerman, N. H. A., Gohar, L. K., Huntingford, C., and Allen, M. R. (2012). Equivalence of greenhouse-gas emissions for peak temperature limits. Nat. Clim. Chang. 2, 535–538. doi: 10.1038/nclimate1496
Stackhouse-Lawson, K. R., Rotz, C. A., Oltjen, J. W., and Mitloehner, F. M. (2012). Carbon footprint and ammonia emissions of California beef production systems. J. Anim. Sci. 90, 4641–4655. doi: 10.2527/jas.2011-4653
Stanley, P. L., Rowntree, J. E., Beede, D. K., DeLonge, M. S., and Hamm, M. W. (2018). Impacts of soil carbon sequestration on life cycle greenhouse gas emissions in Midwestern USA beef finishing systems. Agric. Syst. 162, 249–258. doi: 10.1016/j.agsy.2018.02.003
Stanley, P., Spertus, J., Chiartas, J., Stark, P. B., and Bowles, T. (2023). Valid inferences about soil carbon in heterogeneous landscapes. Geoderma 430:116323. doi: 10.1016/j.geoderma.2022.116323
Stefenoni, H. A., Räisänen, S. E., Cueva, S. F., Wasson, D. E., Lage, C. F. A., Melgar, A., et al. (2021). Effects of the macroalga Asparagopsis taxiformis and oregano leaves on methane emission, rumen fermentation, and lactational performance of dairy cows. J. Dairy Sci. 104, 4157–4173. doi: 10.3168/jds.2020-19686
Steward, D., Weber, E., and Supple, L.. (2021). Anaerobic digestion implementation at dairies in Colorado. National Renewable Energy Laboratory. Available online at: https://www.nrel.gov/docs/fy21osti/80381.pdf#:~:text=GHG%20reductions%20for%20biogas%20produced%20by%20digesters%20operating,MT%29%20CO20220eq%2F%20cow%2Fyear%20%28US20EPA202014%29. (Accessed December 20, 2021)
Thompson, L. R., Beck, M. R., Gunter, S. A., Williams, G. D., Place, S. E., and Reuter, R. R. (2019). An energy and monensin supplement reduces methane emission intensity of stocker cattle grazing winter wheat. Appl. Anim. Sci. 35, 433–440. doi: 10.15232/aas.2018-01841
Thompson, L. R., and Rowntree, J. E. (2020). Invited Review: Methane sources, quantification and mitigation in grazing beef systems. Appl. Anim. Sci. 36, 556–573. doi: 10.15232/aas.2019-01951
Tichenor, N. E., Peters, C. J., Norris, G. A., Thoma, G., and Griffin, T. S. (2017). Life cycle environmental consequences of grass fed and dairy beef production systems in the Northeastern United States. J. Clean. Prod. 142, 1619–1628. doi: 10.1016/j.jclepro.2016.11.138
U.S. Dairy. (2020). U.S. Dairy advances journey to net zero carbon emissions by 2050. Dairy's Journey to Net Zero Carbon Emissions |U.S. Dairy. Available online at: https://www.usdairy.com/ (Accessed August 22, 2024).
U.S. Dairy. (2023). Accelerating Action: U.S. Dairy Net Zero Initiative Executive Summary. NZI-Executive-Summary-2023.pdf. Available online at: https://www.usdairy.com/ (Accessed August 22, 2024).
UNFCCC. (2015). Adoption of the Paris Agreement. Report No. FCCC/CP/2015/L.9/Rev.1. Available online at: https://unfccc.int/resource/docs/2015/cop21/eng/l09r01.pdf (Accessed August 22, 2024).
Ungerfeld, E. M., Beauchemin, K. A., and Muñoz, C. (2022). Current Perspectives on Achieving Pronounced Enteric Methane Mitigation From Ruminant Production. Front. Anim. Sci. 2:795200. doi: 10.3389/fanim.2021.795200
USGCRP (2018). “Impacts, Risks, and Adaptation in the United States” in Fourth National Climate Assessment, Volume II. eds. D. R. Reidmiller, C. W. Avery, D. R. Easterling, K. E. Kunkel, K. L. M. Lewsi, and T. K. Maycock, et al. (Washington, D. C: U.S. Global Change Research Program).
Venterea, R. T., Halvorson, A. D., Kitchen, N., Liebig, M. A., Cavigelli, M. A., Del Grosso, S. J., et al. (2012). Challenges and opportunities for mitigation nitrous oxide emissions from fertilized cropping systems. Front. Ecol. Environ. 10, 562–570. doi: 10.1890/120062
Wattiaux, M. A., Uddin, M. E., Letelier, P., Jackson, R. D., and Larson, R. A. (2019). Invited Review: Emission mitigation of greenhouse gases from dairy farms: the cow, the manure, and the field. Appl. Anim. Sci. 35, 238–254. doi: 10.15232/aas.2018-01803
WRI and WBCSD (2004). The Greenhouse Gas Protocol: A corporate accounting and reporting standard. World Resources Institute and World Business Council for Sustainable Development: Washington D. C.
Yáñez-Ruiz, D. R., Abecia, L., and Newbold, C. J. (2015). Manipulating rumen microbiome and fermentation through interventions during early life: a review. Front. Microbiol. 6:1133. doi: 10.3389/fmicb.2015.01133
Keywords: climate neutrality, manure emissions, enteric emissions, ruminant livestock, greenhouse gas emissions
Citation: Thompson LR, Beck MR, Larson H, Rowntree JE, Place SE and Stackhouse-Lawson KR (2025) Is climate neutral possible for the U.S. beef and dairy sectors? Front. Sustain. Food Syst. 9:1556433. doi: 10.3389/fsufs.2025.1556433
Edited by:
Victoria Anthony Uyanga, Lincoln University, United StatesReviewed by:
Akeem Babatunde Sikiru, Federal University of Agriculture Zuru, NigeriaPeter Amer, AbacusBio Limited, New Zealand
Jalil Ghassemi Nejad, Konkuk University, Republic of Korea
Singaravadivelan A., Tamil Nadu Veterinary and Animal Sciences University, India
Copyright © 2025 Thompson, Beck, Larson, Rowntree, Place and Stackhouse-Lawson. This is an open-access article distributed under the terms of the Creative Commons Attribution License (CC BY). The use, distribution or reproduction in other forums is permitted, provided the original author(s) and the copyright owner(s) are credited and that the original publication in this journal is cited, in accordance with accepted academic practice. No use, distribution or reproduction is permitted which does not comply with these terms.
*Correspondence: L. R. Thompson, dGhvbTk0QGtzdS5lZHU=