 Zheng Guo
 Yunwei Xu1
 Giri Raj Kattel
- 1State Key Laboratory of Lakes and Environment, Nanjing Institute of Geography and Limnology, Chinese Academy of Sciences, Nanjing, Jiangsu, China
- 2School of Geographical Sciences, Nanjing University of Information Science and Technology, Nanjing, China
- 3Department of Infrastructure Engineering, The University of Melbourne, Melbourne, VIC, Australia
- 4Department of Hydraulic Engineering, Tsinghua University, Beijing, China
Cities, as a geographical unit with the greatest intensity of human socio-economic activities, have become the core nodes that disrupt the natural cycle of phosphorous (P) and regulate P flow toward sustainable development. However, P flows and its balance in many Chinese cities are largely unknown. This study employed the substance flow analysis (SFA) method to construct a P flow model for the food chain in Changzhou, a representative lakeside city in the Taihu Basin. From 2000 to 2021, the total P input and stock in Changzhou city's food chain system declined from 5,698.55 tP and 5,219.55 tP to 2,391.26 tP and 1,760.46 tP, respectively. Conversely, the total P loss surged from 478.99 tP to 630.79 tP, suggesting an open and unrestricted P flow. The P use efficiency (PUE) in animal production increased from 30.11% in 2000 to 37.65% in 2021, while that in crop production and the overall food chain increased from 51.41 and 65.74% in 2000 to 71.94% and 80.16% in 2021. Scenario analysis revealed that reducing food P uptake could lower total food chain P inputs and dependence on external P. Fertilizer recommendations could boost the PUE of crop production from 71.94% to 81.34%. Besides, urine diversion and waste incineration scenarios significantly decreased P accumulation in the food chain. Improving sewage treatment technology could further cut P discharge. An adaptive food chain P flow management framework was proposed. Leveraging the self-management and replicability of cities, this framework can be easily implemented in other regions and has the potential to be scaled up nationally, aiming to mitigate P loss and enhance P utilization efficiency.
1 Introduction
Phosphorus (P) is an essential and irreplaceable nutrient for plant and animal growth, and a critical resource for fertilizer production (Bizimana et al., 2024). Human activities, including mining and industrial processing, have escalated P fertilizer application to meet global food demands driven by population growth (Tian et al., 2021). However, these practices have disrupted natural P cycles (Rabby et al., 2024), leading to elevated organic P accumulation in terrestrial and aquatic systems. For instance, P losses from food production and consumption have triggered eutrophication and algal blooms in wetland ecosystems (Dong et al., 2023). Approximately 40% of plant- and animal-derived P is consumed by humans, with the remainder lost to soil or water. Given the low P use efficiency (PUE), global phosphate rock reserves, which serve as the primary natural source of phosphorus for fertilizers, are projected to deplete within 50 to 200 years (Yuan et al., 2011a). The evolving nature of P sourcing profoundly impacts food chain dynamics. Thus, understanding P losses within food chains is crucial for optimizing PUE, ensuring sustainable agriculture, and safeguarding water environmental security (Ma et al., 2013).
Being an important resource and an environmental polluter, the dynamics of P flow in the food chain holds considerable implications in water and food securities in lake and river basins worldwide (Vingerhoets et al., 2023). Understanding upstream P flows in plant and animal production, household consumption, and food processing, and downstream P flows in wastewater treatment plants and landfills is crucial (Færge et al., 2001). Lately, sophisticated approaches such as the Substance Flow Analysis (SFA) have been very useful to indicate household organic waste and soil runoff/erosion/leaching as the major causes of P loss in the food chain (Papangelou et al., 2020). P flows in China's food chain using the SFA method reveals that the PUE in food production is relatively low. Production of 1 kg of food in China requires about 13 kg of P with annual P input about 7.8 × 10⁶ t (Ma et al., 2010). Rapidly changing urban household consumptions in China have become further critical in P flows within the food chain as the P accumulation has increased 5 times since the 1990s (Li et al., 2012). Empirical studies on P flows in food chains of different Chinese cities such as Beijing and Tianjin (Qiao et al., 2011; Ma et al., 2014), counties such as Wuwei (Bi et al., 2013), and Shucheng (Yuan et al., 2011b) show that the behaviors of P flows pattern varies. However, the P flow in cities' food chain is thought to be more and more linear (Guo et al., 2023), implying the need for P flow analysis in cities' food chain to address local P management (Lin et al., 2016). Unlike the static assessment of P loss carried out at a single time point food chain in the past, the future study on P flow must be temporal or policy-driven changes in the food chain (Liu et al., 2023). Without establishing the understanding of the impacts of different future scenarios on the characteristics of P flows and their use efficiencies, such as future urban populations, fertilizer control and improvements in waste management and treatment technologies, no P loss pathways in cities' food chain can be identified (Wu et al., 2016). Further, although strategies such as regulating diet and improving waste treatment facilities were proposed for P flow in the food chain in the past, the concept of sustainable P flow was not included in the framework. Given the rate of China's urban development in unprecedented spatial scales, and its operability and reproducibility of nutrient management, the assessment of P flow in food chains is thought to be feasible.
China's urban development is characterized by population growth, rising living standards, and a transformation in the food consumption structure (Dong et al., 2023). This situation not only presents greater challenges to economic development but also offers an opportunity to establish a robust and sustainable phosphorus (P) management framework. Because of these changes, the pollution sources in urban water environment are shifting from a point to diffuse pollution sources, and these pollution sources are becoming more complex in P governance involving the stage of socio-economic development, economic structure, and consumption structure of the population (Wu et al., 2012). However, the important processes associated with P flow in the food chain during the current rapid urbanization process may take several years before their impacts become apparent (Liu et al., 2023). The knowledge gaps regarding the long-term fate and magnitude of P flows at the China's urban scale must be unraveled (Chowdhury et al., 2014).
In this study, we conducted an in-depth investigation into the evolution of P flow characteristics and the strategies for its sustainable management within the city-level food chain. We chose the city of Changzhou in the Taihu Basin (China), as a representative case study. Changzhou city is endowed with a rich network of lakes, wetlands, and rivers. However, during its rapid urbanization process, it faces a formidable water governance challenge mainly due to anthropogenic P discharges (Zhang et al., 2022). We set three main research objectives: i. quantify the overall P flow characteristics, P sources and use efficiency, P accumulation and loss of the food chain from 2001 to 2021; ii. assess the impacts of different scenarios on P flows in urban food chains in future, and; iii. develop a framework for sustainable management of food P at the urban scale. The results of this study can enrich the research on P flow in the city-level food chain and provide data and theoretical references for the sustainable management of urban P resources.
2 Materials and methods
2.1 Study area
Changzhou is a prefecture-level city located in the southern part of Jiangsu Province, China, between 31°09′−32°04′N and 119°08′−120°12′E. Changzhou city features a dense river network and numerous lakes, which endows the city with abundant water resources. Changdang Lake, Ge Lake, and Taihu Lake are three natural lakes that possess distinct regional characteristics and high visibility (Figure 1). Over the course of the study period, Changzhou city underwent a remarkable demographic transformation. The population of Changzhou city grew from 3.41 million in 2000 to 3.88 million in 2021. The average annual growth rate of per capita gross national product (GDP) reached an astonishing 55.23%, and currently, the per capita GDP is 25,689 US dollars. In terms of urbanization, with an average annual growth rate of 2.11%, Changzhou city's urbanization rate has now reached 77.58% [BSCZ (Bureau of Statistics of Changzhou), 2023]. With the rapid advancement of the social economy, substantial transformations have occurred in both the dietary patterns of urban residents and waste disposal mechanisms. For example, from 2000 to 2021, the consumption of plant-based diets by urban residents decreased from 250.23 kg cap−1yr−1 to 144.6 kg cap−1yr−1. Conversely, the consumption of animal-based diets increased from 25.05 kg cap−1yr−1 to 45.5 kg cap−1yr−1 [BSCZ (Bureau of Statistics of Changzhou), 2023]. Besides, a clear separation between organic waste and farmland has emerged in waste disposal. These changes have led to significant losses of organic waste within the urban food chain. Against the backdrop of strict industrial waste emission controls, the loss of organic waste in the urban food chain has emerged as the most significant non-point source of pollution, exacerbating the eutrophication of water bodies (Chen et al., 2024).
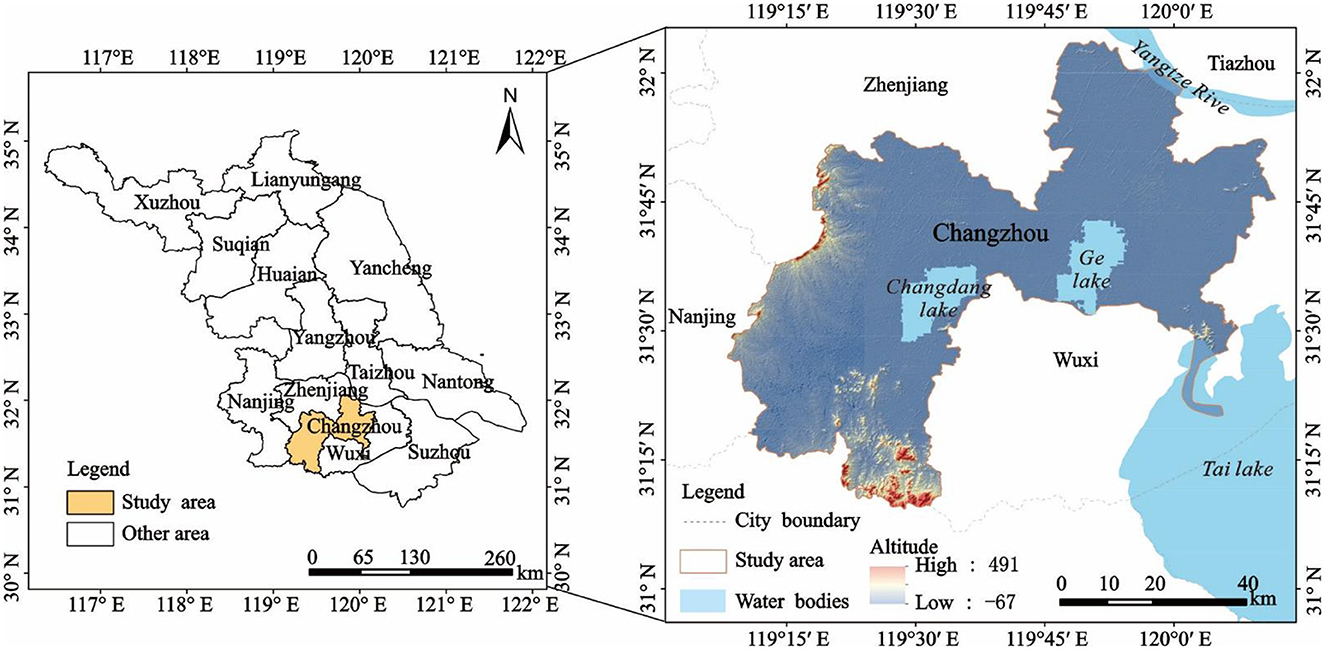
Figure 1. The location of Changzhou city.
2.2 Calculation of the P flows at city level
2.2.1 Description of the P flow analytical model
We used the SFA method to quantify P flows in Changzhou city's food chain from 2000 to 2021. As a systematic framework for tracking substance movement within defined systems, SFA identifies key processes including sources, sinks, flow pathways, and storage nodes (Liu et al., 2024). While standard SFA models typically encompass comprehensive food chain processes, our implementation underwent adaptive modifications to address Changzhou city's data availability constraints and local operational realities. Three principal adjustments were made to optimize the model structure: first, the food processing and household consumption stages were consolidated into a single subsystem. This aggregation aligns with mass conservation principles (Papangelou et al., 2020). It mitigates data scarcity issues and preserves the integrity of system-wide P input-output accounting. Second, enhanced resolution was applied to downstream processes through the explicit inclusion of municipal waste management infrastructure. The establishment of dedicated nodes for Wastewater treatment plants (WWTPs) and landfills enables detailed analysis of P flow redistribution and reuse potential. Third, model complexity was strategically balanced through the elimination of non-essential processes and the retention of core functional units. The constructed P flow model for Changzhou city's food chain comprehensively encompasses multiple key components. Upstream in the food chain, it includes crop production (with the soil root zone considered), animal production, and the combined stage of food processing and household consumption. Downstream, it incorporates WWTPs and landfills. In total, the model features 16 P flows and 2 P stocks, which provides a detailed and systematic representation of the P flow situation in Changzhou city's food chain (Figure 2).
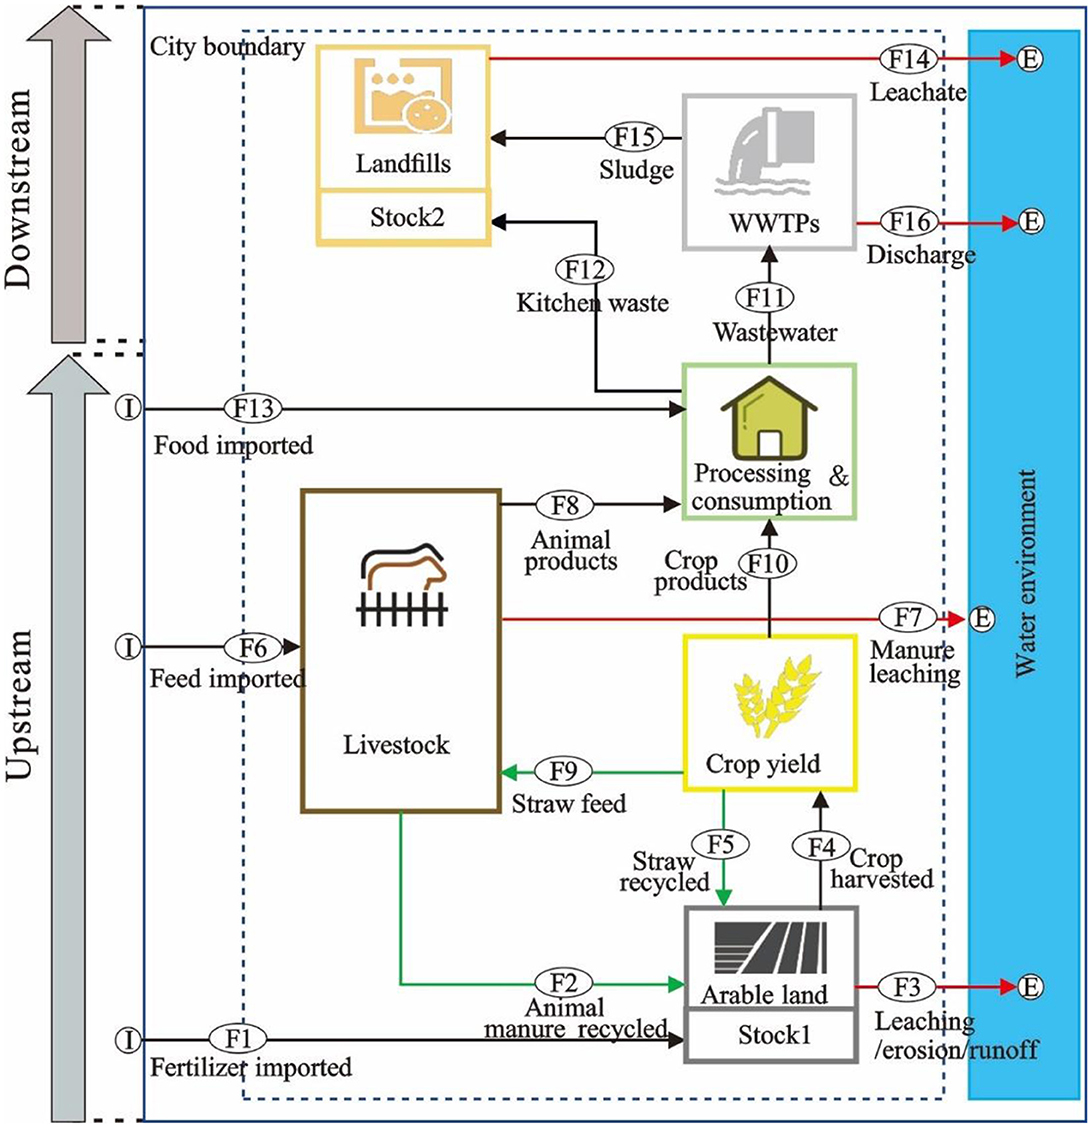
Figure 2. P flow model of Changzhou city's food chain; the upstream part of the food chain includes crop production (with the soil root zone considered), animal production, and the combined stage of food processing and household consumption. Downstream of the food chain incorporates WWTPs and landfills; the black arrow represents the system/subsystem input flow, the green arrow represents the loop flow, and the red arrow represents the loss flow.
2.2.2 Calculation of the total P flows and use efficiency
Using the SFA method, the accounting equations for the P flow model in the food chain were constructed. Details of the specific equations and data sources can be found in Supplementary Tables S1, S2. We consider crop and animal production activities with productive properties, as well as the overall food chain. Based on the Figure 1, the PUE can be obtained by dividing the effective P production of the corresponding link by the total P input. Here, “effective P production” refers to the P output items that have practical value inside or outside the corresponding link, such as crop products. The calculation formula is as follows:
PUEC represents the P use efficiency in crop production, Pout,Ccrop products and Pout,Cstraw feed represent the outputs of crop products and straw feed products during crop production, respectively, while Pin,Ctotal represents the total P input during the crop production process, including P input through fertilizer imported, animal manure recycled and straw recycled.
PUEA represents the P use efficiency in animal production, Pout,Aanimal products and Pout,Aanimal recycle manure represent the outputs of animal products and manure products during animal production, respectively, Pprocessing,Aanimal slaughter waste represents the slaughter waste P during the processing; while Pin, Atotal represents the total P input during the animal production, including P input through feed imported and straw feed.
PUEF represents the P use efficiency in the overall food chain, Pout,FEffective P (upstream downstream) represents relevant effective P in the upstream and downstream of the food chain, such as P from exported or directly imported food products, and plant and animal products consumed by residents. Pin,Ftotal represents the total P input into the food chain, including P input through fertilizer imported, feed imported and food imported.
2.3 Future scenarios
Based on a comprehensive consideration of key factors such as urban population, consumption structure, and management and treatment technologies affecting food chain P flows, we selected seven quantifiable scenarios for regulating urban food chain P flows (Table 1). While synergies between scenarios could theoretically maximize P recovery, our study did not evaluate combined scenarios due to methodological constraints. Each scenario assumes independent policy and technological interventions, and overlapping implementations may introduce conflicting assumptions (e.g., simultaneous dietary shifts and waste infrastructure upgrades). Additionally, data limitations on cross-sectoral interactions and stakeholder coordination preclude robust multi-scenario modeling.
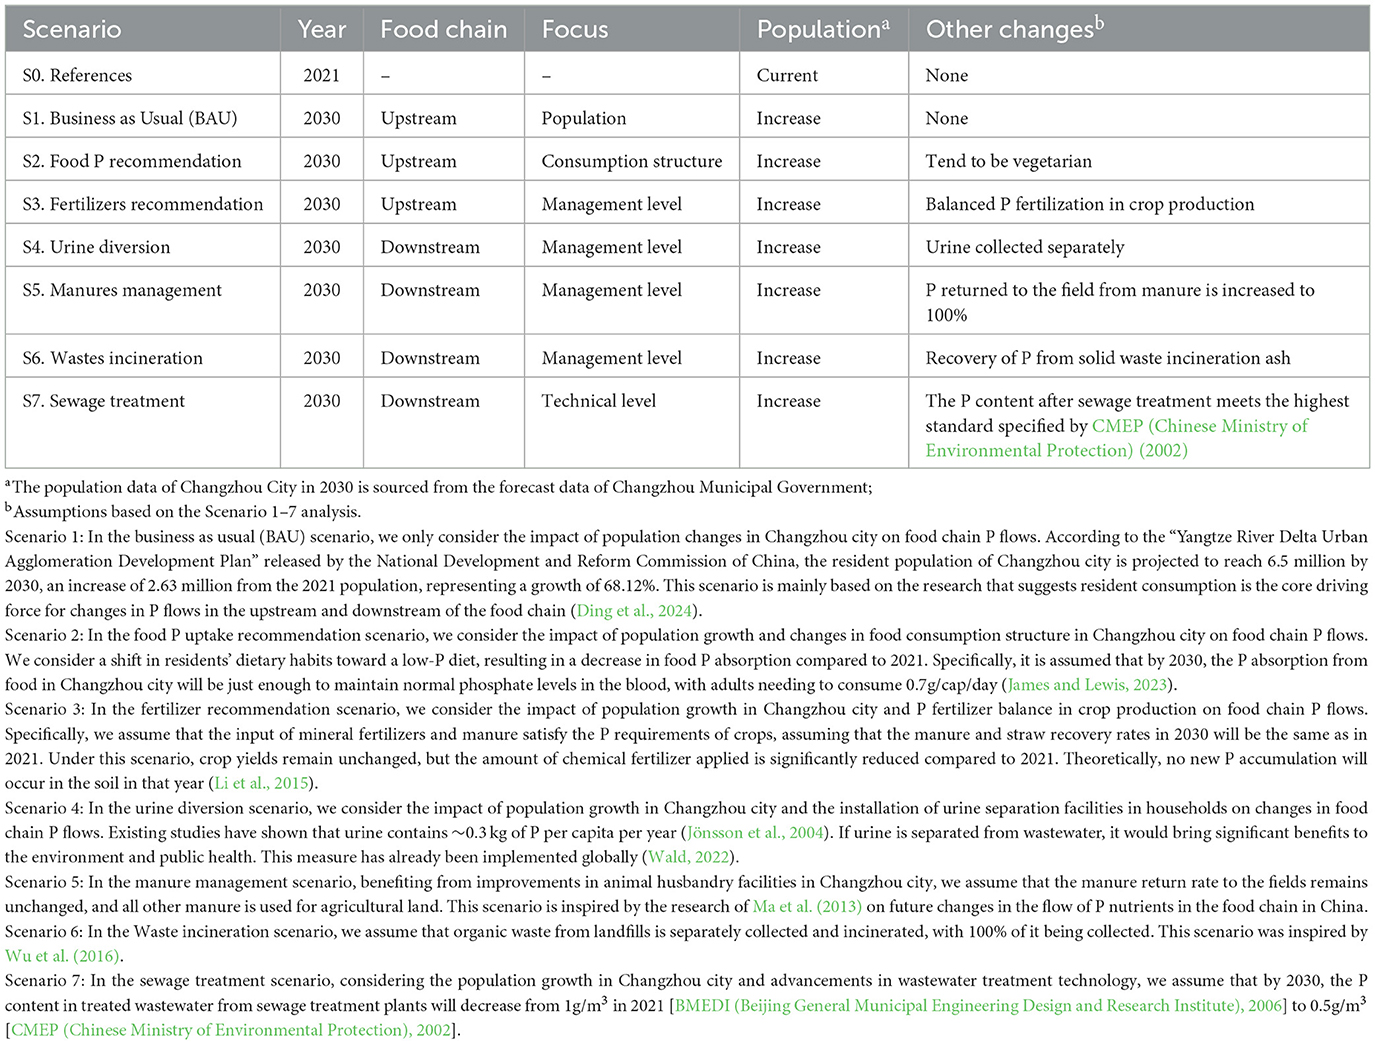
Table 1. Scenario analysis information of food chain P flows in Changzhou.
The P flows in the food chain under different future scenarios are also calculated based on the accounting equations in Supplementary Table S1. The 2021 P flow process serves as the reference scenario (S0), with 2030 set as the target year for scenario evaluation, aligning with the timeline of Changzhou city's Ecological Civilization Construction Plan (2021–2030). This plan aims to establish a green and circular economic system, promote sustainable production and lifestyles, and enhance environmental quality. The scenarios were designed to reflect potential pathways for achieving Sustainable Development Goals (SDGs), particularly SDG 2 (Zero Hunger), SDG 6 (Clean Water and Sanitation), and SDG 12 (Responsible Consumption and Production).
2.4 Uncertainty
To effectively analyze the P flow process in the food chain of Changzhou city, sufficient, reliable, and high-quality data are essential for obtaining valid information on the nature and magnitude of all flows and stocks related to the food chain. In this study, to quantify the uncertainty of the food chain P flow results, we applied the uncertainty analysis method proposed by Hedbrant and Sörme (2001). The fundamental concept of this method is to assign corresponding data uncertainty levels to each data point based on its source (for detailed data uncertainty levels, refer to Supplementary Table S2). In accordance with the common classification criteria adopted in existing studies (Klinglmair et al., 2015; Laner et al., 2016), we ultimately categorized the collected data into the following five classes (Table 2). Specifically, data in Level 1 was from the BSCZ (Bureau of Statistics of Changzhou) (2023) e.g., arable land area and application rate of P fertilizer, are multiplied or divided by 1.02. Data in Level 2 was from relevant research literature/reports/databases in other parts of China level e.g., fraction of animal manure P pollution, and are multiplied or divided by 1.03 and so on up to data in level 5 was from informed assumption.
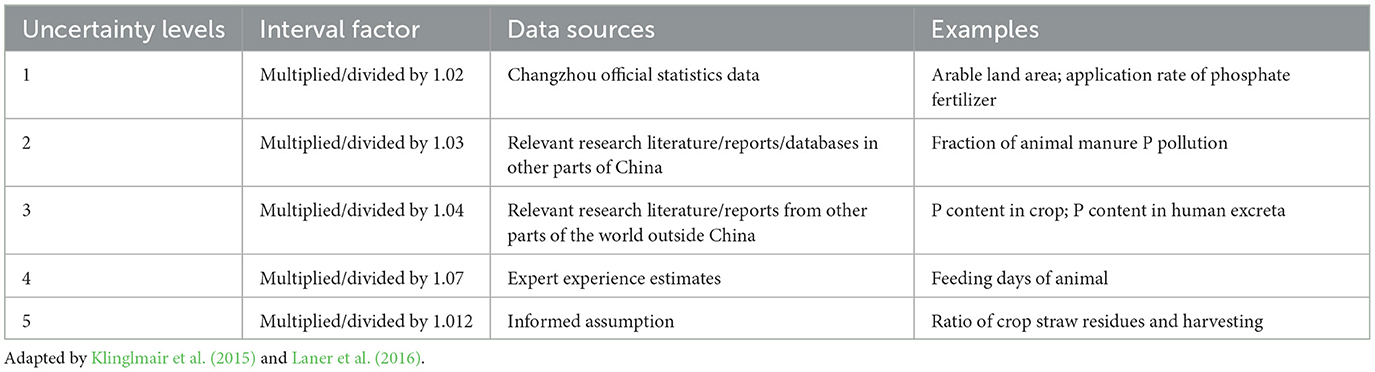
Table 2. Food chain P flow model input data sources and their uncertainty levels.
When combining datasets through addition or multiplication, the uncertainty is calculated using the equations proposed by Antikainen et al. (2005). Notably, multiplying datasets leads to an increase in uncertainty, whereas adding datasets results in a decrease in uncertainty. The specific calculation formula and example are as follows:
Multiplication:
Where fa and fb represented the assigned uncertainty interval for the P flow 1 and flow 2, respectively.
For example, the corn yield was 15,483,000 multiplied or divided by 1.02 kg in Changzhou city in 2021, and there are 3.11 multiplied or divided by 1.04 g P kg−1product−1, then the P in corn was 15,483,000 kg × 3.11 g P kg−1 = 48,152.13 kg, and we can calculate the uncertainty factor as follows:
so, the final uncertainty factor of the corresponding P flow is 1.04, and the final uncertainty interval of the corresponding P flow is 48152.13 multiplied or divided by 1.04 kg. That is, the lower limit of the uncertainty interval of the corresponding P flow is 48152.13 divided by 1.04, and the upper limit is 48152.13 multiplied by 1.04. Finally, the uncertainty interval of the corresponding P flow is [46300.13, 50078.22].
Addition:
Where ma and mb represented mass P flow 1 and flow 2, respectively.
For example, the P in corn and wheat is 48152.13 multiplied or divided by 1.04 kg and 576596.25 multiplied or divided by 1.04 kg, respectively, we can calculate the uncertainty factor as follows:
So, the final uncertainty factor of the corresponding P flow is 1.03, and the final uncertainty interval of the corresponding P flow is 624748.38 multiplied or divided by 1.03 kg. That is, the lower limit of the uncertainty interval of the corresponding P flow is 624748.38 divided by 1.03, and the upper limit is 624748.38 multiplied by 1.03. Finally, the uncertainty interval of the corresponding P flow is [606551.83, 643490.83].
Based on the above calculation principles and examples, and by incorporating the P flow equations in Supplementary Table S1, the uncertainty interval range of each P flow in this study can be obtained. Besides, based on the data structure of this study and referring to the classification criteria proposed by Bi et al. (2013) and Wang et al. (2020), in this study, an uncertainty factor of each P flow within the range of (1, 1.07] indicates a high-quality quantification result, within the range of (1.07, 1.12] indicates a medium-quality quantification result, and >1.12 indicates a low-quality quantification result. For more examples of the calculation methods, please refer to the study by Mnthambala et al. (2021).
3 Results
3.1 Overall P flows characteristics
Figures 3a, b depict the P flow in the food chain of Changzhou city from 2000 to 2021. During the study period, the total P input and stock in the food chain decreased from 5,698.55 tP and 5,219.55 tP in 2000 to 2,391.26 tP and 1,760.46 tP in 2021, representing a decrease of 58 and 66.27%, respectively. This decrease can be mainly attributed to two factors. Firstly, the dietary structure changed significantly. The consumption of grain-based diets dropped from 250 kg cap−1yr−1 in 2000 to 144.60 kg cap−1yr−1 in 2021 [BSCZ (Bureau of Statistics of Changzhou), 2023], and the increase in animal-based diet consumption couldn't offset the resulting decline in food P input. Secondly, the arable land area shrank greatly, decreasing from 204,250 ha in 2000 to 132,110 ha in 2021, which directly led to a substantial reduction in the P stock in arable land. In addition, it can be observed that the P flow in locally supplied animal products within the food chain decreased from 1050.99 tP in 2000 to 218.16 tP in 2021. This decline is attributed to a substantial reduction in the scale of local animal husbandry. For instance, during the study period, the numbers of locally raised sheep and pigs decreased by 108.42 times and 3.96 times [BSCZ (Bureau of Statistics of Changzhou), 2023], respectively. Consequently, the P in consumed animal products is mainly supplemented by food imports. Furthermore, only partial P cycling in the food chain was realized between crop production and animal production through the mutual delivery of straw fodder and animal manure. In 2021, 0.67 tP in crop straw and 133.41 tP in animal manure were exchanged between them. At the same time, both the P in kitchen waste and the P loss in WWTPs increased significantly, from 6.06 tP and 45.75 tP in 2000 to 323.59 tP and 350 tP in 2021, respectively. During the study period, changes in the dietary structure led to a decrease in some P sources entering the WWTPs (such as the P directly contained in food that can be treated). However, with the increase in the population of Changzhou city, especially the improvement in the living standards of residents, the discharge of organic waste increased substantially from 6 kg cap−1yr−1 in 2000 to 64 kg cap−1yr−1 in 2021. Similarly, the total wastewater discharged from the WWTPs increased from 45.75 million m3 in 2000 to 350 million m3 in 2021 [BSCZ (Bureau of Statistics of Changzhou), 2023]. These organic wastes contain a considerable amount of P, which leads to a significant rise in the P in kitchen waste and the total P loss in WWTPs. This reduction in arable land.
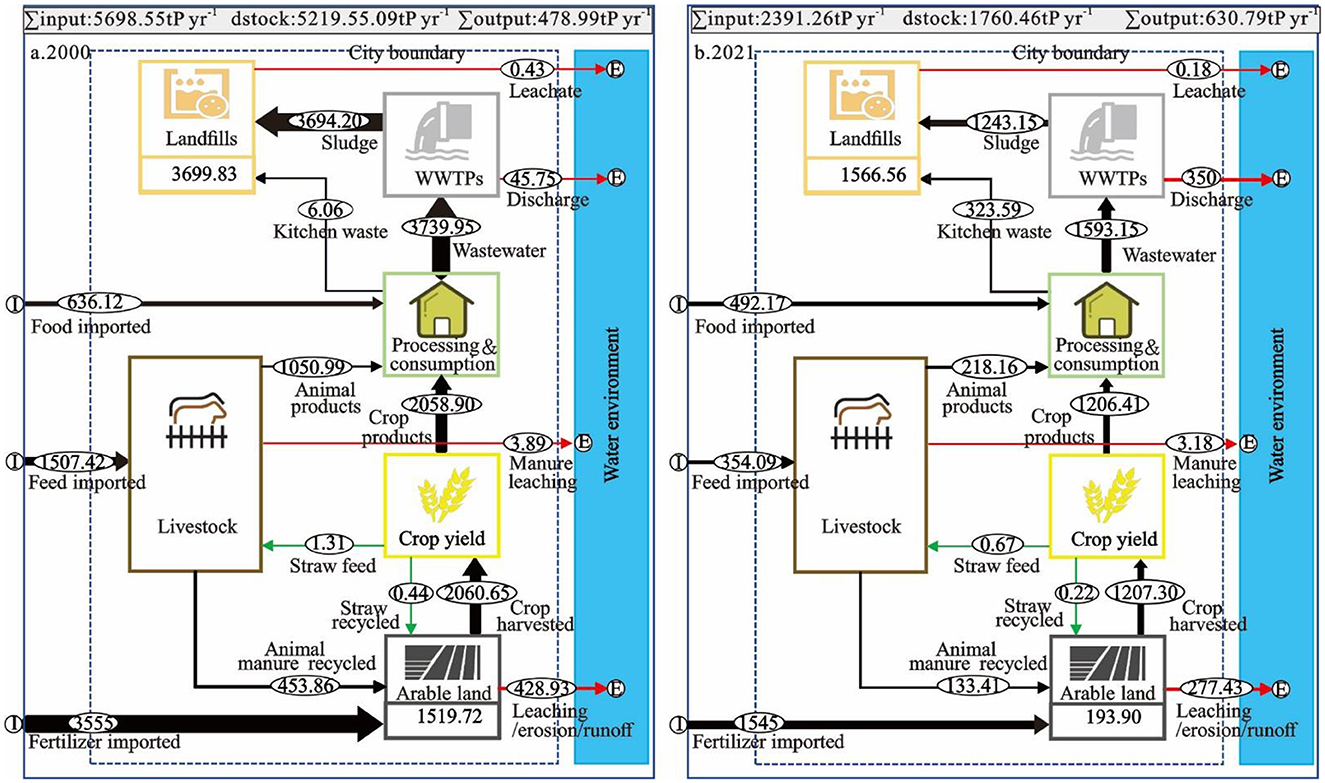
Figure 3. Characteristics of P flow in the food chain of Changzhou city in 2000 and 2021. (A, B) represent the phosphorus flow process in the food chain in 2000 and 2021, respectively.
3.2 P sources and use efficiency
From the perspective of food P flow input in Changzhou City, fertilizer imports are the main source of the food chain P flow (Figures 3a, b). However, P imports through fertilizers decreased from 3,555 tP in 2000 to 1,545 tP in 2021, due to the city's growth, which greatly compressed the area of arable land. P imports through feed decreased from 1,507.42 tP in 2000 to 354.04 tP in 2021 (Figures 3a, b). The decrease in feed-related P imports may be attributed to factors such as changes in the scale of animal breeding and the adjustment of feed formulas. The food P import in Changzhou City was negative in 2001–2002 and 2008–2018. During these years, the locally produced food P in the city exceeded the local demand and was exported. In other years, such as 2000 and 2021, as high as 636.12 tP and 492.17 tP of food P were needed respectively (Figures 3a, b, 4a). Conditions such as the local dietary structure, structural adjustment of food production, control of animal breeding scale, and inter-annual fluctuation of plant and animal product yields could have influenced the food P imports in Changzhou city (Ma et al., 2013).
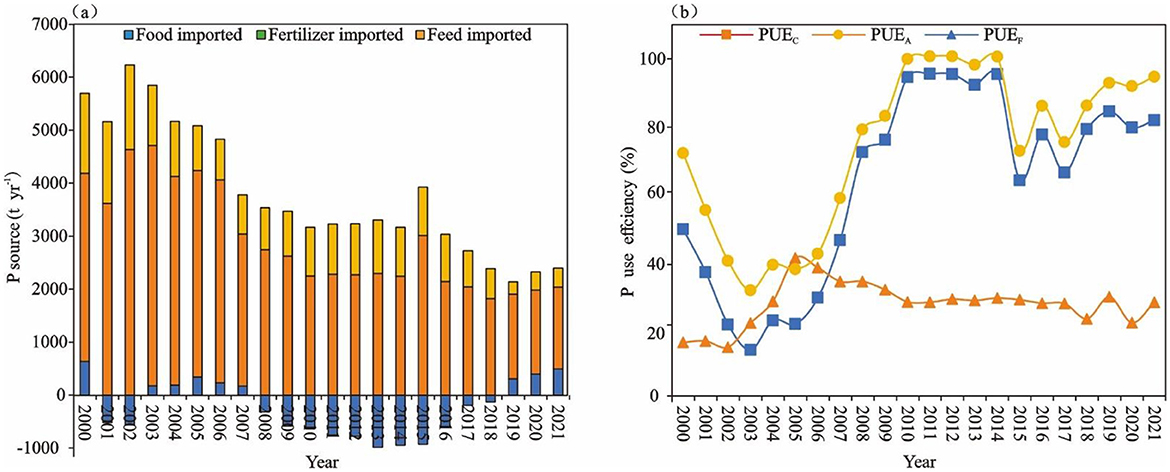
Figure 4. Sources (a) and use efficiency (b) of P in the food chain of Changzhou city.
Figure 4b illustrates that during the study period, the PUEA initially experienced a short-term upward trend, which increased from 30.11% in 2000 to 45.99% in 2005, and then gradually declined to 37.65% in 2021. In contrast, the PUEC and the PUEF exhibited significant fluctuations but ultimately rose from 51.41% and 65.74% in 2000 to 71.94% and 80.16% in 2021, respectively. Furthermore, the synchronized trends in PUEC and PUEF arise from the foundational role of crop production in the broader food chain. Improvements in PUEC-driven by optimized fertilizer application (e.g., reduced overuse), advancements in soil testing, and policy interventions-directly enhance the efficiency of P utilization upstream. These gains propagate downstream, elevating the PUEF. For instance, the increase in PUEC from 28.66% in 2003 to 71.94% in 2021 coincided with PUEF rising from 39.89% to 80.16%, underscoring the cascading impact of crop production improvements. Besides, PUEF inherently integrates PUEA and PUEC, as it accounts for effective P outputs across both animal production and crop production (e.g., crop products, animal products, and recycled manure). Thus, the parallel trends reflect the interconnectedness of agricultural practices and their cumulative effect on systemic P flow.
3.3 P accumulation and losses of the food chain
Figure 5 shows the changes of P accumulation and its composition in the food chain of Changzhou city from 2000 to 2021. There was a fluctuating downward trend from 5,219.55 tP in 2000 to 1,760.46 tP in 2021, with a 2.96—fold reduction in the P accumulation (Figure 5a). The proportion of arable land P accumulation in the study period generally showed a decreasing trend due to a rapid shrinkage of the arable land [BSCZ (Bureau of Statistics of Changzhou), 2023]. Initially, from 2000 to 2003, the P accumulation proportion in arable land showed an upward trend, increasing from 29.12% (1,519.72 t yr−1) to 57.91% (3,097.28 t yr−1). However, by 2011, this proportion rapidly decreased to 9.92% (195.51 t yr−1) (Figure 5b). Subsequently, except for relatively noticeable increases in 2015, 2016, and 2017, reaching 41.67%, 23.84%, and 28.85% respectively, the arable land P accumulation proportion generally stabilized within the range of 8.52% to 17.31% (Figure 5b). This reduction in arable land P accumulation might be attributed to multiple factors, such as the increasing awareness among residents of the negative environmental impacts of excessive fertilization, local agricultural authorities have actively promoted policies to reduce fertilizer use and improve efficiency, taking initiatives to enhance soil quality (Ma et al., 2013). In contrast, the proportion of P accumulation in landfills showed an overall increasing trend during the study period, with most years exceeding 50% (Figure 5b). This is mainly because as living standards improve, the amount of P-containing waste generated by consumption continuously rises. Meanwhile, the corresponding recycling measures for P-waste are insufficient. Moreover, the high cost of recycling P-waste and the lack of a market have also contributed to the increase in P accumulation in landfills (Hou et al., 2013).
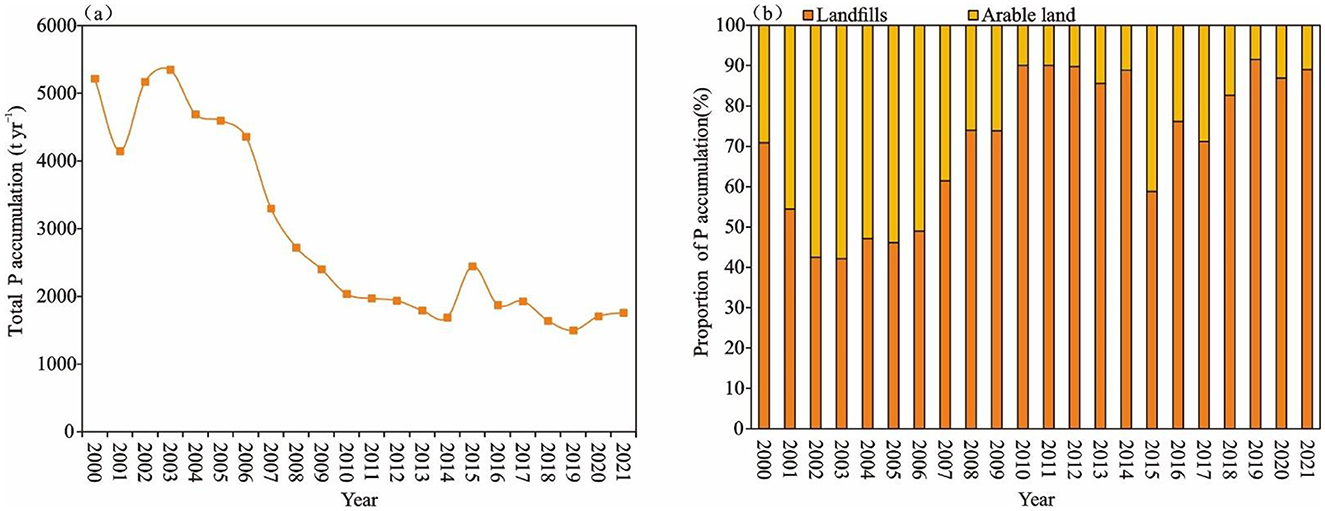
Figure 5. P accumulation (a) and its composition (b) in the food chain of Changzhou city.
Figure 6 shows the changes in P loss and its sources in the food chain of Changzhou from 2000 to 2021. The P loss in the food chain exhibited a rapid upward trend, increasing from 478.99 t in 2000 to 630.79 t in 2021 (Figure 6a). This indicates that the environmental impact of food P emissions was becoming increasingly severe in the Changzhou city. From the perspective of P loss in the food chain, P loss caused by soil leaching/erosion/runoff from cultivated land during crop production was the primary source. However, its proportion could have been continuously decreasing due to the reduction in the cultivated land area, dropping from 89.55% (428.93 tP) in 2000 to 44.72% (277.77 tP) in 2021. Wastewater discharge from sewage treatment plants was another significant source of P loss in the food chain during the study period. However, it increased rapidly with the rapid expansion of urban population from 9.55% (45.75 tP) in 2000 to 54.74% (340 tP) in 2021, with the loss by 7.43 times, surpassing the P loss from cultivated land caused by soil leaching/erosion/runoff. Therefore, further improvement of sewage treatment technology is an urgent issue that needs to be addressed, as it will otherwise become the largest source of P loss in the food chain in Changzhou in the future. Since the amount of P in animal manure is limited and is almost entirely recycled into the soil, the P loss from animal production processes accounts for a small proportion, fluctuating around 1%. However, the P loss from landfills through leachate is negligible, accounting for < 0.05% of the P loss in the food chain.
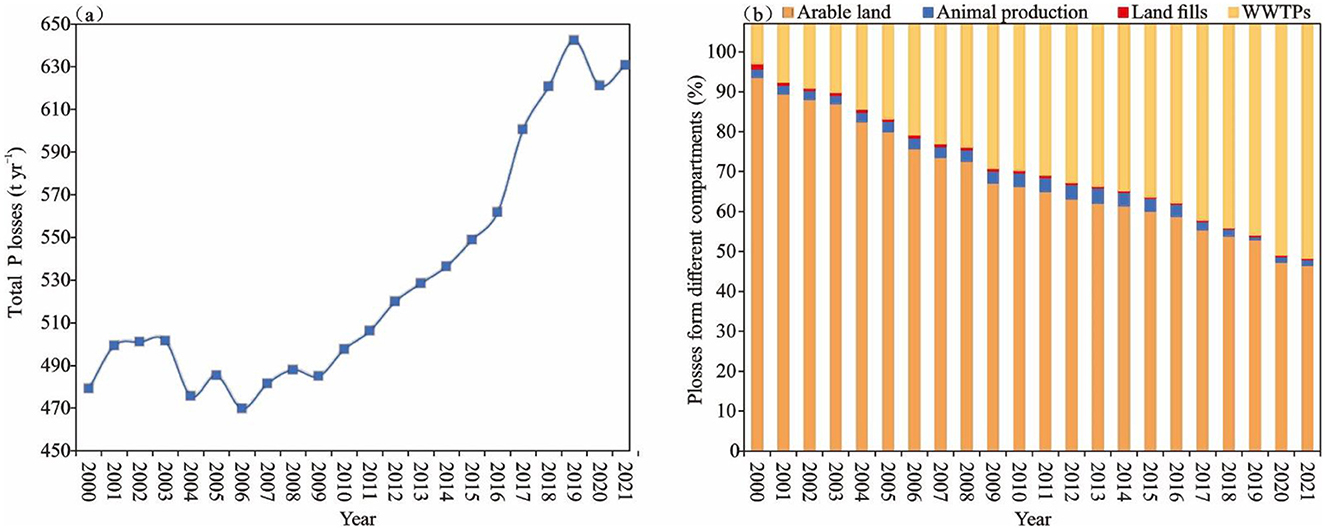
Figure 6. P loss from the food chain in Changzhou (a) and changes in its sources (b).
3.4 Uncertainty analysis
The uncertainty factors of each flow and their corresponding uncertainty ranges were determined (Table 3), providing a more intuitive representation of the reliability and accuracy of the analysis results.
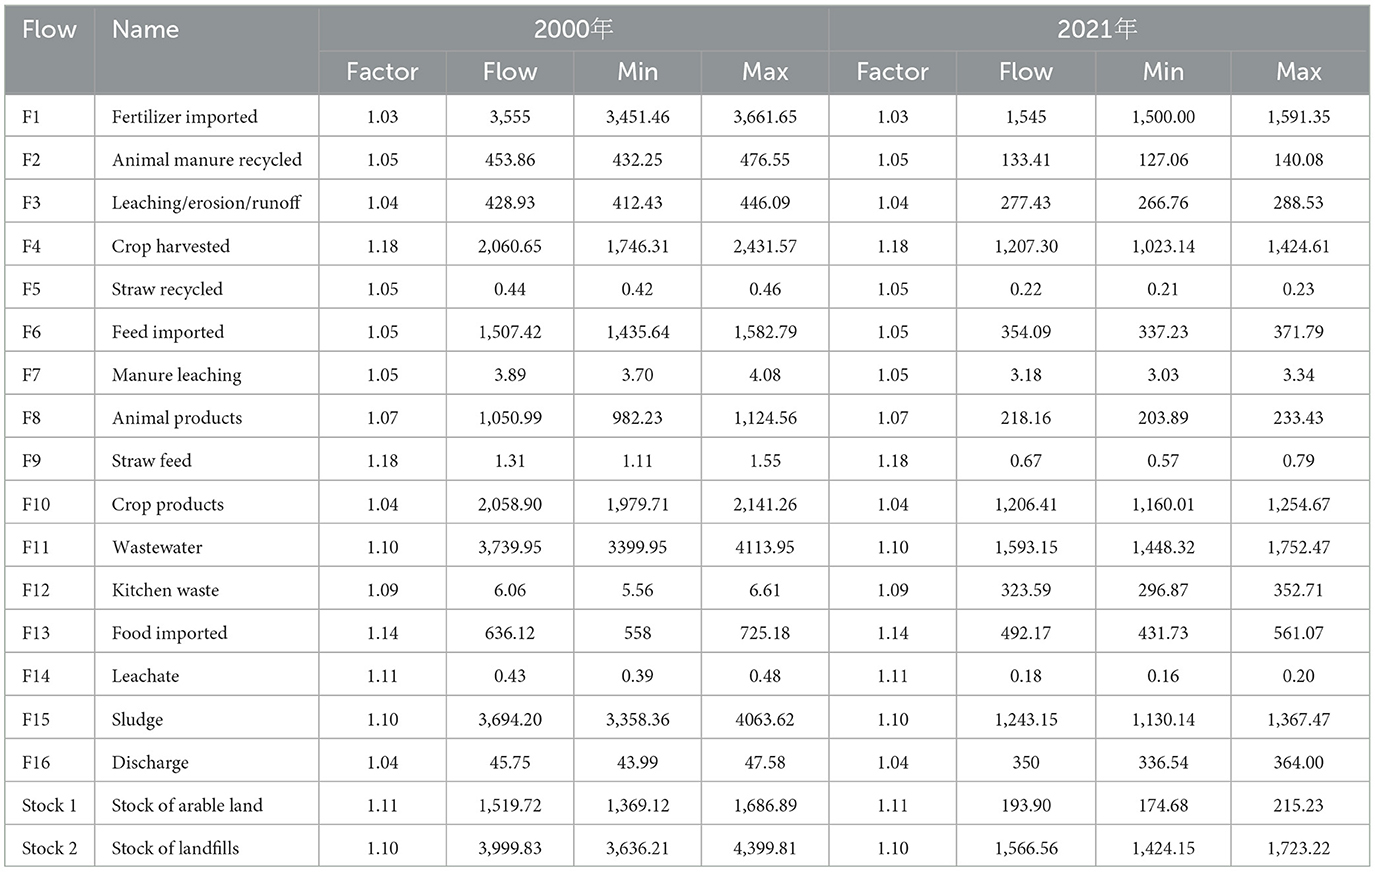
Table 3. Uncertainty intervals for the results of P flows in the food chain of Changzhou city.
Based on the data structure of this study and referring to the classification criteria proposed by Bi et al. (2013) and Wang et al. (2020), this study defined the quality levels of quantification as follows: an uncertainty factor within the range of (1, 1.07] indicates high-quality quantification; an uncertainty factor within the range of (1.07, 1.12] indicates medium-quality quantification; and an uncertainty factor >1.12 indicates low-quality quantification.
According to this definition, the P flow quantification quality in this study was high, medium, and low for 50%, 33.33%, and 16.67% of the flows and stocks, respectively. Among these, although some flows had medium-level quantification quality, they accounted for only a small portion of the P flows in the food chain. For example, consider the flow of leachate (F14). Its value was only 0.43 tP yr−1 in 2000 and 0.18 tP yr−1 in 2021, which is relatively small compared to other P flows in the food chain.
3.5 Scenario analyses of P input, P stock, P loss and PUE
The 2030 BAU scenario (S1) indicates that due to the significant increase in urban population food demand and the corresponding solid and liquid waste productions, the total P input in the food chain may increase from 2,391.26 tP yr−1 in the 2021 reference scenario (S0) to 3,684.23 tP yr−1 in 2030. Similarly, the total P stock may increase from 1,760.46 tP yr−1 to 2,853.31 tP yr−1, and the total P loss may increase from 630.79 tP yr−1 to 830.92 tP yr−1 (Figure 7a). This trajectory, in line with general findings, conflicts with SDG targets, as unchecked urbanization exacerbates P losses to water bodies and landfills. However, local productive P losses were reduced due to the significant increase in food imports, resulting in an increase in food chain utilization efficiency from 80.16% to 87.12% (Figure 7b).
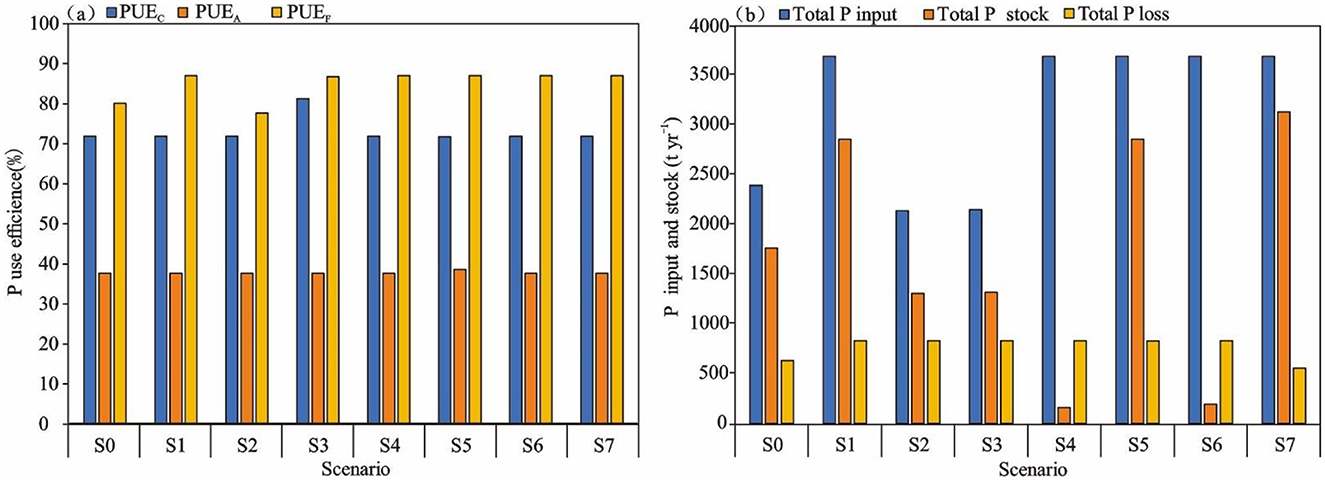
Figure 7. P inputs, stocks and losses in the food chain of Changzhou city under different scenarios (a) and changes in use efficiency (b). S0, References; S1, BAU; S2, Food P recommendation; S3, Fertilizers recommendation; S4, Urine diversion; S5, Manures management; S6, Wastes incineration; S7, Sewage treatment.
Food P uptake recommendation scenario (S2) indicates that reducing food P intake to 0.7 g cap−1day−1 can decrease the total P input in the food chain from 3,684.23 tP yr−1 to 2,135.26 tP yr−1. Similarly, the total P stock would decrease from 2,853.30 tP yr−1 in the BAU scenario (S1) to 1,304.52 tP yr−1. This represents the optimal scenario for reducing P input, achieving a 42% reduction in dependence on external P. However, the total P loss did not show a significant change (Figure 7a). Although food imports are reduced under this scenario, the PUEF decreases from 87.12% to 77.78% compared to the 2021 reference scenario (S0) (Figure 7b), and the PUEC and PUEA remains unchanged. Implementing this scenario requires public education and dietary restructuring. While economically viable with low implementation costs, social acceptance of plant-based diets may vary.
Fertilizer recommendation scenario (S3) shown that the total P input to the urban food chain decreased from 3684.23 tP yr−1 to 2,146.36 tP yr−1, when compared with the BAU scenario (S1), and the total P stock decreased from 2,853.30 tP yr−1 to 1,315.59 tP yr−1 (Figure 7a). The PUEC increased from 71.94% to 81.34% due to scientific fertilizer application (Figure 7b). This scenario reduces P input by 42% with minimal infrastructure costs, aligning with SDG 2 by enhancing agricultural efficiency. However, it requires farmer training and subsidy programs. Overall, the fertilizer recommendation scenario (S3) emerges as the most economically and environmentally viable option, directly supporting SDG 12.
The urine diversion scenario (S4) and the waste incineration scenario (S6) indicate that, owing to the separate recovery of human urine and organic solid waste in the downstream food chain, the total P stock in the food chain decreased significantly compared to the BAU scenario (S1). Specifically, it dropped from 2,853.30 tP yr−1 to 159.65 tP yr−1 and 193.90 tP yr−1 respectively (Figure 7a). Therefore, the urine diversion scenario (S4) represents the optimal scenario for reducing the P stock in the food chain. In scenario S4, the urine diversion process recovers P from urine, which helps prevent P pollution in water bodies and contributes to SDG 6. Although the infrastructure costs for urine separation (~120 dollars per person, Jönsson et al., 2004) and incineration plants [an initial investment of around 50 million dollars, CMEP (Chinese Ministry of Environmental Protection), 2002] are substantial, the urine diversion scenario (S4) provides the greatest long-term environmental benefits, albeit requiring a large upfront investment.
In the manure management scenario (S5), compared to the BAU scenario (S1), the total P loss in the food chain slightly decreased from 830.92 tP yr−1 to 827.74 tP yr−1 (Figure 7a). All the P in manure was fully recovered, resulting in a utilization efficiency of 38.55% (Figure 7b). However, there were no changes in the total P input or stock. In the sewage treatment scenario (S7), compared to the BAU scenario (S1), it represents the optimal scenario for reducing P loss in the food chain as the total P loss decreased from 830.92 tP yr−1 to 555.95 tP yr−1. This reduction aligns with SDG 6, while the total P input remained unchanged. Moreover, due to the increased P content in the sludge generated from treated wastewater, the total P stock increased from 2,853.30 tP yr−1 in the BAU scenario (S1) to 3,128.27 tP yr−1. Advanced wastewater treatment cuts P discharge by 33% but increases the sludge P stock, necessitating sludge - to - fertilizer conversion facilities. Operational costs [about 0.5 dollars/m3, BSCZ (Bureau of Statistics of Changzhou), 2023] may put a strain on municipal budgets.
4 Discussion
4.1 Comparison with other research results
Existing literature typically reports P flow results in absolute terms, such as tP or kgP. However, due to variations in socioeconomic contexts and spatial scales across studies (Guo et al., 2023), these absolute values limit cross-study comparisons. To overcome this issue, we normalized the results into per capita or percentage-based metrics and compared them with studies from diverse regions. As a result of the significant variations in the composition of P flow analysis systems, calculation methods, and data sources among different studies, there are no pre-existing comparable indicators for direct comparison. Therefore, based on a comprehensive review of the studies, we conducted standardized calculations for each indicator. The specific calculation methods are provided in the notes of Table 4.
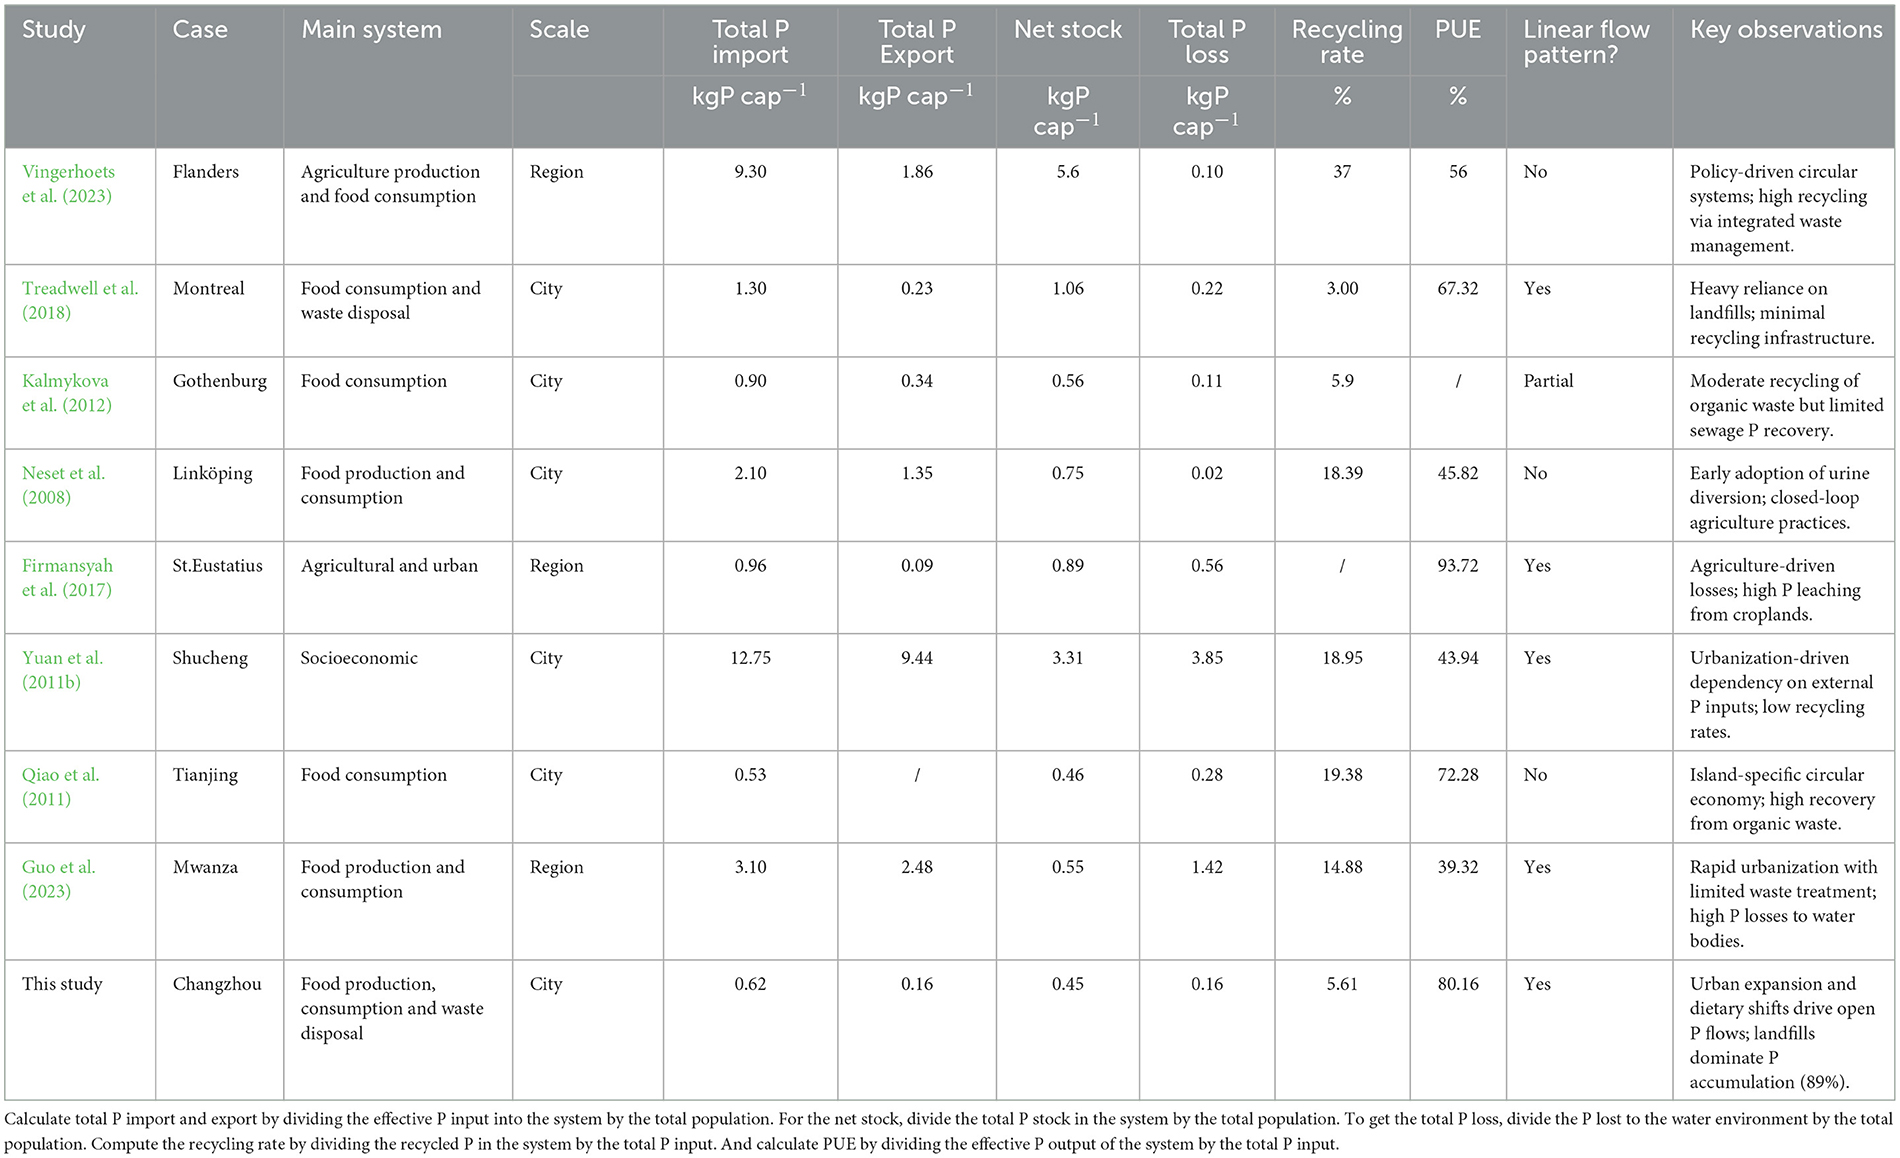
Table 4. A comparison of results of this study with the results of other SFA studies.
For instance, Changzhou city's total P import (0.62 kgP cap−1), export (0.16 kgP cap−1), and stock (0.45 kgP cap−1) in 2021 were markedly lower than those in Flanders (9.30, 1.86, and 5.6 kgP cap−1; Vingerhoets et al., 2023) and Swedish cities like Gothenburg (0.90, 0.34, and 0.56 kgP cap−1; Kalmykova et al., 2012). Notably, Changzhou city exhibited a linear P flow pattern (Table 4). This pattern was characterized by open nutrient cycles dominated by landfill accumulation, which accounted for 89% of the total P stock, and limited recycling, with a recycling rate of 5.61%. This contrasts with circular systems in Flanders and Linköping, where policy-driven waste management and urine diversion significantly enhanced P recovery (Vingerhoets et al., 2023; Neset et al., 2008).
Changzhou city's P loss (0.16 kgP cap−1) exceeded that of Flanders [0.10 kgP cap−1, as previously reported by Vingerhoets et al. (2023, 2025)] and Gothenburg (0.11 kgP cap−1, as reported by Kalmykova et al., 2012), reflecting its reliance on wastewater discharge (54.7% of losses) and insufficient recycling infrastructure. Comparatively, St. Eustatius and Montreal exhibited higher P losses (0.56 and 3.00 kgP cap−1) due to agricultural leaching and landfills dependency (Treadwell et al., 2018; Firmansyah et al., 2017). The linear flow pattern in Changzhou city aligns with rapid urbanization trends observed in Shucheng and Mwanza, where fragmented waste governance and dietary shifts amplify open P flows (Yuan et al., 2011b; Guo et al., 2023).
In terms of PUE, Changzhou (80.16%) lagged St. Eustatius (93.72%), largely due to low recycling rates. However, it outperformed Linköping (45.82%) and Shucheng (43.94%), where limited technological integration hindered efficiency. Key observations from Table 4 highlight systemic differences: Flanders' circular systems relied on integrated waste management, while Linköping's early adoption of urine diversion closed nutrient loops. In contrast, Changzhou city's linearity stems from urban expansion compressing arable land and inadequate recovery of organic waste—issues mirroring challenges in Tianjin and Mwanza (Qiao et al., 2011; Guo et al., 2023).
These disparities underscore the influence of geographic scale, economic development, and policy frameworks. For example, larger-scale regions may have more complex P flow systems due to diverse land uses and population densities. Economically developed areas often have better—funded waste management infrastructure, which can improve P recovery rates. Policy frameworks, such as those promoting urine diversion or waste incineration, play a crucial role in shaping P flow patterns. Such variations emphasize the need for context—specific strategies to transition from linear to circular P flows, as demonstrated by urine diversion (Scenario S4) and waste incineration (Scenario S6) in our analysis. By synthesizing these findings, it becomes evident that cities with circular P systems prioritize policy integration, technological innovation, and stakeholder collaboration—lessons critical for Changzhou city to mitigate its open flow trajectory and align with SDGs.
4.2 Options of P management for SDGs
Since the reform and opening in the 1970s, China has witnessed remarkable changes in its agricultural and urban development. As shown in Figure 8, the sustainable urban food chain P flow management framework is designed to address the complex issues arising from P flow in the food chain. China's grain yield has surged from 2,527 kg ha−1 in 1,978 to 5,802 kg ha−1 in 2021 [NBSC (National Bureau of Statistics of China), 2023], meeting the huge food demand caused by the rapid population growth. However, the fast progress of urbanization has reduced the arable land, leading to extensive use of fertilizers. This not only ensures food security in the face of increasing food P demand but also causes many environmental issues, including eutrophication resulting from the overuse of P resources. Currently, cities are the hotspots of intense P input, output, and loss, with P flow patterns growing more open and linear.
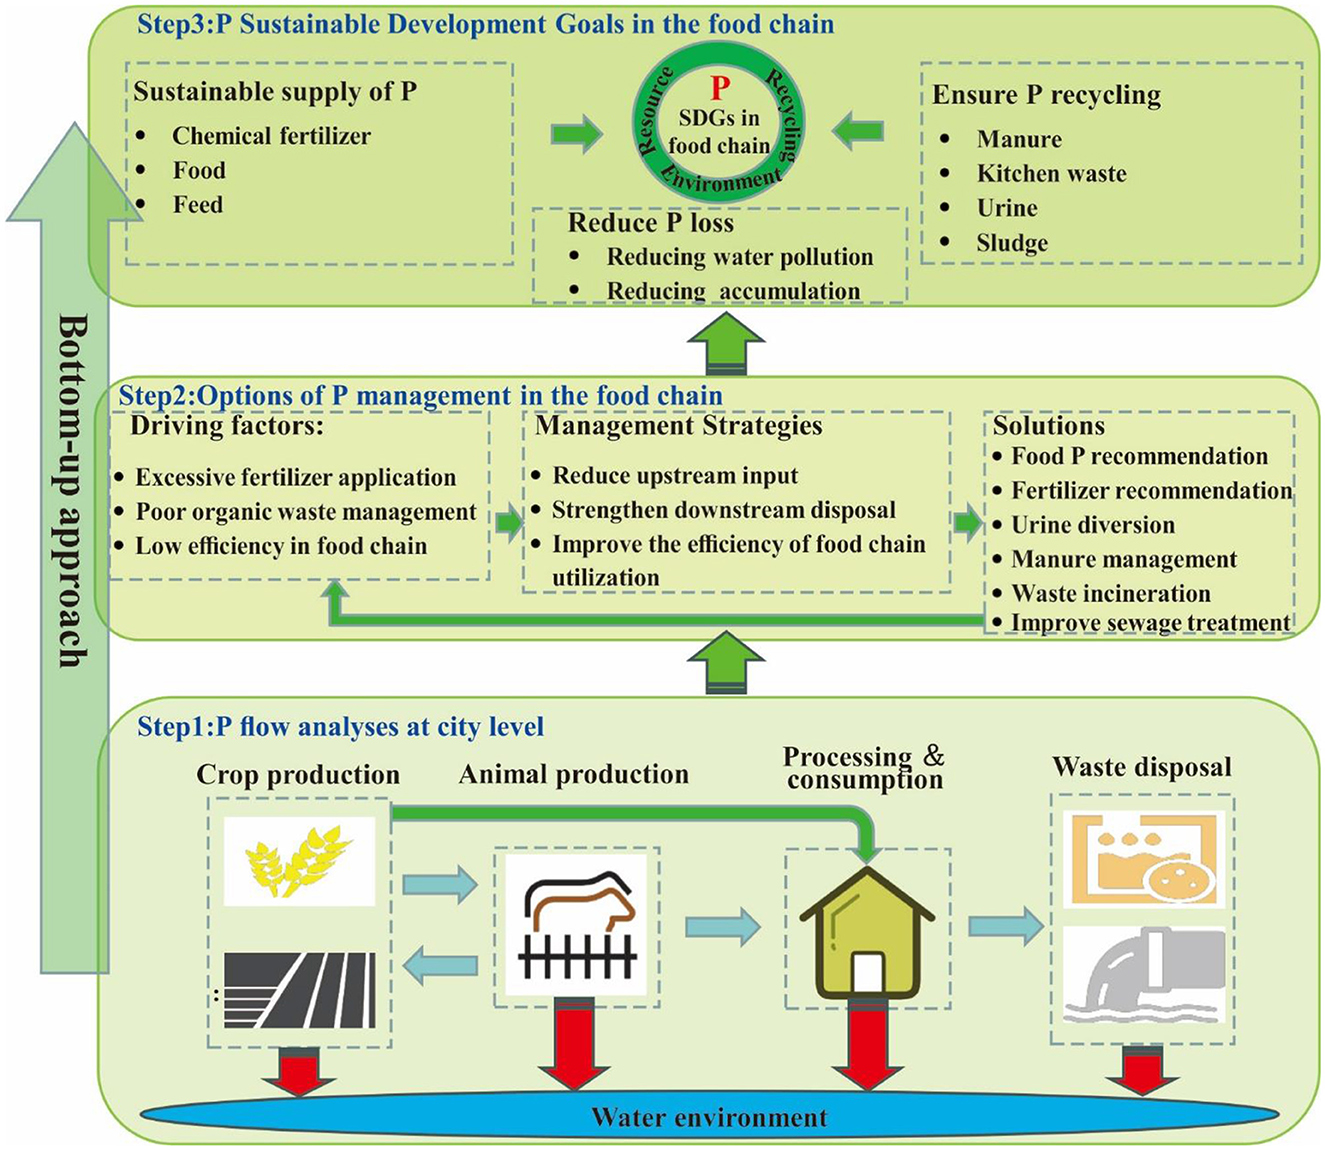
Figure 8. Sustainable management framework for food P flow at city level.
Our sustainable urban food chain P flow management framework in Figure 8 aims to reverse this trend. We first used the SFA method, as depicted in the framework, to quantify P flows and its use efficiency in the urban food chain, identifying key nodes, loss paths, and their reasons. Based on these results, we proposed adaptive strategies considering local P flow conditions. For example, in Changzhou city, our scenario analysis shows a slight P loss reduction with better P management, but there is still more room for improvement. Given that 15.31% of Changzhou residents' dietary P comes from animal foods, and the daily per capita P intake is 0.79 g cap−1 day−1 (higher than the recommended 0.7 g cap−1 day−1), a shift to plant-based diets, as an important part of our framework, can reduce animal food P demand by 20%–70% (Tangsubkul et al., 2005; Metson et al., 2012). Also, in 2021, Changzhou city's arable land P application rate was 11.69 kgP ha−1 yr−1 [BSCZ (Bureau of Statistics of Changzhou), 2023], which is lower than that of Montreal, Canada (42.99 kgP ha−1 yr−1, Treadwell et al., 2018) but higher than that of Brandenburg, Germany (3.05 kgP ha−1 yr−1, Theobald et al., 2016). Through optimization of fertilization in our framework, such as training farmers, soil - testing - based application, and partial use of organic fertilizers, we can save inputs, ensure yield, boost efficiency, and reduce soil P accumulation (Zhuang et al., 2022; Ma et al., 2014). Besides, although the implementation of the measure of returning 100% of manure to the fields is helpful for improving the utilization efficiency of animal husbandry, which is applicable in the case of this study, specific analyses are required for specific regions when promoting this method. If the amount of manure produced exceeds the local farmland demand, especially the nitrogen in the manure, it can be exported to regions with a lower livestock density after manure treatment (Vingerhoets et al., 2025). Furthermore, we advocate recycling P from organic waste before landfilling or losing it into the system, with measures like collecting residential urine, upgrading waste treatments in plants and landfills, and promoting secondary recycling facilities in the city, all of which are integral to our framework for sustainable P management.
4.3 Limitations of the analysis
We failed to comprehensively differentiate the production sectors involved in the upstream and downstream food P flows. For example, before crops or animal products reach household consumption, there are usually multiple food processing activities. However, as in other studies (Papangelou et al., 2020), no data were available from food processing plants in Changzhou city. As a result, the model was built without P food processing data, potentially overlooking the P flow in the city. Changzhou is a rapidly urbanizing city in China, and it inevitably has numerous food import and export activities. However, due to the absence of official statistics on food commodity imports and exports, this study only accounted for the local food surplus exports after meeting residents' P demand, ignoring some food imports.
Moreover, in this study, we calculated the P nutrient loss from cropland by multiplying the P input into the farmland and the total cropland area and then using the empirical P loss values from existing literature for leaching/runoff/erosion (Firmansyah et al., 2017). However, soil P loss is affected by multiple factors such as soil type, rainfall intensity, fertilizer application, land slope, vegetation type, and land use. These factors should be better accounted for in process-based models. Future research should focus on integrating different models into SFA models.
5 Conclusions
Using the SFA method, we quantified P flows within the food chain of Changzhou City, located on the shores of Taihu Lake, from 2000 to 2021. Overall, the food chain in Changzhou exhibited a predominantly linear and open P-flow pattern during this period. Specifically, the total P input and stock of the food chain decreased significantly, dropping from 5,698.55 tP and 5,219.55 tP in 2000 to 2,391.26 tP and 1,760.46 tP in 2021, respectively. However, the total P loss of the food chain increased, with sewage treatment discharge emerging as the main source of P loss. Throughout the study period, only partial P cycling occurred in the food chain, mainly through the exchange of straw feed and animal manure between crop and animal production. Fertilizer and feed imports consistently served as the primary sources of P flows. When local animal and plant production could not meet the P demand of the local population's food consumption, food imports became an alternative P-input source. The PUE in crop production and the overall food chain generally showed a fluctuating upward trend, rising from 51.41 and 65.74% in 2000 to 71.94 and 80.16% in 2021, respectively. Landfill accumulation accounted for the largest portion of P in the food chain. Compared to the 2021 reference scenario, under the BAU scenario, the total P input, total P stock, and total P loss all increased significantly. The food P uptake recommendation scenario proved to be the optimal one for reducing total P input and minimizing dependence on external P. The fertilizer recommendation scenario significantly enhanced PUE in crop production. Additionally, the urine-diversion and waste-incineration scenarios could be effective strategies for reducing P accumulation, potentially alleviating environmental pressures associated with P pollution.
Data availability statement
The original contributions presented in the study are included in the article/Supplementary materials, further inquiries can be directed to the corresponding author/s.
Author contributions
ZG: Conceptualization, Investigation, Methodology, Resources, Software, Validation, Writing – original draft. YX: Data curation, Investigation, Methodology, Writing – review & editing. SC: Funding acquisition, Resources, Supervision, Writing – review & editing. GK: Formal analysis, Writing – review & editing.
Funding
The author(s) declare that financial support was received for the research and/or publication of this article. This research was financially supported by the National Natural Science Foundation of China (W2412156 and 42161144003), the Open Fund Project of the Key Laboratory of Lake and Watershed Science for Water Security (2024SKL020), the General Project of Basic Science (Natural Science) Research in Jiangsu Provincial Colleges and Universities (24KJB170016), and the National Key R&D Program of China (2018YFE0105900).
Conflict of interest
The authors declare that the research was conducted in the absence of any commercial or financial relationships that could be construed as a potential conflict of interest.
Generative AI statement
The author(s) declare that no Gen AI was used in the creation of this manuscript.
Publisher's note
All claims expressed in this article are solely those of the authors and do not necessarily represent those of their affiliated organizations, or those of the publisher, the editors and the reviewers. Any product that may be evaluated in this article, or claim that may be made by its manufacturer, is not guaranteed or endorsed by the publisher.
Supplementary material
The Supplementary Material for this article can be found online at: https://www.frontiersin.org/articles/10.3389/fsufs.2025.1556515/full#supplementary-material
References
Antikainen, R., Lemola, R., Nousiainen, J. I., Sokka, L., Esala, M., Huhtanen, P., et al. (2005). Stocks and flows of nitrogen and phosphorus in the Finnish food production and consumption system. Agric. Ecosyst. Environ. 107, 287–305. doi: 10.1016/j.agee.2004.10.025
Bi, J., Chen, Q., Zhang, L., and Yuan, Z. (2013). Quantifying P flow pathways through socioeconomic systems at the county level in China. J. Indus. Ecol. 17, 452–460. doi: 10.1111/j.1530-9290.2012.00555.x
Bizimana, F., Dong, W., Li, X., Timilsina, A., Zhang, Y., Aluoch, S. O., et al. (2024). Estimating food nitrogen and P footprints and budgeting nitrogen and P flows of Rwanda's agricultural food system during 1961–2020. Sci. Total Environ. 906:167693. doi: 10.1016/j.scitotenv.2023.167693
BMEDI (Beijing General Municipal Engineering Design and Research Institute) (2006). Watersupply and Drainage Design Handbook: Urban Drainage. 2nd Edn. Beijing: China Architecture and Building Press. (in Chinese)
BSCZ (Bureau of Statistics of Changzhou) (2023). Available online at: https://tjj.changzhou.gov.cn/html/tjj/2023/OEJCMFCP_1110/27748.html (accessed November 10, 2024).
Chen, J., Liu, X., Chen, J., Jin, H., Wang, T., Zhu, W., et al. (2024). Underestimated nutrient from aquaculture ponds to Lake Eutrophication: a case study on Taihu Lake Basin. J. Hydrol. 630:130749. doi: 10.1016/j.jhydrol.2024.130749
Chowdhury, R. B., Moore, G. A., Weatherley, A. J., and Arora, M. (2014). A review of recent substance flow analyses of P to identify priority management areas at different geographical scales. Resour. Conserv. Recycl. 83, 213–228. doi: 10.1016/j.resconrec.2013.10.014
CMEP (Chinese Ministry of Environmental Protection) (2002). Discharge Standard of Pollutants for Municipal Wastewater Treatment Plants (GB18918–2002). Beijing: Chinese Environmental Science Publishing.
Ding, X., Wu, Y., Zheng, B., Zhong, G., Song, X., Geng, Y., et al. (2024). Assessment of nitrogen, P and potassium flows in China's food system during 2010–2019: implications for integrated management. Resour. Conserv. Recycl. 207:107652. doi: 10.1016/j.resconrec.2024.107652
Dong, Y., Cheng, X., Li, C., Xu, L., and Lin, W. (2023). Characterization of nitrogen emissions for freshwater eutrophication modelling in life cycle impact assessment at the damage level and urban scale. Ecol. Indic.154:110598. doi: 10.1016/j.ecolind.2023.110598
Færge, J., Magid, J., and de Vries, F. W. P. (2001). Urban nutrient balance for Bangkok. Ecol. Model. 139, 63–74. doi: 10.1016/S0304-3800(01)00233-2
Firmansyah, I., Spiller, M., De Ruijter, F. J., Carsjens, G. J., and Zeeman, G. (2017). Assessment of nitrogen and P flows in agricultural and urban systems in a small island under limited data availability. Sci. Total Environ. 574, 1521–1532. doi: 10.1016/j.scitotenv.2016.08.159
Guo, Z., Chen, S. S., Kattel, G. R., Mkumbo, A. C., Xiong, C., Gao, Q., et al. (2023). Scenario analysis of P flow in food production and consumption system in the Mwanza region, Tanzania. Sci. Total Environ. 879:162991. doi: 10.1016/j.scitotenv.2023.162991
Hedbrant, J., and Sörme, L. (2001). Data vagueness and uncertainties in urban heavy-metal data collection. Water Air Soil Pollut. Focus 1, 43–53. doi: 10.1023/A:1017591718463
Hou, Y., Ma, L., Gao, Z. L., Wang, F. H., Sims, J. T., Ma, W. Q., et al. (2013). The driving forces for nitrogen and P flows in the food chain of China, 1980 to 2010. J. Environ. Qual. 42, 962–971. doi: 10.2134/jeq2012.0489
James, L., and Lewis, III. M. D. (2023). Brookwood Baptist Health and Saint Vincent's. Ascension. Available online at: https://www.msdmanuals.com/professional/authors/lewis-james (accessed October 11, 2024).
Jönsson, H., Stintzing, A. R., Vinnerås, B., and Salomon, E. (2004). Guidelines on the use of urine and faeces in crop production. EcoSanRes Programme.
Kalmykova, Y., Harder, R., Borgestedt, H., and Svanäng, I. (2012). Pathways and management of P in urban areas. J. Ind. Ecol. 16, 928–939. doi: 10.1111/j.1530-9290.2012.00541.x
Klinglmair, M., Lemming, C., Jensen, L. S., Rechberger, H., Astrup, T. F., and Scheutz, C. (2015). Phosphorus in Denmark. Resources, national and regional anthropogenic flows. Resour. Conserv. Recycl. 105, 311–324. doi: 10.1016/j.resconrec.2015.09.019
Laner., D, Feketitsch, Rechberger, H., and Fellner, J. (2016). A novel approach to characterize data uncertainty in material to analysis and its application to plastics flows in Austria. J. Indus. Ecol. 20, 1050–1063. doi: 10.1111/jiec.12326
Li, G. L., Bai, X., Yu, S., Zhang, H., and Zhu, Y. G. (2012). Urban P metabolism through food consumption: the case of China. J. Indus. Ecol. 16, 588–599. doi: 10.1111/j.1530-9290.2011.00402.x
Li, H., Liu, J., Li, G., Shen, J., Bergström, L., and Zhang, F. (2015). Past, present, and future use of P in Chinese agriculture and its influence on P losses. Ambio 44, 274–285. doi: 10.1007/s13280-015-0633-0
Lin, T., Wang, J., Bai, X., Zhang, G., Li, X., Ge, R., et al. (2016). Quantifying and managing food-sourced nutrient metabolism in Chinese cities. Environ. Int. 94, 388–395. doi: 10.1016/j.envint.2016.04.036
Liu, W., Qin, T., Chen, Y., Yin, J., Li, Z., Wang, H., et al. (2024). Sustainable management strategy for P in large-scale watersheds based on the coupling model of substance flow analysis and machine learning. Resour. Conserv. Recycl. 211:107897. doi: 10.1016/j.resconrec.2024.107897
Liu, W., Qin, T., Wu, M., Chen, Z., Zhang, Y., Abakumov, E., et al. (2023). Analyzing the P flow characteristics in the largest freshwater lake (Poyang Lake) watershed of China from 1950 to 2020 through a bottom-up approach of watershed-scale P substance flow model. Water Res. 245, 120546. doi: 10.1016/j.watres.2023.120546
Ma, L., Guo, J., Velthof, G. L., Li, Y., Chen, Q., Ma, W., et al. (2014). Impacts of urban expansion on nitrogen and P flows in the food system of Beijing from 1978 to 2008. Global Environ. Change 28, 192–204. doi: 10.1016/j.gloenvcha.2014.06.015
Ma, L., Ma, W. Q., Velthof, G. L., Wang, F. H., Qin, W., Zhang, F. S., et al. (2010). Modeling nutrient flows in the food chain of China. J. Environ. Qual. 39, 1279–1289. doi: 10.2134/jeq2009.0403
Ma, L., Wang, F., Zhang, W., Ma, W., Velthof, G., Qin, W., et al. (2013). Environmental assessment of management options for nutrient flows in the food chain in China. Environ. Sci. Techn. 47, 7260–7268. doi: 10.1021/es400456u
Metson, G. S., Hale, R. L., Iwaniec, D. M., Cook, E. M., Corman, J. R., Galletti, C. S., et al. (2012). P in Phoenix: a budget and spatial representation of P in an urban ecosystem. Ecol. Appl. 22, 705–721. doi: 10.1890/11-0865.1
Mnthambala, F., Tilley, E., Tyrrel, S., and Sakrabani, R. (2021). Phosphorus flow analysis for Malawi: identifying potential sources of renewable phosphorus recovery. Resour. Conserv. Recycl. 173:105744. doi: 10.1016/j.resconrec.2021.105744
NBSC (National Bureau of Statistics of China) (2023). Available online at: https://www.stats.gov.cn/sj/ndsj/2023/indexch.htm (accessed November 15, 2024).
Neset, T. S. S., Bader, H. P., Scheidegger, R., and Lohm, U. (2008). The flow of P in food production and consumption—Linköping, Sweden, 1870–2000. Sci. Total Environ. 396, 111–120. doi: 10.1016/j.scitotenv.2008.02.010
Papangelou, A., Achten, W. M., and Mathijs, E. (2020). P and energy flows through the food system of Brussels Capital Region. Resour. Conserv. Recycl. 156:104687. doi: 10.1016/j.resconrec.2020.104687
Qiao, M., Zheng, Y. M., and Zhu, Y. G. (2011). Material flow analysis of P through food consumption in two megacities in northern China. Chemosphere 84, 773–778. doi: 10.1016/j.chemosphere.2011.01.050
Rabby, S. H., Rahimi, L., Ahmadisharaf, E., Ye, M., Garwood, J. A., Bourque, E. S., et al. (2024). Dynamic disparities in inorganic nitrogen and P fluxes into estuarine systems under different flow regimes and streamflow droughts. Water Res 264:122238. doi: 10.1016/j.watres.2024.122238
Tangsubkul, N., Moore, S., and Waite, T. D. (2005). Incorporating P management considerations into wastewater management practice. Environ. Sci. Policy. 8, 1–15. doi: 10.1016/j.envsci.2004.08.009
Theobald, T. F. H., Schipper, M., and Kern, J. (2016). P flows in Berlin - Brandenburg, a regional flow analysis. Resour. Conserv. Recycl. 112, 1–14. doi: 10.1016/j.resconrec.2016.04.008
Tian, X., Engel, B. A., Qian, H., Hua, E., Sun, S., and Wang, Y. (2021). Will reaching the maximum achievable yield potential meet future global food demand? J. Clean. Prod. 294:126285. doi: 10.1016/j.jclepro.2021.126285
Treadwell, J. L., Clark, O. G., and Bennett, E. M. (2018). Dynamic simulation of P flows through Montreal's food and waste systems. Resour. Conserv. Recycl. 131, 122–133. doi: 10.1016/j.resconrec.2017.12.018
Vingerhoets, R., Spiller, M., De Backer, J., Adriaens, A., Vlaeminck, S. E., and Meers, E. (2023). Detailed nitrogen and P flow analysis, nutrient use efficiency and circularity in the agri-food system of a livestock-intensive region. J. Clean. Prod. 410:137278. doi: 10.1016/j.jclepro.2023.137278
Vingerhoets, R., Spiller, M., Schoumans, O., Vlaeminck, S. E., Buysse, J., and Meers, E. (2025). Economic potential for nutrient recovery from manure in the European union. Resour. Conserv. Recycl. 215:108079. doi: 10.1016/j.resconrec.2024.108079
Wald, C. (2022). The urine revolution: how recycling pee could help to save the world. Nature 602, 202–206. doi: 10.1038/d41586-022-00338-6
Wang, Z., Hartmann, T. E., Wang, X., Cui, Z. L., Hou, Y., and Meng, F. L. (2020). Phosphorus flow analysis in the maize-based food-feed-energy systems in China. Environ. Res. 184:109319. doi: 10.1016/j.envres.2020.109319
Wu, H. J., Yuan, Z. W., Zhang, L., and Bi, J. (2012). Eutrophication mitigation strategies: perspectives from the quantification of phosphorus flows in socioeconomic system of Feixi, Central China. J. Clean. Prod. 23, 122–137. doi: 10.1016/j.jclepro.2011.10.019
Wu, J. C., Franzén, D., and Malmström, M. E. (2016). Anthropogenic phosphorus flows under different scenarios for the city of Stockholm, Sweden. Sci. Total Environ. 542, 1094–1105. doi: 10.1016/j.scitotenv.2015.09.024
Wu, J., Franzén, D., and Malmström, M. E. (2016). Anthropogenic P flows under different scenarios for the city of Stockholm, Sweden. Sci. Total Environ. 542, 1094–1105. doi: 10.1016/j.scitotenv.2015.09.024
Yuan, Z., Liu, X., Wu, H., Zhang, L., and Bi, J. (2011a). Anthropogenic P flow analysis of Lujiang county, Anhui Province, central China. Ecol. Modell. 222, 1534–1543. doi: 10.1016/j.ecolmodel.2011.01.016
Yuan, Z., Sun, L., Bi, J., Wu, H., and Zhang, L. (2011b). P flow analysis of the socioeconomic ecosystem of Shucheng County, China. Ecol. Appl. 21, 2822–2832. doi: 10.1890/10-1409.1
Zhang, X., Zhao, J., Ding, L., Li, Y., Liu, H., Zhao, Y., et al. (2022). Eutrophication evolution trajectory influenced by human activities and climate in the shallow Lake Gehu, China. Ecol. Indic. 138:108821. doi: 10.1016/j.ecolind.2022.108821
Keywords: phosphorous flow, food chain, sustainable management, scenario analysis, Changzhou city
Citation: Guo Z, Xu Y, Chen SS and Kattel GR (2025) Model-based multi-year P flow analyses and strategies for sustainable food chain management in Changzhou city at China's Taihu Basin. Front. Sustain. Food Syst. 9:1556515. doi: 10.3389/fsufs.2025.1556515
Received: 07 January 2025; Accepted: 21 May 2025;
Published: 21 July 2025.
Edited by:
Chirag Maheshwari, Indian Agricultural Research Institute (ICAR), IndiaReviewed by:
Lochan Singh, Indian Institute of Science (IISc), IndiaRuben Vingerhoets, Swiss Federal Laboratories for Materials Science and Technology, Switzerland
Li Zheng, Chinese Academy of Agricultural Sciences (CAAS), China
Copyright © 2025 Guo, Xu, Chen and Kattel. This is an open-access article distributed under the terms of the Creative Commons Attribution License (CC BY). The use, distribution or reproduction in other forums is permitted, provided the original author(s) and the copyright owner(s) are credited and that the original publication in this journal is cited, in accordance with accepted academic practice. No use, distribution or reproduction is permitted which does not comply with these terms.
*Correspondence: Zheng Guo, MDAzNTgzQG51aXN0LmVkdS5jbg==