 Lingling Wang
 Min Li* and Panpan Zhang
- College of Economics and Management, Qingdao Agricultural University, Qingdao, China
Introduction: Agricultural production in China faces mounting environmental pressures, including resource depletion, chemical pollution, and carbon-intensive practices, which threaten ecological sustainability. Agricultural science, technology and innovation (ASTI) is a key lever for harmonizing agricultural growth and green transformation, but its efficiency remains unevenly distributed across regions. This study assesses the spatiotemporal efficiency of ASTI in promoting green agricultural development across 30 Chinese provinces, aiming to uncover persistent regional disparities and dynamic evolution patterns.
Methods: Constructing an evaluation model and indicator system for science, technology and innovation driven green development in agriculture, applying the network Slack-Based Measure (SBM) model to measure the level of efficiency, and analyzing regional differences and dynamic features through the Theil index, kernel density estimation and spatial Markov methods.
Results and discussion: This study explores the regional differences and distributional dynamic evolution of the efficiency of Agricultural science and technology innovation (ASTI) driven green development in China. The regional efficiency level of each province from 2013 to 2022 was measured by constructing a network SBM model. The results show a clear regional imbalance, with the eastern region showing higher efficiency due to strong investment in innovation and policy coordination effects, while the central and western regions are lagging behind due to fragmented resource allocation and weak institutional support. There is a clear trend of multi-polarization in the kernel density curve, influenced by spatial agglomeration effects and green infrastructure investments; the spatial Markov transformation highlights path dependence and neighborhood effects, emphasizing the role of cross-regional technology diffusion. The integrated approach validates consistency with empirical realities and provides targeted insights for optimizing synergies between ASTI and agriculture, bridging regional gaps, and promoting a spatially coordinated green transition.
1 Introduction
Against the backdrop of global climate change and increasing resource constraints, agriculture, as a basic industry for human survival and development, is facing unprecedented challenges and opportunities (Blakeney, 2022). The agricultural industry is currently undergoing a transformation into a green-growth model due to significant technological advancements. This tendency has become an unavoidable decision and a defining characteristic of agricultural development worldwide. Many nations have boosted their investments in agricultural science and technology research and development in recent years with the goal of utilizing the power of Agricultural science, technology and innovation (ASTI) to increase agricultural production efficiency, guarantee food security, and concurrently lessen the adverse effects of agricultural production activities on the ecological environment in order to support agriculture's sustainable development. Zhang et al. (2024) pointed out that China's greening of agriculture has moved from concept to action, emphasizing the key role of science, technology and innovation in promoting the green transformation of agriculture.
The United Nations Food and Agriculture Organization (FAO) stated in its report that increasing agricultural productivity, guaranteeing global food security, and promoting green agricultural growth all depend on agricultural research, technology, and innovation. In particular, in the face of the multiple pressures of population growth, resource scarcity and environmental pollution, technology, science, and creativity provide new solutions for the sustainable development of agriculture. Agriculture is currently undergoing a crucial phase of change from resource consumption to effective resource use in China. Problems such as high inputs, low yields, low efficiency and high environmental risks in agricultural production are still prominent, severely restricting the excellent growth of agriculture. Exploring new paradigms of agricultural research and promoting green development of agriculture with new quality productivity as an engine has become a major opportunity and challenge for agriculture-related universities and research institutes across the country. The advancement of green growth in agriculture is emphasized in Central Document No. 1 of 2023. China's commitment to green agricultural growth during the “14th Five-Year Plan” era is a crucial step in transforming into high-quality development, as the country is the world's largest producer and user of chemical pesticides and fertilizers (Sun et al., 2019).
In an environment of global climate change and intensifying food security crisis, the green transformation of agriculture has become a core issue of the United Nations Sustainable Development Goals (SDGs). ASTI as the key to solving the problem of green agricultural development, has been highly valued by the Chinese government (Liang et al., 2020). As a populous country and a major contributor to agricultural carbon emissions, China's transition path is of exemplary significance to global carbon emission reduction and ecological governance. This study has several significant contributions. Methodologically, based on innovation and sustainable development theories, it divides the complex process of ASTI driven agricultural green development into two stages. By constructing a theoretical model and indicator system and integrating a two-stage dynamic interaction mechanism, it overcomes the limitations of single-stage or static analyses in existing studies, revealing subsystem synergies and efficiency transfer paths. Empirically, it assesses the 2013–2022 spatiotemporal efficiency of such development in 30 Chinese provinces using methods like the network SBM model, Theil index, kernel density estimation, and spatial Markov methods. This uncovers regional disparities and dynamic evolution patterns, providing valuable empirical evidence on the field's status and trends in China. Regarding policy implications, the study's findings offer targeted insights. Analyzing regional differences helps identify variation sources for region-specific policies, and research on dynamic evolution aids policymakers in understanding trends and risks for preventive measures. Overall, it supports China's “dual-carbon target” and rural revitalization, and provides a reference for other developing countries to explore a “technology-ecology-economy” approach to agricultural modernization.
2 Literature review
Innovation driven green development has been a concern for scholars at home and abroad. In recent years, the crucial role of Green Technology Innovation (GTI) in sustainable agricultural development has become more and more prominent. Zhao et al. (2023) highlighted that GTI helps reduce the differences in development between regions in China by looking at how effective green innovation is in different areas, and their research offers real examples to help understand how agricultural science and technology innovation (ASTI) works together with green development. In analyzing the spatial and temporal differences in the level of green development in agriculture and its driving factors, Gao et al. (2024) studied the spatial and temporal differentiation characteristics and driving factors of the level of green development in agriculture in the Yangtze River Economic Zone, revealing the significant differences between regions and the important role of policies and technologies in promoting green development in agriculture. This provides an important reference for understanding the regional dynamics of greening agriculture. Wei et al. (2023) further demonstrated from a cross-country comparative perspective that GTI significantly improves environmental quality by promoting renewable energy transition and efficient resource utilization, a finding that provides an international reference for the choice of technological paths in China's agricultural green transition. Sun et al. (2024) points out that for inefficient regions, the efficiency of green development in agriculture can be effectively enhanced by strengthening policy guidance and technological innovation. This provides important theoretical support for the regional differentiation strategy proposed in this paper. Wang and He (2024) highlight how combining different policies helps GTI and discover that connecting trade policy with energy efficiency improvements speeds up the spread of green technologies, which is useful for addressing the challenge of applying agricultural science and technology advancements in China. Pan et al. (2021) emphasized the key role of green innovation in enhancing the competitiveness of enterprises and promoting the green development of agriculture, which has a direct correlation with the impact of agricultural science and technology innovation on the efficiency of green development in agriculture studied in this paper.
In recent years, academics have explored the correlation between science, technology, and innovation (STI) and agricultural green development in terms of connotation. Haggblade and Hazell (1989), Conway and Barbie (1988), and Howard (1931), characteristics (Li and Shangguan, 2024), theoretical basis (Han et al., 2024), evaluation research (Wan et al., 2023), and influence factors (Liu and Liu, 2023; Guo et al., 2020; Liu et al., 2023). At the international level, Gebreeyesus and Mohnen (2013), through an empirical analysis of agricultural clusters in Ethiopia, points out that there is a significant positive correlation between a firm's green innovation capacity and its market competitiveness, emphasizing the central role of micro agents in technology diffusion. Djellal and Gallouj (2008) propose an “assembly service” innovation model that reveals the importance of multi-actor synergies for agro-technological innovation, but does not extend to the dynamic process of green transformation. In terms of domestic research, Liang et al. (2020) constructed an evaluation system for China's provincial ASTI capacity based on the green development perspective, and found that the eastern region has a significant advantage in R&D investment and achievement transformation, but did not further analyze the formation mechanism of the inter-regional efficiency difference. Liu et al. (2021) used a coupled coordination degree model to measure the level of synergy between high-quality agricultural development and ASTI in Heilongjiang Province, but their study was limited to a single province and lacked a nationwide comparison. Zhang et al. (2023) investigated the assessment of ASTI capacity and its influencing factors on green agriculture, revealing the intrinsic link between the two. Zhang et al. (2022), while exploring the impacts of technology diffusion on agricultural green development from the perspective of spatial spillovers, does not consider the interference of non-desired outputs (e.g., carbon emissions) on efficiency measures. Meanwhile, in terms of international comparisons and regional policy insights, the latest international research shows that the greening of agriculture in developing countries generally faces the dual challenges of low technology adoption and regional imbalances. For example, Sun and Chen (2023) find that China's green agriculture demonstration zones significantly enhance firms' green innovation through policy incentives, but technology spillovers are weaker in remote areas. In response, this paper finds that the “low-level lock-in” in western China is closely related to the spatial lag effect, and that path dependence needs to be broken through cross-regional technology sharing. Meanwhile, Wan et al. (2023) based on the Gini coefficient and the hesitant fuzzy decision-making model, pointed out that the fairness of agricultural green development needs to be included in the policy consideration, and this paper further quantified the contribution rate of intra-regional differences (73.13%) through the Theil index, which provides data support for the “precise policy implementation.” Additionally, the “sustainable intensification” framework created by Tilman et al. (2011) offers examples from different regions to help understand how agricultural technology improvements can work together with environmental goals; meanwhile, Pretty et al. (2018) highlight how the spread of technology relies on institutions, which complements this paper's findings about regional differences in China. All of the above studies show that the green transformation of agriculture needs to break through the multidimensional barriers of “technology-institution-space,” which provides international experience as a reference for the policy implications of this study.
In conclusion, there is a lack of a thorough theoretical framework system, research findings on how to gauge the success of innovation driven green development in agriculture are limited, and the study of science and technology driven green development in Chinese agriculture is still in its infancy. Based on innovation theory (Bloch and Metcalfe, 2018) and sustainable development theory (Shi et al., 2019), the complicated dynamic process of ASTI driven agricultural green development is broken down into two stages in this paper: agricultural green development and ASTI theoretical model and indicator system are then developed to gauge the effectiveness of this process. The network SBM model is used to assess how well ASTI driven agricultural green development worked in 30 Chinese regions between 2013 and 2022. The features of inter-regional efficiency differences and the dynamic evolution of their distribution are also thoroughly examined, as are the main factors preventing efficiency gains. Existing studies mostly focus on a single stage or static analysis. This paper reveals the synergistic effect and efficiency transfer path between the subsystems by integrating a two-stage dynamic interaction mechanism, which includes feedback from ASTI and demand for green development. This integration addresses the inadequacies of traditional studies regarding the systematicity of the theoretical framework.
3 Materials and methods
3.1 Research methodology
3.1.1 Network SBM model
Initially, a network DEA model was proposed by Färe and Grosskopf (2000), which was then continuously developed and refined by Tone et al. The main concept is to decompose the production and operation process into several interconnected steps and quantitatively evaluate the efficiency of each step and the overall process, aiming to comprehensively analyze the main barriers to efficiency improvement. The network SBM model is able to decompose the overall process into multiple sub-stages, quantify the efficiency of each stage and its contribution to the total efficiency, and thus accurately identify efficiency bottlenecks. As a result, the approach offers a scientific foundation for gauging the effectiveness and thorough assessment, which is fueled by technological and scientific innovation. The network SBM model is highly effective in addressing the efficiency assessment issue within a multi-stage production process. Unlike traditional DEA models that treat the system as a “black box,” this study breaks through such limitations. It comprehensively considers multiple links in the process of agricultural technological innovation leading to green development, including innovation inputs, R&D outputs, result transformation, and the ultimate effects of green development. By doing so, this phased assessment approach can more precisely identify efficiency bottlenecks and offer a more targeted foundation for subsequent policy-making. In this study, we adopt the non-radial network SBM model to evaluate both stage-specific and system-wide efficiency in China's agriculture sector. Here, ASTI drives green development while taking into account undesirable outputs (Tone and Tsutsui, 2009, 2014). The combined efficiency value solution of the decision-making unit can be expressed by the following formula:
where ρo* denotes the overall efficiency of the measure; sik–, spkg+, and sqkb– are slack variables for inputs, desired outputs, and undesired outputs, respectively; zo (k, h) is an intermediate variable that represents the output of node k and the input of node h is the input vector of the decision unit DMU node k; are the desired and undesired output vectors of node k, respectively; λkεRn+ is a nonnegative vector; e is a constant, denoting non-Archimedean infinitesimals. In the analysis, the relative weight of each node needs to satisfy the condition that the sum is 1 and non-negative. Since the importance of the two stages is the same, the weight of each node is set to 0.5. When the efficiency indicator reaches the critical value of 1, it means that the decision-making unit is in a fully effective state.
The following formula can be used to express the decision-making unit's sub-stage efficiency:
where: sk-* denotes the optimal input slack; sk+* denotes the optimal output slack. When ρk = 1, it means that the node k of the decision cell is efficient.
3.1.2 Tyrell's index
The Theil index, an economic analysis tool based on the concept of entropy, is widely used to measure income inequality. The ability to efficiently break down aggregate differences into intra- and inter-cluster differences, so exposing the underlying causes of inequality, is its main strength (Cheng et al., 2024). The Tyrell generalized entropy index, which is computed as follows, is presented in this research to quantify the relative degree of variation in the efficiency value:
Where: intergroup and intragroup gaps are denoted by TheilB and TheilW, respectively. The intra-group gap in group i is denoted by Theili; n is the total number of samples; ni denotes the number of districts in the ith group; i denotes clusters formed according to the classification; k denotes different provinces; yik denotes the level of efficiency value of ASTI driven agricultural green development in the kth province in group i; μi and μ denote the within-group mean and overall mean of the efficiency level of ASTI driven agricultural green development, respectively.
3.1.3 Kernel density estimate
By estimating the probability densities of random variables, kernel density estimation is a nonparametric estimation technique that produces continuous density curves that describe the variables' unequal spatial distribution and dynamic evolution patterns. Using the approach of kernel density estimation, this study investigates the dynamic evolution and absolute disparities in the efficacy level of green development in agriculture based on driving innovation (Węglarczyk, 2018). Its primary benefits are smooth density function estimation, more robust estimate findings, and the elimination of a priori assumptions regarding the model-specific distribution. The result is shown in Equation 8:
where: denotes the estimate of the density function f(x) of the random variable; × k denotes the efficiency level of the kth province; μ is the efficiency mean; n is the total number of provinces; h is the bandwidth to reflect the density function estimation accuracy; K(·) is chosen to be a Gaussian kernel function.
3.1.4 Spatial Markov chains
In this research, we break down the M × M transfer probability matrix into k M × M transfer conditional probability matrices, create a geographical weighting matrix (Tong et al., 2022), and discretize the efficiency level of ASTI driven green development in agriculture into k types. Hence, conditional on the spatial lag type k, the element Pkx|y in the matrix indicates the likelihood that the region will change from the initial state type x to type y at the following instant. The spatial lag value's precise formula is:
where Laga is the spatial lag value of region a; Yu is the observed value of region u; n is the number of study subjects; Wau is the spatial weight matrix, which represents the spatial relationship between city a and city u, throughout this essay, we use the spatial adjacency matrix.
3.2 Construction of the indicator system
3.2.1 Conceptual model
A number of changes, from the introduction of ASTI to the widespread promotion of green practices in agriculture, are essential to the shift to a more sustainable and efficient agricultural model. The main driver of the greening of Chinese agriculture is innovation in science and technology (Wang et al., 2019). Science, technology and innovation to drive the green development of Chinese agriculture is a multi-dimensional systematic project, which contains the following key links (Figure 1): innovation inputs, research and development, innovation outputs, transformation and diffusion, and green development performance Innovative inputs have laid the technological foundation for green agricultural development; green agricultural technologies developed through innovative means, after being transformed and diffused and applied, are widely disseminated into agricultural production, forming green agricultural products, ecological agricultural models and so on, and helping agriculture to realize the goal of resource-saving and environmentally friendly development (Chen and Li, 2022). The system can be separated into ASTI and agricultural green growth subsystems based on the constantly changing process of ASTI driven agricultural green development. The ASTI subsystem consists of three core elements: ASTI inputs, technology development, and innovation outputs, while the agricultural greening subsystem consists of four key elements: innovation outputs (which serve as inputs to the subsystem), intermediate inputs, transformation and diffusion, and final outputs. The two subsystems interact closely and form a feedback, with the ASTI subsystem providing solutions for green agricultural development, and the latter's experience feedback guiding the direction of ASTI. The elements are interdependent and communicate with the external environment to jointly build an open and synergistic science, technology and innovation driven agricultural green development system.
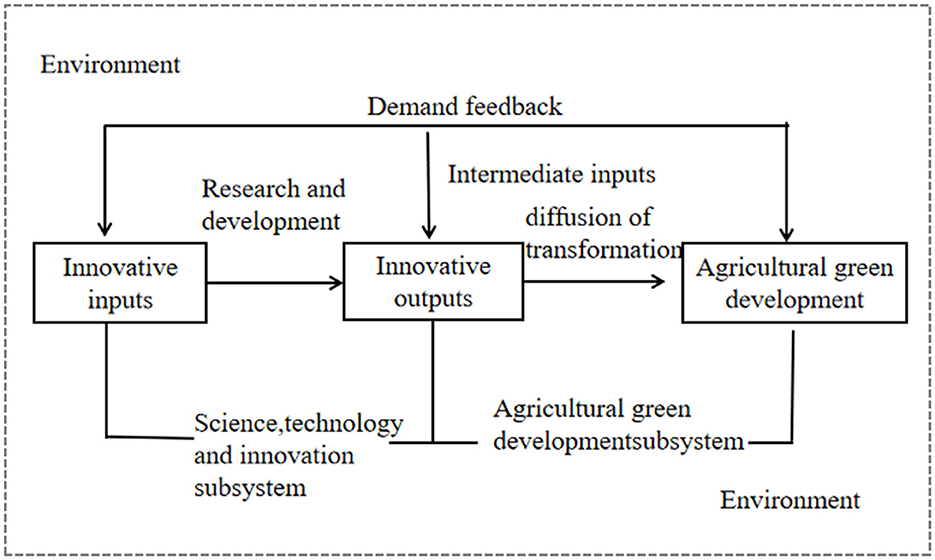
Figure 1. Evaluation conceptual model.
3.2.2 Selection of indicators
The efficiency evaluation index method is built using two steps based on the conceptual model (Table 1). In accordance with the majority of academics' practices (Wang et al., 2023; Liu et al., 2021; Yang, 2017), this paper selects the full-time equivalents of agricultural R&D workers as human inputs and internal expenditures of agricultural R&D funds as financial inputs (Wang et al., 2020). When examining the input components, prior research has mostly focused on material, financial, and human inputs; however, diverse literature has various areas of interest. The scientific and technological output indicators are selected from the number of applications for new varieties of agricultural plants, scientific and technological papers of China included in the main foreign search tools and the amount of contracts transacted in the technology market.
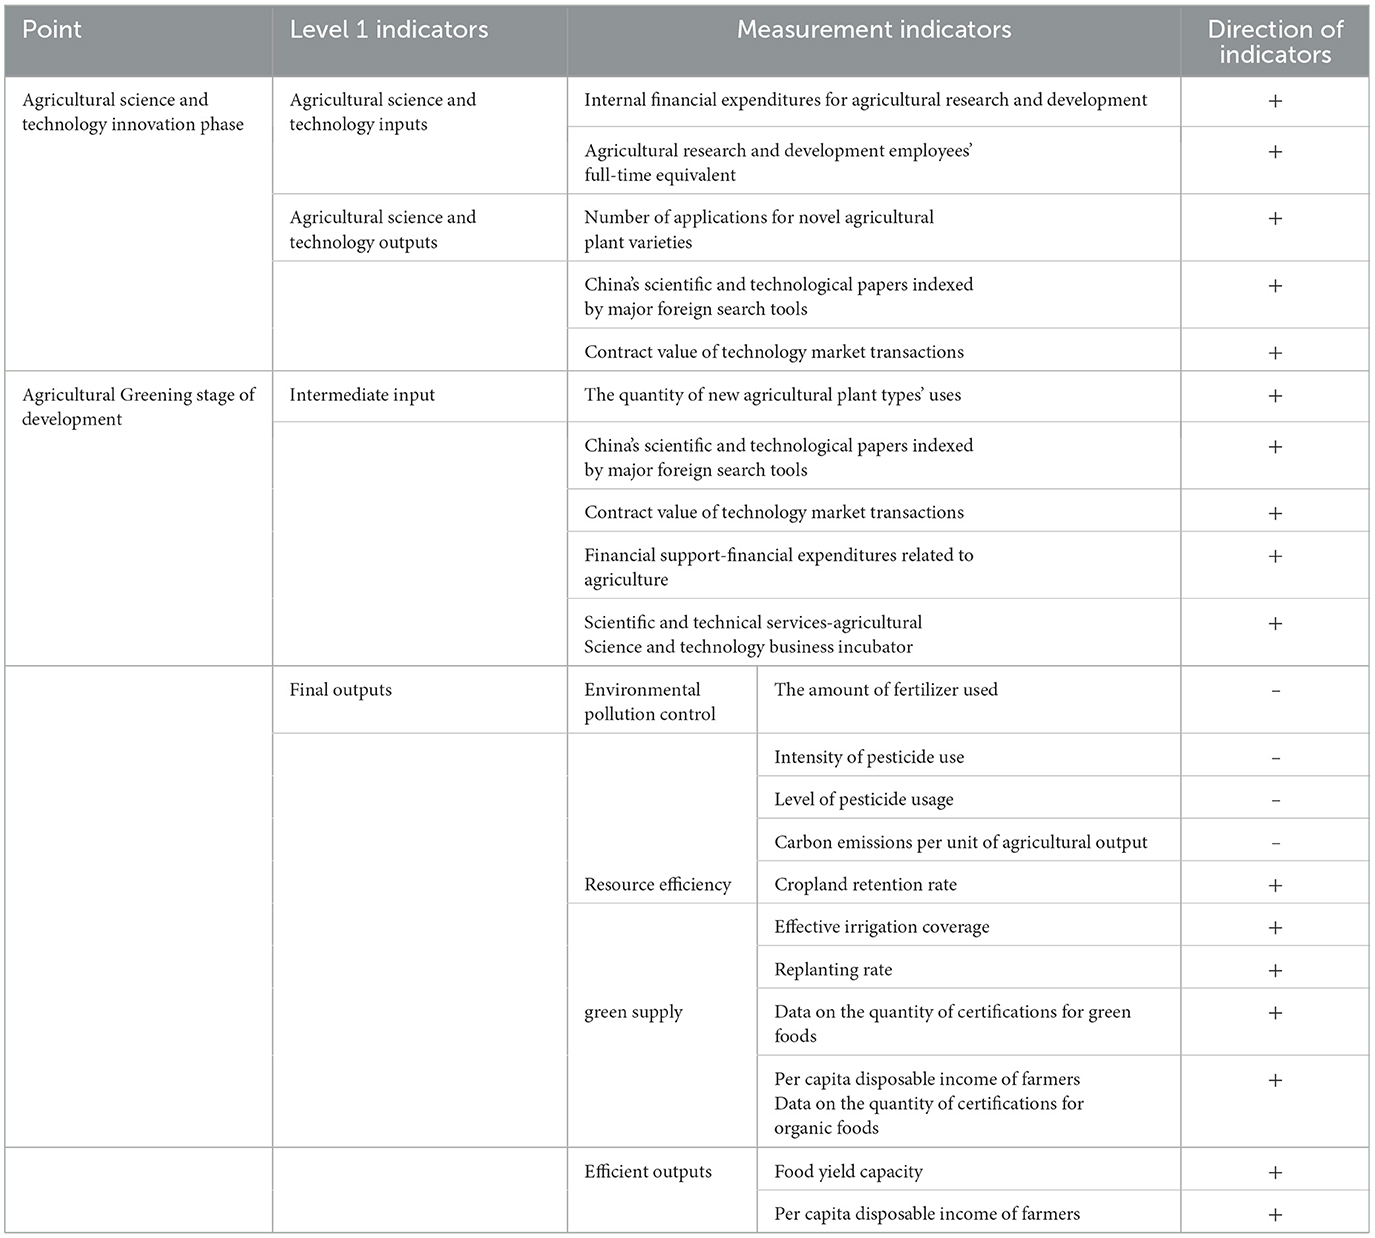
Table 1. Efficiency evaluation indicator system.
The transition accomplishment is the most important link, as it is the key to agricultural scientific and technological advancement that supports economic development. However, scientific and technological advancements alone will not translate into actual productivity; they must be brought together with other factors of production to create new products and new technologies, so the transformation stage also requires ongoing input additions (Cai, 2015). The transformation process must be supported by a significant amount of funds, and the number of business incubators in various agricultural regions should be chosen to measure the level of scientific and technological services (Wang et al., 2023).
Before evaluating the extent to which science and technological innovation have supported China's sustainable agricultural growth, it is essential to define agricultural green development. Scholars have different opinions on this: the core concept of greening agriculture focuses on setting stringent environmental standards and food quality requirements and working to enhance human wellbeing (Zhang, 2020). Shen et al. (2020) mainly evaluated the degree of green development of agriculture in three dimensions: socio-economic, food production and ecological environment. The indicator system places special emphasis on the synergistic relationship between indicators in various dimensions, for example, through the establishment of a triangular equilibrium model of “food production - resource inputs - environmental costs”, which reveals the relationship between indicators under different modes of agricultural production, and provides a scientific basis for the formulation of differentiated regional green development policies. According to Liu et al. (2020), agricultural green production is distinct from traditional agricultural production. Its fundamental idea is the thorough evaluation of economic, environmental, and social factors. Despite their lack of uniformity, the definitions often center on important topics such as resource efficiency, environmental and ecological preservation, raising the caliber of goods, and the sustainable growth of the agricultural sector. This paper constructs agricultural green development output indicators from four aspects: environmental pollution control, resource efficiency, green supply, and efficiency outputs. Environmental pollution control selects fertilizer use intensity, pesticide use intensity, agricultural film use intensity, and carbon emissions per unit of agricultural output value. Resource efficiency indicators select arable land retention rate, effective irrigation rate, replanting rate. Green supply indicators select statistics on the quantity of green food certifications and organic food certifications. Efficiency outputs indicators select food yield capacity, per capita disposable income of farmers. Considering the large number of indicators measured for the final outputs, the indices chosen for the measurement of the results later are measured using each level of indicator.
3.3 Data description
The data and information utilized in this investigation come from reputable sources like the China Statistical Yearbook, China Scientific and Technological Statistics, and China Rural Statistics, and it covers 30 provinces in mainland China—with the exception of Tibet—for the years 2013–2023. There is a time lag between the input of innovation factors and the final output because ASTI driven green development in agriculture is a multi-stage value transformation process. According to the majority of scholars, the time interval between the inputs and outputs at each stage is 1 year. Data on technology market turnover and per capita disposable income of farmers are converted to comparable price indices with 2013 as the base period; in which indicators such as internal expenditure on agricultural R&D and full-time equivalents of agricultural R&D personnel are converted, drawing on the practice of Cheng and Chen (2020).
4 Empirical
4.1 Temporal changes in total and sub-stage efficiencies
Based on the assessment index system of ASTI driven China's agricultural green development efficiency and the previously constructed network SBM model that accounts for unexpected outputs. Figure 2 displays the effectiveness of ASTI driven China's agricultural green development from 2013 to 2022.
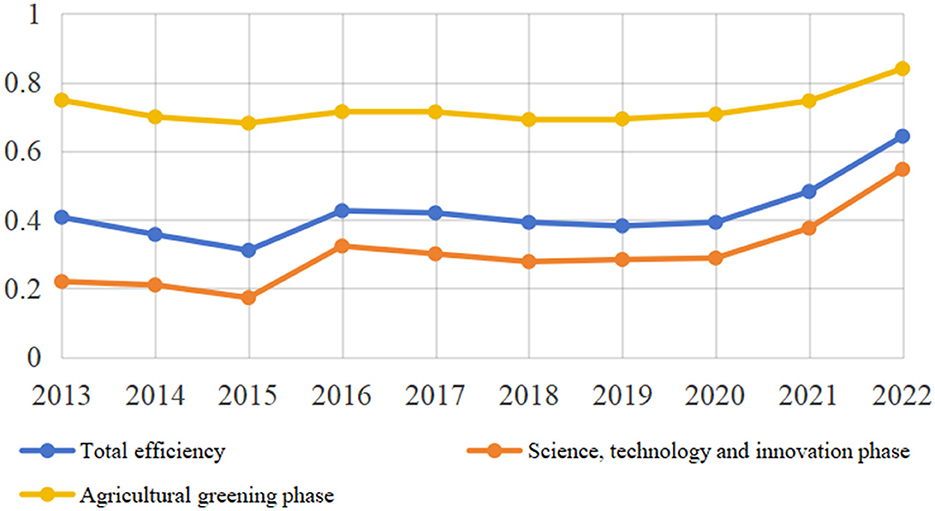
Figure 2. Level of efficiency measurement, 2013–2022.
Globally speaking, China's overall efficiency value shows a mixed upward trend, increasing by an average of 5.18% annually from 0.408 in 2013 to 0.643 in 2022. This suggests that, in tandem with the steady advancement of the innovation-driven strategy, China's green development in agriculture has successfully increased its efficiency, although the overall level remains low and much room remains for improvement. In terms of the evolutionary process, the trend in the value of total efficiency over the sample period can be divided into three phases. The period from 2013 to 2015 was a phase of slow decline, corresponding to the middle and late stages of the 12th Five-Year Plan. During this period, influenced by the market economy, the prices of most agricultural products showed a downward trend, leading to a decrease in the total value of gross agricultural output and value-added, a decline in agricultural efficiency, and an impact on farmers' income growth. Green agricultural technology adoption and promotion may suffer as a result of farmers cutting back on inputs used in agricultural output. The 2015–2020 period is a fluctuating and rising stage, which is due to the government's increasing attention to agricultural greening, accompanied by the introduction of policies and the vigorous adjustment of industrial structure, such as strengthening the environmental protection and governance of agricultural origins, promoting the reduction of the use of insecticides and fertilizers, and facilitating the comprehensive utilization of crop straw and the resourceful utilization of livestock and poultry manure. The adoption of these regulations, which have provided strong institutional safeguards and incentives for green agricultural development, has improved its efficiency. The period from 2020 to 2022 will be a phase of gradual increase, in which agricultural production methods will be constantly innovated based on scientific and technological progress, and a series of green, highly efficient and environmentally friendly agricultural technologies will be widely applied to actual production.
Though the overall performance of agricultural science and technology innovation < total efficiency < green development of agriculture pattern, the two sub-stages and the total efficiency have similar, fluctuating increasing patterns in terms of change. The efficiency of ASTI grew from 0.220 in 2013 to 0.547 in 2022, a yearly growth rate of 10.65% on average; the efficiency of green development in agriculture improved from 0.748 in 2013 to 0.840 in 2022, a 1.3% yearly average growth. The justification for this situation is that under the innovation-driven strategy, China's regional R&D investment has surged and measures to compete for talents are frequently put in place, but the R&D cycle is long and slow, so high investment may not lead to quick results, which may lead to redundancy in investment.
4.2 Regional analyses of total and sub-stage efficiencies
On the basis of regional geographic location, and in accordance with statistical practice since 2005, China is divided into East (Beijing, Tianjin, Hebei, Shanghai, Jiangsu, Zhejiang, Fujian, Shandong, Guangdong, Hainan), Central (Shanxi, Anhui, Jiangxi, Henan, Hubei, Hunan), West (Chongqing, Sichuan, Guizhou, Yunnan, Shaanxi, Gansu, Qinghai, Ningxia, Xinjiang, Inner Mongolia, Guangxi), North-East (Liaoning, Jilin, Heilongjiang) four major regions for further comparative analyses.
(1) Sub-stage-Efficiency of agricultural science and technology innovation. Figure 3a illustrates the distribution pattern of “northeast > east > central > western China,” with the average efficiency of ASTI in northeastern China being significantly higher than that in western China. The average efficiency during the sample period is 0.372 in eastern China, 0.267 in central China, 0.216 in western China, and 0.434 in northeastern China. The higher efficiency is due to the deep research accumulation and policy support. The advantages of its black soil and commercial grain base provide a large-scale application scenario for technology research and development, with a solid foundation for mechanization. Agricultural universities and research institutions in the region are densely populated, with close collaboration between the industry, academia and research institutes, superimposed on special financial inputs (e.g., the Black Soil Conservation Fund) to attract high-end talents and promote the efficient transformation of research and development. The trend of changes in the degree of efficiency development of science, technology, and innovation varies by region over time. In 2015, the four major regions' levels of efficiency development showed a downward trend to varying degrees, but since then, they have been gradually rising. The scientific and technical innovation efficiency score for the Northeast region is quite high, although it fluctuates greatly over time, showing a “W”-shaped trend of change. While the agricultural science and technology innovation efficiency value in the western region changes more smoothly and shows a rising tendency, the eastern and western regions both surpassed the northeast in 2022 in terms of efficiency value. The central region, which originally prioritized economic growth, had a sloppy mode of agricultural development, and lagged behind in the research and development of green technology, has been driven by the “innovation-driven” approach in recent years. The following factors contribute to the differences in the efficiency of ASTI across the four regions: the western region experiences a significant brain drain as a result of its low economic standing and shortage of skilled workers, which limits efforts to increase the efficiency of ASTI. However, in recent years, under the influence of the “innovation-driven” and “ecological priority” strategies, the efficiency has improved; the Northeast and Eastern regions have maintained their benefits in agricultural technology and science innovation efficiency due to the concentration of talents and sufficient R&D funds.
(2) Substage-Efficiency in greening agriculture. Figure 3b illustrates the distribution pattern of “east > central > northeastern > western” with an average efficiency value of 0.853 in the eastern region of China, 0.744 in the middle area, 0.612 in the western area, and 0.660 in the area to the northeast during the sample period. Compared to the northeast, the eastern region is at a higher stage of agricultural green development but at a lesser stage of agricultural science and technological innovation. In terms of time trend, the eastern, central and western regions all showed fluctuating upward trends, while the northeastern region fell to the trough twice, in 2015 and 2019, and generally showed a “W”-shaped trend throughout the sample time frame. It suggests that the eastern, central, and western regions are gradually improving their efficiency, but the northeastern region has not witnessed any notable gain in this area. At the same time, resource and environmental constraints, such as black land degradation and water scarcity, limit ASTI driven green development in agriculture.
(3) Total efficiency. The distribution pattern of “East > Northeast > Central > West” is generally evident in Figure 3c, which shows that the average value of total efficiency during the sample period is 0.534 in the eastern region of China, 0.407 in the central region, 0.304 in the western region, and 0.508 in the northeastern region (Zhang and Tian, 2024). In contrast to the western area, the east has a substantially greater degree of overall efficiency. This is probably because agricultural technology has developed more quickly in the eastern zone, which has been essential to increasing the efficacy of green agricultural growth. In addition to increasing agricultural production's efficiency, these technical advancements have lessened its negative environmental effects. However, in terms of agricultural technology innovation and extension, the western area may be lagging behind. While the level of development of total efficiency in the western zone changes more smoothly, the values of total efficiency in the other four regions exhibit a fluctuating rising tendency over time. The eastern and northeastern regions are often stronger in ASTI than the central and western provinces because of their established economies and abundance of capital, which can attract more scientific and technological talent and resource inputs. This implies that the effectiveness of agricultural green development, which is fueled by innovations in agricultural science and technology, is rather uneven within China's four main regions.
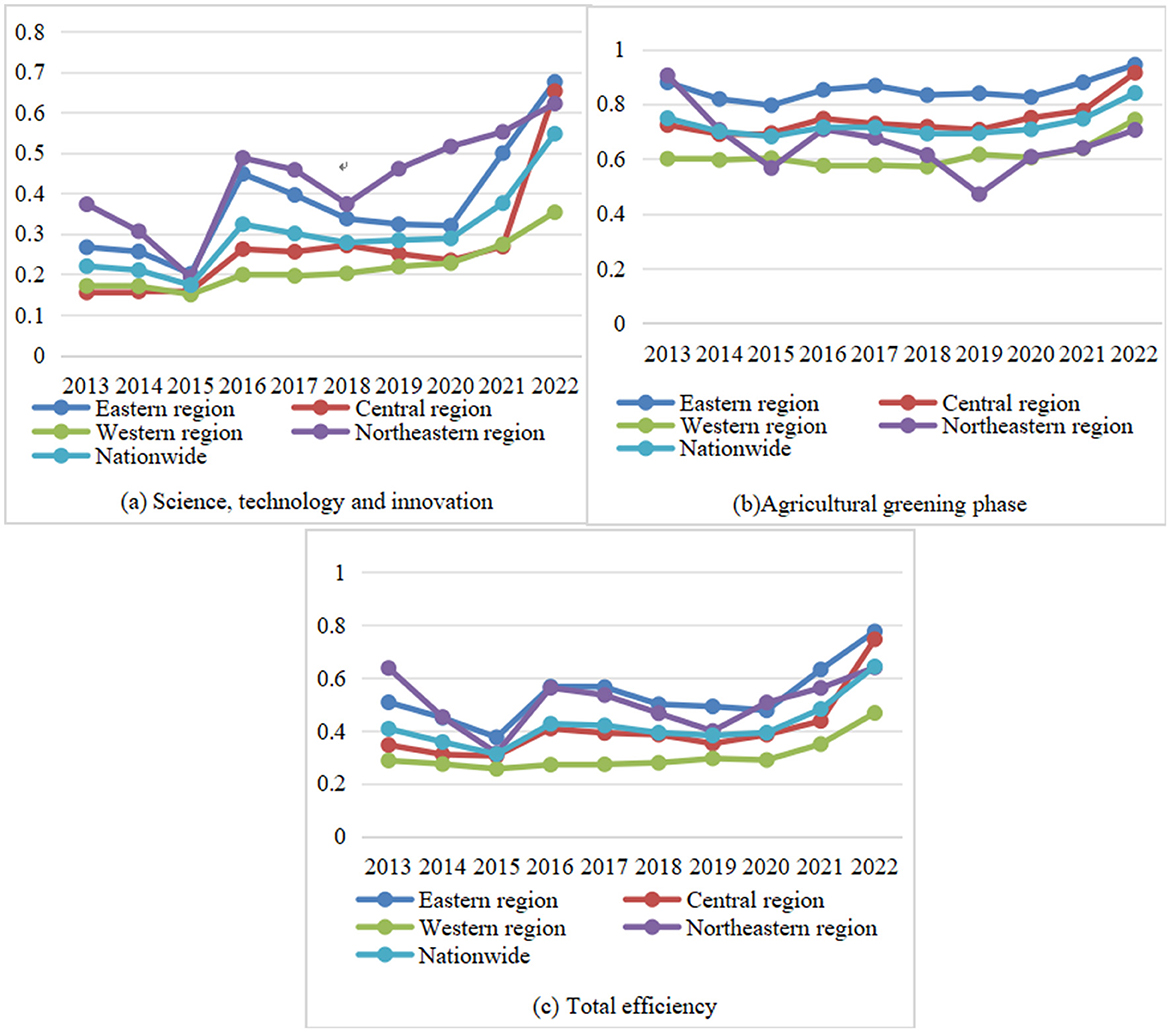
Figure 3. Efficiency by region, 2013–2022.
5 Discussion
5.1 Analysis of regional differences
This paper further employs the Theil Index to quantitatively analyze the differences in the geographical distribution of ASTI driven green agricultural development in China and decomposes the specific sources of these differences. The measurement results are presented in Figures 4, 5.

Figure 4. Total efficiency and its sub-stage efficiency Tyrell index.
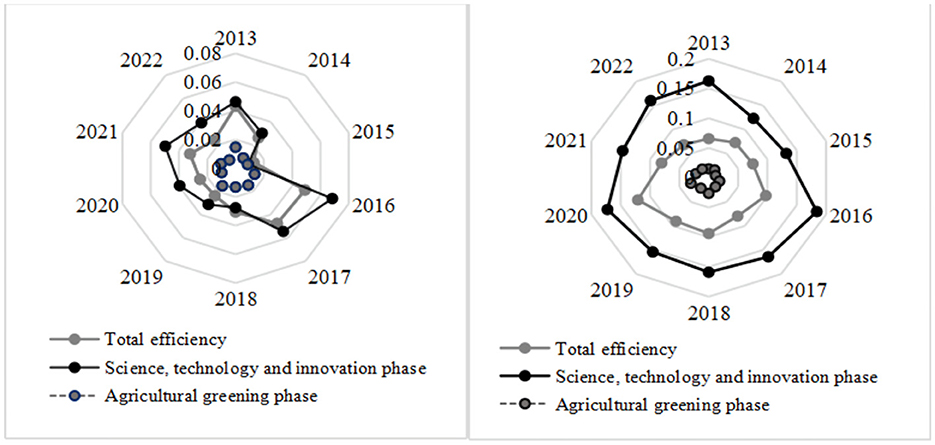
Figure 5. Total efficiency and its sub-stage efficiency regional Tyrell index.
In terms of overall differences, as shown in Figure 4, the Theil index of China's overall total efficiency shows a fluctuating and decreasing evolutionary trend over the sample period, from 0.109 in 2013 to 0.093 in 2022, indicating that the overall efficiency differences between China's regions show a decreasing trend. Among them, the gradual decline of the Theil index in 2013–2015 was mainly attributed to the fact that the State Council issued a series of strategic guidelines on regional co-operative development during this period, and regional co-operation mechanisms were rapidly launched in various regions, with more obvious effects. The reason behind this is that regional cooperation facilitates the flow and sharing of resources across regions. For instance, the Yangtze River Delta region has achieved mutual exchange of agricultural science and technology talent, funds, and advanced equipment through regional cooperation. Shanghai's financial and technological resources have radiated to neighboring cities, driving the greening of agriculture in some cities in Jiangsu and Zhejiang, resulting in an overall increase in efficiency and a narrowing of disparities within the region. The Theil index of agricultural science and technology innovation efficiency shows a generally stable tendency with no noticeable decreasing trend between 2016–2022, despite the fact that the difference in agricultural science and technology innovation efficiency declined from 0.209 to 0.141 between 2013 and 2015. This is because during the 12th Five-Year Plan period, many regions, including Zhejiang, have significantly increased their investment in agricultural science and technology, which has promoted a wide range of ASTI activities and improved the efficiency of innovation, thus narrowing the differences between regions. However, at a later stage, with the general increase in the importance attached to agricultural science and technology around the world, inputs have increased but the speed and quality of the transformation of innovations has been uneven. Taking Shandong Province as an example, some cities in ASTI pay too much attention to short-term results such as the publication of scientific research papers, while neglecting the application of the results in the actual transformation of agricultural production, resulting in a continuous increase in inputs, but the marginal effect on the overall improvement of the efficiency of innovation is gradually weakening, and the trend of narrowing the differences between regions has become slower. Similar to the Theil index of total efficiency, the Theil index of agricultural green development efficiency has a changing pattern and a more pronounced downward tendency. In the context of interregional synergistic cooperation, the efficiency of resource utilization has been improved and agricultural production methods have been optimized, thereby promoting the green development of agriculture. It is noteworthy that the efficiency Tel indexes of the two sub-stages and the overall efficiency Theil index essentially showed the same downward trend during 2013–2015. It shows that under regional synergistic cooperation, ASTI has led to the optimization of production methods and the improvement of resource utilization efficiency, and promoted the green development of agriculture.
Looking at the differences between the four main areas of Eastern, Central, Western and Northeastern China, as shown in Figure 5a, the inter-regional gap in total efficiency decreases from 0.043 in 2013 to 0.024 in 2022, with a decrease in the inter-regional Theil index over the sample period, suggesting that the differences in total efficiency among the four main regions have also decreased. Regarding evolutionary patterns, the interregional Theil index of overall total efficiency experienced a rapid decline followed by an increase and then a fluctuating decline from 2013 to 2022; the evolutionary trends of the interregional Theil index for the stage of agricultural science and technology innovation and overall total efficiency were basically the same, and the stage of green development in agriculture showed a fluctuating downward trend. This is due to the fact that the degree of policy coordination effects, the speed of resource flows and the sharing of ASTI results vary between regions at different stages. For example, in 2015–2017, the state's agricultural support policies for the Northeast increased, and the Northeast made significant progress in ASTI and green development, and the differences with other regions narrowed rapidly, leading to a rapid decline in the inter-regional Theil index of overall total efficiency; however, there was a subsequent marginal diminution in the effects of some of the policies, and this, together with catching up in other regions, led to another increase in the Theil index. In terms of the differences between cities within the four regions, as shown in Figure 5b, the intra-regional Theil index of overall total efficiency fluctuates from 0.066 in 2013 to 0.069 in 2022, which shows that the intra-regional imbalance of overall total efficiency is gradually emerging. The Tel Index's intra-regional fluctuation in the stages is comparatively stable, with no obvious downward trend, due to regional variations in the economy, policies, resource environment, and technological innovation capacity. As a result, the degree and impact of technological and scientific advancement on the growth of green agriculture are uneven across different regions.
In terms of the sources of variation, Table 2 shows that intraregional variation contributes more than 60 per cent of the variation in total efficiency and its sub-stage efficiencies, with intraregional variation contributing as much as 80.48 per cent in the agricultural science, technology and innovation stage, suggesting that most of the variations in total and two-stage efficiencies originate from intraregional variations while < 40 per cent of the factors come from inter-regional variations. Regional differences in agricultural green development stage are ranked Central < East < Northeast < West, regional differences in overall total efficiency are ranked Central < Northeast < West < East, and variations by area in the stage of agricultural science and technology innovation are ranked West < Central < Northeast < East. In light of the combination, the eastern region has the largest average variance contribution (53.17%, 13.78%, and 38.66%, respectively). This suggests that one of the primary causes of spatial differences in total efficiency is performance imbalances among eastern cities. The western region has the lowest average contribution to science and technology innovation stage differences, and the central region has the lowest contribution to agricultural greening stage differences and total efficiency differences. In the eastern region, for example, within the provinces of Shandong and Jiangsu, there are large differences between coastal and inland cities in terms of their level of economic development, industrial structure, and the importance they place on agricultural science and technology innovation. Coastal cities are economically developed, with diversified industrial structures and more investment in agricultural science and technology innovation, and better development of green agriculture; while inland cities are economically relatively backward, with a single agricultural industrial structure and insufficient investment in agricultural science and technology innovation, leading to obvious differences in the efficiency of intra-regional green development of agriculture, which pulls up the contribution rate of intra-regional variation in the eastern region.
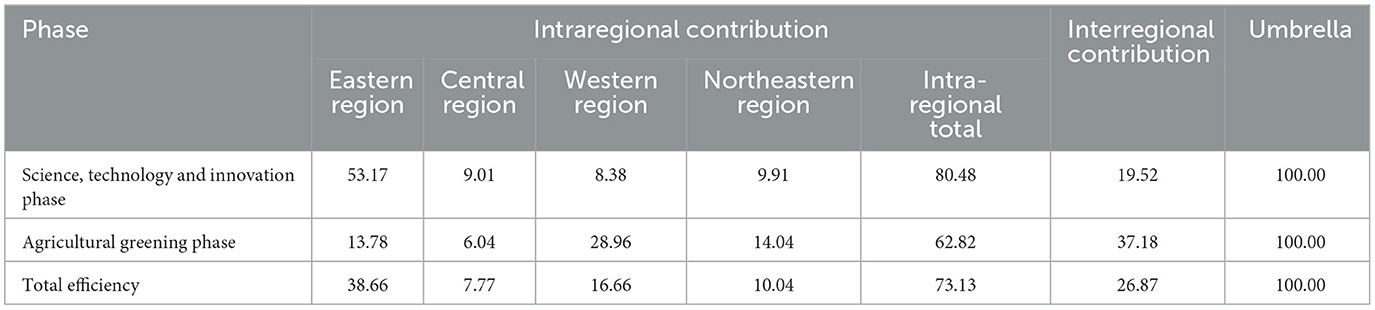
Table 2. Results of the average contribution of the Theil index, 2013–2022 (%).
5.2 Adaptive development using kernel density estimation
This research next applies kernel density estimation. to show the dynamic trends over time and the distributional features of the absolute disparities in their efficiency levels (Figure 6).
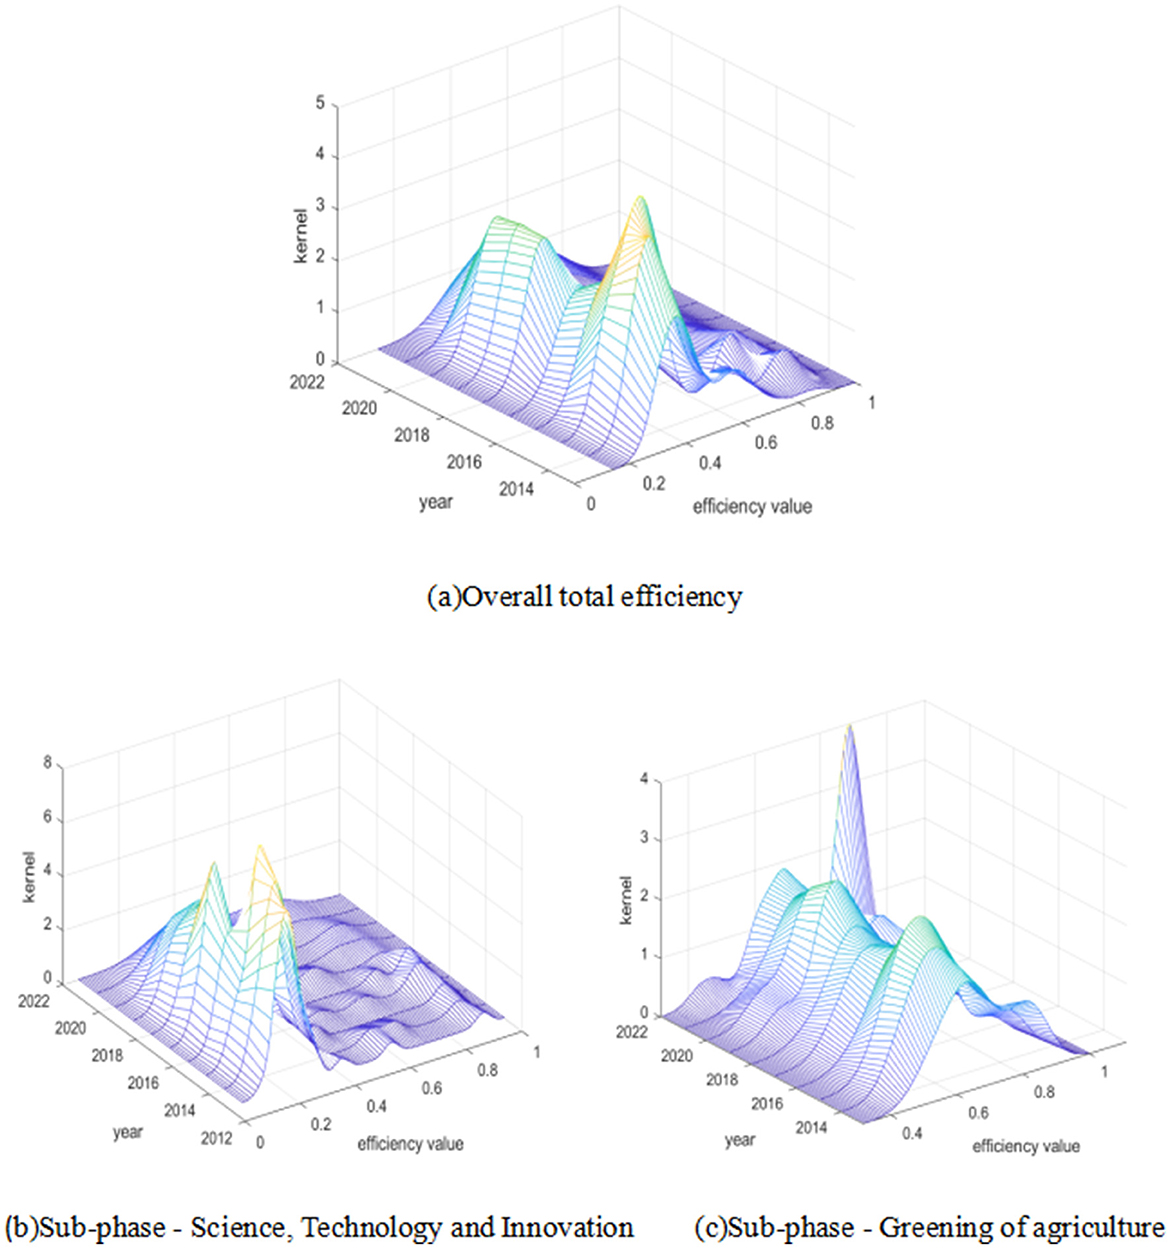
Figure 6. Dynamic evolution of efficiency.
The general shift to the right of the distribution positions of the main peaks of China's overall total efficiency level, sub-stage-agricultural science and technology innovation, and sub-stage-agricultural green development indicates that both the overall efficiency and its sub-stage efficiency levels have improved. The width of the agricultural science and technology innovation sub-stage first narrowed and then widened, showing a “upward-declining” tendency in the primary peak's height. This suggests that the stage is generally consistent with the overall trend in total efficiency. In 2013–2018, the country continued to increase investment in agricultural science and technology innovation, and localities responded positively by establishing many agricultural science and technology R&D centers and innovation platforms and attracting a large number of talents, which led to the emergence of ASTI and increased efficiency, as evidenced by the rise in the height of the main peak. However, in 2018–2022, agricultural science and technology R&D in some regions enters a bottleneck. On the one hand, the R&D funds invested in the previous period fail to be consistently transformed into effective innovations, and some of the R&D projects fail to meet the expected goals; on the other hand, with the intensification of market competition, agricultural science and technology enterprises in some regions face survival pressure and insufficient innovation power, resulting in a decline in the height of the main peak. Among them, a turning point was reached in 2014–2015, reaching a peak, indicating that technology research and development and resource allocation in the regions have been effective after 2014, but also exacerbating inter-regional disparities. Taking Sichuan Province as an example, after 2014, Chengdu and other areas, with their good economic foundation and policy support, have vigorously developed agricultural science and technology, actively introduced advanced technology and talents from home and abroad, and made significant progress in the fields of smart agriculture, deep processing of agricultural products, etc., so that the efficiency of green development of agriculture has increased significantly; while some remote areas in the province are lagging behind in terms of development due to the inconvenient transportation, lack of funds, and shortage of talents, etc. This has led to an increase in the differences in the efficiency of green agricultural development between Sichuan and other provinces and different regions within the province. The height of the main peak of the agricultural green development sub-stage is generally fluctuating upward and narrowing in width, indicating that the level of efficiency of agricultural green development is narrowing in its unevenness across regions. From the standpoint of distribution ductility, the sub-stage of agricultural science and technology innovation and overall total efficiency are right behind, and ductility contraction, which shows that there are some areas with higher levels of efficiency, causes the overall absolute differences to decrease, while other areas have a pulling effect; the sub-stage of the green development of agriculture shows that the overall absolute differences increase, and ductility broadening shows that the level of efficiency development of the individual areas between the existence of significant not-balance phenomena increases. The presence of multipolar differentiation was indicated by the two subphases' multi-peak structure and overall total efficiency, but each also exhibited a tendency to differentiate to differing degrees. This is due to the differences in resource endowment, market demand and policy orientation in different regions. For example, in terms of resource endowment, the northeastern region, with its rich land resources and good ecological environment, has a natural advantage in developing green agriculture, while parts of the western region are ecologically fragile and face more challenges in developing green agriculture. In terms of market demand, the developed economy of the eastern region and the strong consumer demand for green agricultural products have promoted the green development of local agriculture, while the relative lack of market demand in some central and western regions has constrained the pace of green agricultural development. With regard to policy orientation, some regional governments have attached high importance to green agricultural development and introduced a series of preferential policies and support measures to promote green agricultural development in their localities, while the lack of implementation of policies in some regions has affected the process of green agricultural development.
5.3 Dynamic evolution based on spatial Markov chains
In order to further reflect the internal flow direction of ASTI driven agricultural green development and its location transfer characteristics, this paper introduces the Markov transfer probability matrix for analysis, and Table 3 displays the outcomes. The “club convergence” effect is demonstrated by the ASTI driven agricultural green development index's strong level stability, as seen by the values on the diagonal of the matrix being typically greater than those on the off-diagonal. Specifically, the chances of a province remaining at the same level after a year are 70.67% for low-level provinces, 52.17% for medium-low provinces, 60.29% for medium-high provinces, and 81.03% for high-level provinces. It is important to remember that the higher values at the ends of the diagonal line compared to the center indicate that provinces at low or high levels tend to maintain their original rank, and that the “club convergence” phenomenon between low and high levels is particularly significant. The emergence of this phenomenon is closely related to the industrial structure, policy environment and science and technology innovation capacity of the region. Low-level provinces tend to have a single industrial structure, dominated by traditional agriculture, and have limited capacity to invest in and apply ASTI; they have insufficient policy support for the green development of agriculture and lack the advantage of attracting scientific and technological talent and capital. For example, in some western provinces, agricultural production is still predominantly crude, with a low level of acceptance of new technologies and equipment, which makes it difficult to improve the efficiency of green agricultural development, and the probability of maintaining it at a low level is high. The high-level provinces, on the other hand, have a diversified industrial structure, a high degree of agricultural modernization, a large investment in ASTI, and a sound ASTI system and a policy support environment, and are able to sustain a high level of development. In addition, inter-class transfer is limited to neighboring categories, implying that ASTI driven greening of agriculture is a gradual evolutionary process that makes leapfrogging difficult. The odds of moving on to the next level after a year are 20%, 23.19%, and 16.18% for provinces at the low, medium-, and medium-low levels, respectively. This suggests that the process is complicated and full of ups and downs, and that the development challenges that each level faces are distinct. Correspondingly, the probabilities of transferring to the next level are 18.84 per cent, 22.06 per cent and 15.52 per cent for medium-low, medium-high and high-level provinces, respectively, revealing that ASTI-driven green development in agriculture is also accompanied by a certain downgrading risk. Guizhou Province, for example, has long been at a low to medium level of efficiency, and in the course of its development has faced problems such as difficulties in introducing technology and a shortage of capital; although it has the will and action to upgrade, it is constrained by its own conditions, which makes upgrading difficult, and at the same time it needs to guard against the risk of declining efficiency as a result of changes in the external environment or policy adjustments. This is because Guizhou Province is located inland, relatively backward economically, and has a weak ability to attract external technology and capital; at the same time, the province has a weak agricultural industrial base and a lack of ASTI talents, which makes it difficult to support the rapid upgrading of green agricultural development.
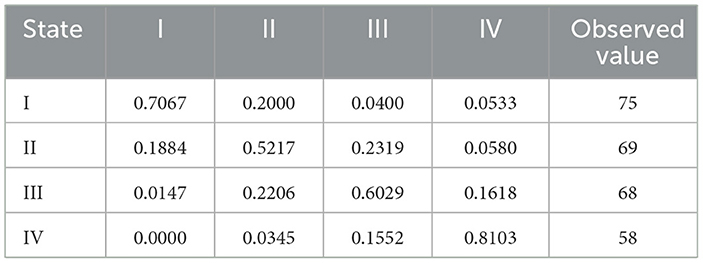
Table 3. Markov transfer probability matrix 2013–2022.
By incorporating spatial lag conditions into the standard Markov chain transfer probability matrix, a spatial Markov transfer probability matrix is produced, enabling a more comprehensive examination of the transfer probabilities in different neighborhood scenarios (Table 4). First, under various types of spatial lags, each of the four transfer probability matrices is unique. In the presence of variations in ASTI driven development level in neighboring provinces, it demonstrates that the likelihood that the growth of ASTI driven development level in this province will be impacted and moved varies. For example, in the Beijing-Tianjin-Hebei region, Beijing and Tianjin have a high level of green agricultural development, which has created a radiation driven effect on Hebei. When Beijing and Tianjin increase their investment in ASTI to enhance the level of green development, the spatial spillover effect on Hebei increases, and the probability of its agricultural green development level increasing accordingly. Second, the transfer probability matrix's diagonal elements under various spatial lags are typically not higher than its non-diagonal elements. This implies that spatial spillovers have weakened the “hierarchical solidification” of ASTI driven green development in agriculture, particularly under the third type of lag conditions. The instability of the level of ASTI driven green development in agriculture is further demonstrated by the non-zero elements on both sides of the matrix diagonal. This instability is accompanied by the risk of slippage even though there is a chance to advance to a higher level and the fact that these transfers are only possible between adjacent levels; cross-level jumps are uncommon. In the medium-high level lag type, the transfer probability from low level to medium level is 26.92%, higher than the transfer probability under the medium-low level lag type. Finally, the same lag type shows variability in its impact on different classes. Under the medium-high lag condition, the probability of shifting to the next level is 26.92%, 25%, and 15.22% for the low, medium-low and medium-high levels, respectively, showing a decreasing trend. This suggests that the transfer probability depends on both the initial ranking of ASTI driven greening of agriculture and the type of spatial lag. Low-level provinces, due to their low starting point, have more room for upgrading, driven by high-level provinces; while medium- and high-level provinces have relatively greater difficulty in upgrading and a lower probability of transfer.
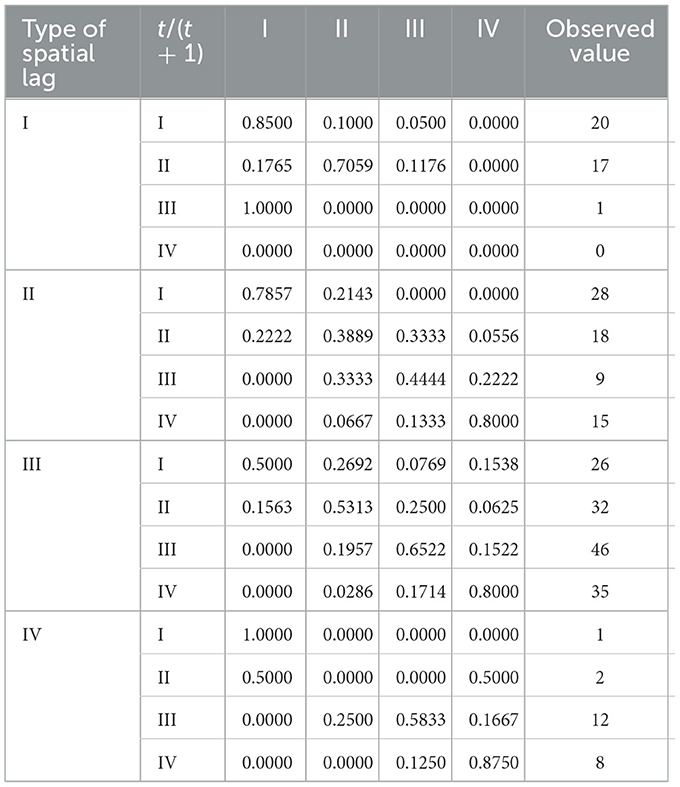
Table 4. Spatial Markov transfer probability matrix 2013–2022.
6 Conclusions and policy recommendations
6.1 Conclusions
This paper decomposes the complex system process into two stages from the perspective of system theory. Its conceptual model and index system are created, and the network SBM model of unexpected outputs is taken into consideration in the measurement method to determine the efficiency level. On this basis, the spatial and temporal variations are analyzed in terms of regional differences and dynamic evolution by combining the Theil index, kernel density estimation and spatial Markov chains. The following conclusions were drawn: (1) Timing characteristics: In 2013–2022, the overall efficiency of ASTI driven agricultural green development shows a fluctuating upward trend, but the efficiency of ASTI is significantly lower than the efficiency of agricultural green development, which becomes a key bottleneck constraining the improvement of total efficiency. (2) Spatial pattern: the efficiency shows a gradient distribution of “East > Northeast > Central > West.” The efficiency of the agricultural science and technology innovation sub-stage is superior in the Northeast, while the efficiency of the agricultural green development sub-stage is ahead of the East, indicating that there is a mismatch between inter-regional technology research and development capabilities and the environment for the transformation of results. (3) Regional variations: the relative differences in overall total efficiency during the study period are gradually narrowing, and the synergistic development of agricultural greening among regions is obvious. In terms of the causes of variations, the average contribution of interregional variations was 26.87 per cent, while the average contribution of intraregional variations reached 73.13 per cent, thus making intraregional variations the main cause of overall variations. (4) Dynamic evolutions: the main peaks of the overall total and sub-stage efficiencies are typically moved to the right during the kernel density-based estimation evolution, suggesting that both the total efficiency and its sub-stage efficiencies have increased, albeit with a pronounced multi-polarization tendency; In the process of evolution based on the spatial Markov chain, the overall total efficiency is characterized by an “increase in the level of development and a decrease in the absolute differences,” but the process of development has fluctuations and variations. In addition, there is a “club convergence” phenomenon in the ASTI driven agricultural green development index, with grade shifts occurring between neighbor types, making it difficult to achieve “leapfrog” shifts. The overall level of efficiency is also subject to some risk of downgrade, and the probability of downward shifts increases accordingly as the level increases. When spatial parameters are taken into account, it is discovered that the transfer probability is influenced by both the initial degree of ASTI driven agricultural greening and the type of spatial lag.
6.2 Policy recommendations
Considering the information given, this study suggests the following policies: (1) Implementing a differentiated regional strategy: in the eastern region, focusing on optimizing internal resource allocation and establishing an “efficiency depression” support mechanism. For example, through special provincial financial support for relatively backward regions such as west Luxi and north Suzhou, the promotion of green technology and industry chain synergy have been strengthened to narrow the differences within the province. In the northeastern region, in response to the contradiction between “high research and development and low transformation,” a demonstration zone for the protection of black soil and the transformation of green technology has been set up to promote in-depth cooperation between scientific research institutions and agricultural cooperatives, so as to solve the problems of low market acceptance and resource constraints (e.g., degradation of black soil). For the central and western regions, the “Science and Technology Talent Westward Program” has been implemented to attract talents from the east through tax incentives and tilting of scientific research projects; (2) Cracking the “club convergence” effect: constructing a cross-regional technology transfer platform, for example, pairing up the east with the west, and directing Zhejiang's digital agriculture model and Guangdong's eco-cycling technology into areas such as Yunnan and Gansu, to break the solidification of low-level regions. For provinces that have long been in the low-efficiency category (e.g., Qinghai, Ningxia), a “stepped-up” policy has been implemented, prioritizing support for the introduction of mature technologies (e.g., water-saving irrigation, organic fertilizer substitution) rather than blindly pursuing cutting-edge innovations. (3) Strengthening the precision of results and inputs: the establishment of a “green technology suitability assessment mechanism” aims to filter the list of suitable technologies for various ecological types, including the western arid zone and the northeastern black-soil zone, to prevent a uniform approach to technology promotion. Optimize the structure of financial inputs, direct 30% of agricultural R&D funding to transformation (e.g., technology demonstration parks, farmer training), and introduce a “green technology transformation performance” assessment index, forcing research institutions to collaborate with local governments. (4) Addressing the risk of downgrading: dynamic monitoring of medium and high level regions (e.g. Hubei, Hunan), if the efficiency declines for two consecutive years, the “yellow card warning” will be initiated, and project approval will be suspended until rectification is achieved. Encourage the northeastern region to reduce the risk of degradation by directly linking the application of green technologies to economic benefits through market-based means such as carbon emissions trading and ecological compensation.
Data availability statement
The datasets presented in this study can be found in online repositories. The names of the repository/repositories and accession number(s) can be found in the article/supplementary material.
Author contributions
LW: Conceptualization, Funding acquisition, Supervision, Writing – original draft, Writing – review & editing. ML: Data curation, Formal analysis, Methodology, Validation, Visualization, Writing – review & editing. PZ: Conceptualization, Methodology, Validation, Writing – review & editing.
Funding
The author(s) declare that financial support was received for the research and/or publication of this article. This work was funded by General Project of Shandong Soft Science Research Plan (2023RKY02003) and Doctoral Fund of Qingdao Agricultural University (663/1115704).
Acknowledgments
The authors express their gratitude to the editors and reviewers for their insightful and beneficial feedback.
Conflict of interest
The authors declare that the research was conducted in the absence of any commercial or financial relationships that could be construed as a potential conflict of interest.
Generative AI statement
The author(s) declare that no Gen AI was used in the creation of this manuscript.
Publisher's note
All claims expressed in this article are solely those of the authors and do not necessarily represent those of their affiliated organizations, or those of the publisher, the editors and the reviewers. Any product that may be evaluated in this article, or claim that may be made by its manufacturer, is not guaranteed or endorsed by the publisher.
References
Blakeney, M. (2022). Agricultural innovation and sustainable development. Sustainability 14:2698. doi: 10.3390/su14052698
Bloch, H., and Metcalfe, S. (2018). Innovation, creative destruction, and price theory. Ind. Corp. Change 27, 1–13. doi: 10.1093/icc/dtx020
Cai, Y. Z. (2015). Research commercialization: content, boundary as well as statistics and measuring. Stud. Sci. Sci. 33, 37−44. doi: 10.16192/j.cnki.1003-2053.2015.01.006
Chen, X., and Li, T. (2022). Diffusion of agricultural technology innovation: research progress of innovation diffusion in Chinese agricultural science and technology parks. Sustainability 14:15008. doi: 10.3390/su142215008
Cheng, C. M., and Chen, X. Y. (2020). Research on the coordinated development of grain production modernization and agricultural scientific and technological innovation in AnHui province. Chin. J. Agric. Resour. Reg. Plann. 41, 163–171.
Cheng, S. X., Chen, L. P., and Liu, S. J. (2024). Decomposotion, evolution and influencing factors of green innovation performance in the Yangtze River economic belt from the perspective of innovation value chain. Resour. Environ. Yangtze Basin. 33, 1123–1139. doi: 10.11870/cjlyzyyhj202406001
Conway, G. R., and Barbie, E. B. (1988). After the green revolution: sustainable and equitable agricultural development. Futures 20, 651–670. doi: 10.1016/0016-3287(88)90006-7
Djellal, F., and Gallouj, F. (2008). A model for analysing the innovation dynamic in services: the case of assembled services. Int. J. Serv. Technol. Manag. 9, 285–304. doi: 10.1504/IJSTM.2008.019702
Färe, R., and Grosskopf, S. (2000). Network DEA. vol. 34, issue 1. Socioecon. Plann. Sci. 34, 35–49. doi: 10.1016/S0038-0121(99)00012-9
Gao, Q., Wang, Y. X., and Dou, Y. W. (2024). Spatial-temporal differentiation and driving factors of agricultural green development level in the Yangtze Economic Belt. Chin. J. Eco-Agric. 1731−1743. doi: 10.12357/cjea.20240170
Gebreeyesus, M., and Mohnen, P. (2013). Innovation performance and embeddedness in networks: evidence from the Ethiopian footwear cluster. World Dev. 41, 302–316. doi: 10.1016/j.worlddev.2012.05.029
Guo, H., Xu, S., and Pan, C. (2020). Measurement of the spatial complexity and its influencing factors of agricultural green development in China. Sustainability 12:9259. doi: 10.3390/su12219259
Haggblade, S., and Hazell, P. (1989). Agricultural technology and farm-nonfarm growth linkages. Agric. Econ. 3, 345–364. doi: 10.1111/j.1574-0862.1989.tb00096.x
Han, G., Yang, H., and Xie, H. (2024). Research on the efficiency and spatiotemporal evolution characteristics of agricultural green development in central cities of the Yangtze River Delta. Front. Environ. Sci. 12:1502824. doi: 10.3389/fenvs.2024.1502824
Li, S., and Shangguan, L. (2024). Has the policy of national agricultural green development pilot zones enhanced the agricultural eco-efficiency? Observation based on the county-level data from hubei province of China. Sustainability 16:9265. doi: 10.3390/su16219265
Liang, J. F., Fang, W., Wan, Z., and Zhang, L. (2020) Evaluation of China's provincial agricultural science technology innovation ability from the perspective of green development. Sci. Technol. Manag. Res. 40, 60–67. doi: 10.3969/j.issn.1000-7695.2020.9.009
Liu, C., Guo, Y. D., and Ma, G. W. (2021). Collaborative development level of high-quality agricultural development and agricultural science and technology innovation ability in Heilongjiang province. Sci. Technol. Manag. Res. 41, 81–88. doi: 10.3969/j.issn.1000-7695.2021.14.011
Liu, H., and Liu, H. (2023). Study on the influence mechanism and level measurement of agricultural green development—a case study of China. Front. Environ. Econ. 2:1179399. doi: 10.3389/frevc.2023.1179399
Liu, Y., Lu, C., and Chen, X. (2023). Dynamic analysis of agricultural green development efficiency in China: spatiotemporal evolution and influencing factors. J. Arid Land 15, 127–144. doi: 10.1007/s40333-023-0007-6
Liu, Y., Sun, D., Wang, H., Wang, X., Yu, G., Zhao, X., et al. (2020). An evaluation of China's agricultural green production: 1978–2017. J. Clean. Prod. 243:118483. doi: 10.1016/j.jclepro.2019.118483
Pan, C., Jiang, Y., Wang, M., Xu, S., Xu, M., Dong, Y., et al. (2021). How can agricultural corporate build sustainable competitive advantage through green intellectual capital? A new environmental management approach to green agriculture. Int. J. Environ. Res. Public Health 18:7900. doi: 10.3390/ijerph18157900
Pretty, J., Benton, T. G., Bharucha, Z. P., Dicks, L. V., Flora, C. B., Godfray, H. C., et al. (2018). Global assessment of agricultural system redesign for sustainable intensification. Nat. Sustain. 1, 441–446. doi: 10.1038/s41893-018-0114-0
Shen, J., Zhu, Q., Jiao, X., Ying, H., Wang, H., Wen, X., et al. (2020). Agriculture green development: a model for China and the world. Front. Agr. Sci. Eng. 7, 5–13. doi: 10.15302/J-FASE-2019300
Shi, L., Han, L., Yang, F., and Gao, L. (2019). The evolution of sustainable development theory: types, goals, and research prospects. Sustainability 11:7158. doi: 10.3390/su11247158
Sun, H., and Chen, J. (2023). The road to green innovation in agriculture: the impact of green agriculture demonstration zone on corporate green innovation. Environ. Sci. Pollut. Res. Int. 30, 120340–120354. doi: 10.1007/s11356-023-30707-1
Sun, Y., Hu, R., and Zhang, C. (2019). Does the adoption of complex fertilizers contribute to fertilizer overuse? Evidence from rice production in China. J. Clean. Prod. 219, 677–685. doi: 10.1016/j.jclepro.2019.02.118
Sun, Z., Jiang, Y. L. D., and Yu, Z. G. (2024). Research on the multiple driving paths of China's agricultural green development from the perspective of configuration: based on fuzzy-set qualitative comparative analysis. J. Agro-For. Econ. Manag. 23, 731−740. doi: 10.16195/j.cnki.cn36-1328/f.2024.06.76
Tilman, D., Balzer, C., Hill, J., and Befort, B. L. (2011). Global food demand and the sustainable intensification of agriculture. Proc. Natl. Acad. Sci. USA. 108:20260-4. doi: 10.1073/pnas.1116437108
Tone, K., and Tsutsui, M. (2009). Network DEA: a slacks-based measure approach. Eur. J. Oper. Res. 197, 243–252. doi: 10.1016/j.ejor.2008.05.027
Tone, K., and Tsutsui, M. (2014). Dynamic DEA with network structure: a slacks-based measure approach. Omega 42, 124–131. doi: 10.1016/j.omega.2013.04.002
Tong, M., Chu, H. C. C., and Li, Y. (2022). Research on the distribution dynamics, regional differences and convergence of China's high-quality economic development. J. Quant. Technol. Econ. 39, 3–22. doi: 10.13653/j.cnki.jqte.2022.06.002
Wan, M., Kuang, H., Yang, Y., He, B., Zhao, S., Wang, Y., et al. (2023). Evaluation of agricultural green development based on gini coefficient and hesitation fuzzy multi-attribute decision-making: the case of China. Agriculture 13:699. doi: 10.3390/agriculture13030699
Wang, D., Du, X., and Guo, X. (2023). Capability evaluation and analysis of provincial agricultural science, technology and innovation. China Econ. Transit. 6, 495–495. doi: 10.3969/j.issn.1000-7695.2021.01.001
Wang, D., and He, Y. (2024). Re-imagining trade policy and energy efficiency: groundbreaking pathways to strengthen environmental sustainability in South Korea. Appl. Sci. 14:9443. doi: 10.3390/app14209443
Wang, F., Wu, L., and Zhang, F. (2020). Network structure and influencing factors of agricultural science and technology innovation spatial correlation network—a study based on data from 30 provinces in China. Symmetry 12:1773. doi: 10.3390/sym12111773
Wang, H., Li, Y. X. Y., and Xu, Y. L. (2019). Research on performance evaluation and influencing factors of high-quality economic development driven by scientific and technological innovation in China. Economist 64–74. doi: 10.16158/j.cnki.51-1312/f.2019.11.008
Węglarczyk, S. (2018). “Kernel density estimation and its application,” in ITM Web of Conferences, Vol. 23 (Les Ulis: EDP Science), 00037. doi: 10.1051/itmconf/20182300037
Wei, S., Jiandong, W., and Saleem, H. (2023). The impact of renewable energy transition, green growth, green trade and green innovation on environmental quality: evidence from top 10 green future countries. Front. Environ. Sci. 10:1076859. doi: 10.3389/fenvs.2022.1076859
Yang, X. Y. (2017). Analysis on regional agricultural technology innovation ability and convergence based on TOPSIS method. J. Huazhong Agric. Univ. 42–50+150–151 doi: 10.13300/j.cnki.hnwkxb.2017.03.006
Zhang, F. (2020). Agriculture green development: a model for China and the world. Front. Agric. Sci. Eng. 7, 5–13. doi: 10.15302/J-FASE-2019300
Zhang, F., Wang, F., Hao, R., and Wu, L. (2022). Agricultural science and technology innovation, spatial spillover and agricultural green development—taking 30 provinces in China as the research object. Appl. Sci. 12:845. doi: 10.3390/app12020845
Zhang, H., Feng, Y., Jia, Y., Liu, P., Hou, Y., Shen, J., et al. (2024). China's agriculture green development: from concept to actions. Front. Agric. Sci. Eng. 11, 20–34. doi: 10.15302/J-FASE-2023512
Zhang, K., and Tian, Y. (2024). Research on the spatio-temporal coupling relationship between agricultural green development efficiency and food security system in China. Heliyon 10:e31893. doi: 10.1016/j.heliyon.2024.e31893
Zhang, M., Fang, K., Zhang, D., and Zeng, D. (2023). Relationship between the evaluation of agricultural scientific and technological innovation capacity and the influencing factors of green agriculture. PLoS ONE 18:e0295281. doi: 10.1371/journal.pone.0295281
Keywords: technological innovation, agricultural green development, efficiency measure, regional disparity, distribution dynamics evolution
Citation: Wang L, Li M and Zhang P (2025) Regional differences and distributional dynamic evolution of science and technology innovation driven green development efficiency in Chinese agriculture. Front. Sustain. Food Syst. 9:1559625. doi: 10.3389/fsufs.2025.1559625
Received: 13 January 2025; Accepted: 08 May 2025;
Published: 03 June 2025.
Edited by:
Anas Tallou, Institute of Agrifood Research and Technology (IRTA), SpainReviewed by:
Shengxia Xu, Capital University of Economics and Business, ChinaFanghui Pan, Northeast Agricultural University, China
Peiyang Zhao, Peking University, China
Copyright © 2025 Wang, Li and Zhang. This is an open-access article distributed under the terms of the Creative Commons Attribution License (CC BY). The use, distribution or reproduction in other forums is permitted, provided the original author(s) and the copyright owner(s) are credited and that the original publication in this journal is cited, in accordance with accepted academic practice. No use, distribution or reproduction is permitted which does not comply with these terms.
*Correspondence: Min Li, MjM3MDI1MzIzMEBxcS5jb20=