 Na Wang
 Fangru Liu
 Lei Zhang2
- 1School of Economics, Shandong Women's University, Jinan, China
- 2School of Business, Ludong University, Yantai, China
Non-local vegetables have become a crucial source of vegetable supply for major cities, establishing stable production-marketing linkage mechanisms between large cities and external vegetable-producing regions is now imperative. Existing research has primarily examined, from a static perspective, the mechanisms by which government interventions influence the cross-regional alignment of agricultural production and marketing, yet it has not explored the dynamic characteristics and evolutionary patterns that emerge in the cross-regional integration of vegetable supply chains. This paper aims to establish a stable and healthy cross-regional vegetable production and sales docking mechanism. Based on evolutionary game theory, it constructs a tripartite evolutionary game model involving “government guidance—farmer participation—wholesaler operation” to explore the behavioral strategies and mutual influence mechanisms of the three parties. Through simulation analysis, the study investigates the impact of these three parties on the efficient and stable operation of the cross-regional production, and sales docking chain. The research results show that the level of government support and subsidies for wholesalers and farmers influence the strategic behavior of wholesalers and farmers. Appropriate supervision and penalties are conducive to the consistency of decision-making behavior between the government and wholesalers, while excessive supervision and penalties can lead to increased costs that wholesalers cannot bear, resulting in non-responsive behavior from wholesalers and causing a vicious cycle in the operation of the production and sales docking chain. A key contribution of this paper lies in its application of an evolutionary game model to describe the decision-making processes and adaptive learning behaviors of the three principal actors—government, wholesalers, and farmers—throughout the cross-regional production—marketing integration process, and to trace their dynamic evolution over time. By framing these interactions under conditions of bounded rationality, the model both analyzes and predicts the collective strategies that emerge among stakeholders, thereby furnishing essential theoretical insights for strengthening integration and securing vegetable supply. In doing so, it extends existing agricultural supply theory and offers actionable guidance for orderly production planning in major vegetable—producing regions and for accurately aligning output with primary consumption markets.
1 Introduction
Over the past decade, China has experienced an increasing trend of regional and structural imbalances in population and vegetable distribution across the country. Influenced by the rapid development of urban industries, a large population continues to concentrate in major cities, leading to an increase in urban commercial land while agricultural land area is continuously squeezed out. Vegetable production bases are gradually moving away from cities, concentrating in advantageous production areas on the outskirts, which results in a decline in the self-sufficiency capacity of cities for vegetables (Ma, 2020). At the same time, as the level of intensification and scale of the vegetable industry continues to rise, the unit yield of vegetable land keeps increasing, leading to severe stagnation in the sale of vegetables in production areas.
With the continuous adjustment of the planting structure, China's vegetable product industry structure has also been further optimized. This has gradually formed six major vegetable production areas: winter-spring vegetables in the South and Southwest hot regions, winter-spring vegetables in the Yangtze River basin, summer-autumn vegetables in the Yunnan-Guizhou Plateau, summer-autumn vegetables in the Loess Plateau, summer-autumn vegetables in the high-latitude northern regions, and facility vegetables in the Huang-Huai-Hai and Bohai Rim areas (Chen et al., 2020). However, considering the distribution patterns of population and economic development clusters, the stability of the regional vegetable structure remains relatively low.
Significant regional and seasonal fluctuations in vegetable market prices, combined with low satisfaction of demand in sales areas and prominent issues of unsold produce among farmers, have exacerbated these challenges. Since the outbreak of the COVID-19 pandemic, the instability of the vegetable market has intensified, bringing the problem of cross-regional vegetable production and sales docking into sharp focus. The severe imbalance in vegetable supply and demand between production and sales regions highlights the urgent need to streamline cross-regional vegetable circulation channels. Therefore, establishing a long-term mechanism for cross-regional vegetable production and sales docking is of paramount importance.
Vegetable production and sales are fundamental to people's livelihoods. Both domestic and international scholars have conducted in-depth research on vegetable market circulation models and cross-regional production and sales docking. Liu et al. (2012) analyzed the deep-seated reasons for the severe disconnection between cross-regional vegetable production and sales, pointing out that the imbalance in the vegetable market supply and demand make it urgent to innovate production and sales docking mechanisms. Baraka et al. (2021) argued that transaction costs are a common obstacle in agricultural supply chains and used the Heckman two-step model to find a significant positive correlation between indirect monitoring of transaction costs and direct sales of vegetables in urban markets; they also found a negative correlation between indirect information transaction costs and market information systems, suggesting that better market information systems will improve farmers' profitability.
Weerabahu et al. (2022) explored the challenges of food security in agricultural value chains from source to consumption and proposed a CRFS strategic framework to identify strategies that promote urban-rural linkages among multiple stakeholders. Fu et al. (2020), using evolutionary game theory, investigated the interactions of various stakeholders under the “farmer-supermarket docking” model, concluding that government guidance is fundamental and crucial for the sustained and stable operation of this model. Zhang et al. (2013) summarized four models of cross-regional vegetable circulation, noting that the farmer-wholesaler sales model remains the predominant sales model in the vegetable market. Zhao et al. (2022) designed a regional agricultural product production and sales balance index based on the characteristics of cross-regional circulation of agricultural products in China and suggested that establishing a vegetable price warning mechanism can effectively promote the stable operation of the vegetable market. Jin et al. (2025) argued that, for market participants—including policymakers—accurate forecasting of bulk-commodity price movements is essential, they demonstrate that a non-linear autoregressive neural network (NAR-NN) model can be calibrated—by adjusting training algorithms, lag orders, the number of hidden neurons, and data-splitting ratios—to predict prices for commodities such as peanut oil and coffee.
In summary, both domestic and international scholars have offered valuable insights into the necessity of cross-regional integration of agricultural production and marketing, the associated transaction costs, stakeholder relationships, and the role of government in facilitating these linkages. However, existing research remains limited in important respects. Analyses of government behavior have focused predominantly on subsidies and regulatory enforcement, employing static frameworks that obscure the dynamic characteristics and evolutionary patterns inherent in vegetable supply-chain integration across regions. Even studies that model strategic interactions between government and farmers have omitted wholesalers—the critical actors whose transportation and distribution activities drive market linkage. In reality, cross-regional integration of agricultural products is propelled jointly by government, wholesalers, and farmers: government subsidies, regulation, and infrastructure investment form the necessary foundation; wholesalers' logistics operations supply the operational impetus; and farmers constitute the essential supply base. By applying evolutionary game theory, this paper provides a coherent depiction of how government agencies, wholesalers, and farmers iteratively adjust their strategies and learn from one another over time. The resulting tripartite model captures the dynamic evolution of stakeholder decision processes under bounded rationality, enabling both the analysis and prediction of collective behaviors during integration (Abolhasani et al., 2023). Building on numerical simulations of wholesalers' and farmers' strategy trajectories under varying regulatory regimes, we derive targeted policy recommendations to strengthen China's cross-regional vegetable supply chains—thereby enhancing supply security and offering practical guidance for the orderly planning of production in major growing areas and the precise alignment of output with key consumption markets.
2 Problem description and model construction
2.1 Problem description
The circulation of vegetables is a crucial component of agricultural product distribution, influencing the commercialization and marketization of agricultural development and directly affecting people's livelihoods. As the manager and supervisor of social operations, the government controls the development direction of the vegetable industry structure. As early as 2012, the government introduced special financial subsidies for vegetable production, wholesale, and retail, significantly motivating various stakeholders to engage in vegetable production and distribution actively. Government guidance plays a positive role in improving the layout of vegetable products and adjusting the supply and demand structure of vegetables. Therefore, to facilitate cross-regional vegetable production and sales channels and to build an ideal docking mechanism, it is essential to leverage the government's control and regulatory power and to utilize its leading role effectively.
In the context of constructing production and sales docking models, agriculture has always been a focal point of public concern. With the continuous optimization of the agricultural product industry structure, China's vegetable market has seen the emergence of several new production and sales models. For instance, the “farmer-supermarket docking” retail model aims to reduce the operating costs of vegetable production and sales and improve their operational efficiency. However, this retail model faces several challenges that restrict its development, such as long repayment cycles due to high standardization, operational difficulties, and cost transfers that squeeze profit margins. Additionally, China still has many small-scale vegetable farmers, and influenced by the smallholder economy, the farmer-run sales model persists. Nevertheless, this model suffers from poor quality control, limited scale, and delayed access to information, which hampers farmers' ability to respond to market changes and makes them vulnerable to market fluctuations. As a result, the farmer-run sales model has poor sustainability and is not recommended for broader adoption (Zhang et al., 2021).
To address these issues, it is essential to explore and establish more effective production and sales docking mechanisms that can enhance the stability and efficiency of cross-regional vegetable distribution. This involves leveraging government guidance and support, improving information systems, and encouraging the participation of various stakeholders to create a more resilient and responsive vegetable market.
In comparison, the traditional wholesaler sales model avoids the immaturity of processes found in the retailer sales model and the disorderliness of operations seen in the farmer-run sales model. Consequently, the wholesaler sales model is more widely accepted and has a broader reach, continuing to dominate China's vegetable production and sales. The traditional wholesale-retail model involves multiple actors: the production-region government, the consumption-region government, wholesalers, vegetable brokers, farmers, retailers, and consumers.
In the construction and operation of the cross-regional supply chain, both the production-region government (i.e., the government where vegetables are grown) and the consumption-region government (i.e., the government where vegetables are consumed) share the common goal of ensuring the chain's successful establishment and healthy operation—namely, increasing farmers' incomes, improving wholesalers' efficiency, and delivering benefits to consumers. Because these two government bodies are aligned in their objectives and desired outcomes, this manuscript treats them as a single “government” actor, which collectively chooses its strategy.
Vegetable farmers are the primary suppliers whose decisions directly determine market supply volumes and quality (Jin and Xu, 2024). However, since small-scale cultivation still predominates in China, individual growers cannot directly access wholesale markets or retail outlets to sell their produce, making it difficult for small producers to link to large markets (Bendinelli et al., 2020). Instead, a large network of transport agents operates between farms and consumption markets, serving as the logistical bridge (Fan et al., 2021). These agents are composed of wholesalers and brokers: wholesalers, with their broad procurement radii, high volumes, and diverse varieties, typically do not transact directly with growers but rely on brokers to handle sourcing, quality inspection, consolidation and loading, and price negotiation (Bolívar et al., 2025). Because a broker's functions are effectively a subset of a wholesaler's operations, this study integrates the broker role into the wholesaler actor.
Wholesalers represent the demand side of the cross-regional chain, purchasing from wholesalers and selling to consumers. Whether they stock local or out-of-region produce, retailers base their procurement decisions solely on consumer demand and daily prices; thus, they do not exert a significant influence on the mechanism of cross-regional integration. Similarly, consumers—the ultimate end-users—make purchases based on the vegetables' variety, price, and freshness, without regard for their geographic origin (Zhang et al., 2021). Therefore, neither retailers nor consumers are modeled as strategic players in this evolutionary game.
Accordingly, this paper focuses exclusively on the three core actors—government, wholesalers, and farmers—and, using evolutionary game theory, constructs a tripartite “government-led, wholesaler-response, farmer-participation” model. We then employ the system-dynamics software Vensim PLE to simulate the replicator-dynamics equations and explore the strategy-selection and interaction mechanisms among these three parties.
2.2 Analysis of stakeholder interests
In the evolutionary game model of cross-regional production–marketing integration there are three players: the government, wholesalers and farmers. The government's strategy set is {Active Regulation, Non-active Regulation}; wholesalers' {Active Response, Non-active Response}; and farmers' {Participate in Integration, Not Participate}. The strategic interactions among them are as follows:
2.2.1 Game between government and vegetable wholesalers
The government, as the coordinator and regulator of social resources, participates in, guides and supervises the operation of the cross-regional vegetable supply-chain project. It uses administrative means—policies and regulations—to incentivize wholesalers to respond actively to the chain's construction, while monitoring their economic behavior to ensure healthy, stable operation (Li et al., 2025). Its policy tools during chain design and operation fall into two types: Active regulation: The government not only encourages and supports wholesalers through fiscal subsidies, tax incentives, and targeted deductions to engage in the cross-regional chain, but also supervises their response behavior. Wholesalers whose non-active responses undermine the chain may face withdrawal of subsidy eligibility, fines or other penalties (Bera and Giri, 2023). Non-active guidance: The government provides only positive incentives (e.g., subsidies, technical support) to both wholesalers and farmers, without imposing negative measures on wholesalers for non-active responses (Jin et al., 2024). Wholesalers then weigh these incentives and potential penalties in their payoff functions and choose the strategy (Active response or Non-active response) that maximizes their expected returns.
2.2.2 Game between government and farmers
Through fiscal subsidies, technical guidance, and increased investment in cold-chain logistics and infrastructure, the government influences farmers' choices of crop rotation, variety, and planting volume (Zhang et al., 2021). It also promotes price-insurance schemes to reduce market risk and establishes quality-traceability management systems to strengthen food-safety control. Farmers, guided by these measures, compare the expected payoffs of participating in the cross-regional integration against those of traditional channels and decide whether to join.
2.2.3 Game between wholesalers and farmers
As the demand and supply sides in the procurement stage, wholesalers and farmers choose strategies that mutually affect each other's payoffs. Farmers may sell vegetables to wholesalers, contact buyers directly, or transport produce to local markets; wholesalers decide whether to procure based on the types and quality of vegetables offered (Crippa et al., 2021). Whenever a transaction occurs, both parties realize additional surplus benefits, forming the classic buyer–seller payoff structure.
2.3 Model construction
As the main body responsible for the overall management of society, the government plays a crucial role as a participant, guide, and supervisor in the operation of cross-regional vegetable production and sales docking projects. The government can utilize its administrative tools to formulate policies and regulations that encourage wholesalers and farmers to actively participate in the construction of cross-regional production and sales chains. Additionally, the government oversees the economic behaviors of wholesalers and farmers to ensure the healthy and stable operation of the production and sales chain. The policy measures employed by the government in the construction and operation of the production and sales chain can be categorized into two types: active guidance and passive guidance. “Active guidance” refers to the government not only encouraging, guiding, and supporting wholesalers and farmers to actively participate and respond to the construction of the cross-regional vegetable production and sales chain through financial subsidies, tax incentives, and special deductions but also supervising the response behaviors of wholesalers during the operation of the production and sales chain. The government imposes penalties, such as canceling subsidy qualifications and fines, on wholesalers who exhibit “negative responses” that are detrimental to the operation of the cross-regional production and sales docking chain. On the other hand, “passive guidance” indicates that the government only adopts positive incentives for wholesalers and farmers without taking punitive measures against wholesalers' “negative responses.”
In the construction and operation of the production and sales chain, both the production area government (government of the vegetable production location) and the sales area government (government of the vegetable consumption location) aim to facilitate the successful establishment and healthy operation of the production and sales chain. Their ultimate goals are to increase farmers' income, enhance wholesalers' efficiency, and benefit consumers. Given the alignment of objectives and goals between these two governments, this paper treats the production area government and the sales area government as a unified “government” entity, making joint decisions.
In summary, the development of the cross-regional vegetable production and sales docking chain is closely related to the decision-making behaviors of the government, farmers, and wholesalers (Maleki et al., 2020). Therefore, this paper employs evolutionary game theory to characterize the behavioral strategies of these three parties. Before constructing the tripartite game model, the following assumptions are made:
Assumption 1: Assume that the influence of external environmental factors is not considered. The realization of the goal of healthy and efficient operation of the cross-regional vegetable production and sales chain depends on the behaviors of the government, wholesalers, and farmers. All three parties in this game are considered to be decision-making entities with bounded rationality, and they all follow the principle of maximizing their benefits.
Assumption 2: The government can guide the operation of the production and sales chain. Its strategy choices are {active guidance, non-active guidance}, with corresponding probabilities {x, 1 − x}. Wholesalers, as policy responders, have strategy choices of {active response, non-active response}, with corresponding probabilities {y, 1 − y}. Farmers, as participants, have strategy choices of {participate, not participate}, with corresponding probabilities {z, 1 − z}, where x, y, z ∈ (0, 1). Additionally, all three parties adjust their strategies over time.
Assumption 3: When the government chooses passive guidance, it only provides financial subsidies to wholesalers and farmers. The financial subsidy for farmers is M, with a support intensity of α; the subsidy for wholesalers is N, with a support intensity of β.
Assumption 4: When the government chooses active guidance, it incurs a cost Cg. In addition to financial subsidies, the government supervises and penalizes wholesalers for non-active response behaviors. Let γ be the intensity of the government's supervision and penalties, and K be the penalty imposed on wholesalers. Thus, wholesalers' non-compliant behaviors result in a loss of γK.
Assumption 5: Wholesalers who actively respond to government policies incur an operational cost Cw and receive a corresponding benefit A. Additionally, their active operation behavior fosters long-term cooperation with farmers, bringing an extra benefit B. Wholesalers who do not actively respond to government policies receive a retained benefit H.
Assumption 6: Farmers who join the production and sales chain receive a benefit D. If the government actively guides and wholesalers actively operate, farmers gain an additional benefit F. Farmers who do not join the chain receive a benefit E. When the government provides passive guidance and wholesalers do not actively operate, the production and sales chain performs poorly, resulting in the farmers obtaining their retained benefit E.
2.4 Game payment matrix and modeling
Based on the assumptions, the payoff matrix for the tripartite game involving the government, wholesalers, and farmers is constructed as shown in Table 1.
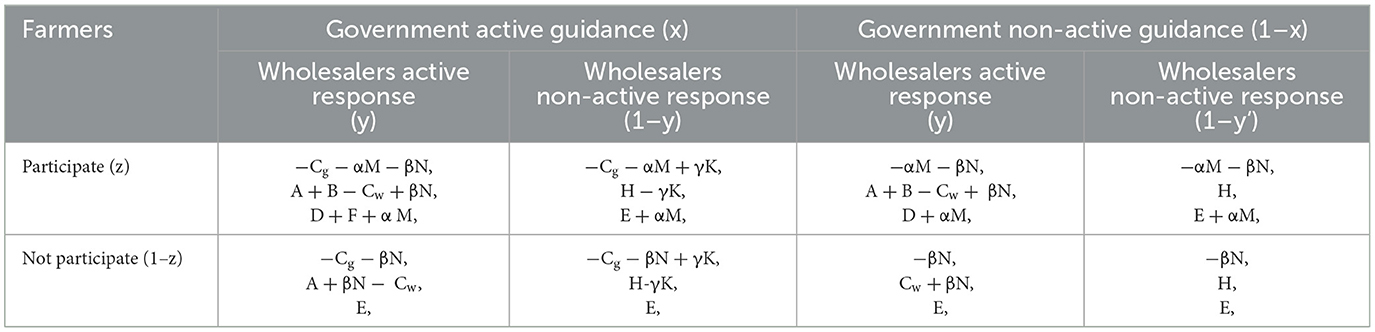
Table 1. Payoff matrix for the tripartite game.
Under a regime of active guidance by the government, if wholesalers respond positively and farmers participate actively, the government's total payoff is − Cg − αM − βN, the wholesaler's total payoff is A + B − Cw + βN, including the direct benefits from positive response A, additional gains B, and government subsidy βN, and less operational costs Cw, and the farmers' payoff is D + F + αM. If wholesalers respond positively but farmers do not participate, the government's total cost is − Cg − βN, the wholesaler's net payoff is A + βN − Cw, and farmers receive only their reservation payoff E. When the government opts for active guidance but wholesalers do not respond, if farmers choose to participate, the government incurs direct implementation costs Cg and subsidies αM paid to farmers, offset γK by fines collected from wholesalers, resulting in a total government payoff of − Cg − αM + γK; the wholesaler's total payoff is H − γK; and the farmers' total payoff is E + αM. If farmers also choose not to participate, then the government's, wholesalers', and farmers' payoffs are − Cg − βN + γK, H − γK, and E, respectively. By applying the same calculation process under a passive-guidance regime, one can derive the payoffs for the three parties—government, wholesalers, and farmers—under each combination of wholesalers' response (positive vs. non-positive) and farmers' participation (participate vs. not participate).
Based on Table 1, the expected payoffs for the government under “active guidance” Ig1 and “passive guidance” Ig2, as well as the average expected payoff Ig, can be calculated as follows:
Based on Table 1, the expected payoffs for the wholesalers under “active response” Iw1 and “non-active response” Iw2, as well as the average expected payoff Iw, can be calculated as follows:
Based on Table 1, the expected payoffs for the farmers under “participate” If1 and “not participate” If2, as well as the average expected payoff If, can be calculated as follows:
Based on the principles of evolutionary game theory, the replicator dynamics equations for the government, wholesalers, and farmers describe how the proportion of each strategy in the population changes over time. These equations are derived from the expected payoffs of each strategy.
3 Evolutionary stable strategy (ESS) analysis
The three parties in the game continuously adjust their decisions based on their immediate interests, eventually achieving dynamic equilibrium (Zhang, 2003). Setting F(x) = 0, F(y) = 0, F(z) = 0, we solve for the system's equilibrium points: X1 = (0, 0, 0), X2 = (1, 0, 0), X3 = (0, 1, 0), X4 = (0, 0, 1), X5 = (1, 1, 0), X6 = (0, 1, 1), X7 = (1, 0, 1), X8 = (1, 1, 1), Additionally, there exists a dynamic equilibrium point X9 = (a, b, c) that satisfies Equation 13.
3.1 Evolutionary stability analysis of government strategy choices
Based on Equation 13, we can see the following: If Cg − γK + yγK − zβN + yzβN = 0, the system is in a stable equilibrium state, and there is no need to adjust the government strategy. If Cg − γK + yγK − zβN + yzβN≠0, setting F(x) = 0, we obtain two equilibrium points, x = 0 and x = 1, both representing stable equilibrium states. When Cg − γK + yγK − zβN + yzβN > 0, we have F′(0) > 0∩F′(1) < 1. In this case, the system will be in a stable equilibrium state only if the government chooses the “active guidance” strategy. If the government chooses the “passive guidance” strategy, the system will be unstable. When Cg − γK + yγK − zβN + yzβN < 0, we have F′(0) < 0∩F′(1) > 0. In this case, the system will be in a stable equilibrium state only if the government chooses the “passive guidance” strategy. If the government chooses the “active guidance” strategy, the system will be unstable.
3.2 Evolutionary stability analysis of wholesalers strategy choices
Based on Equation 13, we can see the following: If A − CW − H + βN + zB + xγK = 0, the system is in a stable equilibrium state, and there is no need to adjust the wholesalers' strategy. If A−CW − H + βN + zB + xγK ≠ 0, setting F(y) = 0, we obtain two equilibrium points, y = 0 and y = 1, both representing stable equilibrium states. When A−CW − H + βN + zB + xγK > 0, we have F′(0) > 0∩F′(1) < 0. In this case, the system will be in a stable equilibrium state only if the wholesalers choose the “active response” strategy. If the wholesalers choose the “non-active response” strategy, the system will be unstable. When A − CW − H + βN + zB + xγK < 0, we have F′(0) < 0∩F′(1) #x0003E; 0. In this case, the system will be in a stable equilibrium state only if the wholesalers choose the “non-active response” strategy. If the wholesalers choose the “active response” strategy, the system will be unstable.
3.3 Evolutionary stability analysis of farmers strategy choices
Based on Equation 13, we can see the following: If (1 + x − xy − z + yz)αM + yD + (x − y − z − xy + yz)E + xyF = 0, the system is in a stable equilibrium state, and there is no need to adjust the farmers' strategy. If ((1 + x − xy − z + yz)αM + yD + (x − y − z − xy + yz)E + xyF ≠ 0(1 + x − xy − z + yz)αM + yD + (x − y − z − xy + yz)E + xyF ≠ 0, setting F(z) = 0, we obtain two equilibrium points, z = 0 and z = 1, both representing stable equilibrium states. When (1 + x − xy − z + yz)αM + yD + (x − y − z − xy + yz)E + xyF > 0, we have F′(0) > 0∩F′(1) < 0. In this case, the system will be in a stable equilibrium state only if the farmers choose the “participate” strategy. If the farmers choose the “not participate” strategy, the system will be unstable. When (1 + x − xy − z + yz)αM + yD + (x − y − z − xy + yz)E + xyF < 0, we have F′(0) < 0∩F′(1) > 0. In this case, the system will be in a stable equilibrium state only if the farmers choose the “not participate” strategy. If the farmers choose the “participate” strategy, the system will be unstable.
4 Evolutionary simulation analysis
Based on the principles of evolutionary game theory, we use the system dynamics simulation software Vensim PLE to construct and simulate the “government guidance—wholesaler response—farmer participation” cross-regional vegetable production and sales docking chain. The model construction is shown in Figure 1. In accordance with the payoff functions and replicator dynamics equations derived from the above evolutionary game analysis, the model includes 14 Constant variables, 9 Auxiliary variables, and 6 Level variables. The initial parameters for the model were set based on the values provided in the literature (Cao et al., 2018), as detailed in Table 2. The simulation process involves changing the values of the simulation parameters while keeping the other parameter values constant. The model is set to run over a time period of 12 months with a time step of 0.05.
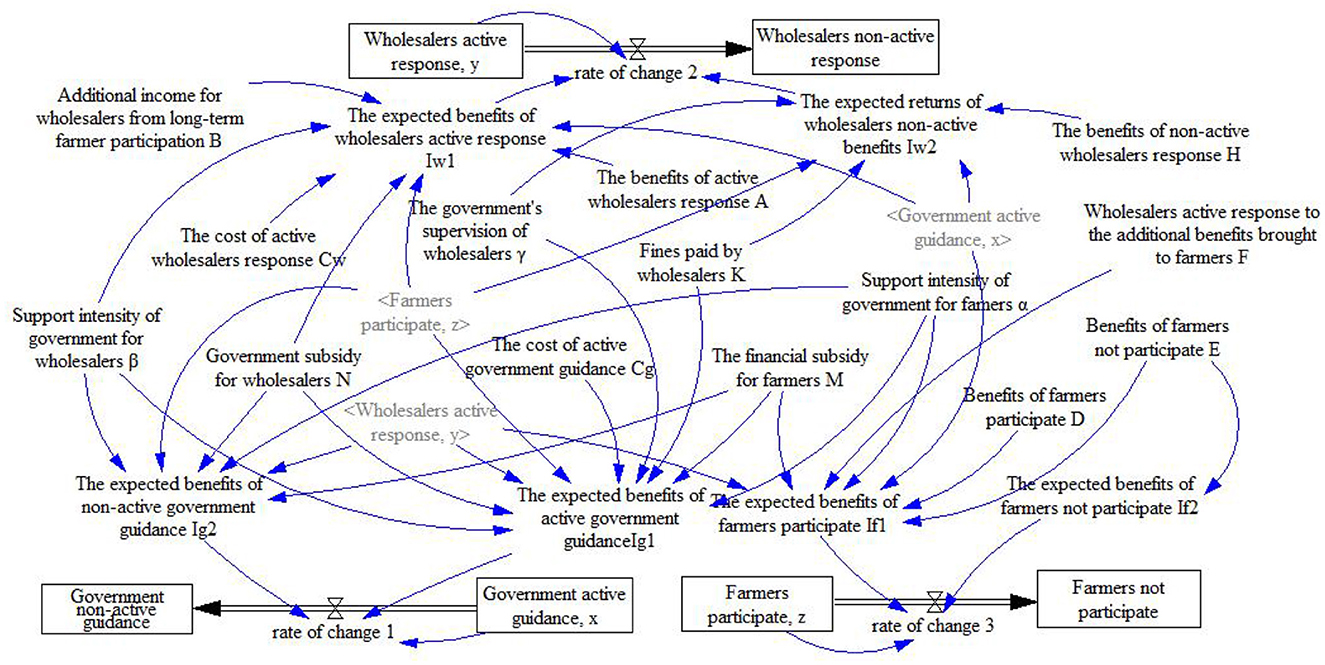
Figure 1. A game model for the cross-regional vegetable production and sales docking chain.

Table 2. Initial assignment of model parameters.
4.1 Initial evolution results
The initial results of the evolution simulation for the “government-wholesaler-farmer” interaction in the cross-regional vegetable production and sales docking chain are shown in Figure 2. It is assumed that the initial strategy selection probabilities for all three parties are 0.5, i.e., x = y = z = 0.5. Since the outbreak of the COVID-19 pandemic, the instability in vegetable production due to the fluctuating pandemic situation has led to increased volatility in vegetable market prices. Wholesalers and vegetable farmers, being directly related to the interests of the vegetable market, are particularly concerned with the supply and demand structure of the market. Wholesalers, as the demand side, are highly motivated to actively respond to the government's guidance in joining the cross-regional vegetable production and sales docking chain, especially given the significant appeal of securing a long-term, stable source of vegetable crops amid growing demand.
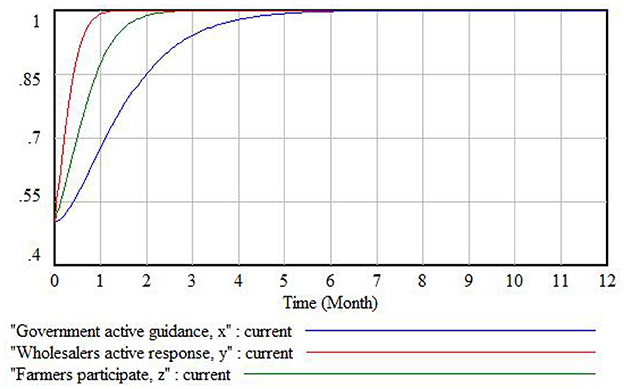
Figure 2. Initial evolution results.
Farmers, facing difficulties in selling their vegetables during the pandemic, also show a high level of enthusiasm for joining the government-guided cross-regional vegetable production and sales docking chain. However, as suppliers in the vegetable market, farmers have more flexibility in choosing their sales channels, so their convergence speed in actively participating in the production and sales docking chain is slower compared to wholesalers.
The government, as the societal manager, has the responsibility to regulate supply and demand and ensure public welfare. Beyond guiding and managing wholesalers and farmers, the government must also ensure that consumer demand is met. In the early stages of the production and sales docking chain operation, the government primarily adopts a “passive guidance” strategy by providing financial subsidies and tax incentives to attract wholesalers and farmers to actively participate in building the docking chain. As time progresses, issues within the production and sales docking chain, such as delayed payments by wholesalers, begin to surface, hindering the stable operation of the chain. Consequently, the government is compelled to increase its regulatory efforts, gradually shifting to an “active guidance” strategy that combines rewards and penalties.
4.2 The impact of support intensity and financial subsidies on wholesaler and farmers decisions
4.2.1 The impact of support intensity and financial subsidies on wholesaler decisions
The government's support intensity for wholesalers is set at three levels: low, medium, and high. In the simulation model, the support intensity is set to 0.1, 0.5, and 0.8, respectively. Figure 3 shows the impact of different support intensities on the expected returns for wholesalers, while Figure 4 illustrates the corresponding impact of different support intensities on wholesaler decision-making behavior.
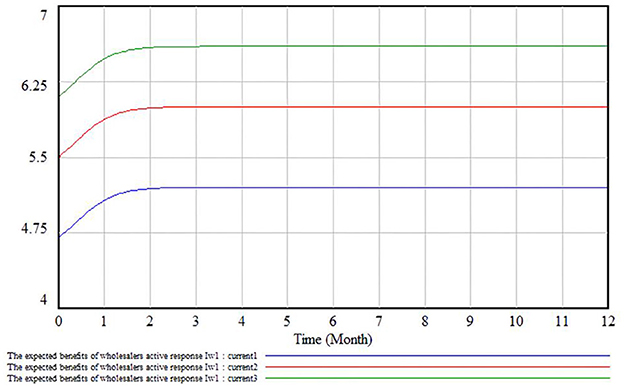
Figure 3. The impact of support intensity on benefits of wholesaler.
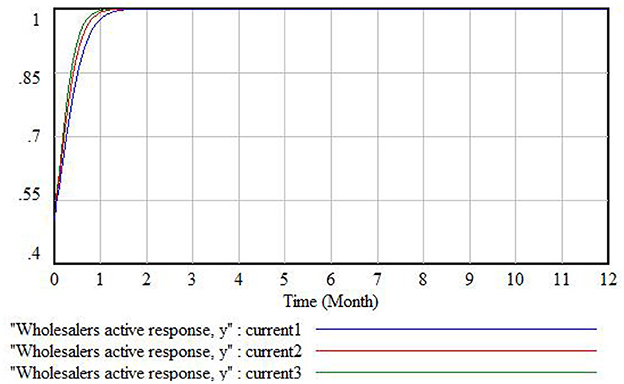
Figure 4. The impact of support intensity on wholesaler decisions.
Wholesalers can utilize the special financial subsidies they receive to optimize their operational processes, such as establishing a logistics system that matches the production and sales chain, streamlining the process of delivering fresh vegetables directly from farmers to wholesale markets, and improving operational efficiency to enhance their competitiveness. As shown in Figure 3, when the subsidy intensity increases, the expected returns from actively responding to the government's guidance significantly increase. Consequently, as the expected returns from active response increase, wholesalers' willingness to actively participate in and operate within the production and sales docking chain also increases. As illustrated in Figure 4, with the enhancement of subsidy intensity, the speed at which wholesalers converge to the active response strategy accelerates.
Figure 5 depicts the impact of different levels of financial subsidies on wholesaler decision-making. In the model, the financial subsidies are set to 2, 10, and 18. Consistent with the reasons mentioned above, as the amount of special financial subsidies increases, the convergence speed of wholesalers toward an active response strategy also increases.
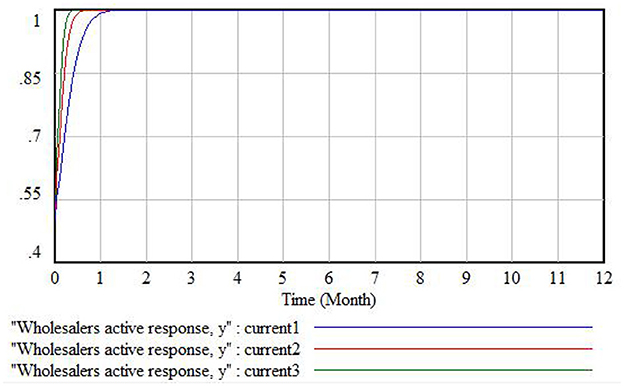
Figure 5. The impact of financial subsidies on wholesaler decisions.
In many large and mid-sized Chinese cities, local governments forge supply agreements with major vegetable—producing regions to enrich their “vegetable baskets” (Fan et al., 2021). Take Shanghai as an example: with a local self-sufficiency rate below 40%, the city proactively organizes nationwide agricultural and sideline products to enter its markets—linking “vegetable gardens” to “vegetable baskets.” Following the principle of “government sets the stage, enterprises perform, market operates, citizens benefit,” Shanghai has built a comprehensive production-marketing coordination mechanism and food-safety control system, establishing close partnerships with vegetable bases in other provinces and municipalities (Li, 2023). Since 2017, Xuzhou Municipality has implemented the Xuzhou–Shanghai Extended Vegetable Base Construction Action Plan, strictly selecting sites according to Shanghai's evaluation standards for extended-base production and operation. Sixty bases—each over 500 mu (≈33 ha)—were designated, with municipal fiscal funds actively integrated and support intensified: the city subsidizes both listed extended bases and partnering wholesalers. As a result, wholesalers' enthusiasm for targeted procurement and distribution has risen markedly, and the circulation efficiency of vegetables from Xuzhou to Shanghai has significantly improved.
4.2.2 The impact of support intensity and financial subsidies on farmers decisions
The government's support intensity for farmers is set at three levels: low, medium, and high. In the simulation model, the support intensity is set to 0.1, 0.5, and 0.8, respectively. Figure 6 illustrates the impact of different support intensities on farmers' strategies. Figure 7 shows the impact of different levels of financial subsidies on farmers' decision-making behavior, with subsidy amounts set to 2, 4, and 6 in the model.
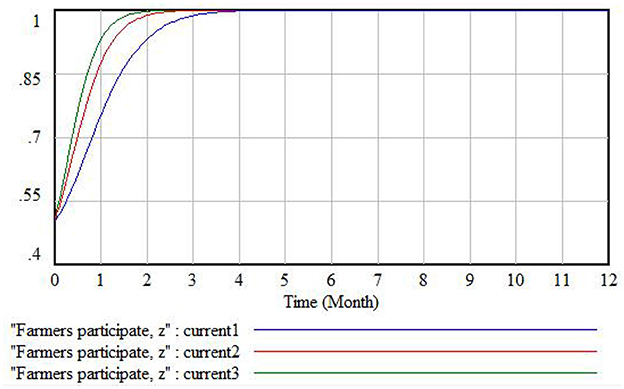
Figure 6. The impact of support intensity on farmers' decisions.
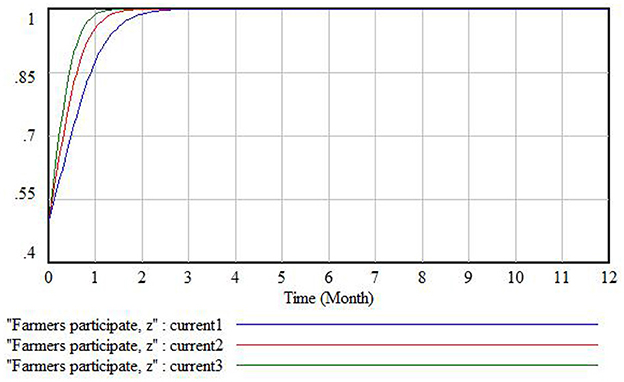
Figure 7. The impact of financial subsidies on farmers' decisions.
As shown in the figures, when the subsidy intensity increases or the financial subsidy amount rises, the convergence speed of farmers toward a stable participation state accelerates, indicating increased enthusiasm among farmers to participate in the operation of the vegetable production and sales docking chain. This is because the operation of the cross-regional vegetable production and sales docking mechanism provides farmers with a stable sales channel for their vegetable products. Additionally, with the government's support, issues such as logistics disruptions during pandemic lockdowns and price fluctuations caused by changes in vegetable production are effectively resolved. The stability of the “planting-sales” chain for farmers is greatly improved, leading to an increase in farmers' willingness to participate in the production and sales docking chain.
Taking the cooperation between Xuzhou and Shanghai as an example, by establishing extended vegetable bases, Xuzhou farmers have shifted from an “individual-farming” model to a “group-development” model. For instance, Runjia Co. in Tongshan District operates a 1,200 mu core base and has driven land transfers of over 10,000 mu in surrounding areas; more than 3,000 farmers now cultivate specialty vegetables under the company's guidance, generating an additional RMB 60 million in annual farm income. Furthermore, the government and financial institutions have collaborated to shield growers from market risk (Li, 2023). In recent years, they have piloted an Extended Vegetable Purchase-Price Index Insurance: during peak harvest periods, selected collection points monitor average farm-gate prices, and if prices fall below the year's target, the insurer triggers compensation.
4.3 The impact of regulatory intensity and penalty amounts on wholesaler and government decisions
4.3.1 The impact of regulatory intensity on wholesaler and government decisions
The government's regulatory intensity is set at three levels: low, medium, and high. In the simulation model, the regulatory intensity is set to 0.2, 0.5, and 0.8, respectively. Figure 8 shows the impact of regulatory intensity on wholesaler decisions, and Figure 9 illustrates the impact of regulatory intensity on government decisions.
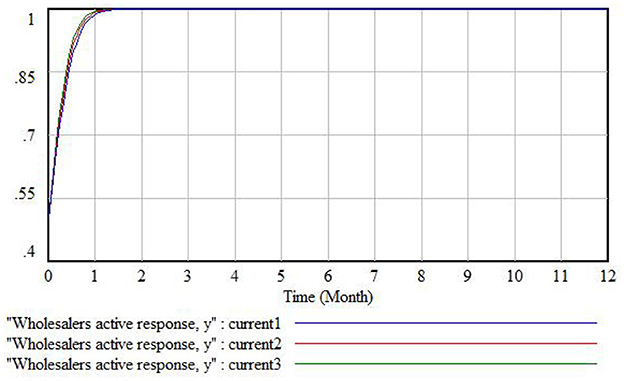
Figure 8. The impact of regulatory intensity on wholesaler decisions.
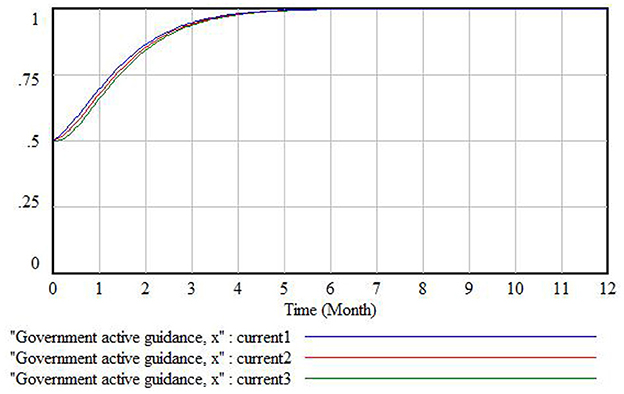
Figure 9. The impact of regulatory intensity on government decisions.
As shown in Figure 8, with the increase in regulatory intensity, the speed at which wholesalers converge to a stable state of non-active response accelerates. This indicates that stronger regulatory intensity effectively reduces wholesalers' willingness to not actively respond. This is because a higher level of government regulation not only standardizes wholesalers' operational behavior within the production and sales docking chain but also optimizes the operating environment of the chain, attracting more wholesalers to join and actively respond to the operations of the docking chain.
As illustrated in Figure 9, with the increase in regulatory intensity, the speed at which the government converges to a stable state of active guidance decreases. This suggests that stronger regulatory intensity may reduce the government's willingness to actively guide. The reason is that as regulatory intensity increases, the government's regulatory costs also raise, which in turn reduces the government's inclination to pursue active guidance.
4.3.2 The impact of penalty amounts on wholesaler and government decisions
The government's regulatory intensity is set at three levels: low, medium, and high. In the simulation model, the penalty amounts are set to 2, 8, and 14, respectively. Figure 10 shows the impact of different penalty amounts on wholesaler decisions, while Figure 11 illustrates the impact of different penalty amounts on government decisions.
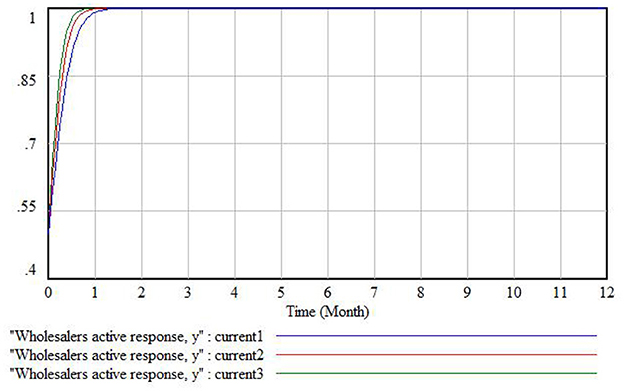
Figure 10. The impact of penalty amounts on wholesaler decisions.
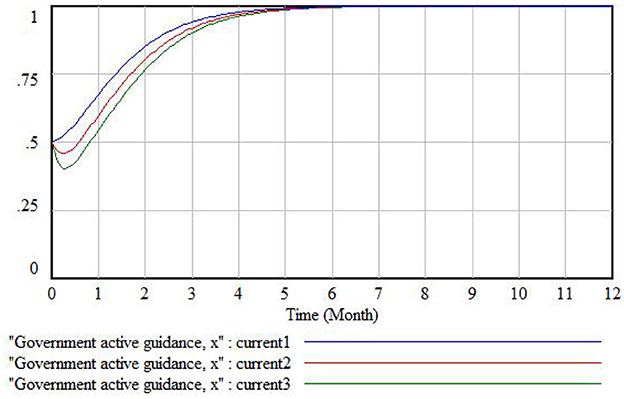
Figure 11. The impact of penalty amounts on government decisions.
As shown in Figure 10, with the increase in penalty amounts, the speed at which wholesalers converge to a stable state of active response increases. This indicates that stronger penalties enhance wholesalers' willingness to actively respond. Conversely, as shown in Figure 11, with the increase in penalty amounts, the speed at which the government converges to a stable state of active guidance decreases. This suggests that stronger penalties reduce the government's inclination to actively guide.
Moreover, the government's decision-making rate of change is slower compared to that of wholesalers. This is because the government evaluates the operational behavior of wholesalers based on changes in the production and sales docking chain environment and adjusts its strategies accordingly. As a result, the government's strategy choices exhibit a certain degree of time lag compared to those of wholesalers.
Shanghai has issued the Shanghai Extended Vegetable Base Production and Operation Evaluation Guidelines, setting criteria on base scale, crop varieties, inspection and testing, labeling, traceability functions, and video surveillance. Bases that meet these standards and commit to guaranteed supply levels during “summer lulls” and “winter lulls” may be listed as official extended vegetable production bases and enjoy preferential treatment in inspection, testing, and traceability-system development. A QR-code—based traceability system links production-circulation data with Shanghai's edible-agricultural-products traceability platform, effectively ensuring the quality and safety of vegetables supplied to the city. Strict controls on all stages—production, distribution, and sales—drive standardization, proper packaging, and consistent quality. These measures guarantee ample supply, variety, reasonable prices, and controllable safety of Shanghai's “vegetable basket.” Wholesalers and farmers participating in cross-regional docking have seen steadily rising returns and markedly reduced market risk.
4.4 The impact of costs and benefits on decision-making
4.4.1 The impact of active response costs on wholesaler decision-making
Figure 12 illustrates the impact of different active response costs on wholesaler decision-making. In the model, the costs of active response are set to 2, 4, and 6, respectively. It is observed that as the cost of active response increases, the speed at which wholesalers converge to a stable state of active response decreases.
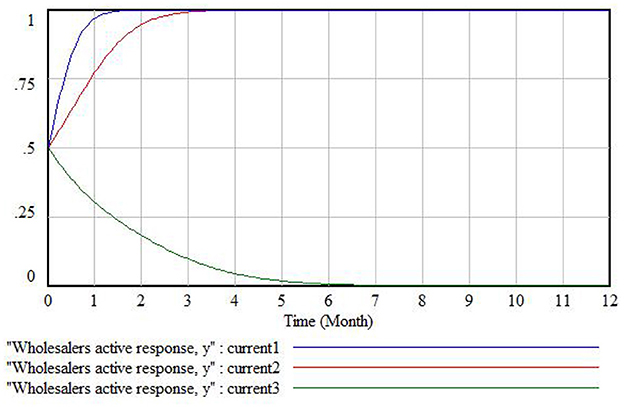
Figure 12. The impact of active response costs on wholesaler decision-making.
Furthermore, when the active response costs exceed a certain threshold, the stable strategy of the wholesaler group shifts from active response to non-active response. This indicates that higher costs discourage wholesalers from actively engaging in the production and sales docking chain, leading them to adopt a less responsive strategy to avoid the increased financial burden.
Generally, as circulation radii expand—especially in cross-province (or cross-municipality) flows—wholesalers face heightened operating risks, including transportation and price risks (Lu and Reardon, 2018). When supply exceeds demand, prices fall and the spread between production-region and consumption-region prices narrows. Prolonged price declines lead wholesalers to expect further drops and fear price reversals upon arrival, causing them to hesitate in increasing procurement volumes. This collective “wait-and-see” stance results in large vegetable backlogs at the production end, which in turn drives production-region prices down even further (Ma et al., 2019).
4.4.2 The impact of long-term cooperation benefits on wholesaler decision-making
Figure 13 illustrates the impact of different long-term cooperation benefits on wholesaler decision-making. In the model, the long-term cooperation benefits are set to 1, 3, and 5, respectively. As shown in the figure, as long-term cooperation benefits increase, the speed at which wholesalers converge to a stable state of active response accelerates. This indicates that as the long-term cooperation benefits grow wholesalers' willingness to actively respond to and participate in the production and sales docking chain also increases.
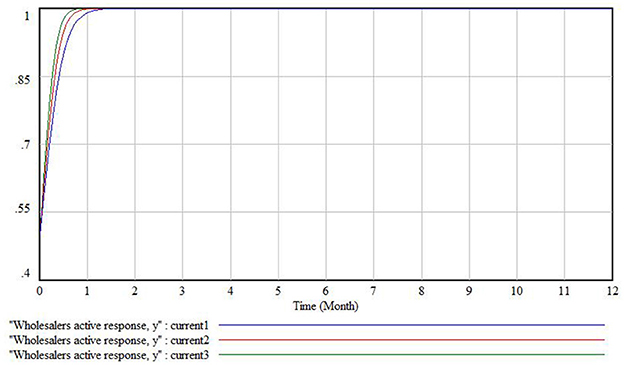
Figure 13. The impact of long-term cooperation benefits on wholesaler decision-making.
The construction of the cross-regional vegetable production and sales docking chain provides wholesalers with a long-term stable supply of vegetable products, ensuring the stability of vegetable supply. Additionally, it reduces the price premiums that typically arise in traditional wholesale models due to multiple layers of intermediaries, thereby increasing the long-term profitability for wholesalers. Consequently, as long-term cooperation benefits increase, wholesalers become more inclined to actively engage in the operation of the production and sales docking chain.
4.4.3 The impact of participation benefits and additional benefits on farmer decision-making
Figures 14, 15 illustrate the impact of different participation benefits and additional benefits on farmer decision-making. In the model, the participation benefits are set to 2.5, 3, and 3.5, while the additional benefits are set to 1, 2, and 3, respectively.
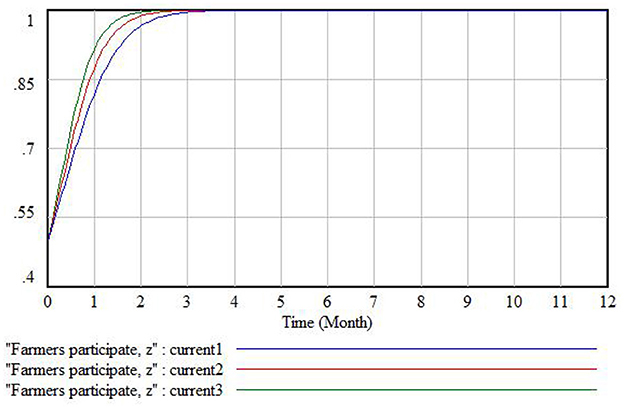
Figure 14. The impact of participation benefits on farmer decision-making.
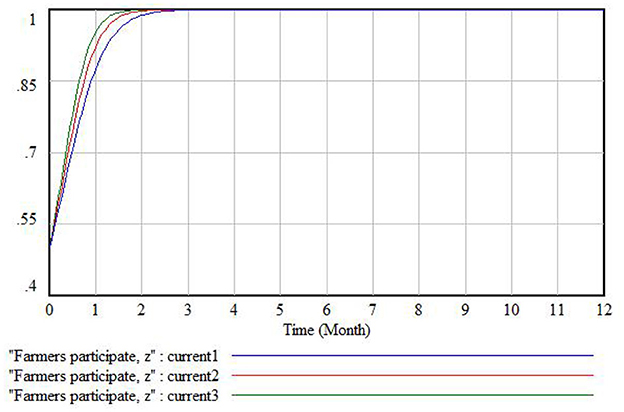
Figure 15. The impact of additional benefits on farmer decision-making.
As shown in Figures 14, 15, when participation benefits and additional benefits increase, farmers converge more rapidly toward a stable strategy of participation. This indicates that as participation and additional benefits increase, farmers' willingness to participate in the operation of the production and sales docking chain also increases.
This outcome is largely due to the fact that many vegetable farmers in China operate as small-scale, independent growers influenced by the “smallholder economy” mindset, with limited sales channels for their produce. The construction and operation of the cross-regional vegetable production and sales docking chain significantly enhance the efficiency of vegetable cultivation and supply for these farmers. It also offers higher product value-added, thus increasing farmers' willingness to participate in the production and sales docking chain.
5 Conclusion and policy recommendations
5.1 Conclusion
The construction and simulation of the “government guidance—wholesaler response—farmer participation” cross-regional vegetable production and sales chain model demonstrate that the decision-making behaviors of the government, wholesalers, and farmers collectively influence the effectiveness of the vegetable production and sales docking chain. Among these actors, the government consistently occupies a leading position, with its decisions significantly impacting the strategies of both wholesalers and farmers. The interaction between the government and farmers has a relatively smaller influence on wholesalers, whereas the interaction between the government and wholesalers has a more substantial impact on farmers.
The special financial subsidies provided by the government to guide the operation of the cross-regional vegetable production and sales docking chain effectively enhance the willingness of wholesalers and farmers to participate and operate within the chain. Farmers, in particular, are more sensitive to government subsidies compared to wholesalers. High-intensity support significantly motivates farmers to actively engage in the chain's operations, though it has a less pronounced effect on increasing wholesalers' willingness to respond actively.
Government regulation and penalties have a positive motivational effect on wholesalers' decision-making. When considering the impact of active response costs on wholesalers' behavior, moderate levels of government regulation, and penalties are most effective in encouraging wholesalers to respond actively. However, if the government's penalties are too severe, causing the cost of active response to exceed wholesalers' capacity, they may opt for a non-active response strategy. Conversely, insufficient penalties and oversight fail to restrain wholesalers' behavior, leading to a vicious cycle of non-responsiveness and the growth of undesirable practices such as subsidy exploitation, which hinders the establishment of a favorable operating environment for the cross-regional vegetable production and sales docking chain.
When wholesalers and farmers establish long-term stable cooperation, the benefits of long-term cooperation and additional gains have a positive motivational effect on both parties, with a more pronounced impact on farmers than on wholesalers. The establishment of long-term cooperative relationships is undoubtedly crucial for achieving sustained benefits for both wholesalers and farmers, and it facilitates the creation of a positive feedback loop in the operation of the cross-regional vegetable production and sales docking chain.
5.2 Theoretical expansion and implications
This study developed an evolutionary game theory model that systematically examines the interdependent decision-making processes among government entities, wholesalers, and farmers. Our approach makes two distinct contributions:
1. Dynamic interaction modeling: Captures how these actors iteratively adapt strategies and learn from each other under bounded rationality, revealing the emergent patterns in supply chain coordination.
2. Tripartite system analysis: Integrates all critical players—where (i) government provides foundational support through subsidies, regulation, and infrastructure; (ii) wholesalers supply operational momentum via logistics; and (iii) farmers form the production base.
Ensuring a balanced, all-season supply of the quantity, variety, and quality of “vegetable-basket” products in large and mid-sized cities is the core of supply-side reform. Based on ecological conditions, market demand and production cycles, it is necessary to plan and allocate each category of urban “vegetable-basket” products—covering supply volume, variety structure, and rotation schedule—and to establish a long-term docking mechanism between cities and out-of-region production bases. In practice, cross-regional docking involves not only government, wholesalers, and farmers but also cooperatives, leading enterprises, retail chains, and e-commerce platforms. In Section 3 we construct an evolutionary game model with the three core actors (government—wholesaler—farmer) to derive replicator-dynamics equations and identify ESS under a wholesaler-dominated mode. We can extend this framework to include cooperatives and e-commerce actors—showing how, for example, farmer–supermarket docking and online-agri-product models generate distinct strategy-evolution dynamics and equilibrium outcomes. By clarifying the government's direction and points of intervention—and by illustrating how “effective markets” and a “proactive government” can coordinate governance—our analysis provides concrete policy levers for promoting high-quality development of urban “vegetable-basket” supplies.
5.3 Policy recommendations
The government should take a leading role in the operation of the vegetable production and sales docking chain, actively guiding the decision-making behavior of wholesalers and farmers.
Increase support for wholesalers and farmers: Financial support through special fiscal subsidies can enhance the confidence of wholesalers and farmers in operating the production and sales docking chain. However, such support may foster dependency and might not fundamentally improve the profitability and efficiency of businesses and farmers. Therefore, in addition to tax policy incentives, the government should actively establish a regional vegetable production and sales fund and collaborate with rural credit cooperatives, policy banks, and other financial institutions to introduce special credit preferential policies. These measures will help remove financial barriers for wholesalers and farmers to participate in and operate the cross-regional vegetable production and sales docking chain, while also fostering a self-sustaining business mentality and enhancing operational capabilities. This will ensure the long-term stability and sustainability of their participation.
Leverage information technology to improve market information flow and early warning mechanisms: The government should take responsibility for monitoring and updating market information to enhance information symmetry and transparency. By utilizing modern information technologies, such as the Internet of Things (IoT) and blockchain, the government can establish a big data platform for the vegetable market. This platform would improve the flow and transparency of market information, enabling real-time communication of vegetable price fluctuations across different regions and stages of the supply chain, thereby eliminating information silos and enhancing the supply-demand linkages across regions and seasons (Zhang, 2023). On this basis, a comprehensive vegetable market analysis and early warning mechanism should be established to help wholesalers and farmers mitigate market risks in advance and better plan their production and sales activities.
Strengthen human resources in vegetable production: Farmers, as the weaker party in the production and sales chain, are heavily influenced by the decisions of the government and wholesalers, with limited power to influence the actions of others. Therefore, the government should actively integrate and introduce agricultural production and management talent to vegetable production areas. By implementing talent introduction policies, the government can enhance the endogenous growth momentum of farmers' production capabilities, thereby improving the professionalism of the production and sales docking chain.
Implement appropriate regulation and penalties: The government should establish a reasonable behavioral evaluation system and set clear standards for entry and operation in the vegetable market. This system should include monitoring and penalties for breaches of contract or subsidy exploitation by wholesalers, ensuring the healthy operation of the vegetable market. In the wholesale model, where farm gate prices are lower than market prices, the profit margins for farmers are often slim. Therefore, it is essential to monitor the situation in real time to prevent wholesalers from excessively transferring operational costs to farmers, ensuring that farmers retain a fair and reasonable profit margin.
Establish a safe and efficient logistics, warehousing, and cold chain system: An efficient logistics, warehousing, and cold chain system is crucial for ensuring the quality and transportation efficiency of vegetables within the production and sales docking chain. However, the cost of building a logistics, warehousing, and cold storage network is high. While wholesalers and farmers may prefer to establish their systems for greater autonomy, the associated construction and management costs can be prohibitive. Therefore, it is necessary to involve third-party logistics, warehousing, and cold chain companies to integrate resources, control costs, and enhance the efficiency of these services (Yang et al., 2023). The government should lead the development of standardized logistics, warehousing, and cold chain service regulations, creating a unified and market-oriented service system.
Additionally, the government should monitor the implementation of relevant policies to ensure a healthy and sustainable operational cycle for the cross-regional vegetable production and sales docking chain.
5.4 Limitations and future research
This paper employs evolutionary game theory to simulate the process of cross-regional production–marketing integration and derives several key insights. However, it has the following limitations. First, the parameterization of the evolutionary game's payoff matrix does not encompass all factors that influence the efficient and stable operation of the integration chain. Second, owing to constraints on survey subjects and field conditions, the assigned parameter values in the payoff matrix are only approximate and lack empirical validation. Addressing these gaps will be the focus of future work. Subsequent research will undertake comprehensive field investigations of the actual operation of vegetable production–marketing integration in major urban markets, with the aim of identifying the critical levers and optimal directions for fostering a stable and scalable integration system.
Data availability statement
The original contributions presented in the study are included in the article/supplementary material, further inquiries can be directed to the corresponding author.
Author contributions
NW: Conceptualization, Methodology, Writing – original draft. FL: Investigation, Visualization, Writing – original draft. LZ: Funding acquisition, Project administration, Writing – review & editing.
Funding
The author(s) declare that financial support was received for the research and/or publication of this article. This work was supported by the National Social Science Foundation of China: “Spatial Structure, Market Docking, Optimization and Regulation of the Supply of ‘Vegetable Basket' Products in Large and Medium-sized Cities under the Perspective of Domestic General Circulation” (22BJY258).
Acknowledgments
We would like to express our sincere gratitude to all those who contributed to this research, and we appreciate the valuable feedback and support provided by our colleagues and mentors throughout this study.
Conflict of interest
The authors declare that the research was conducted in the absence of any commercial or financial relationships that could be construed as a potential conflict of interest.
Generative AI statement
The author(s) declare that no Gen AI was used in the creation of this manuscript.
Publisher's note
All claims expressed in this article are solely those of the authors and do not necessarily represent those of their affiliated organizations, or those of the publisher, the editors and the reviewers. Any product that may be evaluated in this article, or claim that may be made by its manufacturer, is not guaranteed or endorsed by the publisher.
References
Abolhasani, S., Taleai, M., and Lakes, T. (2023). Developing a game-theoretic interactive decision-making framework for urban land-use planning. Habitat Int. 141:102930. doi: 10.1016/j.habitatint.2023.102930
Baraka, B., Mburu, J., and Muriithi, B. (2021). Transaction costs magnitudes, market participation, and smallholder profitability in rural-urban vegetable supply chain. Int. J. Veg. Sci. 27, 54–64. doi: 10.1080/19315260.2019.1700204
Bendinelli, W. E., Su, C. T., Péra, T. G., and Filho, J. V. C. (2020). What are the main factors that determine post-harvest losses of grains. Sustain. Prod. Consum. 21, 228–238. doi: 10.1016/j.spc.2019.09.002
Bera, S., and Giri, B. C. (2023). Evolutionary game analysis for non-cooperative behavior of entities in a closed-loop green supply chain under government intervention. Soft Comput. 27, 17785–17808. doi: 10.1007/s00500-023-09060-5
Bolívar, J., Cantillo, V., and Miranda, P. (2025). Agri–food supply chain design for perishable products: application to small-scale farmers. Oper. Res. Int. J. 25:26. doi: 10.1007/s12351-024-00878-x
Cao, X., Xing, Z. Y., and Zhang, L. P. (2018). Evolutionary game analysis of new energy vehicle industry development under government regulation. Manage. Rev. 30, 82–96. doi: 10.14120/j.cnki.cn11-5057/f.2018.09.008
Chen, M. W., Wang, F., and Lu, Y. Q. (2020). Analysis of problems and countermeasures in vegetable production-marketing linkage. Chin. Fruits Veg. 40, 69–71. doi: 10.2991/978-94-6463-542-3_33
Crippa, M., Solazzo, E., Guizzardi, D., Monforti-Ferrario, F., Tubiello, F. N., and Leip, A. (2021). Food systems are responsible for a third of global anthropogenic GHG emissions. Nature Food 2, 198–209. doi: 10.1038/s43016-021-00225-9
Fan, S. G., Headey, D., Rue, C., and Thomas, T. (2021). Food systems for human and planetary health: economic perspectives and challenges. Ann. Rev. Resour. Econ. 13, 131–156. doi: 10.1146/annurev-resource-101520-081337
Fu, S. S., Chen, W. D., and Ding, J. F. (2020). Multi-agent game and simulation of government influence on the development of “Farm-Supermarket Direct-Purchase”. Complex Syst. Complex. Sci. 17, 52–61. doi: 10.13306/j.1672-3813.2020.03.005
Jin, B. Z., and Xu, X. J. (2024). Machine learning coffee price predictions. J. Uncertain Syst. 17:2450023. doi: 10.1142/S1752890924500235
Jin, B. Z., Xu, X. J., and Zhang, Y. (2025). Peanut oil price change forecasts through the neural network. Foresight 27, 595–612. doi: 10.1108/FS-01-2023-0016
Jin, S., Qiao, N., Khan, M. A. S., and Zhu, C. C. (2024). Promoting the production and consumption of green products from the perspective of supply and demand: an evolutionary game-based analysis. Environ. Dev. Sustain. 26, 23193–23213. doi: 10.1007/s10668-023-03596-0
Li, G. J. (2023). Problems and thoughts on vegetable supply under the COVID-19 in Shanghai. Chin. Veg. 2, 11–15. doi: 10.19928/j.cnki.1000-6346.2023.1005
Li, G. Y., Wu, S. H., You, H. Y., and Wang, C. C. (2025). Governments' behavioral strategies in cross-regional reduction of inefficient industrial land: learned from a tripartite evolutionary game model. Human. Soc. Sci. Commun. 12:697. doi: 10.1057/s41599-025-04822-y
Liu, D. Y., Zhang, Y., and Wang, D. C. (2012). Current status and strategies for the production-marketing connection mechanism in the vegetable industry. North. Horticult. 12, 194–196.
Lu, L., and Reardon, T. (2018). An economic model of the evolution of food retail and supply chains from traditional shops to supermarkets to E-commerce. Am. J. Agric. Econ. 100, 1320–1335. doi: 10.1093/ajae/aay056
Ma, X. C. (2020). The dilemmas and solutions for Beijing's vegetable industry development. Econ. World 5, 14–18.
Ma, X. L., Wang, S., Islam, S. M. N., and Liu, X. (2019). Coordinating a three-echelon fresh agricultural products supply chain considering freshness-keeping effort with asymmetric information. Appl. Math. Model. 67, 337–356. doi: 10.1016/j.apm.2018.10.028
Maleki, J., Masoumi, Z., Hakimpour, F., and Coello Coello, C. A. (2020). A spatial land-use planning support system based on game theory. Land Use Policy 99:105013. doi: 10.1016/j.landusepol.2020.105013
Weerabahu, S. K., Samaranayake, P., Dasanayaka, S. W. S., and Wickramasinghe, C. N. (2022). Challenges of agri-food supply in city region food systems: an emerging economy perspective. J. Agribus. Dev. Emerg. Econ. 12, 161–182. doi: 10.1108/JADEE-01-2021-0004
Yang, J. H., Wang, X., and Wang, Y. Y. (2023). Research on cold chain logistics development of agricultural products under the new retail background. Chin. Storage Trans. 3, 182–183. doi: 10.16301/j.cnki.cn12-1204/f.2023.03.075
Zhang, H. (2023). How digital information technology mitigates agricultural product price fluctuations: a circulation perspective based on the domestic large market. Finance Trade Res. 34, 55–66. doi: 10.19337/j.cnki.34-1093/f.2023.01.005
Zhang, L., Wang, N., and Zhao, S. (2013). A study on consumer behavior in small-medium cities and the layout of fresh agricultural product retail terminals: a case of vegetable retail terminals in Yantai, Shandong. Issues Agricult. Econ. 34, 74–81. doi: 10.13246/j.cnki.iae.2013.06.013
Zhang, L. Q. (2003). On evolutionarily stable strategies. Econ. Rev. 2, 70–74. doi: 10.19361/j.er.2003.02.015
Zhang, Y. Q., Zhang, L. Y., and Zhang, T. (2021). Analysis of problems and countermeasures in vegetable production-marketing linkage. Vegetables 34–36. doi: 10.15541/jim20210901
Keywords: cross-regional production, marketing docking, evolutionary game, simulation analysis, big cities
Citation: Wang N, Liu F and Zhang L (2025) Mechanism and simulation analysis of cross-regional vegetable production and marketing docking in big cities based on evolutionary game. Front. Sustain. Food Syst. 9:1560865. doi: 10.3389/fsufs.2025.1560865
Received: 15 January 2025; Accepted: 15 June 2025;
Published: 09 July 2025.
Edited by:
Durgesh Nandan, SR University, IndiaReviewed by:
Chongsen Ma, Changsha University of Science and Technology, ChinaTheodore Tarnanidis, International Hellenic University, Greece
Copyright © 2025 Wang, Liu and Zhang. This is an open-access article distributed under the terms of the Creative Commons Attribution License (CC BY). The use, distribution or reproduction in other forums is permitted, provided the original author(s) and the copyright owner(s) are credited and that the original publication in this journal is cited, in accordance with accepted academic practice. No use, distribution or reproduction is permitted which does not comply with these terms.
*Correspondence: Na Wang, bGR1d25AbGR1LmVkdS5jbg==