 Jianyu Liu1,2†
 Kai Kang3†
 Lin Lu1,4*
 Ruihai Dong5,6*
 Xiaochun Luo5*
 Chaoling Li1
 Ping Long1Xiangjun Yang1
 Siyi Mao1
- 1School of Economics and Management, Guangxi Normal University, Guilin, China
- 2Jinan Liangong Testing Technology Co., Ltd., Jinan, China
- 3Business School, Nanjing University of Information Science and Technology, Nanjing, China
- 4Key Laboratory of Digital Empowerment Economic Development, Guangxi Normal University, Guilin, China
- 5School of Economics and Management, Nanjing University of Aeronautics and Astronautics, Nanjing, China
- 6China Petroleum & Chemical Corporation, Shandong Petroleum Branch, Jinan, China
In the context of demand disruption, food supply chain resilience not only helps enterprises maintain stability in the face of uncertainty and risk but also enables them to better satisfy customer demand, reduce costs, enhance competitiveness, and promote sustainable development. In order to analyze the resilient input and coordination of the food supply chain under the risk of demand disruption. This paper uses game theory as the methodological basis of the research to construct a game model between manufacturers and retailers. This model considers the impact of different demand interruption risks and product order quantities on food supply chain resilience input, manufacturer profits, and retailer profits. And analyzed the coordination mechanism of cost sharing contracts and revenue sharing contracts on the food supply chain. The results show that, under the risk of demand disruption, the cost-sharing contract is more suitable than the benefit-sharing contract for harmonizing the profits of food supply chain parties. Furthermore, the manufacturer's profit is negatively related to the probability of demand disruption, while the retailer's profit is positively related to this probability when the product order quantity is low, but negatively related when the product order quantity is high. food supply chain resilience input are positively correlated with the probability of demand disruption. Furthermore, during sensitivity analysis, the profits of both the manufacturer and retailer exhibit a U-shaped fluctuation, initially decreasing and then increasing, as the capacity restoration factor grows.
1 Introduction
Against the backdrop of globalization and geopolitical turbulence, the food supply chain has become a highly complex, multi-level interconnected system engineering. From farm to table, it involves multiple links such as raw material procurement, processing and manufacturing, logistics distribution, and terminal sales. Any interruption at any node may trigger the “bullwhip effect,” leading to inventory imbalance, rising costs, and even market shortages (Gonçalves et al., 2023). In recent years, the frequent occurrence of extreme weather events, public health crises, and geopolitical conflicts has made demand disruption risk one of the core challenges in food supply chain management (Maria et al., 2023). This type of “black swan” event has high unpredictability, non-linear effects, and far-reaching consequences. Once it occurs, it will quickly spread to the entire supply chain network, exposing the vulnerability of traditional management models (Sunil et al., 2023).
To address this challenge, supply chain resilience is widely regarded as a key strategic capability, which refers to the system's ability to quickly respond, recover, and adapt to external shocks (Adela et al., 2023). A large amount of research has focused on improving supply chain resilience, mainly in two directions: one is to enhance risk resistance through operational means such as inventory buffering, multi-source procurement, and digital monitoring (Amirhossein et al., 2023); the second is to achieve supply chain coordination through contract design (Qiao and Zhao, 2023).
However, there is a significant disconnect between theory and practice in existing research. Most models assume that demand is a stable or stationary stochastic process, ignoring the non-linear characteristics of “abrupt” demand interruptions (Dong et al., 2019). For example, although Thanh et al. (2023) explored inventory strategies under uncertainty, they still rely on the assumption of normal distribution, which makes it difficult to reflect the reality of “cliff like” demand decline or “explosive” surge; the research on resilience cost investment mostly focuses on single subject decision-making, lacking in-depth analysis of the game relationship between manufacturers and retailers. Xiang et al. (2023) pointed out based on empirical data from small and medium-sized enterprises that companies generally recognize the importance of resilience investment, but in practice, it is often difficult to implement due to uneven cost sharing and vague responsibilities; the order quantity is often simplified as a key decision variable. Existing literature often assumes that order volume is exogenous or a linear function, neglecting its moderating effect on investment incentives in different risk scenarios. Pertheban et al. (2023) pointed out that order size directly affects a company's risk tolerance, but there has been no systematic modeling of its interaction effect with interruption risk.
More importantly, although cost sharing and revenue sharing contracts have been widely discussed (Barbara et al., 2023), under what order size and interruption probability are these contracts effective? Are manufacturers willing to support retailers in high-risk situations? These issues still lack theoretical support. In response to the research gap mentioned above, this paper constructs a food supply chain resilience cost input model based on the Stackelberg game framework, focusing on how the interaction between product order quantity and demand interruption risk affects the decision-making behavior of manufacturers and retailers. This article aims to answer the following two core questions:
RQ1: What is the optimal resilience investment cost and profit performance of manufacturers and retailers under different order quantities and interruption risks?
RQ2: Can cost sharing and revenue sharing contracts effectively coordinate the supply chain? How does its effectiveness vary with order size and interruption probability?
This study has made three progressive contributions in the field of resilience management in the food supply chain, corresponding to innovation in modeling methods, integration of multidimensional variables, and discovery of theoretical mechanisms. Firstly, there is innovation in modeling methods: constructing a “order risk” dual dimensional resilience investment decision framework. This article proposes a new Stackelberg game model that explicitly incorporates resilience investment costs into the expected profit functions of manufacturers and retailers, breaking through the limitations of traditional research that considers resilience as an exogenous capability or qualitative indicator. Secondly, there is the contribution of variable integration: a joint analysis that integrates order quantity, interruption probability, and contract mechanism. Existing literature usually studies a certain variable in isolation, and this article achieves the systematic integration of three key variables for the first time. This framework is closer to real-life decision-making scenarios, where companies not only need to assess the probability of risk, but also need to decide whether to invest in resilience based on order size and select appropriate contract forms; finally, provide boundary conditions for the applicability of the contract. Through sensitivity analysis, clarify the coordination advantages of cost sharing contracts in the low high order range, and provide decision-making tools for managers. This study not only enriches the theoretical system of resilience management in the food supply chain, but also provides practical guidance for policy makers and enterprises on when and how to implement cost sharing mechanisms.
2 Literature review
2.1 Research on supply chain decision making under demand interruption: focusing on operations and pricing
Demand disruption refers to a sudden change in consumer demand caused by unforeseeable events such as natural disasters, public health events, or severe market fluctuations. Its characteristics are suddenness, non-linearity, and high uncertainty (Wu et al., 2023). Current research mainly focuses on two core decisions: pricing and production, and procurement and inventory management.
In terms of pricing and production decision-making, scholars widely use game theory models to analyze strategy adjustments under interruption scenarios. For example, Yan et al. (2021) studied the decentralized decision-making and coordination mechanism of dual channel supply chains under demand interruption; Pi et al. (2019) explored competitive pricing strategies between a manufacturer and two retailers; Zhai et al. (2022) analyzed the robustness of service investment and pricing under different power structures and found that decision-making is stable under slight disturbances. However, most of these studies assume that the degree of interruption is exogenously given or linearly changing, and that order volume is considered a fixed or exogenous variable, failing to reflect its moderating effect in risk response.
In terms of procurement and inventory decision-making, research focuses on how to cope with uncertainty through inventory strategies: He and Wang (2012) proposed a production inventory plan based on interruption time for deteriorating products; Ray and Jenamani (2016) used the newsboy model to analyze the impact of risk preference on procurement decisions; Pathy and Rahimian (2023) proposed a flexible inventory strategy for the pharmaceutical supply chain to cope with demand fluctuations. Although these studies consider uncertainty, most of them are still based on the assumption of steady or normal distribution (Schmidt and Raman, 2022), ignoring the cliff like decline or explosive growth of demand under “black swan” events, and failing to incorporate elastic investment costs into the decision-making framework.
2.2 Research on supply chain resilience: from capability building to coordination mechanisms
Supply chain resilience is defined as the ability of a system to absorb shocks, respond quickly, and resume operations (Ghadafi et al., 2023), and is a dynamic capability that encompasses preparation, response, recovery, and growth (Hendrik et al., 2023). Current research mainly focuses on three dimensions: research on influencing factors. Scholars have identified key factors that affect resilience, such as information sharing (Ge et al., 2020), collaborative networks (Asamoah et al., 2022), agility and adaptability (Soni et al., 2014), and so on. Vipul et al. (2017) constructed an evaluation framework consisting of 13 elements, emphasizing the role of trust and visibility. In terms of internal mechanism analysis. The study used methods such as Explanatory Structural Modeling (ISM) and Bayesian Networks to reveal the interdependence between factors (Luiz et al., 2021; Kumar et al., 2022). However, these studies are mostly qualitative or empirical analyses, lacking quantitative modeling of the trade-off between investment costs and returns.
In the research of coordinated decision-making and game models. Lyu et al. (2023) studied enhancing resilience in the shipping supply chain through capacity allocation and pricing; Ye et al. (2024) analyzed the equilibrium strategies of ports and carriers in uncertain environments; Rajabzadeh and Babazadeh (2022); Rajabzadeh et al. (2024) explored the impact of procurement strategies on energy and global supply chain resilience. Although these studies introduce game theory frameworks, there are generally limitations: Soni et al. (2014) and Lyu et al. (2023) ignore the moderating effect of order quantity, and most models assume that order quantity is exogenous or constant, without considering its impact on supply chain coordination. Zhai et al. (2022) and Ray and Jenamani (2016) did not endogenize the interruption probability. Interruption is regarded as a binary event of whether it occurs or not, lacking modeling of the interaction effect between interruption probability and investment level. Rajabzadeh and Wiens (2024) and Ge et al. (2020) only analyzed a single contract type (such as revenue sharing), lacking a comparison of the effectiveness of cost sharing vs. revenue sharing in different contexts. Vipul et al. (2017) and Kumar et al. (2022) lack a quantitative framework for “investment return.” The lack of clear inclusion of resilience investment costs in the profit function makes it difficult to evaluate the economic feasibility of supply chain resilience investment costs.
In summary, there is a significant research gap in the resilience of the food supply chain. The literature gap between different authors is shown in Table 1. Although demand disruption and supply chain resilience have become important issues in supply chain management, there are still significant theoretical gaps in existing research. Specifically, most resilience research focuses on capacity building, but lacks economic modeling for cost investment decisions in supply chain resilience; research on demand interruption often focuses on pricing and inventory, neglecting the role of resilience cost investment as a strategic response tool; the number of orders, as a key variable affecting a company's risk tolerance, is often simplified in existing game models. Therefore, this article aims to fill this gap by constructing a Stackelberg game model that integrates the division of order quantity intervals, endogeneity of interruption probabilities, and resilience input cost functions, to analyze the coordination effects of cost sharing and revenue sharing contracts in different risk scenarios. This article not only responds to the empirical findings of Xiang et al. (2023) on the resilience investment dilemma of small and medium-sized enterprises, but also provides a theoretical explanation for the “selective support” behavior proposed by Zhai et al. (2022) and Wu et al. (2023).
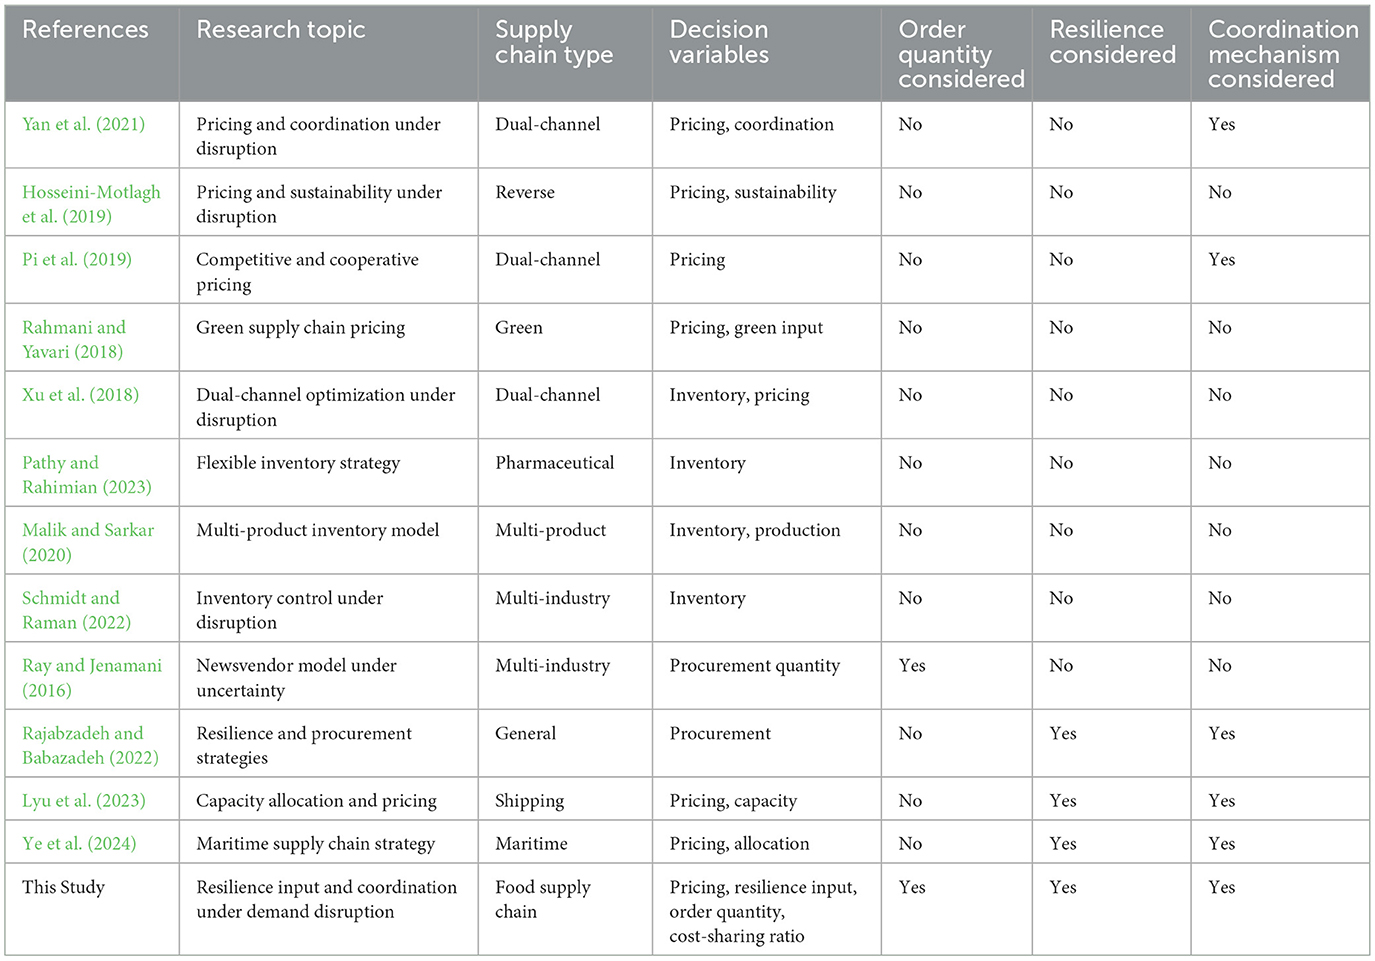
Table 1. Comparison of research literature by different authors.
3 Model construction and game decision model analysis
The Stackelberg Model, also known as the Stackelberg Game, is a game theory model used to describe the decision-making process in a market or supply chain with a leader-follower relationship (Chen et al., 2025); it was first proposed by the German economist Heinrich Freiherr von Stackelberg in the 30s of the twentieth century and is mainly used to analyze the behavior of oligopoly markets (Yao et al., 2023). The Starkerberg model differs from Nash equilibrium in that it assumes that there is an asymmetrical information or power structure between actors, i.e., that one actor (the leader) is able to act first and influence the decision-making of the other actor (the follower) based on his actions (Yang et al., 2025). This setting is particularly applicable to scenarios such as manufacturer-retailer relationships in supply chain management, and interactions between policymakers and other market players. In a Stackelberg game, one participant may have the advantage or disadvantage of being the first move, depending on the assumptions in the specific game (Chen et al., 2025).
3.1 Problem description and modeling assumptions
Because of the disruptive nature and uncertainty of supply chain risks, the problem of demand disruptions arises when unexpected events occur due to force majeure. A manufacturer produces a single type of product and sells it to a retailer at a wholesale price w. The retailer sells the product at a price p in the end market, and its unit production cost is c. At the same time, the industry in which the supply chain operates is a typical procyclical industry, and its market demand is highly susceptible to external systemic risk factors such as macroeconomic conditions, trade conflicts, and the spread of the COVID-19 pandemic, resulting in the probability of localized demand disruptions, denoted as λ. In the event of a demand disruption, the retailer will not be able to sell its products. Therefore, the retailer needs to invest in supply chain resilience in order to restore normal product delivery. Based on this, this paper investigates whether and how the manufacturer can assist the retailer in achieving timely product delivery through cost-sharing contracts under the risk of demand disruption. This study focuses on a secondary supply chain consisting of a single manufacturer and a single retailer. The manufacturer and the retailer are in a single-source supply relationship.
The basic assumptions of this paper are as follows:
Hypothesis 1: It can be assumed that demand is a known constant d, that both the manufacturer and the retailer are risk neutral, that information is shared between the manufacturer and the retailer, that both seek to maximize their expected profits, and that the manufacturer will send the goods to the retailer after completing all orders.
Hypothesis 2: There is a Stackelberg game between the manufacturer and the retailer, where the former is the leader and the latter is the follower.
Hypothesis 3: Manufacturers are vulnerable to demand disruptions due to uncertainty shocks. Assume that the probability of demand disruption is λ, and the probability that no demand disruption occurs is 1-λ.
Hypothesis 4: Due to the uncertainty of capacity recovery ability after demand disruptions, let α be a random variable following a binomial distribution representing the level of supply chain recovery. After the supply chain makes a resilience input, there is a ξ probability of achieving a higher capacity recovery level αH and a 1 − ξ probability of achieving a lower capacity recovery level αL, resulting in a capacity recovery level Eα = (1 − ξ)aL + ξaH.
Hypothesis 5: In order to maximize the level of capacity restoration to meet demand, while considering the costs of resilience inputs vs. production costs, the level of capacity restoration will not exceed the condition where d < αLe.
Hypothesis 6: For consumers in the market, a recovery of αe is available, and there may be a gap between this recovery and the actual demand d. When the actual recovery is less than the actual demand, the retailer will have to face stock-out losses. Assuming that each unit of out-of-stock results in a loss of μ in profit, the retailer's stock-out loss is μ(d-αe)+. When the actual supply exceeds the actual demand, the manufacturer will generate surplus products. Assuming that each unit of surplus product has a salvage value of s, the manufacturer's return on surplus product is s(αe-d)+.
The symbols and their meanings in the model are shown in Table 2.
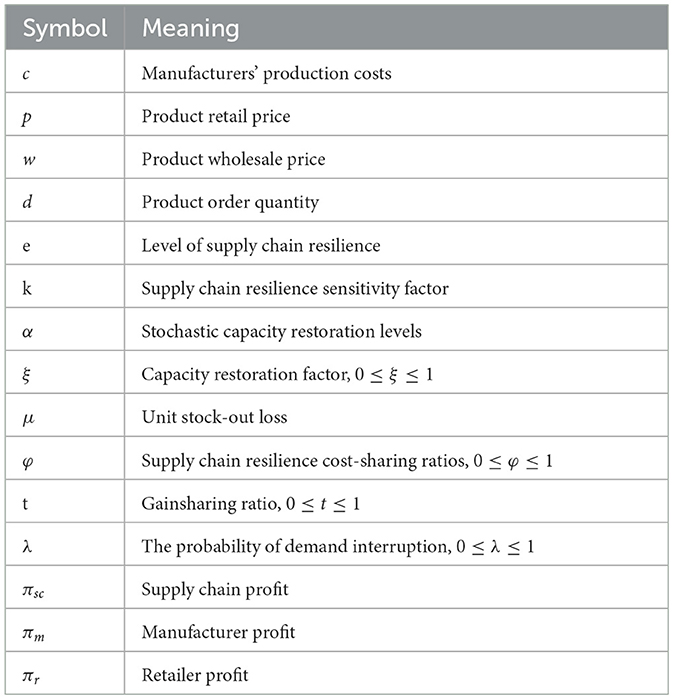
Table 2. Symbols and their meanings.
3.2 Decentralized decision making model under demand disruption risk (M model)
This subsection constructs a decision model (referred to as Model M) in which the retailer makes independent resilience inputs to explore the changes in profits of each participant in the supply chain under this scenario. To investigate the impact of demand disruption risk on the profits and resilience inputs of each participant in the supply chain, the constructed profit functions for the manufacturer and retailer are as follows:
3.2.1 Retailer profit decision model
To find the optimal solution for the supply chain resilience input level e, the retailer profit function is simplified as:
The retailer profit is derived using the Lagrangian function and its K-T conditions, yielding the following results:
The supply chain's resilience input level e and the retailer profit πr can then be obtained as:
Depending on the level of capacity recovery in the supply chain, the resilience input level e exhibits different strategies across various product ordering quantities d, and it tends to increase with the ordering quantity. This trend aligns with real-world practices, as firms continually seek a balance between profits and input costs. When the product ordering quantity is very small, both , the consumer's needs can be satisfied with a lower capacity recovery capacity αL. Specifically, when the order quantity reaches , the retailer's resilience input level is ; at an order quantity of , the supply chain's resilience input level is . Once the order quantity d exceeds , the retailer's resilience input level stabilizes at . It is noteworthy that the retailer's optimal resilience input level is influenced by several factors, including the capacity recovery coefficient ξ, retail price p, wholesale price w, unit stockout loss u, the supply chain's capacity recovery level αi, and the sensitivity coefficient k regarding resilience input costs. Overall, the supply chain resilience input level displays a wave-like trend as the product order quantity increases.
3.2.2 Manufacturer profit decision model
Based on the previous analysis, the manufacturer's profit function can be simplified as:
Entering the resulting supply chain resilience input level e into the equation yields a manufacturer's profit of:
From the above results, it is clear that the profitability of a manufacturer without sufficient incentives is directly related to the level of capacity recovery in the supply chain. The greater the supply chain's capacity resilience, the lower the risk of profit erosion due to demand disruptions for manufacturers. A notable turning point occurs when the out-of-stock losses suffered by retailers reach a critical mass, prompting manufacturers to proactively invest in resilience in order to help retailers meet consumer demand. The profound impact of key parameters such as product order quantity d, production cost c, wholesale price w, and capacity restoration level αi. Given the difficulty for manufacturers to predict changes in retailers' actual product demand, by sharing part of the cost of retailers' resilience inputs, the two parties can build an informative and transparent cooperation framework that effectively relieves retailers' financial pressure. This type of cooperation not only inspires retailers to scale up product deliveries, but also may achieve win-win Pareto optimization for both parties without sacrificing the interests of either party.
3.3 Centralized decision-making model under demand disruption risk (C model)
In this subsection, the manufacturer and the retailer are regarded as one decision subject, and the supply chain as a whole is taken as a benchmark model, the overall revenue of the supply chain is equal to the sum of the retailer's sales revenue and salvage value minus the manufacturer's manufacturing cost and the out-of-stock cost, and the model of the overall supply chain's profitability decision under coordinated decision making (referred to as Model C) is as follows:
In order to find an optimal solution for the supply chain resilience input level (e), the supply chain profit function is simplified as:
The supply chain profit is solved by the Lagrangian function and its K-T condition with the following results:
Subsequently, the resilience input level (e) of the supply chain and the overall profit (πsc) of the supply chain can be obtained as:
In the centralized model, when the product order quantity is very small, the retailer can be satisfied with a lower capacity recovery level (αL) without being influenced by the order quantity. The optimal product delivery quantity for the retailer is denoted as . This delivery quantity is influenced by various factors, including the capacity recovery factor (ξ), selling price (p), production cost (c), capacity recovery level (αi), and product salvage value (s). Conversely, when the product order quantity is large, a higher capacity recovery level (aH) is necessary to meet demand, resulting in an increased input level for supply chain resilience as the order quantity grows. When the order quantity exceeds , the resilience input level becomes fixed at , determined by the capacity recovery coefficient (ξ). At this stage, the resilience input level (e) shows a positive correlation with the selling price (p), recovery level (αi), and out-of-stock loss (u), while demonstrating a negative correlation with the production cost (c) and the sensitivity coefficient (k) of supply chain resilience input costs.
When product order quantities are low, manufacturers and retailers can ensure full order fulfillment by increasing inputs to supply chain resilience. However, the required inputs for supply chain resilience are significantly reduced compared to the optimal recovery level in high-demand scenarios. This is because, when order quantities are small, the supply chain itself possesses sufficient redundancy and flexibility to meet demand without incurring additional high recovery costs, thereby diminishing the urgency to proactively enhance capacity resilience. In summary, the inherent resilience of the supply chain is adequate to cover demand under low-demand conditions, which reduces the motivation to pursue higher capacity resilience.
3.4 Revenue sharing decision model under demand disruption risk (M-R model)
A revenue sharing contract is a supply chain coordination mechanism that aims to optimize overall performance by adjusting the distribution of benefits among the various parties involved in the supply chain. Such contracts allow different members of the supply chain to share a share of the revenue from sales, thereby incentivizing all participants to work together to improve the efficiency and profitability of the entire supply chain. According to the idea of revenue sharing, in the Coordinated Decision Model (referred to as M-R), let the manufacturer bear a proportion (φ) of the resilience input cost, and the manufacturer's profit function under this contract can be expressed as follows:
3.4.1 Modeling retailer profit decisions under revenue-sharing contract
In order to derive the optimal solution for the supply chain resilience input level (e), the retailer's profit function is simplified as follows:
The retailer's profit is derived using the Lagrangian function and its K-T conditions, yielding the following results:
The resilience input level (e) of the supply chain and the profit (πr) of the retailer can then be obtained as follows
In comparison to the scenario where the revenue-sharing contract is not implemented, we examine two cases of very small and very large product ordering quantities, referred to as and . At this point, the supply chain resilience levels are represented by and , respectively. The supply chain resilience level is directly proportional to the product ordering quantity and inversely proportional to the capacity recovery level. However, when considering and , the supply chain resilience levels at this time are denoted as and , respectively. These resilience levels are influenced by factors such as the capacity recovery coefficient, the level of capacity recovery, and the retail price.
3.4.2 Modeling manufacturers' profit decisions under revenue-sharing contract
Based on the previous analysis, the manufacturer's profit function can be reduced to:
(1) When , the profit function is as follows,
at this time ,
The manufacturer's profit increases as the revenue-sharing percentage rises, and at this point, a lower level of capacity restoration is sufficient to meet the product order quantity. Therefore, the manufacturer desires all of the retailer's profits and expects the retailer to cover the overall input costs for supply chain resilience. However, the retailer prefers the revenue-sharing percentage to be as low as possible. As a result, the manufacturer and the retailer are unable to enter into a suitable revenue-sharing contract, which fails to coordinate the activities of the supply chain.
(2) When , then . Therefore, it is possible to construct a function with respect to e. Construct the Lagrangian function and formulate the K-T constraints as follows:
s.t. v10 ≥ 0,v10(αHe − d) = 0.
The optimal cost-sharing ratio for the manufacturer under condition is given by
(3) When , as in the case of , the manufacturer's profit decreases as the revenue share increases. Therefore, the manufacturer aims to capture all of the retailer's sales profit but is unwilling to bear the costs associated with supply chain resilience. Consequently, the retailer is reluctant to enter into a revenue-sharing contract with the manufacturer and prefers to make resilience inputs independently. At this point, the manufacturer's profit is:
(4) When and , the manufacturer's profit can be expressed as a function of e, and a Lagrangian function can be constructed.
s.t.,v12(d − αHe) = 0.
When, ,
3.5 The decision model for cost-sharing under the risk of demand disruption (M-C model)
A cost-sharing contract, sometimes referred to as a cost-sharing agreement, is a coordination mechanism in supply chain management. It allows all parties in the supply chain to share certain costs, thereby incentivizing all participants to work together to improve efficiency and reduce overall costs. This type of compact is particularly useful in supply chains, as it fosters collaboration, reduces risk, and improves performance across the supply chain. According to the concept of cost sharing, in the coordinated decision model (referred to as M-C), let the manufacturer bear a proportion (φ) of the resilience input cost. The manufacturer's profit function under this contract can be expressed as follows:
3.5.1 Modeling retailer profit decisions under cost-sharing contracts
To find the optimal solution for the supply chain resilience input level (e), the retailer profit function is simplified as:
The retailer profit is obtained by solving the Lagrangian function and its K-T conditions, resulting in the following:
Subsequently, the supply chain's resilience input level (e) and the retailer profit (πr) can be obtained as:
In the scenarios of very small and very large product ordering volumes, and , the supply chain resilience levels are and , respectively. In these cases, the supply chain resilience level is proportional to the product ordering volume and inversely proportional to the level of capacity restoration, compared to the scenario where the cost-sharing pact is not realized. However, when and occur, the supply chain resilience levels are and , respectively, and these levels are influenced by factors such as the capacity recovery factor, the capacity recovery level, and the retail price.
3.5.2 Modeling manufacturers' profit decisions under cost-sharing contracts
Based on the previous analysis, the manufacturer's profit function can be reduced to:
(1) When , the manufacturer's profit decreases as the cost-sharing ratio increases, and the product order quantity can be met due to the lower level of capacity restoration at this point. Therefore, the manufacturer is not willing to bear the input costs of supply chain resilience, which are all paid by the retailer, and the profit function is as follows,
At this point , .
(2) When , then W = H. Therefore, it is possible to construct a function with respect to e. Construct the Lagrangian function and write the K-T constraint as:
s.t.,v10(αHe − d) = 0.
The optimal cost-sharing ratio for the manufacturer under the condition can be obtained as .
(3) When , which is the same as in the case of , the manufacturer's profit decreases as the proportion of cost sharing increases. Therefore, the manufacturer is unwilling to bear the input cost of supply chain resilience, at which point the manufacturer's profit is:
, when φ* = 0,
(4) When and , the manufacturer's profit can be expressed as a function of e, and a corresponding Lagrangian function can be constructed.
s.t. v ≥ 0, v12(d − αHe) = 0.
When, , .
4 Numerical simulation
4.1 Supply chain members' optimal profit and resilience input decisions
This section conducts numerical simulations based on MATLAB R2016a software to analyze and compare the impact of three decision-making models—decentralized, centralized, and cost-sharing contract models—on the profitability of manufacturers and retailers. During the simulation process, the model is solved using the built-in optimization solver fmincon in MATLAB to ensure that the optimal solution is obtained under the premise of meeting the constraints. All model parameters are set according to the characteristics of real supply chain operations to meet the basic assumptions of the model and reflect reasonable logical relationships. In addition, sensitivity analysis was performed on the main parameters to illustrate the effectiveness of the proposed model and some management insights were derived. Costco is the world's leading membership-based warehousing retailer, and its private label, Kirkland Signature, is one of its core competencies, accounting for about 70% of its food sales. Kirkland's supply chain model is typical of a manufacturer-retailer integration model that is ideal for modeling and analyzing the relationship between wholesale prices, costs and retail prices. Based on industry data from Food Processing magazine and data from Costco's product page, this article shows that Kirkland brand nuts p = 20, c = 2, w = 15. The other parameters are assigned as follows: αL = 1, αH = 2, k = 1, u = 10, s = 1, ξ = 0.5, λ ∈ [0, 1].d ∈ [0, 100]. The setting of these parameter values mainly refers to the typical values used in similar supply chain models in the existing literature (Luo et al., 2024; Bo et al., 2023; Zhou et al., 2022).
(1) Overall Supply Chain Profit Analysis
This subsection analyzes the impact of product ordering quantity and demand disruption risk on total channel profitability, and the results are shown in Figure 1.
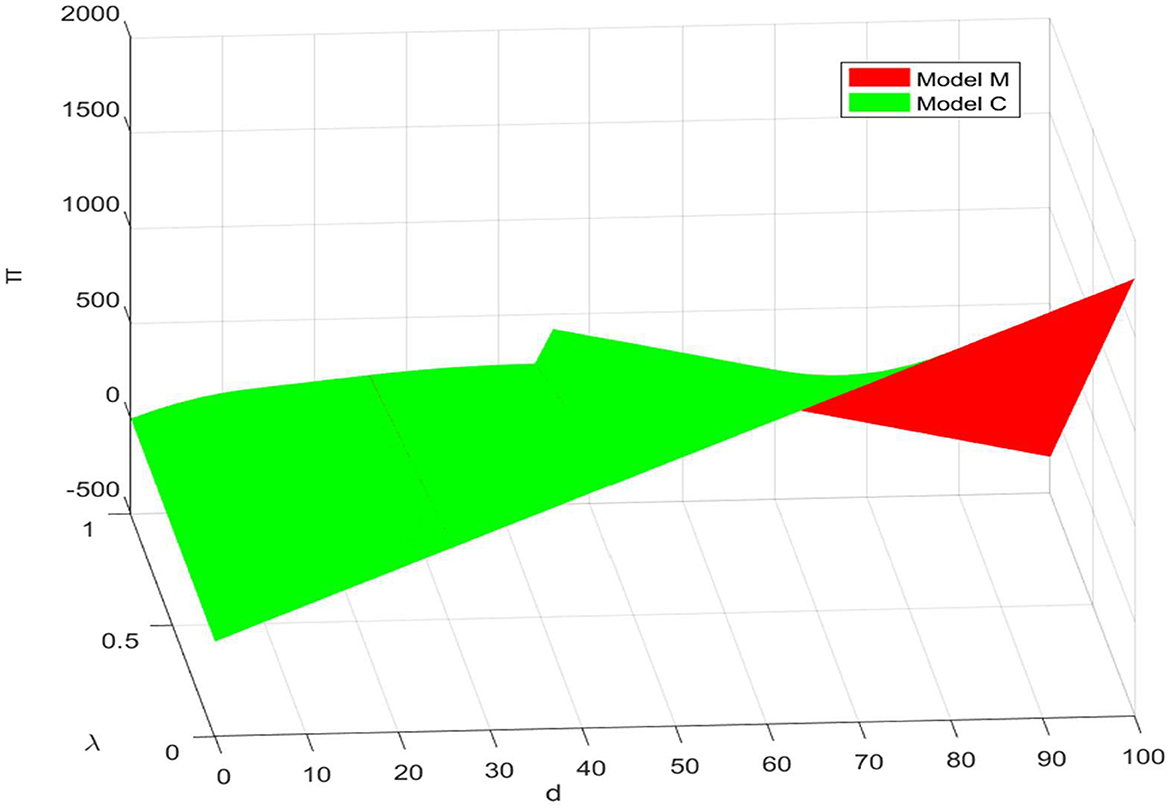
Figure 1. Overall supply chain profits under different strategies.
When the product order quantity is very small, both , consumer demand can be satisfied with a low capacity resilience αL. The retailer's resilience input level is when the product order quantity is , and the supply chain resilience input level is when the product order quantity is . The retailer's resilience input level is fixed at until the order quantity (d) exceeds .
At this point, it can be observed that the retailer's optimal resilience input level is related to the capacity restoration coefficient (ξ), the retail price (p), the wholesale price (w), the unit out-of-stock loss (u), the supply chain's capacity recovery level (αi), and the supply chain resilience input cost sensitivity coefficient (k).
The overall profitability of the supply chain is significantly influenced by the product ordering volume (d) and the risk of demand disruption (λ), with the centralized management model consistently showing a profit advantage over the decentralized model. The total profit of both models increases in parallel with the rise in order quantity (d), regardless of the level of product order quantity.
In particular, when the order quantity d is relatively low, both and , the profits of both centralized and decentralized modes are equivalent. This illustrates that the supply chain demonstrates a high level of adaptability and resilience at this stage, effectively mitigating the impacts of minor adjustments in order quantity, thereby maintaining profit fluctuations at a minimal level. However, when the order quantities are and , and the risk of demand disruption (λ) is substantial, the profit advantage of the centralized management model becomes significantly pronounced. This indicates that, within the context of high order quantities, the supply chain encounters an acute increase in the risk of demand disruption, which surpasses its inherent capacity for resilience. At this juncture, the influence of slight variations in order quantity on the overall profitability of the supply chain is considerably amplified.
In further exploring the impact of demand disruption probability (λ) on supply chain profit, we observe that total profit decreases with increasing λ in both centralized and decentralized management models. The underlying reason is that the heightened risk of demand disruption undoubtedly amplifies the uncertainty within the supply chain, compelling firms to maintain larger inventory levels as a precaution. However, the resulting high inventory costs erode profit margins, creating a paradox between the necessity of increasing safety stock and the imperative of cost control. Furthermore, in order to address supply chain disruptions, companies must invest additional resources and time in seeking alternatives or executing emergency responses, which inevitably escalates operational costs and diminishes supply chain efficiency.
In summary, in the face of demand disruptions, adopting a centralized decision-making mechanism and optimizing resource allocation through contractual tools becomes a key strategy for ensuring the profit maximization of the supply chain as a whole, compared to decentralized decision-making. This approach not only serves as a robust complement to existing supply chain management theory but also provides empirical support for enterprises to develop effective strategies in a complex and dynamic market environment.
(2) Manufacturer Profit Analysis
As can be seen from Figure 2, the manufacturer's profit curve also exhibits a fluctuating pattern in relation to the level of product order volume. Based on the quantity of product ordered, this dynamically changing profit curve can be subdivided into intervals with four distinct turning points, which profoundly reveals the phased nature of the impact of order volume on the retailer's profit.
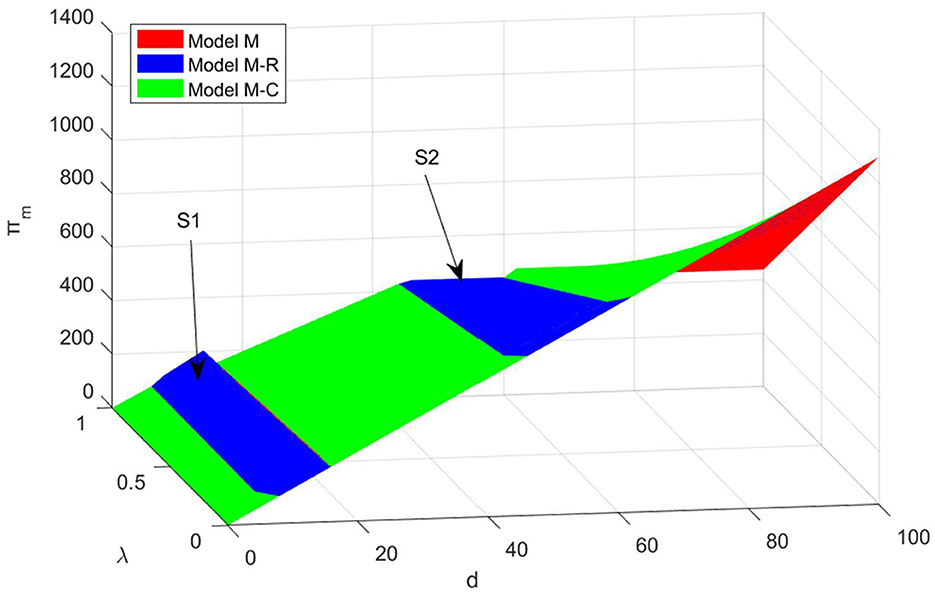
Figure 2. Manufacturer's profit under different strategies.
I. In the first interval of the change in order quantity, namely , the manufacturer's profit in the decentralized model is equal to the manufacturer's profit in both the revenue-sharing contract model and the cost-sharing contract model. Moreover, the manufacturer's profit increases with the increase in the product order quantity (d) and decreases with the increase in demand disruption risk (λ). Therefore, there is no need for contractual coordination. This indicates that when the order quantity is low, the supply chain demonstrates a certain level of resilience, allowing the retailer to maintain the normal operational needs of the supply chain through independent resilience inputs.
II. In the second interval of order quantity change, namely , the manufacturer's profit is negatively correlated with the demand disruption risk (λ), and the manufacturer's profit increases with the product order quantity (d). In the S1 region, the manufacturer's profit under the revenue-sharing contract model is higher than that under both the decentralized model and the cost-sharing model. This indicates that manufacturers are more inclined to use the revenue-sharing contract in this region. Furthermore, upon analyzing the manufacturer's profit under the decentralized and cost-sharing contract models, it can be observed that at point , the manufacturer's profit under the cost-sharing contract is equal to that under the decentralized model. Therefore, manufacturers and retailers can address the risk of demand disruption without the need to enter into a cost-sharing contract. At point , the manufacturer's profit under the cost-sharing contract will exceed the manufacturer's profit under the decentralized model.
III. In the third interval of product order quantity variation, namely , similar to the first interval, the manufacturer's profit in the decentralized model is equal to the manufacturer's profit in both the revenue-sharing contract model and the cost-sharing contract model. Additionally, the manufacturer's profit is positively correlated with the product order quantity (d) and negatively correlated with the risk of demand disruption (λ). Therefore, there is no need for contractual coordination.
IV. In the fourth interval of product ordering variation, denoted as , the manufacturer's profit exhibits a negative correlation with the risk of demand disruption (λ). Specifically, the manufacturer's profit is positively correlated with the product ordering quantity, d. Within the S2 region, the profit accrued by the manufacturer under the revenue-sharing contract model surpasses that observed in both the decentralized and cost-sharing models. Conversely, outside the S2 region, the manufacturer's profit under the cost-sharing contract model exceeds that of the decentralized and revenue-sharing models. Further analysis of the manufacturer's profits under the decentralized and cost-sharing contract models indicates that, at point , the profits under the cost-sharing contract equal those under the decentralized model. However, at points and , the profits under the cost-sharing contract model are greater, thereby allowing the manufacturer and retailer to enter into a cost-sharing agreement based on their actual circumstances. Overall, it can be observed that as the product order quantity (d), increases, the significance of the cost-sharing contract becomes increasingly pronounced.
In summary, manufacturers' profits are influenced by both the level of demand disruption risk and product ordering quantities, exhibiting a negative correlation with the disruption risk (λ). When order quantities remain low, the supply chain demonstrates inherent resilience, allowing retailers to manage market fluctuations through their own inputs in supply chain resilience, without necessitating additional cost-sharing contracts to stabilize their operations. However, as order quantities increase along with the risk of disruption, manufacturers increasingly turn to cost-sharing and revenue-sharing agreements as effective tools for supply chain coordination, ensuring continuity and efficiency in high-risk environments.
It is important to note that manufacturers encounter a more complex decision-making environment when the retailer's order quantities are either or . In this context, manufacturers must carefully assess the risk of demand disruption in relation to the specific order quantities and deliberate on whether to implement a cost-sharing contract or a revenue-sharing model. This decision-making process aims to identify vulnerabilities within the supply chain. By introducing cost-sharing mechanisms in a timely manner, manufacturers can effectively mitigate potential risks while ensuring the maximization of their interests in an unpredictable market environment. This strategy seeks to achieve an optimal balance between the economic efficiency of the supply chain and effective risk management.
(3) Retailer Profit Analysis
As can be seen in Figure 3, although the retailer's profit curve shows overall stable growth, it experiences subtle fluctuations at different points, vividly reflecting the dynamic evolution of the impact of demand disruption probability and product ordering volume on retailer performance. Delving deeper, when both the product ordering volume and demand disruption probability are high, retailers' profits under decentralized decision-making and revenue-sharing models are generally lower than those under the cost-sharing contract mechanism. This finding aligns with certain real-world examples of supply chain management. It implies that, when faced with higher disruption risks and substantial ordering demands, manufacturers are more inclined to incentivize faster product delivery by assuming part of the retailer's costs, thus enhancing the overall resilience of the supply chain. This approach not only helps retailers avoid potential economic losses from supply chain disruptions but also ensures a stable and continuous supply of goods, ultimately maximizing their own interests. By implementing cost-sharing contracts, retailers and manufacturers establish a mutually beneficial relationship, enabling them to weather market fluctuations, optimize supply chain performance, and ensure long-term business success and sustainable development.
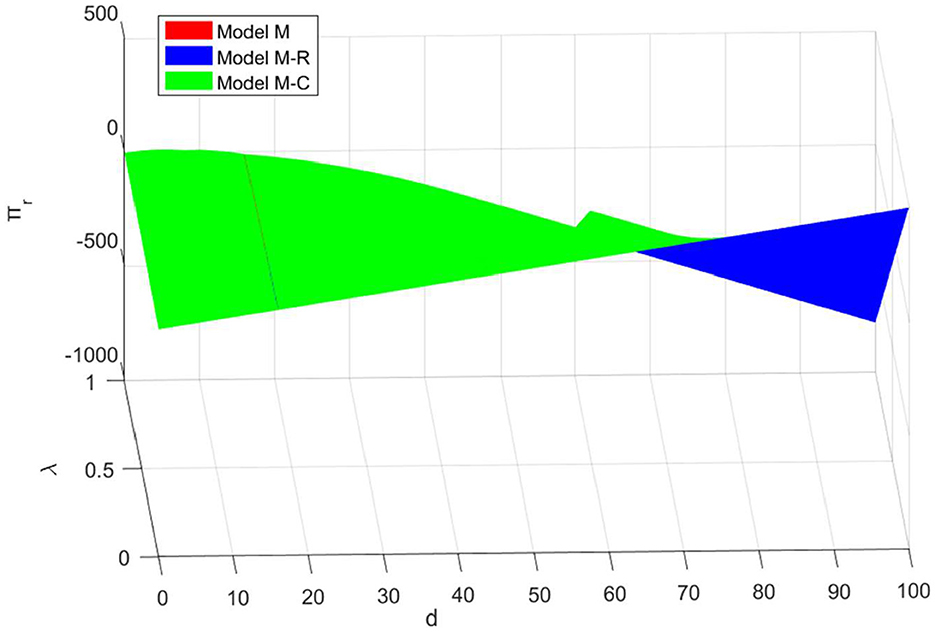
Figure 3. Retailer profits under different strategies.
I. In the first interval of the change in order quantity, both . The retailer's profit in the decentralized model is equal to the retailer's profit in both the cost-sharing contract model and the revenue-sharing contract model. Furthermore, the retailer's profit is positively correlated with the product ordering quantity and negatively correlated with the demand disruption risk λ. This indicates that when the order quantity is low, supply chain coordination can be achieved without the need for cost-sharing and revenue-sharing contracts, allowing retailers to maintain a normal product supply by adjusting their resilience inputs.
II. In the second interval of the change in order quantity, both . When occurs, the retailer's profit under the cost-sharing contract is equal to the manufacturer's profit in the decentralized model. Therefore, both the manufacturer and the retailer do not need to enter into a cost-sharing contract to address the risk of demand disruption. When occurs, the manufacturer's profit under the cost-sharing contract will be higher than the manufacturer's profit in both the decentralized model and the revenue-sharing model. This further illustrates that the supply chain itself possesses a certain level of resilience and can adjust manufacturing activities accordingly.
III. In the third interval of product ordering variation, both . Similar to the first interval, the manufacturer's profit in the decentralized model is equal to the manufacturer's profit in the cost-sharing contract model. When the risk of demand disruption is low, the manufacturer's profit is positively correlated with the product ordering quantity (d) and negatively correlated with the demand disruption risk (λ). Conversely, when the risk of demand disruption is low, the manufacturer's profit is negatively correlated with both the product ordering quantity and the demand disruption risk (λ).
IV. In the fourth interval of product order quantity variation, denoted as , when at point , the retailer's profit under the cost-sharing and revenue-sharing models is equal to the retailer's profit under the decentralized model and higher than that under the revenue-sharing model. This indicates that manufacturers and retailers in this interval cannot establish an appropriate cost-sharing or revenue-sharing ratio to achieve supply chain coordination; hence, there is no need to develop a contract for supply chain coordination in this interval. At point , the retailer's profits under both the decentralized and revenue-sharing models are consistently lower than those under the cost-sharing contract model. This suggests that when order quantities are large, retailers can achieve supply chain coordination through cost-sharing contracts, and the effectiveness of these contracts increases with the growing risk of demand disruption.
Overall, when there is a significant increase in the volume of products ordered, manufacturers are more likely to adopt a cost-sharing strategy, i.e., to take on part of the retailer's input in supply chain resilience. This approach enhances the overall resilience of the supply chain and its ability to cope with unforeseen events, while also opening up a path for retailers to maximize their own benefits. By establishing cost-sharing relationships with manufacturers, retailers can ensure supply chain continuity and stability in high demand environments, thereby strengthening their market position and gaining a competitive advantage. On the other hand, retailers prefer to maintain a decentralized decision-making model when product ordering is low. In this scenario, retailers are usually well-positioned to deal with the risk of demand disruptions on their own and maintain normal production and delivery processes. The retailer is able to secure a strong foothold in the market, capitalizing on lower operating costs and a stable supply chain to generate higher margins. In this case, the retailer does not need to invest additional costs to enhance the resilience of the supply chain. Instead, the retailer can use the saved resources for other business expansion or profit reinput to further enhance its market competitiveness and profitability. All in all, the retailer's decision-making logic at different ordering levels reflects the flexibility and efficiency in supply chain management. By adjusting the cost-sharing strategy at the right time, retailers can effectively respond to market demand fluctuations and optimize supply chain performance.
(4) Decision Analysis of Resilience Inputs
Since cost-sharing contracts are superior to revenue-sharing contracts, this section explores the cost of elastic inputs in the supply chain under the cost-sharing contract model and the decentralized model. As shown in Figure 4, supply chain input in resilience shows a volatile trend, taking into account the risk of demand disruption: it rises, then falls, and then rises again. This unique pattern is closely tied to product order volumes and the potential for demand disruptions. Depending on the level of product orders, four intervals can be established. It can also be observed that the cost of supply chain elastic inputs fluctuates with market demand, but the overall trend is upward.
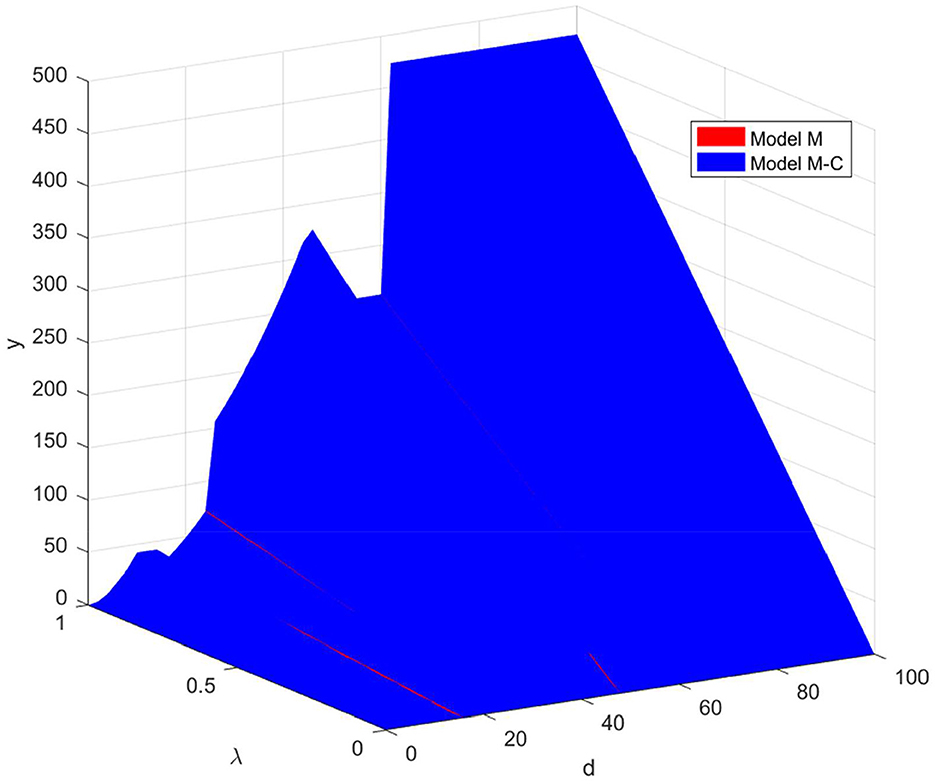
Figure 4. Input costs for supply chain resilience under different strategies.
I. In the first interval of the change in order quantity, denoted as , t the input cost of supply chain resilience under the cost-sharing model is positively correlated with the number of product orders (d) and the risk of demand disruption (λ). In this context, the input cost of supply chain resilience in the decentralized mode is equal to the input cost in the cost-sharing contract model. This suggests that when order volumes are low, even if disruptions occur, the impact is smaller, and the marginal benefit of improving resilience is lower. And with limited resources, it is not possible to invest flexibly in all scenarios. From the perspective of resource allocation efficiency: In low-order scenarios, companies are more inclined to invest resources in growth inputs.
II. In the second interval of the order quantity change, denoted as . When occurs, retailer profits under cost-sharing contracts are equal to manufacturer profits under the decentralized model. In addition, supply chain elastic input costs and demand disruption risk (λ) are positively correlated and independent of product order quantity (d). When occurs, retailers make more profits under cost-sharing contracts than manufacturers make under a decentralized model. In addition, supply chain elastic input costs and demand disruption risk (λ) are positively correlated and independent of product order quantity. At this time, supply chain participants can achieve supply chain coordination through cost-sharing contracts.
III. In the third interval of product ordering, denoted as , similar to the first interval, the manufacturer profit in the decentralized model is equal to the supplier profit in the cost-sharing contract model. In addition, supply chain elastic input costs are positively correlated with product order volume (d) and demand disruption risk (λ). At this point, supply chain participants cannot coordinate through cost-sharing contracts.
IV. In the fourth interval of the product ordering quantity change, referred to as , when considering , the supply chain elastic input cost in the cost-sharing model is equal to the input cost in the decentralized model. In addition, supply chain elastic input costs are positively correlated with demand disruption risk (λ) and independent of product orders (d). This indicates that manufacturers and retailers in this interval are unable to establish appropriate cost-sharing ratios to achieve supply chain coordination; therefore, in this case, it is not necessary to implement a cost-sharing contract for coordination. Conversely, when occurs, the input cost of supply chain elasticity in the decentralized model is always lower than the input cost in the cost-sharing contract model. In addition, supply chain elastic input costs are positively correlated with demand disruption risk (λ) and independent of product orders (d). This suggests that disruptions can result in significant losses when the number of orders is high, and further inputs have a high marginal value even with high current elasticity. In the high-order scenario, elastic input has become an important means of risk control and has a higher priority. Retailers can achieve supply chain coordination through cost-sharing contracts, which are more effective when both order volume and the risk of demand disruption increase.
Overall, supply chain elastic input costs are positively correlated with demand disruption risk—the higher the risk, the higher the corresponding elastic input cost. In particular, in the scenario of low order volume, the level of elasticity is the lowest, but the potential loss caused by interruption is also the smallest, so the marginal return on improving elasticity is low. Therefore, at low order levels, manufacturers and retailers do not need to rush to initiate cost-sharing agreements. However, when product ordering levels are at a moderate level, decision-making becomes more complex. In this case, companies must consider the risk of product order volume and demand disruption to accurately determine the necessity and scale of elastic input costs. Especially when orders rise significantly to higher levels, despite the already relatively high level of resilience, companies are willing to invest further to strengthen supply chain resilience due to systemic risks and significant losses that disruptions can cause. This behavior reflects the logic of “risk-benefit trade-off” in supply chain resilience decision-making, that is, enterprises do not make input decisions based solely on the current level of resilience, but comprehensively consider the likelihood of disruption, the scope of impact and the return on input. Manufacturers and retailers should decisively adopt cost-sharing contracts to maximize supply chain resilience.
4.2 Sensitivity analysis
From the previous discussion and analysis, it is evident that the decision-making of supply chain members is often influenced by changes in the random capacity restoration coefficient, and this influence is not straightforward. To further investigate the impact of these coefficient changes on the decision-making of supply chain members and their associated profits, we will fix the values of other parameters assigned to ξ = [0.1, 0.3, 0.5, 0.7, 0.9] and d = 10, and observe the resulting changes in the experimental outcomes. The different scenarios are represented by λ = 0.2, λ = 0.5, and λ = 0.8, corresponding to varying levels of demand disruption risk, as shown in Table 3.
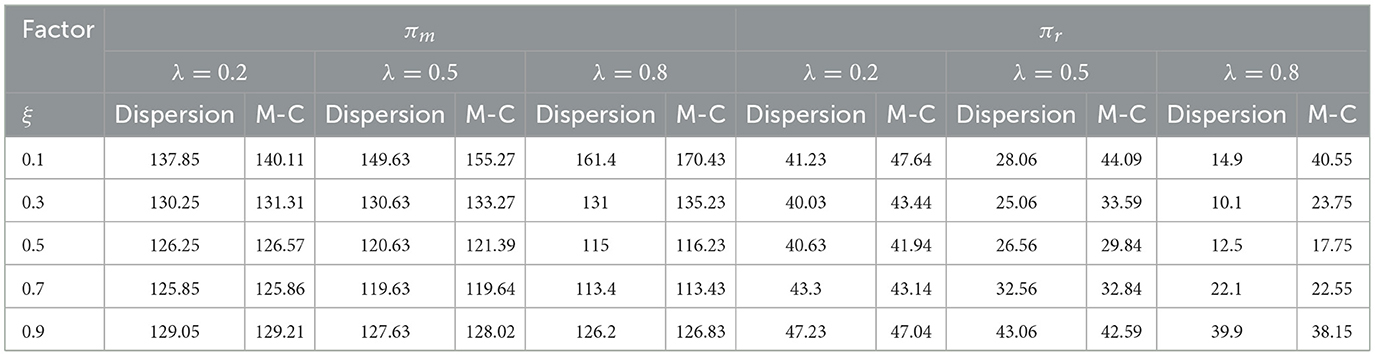
Table 3. Impact of changes in the capacity restoration coefficient on the optimal profit of the supply chain.
By taking a look at the results of the simulation experiments in Table 3, it can be clearly seen that as the capacity recovery factor ξ increases, the profits of both the manufacturer and the retailer show a U-shaped growth trend. This is because when the retailer's delivery capacity is insufficient, then the manufacturer and the retailer will cooperate closely and the manufacturer will be more willing to bear the supply chain resilience input cost. However, when the retailer's delivery capacity increases, the retailer and the manufacturer will set up cost-sharing ratios based on their respective profit-maximizing objectives, and will spend additional costs to set up a cost-sharing contract as a result. However, when the retailer's delivery capacity is higher, the manufacturer and the retailer can basically meet the market demand even without strengthening cooperation, and the increase in the capacity recovery factor increases the likelihood that the retailer will obtain more orders, which in turn enables the manufacturer and the retailer to obtain more revenue from manufacturing and sales activities, respectively. From the cross-sectional general trend analysis, when the capacity recovery factor is low, the manufacturer's profit increases with the increase in the probability of disruption, and the retailer's profit decreases with the increase in the probability of disruption. When the capacity recovery factor is high, the manufacturer's profit decreases as the probability of disruption increases and the retailer's profit decreases as the probability of disruption increases. It is noteworthy that the profits of both parties under the adoption of the cost-sharing strategy are generally not lower than those without cost-sharing, which further validates the effectiveness of the cost-sharing contract.
Focusing on the scenario with lower disruption probability (λ = 0.2), it is observed that the profits of the supply chain members do not change significantly when the capacity recovery factor increases. Moreover, when the capacity recovery factor is small, both the manufacturer's profit and the retailer's profit are higher than those in the decentralized model, which proves that the smaller the capacity recovery factor is, the more the manufacturer tends to implement the cost-sharing contract. When the capacity recovery coefficient is large, the retailer's profit in the cost-sharing model will be lower than that in the decentralized model, so the manufacturer will not continue to share supply chain resilience input costs with the retailer at this time.
When examining the case with a high probability of disruption (λ = 0.5), manufacturer and retailer profits (ξ) re-decrease and then increase in a U-shaped relationship with the increase. In particular, when the probability of disruption is very high, the decentralized model shows that higher values of ξ lead to higher manufacturer and retailer profits, implying that higher ξ extends the manufacturer and retailer profit bands, i.e., in the decentralized model, an increase in the level of capacity restoration enhances the retailer's ability to cope with severe demand disruptions.
In the scenario with a very high probability of disruption (λ = 0.8), the manufacturer's profit (ξ) and the retailer's profit exhibit a U-shaped trend with changes. This indicates that manufacturers and retailers generally prefer to use the cost-sharing model when the capacity recovery factor is low. When the product delivery capability is high, an increase in the capacity recovery factor can provide more profitable opportunities for manufacturers. This implies that as the capacity recovery factor increases, the manufacturer approaches full and efficient recovery, thereby reducing the urgency and initiative of retailers to adopt incentives.
To summarize, when designing a cost-sharing contract in the face of demand disruption risks, it is crucial for retailers to consider market research findings, the resilience of the supply chain, and the potential impacts of market disruptions. Only by doing so can a realistic and strategic cost-sharing mechanism be developed to maximize both the resilience of the supply chain and its business value in an uncertain market environment. This refined contract design not only helps balance the interests of all parties within the supply chain but also provides retailers with a competitive edge in a fierce market, ensuring long-term sustainable development.
4.3 Results discussion
The above game model analysis shows that the number of product orders in the food supply chain can be divided into four key intervals, and there are significant differences in the optimal elastic input strategies and coordination mechanisms between retailers and manufacturers in different intervals. The study found that when the number of product orders is low or high, retailers can effectively mitigate the impact of demand disruption by investing in supply chain resilience. More importantly, in these order ranges, the implementation of cost-sharing contracts between manufacturers and retailers can significantly improve the performance and stability of the entire food supply chain compared to a single entity bearing all the flexible input costs. As the risk of demand disruption rises, both manufacturers and retailers are showing a downward trend in profit levels and willingness to invest flexibly, indicating that supply chain members are more conservative in high-risk environments.
In the study on service input and demand disturbances, Zhai et al. (2022) pointed out that when the degree of demand disturbance is small, supply chain decision-making has a certain robustness, which is consistent with the findings of this paper. This paper further expands this view, suggesting that supply chain members need to design contractual mechanisms to achieve risk sharing and performance optimization in the case of intensified demand disturbances (Zhai et al., 2022). From the perspective of emergency management, Wu et al. (2023) studied the decision-making behavior of a dual-channel closed-loop supply chain under demand interruption based on the Stackelberg game model. They found that manufacturers tend to assist retailers in reducing losses when negative demand disturbances occur, but their priority remains to protect their own profits (Wu et al., 2023). The research in this paper further shows that manufacturers are more willing to adopt cost-sharing contracts to support retailers only when the degree of demand disturbance is high, which provides a deeper theoretical explanation for the behavior logic of manufacturers in risk scenarios.
Xiang et al. (2023) pointed out that improving supply chain resilience is key to reducing the risk of disruption based on empirical data from 271 SMEs in China. This conclusion provides a realistic basis for the game model in this paper. Based on this, this paper further quantifies the impact of demand disruption probability on supply chain performance, and identifies the optimal elastic input level that manufacturers and retailers should adopt under different order quantities and interruption risks.
In summary, this paper systematically analyzes the elastic input strategy and coordination mechanism of manufacturers and retailers in the food supply chain under different risk scenarios by constructing a game model that integrates the number of product orders and the risk of demand interruption. This study not only reveals the dynamic impact of order quantity and interruption risk on supply chain performance, but also proposes a resilience improvement path based on contract design, which enriches the theoretical system of resilience management of food supply chain.
5 Conclusion
This study systematically analyzed the impact of these factors on food supply chain resilience input and coordination issues by constructing a Stackelberg model. The research results not only provide scientific decision support for food supply chain management, but also provide theoretical basis for optimizing the risk resistance and coordination mechanism of the food supply chain. The research results indicate that:
(1) This is an effective strategy for retailers to improve product delivery capacity by sharing the cost of resilient inputs in the food supply chain after demand disruptions. However, the application of this strategy should be contextual. Manufacturers' considerations when determining the optimal level of capacity recovery vary depending on factors such as the quantity of products ordered during the disruption, the risk of demand disruptions, and the benefits of supply. Manufacturers also need to consider these factors comprehensively when determining the optimal level of capacity recovery to ensure efficient supply chain operation and long-term stable development. Specifically, if the incremental increase in product orders is small, the current risk is low, the order volume is small, and the return on input is low; enterprises are more inclined to invest resources in market expansion, product innovation, etc.; conversely, if product orders spike, it may be due to inputs made or the system itself is at high risk and needs to be more resilient. Indicates that manufacturers are more inclined to adopt cost-sharing strategies and revenue-sharing agreements, while retailers are more likely to utilize cost-sharing agreements.
(2) The cost of input in food supply chain resilience is clearly positively correlated with the risk of demand disruption, meaning that the increased risk directly drives greater demand for improved food supply chain resilience. In addition, the level of resilience of the food supply chain is closely related to the number of product orders. Specifically, the cost of supply chain resilience also increases when the number of orders increases, indicating that enterprises are more inclined to increase the input cost of supply chain resilience in the face of higher probability of disruption and larger order size. In the case of low order volume, the level of elasticity is naturally low, but the marginal return of improving elasticity is limited because the potential loss caused by interruption is also small. Conversely, when faced with a high volume of orders, companies are willing to continue investing to further build resilience despite the already high levels of supply chain resilience. This is because in such cases, if an outage occurs, it can trigger systemic risks and cause significant losses. This decision-making behavior of enterprises reflects the existence of a “risk-return trade-off” mechanism in supply chain resilience input, that is, when deciding whether to improve elasticity, enterprises will not only consider the current level of elasticity, but also comprehensively evaluate the probability of interruption, the degree of impact and the return efficiency of input.
(3) When the capacity recovery coefficient is small, the profits of both manufacturers and retailers are higher than those under decentralized decision-making. This is because a lower recovery factor means that the supply chain can recover capacity more quickly and mitigate the impact of disruptions. In this case, the cost-sharing model improves overall profitability through risk sharing and resource integration. However, when the capacity recovery coefficient is high, the retailer's profit is lower than that of the decentralized model due to the increase in elastic input and the increase in costs. This suggests that the effectiveness of cost-sharing is limited by the cost of recovery. Further analysis shows that under the condition that the probability of demand interruption is constant, the profit shows a U-shaped trend with the change of capacity recovery coefficient, indicating that there is an optimal recovery interval to maximize profit. The results reveal the non-linear relationship between supply chain resilience input and returns, and provide theoretical support for enterprises' risk decision-making.
5.1 Management suggestions
This study not only has theoretical value, but also provides operational decision-making tools and strategic guidance for small and medium-sized food enterprises, supply chain managers, industry organizations, and policy makers. The following elaborates on its practical significance from four levels. Firstly, the management inspiration for small and medium-sized food enterprises: the strategic transformation from “passive response” to “active response.” This study suggests that not all order sizes are worth investing in high cost resilience. Therefore, small and medium-sized enterprises should establish an “order risk” assessment matrix. When the order volume is in the low or high range, priority should be given to investing in cold chain, inventory buffering, or digital monitoring systems to maximize investment returns. Clearly state the “risk triggered cost sharing clause” when signing the procurement contract; provide sales data and market forecasts to enhance manufacturers' awareness of risks and increase their willingness to cooperate; build a “lightweight” emergency response mechanism. Small and medium-sized enterprises have limited resources and should not pursue “comprehensive defense.” Therefore, it is recommended to establish a “minimum feasible emergency plan.” Focus on key nodes and establish a “mutual aid alliance” with local suppliers to achieve resource and risk sharing; and utilize cloud platforms to achieve real-time monitoring of inventory and demand, improving response speed.
Secondly, policy recommendations for the government and regulatory agencies: institutional design from “post rescue” to “pre incentive.” A policy of “resilience cost investment tax credit” can be established. Currently, small and medium-sized enterprises generally neglect long-term resilience construction due to short-term cost pressures. Therefore, the government can provide tax credits to enterprises investing in cold chain, digital systems, and emergency response drills, encouraging forward-looking investment. It can also promote the construction of a regional emergency logistics network. For example, establishing regional emergency cold chain centers in key agricultural production areas and around cities; alternatively, by jointly building a “shared storage pool” between the government and enterprises, priority can be given to ensuring food circulation during crisis periods and improving agricultural and food supply chain insurance products. Insurance companies can also be encouraged to collaborate with supply chain platforms to achieve data sharing and risk pricing.
Again, a suggestion for industry organizations and platform enterprises: to build a collaborative ecosystem. Industry associations should release a “Resilience Best Practice Guide” to assist small and medium-sized enterprises in assessing their own risks and developing improvement plans. E-commerce platforms and logistics platforms should open data interfaces. Allow small and medium-sized food enterprises to access the platform's demand forecasting, inventory visualization, and delivery tracking systems; in case of sudden interruption, prioritize ensuring the traffic and distribution resources of certified resilient enterprises. It can also promote the standardization of contracts. Develop a model text for cost sharing contracts in the food supply chain, clarifying risk definitions, cost ranges, sharing ratios, and dispute resolution mechanisms. In this way, reducing negotiation costs and improving contract execution efficiency.
Finally, recommendations for policy makers. By enhancing supply chain resilience, reducing food disruptions and waste, and ensuring food accessibility. Assist small and medium-sized enterprises in maintaining operations and protecting employment. Promote the application of digital and intelligent technologies in the food supply chain. Reduce food loss and resource waste caused by interruptions. In summary, this study achieved a leap from academic modeling to strategic decision-making. It means that businesses can avoid blind investment, governments can implement precise policies, and the entire food system can be more resilient and sustainable in times of uncertainty.
5.2 Limitations and prospects of research
This study has certain limitations, and future research can explore the impact of simultaneous supply and demand disruptions on the food supply chain. In addition, comprehensive models of multiple risk factors, dynamic risk management strategies, and technological applications can also be explored. Through these studies, we can gain a more comprehensive understanding and optimization of the resilience of the supply chain, improve its risk resistance and operational efficiency.
Data availability statement
The raw data supporting the conclusions of this article will be made available by the authors, without undue reservation.
Author contributions
JL: Writing – review & editing, Data curation. KK: Conceptualization, Methodology, Writing – original draft, Writing – review & editing. LL: Writing – review & editing, Conceptualization. RD: Data curation, Writing – review & editing. XL: Supervision, Writing – review & editing. CL: Formal analysis, Writing – review & editing. PL: Investigation, Writing – review & editing. XY: Methodology, Writing – review & editing. SM: Data curation, Writing – review & editing.
Funding
The author(s) declare that financial support was received for the research and/or publication of this article. This work was supported by Guangxi Key R&D Plan (Guike AB23026014): The Key Technologies and Industrialization of Intelligent Traceability in the Whole Link of High-quality Seedling Seed Supply Chain in Lijiang River Basin and by Innovation Project of Guangxi Graduate Education (JGY2020039).
Conflict of interest
JL was employed by Jinan Liangong Testing Technology Co., Ltd. RD was employed by China Petroleum & Chemical Corporation.
The remaining authors declare that the research was conducted in the absence of any commercial or financial relationships that could be construed as a potential conflict of interest.
Generative AI statement
The author(s) declare that no Gen AI was used in the creation of this manuscript.
Any alternative text (alt text) provided alongside figures in this article has been generated by Frontiers with the support of artificial intelligence and reasonable efforts have been made to ensure accuracy, including review by the authors wherever possible. If you identify any issues, please contact us.
Publisher's note
All claims expressed in this article are solely those of the authors and do not necessarily represent those of their affiliated organizations, or those of the publisher, the editors and the reviewers. Any product that may be evaluated in this article, or claim that may be made by its manufacturer, is not guaranteed or endorsed by the publisher.
References
Adela, D., Amrik, S., Christopher, N., and Sajad, F. (2023). Supply chain resilience in relation to natural disasters: framework development. Prod. Plan. Control 34, 1603–1617. doi: 10.1080/09537287.2022.2035446
Amirhossein, M., Ghazale, K., Mahdi, P. M., Ali, D., and Mostafa, H. K. (2023). Designing a sustainable-resilient-responsive supply chain network considering uncertainty in the COVID-19 era. Expert Syst. Appl. 227:120334. doi: 10.1016/j.eswa.2023.120334
Asamoah, D., Owusu, B. A., and Ashun, E. (2022). Social network relationship, supply chain resilience and customer-oriented performance of small and medium enterprises in a developing economy. Benchmarking 27, 1793–1813. doi: 10.1108/BIJ-08-2019-0374
Barbara, G., Roberta, P., and Ilenia, C. (2023). Achieving supply chain resilience in an era of disruptions: a configuration approach of capacities and strategies. Supply Chain Manage. 28, 97–111. doi: 10.1108/SCM-09-2022-0383
Bo, H., Chen, X. A., Luo, Q., and Wang, W. (2023). Manufacturing rescheduling after crisis or disaster-caused supply chain disruption. Comput. Oper. Res. 157:106266. doi: 10.1016/j.cor.2023.106266
Chen, Z., Khalilpour, K., Shao, L., Zhao, R., Li, X., and Yao, Q. (2025). Pricing and coordination in green supply chains: the impact of overconfident retailers under reference price effect. Environ. Dev. Sustain. doi: 10.1007/s10668-025-06214-3
Dong, G. S., Wei, L. H., Xie, J. P., Zhang, W. S., and Zhang, Z. F. (2019). Two-echelon supply chain operational strategy under portfolio financing and tax shield. Indus. Manage. Data Syst. 120, 633–656. doi: 10.1108/IMDS-07-2019-0395
Ge, X., Yang, J. Q., Wang, H. Y., and Shao, W. Q. (2020). A fuzzy-topsis approach to enhance emergency logistics supply chain resilience. J. Intell. Fuzzy Syst. Appl. Eng. Technol. 38, 6991–6999. doi: 10.3233/JIFS-179777
Ghadafi, M. R., Linda, C. H., and Mark, S. (2023). Supply chain traceability: a review of the benefits and its relationship with supply chain resilience. Prod. Plan. Control 34, 1114–1134. doi: 10.1080/09537287.2021.1983661
Gonçalves, A. P., Siqueira, M. M. A., Torresda, R. A. B., and José de Oliveira, O. (2023). Understanding and implementing environmental management in small entrepreneurial ventures: supply chain management, production and design. J. Small Bus. Enterp. Dev. 30, 1445–1475. doi: 10.1108/JSBED-08-2022-0344
He, Y., and Wang, S. (2012). Analysis of production-inventory system for deteriorating items with demand disruption. Int. J. Prod. Res. 50, 4580–4592. doi: 10.1080/00207543.2011.615351
Hendrik, B., Nils-Ole, H., and Sven, H. (2023). How have digital technologies facilitated supply chain resilience in the COVID-19 pandemic? An exploratory case study. Comput. Indus. Eng. 183:109538. doi: 10.1016/j.cie.2023.109538
Hosseini-Motlagh, S. M., Nouri-Harzvili, M., Choi, T. M., and Ebrahimi, S. (2019). Reverse supply chain systems optimization with dual channel and demand disruptions: sustainability, CSR input and pricing coordination. Inform. Sci. 503, 606–634. doi: 10.1016/j.ins.2019.07.021
Kumar, B. G., Gunjan, S., Vipul, J., Rohit, J., and Sameer, M. (2022). Assessing supply chain resilience to the outbreak of COVID-19 in Indian manufacturing firms. Oper. Manage. Res. 15, 1161–1180. doi: 10.1007/s12063-021-00236-6
Luiz, R. A., Miguel, F. L., and Sofia, C. S. (2021). Modelling sustainability risk in the brazilian cosmetics industry. Sustainability 13, 13771–13771. doi: 10.3390/su132413771
Luo, X., Kang, K., Lu, L., and Ke, Y. (2024). Research on input and coordination strategies for supply chain resilience under supply disruption risk. Symmetry 16:1192. doi: 10.3390/sym16091192
Lyu, G., Zhao, M., Ji, Q., and Lin, X. (2023). Improving resilience via capacity allocation and strategic pricing: co-opetition in a shipping supply chain. Ocean Coast. Manage. 244:106779. doi: 10.1016/j.ocecoaman.2023.106779
Malik, A. I., and Sarkar, B. (2020). Paper disruption management in a constrained multi-product imperfect production system. J. Manuf. Syst. 56, 227–240. doi: 10.1016/j.jmsy.2020.05.015
Maria, D. E., Juncal, C., and Perez, D. G. F. (2023). Commodity price shocks, supply chain disruptions and U.S. inflation. Financ. Res. Lett. 58:104495. doi: 10.1016/j.frl.2023.104495
Pathy, S. R., and Rahimian, H. (2023). A resilient inventory management of pharmaceutical supply chains under demand disruption. Comput. Indus. Eng. 180:109243. doi: 10.1016/j.cie.2023.109243
Pertheban, T. R., Thurasamy, R., Marimuthu, A., Venkatachalam, K. R., Annamalah, S., Paraman, P., et al. (2023). The impact of proactive resilience strategies on organizational performance: role of ambidextrous and dynamic capabilities of SMEs in manufacturing sector. Sustainability 15:12665. doi: 10.3390/su151612665
Pi, Z., Fang, W., and Zhang, B. F. (2019). Service and pricing strategies with competition and cooperation in a dual-channel supply chain with demand disruption. Comput. Indus. Eng. 138:106130. doi: 10.1016/j.cie.2019.106130
Qiao, R. L., and Zhao, L. D. (2023). Highlight risk management in supply chain finance: effects of supply chain risk management capabilities on financing performance of small-medium enterprises. Supply Chain Manage. 28, 843–858. doi: 10.1108/SCM-06-2022-0219
Rahmani, K., and Yavari, M. (2018). Pricing policies for a dual-channel green supply chain under demand disruptions. Comput. Indus. Eng. 127, 493–510. doi: 10.1016/j.cie.2018.10.039
Rajabzadeh, H., and Babazadeh, R. (2022). A game-theoretic approach for power pricing in a resilient supply chain considering a dual channel biorefining structure and the hybrid power plant. Renew. Energy 198, 1082–1094. doi: 10.1016/j.renene.2022.08.118
Rajabzadeh, H., Rabiee, M., and Sarkis, J. (2024). Sourcing from risky reverse channels: insights on pricing and resilience strategies in sustainable supply chains. Int. J. Prod. Econ. 276:109373. doi: 10.1016/j.ijpe.2024.109373
Rajabzadeh, H., and Wiens, M. (2024). Resilient and sustainable energy supply chains: insights on sourcing and pricing strategies in a non-collaborative and collaborative environment. Int. J. Prod. Res. 62, 9011–9042. doi: 10.1080/00207543.2024.2331556
Ray, P., and Jenamani, M. (2016). Sourcing decision under disruption risk with supply and demand uncertainty: a newsvendor approach. Ann. Oper. Res. 237, 237–262. doi: 10.1007/s10479-014-1649-8
Schmidt, W., and Raman, A. (2022). Operational disruptions, firm risk, and control systems. Manuf. Serv. Oper. Manage. 24, 411–429. doi: 10.1287/msom.2020.0943
Soni, U., Jain, V., and Kumar, S. (2014). Measuring supply chain resilience using a deterministic modeling approach. Comput. Indus. Eng. 74, 11–25. doi: 10.1016/j.cie.2014.04.019
Sunil, T., Pankaj, S., and Kumar, J. A. (2023). Digitalization & Covid-19: an institutional-contingency theoretic analysis of supply chain digitalization. Int. J. Prod. Econ. 267:109063. doi: 10.1016/j.ijpe.2023.109063
Thanh, P. H., Raffaele, T., and Chiara, V. (2023). The impact of operational risk on performance in supply chains and the moderating role of integration. Balt. J. Manage. 18, 207–225. doi: 10.1108/BJM-10-2021-0385
Vipul, J., Sameer, K., Umang, S., and Charu, C. (2017). Supply chain resilience: model development and empirical analysis. Int. J. Prod. Res. 55, 6779–6800. doi: 10.1080/00207543.2017.1349947
Wu, D., Li, P., Chen, J. H., and Wang, H. (2023). Coordination strategies of dual channel closed-loop supply chain considering demand disruptions. Euro. J. Indus. Eng. 17, 597–626. doi: 10.1504/EJIE.2023.131733
Xiang, S. K., Boon, O. K., Han, T. G. W., and Hsien, L. V. (2023). Enhancing supply chain resilience in SMEs: a deep Learning-based approach to managing Covid-19 disruption risks. J. Enterp. Inf. Manage. 36, 1508–1532. doi: 10.1108/JEIM-06-2023-0298
Xu, Q., Wang, W., Liu, Z., and Tong, P. (2018). The influence of online subsidies service on online-to-offline supply chain. Asia Pac. J. Oper. Res. 35:184007. doi: 10.1142/S0217595918400079
Yan, B., Chen, Z., Liu, Y., and Chen, X. (2021). Pricing decision and coordination mechanism of dual-channel supply chain dominated by a risk-aversion retailer under demand disruption. Rairo-Oper. Res. 55, 433–456. doi: 10.1051/ro/2021013
Yang, H., Ma, W., Cheng, R., Wu, B., Wang, Y., and Zheng, P. (2025). A novel game approach to integrating traffic assignment and signal control for enhanced efficiency and environmental performance in mixed networks. Transp. Res. C: Emerg. Technol. 171:105017. doi: 10.1016/j.trc.2025.105017
Yao, Q., Shao, L., and Chen, Z. (2023). Should low-carbon subsidies be given to real estate developers or homebuyers? An evolutionary game theory analysis on small-world networks. Energy Build. 301:113709. doi: 10.1016/j.enbuild.2023.113709
Ye, Z., Wang, J., Zhang, G., and Zhao, H. (2024). One-stop service to enhance maritime resilience. Ocean Coast. Manage. 251, 107072. doi: 10.1016/j.ocecoaman.2024.107072
Zhai, Y. K., Bu, C. H., and Zhou, P. (2022). Effects of channel power structures on pricing and service provision decisions in a supply chain: a perspective of demand disruptions. Comput. Indus. Eng. 173:108715. doi: 10.1016/j.cie.2022.108715
Keywords: food supply chain resilience, demand disruption risk, cost-sharing contracts, benefit-sharing contracts, capacity restoration
Citation: Liu J, Kang K, Lu L, Dong R, Luo X, Li C, Long P, Yang X and Mao S (2025) Decision analysis considering the resilience level of the food supply chain under the risk of demand disruption. Front. Sustain. Food Syst. 9:1563938. doi: 10.3389/fsufs.2025.1563938
Received: 07 February 2025; Accepted: 20 August 2025;
Published: 15 September 2025.
Edited by:
Omar Alsetoohy, University of Sadat City, EgyptReviewed by:
Zhen Chen, Huludao Central Hospital, ChinaFeng Guo, Huazhong University of Science and Technology, China
Peng Liu, Shenyang University of Technology, China
Yingdong Tian, Fuyang Normal University, China
Copyright © 2025 Liu, Kang, Lu, Dong, Luo, Li, Long, Yang and Mao. This is an open-access article distributed under the terms of the Creative Commons Attribution License (CC BY). The use, distribution or reproduction in other forums is permitted, provided the original author(s) and the copyright owner(s) are credited and that the original publication in this journal is cited, in accordance with accepted academic practice. No use, distribution or reproduction is permitted which does not comply with these terms.
*Correspondence: Lin Lu, bHVsaW4zNTVAMTYzLmNvbQ==; Ruihai Dong, ZG9uZ3JoLnNkc3lAc2lub3BlYy5jb20=; Xiaochun Luo, NTc3NDcyNzhAcXEuY29t
†These authors share first authorship