 Minhao Lu
 Yingmei Wu
 Chao Zhang
- Faculty of Geography, Yunnan Normal University, Kunming, China
Introduction: Trade plays a pivotal role in maintaining global grain security. However, the grain trade network (GTN) within Regional Comprehensive Economic Partnership (RCEP) member countries remains unclear. Analyzing grain flow characteristics and the agreement’s potential impacts are essential to fostering resilient economic and trade cooperation within the world’s largest free trade area.
Methods: This study constructed a trade network analysis framework incorporating complex network topology, competition intensity, interdependence intensity, and robustness. It examined the grain trade patterns and coopetition relationships from 2000 to 2020. Building on this, the study created the “Five Forces” model to analyze evolutionary mechanisms in the GTN and explored the potential impacts of trade agreements through trade diversion and creation effects.
Results: (1) The GTN has grown increasingly complex and interconnected, with key nodes exhibiting trends toward homogenization. By 2020, Australia, Viet Nam, Myanmar, Thailand, and Cambodia collectively accounted for 95.70% of total exports, emerging as major grain exporters in the GTN. (2) The GTN exhibits high competition and low interdependence. Populous countries with constrained arable land resources, such as China, Philippines, Malaysia, South Korea, and Indonesia, face intense import competition. Concerns over external supply security have led to diversified trade behaviors among member countries, fostering a trade pattern characterized by low interdependence (87.23%). (3) The robustness of the GTN has significantly improved due to the complexity of network structures and the homogenization of key node positions. Countries such as Thailand and Australia, with high Betweenness centrality values, play crucial roles in maintaining stability. Meanwhile, Viet Nam and China, as major import–export countries, are exerting growing influence in the GTN. (4) The evolution of the GTN is shaped by the interactive effects of five key forces: resource endowments, domestic demand, economic conditions, geopolitical relations, and important events. Differentiated tariff reduction commitments and reduced non-tariff measures are expected to generate trade diversion and creation effects. Such policy measures may reallocate intra-regional trade flows and expand trade volumes while intensifying import competition.
Discussion: From a complex network perspective, this study provides valuable policy insights for RCEP member countries to leverage their strengths and participate more effectively in agricultural trade.
1 Introduction
Grain trade has remained a focal point of sustained attention across various sectors (Chen and Zhang, 2022). Recently, the rise of unilateralism and backlash against globalization have introduced significant uncertainties to global trade (Gong et al., 2022). Influenced by factors such as health crises (Alabi and Ngwenyama, 2023), regional conflicts (Liu L. et al., 2023; Liu H. et al., 2023), and trade policy changes (Yang et al., 2022), the vulnerability of grain trade systems has become increasingly evident (Zhang et al., 2021a,b), impacting the achievement of the global Zero Hunger goal (SDG 2) by 2030 (FAO, 2023).
In the context of rising anti-globalization sentiments, participating in regional trade agreements has become one of the key strategies for countries to address risks in grain trade (Zhang and Gong, 2022). Existing research has shown that trade agreements such as Association of Southeast Asian Nations (ASEAN), North American Free Trade Agreement (NAFTA), and Transatlantic Trade and Investment Partnership (TTIP) have facilitated the integration of regional agricultural markets, contributing to the agricultural development of member countries (Greenville and Kawasaki, 2018; Zahniser et al., 2015; Bureau et al., 2014). The world’s largest free trade agreement, the Regional Comprehensive Economic Partnership (RCEP), was signed in 2020. The member countries of RCEP represent a significant global population aggregation district (24.64% of the world’s population) and a major grain production area (27.17% of global grain production) in 2022. Agricultural trade is one of the key traditional areas of cooperation among RCEP member countries. The agreement includes provisions for agricultural trade, such as tariff reduction, rules of origin, trade facilitation, negative list, and trade remedy, with the overarching goal of maximizing trade liberalization and facilitation within the region (Zuo et al., 2024).
The Customs Unions Issue argues that trade agreements lead to trade diversion and trade creation effects, with agricultural products subject to higher tariff rates being more sensitive to these impacts (Viner, 2014; Hoekman and Nicita, 2011). Currently, scholars have conducted extensive research on trade promotion effects of RCEP provisions from a commodity trade perspective (Wei, 2024; Zainuddin et al., 2020). However, studies on grain trade tend to focus on unilateral or bilateral relations based on value quantity, with limited research exploring the overall intra-regional trade pattern. On one hand, scholars have analyzed the bilateral grain flow characteristics among RCEP member countries, such as examining trade structures with between China and other countries (Chen and Wang, 2021). On the other hand, there are studies discussing the post-signing impacts of the agreement on individual countries, such as analyzing each country’s involvement in agricultural value chains (Cui et al., 2025) and forecasting the potential rice export markets for Vietnam (Chakradhar and Thao, 2024). However, there remains a lack of research on multilateral trade relations, and the potential impact of RCEP on the overall grain trade pattern remains an area with considerable room for exploration.
Investigating the complex characteristics of grain flows among RCEP member countries is a fundamental prerequisite for analyzing the potential impact of RCEP on regional GTN. Complex network analysis methods provide a solid foundation for addressing this issue. Currently, there is relatively abundant research based on complex network methods from the “cooperation relationship” perspective (Liu L. et al., 2023; Liu H. et al., 2023), exploring global trade patterns in different food types (Duan et al., 2022; Sun et al., 2018; Burkholz and Schweitzer, 2019; Zhang et al., 2022). However, research on trade from the “competition relationship” perspective remains mostly focused on energy (Zhang et al., 2014; Chen et al., 2016) and key minerals (Zhu et al., 2023; Li et al., 2022). Research indicates that, within the increasingly complex global trade network, trade relations between countries exhibit both interdependence and competition, and trade networks dominated by core countries are gradually evolving into a “robust but fragile” structure (Puma et al., 2015). That is, when major exporting countries restrict exports, it is more likely to trigger supply disruptions and exacerbate competition risks for importing countries. For grain, which is also a strategic resource, existing studies mostly analyze global trade patterns from a cooperation perspective based on trade value quantity (Wang and Dai, 2021). In the field of regional grain trade, research is mostly limited to areas such as the Belt and Road (Miao et al., 2024; Zhang et al., 2021a,b), the European Union (Bojnec and Fertő, 2009), and the China-Pakistan free trade agreement (Khan et al., 2024), while there is relatively limited attention to the grain trade network within RCEP, the world’s largest free trade area. Therefore, considering the unique role of regional grain trade in ensuring global grain security, it is necessary to reveal the structural characteristics, coopetition relationships, robustness, and evolutionary mechanisms of the RCEP regional trade network, serving as a basis for exploring the potential impacts of RCEP.
In summary, there are still the following gaps in the research on the grain trade pattern among RCEP member countries: (1) Due to the limited time since RCEP’s implementation, the coopetition relationships and robustness of the GTN among member countries have not been fully explored. Specifically, how competition within the GTN is shaped by similar geographical environments remains unclear; (2) Due to the relatively small number of member countries, traditional quantitative methods used to reveal the evolutionary mechanisms of complex networks have shown limited effectiveness, and further investigation is needed to effectively uncover the evolutionary mechanisms of the GTN within the world’s largest free trade area; (3) The impact of tariff and non-tariff barrier reductions under RCEP on the cooperation and competition of the GTN still requires further exploration.
Therefore, this study approaches the issue from the perspective of multilateral trade relations, focusing on major grains (rice, wheat, and maize), and attempts to answer the following questions: (1) What are the characteristics of the GTN among RCEP member countries and their competition and interdependence from the perspective of physical quantity? (2) What are the evolutionary mechanisms of the GTN? (3) What are the potential impacts of RCEP on the GTN? To address these questions, this study applies complex network method, constructing the GTN among RCEP member countries based on FAO trade matrix data from 2000 to 2020, revealing the evolution characteristics of the grain trade pattern. On this basis, competition intensity index and interdependence index are introduced to clarify the coopetition relationships between countries, and the network’s robustness is simulated and analyzed. Furthermore, this study creates the “Five Forces” model to analyze the evolutionary mechanisms of the GTN. Finally, the potential impacts of RCEP on reshaping the GTN are explored based on trade diversion and creation effects. This study aims to clarify the grain trade pattern within the region before the agreement was signed, thereby firmly establishing a baseline for measuring the direction and magnitude of subsequent changes. It aims to provide a theoretical perspective and practical basis for promoting regional grain trade cooperation and ensuring the security of the regional trade network.
2 Data and methodology
2.1 Data source and processing
The RCEP member countries include the ASEAN countries (Brunei, Cambodia, Indonesia, Laos, Malaysia, Philippines, Singapore, Thailand, Myanmar, and Viet Nam) along with China, Japan, South Korea, Australia, and New Zealand, totaling 15 countries. This study focuses on three key grains: rice, wheat, and maize. The trade data is derived from the FAOSTAT Detailed Trade Matrix dataset (http://faostat.fao.org, accessed 10 January 2024), while grain import/export volumes and production data are obtained from the FAO Food Balance Sheets. The analysis covers the period from 2000 to 2020. Notably, for Brunei, Cambodia, Myanmar, Laos, and Viet Nam, certain years have missing import data; in these cases, export volumes from other countries to these countries were used as Supplementary data. Additionally, trade data for China excludes Hong Kong, Macau, and Taiwan. As shown in Figure 1, this study constructs the GTN based on import volume data and analyzes the trade network structure, coopetition relationships, and network robustness of RCEP member countries using Gephi, Python, and MATLAB. Furthermore, the “Five Forces” model is created to uncover the evolutionary mechanisms of the network. Finally, the potential impacts of RCEP are evaluated based on trade diversion and creation effects.
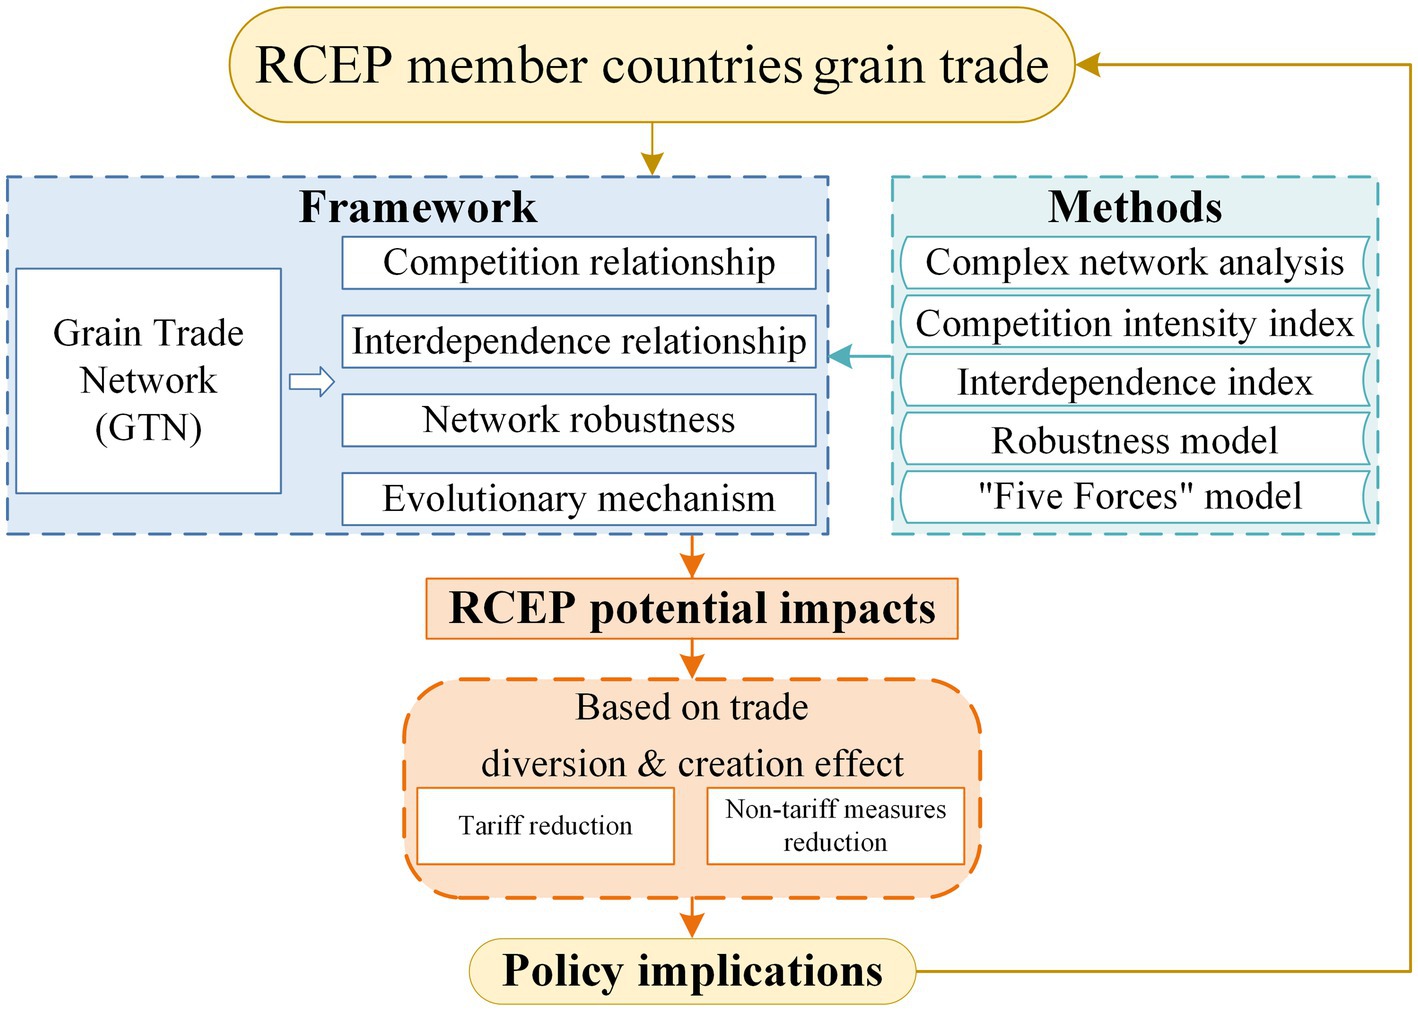
Figure 1. Research framework for the RCEP member countries GTN.
2.2 Research methods
2.2.1 Complex network analysis
According to graph theory, the RCEP member countries GTN is defined as follows:
In the formula (1), V represents the set of all nodes (i.e., countries), L is the set of all edges (i.e., the trade links between two countries), W and W′ represent the function sets of all node attributes (i.e., the number of trade links each country possesses) and all edge attributes (i.e., the total trade volume between two countries), respectively. T denotes the set of years for each trade network. In this context, RCEP member countries are treated as nodes, trade relationships between countries are treated as edges, and the grain trade volume (t) is the weight of the edges (Wasserman and Faust, 1994).
Based on the construction of the trade network, the following indicators are used for network feature analysis (Table 1).
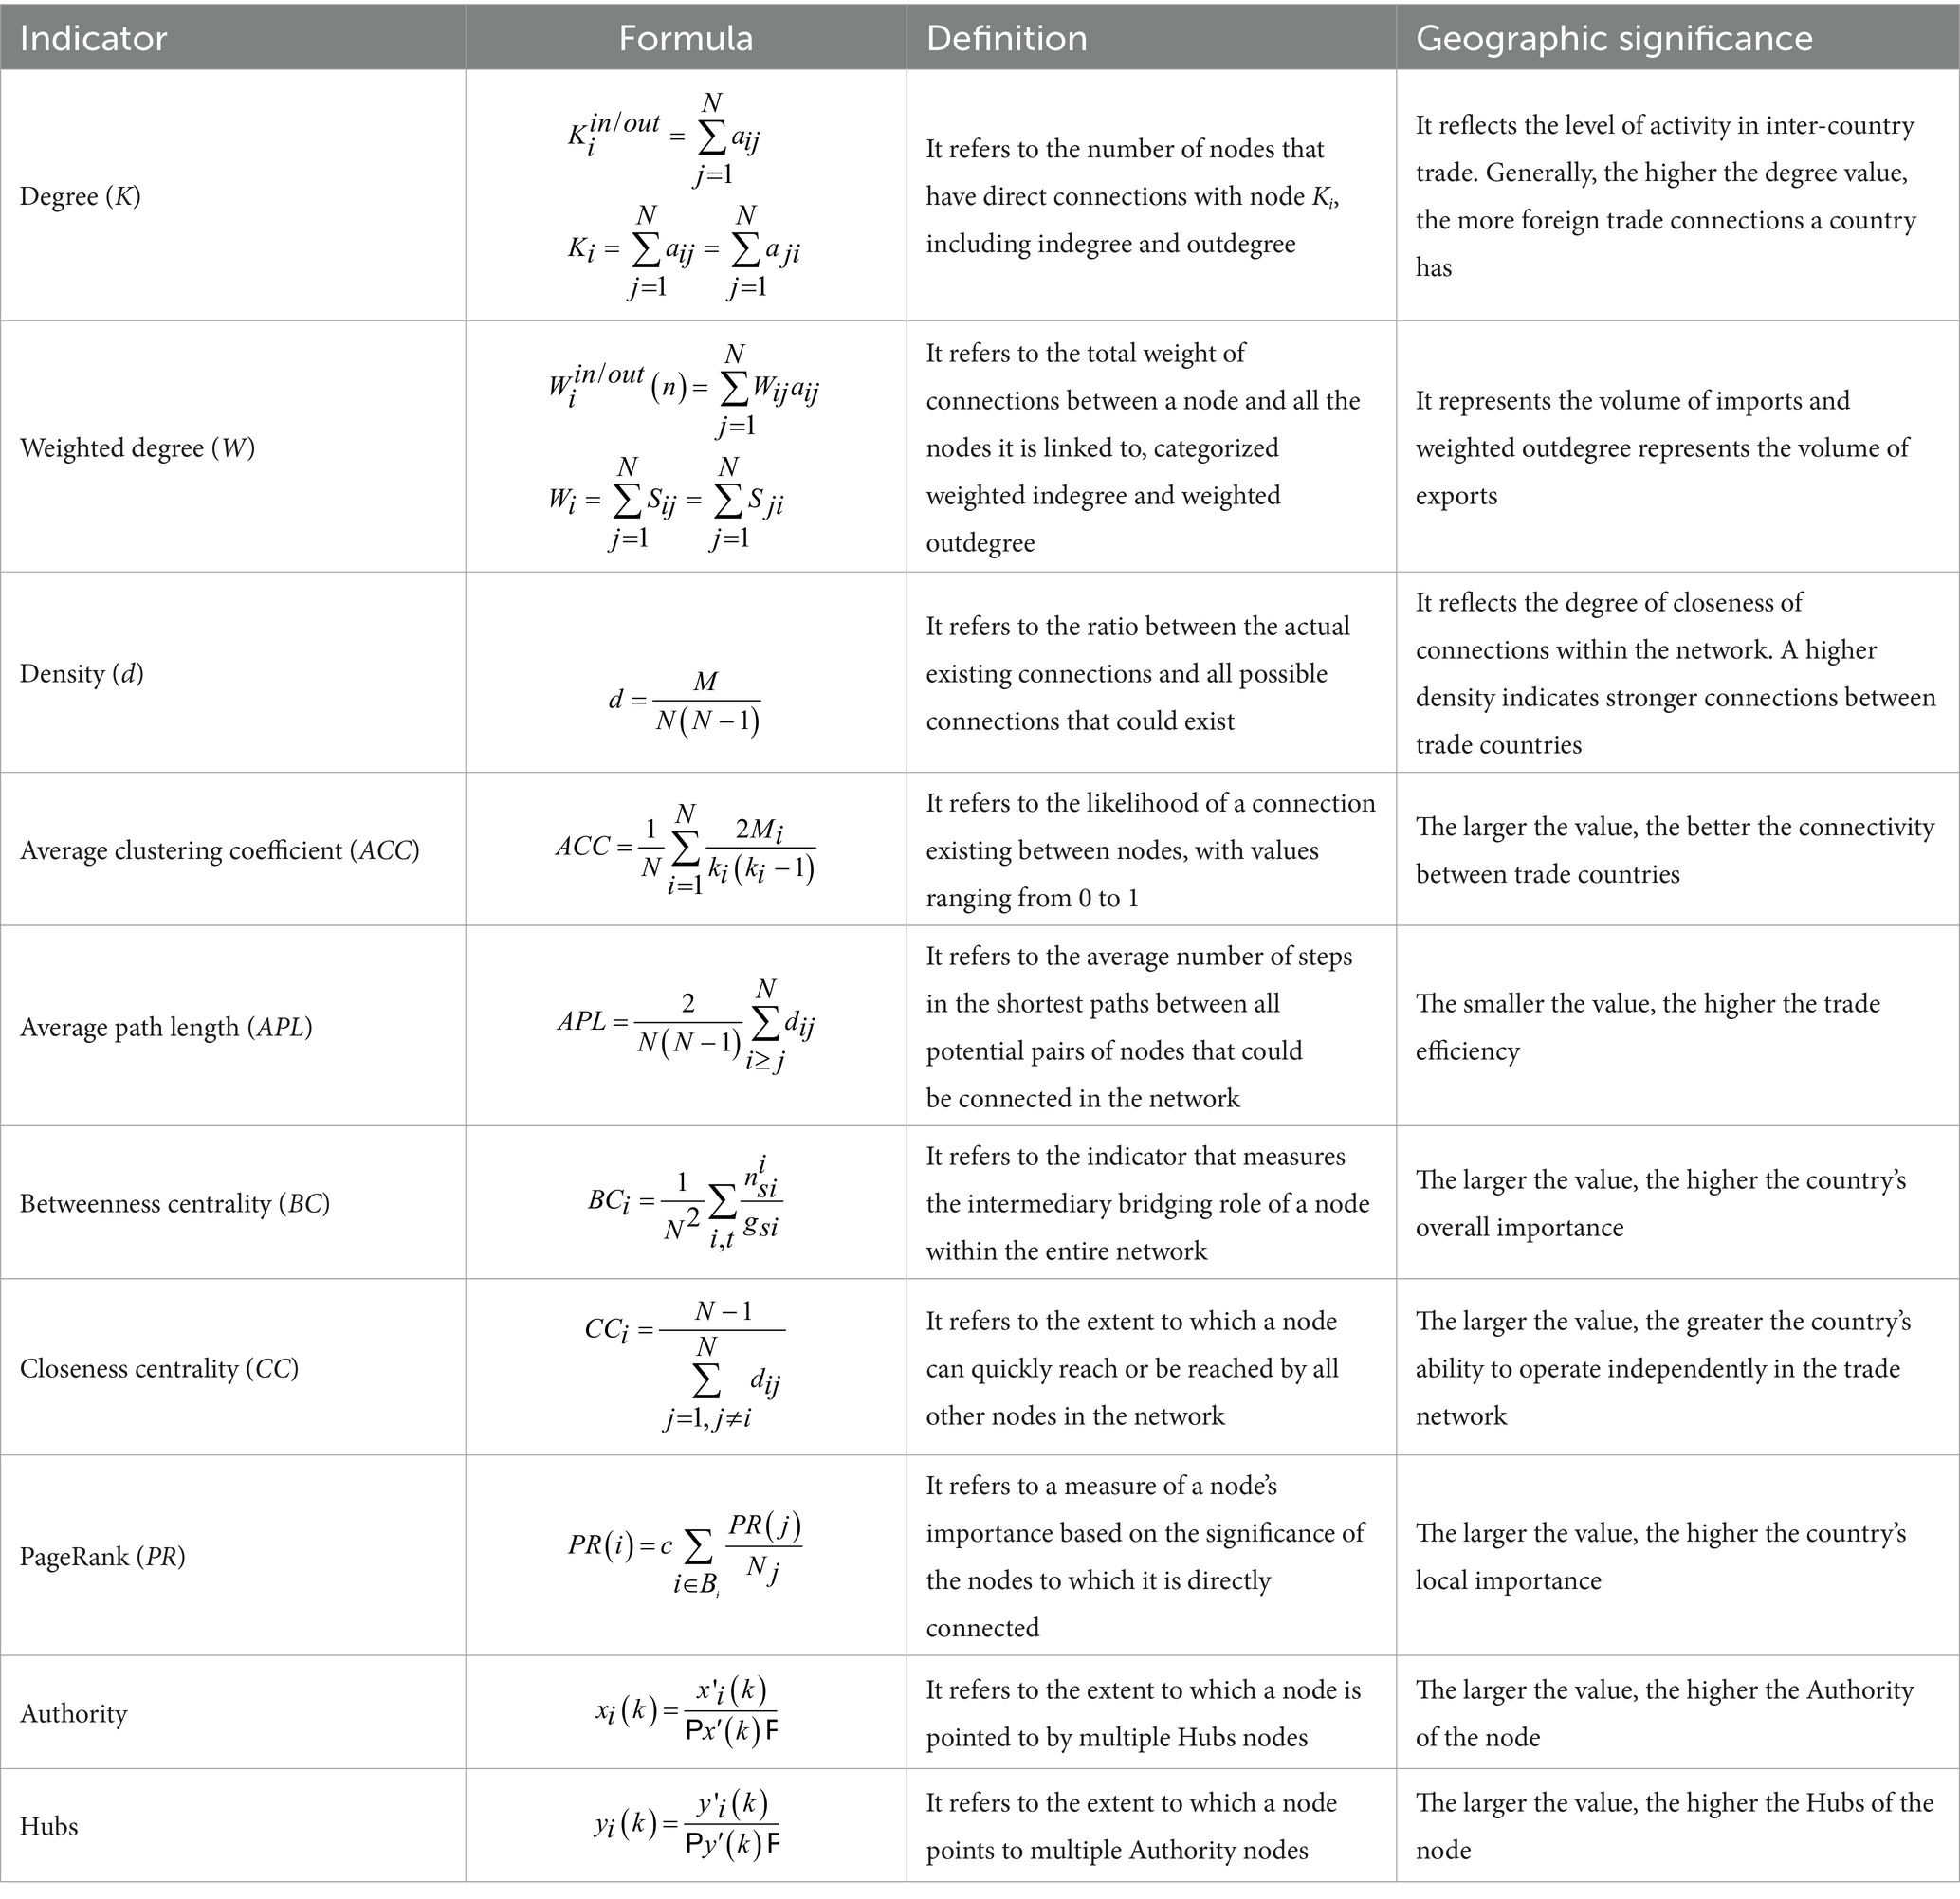
Table 1. The RCEP member countries GTN analysis method and its geographical significance.
2.2.2 Competition intensity index
Due to differences in import volumes and import structures, the competition intensity between grain-importing countries varies. Therefore, drawing on the competition intensity index proposed by Glick and Rose (1999) and Zhang et al. (2014), this study measures the competitive level between countries. The formula is as follows:
In the formula (2), represents the trade competition intensity between grain-importing countries and . and represent the grain trade volumes imported by countries and from the common importing source c, respectively. and represent the total grain imports of countries and , while denotes the total regional grain imports. The larger the value of , the greater the import competition intensity between grain-importing countries and , indicating more intense competition. Due to the widespread nature of grain trade, import competition exists between nearly all countries. As supported by existing studies (Wang and Fan, 2023), this study sets a threshold of 0.1. If ≥0.1, the competition intensity between grain-importing countries and is maintained as , indicating the presence of import competition with intensity . If <0.1 then =0, indicating no import competition between countries and .
2.2.3 Interdependence intensity index
The interdependence index can be used to characterize the interdependence relationship between countries in grain trade. Drawing on the Grubel-Lloyd index (Grubel and Lloyd, 1975), the formula for constructing the interdependence index of grain trade is as follows:
In the formula (3), and represent the grain export volume of country i to country j and the grain import volume of country i from country j, respectively. The value of represents the grain trade interdependence index between countries i and j. The larger the value of , the stronger the interdependence in grain trade between the two countries. When ≥0.5, it indicates a high level of interdependence. When 0.2< <0.5, it indicates a medium level of interdependence. When ≤0.2, it indicates a low level of interdependence. When =0, it indicates a one-way dependence.
2.2.4 Robustness
Robustness refers to the ability of a network to maintain its structure and function, either fully or partially, after nodes or edges are subjected to external attacks. When assessing the vulnerability of the trade network, network efficiency (E) is a good indicator of the network’s topological performance, particularly the connectivity between nodes and overall efficiency. It is widely used in evaluating the network’s robustness (Crucitti et al., 2003). Network efficiency is defined as the average of the reciprocal of the distances between all pairs of nodes in the network. The formula is as follows:
In the specific evaluation, the objects of simulated attacks are typically nodes and edges. The attack methods are generally divided into random attacks and targeted attacks. Random attacks generate random sequences using MATLAB to attack nodes or edges sequentially, calculating the new trade network efficiency by the formula (4) until there are no remaining nodes or edges in the network. Since countries with large trade volumes or important positions inevitably impact the trade network once they implement import–export control measures, targeted attacks are also considered. Referring to existing studies (Karakoc and Konar, 2021; Gutiérrez-Moya et al., 2021), targeted attacks on nodes are conducted based on five indicators: Degree, Betweenness centrality, Closeness centrality, Hubs, and Authority. Targeted attacks on edges are conducted by the weight of the edges. These nodes or edges are sequentially removed according to their indicator values. The updated trade network is then obtained, and its network efficiency is recalculated until all nodes or edges are removed. The robustness of the trade network is analyzed based on the changes in network efficiency.
2.2.5 “Five forces” model
Existing studies have explored the evolution mechanisms of trade network from natural, economic, political, policy, and cultural perspectives (Nie et al., 2021). Building on these studies, this research incorporates the geographical attributes and development characteristics of RCEP member countries and comprehensively considers factors such as resource endowments, domestic demand, economic conditions, geopolitical relations, and important events to analyze their impact on this regional trade network. Accordingly, we create the “Five Forces” model, which is defined as follows:
(1) Resource endowment: Within the region, there is significant heterogeneity in arable land endowment, which is closely linked to domestic grain supply capacity. The region includes countries with abundant arable land, such as China and Australia, as well as those with relatively scarce land resources, such as South Korea and Japan. Additionally, differences in cropping patterns and yield levels vary across countries. According to the Factor Endowment Theory, disparities in resource availability serve as a key driving force behind international trade. Therefore, it is necessary to explore the relationship between domestic supply capacity and trade links from the perspective of arable land resource endowment. We define this driving force as the “potential difference force” in the evolution of the GTN.
(2) Domestic demand: Population size differences serve as a fundamental factor driving variations in grain demand. The RCEP region includes populous countries such as China, Indonesia, and Japan, each with a population exceeding 100 million, as well as countries like Australia, which have abundant arable land but relatively small populations. These disparities in population size lead to differences in domestic demand, where shifts in population size drive changes in demand, subsequently influencing import volumes. This dynamic acts as the “reconstructing force” in the evolution of the GTN.
(3) Economic conditions: Changes in economic development levels are a key driver of shifts in grain demand. The RCEP region includes rapidly developing countries such as China and Viet Nam, where economic growth has led to rising demand for animal-based food products, thereby increasing grain consumption and import demand. This dynamic serves as the “propelling force” in the evolution of the GTN.
(4) Geopolitical relations: RCEP member countries are naturally proximate, and under the influence of the First Law of Geography, the cost advantages of trade serve as the initial “traction force” in the formation of the trade network. Additionally, this region represents a geostrategic intersection of great powers, where geopolitical competition among major nations shapes interregional relations and further provides traction for the evolution of the GTN.
(5) Important events: The impact of important events on trade networks has been widely recognized. Therefore, it is essential to analyze how both intra-regional and extra-regional events influence the evolution of the trade network. This influence is referred to as the “disturbing force” in the evolution of the GTN.
3 Results
3.1 Topology characteristics of the trade network
The RCEP member countries GTN has become increasingly complex, with closer ties between countries. From 2000 to 2020, the number of network edges increased from 94 to 144, representing a rise of 53.20%, which indicates a significant growth in network complexity. The network density increased from 0.448 to 0.686, representing a 53.13% growth, while the average path length decreased from 1.582 to 1.270, reflecting a 19.72% reduction. During the study period, trade cooperation within the China-ASEAN Free Trade Area and the Greater Mekong Sub region deepened progressively, fostering a more integrated trade network and a more diversified range of trade partners.
The dominance of major countries in the GTN is significant, but the dominance effect has decreased (Table 2). Regarding weighted indegree (Figure 2 and Supplementary Figure S1), in 2000, South Korea, Indonesia, Malaysia, Japan, and Philippines ranked among the top five, collectively contributing 88.90% of total imports. South Korea alone accounted for 37.05%, with imports reaching 7.71 × 10⁶ tons. By 2010, the combined import proportion of the top five countries had declined to 72.02%. By 2020, China, Philippines, Thailand, South Korea, and Malaysia emerged as the top five countries in terms of weighted indegree, with their combined import proportion reaching 71.42% and consistently remaining above 70%.
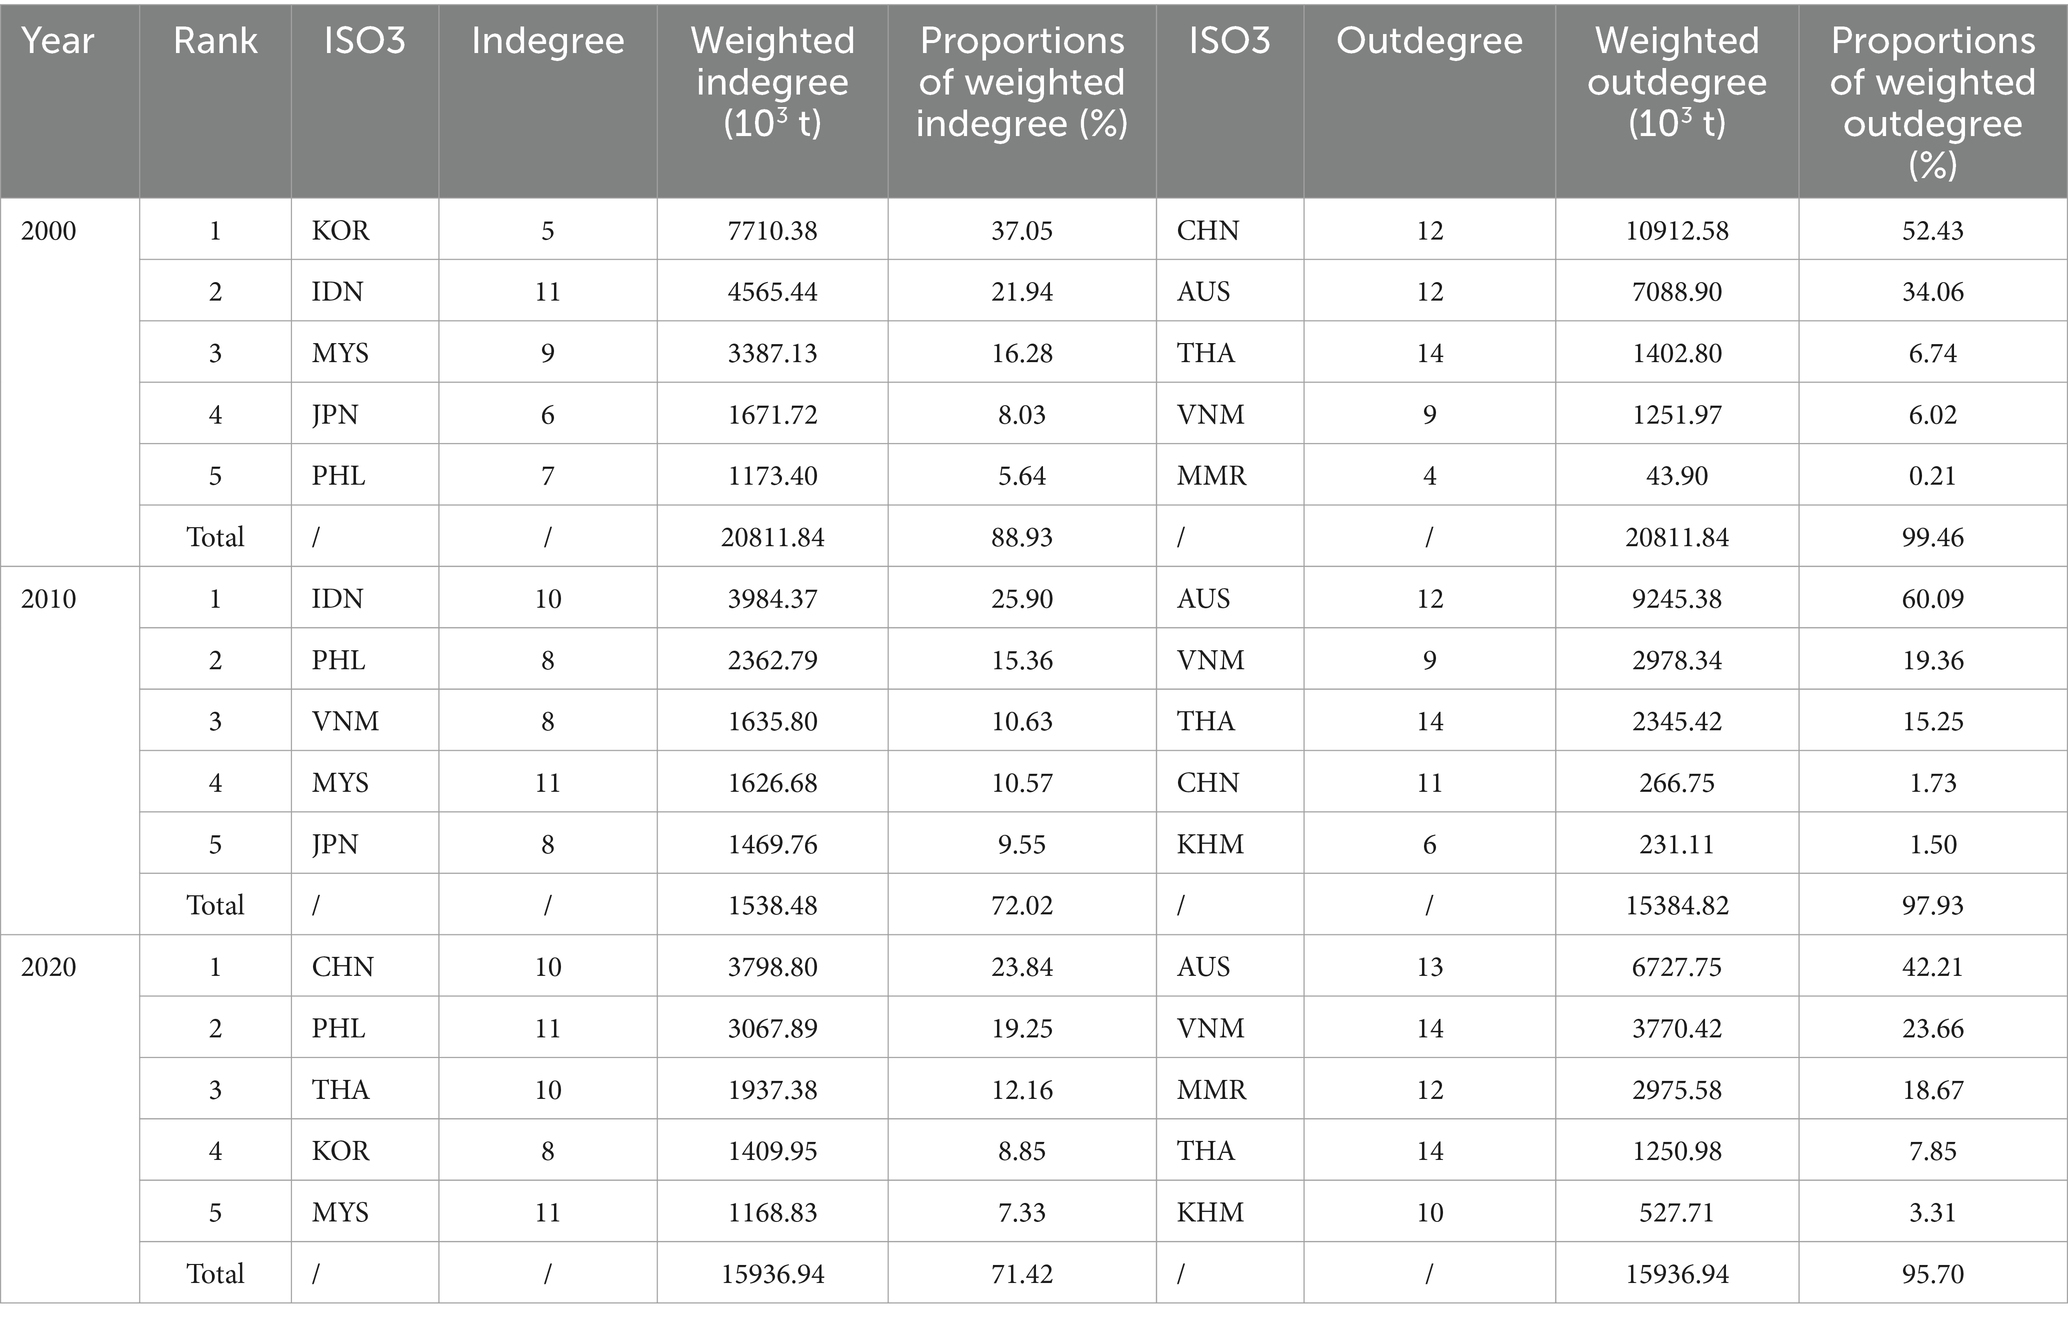
Table 2. Characteristics of the RCEP member countries GTN core node.
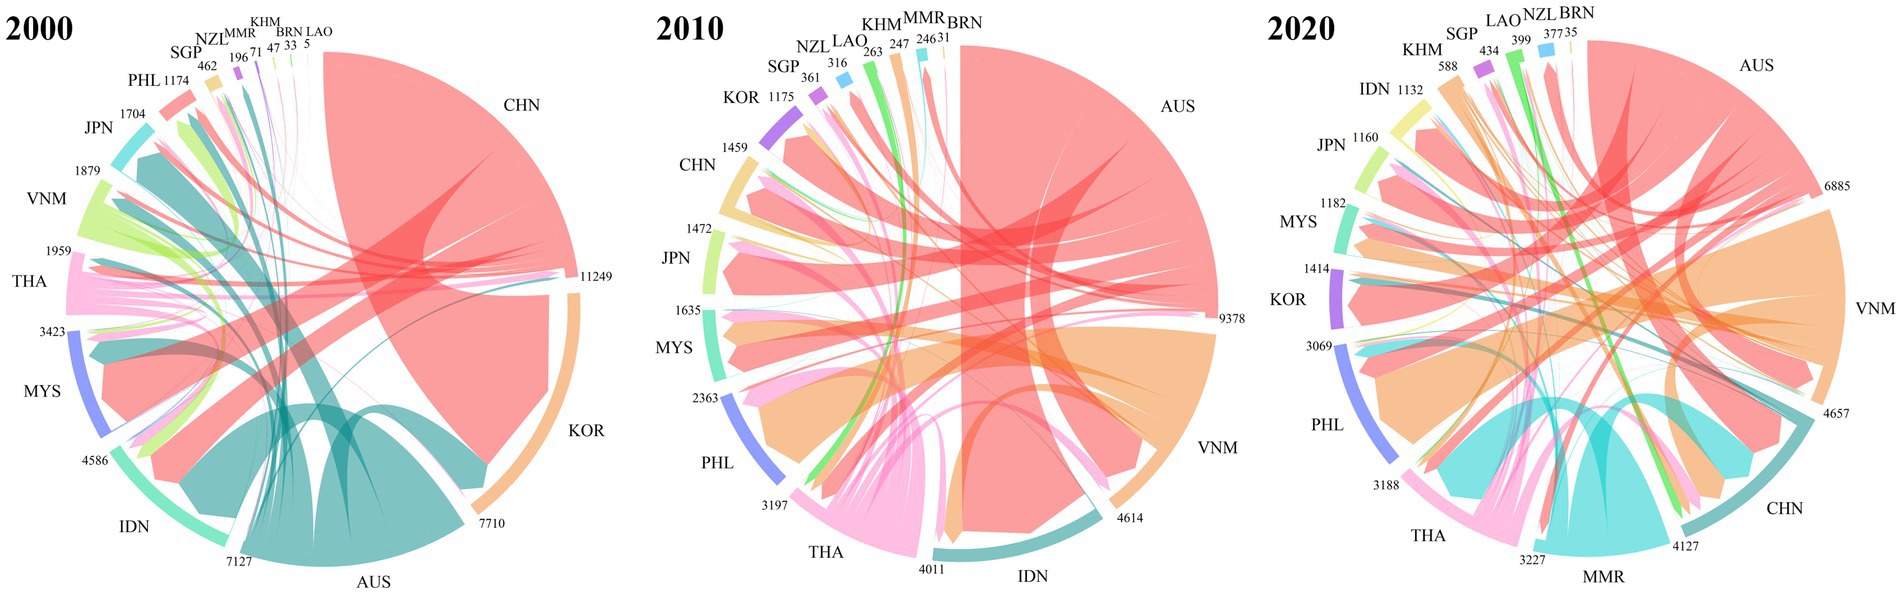
Figure 2. Grain trade flow of the RCEP member countries. Note: Countries are ranked by the total trade volumes and plotted clockwise in descending order. The size of the out bar indicates the total trade volumes (unit: 103t).
Regarding weighted outdegree, in 2000, China, Australia, Thailand, Viet Nam, and Myanmar ranked among the top five, collectively accounting for 99.46% of total exports. By 2010, the combined export proportion of the top five countries had slightly declined. By 2020, Australia, Viet Nam, Myanmar, Thailand, and Cambodia held the highest weighted outdegree, with their combined export proportion reaching 95.70%.
Countries with overall importance and local importance are primarily major grain exporters, and the role of core trade nodes has become increasingly homogenized. From an overall importance perspective (Supplementary Figure S2A), in 2000, Thailand, Indonesia, Australia, Singapore, and Malaysia exhibited the highest Betweenness centrality. By 2010, Japan and China had entered the top five. In 2020, Thailand’s rank fell to fourth, Australia rose to first, and Viet Nam, China, and Japan secured positions in the top five. The Betweenness centrality values of the top five countries exhibited a stepwise decline, reflecting a trend toward homogenization of trade roles among countries with significant overall influence. From a local importance perspective (Supplementary Figure S2B), in 2000, Indonesia, Malaysia, Australia, Singapore, and Thailand achieved the highest PageRank scores. By 2010, Australia had surged to first place. In 2020, Singapore, Australia, Malaysia, Philippines, and Viet Nam ranked among the top five. Known as the “Crossroads of the East,” Singapore has leveraged its port advantages to become the most influential player among neighboring countries. Australia, Viet Nam, and Thailand, as major exporting countries, occupy significant positions in the trade network.
3.2 Competition relationships among RCEP member countries
From 2000 to 2020, the scale of grain trade among RCEP member countries expanded substantially, accompanied by a rise in the number of competition relationships in trade. The overall competition intensity increased, but the growth rate was moderate. The evolution of competition intensity can be categorized into three stages (Supplementary Figure S3): (1) From 2000 to 2007, competition intensity in grain trade fluctuated, remaining near its initial level. (2) From 2008 to 2012, competition intensity in grain trade steadily rose, peaking at 750.19 in 2014, representing a 52.14% increase compared to the early stage. (3) From 2013 to 2020, competition intensity in grain trade fluctuated before gradually declining. With member countries diversifying their trade partners, competition intensity eased. It began to decline gradually in 2017, reaching 515.45 in 2020, which approached the competitive level observed at the beginning of the period. Overall, competition intensity rose by 2.70% over the study period.
The main competition is concentrated among a few major importers, and the cumulative distribution of competition intensity among RCEP member countries follows the “key minority rule” (Figure 3). Using 70% cumulative competition intensity as the standard, 70% of the competition intensity in intra-regional grain trade comes from 15 to 30% of the competition relationships. This indicates that intense competition mainly occurs between a small number of major grain importers, while most countries experience relatively low levels of competition. This suggests that the competition intensity among member countries is unevenly distributed, with the majority concentrated in a few competition relationships.

Figure 3. Cumulative distribution of the competition intensity between RCEP member countries.
From the perspective of single country competition (Figure 4A and Supplementary Table S1), the top five countries in terms of competition intensity shifted from South Korea > Indonesia > Malaysia > Japan > Thailand in 2000 to China > Philippines > Malaysia > South Korea > Indonesia in 2020. In terms of competition intensity as a percentage (Figure 4B), South Korea’s competition intensity initially declined and then increased, with its proportion of total competition intensity dropping from 19 to 10%. Indonesia’s competition intensity remained stable initially before decreasing, with its proportion falling from 17 to 10%. Malaysia and Viet Nam maintained competition intensity proportion between 9–15% and 7–11%, respectively. Japan and Thailand’s competition intensity remained relatively stable, with proportion of 8 and 6% in 2020, respectively. Thailand’s competition intensity consistently remained low, with its proportion falling to 6%. China’s competition intensity proportion steadily increased, rising from 4 to 17%, making it the leader. The proportion of other RCEP member countries in grain trade competition increased overall, rising from 23 to 32%.
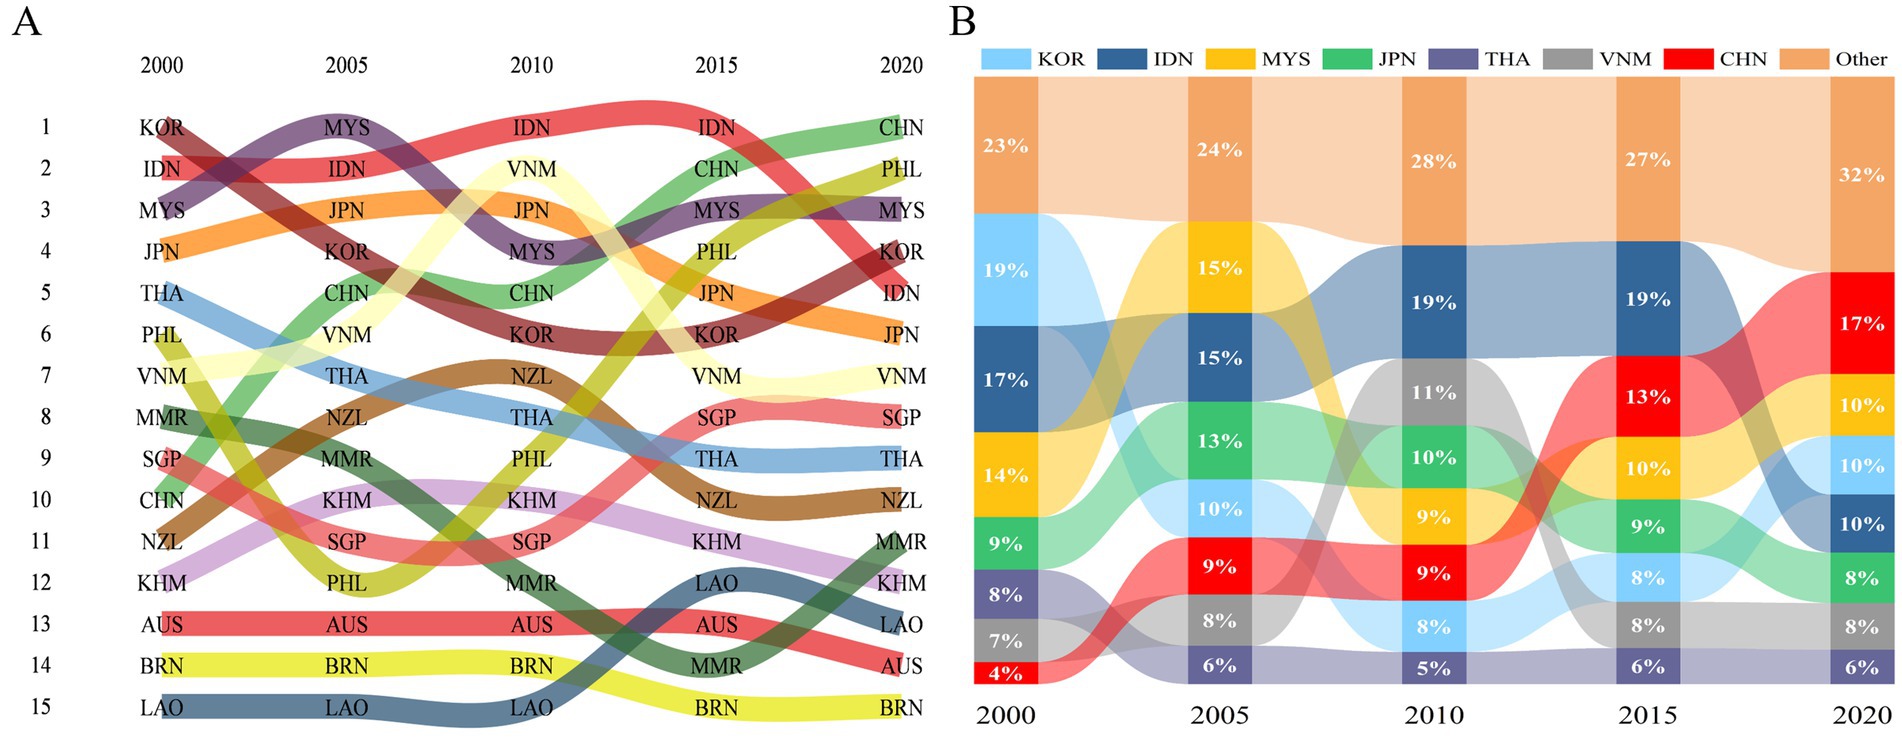
Figure 4. The changes of RCEP member countries competition intensity. (A) Rank. (B) Regional proportion.
From the perspective of inter-country competition (Table 3), in 2000, the top ten grain competition intensities primarily involved Indonesia, South Korea, Malaysia, and other ASEAN countries. By 2010, a pattern emerged where Indonesia and China became the primary competitors with other countries, signifying a notable shift in the main competition relationships. By 2020, competition between China and ASEAN countries dominated the top ten competition relationships.
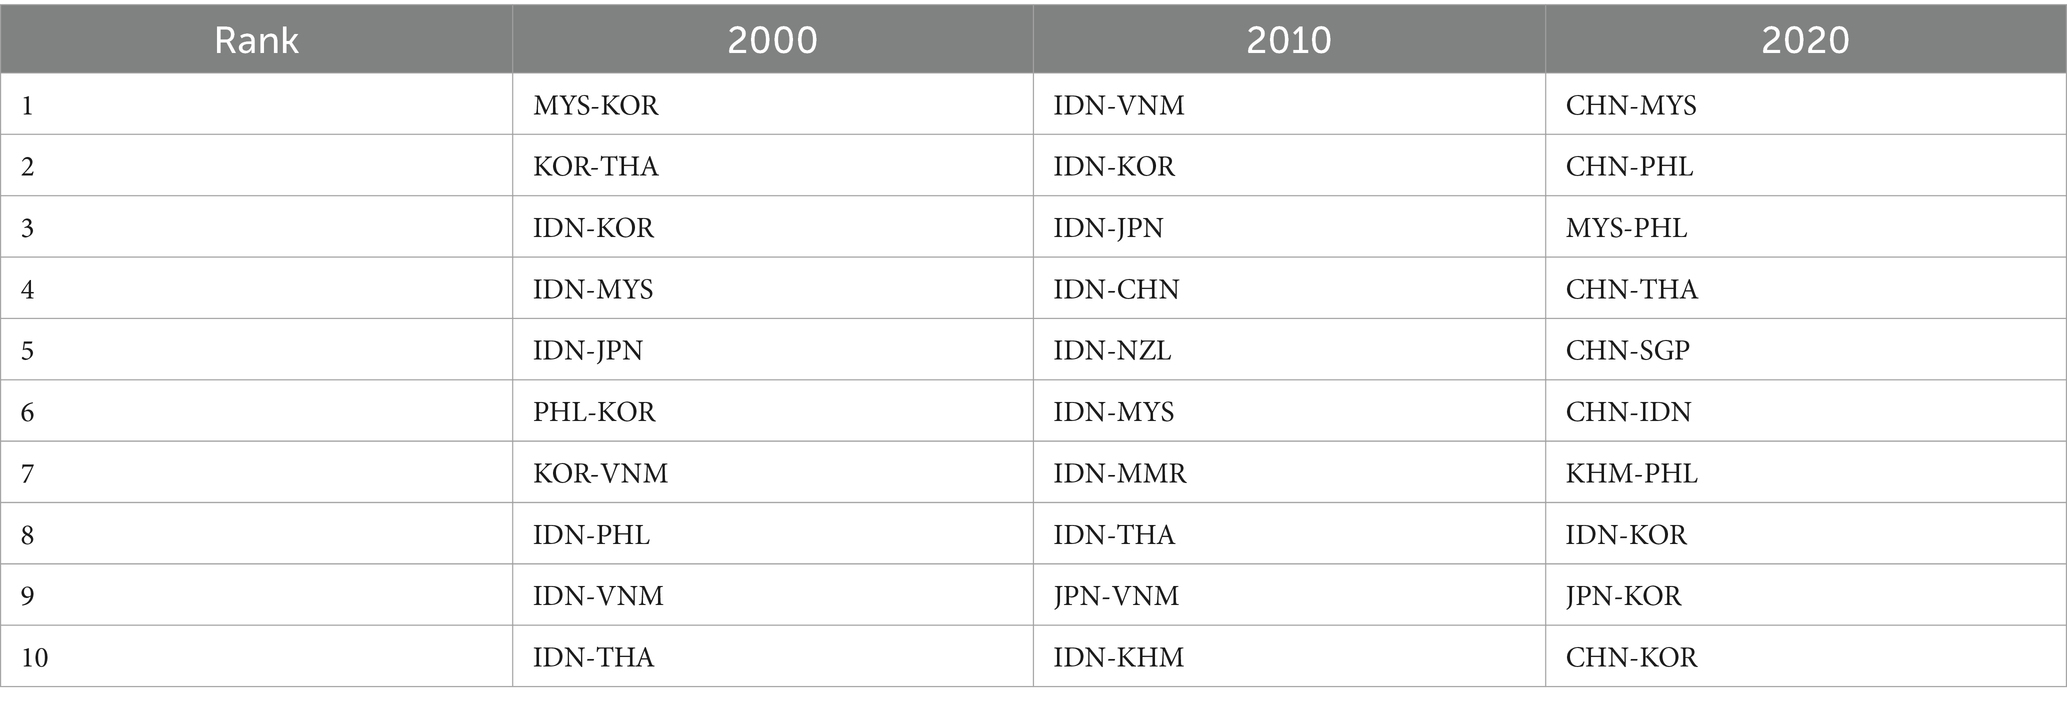
Table 3. Top ten country pairs ranked by competition intensity.
3.3 Interdependence relationships among RCEP member countries
From 2000 to 2020, the number of interdependence relationships among countries increased steadily, from 66 pairs to 94 pairs, representing a 42.42% growth and resulting in a more complex and interconnected interdependence pattern (Supplementary Figure S4). From the perspective of interdependence differentiation (Table 4), the proportion of high and medium interdependence relationships declined from 15.15 to 12.77%, while low interdependence relationships rose from 84.85 to 87.23%. Low interdependence relationships dominate, with the proportion of high and medium interdependence relationships steadily declining, remaining relatively stable between Thailand-Laos, Cambodia-Viet Nam, and Malaysia-Indonesia. This reflects the low interdependence in grain trade among RCEP member countries, highlighting the diversification of trade behavior in choosing grain import sources. Coupled with the increasing competition intensity within the region, this trend illustrates a decentralization of cooperation and a rise in competition, indicating that competition relationships outweigh cooperative ones. This can be attributed to the fact that although member countries exhibit diversified trade behaviors, their import volumes remain highly concentrated among the region’s major grain-exporting countries. These exporting countries maintain dominant positions in weighted outdegree and have limited import volumes, resulting in significant imbalances in trade scales among countries. This highlights a “high competition, low interdependence” competitive-cooperative dynamic.
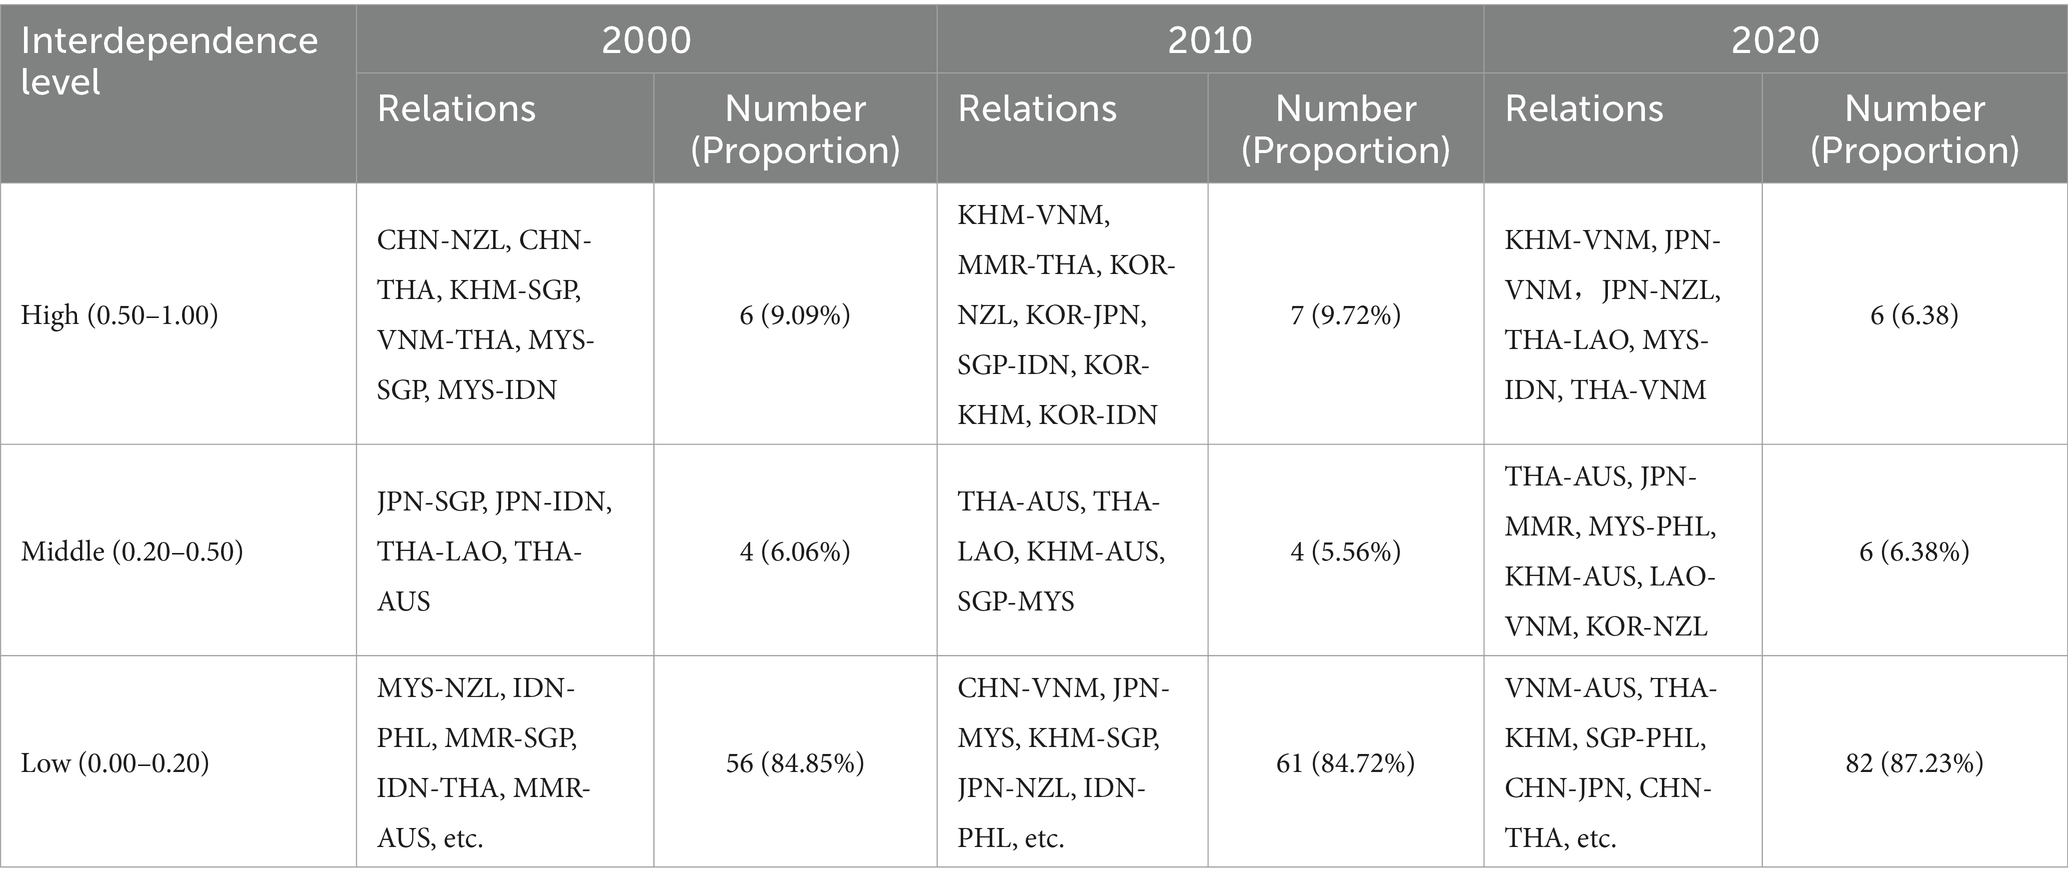
Table 4. Grain trade interdependence of RCEP member countries.
3.4 Robustness of the trade network
Results of random node attacks (Figure 5) reveal that in 2000, the GTN completely collapsed (network efficiency dropped to 0%) when 86.67% of the nodes were attacked. By 2010 and 2020, the percentage of nodes required to be attacked for the network to fully collapse increased to 93.33%. Targeted attacks results demonstrate that the decline in network efficiency occurs more rapidly compared to random attacks. However, the ranking of indicators influencing the rate of efficiency decline has remained relatively consistent over the years. As trade relations have grown closer, under targeted attacks, the percentage of nodes required to cause the network’s complete collapse rose from 66.67 to 86.67%. The slope of the network efficiency decline curve has gradually aligned with that of the random attack scenario, exhibiting an overall roughly uniform downward trend. In 2020, the centrality measures ranked as follows: Betweenness centrality > Degree > Hubs > Closeness centrality > Authority > Random attacks. This indicates that countries with high Betweenness centrality, such as Thailand and Australia, serve as key nodes in the GTN. Overall, the current robustness of the GTN under targeted attacks closely resembles that under random attacks. Diversified trade behaviors have partially enhanced the network’s robustness, strengthening its capacity to withstand shocks.
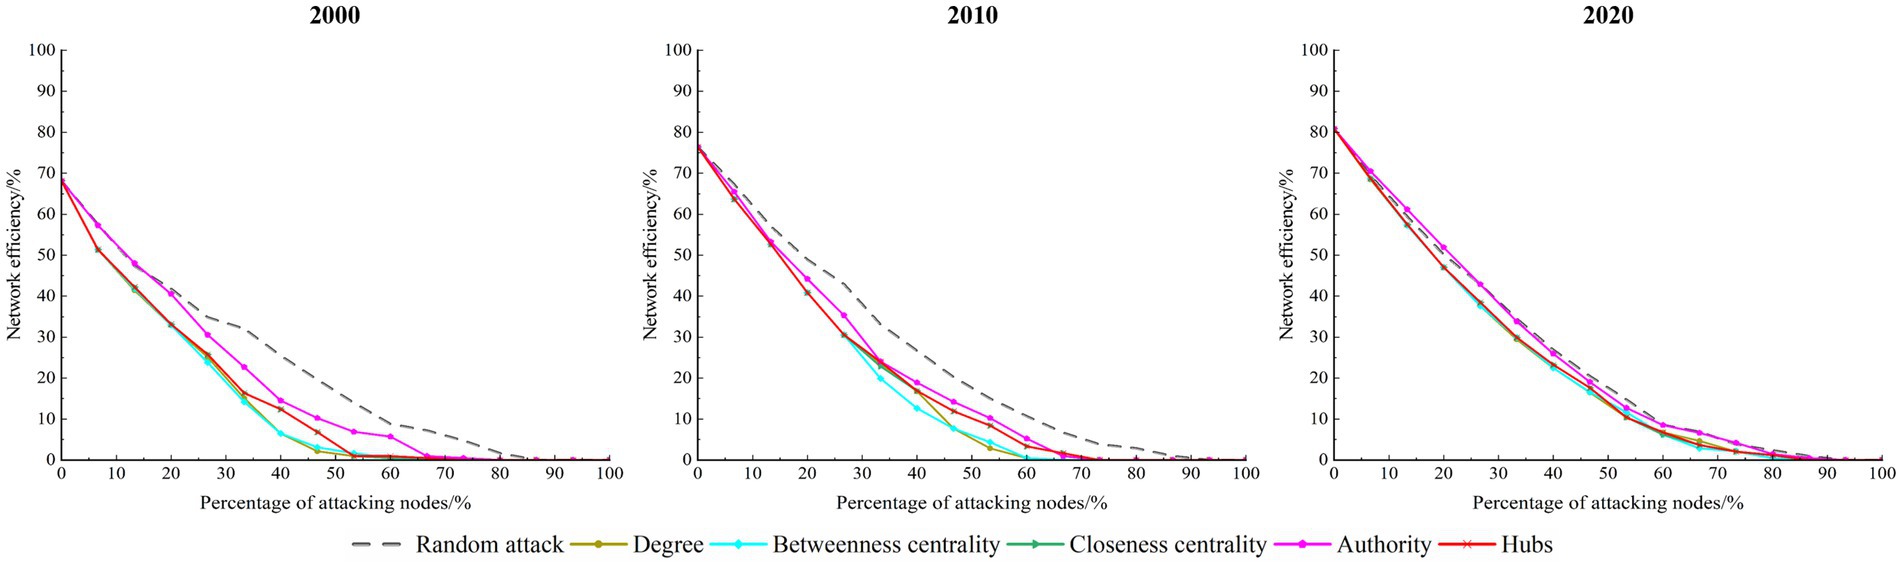
Figure 5. The change curve of the RCEP member countries GTN efficiency under node attack.
Results of random edge attacks (Figure 6) indicate that in 2000, 2010, and 2020, the proportion of edges attacked that reduced the network efficiency to below 1% were 96.00, 97.33, and 98.11%, respectively. Under targeted attacks, the proportion of edges attacked that reduced the network efficiency to below 1% were 40.89, 49.78, and 63.11%, respectively. The proportion of attacked edges required to collapse the GTN reflects an upward trend, suggesting that the growing tightness of trade connections enhances the network’s robustness against potential disruption risks.
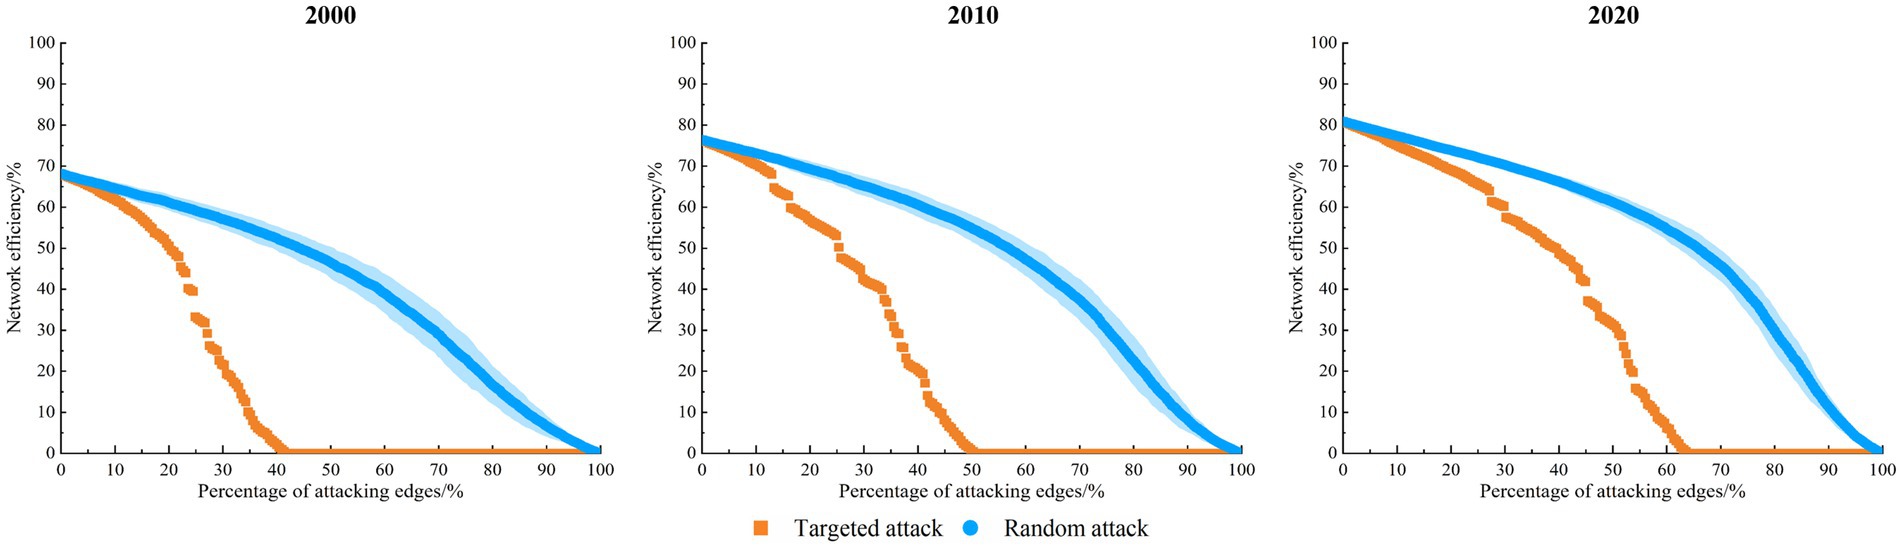
Figure 6. The change curve of the RCEP member countries GTN efficiency under edge attack.
Table 5 presents the results of targeted attacks on single countries, revealing that during the study period, the impact of member countries on network efficiency has become increasingly similar, while the influence of core countries still varies significantly. Currently, Viet Nam, China, Thailand, and Australia exert the highest influence on overall network efficiency, with each surpassing 15%. Viet Nam and China, as major importers and exporters, have become increasingly critical to the entire GTN. Despite its declining influence, Thailand remains one of the most important countries in the GTN. This finding further underscores the critical role of countries with high Betweenness centrality in maintaining the stable operation of the GTN.
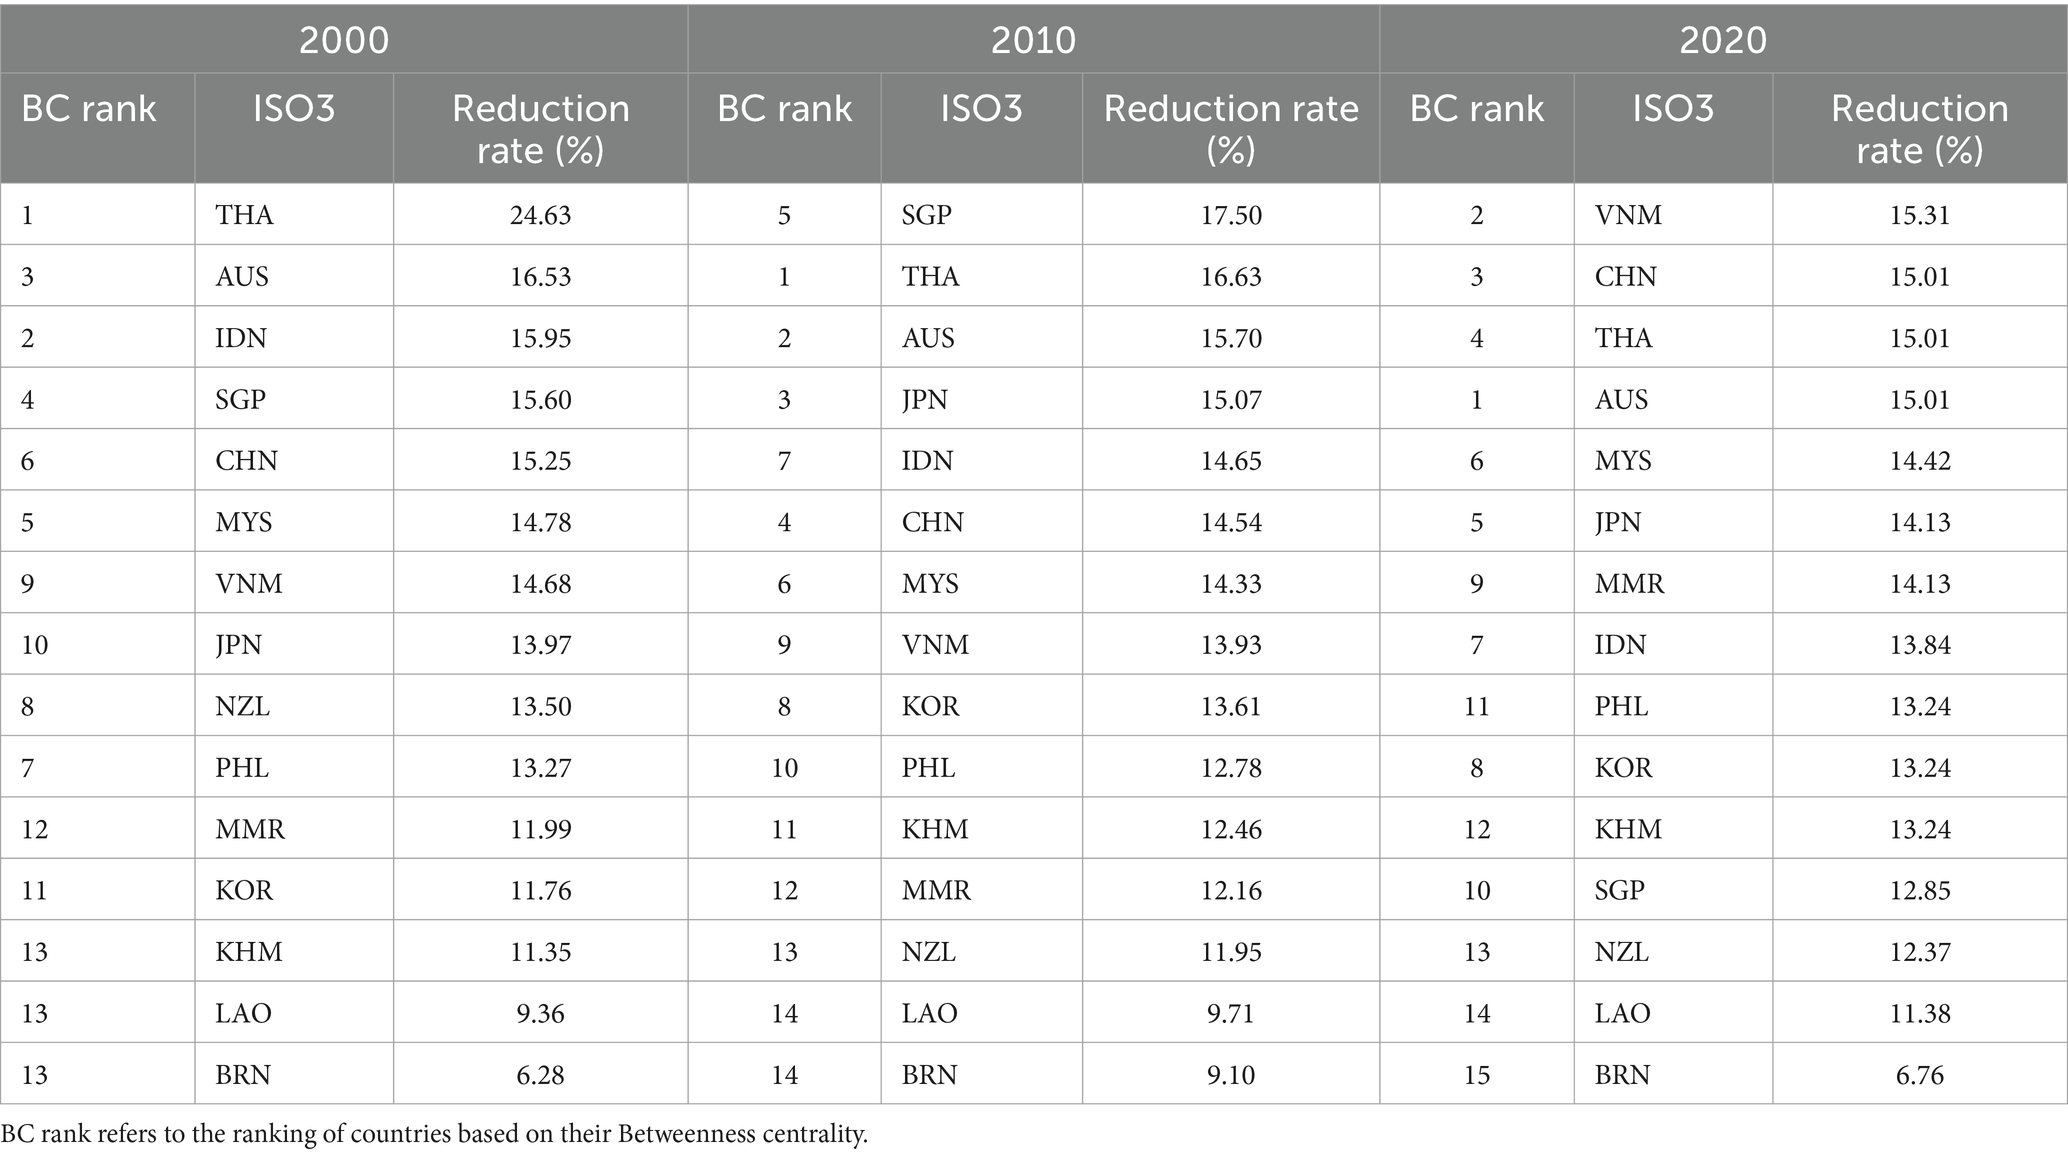
Table 5. The changes in the network efficiency of the RCEP member countries GTN under deliberate attacks on a single country.
3.5 Evolutionary mechanisms of the trade network
3.5.1 Resource endowments
Resource endowments serve as the “potential difference force” driving the evolution of the RCEP member countries GTN. This is mainly reflected in differences among countries in cropland area per capita and grains production, which influence their roles in the trade network. In physics, potential difference force refers to the force that drives an object from a region of higher potential energy to one of lower potential energy due to a potential energy gradient (Kellogg, 1953). According to Factor Endowment Theory, “potential difference” in economics essentially reflects differences in factor endowments among countries. Variations in resource endowments across countries influence grain production scale and domestic supply levels, creating a resource potential difference. During the study period, countries with limited arable land per capita, including South Korea, Japan, and Malaysia, struggle to meet domestic grain demand. As a result, these countries consistently ranked high in weighted indegree, with high competition intensity. Conversely, countries with abundant arable land per capita, such as Australia and Thailand, are major players in the global grain export market. They rank high in weighted out-degree but experience relatively low import competition intensity. At the same time, differences in resource potential drive varying patterns of resource flows between countries, leading to different types of interdependence. When the disparity in grain production is significant, one-way dependence emerges. For example, in 2020, Cambodia, which had the highest per capita grain production, exhibited a one-way dependency relationship with South Korea and Singapore, which ranked the lowest. In contrast, when countries have similar per capita grain production levels, they tend to develop a high level of interdependence. This is evident in the relationships between Thailand-Laos, as well as Thailand-Viet Nam.
3.5.2 Domestic demand
Domestic demand serves as the “reconstructing force” driving the evolution of the RCEP member countries GTN. This is mainly reflected in how changes in population size and per capita consumption demand influence the scale of grain imports, reconstructing the GTN. According to Demand and Supply Theory, when domestic grain consumption demand exceeds domestic supply, it drives an increase in grain imports. In the short term, a significant rise in grain imports by a single country can lead to noticeable changes in the GTN, with China being the most typical example. Between 2000 and 2020, China’s annual per capita grain consumption rose from 282.15 kg to 441.75 kg, a 56.56% increase, transitioning from an export powerhouse to a net grain importer. Similar populous countries include Indonesia and Philippines. The reliance of these countries on grain imports has rapidly increased, reconstructing the grain trade pattern and intensifying competition among major importers. For example, the import competition intensity between China and Philippines ranked 10th and 6th, respectively, in 2000, and rose to 1st and 2nd by 2020.
3.5.3 Economic conditions
Economic conditions serve as the “propelling force” driving the evolution of the RCEP member countries GTN. This influence is primarily reflected in income levels, foreign exchange reserves, and price levels. These factors collectively contribute to the rise in per capita grain demand, thereby driving the increase in total grain demand. According to Bennett’s Law, the consumption of animal-based foods increases with higher income levels (Bennett, 1941), which in turn drives the demand for feed grain and triggers a rise in grain imports. Additionally, foreign exchange reserves serve as a crucial foundation for supporting grain imports. For example, in China, from 2000 to 2020, per capita disposable income surged 5.98 times, while foreign exchange reserves increased 18.43 times. As a result, feed grain consumption increased by 1.2 times, and import volume surged 10.28 times. Similarly, international grain prices significantly shape grain imports and exports. For instance, during the low-price period of 2016, China’s imports increased by 32.83% compared to the previous year. In contrast, Australia’s exports decreased by 34.66%, triggering structural changes in the GTN. During the same period, China and Indonesia experienced rapid economic and population growth. With the rising demand for grain imports, competition for grain imports has become increasingly intense.
3.5.4 Geopolitical relations
Geopolitical relations serve as the “traction force” driving the evolution of the RCEP member countries GTN. This impact is primarily reflected in the “traction” created by political relations, geo-economic linkages, and geographical distance. These factors not only foster the formation of trade relationships but also potentially intensify regional competition in grain imports. On the one hand, the First Law of Geography suggests that countries geographically close to each other are more likely to engage in trade interactions. On the other hand, economic cooperation policies effectively lower regional grain trade barriers and promote trade facilitation (Hayakawa and Kimura, 2015). Owing to the closer geographical distance, RCEP member countries demonstrate high trade intensity, reflected in a network density of 0.686 in 2020—far exceeding the global GTN density (0.141) of the same period (Nie et al., 2021). Following China’s accession to the WTO and the signing of the “China-ASEAN Comprehensive Economic Cooperation Framework Agreement,” intra-regional trade connections rapidly increased, strengthening the network’s robustness. In addition, geographic proximity and tariff changes resulting from joining trade organizations further highlight the advantage of lower grain transportation costs within RCEP. This advantage not only drives the tightening of the regional trade network but also intensifies import competition among countries, such as those with high import competition intensity, which are often neighboring countries (e.g., China-Philippines, Indonesia-Malaysia, Malaysia-Philippines).
3.5.5 Important events
Important events serve as the “disturbing force” driving the evolution of the RCEP member countries GTN. These disruptions heighten trade uncertainty, compel adjustments in trade partners, and propel the evolution of the GTN. According to System Resilience Theory, external shocks prompt adaptive adjustments in complex systems. In the realm of resource flows, significant events can disrupt existing grain trade relationships between countries. For example, the 2008 global financial crisis led to soaring grain prices, causing some countries to struggle with the high costs of grain (Headey, 2011). As a result, total intra-regional trade volume dropped to its lowest point, and the average path length of the network increased. At the same time, some countries enacted export restrictions or outright bans to protect domestic grain supply, reducing trade fluidity and increasing dependence on fewer sources, thereby intensifying overall import competition. On the other hand, to reduce the risk of reliance on a single country, member countries often seek new or additional trade partners. This will strengthen the network’s robustness. For instance, despite the grain export restrictions during the COVID-19 pandemic in 2019 (Laborde et al., 2020), the network’s robustness against targeted attack improved. Due to the diversification of import sources, trade volumes remained stable or even increased, while overall competition intensity slightly decreased. This highlights the pivotal role of important events in driving the evolution of the GTN.
The above content explains the impact mechanisms of the “five forces” on the evolution of the GTN from the perspective of individual factors. In fact, as shown in Figure 7, the interaction between the “five forces” varies, with their primary roles differing during different stages of trade network evolution.
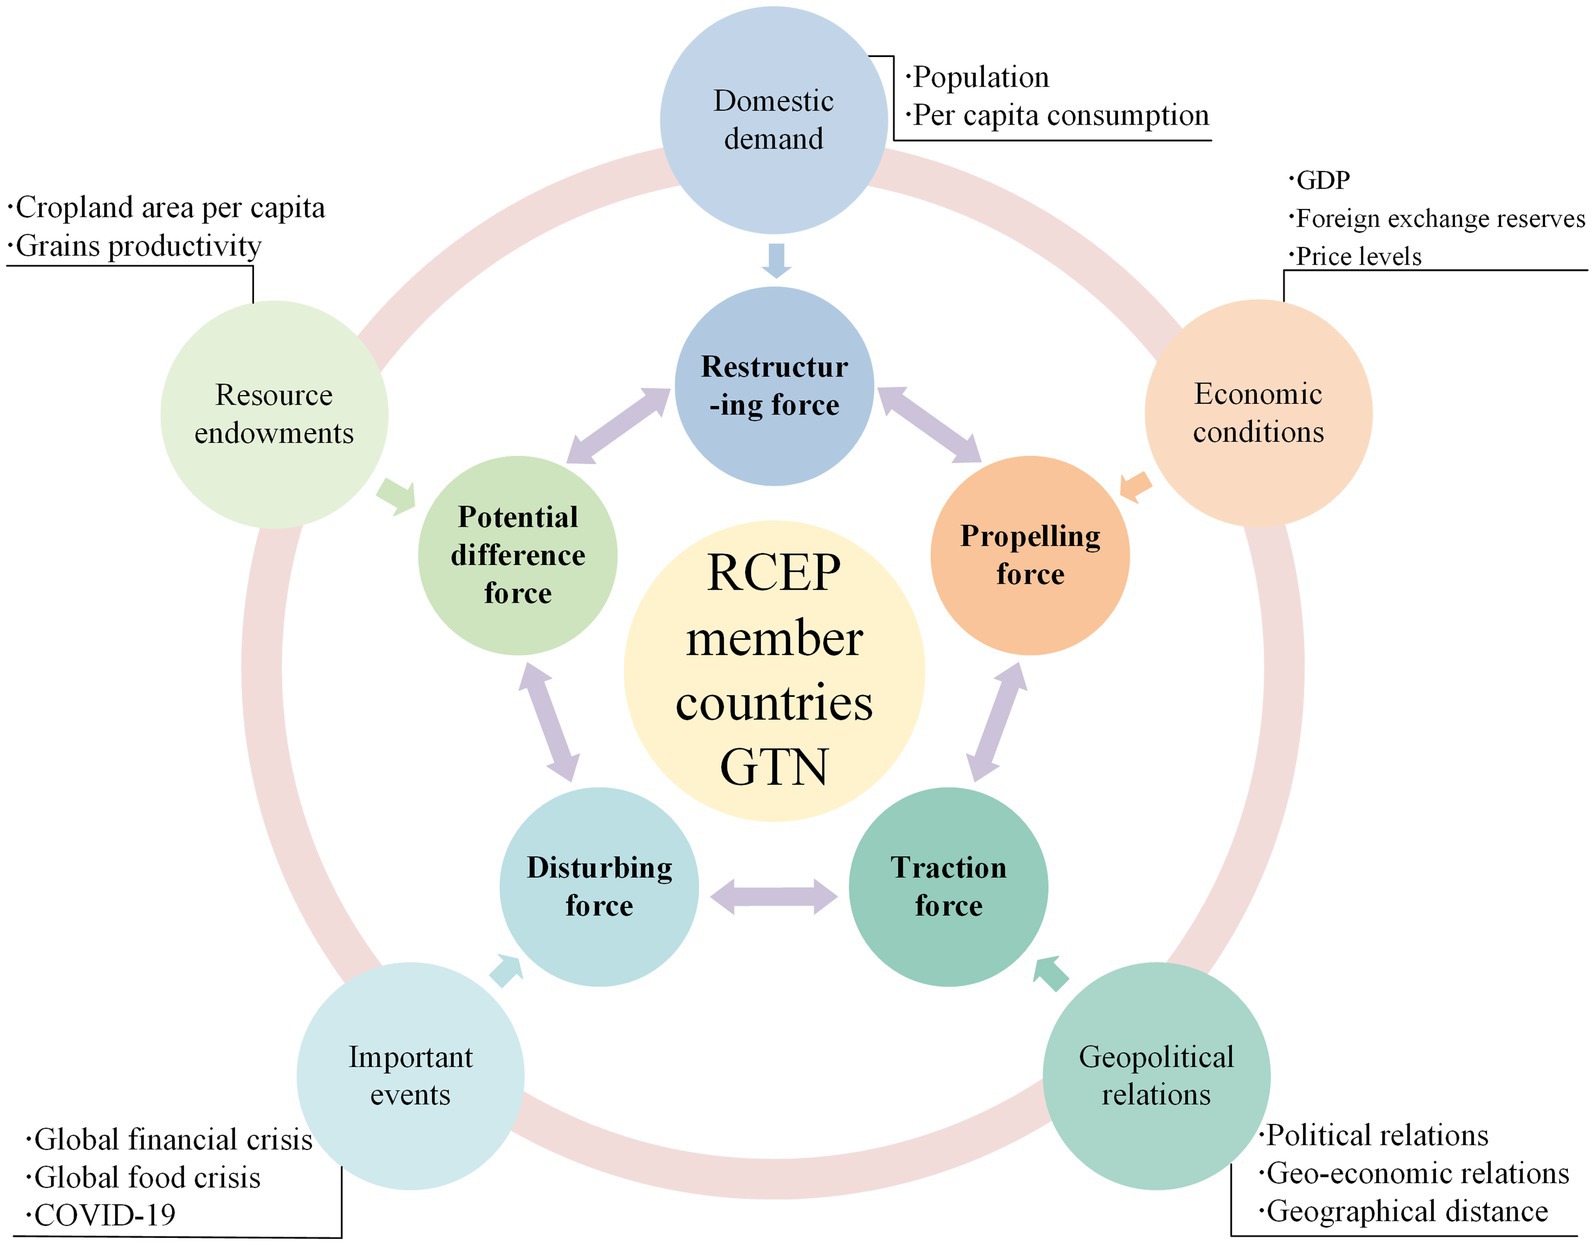
Figure 7. Evolutionary mechanisms of the RCEP member countries GTN.
In the early stages of trade network formation, disparities in resource endowments played a pivotal role in shaping regional trade relationships. For instance, in 2000, countries with abundant arable land resources, such as Australia and Thailand, established strong trade ties with countries like South Korea, which faced land resource constraints. This dominant influence continued throughout the evolution of the network. On the basis of the initially established trade patterns, the heterogeneity of countries within the region—especially regarding economic development and changes in domestic demand—collectively fueled the evolution of the trade network. For example, China’s rapid economic growth prompted significant shifts in food consumption patterns and demand, resulting in increased reliance on external grain imports. Notably, this growing dependency on grain imports from RCEP member countries has driven the evolution of the trade network and intensified competition between China and other major grain importers.
Undoubtedly, the low-cost trade effect driven by geographic proximity has continued to play a crucial role in maintaining the stability of the network structure, contributing to its robust characteristics. The influence of geopolitical relations and important events on trade network structure changes has been widely acknowledged. For example, the signing of “China-ASEAN Comprehensive Economic Cooperation Framework” significantly facilitated the tightening of trade network, while the 2008 global financial crisis disrupted grain trade relations within the region, leading to a decline in network density. Following the global financial crisis, the diversification of trade partners among member countries somewhat enhanced the robustness of the network. Despite disruptions caused by the COVID-19 pandemic, the trade network has maintained a relatively stable structure. Looking ahead, the signing of RCEP is expected to influence the future evolution of the GTN in a significant way.
4 Potential impacts of RCEP signing on the trade network
The RCEP provisions on agricultural trade encompass tariff reductions, rules of origin, investment facilitation, negative list, and trade remedy. These measures are expected to generate trade diversion and creation effects, reshaping existing grain trade patterns (Xu et al., 2025). Therefore, this study analyzes the potential impact of RCEP on the GTN based on two key provisions: tariff reduction and non-tariff measures reduction. On this basis, it identifies the conduction path through which these provisions influence the trade network (Figure 8) and explores the differentiated effects of RCEP.
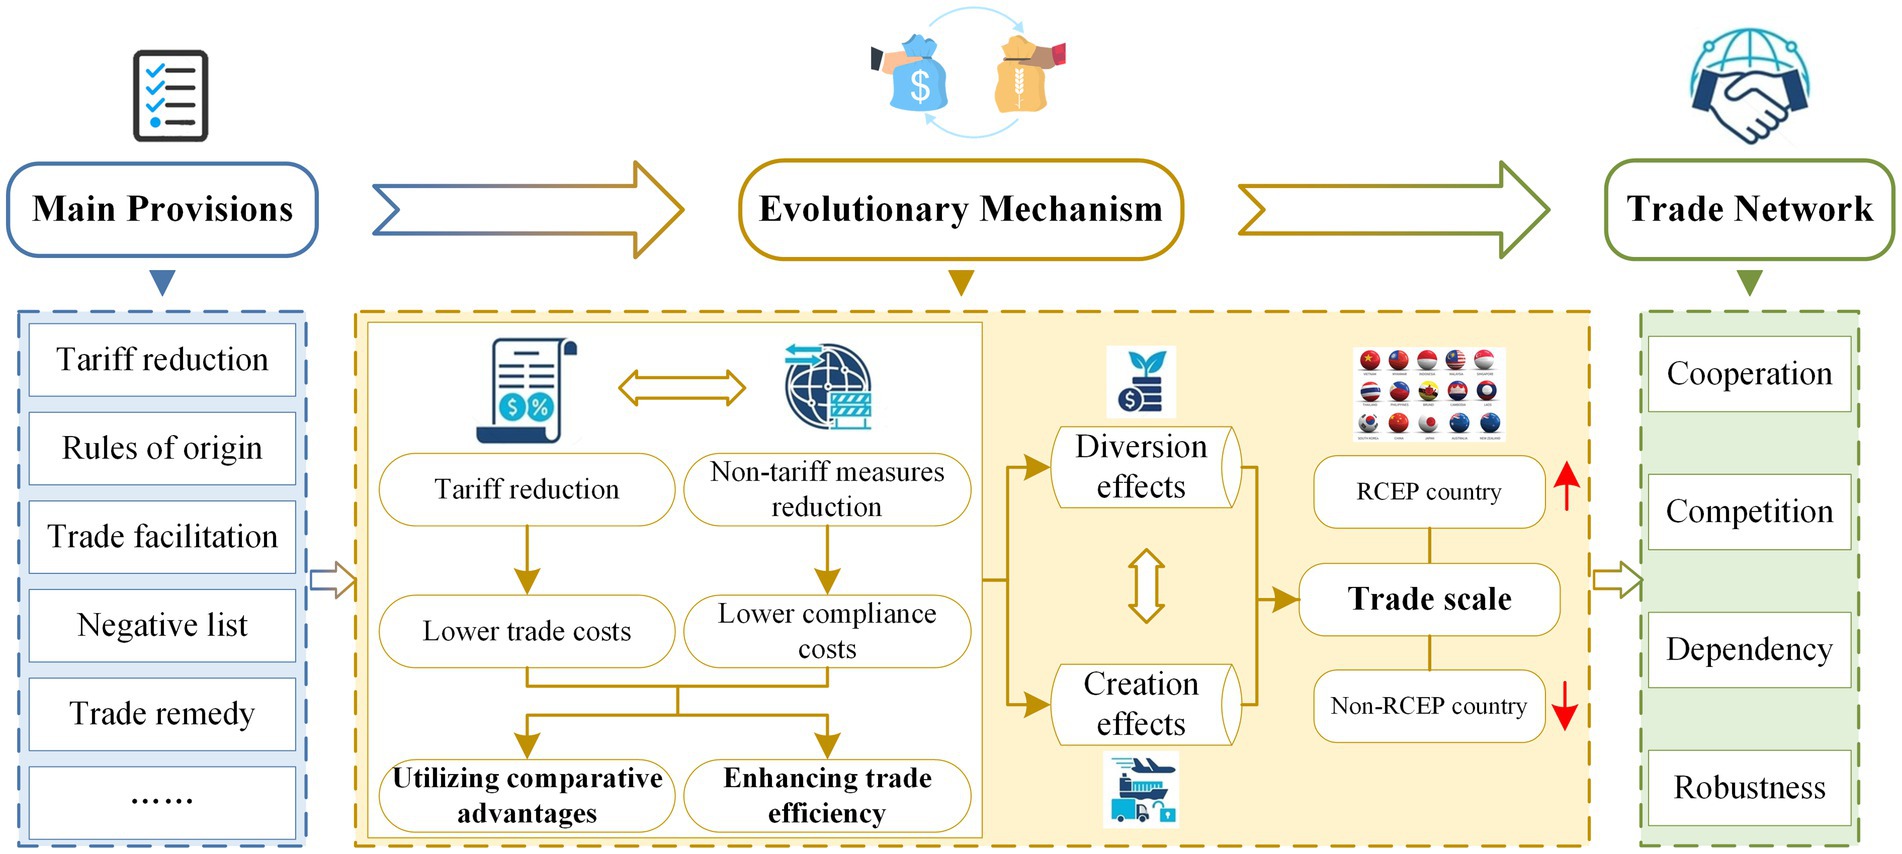
Figure 8. Conduction path of the potential impacts of RCEP signing on the GTN.
4.1 Tariff reduction
Against the backdrop of widespread tariff reductions, grain trade within the RCEP region will grow increasingly interconnected, with import sources gravitating toward RCEP member countries. As imports become more concentrated, intra-regional competition is expected to intensify. According to RCEP Schedule of Tariff Commitments, the region’s grain tariff reduction policies fall into four categories based on benchmark rates (Table 6): (1) No tariff reduction commitments (e.g., South Korea, China, Malaysia, and Indonesia, maintaining rates of 110.33, 50.00, 13.33, and 10.00%, respectively). (2) Gradual tariff reductions (e.g., Laos reducing tariffs from 5 to 1.67% over 21 years). (3) Immediate tariff exemptions (e.g., Viet Nam, Thailand, and Philippines eliminating tariffs outright). (4) Zero-tariff maintenance (e.g., The tariff levels of Australia, Japan, Singapore, New Zealand, Myanmar, Cambodia, and Brunei have consistently remained at 0.00%).
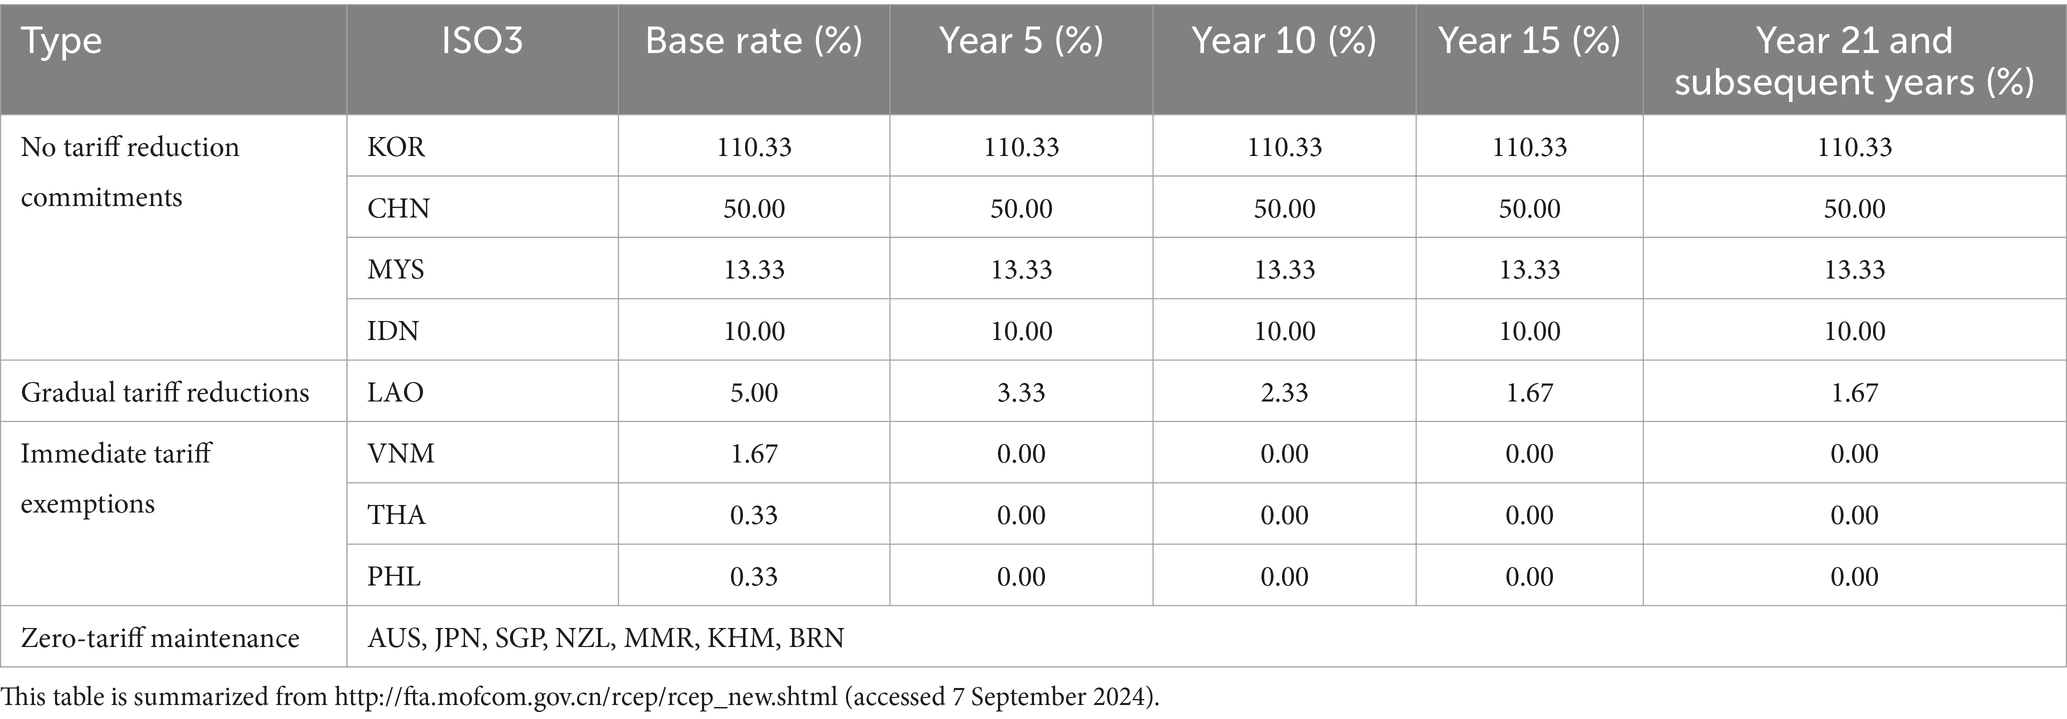
Table 6. RCEP Schedule of Tariff Commitments on grain.
The reduction or elimination of grain tariffs will substantially lower trade costs, thereby stimulating trade among member countries (Wei, 2024; Liu and Wang, 2024). As a result, grain imports previously sourced from non-RCEP countries are likely to shift toward major intra-regional producers offering comparative advantages, such as lower tariffs and shorter transportation distances. This shift is expected to expand the scale and density of intra-regional grain trade, reduce external trade volumes, and increase interdependence, thereby homogenizing the network. As grain import sources concentrate in major exporting countries, competition among importers will intensify.
Meanwhile, the export destinations of major grain-exporting countries may undergo a partial redistribution of trade flows due to some countries maintaining their existing grain tariff levels (Huang and Li, 2024). Some countries, such as South Korea, China, Malaysia, and Indonesia, have retained their current grain tariff levels to safeguard national grain security. These countries have neither reduced tariffs nor eased market access thresholds and have no tariff reduction plans for the next 20 years. Consequently, grain trade volumes previously destined for these countries may be redistributed within the region, potentially altering the roles of key grain importers.
4.2 Non-tariff measures reduction
The reduction of non-tariff measures in the grain trade among RCEP member countries will encourage the formation of new trade links. The impact of non-tariff measures on grain trade is characterized by mixed effects. While ensuring product quality, non-tariff measures inevitably increase compliance costs, leading to a reduction in the export supply of producing countries (Wickrama et al., 2024). Hoekman and Nicita (2011) highlights that a 10% increase in non-tariff measures could lead to an average trade volume decline of 1.7%. Nevertheless, the reduction of non-tariff measures within RCEP has undeniably fostered a more efficient and integrated regional market. It has significantly reduced potential barriers, enhanced trade efficiency, and highlighted the comparative advantages of grains among member countries (Ratna and Huang, 2016).
For example, in the context of trade facilitation, some less-developed countries in the region incur high customs clearance costs. These measures are expected to significantly enhance the efficiency of grain clearance, reducing both fixed costs (e.g., passing health inspections, acquiring certificates, and meeting marketing requirements) and variable costs (e.g., delays caused by customs inspections) (Crivelli and Gröschl, 2016). This will promote trade among member countries by lowering costs and simplifying procedures.
4.3 Conduction path and unique effects of RCEP’s potential impact
The reduction of tariff and non-tariff measures (such as rules of origin, trade facilitation, negative list, and trade remedy) impacts the formation of trade links by influencing trade costs and compliance costs, leading to changes in the structure of the trade network. Specifically, the reduction of trade tariff within the region will lower grain trade costs, thereby highlighting the price competitiveness of grain. This, in turn, triggers the formation of new trade relationships and promotes the substitution of trade links between member countries for those between the region and non-member countries.
Compared to regional free trade agreements such as the CPTPP and ASEAN, RCEP has distinct advantages. On one hand, it includes both China and Japan, making it the first bilateral free trade agreement between the two countries, which helps reduce the tariff levels on grain trade between China and Japan, significantly weakening trade barriers between them. On the other hand, RCEP enforces more open and unified rules of origin, with lower restrictions on origin certification standards, thereby reducing hidden barriers to a greater extent. Specifically, the more substantial reduction in tariffs and non-tariff measures under RCEP, compared to other agreements, will lead to price effects that further promote the tightening of the GTN within the region.
5 Conclusion and discussion
This study examines the dynamics of grain trade within the world’s largest free trade agreement zone. It investigates the characteristics of grain flow among RCEP member countries, explores the mechanisms driving the evolution of the GTN, and assesses the potential impacts of the agreement on the grain trade pattern. The main contributions are as follows: (1) This study characterizes the GTN among RCEP member countries from a trade network perspective for the first time, systematically uncovering its cooperation relationships as well as its robustness. (2) The “Five Forces” model is created to analyze the evolution mechanisms of complex networks, providing a multi-dimensional framework for understanding the RCEP member countries GTN. This model addresses the limitations of quantitative approaches in analyzing regional trade network evolution and offers methodological advancements for studying trade network with relatively small numbers of nodes. (3) The study adopts an innovative perspective, analyzing the potential impacts of RCEP on the GTN through the lenses of trade diversion and creation effects. The main findings include the following aspects.
(1) Under the influence of multiple factors, the GTN among RCEP member countries has grown more complex and interconnected, with both the number of network edges and density increasing by over 50%. Australia, Viet Nam, Myanmar, Thailand, and Cambodia serve as the primary exporters in the region, contributing 95.70% of total exports, while China, Philippines, Thailand, South Korea, and Malaysia are the main importers, accounting for 71.42% of total imports. Significant differences in trade scale persist among countries, and the network exhibits a typical major-country dominance effect, with grain-exporting countries serving as key nodes. However, the Betweenness centrality of these key nodes has declined stepwise, signaling a trend toward greater homogeneity in the trade status of member countries. Compared to the global GTN (Wang and Dai, 2021), the geographically proximate, bloc-based free trade zone offers more favorable conditions for establishing trade connections (Chaney, 2014). Currently, the network density and average clustering coefficient are 4.67 times and 1.36 times higher than global averages, respectively, while the average path length is only 63.44% of the global level (Figure 9). These findings indicate that the regional GTN is characterized by tighter trade links, shorter network distances, and higher transmission efficiency.
(2) The grain trade within RCEP member countries exhibits a distinct “high competition” characteristic. During the study period, regional competition intensified, though the increase was only 2.70%. The primary competition in the regional grain trade is concentrated among a small number of major grain-importing countries, with 70% of competition intensity arising from competition relationships ranging between 15 and 30%. Due to variations in resource endowments and demand scale, grain-importing countries with large populations and significant land constraints, such as China, Philippines, Malaysia, South Korea, and Indonesia, face greater competition intensity. Unlike the global grain trade (Wang and Fan, 2023), where competition is decelerating, grain import competition within the region continues to rise because member countries’ import sources are heavily concentrated among a few major exporting countries. Currently, the average competition intensity in regional grain trade is 2.08 times higher than the global level (Supplementary Figure S5), underscoring the high concentration of grain import sources within RCEP member countries.
(3) Due to the immense trade scale imbalance implied by the dominance of large countries, grain trade cooperation among RCEP member countries exhibits a pronounced “low interdependence” characteristic. Growing concerns about external supply security have driven the diversification of trade behaviors among member countries, contributing to a more complex interdependence pattern. Throughout the study period, low-interdependence relationships consistently prevailed, with their proportion rising from 84.85 to 87.23%. Considering the competition intensity in regional grain trade, competition relationships among RCEP member countries outweigh cooperative ones.
(4) With the increasing complexity of the GTN structure and the homogenization of trade positions among member countries, the robustness of the GTN has significantly improved. Currently, under both random and targeted attacks scenarios, 93.33 and 86.67% of nodes, respectively, must be attacked to cause a complete network collapse. The network efficiency decline curves are gradually aligning, presenting a near-uniform decline. Countries with higher Betweenness centrality, such as Thailand and Australia, are pivotal in maintaining the stability of the trade structure. Meanwhile, the influence of major trade countries, such as Viet Nam and China, has been steadily deepening. Compared to the global trade network of wheat (Ma et al., 2023), one of the three major primary grains, the homogenization of trade positions among RCEP member countries enhances the robustness of the regional GTN against disruptions. In the random attacks scenario, its robustness is comparable to the global level, with network collapse occurring when the node failure rate reaches 90%. However, in the targeted attacks scenario, its robustness far exceeds the global level. The global trade network collapses when the node failure rate reaches 40%, whereas the RCEP network remains intact under similar conditions.
(5) The evolution of the GTN among RCEP member countries results from the combined influence of resource endowments, domestic demand, economic conditions, geopolitical relations, and important events. The increased trade connections driven by export powerhouses significantly contribute to the network’s complexity, the intensification of cooperation relationships, and enhanced trade network robustness. Following the agreement’s implementation, the differentiated tariff reduction commitments among member countries are expected to redistribute trade flows. Meanwhile, the reduction of non-tariff measures will enhance the efficiency of trade links, which is expected to generate trade diversion and creation effects. While the agreement strengthens intra-regional trade links and boosts the scale of trade within the region, the intensity of import competition will further increase, thereby reshaping the grain trade pattern. The findings of the above study are also supported by simulation results from previously published research. Taking Viet Nam, a major grain exporter, as an example, on one hand, if import partners reduce their rice import tariffs by 1%, the per capita consumption of Vietnamese rice in those countries will increase by 0.01 USD, generating a trade creation effect. On the other hand, due to high tariff barriers set by the South Korean government to protect its domestic rice industry, South Korea is not an ideal destination for Vietnamese rice exports. This portion of the export volume will be redistributed to other member countries that have committed to tariff reductions, generating a trade diversion effect (Chakradhar and Thao, 2024). For China, a major grain importer, it is expected that, 10 years after the formal implementation of RCEP, rice imports from non-RCEP member countries will decrease by 5.65%, with some of the import volume shifting to within the region. Specifically, China’s rice imports from Australia are expected to increase the most (7.23%), and the import competition pressure within the region will also rise (Liu and Wang, 2024).
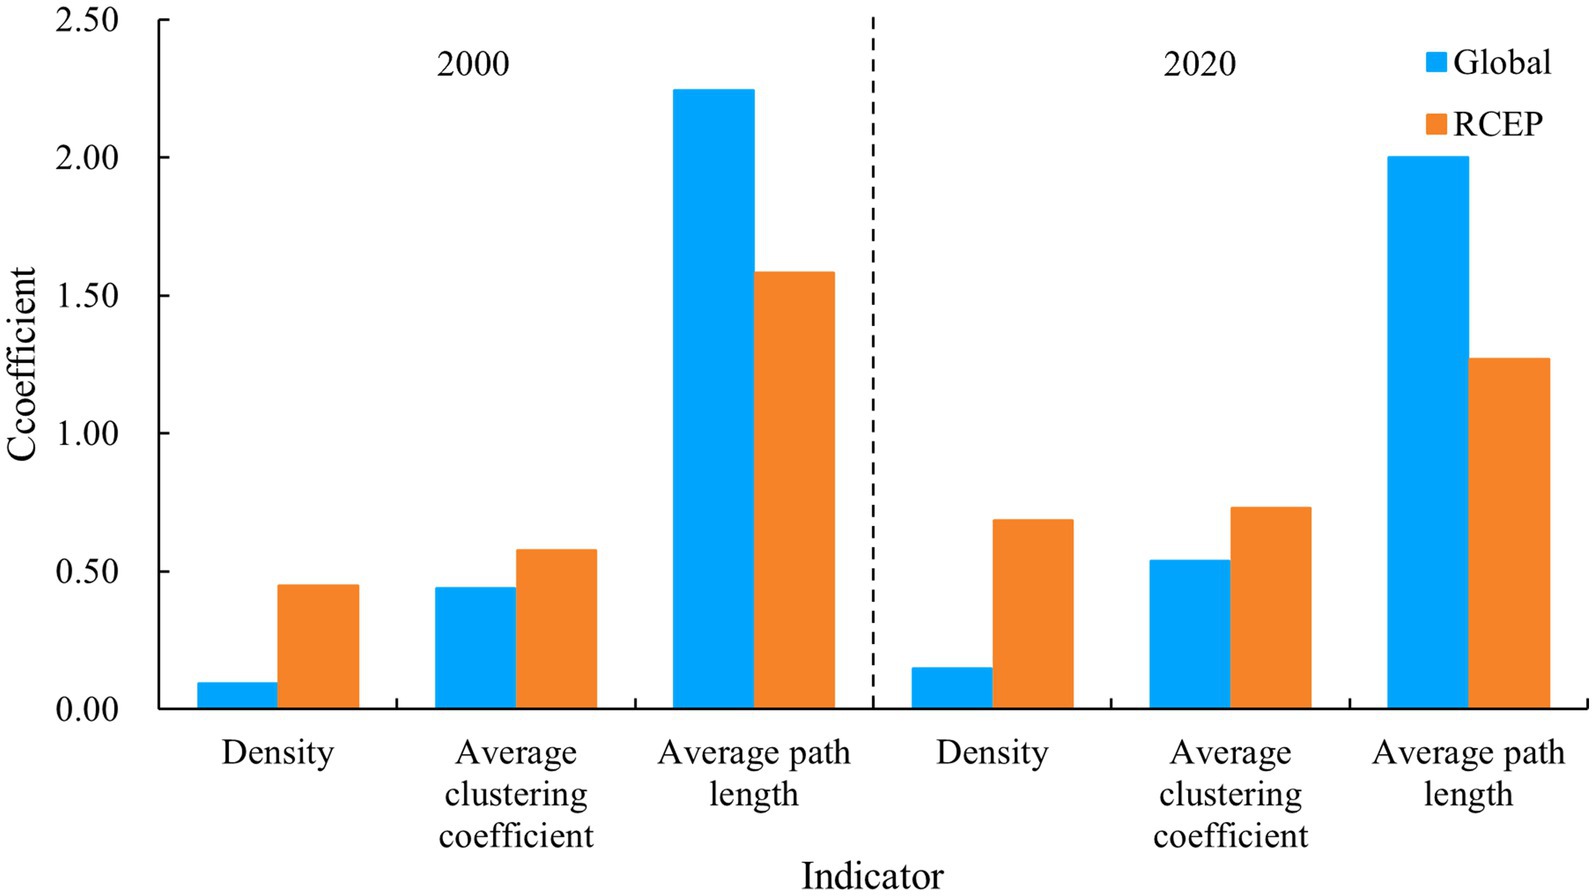
Figure 9. Comparative analysis of GTN characteristics: Global and RCEP member countries.
This study emphasizes the importance of effectively leveraging the RCEP agreement to address the “high competition, low interdependence” nature of grain trade relations among member countries. Transitioning from “highly competition relationships” to “strong cooperative relationships” is identified as a critical issue for ensuring the stable development of grain trade within the RCEP region. It is recommended that countries facing significant import competition pressure—such as China, Philippines, Malaysia, South Korea, and Indonesia—enhance agricultural production cooperation with countries in the Indo-China Peninsula. These countries, endowed with abundant arable land and favorable water and heat conditions, possess substantial potential for yield improvement. By supporting these high-potential agricultural producers to capitalize on their resource endowment advantages, the region can increase its overall grain supply and mitigate the intense import competition within the member countries.
Undoubtedly, RCEP member countries have extensive trade interactions with non-member countries and also participate in multiple free trade agreements across the Asia-Pacific region and globally, which may result in the “Spaghetti bowl phenomenon” (Sorgho, 2016). Looking ahead, it is necessary to quantitatively analyze the trade network evolution mechanism of RCEP member countries from the perspective of an open system linking both intra-regional and extra-regional dynamics (Guo et al., 2023), and simulate the global economic effects of the agreement’s signing (Xu et al., 2025). On the other hand, the RCEP member region serves as a geostrategic intersection of great powers, and geopolitical conflicts among these powers may impact the implementation process of the agreement. Assessing the potential supply risk in the regional GTN (Sun et al., 2022) and proposing response strategies is also an important avenue for future research.
Data availability statement
The datasets presented in this study can be found in online repositories. The names of the repository/repositories and accession number(s) can be found at: http://faostat.fao.org.
Author contributions
ML: Conceptualization, Methodology, Writing-original draft, Formal Analysis. YinW: Data curation, Methodology, Writing-review & editing, Funding acquisition. CZ: Conceptualization, Funding acquisition, Methodology, Writing-review & editing. YanW: Data curation, Formal analysis, Writing-review & editing. JY: Methodology, Visualization, Writing-review & editing. YH: Methodology, Visualization, Writing-review & editing. YiW: Methodology, Visualization, Writing-review & editing.
Funding
The author(s) declare that financial support was received for the research and/or publication of this article. This work is supported by Yunnan Province Science and Technology Department Basic Research General Program (202401CF070030), Yunnan Province Educational Committee Scientific Research Foundation (2023J0172), Yunnan Province Basic Research Key Programs (202401AS070037), State Key Program of National Natural Science of China (42130508).
Acknowledgments
We are grateful to the editor and the reviewers for their valuable comments and suggestions.
Conflict of interest
The authors declare that the research was conducted in the absence of any commercial or financial relationships that could be construed as a potential conflict of interest.
Generative AI statement
The authors declare that no Generative AI was used in the creation of this manuscript.
Publisher’s note
All claims expressed in this article are solely those of the authors and do not necessarily represent those of their affiliated organizations, or those of the publisher, the editors and the reviewers. Any product that may be evaluated in this article, or claim that may be made by its manufacturer, is not guaranteed or endorsed by the publisher.
Supplementary material
The Supplementary material for this article can be found online at: https://www.frontiersin.org/articles/10.3389/fsufs.2025.1565092/full#supplementary-material
References
Alabi, M. O., and Ngwenyama, O. (2023). Food security and disruptions of the global food supply chains during COVID-19: building smarter food supply chains for post COVID-19 era. Br. Food J. 125, 167–185. doi: 10.1108/BFJ-03-2021-0333
Bennett, M. K. (1941). International contrasts in food consumption. Geogr. Rev. 31, 365–376. doi: 10.2307/210172
Bojnec, Š., and Fertő, I. (2009). Determinants of agro-food trade competition of central European countries with the European Union. China Econ. Rev. 20, 327–337. doi: 10.1016/j.chieco.2008.10.002
Bureau, J. C., Disdier, A. C., Emlinger, C., Fouré, J., Felbermayr, G., Fontagné, L., et al. (2014). Risks and opportunities for the EU agri-food sector in a possible EU-US trade agreement : Paris: CEPII.
Burkholz, R., and Schweitzer, F. (2019). International crop trade networks: the impact of shocks and cascades. Environ. Res. Lett. 14:114013. doi: 10.1088/1748-9326/ab4864
Chakradhar, J., and Thao, T. T. (2024). The impact of participating in the regional comprehensive economic partnership (RCEP) agreement and potential export Markets for Vietnamese Rice: An application of augmented gravity model. J. Int. Econ. Commer. Policy 15:2450004. doi: 10.1142/S1793993324500042
Chaney, T. (2014). The network structure of international trade. Am. Econ. Rev. 104, 3600–3634. doi: 10.1257/aer.104.11.3600
Chen, Z., An, H., Gao, X., Li, H., and Hao, X. (2016). Competition pattern of the global liquefied natural gas (LNG) trade by network analysis. J. Nat. Gas Sci. Eng. 33, 769–776. doi: 10.1016/j.jngse.2016.06.022
Chen, Y. S., and Wang, Y. M. (2021). Research on the structure, efficiency and influencing factors of agricultural products trade between China and RCEP member countries: based on empirical analysis of sub-products. World Agric. 12, 72–128. doi: 10.13856/j.cn11-1097/s.2021.12.007
Chen, W., and Zhang, H. (2022). Characterizing the structural evolution of cereal trade networks in the belt and road regions: a network analysis approach. Food Secur. 11:1468. doi: 10.3390/foods11101468
Crivelli, P., and Gröschl, J. (2016). The impact of sanitary and phytosanitary measures on market entry and trade flows. World Econ. 39, 444–473. doi: 10.1111/twec.12283
Crucitti, P., Latora, V., Marchiori, M., and Rapisarda, A. (2003). Efficiency of scale-free networks: error and attack tolerance. Physica A 320, 622–642. doi: 10.1016/S0378-4371(02)01545-5
Cui, W., Qiao, C., and Song, Y. (2025). The influence of the regional comprehensive economic partnership on agricultural value chain participation: insights from a global trade analysis project model simulation. Appl. Econ., 1–14. doi: 10.1080/00036846.2024.2446592
Duan, J., Nie, C., Wang, Y., Yan, D., and Xiong, W. (2022). Research on global grain trade network pattern and its driving factors. Sustain. For. 14:245. doi: 10.3390/su14010245
FAO. (2023). The State of Food Security and Nutrition in the World 2023: Urbanization, Agrifood Systems Transformation and Healthy Diets Across the Rural-Urban Continuum. Rome: Food Agriculture Organization of the United Nations.
Glick, R., and Rose, A. K. (1999). Contagion and trade: why are currency crises regional? J. Int. Money Financ. 18, 603–617. doi: 10.1016/S0261-5606(99)00023-6
Gong, H., Hassink, R., Foster, C., Hess, M., and Garretsen, H. (2022). Globalisation in reverse? Reconfiguring the geographies of value chains and production networks. Camb. J. Reg. Econ. Soc. 15, 165–181. doi: 10.1093/cjres/rsac012
Greenville, J., and Kawasaki, K. (2018). “Agro-food trade, GVCs and agricultural development in ASEAN” in OECD food, agriculture and fisheries papers (Paris: OECD Publishing).
Grubel, H., and Lloyd, P. (1975). Intra-industry trade: The theory and measurement of international trade in differentiated products. New York: Wiley.
Guo, Y., Zhao, B., and Zhang, H. (2023). The impact of the belt and road initiative on the natural gas trade: a network structure dependence perspective. Energy 263:125912. doi: 10.1016/j.energy.2022.125912
Gutiérrez-Moya, E., Adenso-Díaz, B., and Lozano, S. (2021). Analysis and vulnerability of the international wheat trade network. Food Secur. 13, 113–128. doi: 10.1007/s12571-020-01117-9
Hayakawa, K., and Kimura, F. (2015). How much do free trade agreements reduce impediments to trade? Open Econ. Rev. 26, 711–729. doi: 10.1007/s11079-014-9332-x
Headey, D. (2011). Rethinking the global food crisis: the role of trade shocks. Food Policy 36, 136–146. doi: 10.1016/j.foodpol.2010.10.003
Hoekman, B., and Nicita, A. (2011). Trade policy, trade costs, and developing country trade. World Dev. 39, 2069–2079. doi: 10.1016/j.worlddev.2011.05.013
Huang, X. Y., and Li, G. X. (2024). Impacts of RCEP agreement on China’s agricultural products import and food security. J. China Agric. Univ. 29, 1–15. doi: 10.11841/j.issn.1007-4333.2024.10.01
Karakoc, D. B., and Konar, M. (2021). A complex network framework for the efficiency and resilience trade-off in global food trade. Environ. Res. Lett. 16:105003. doi: 10.1088/1748-9326/ac1a9b
Khan, H., Chen, Y., and Lv, L. (2024). Does the China–Pakistan free trade agreement benefit the vegetable exports of Pakistan? A gravity estimation. Front. Sustain. Food Syst. 8:1362910. doi: 10.3389/fsufs.2024.1362910
Laborde, D., Martin, W., Swinnen, J., and Vos, R. (2020). COVID-19 risks to global food security. Science 369, 500–502. doi: 10.1126/science.abc4765
Li, X., Zhang, H., Zhou, X., and Zhong, W. (2022). Research on the evolution of the global import and export competition network of chromium resources from the perspective of the whole industrial chain. Resour. Policy 79:102987. doi: 10.1016/j.resourpol.2022.102987
Liu, Z. M., and Wang, Z. G. (2024). The impact of RCEP on agricultural trade among members: from the perspectives of tariff concession and trade facilitation. Resour. Sci. 46, 1144–1158. doi: 10.18402/resci.2024.06.08
Liu, L., Wang, W., Yan, X., Shen, M., and Chen, H. (2023). The cascade influence of grain trade shocks on countries in the context of the Russia-Ukraine conflict. Hum. Soc. Sci. Communic. 10, 1–28. doi: 10.7910/DVN/KJB3OZ
Liu, H., Zhang, S., Mu, Y., and Zhu, Y. (2023). Topology and evolution of international trade network for fish and fish products. Front. Sustain. Food Syst. 7:1134687. doi: 10.3389/fsufs.2023.1134687
Ma, J., Li, M., and Li, H. J. (2023). Robustness of the international wheat trade network. IEEE Trans. Netw. Sci. Eng. 11, 14–23. doi: 10.1109/TNSE.2023.3283251
Miao, T., Pastpipatkul, P., Liu, X., and Liu, J. (2024). The trade potential of grain crops in the countries along the belt and road: evidence from a stochastic frontier model. Front. Sustain. Food Syst. 8:1404232. doi: 10.3389/fsufs.2024.1404232
Nie, C. L., Jiang, H. N., and Duan, J. (2021). Spatial pattern evolution of global grain trade network since the 21st century. Econ. Geogr. 41, 119–127. doi: 10.15957/j.cnki.jjdl.2021.07.013
Puma, M. J., Bose, S., Chon, S. Y., and Cook, B. I. (2015). Assessing the evolving fragility of the global food system. Environ. Res. Lett. 10:024007. doi: 10.1088/1748-9326/10/2/024007
Ratna, R. S., and Huang, J. (2016). Regional comprehensive economic partnership (RCEP) FTA: reducing trade cost through removal of non-tariff measures: reducing trade cost through removal of non-tariff measures. Korea World Econ. 17, 213–242.
Sorgho, Z. (2016). RTAs' proliferation and trade-diversion effects: evidence of the “spaghetti bowl” phenomenon. World Econ. 39, 285–300. doi: 10.1111/twec.12295
Sun, J., Mooney, H., Wu, W., Tang, H., Tong, Y., Xu, Z., et al. (2018). Importing food damages domestic environment: evidence from global soybean trade. Proc. Natl. Acad. Sci. 115, 5415–5419. doi: 10.1073/pnas.1718153115
Sun, X., Shi, Q., and Hao, X. (2022). Supply crisis propagation in the global cobalt trade network. Resour. Conserv. Recycl. 179:106035. doi: 10.1016/j.resconrec.2021.106035
Wang, J., and Dai, C. (2021). Evolution of global food trade patterns and its implications for food security based on complex network analysis. Food Secur. 10:2657. doi: 10.3390/foods10112657
Wang, Y., and Fan, A. J. (2023). Research on global grain imports competition pattern and influence factors. Economist 5, 118–128. doi: 10.16158/j.cnki.51-1312/f.2023.05.010
Wasserman, S., and Faust, K. (1994). Social network analysis: Methods and applications. Cambridge: Cambridge University Press.
Wei, K. (2024). The impact of RCEP tariff concessions on intra-regional trade: An analysis of trade creation and diversion. High. Bus. Econ. Manag. 31, 145–155. doi: 10.54097/9fpgy060
Wickrama, S. P., Kandangama, N. B., Wickramaarachchi, T., and Weerahewa, J. (2024). Assessing the impact of non-tariff measures on Sri Lankan mango exports: insights, challenges, and recommendations. Front. Sustain. Food Syst. 8:1293263. doi: 10.3389/fsufs.2024.1293263
Xu, S., Qian, J., Chen, Y., and Zhang, H. (2025). Impact of RCEP implementation on agricultural sector in regional countries: a global value chain perspective. J. Integr. Agric. 24, 380–397. doi: 10.1016/j.jia.2024.11.035
Yang, C., Niu, Z., and Gao, W. (2022). The time-varying effects of trade policy uncertainty and geopolitical risks shocks on the commodity market prices: evidence from the TVP-VAR-SV approach. Resour. Policy 76:102600. doi: 10.1016/j.resourpol.2022.102600
Zahniser, S., Angadjivand, S., Hertz, T., Kuberka, L., and Santos, A. (2015). NAFTA at 20: North America’s free-trade area and its impact on agriculture. Washington, DC: United States Department of Agriculture, Economic Research Service.
Zainuddin, M. R. K., Sarmidi, T., and Khalid, N. (2020). Sustainable production, non-tariff measures, and trade performance in RCEP countries. Sustain. For. 12:9969. doi: 10.3390/su12239969
Zhang, T. D., and Gong, T. (2022). The forces of globalization reshape regionalism: the division of labor in global value chains and the formation of a network of regional trade agreements. World Econ. Stud. 7:135. doi: 10.13516/j.cnki.wes.2022.07.003
Zhang, H. Y., Ji, Q., and Fan, Y. (2014). Competition, transmission and pattern evolution: a network analysis of global oil trade. Energy Policy 73, 312–322. doi: 10.1016/j.enpol.2014.06.020
Zhang, C., Yang, Y., Feng, Z., Lang, T., Wang, X., and Liu, Y. (2021a). Food security risks of countries along the belt and road in the context of the COVID-19 pandemic. J. Risk Anal. Crisis Resp. 11, 45–56. doi: 10.2991/jracr.k.210503.001
Zhang, C., Yang, Y., Feng, Z., Xiao, C., Lang, T., Du, W., et al. (2021b). Risk of global external cereals supply under the background of the COVID-19 pandemic: based on the perspective of trade network. Food Secur. 10:1168. doi: 10.3390/foods10061168
Zhang, C., Yang, Y., Feng, Z., Xiao, C., Liu, Y., Song, X., et al. (2022). Cold chain food and COVID-19 transmission risk: from the perspective of consumption and trade. Food Secur. 11:908. doi: 10.3390/foods11070908
Zhu, M., Zhou, X., Zhang, H., Wang, L., and Sun, H. (2023). International trade evolution and competition prediction of boron ore: based on complex network and link prediction. Resour. Policy 82:103542. doi: 10.1016/j.resourpol.2023.103542
Keywords: grain trade network, coopetition relationships, evolutionary mechanisms, trade agreement, RCEP member countries
Citation: Lu M, Wu Y, Zhang C, Wang Y, Yang J, Huang Y and Wang Y (2025) Evolution of grain trade patterns among RCEP member countries and the potential impacts of agreement signing. Front. Sustain. Food Syst. 9:1565092. doi: 10.3389/fsufs.2025.1565092
Edited by:
Wenjin Long, China Agricultural University, ChinaReviewed by:
Li Ningjing, China Agricultural University, ChinaLunzheng Zhou, East China Jiaotong University, China
Copyright © 2025 Lu, Wu, Zhang, Wang, Yang, Huang and Wang. This is an open-access article distributed under the terms of the Creative Commons Attribution License (CC BY). The use, distribution or reproduction in other forums is permitted, provided the original author(s) and the copyright owner(s) are credited and that the original publication in this journal is cited, in accordance with accepted academic practice. No use, distribution or reproduction is permitted which does not comply with these terms.
*Correspondence: Chao Zhang, emhhbmdjaGFvQHlubnUuZWR1LmNu
†ORCID: Minhao Lu, https://orcid.org/0009-0003-4979-4243
Chao Zhang, https://orcid.org/0000-0002-2701-4088