Abstract
The rapid economic development of coastal cities has significantly constrained the availability of farmland resource. Therefore, understanding land-use change dynamics over the past two decades in these regions is essential for promoting the sustainable management of farmland. In this study, based on historical land-use data from the coastal cities of Jiangsu Province, we analyzed the spatiotemporal patterns of land-use change from 2000 to 2020 using remote sensing image interpretation with ArcGIS, construction of land-use change transition matrices, and calculation of land-use dynamic indices. Furthermore, we integrated the PLUS model with a Markov chain approach to simulate potential land-use patterns in 2035 under three future scenarios: natural development, ecological protection, and farmland protection. The results showed that paddy occupied the largest proportion of land use in the study area, ranging from 43.1 to 39.5%, followed by upland, which accounted for 37.7 to 36.5%. Both paddy and upland exhibited continuous declines during the study period, with total reductions of 1,086.67 km2 and 381.35 km2, respectively. The loss of farmland was primarily driven by conversion into built-up land, which expanded by 1,003.61 km2. Transition matrix analysis further revealed that between 2005 and 2010, built-up land experienced a net increase of 1,154.93 km2, of which 55.4 and 34.0% were converted from paddy and upland, respectively. Additionally, statistical analysis identified GDP, population density, annual precipitation, and annual average temperature as the main driving factors influencing land-use change. Simulation results indicated that under both the natural development and ecological protection scenarios, upland would experience slight increases of 32.8 km2 and 10.5 km2, respectively, by 2035. However, paddy would decrease significantly by 466.9 km2 and 476.8 km2 under these two scenarios. In contrast, under the farmland protection scenario, both paddy and upland would increase by 22.6 km2 and 63.1 km2, respectively, by 2035. In conclusion, under the current trajectory of land-use change, the consistent enforcement of farmland protection policies, together with targeted measures for paddy conservation, is crucial for achieving the sustainable utilization of farmland resource in the coastal cities of Jiangsu Province.
1 Introduction
Land serves as a fundamental resource for human survival and societal development, and the rational utilization of land resources is essential for promoting sustainable regional growth (Xia and Zhai, 2023). Coastal regions are characterized by high population density, rapid urbanization, and strong economic growth. While urban expansion stimulates economic development, it also triggers significant land-use changes, leading to increasing pressure on land resource availability (Xu et al., 2022; Zhou et al., 2022). Jiangsu Province, located in China’s economically developed eastern coastal region, covers a total land area of 1.72 × 10⁴ km2, accounting for 1.12% of the country’s total territory. The continuous advancement of economic development and urbanization has intensified resource competition and exacerbated the human-land conflict (Hansen et al., 2014). Notably, Jiangsu possesses a farmland area of 4.58 × 10⁴ km2, yet its per capita farmland is only 0.86 Chinese acres—considerably lower than the national average (Hagenlocher et al., 2012). Farmland plays a critical role in ensuring food security and supporting sustainable agricultural development (You et al., 2017). As one of China’s key grain-producing regions, Jiangsu has prioritized the protection of farmland and the maintenance of stable grain reserves, aligning with its strategic goal of high-quality development. Therefore, achieving sustainable use and scientifically informed management of farmland resource has become a matter of urgent importance in Jiangsu Province.
Since the 1980s, Jiangsu province in China has consistently emphasized farmland utilization within the framework of its farmland protection policy (Qian et al., 2020). Despite the province’s firm adherence to the farmland red line during a period of rapid economic growth, urban expansion has continued to be a dominant trend. Between 1990 and 2010, the built-up land area in Jiangsu nearly doubled, with approximately 90% of this increase originating from farmland conversion (Yao, 2013). This transformation in coastal land-use patterns has significantly reduced farmland area, thereby imposing substantial constraints on the sustainable development of the region’s economy, society, and ecosystems. To support more effective planning and management of coastal land resources, previous studies have focused on coastal reclamation and the development of coastal zones in Jiangsu. For instance, Xu et al. (2022) used Landsat series images to monitor thespatiotemporal dynamics of coastal reclamation in Jiangsu Province from 1984 to 2019. They highlighted the need to improve the utilization efficiency of reclaimed land and to balance both the benefits and environmental impacts of coastal reclamation in order to promote the sustainable development of tidal flat resources in the province. Li F, et al. (2020) using statistical and remote sensing data, analyzed the extent of coastal reclamation, the introduction of relevant policies, and their impact on sea use practices between 2002 and 2018, aiming to inform improvements in China’s marine resource management policies. It is evident that most existing research on coastal land use has primarily concentrated on changes along the coastline, withlimited attention given to inland coastal areas, particularlyregarding farmland utilization and the underlying drivers of land-use change. Currently, the permanent farmland areas in the three major coastal cities of Jiangsu - Nantong, Yancheng, and Lianyungang - are 5.802 million Chinese acres, 10.813 million Chinese acres, and 4.724 million Chinese acres, respectively, accounting for 45.3, 42.4, and 41.1% of each city’s designated farmland red line. Understanding the dynamic process of land-use change is essential for comprehending regional land transformations and promoting the scientific and sustainable management of land resources (Jiang et al., 2021; Xu et al., 2012). Therefore, investigating the spatiotemporal dynamics of farmland resource in these coastal regions is of crucial importance for ensuring the long-term sustainability of agriculture in Jiangsu Province.
Analyzing the spatiotemporal characteristics of land-use change involves examining the transformation patterns and dynamic trends of land-use types across different time periods and spatial scales within a given region (Shen et al., 2006). Temporal and spatial variations in regional land use reflect the historical development stages and distinctive features of the study area, enabling the identification of emerging challenges and providing a solid foundation for the formulation of science-based land-use policies and management strategies (Yan et al., 2007). Moreover, investigating the driving factors behind land-use change is essential for understanding the mechanisms of land-use dynamics and their ecological implications. Predicting future land-use patterns is a critical component of regional land management. Multi-scenario simulation serves as a powerful tool that enables planners to forecast land-use changes under various development pathways, assess associated driving forces, and evaluate potential ecological risks of land expansion. This approach provides valuable insights for formulating more sustainable and evidence-based land management plans. Therefore, multi-scenario simulation has become an increasingly promising and practical method in regional planning and policy design (Chen and Yao, 2023). In this context, our research utilizes satellite remote sensing data and land-use datasets from the coastal cities of Nantong, Yancheng, and Lianyungang in Jiangsu Province. Through the unit area value method and spatial interpolation techniques, we investigate the spatiotemporal evolution of land-use types in these coastal cities and analyze transitions among different land-use categories. Additionally, a random forest algorithm was applied to assess the spatial probability of land-use type development and its key driving factors (Liang et al., 2021). Based on remote sensing data that capture land-use evolution at the patch scale, this study integrates the PLUS model with the Markov chain model to simulate land-use change from both temporal and spatial perspectives (Li et al., 2021). The PLUS model retains the advantages of adaptive inertial competition and roulette competition mechanisms, which enhance its ability to identify the causes of various land-use transitions and accurately simulate patch-based growth patterns (Liang et al., 2021). The primary objective of this research is to model the spatial distribution of land-use types in Jiangsu’s coastal cities in 2035 under three distinct scenarios: natural development, ecological protection, and farmland protection. By analyzing the characteristics and patterns of these changes, the study reveals the spatiotemporal dynamics of land-use types, particularly those related to farmland resource evolution, in Jiangsu’s coastal cities. These findings will provide valuable insights into the historical trends and future trajectories of farmland use changes in the region, ultimately contributing to the theoretical foundation necessary for sustainable farmland management in coastal zones.
2 Materials and methods
2.1 Description of study area
Jiangsu Province is located in the Yangtze River Delta region along the eastern coast of mainland China, covering a geographical range of approximately 30°45′ to 35°08′ north latitude and 116°21′ to 121°56′ east longitude. The province includes three major coastal cities: Nantong, Yancheng, and Lianyungang (Figure 1). The study area is characterized by flat topography and abundant land and tidal flat resources. The region lies within the East Asian monsoon climate zone, exhibiting a transitional climate between subtropical and warm temperate zones. It features mild temperatures, distinct seasonal variations, concentrated rainfall, sufficient solar radiation, and a relatively long growing season. The average annual temperature ranges from 13.6 to 16.1°C, with annual precipitation varying between 704 and 1,250 mm. Annual total solar radiation energy reaches 110–126 kcal/cm2, and the frost-free period decreases from approximately 250 days in the south to around 200 days in the northern parts of the region.
Figure 1
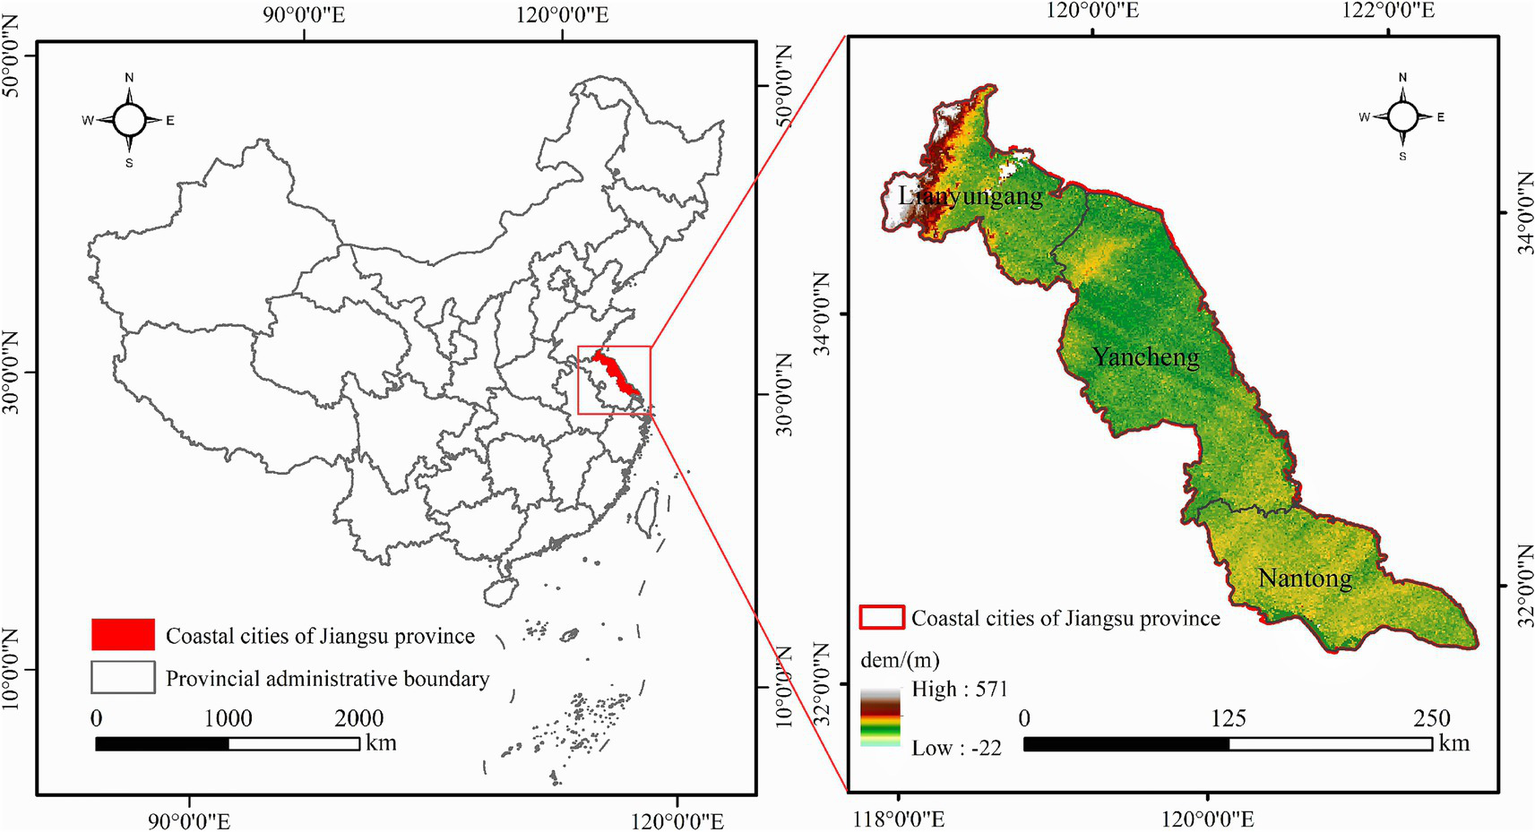
Location of the study area−coastal cities of Jiangsu province.
2.2 Data sources
All land use data employed in this study were obtained from the National Earth System Science Data Center.1 A 1:100,000 scale land use dataset covering five time periods between 2000 and 2020 was acquired. The dataset consisted of 100 × 100 m grid-based land use maps for the years 2000, 2005, 2010, 2015, and 2020, which accurately captured the land use characteristics, utilization patterns, and spatial distribution across Jiangsu Province.
The dataset categorized land use into six primary classes: cropland, forestland, grassland, water area, built-up land, and unused land. Given the focus of this study on the spatiotemporal dynamics of farmland, the cropland category was further subdivided in accordance with the Classification of Land Use Status standards. This refinement allowed for a more detailed and nuanced analysis of farmland transitions within the study area (Table 1).
Table 1
| Primary classification | Secondary classification | Representative meaning |
|---|---|---|
| Farmland | Upland | Farmland with or without water sources and irrigation facilities. |
| Paddy | It refers to farmland with water source and irrigation facilities and is used to grow rice. | |
| Built-up land | − | Urban and rural residential areas and other industrial, transportation areas. |
| Water area | − | Refers to natural land and land for water conservancy facilities. |
| Grassland | − | Various types of grasslands mainly composed of growing herbaceous plants. |
| Woodland | − | Refers to forestry land that grows trees, shrubs, bamboo, and coastal mangrove forests. |
| Unutilized Land | − | Refers to unused land, including difficult to use land. |
Land use classification system in three coastal cities of Jiangsu.
The raster database of driving factors was obtained from multiple authoritative sources, including the Resource and Environmental Science and Data Center, the National Earth System Science Data Center, and the National Catalog Service for Geographic Information (see Table 2 for details). These driving factors encompassed a range of natural and anthropogenic variables that influence land use change. To ensure compatibility with the Patch-generating Land Use Simulation (PLUS) model, all datasets were standardized to a spatial resolution of 100 meters and converted into grid format using ArcGIS software.
Table 2
| Type of driving factors | Driving factors | Data resolution/time | Data source |
|---|---|---|---|
| Natural factors | Elevation | 90 m/2007 | Resource and Environment Science and Data Center (https://www.resdc.cn) |
| Slope | 90 m/2007 | ||
| Annual average temperature | 1 km/2020 | National Earth System Science Data Center (http://www.geodata.cn/) | |
| Annual precipitation | 1 km/2020 | ||
| Soil type | 1 km/2003 | Resource and Environment Science and Data Center (https://www.resdc.cn) | |
| Socioeconomic factors | GDP | 1 km/2019 | Resource and Environment Science and Data Center (https://www.resdc.cn) |
| Population density | 1 km/2019 | ||
| Night-time light | 500 m/2020 | Night-time light data were derived from Chen et al. (2021; Harvard Dataverse, https://doi.org/10.7910/DVN/YGIVCD). | |
| Accessibility factors | Distance to town | 1: 1,000,000 vector data (2020) | National Catalog Service For Geographic Information (https://www.webmap.cn/) data, these data are calculated by using the European distance tool in ArcGIS. |
| Distance to road | |||
| Distance to railway | |||
| Distance to river |
Data source of drive factors.
2.3 Research method
2.3.1 Establish a land use database for the study area
Land use remote sensing image data were processed and analyzed using ArcGIS 10.8 to extract land use information specific to the study area and to establish a comprehensive spatial database. The following methodological steps were carried out:
-
A scanned 1:100,000 scale topographic map of the study area was imported into the GIS environment and underwent projection correction to ensure spatial accuracy.
-
At least nine representative ground control points (GCPs) with distinct and recognizable features were selected from the Thematic Mapper (TM) satellite imagery and matched to their corresponding locations on the topographic map to ensure geometric consistency.
-
Within the GIS environment, a dynamic TM image library representing land use changes over time was constructed for the study area.
-
The extracted land use data were stored in the coverage file format in ArcGIS, facilitating the creation of a structured and spatially enabled database.
Land use maps for the years 2000, 2005, 2010, 2015, and 2020 are presented in Figure 2, illustrating the spatial distribution and temporal evolution of land use types across the study area.
Figure 2
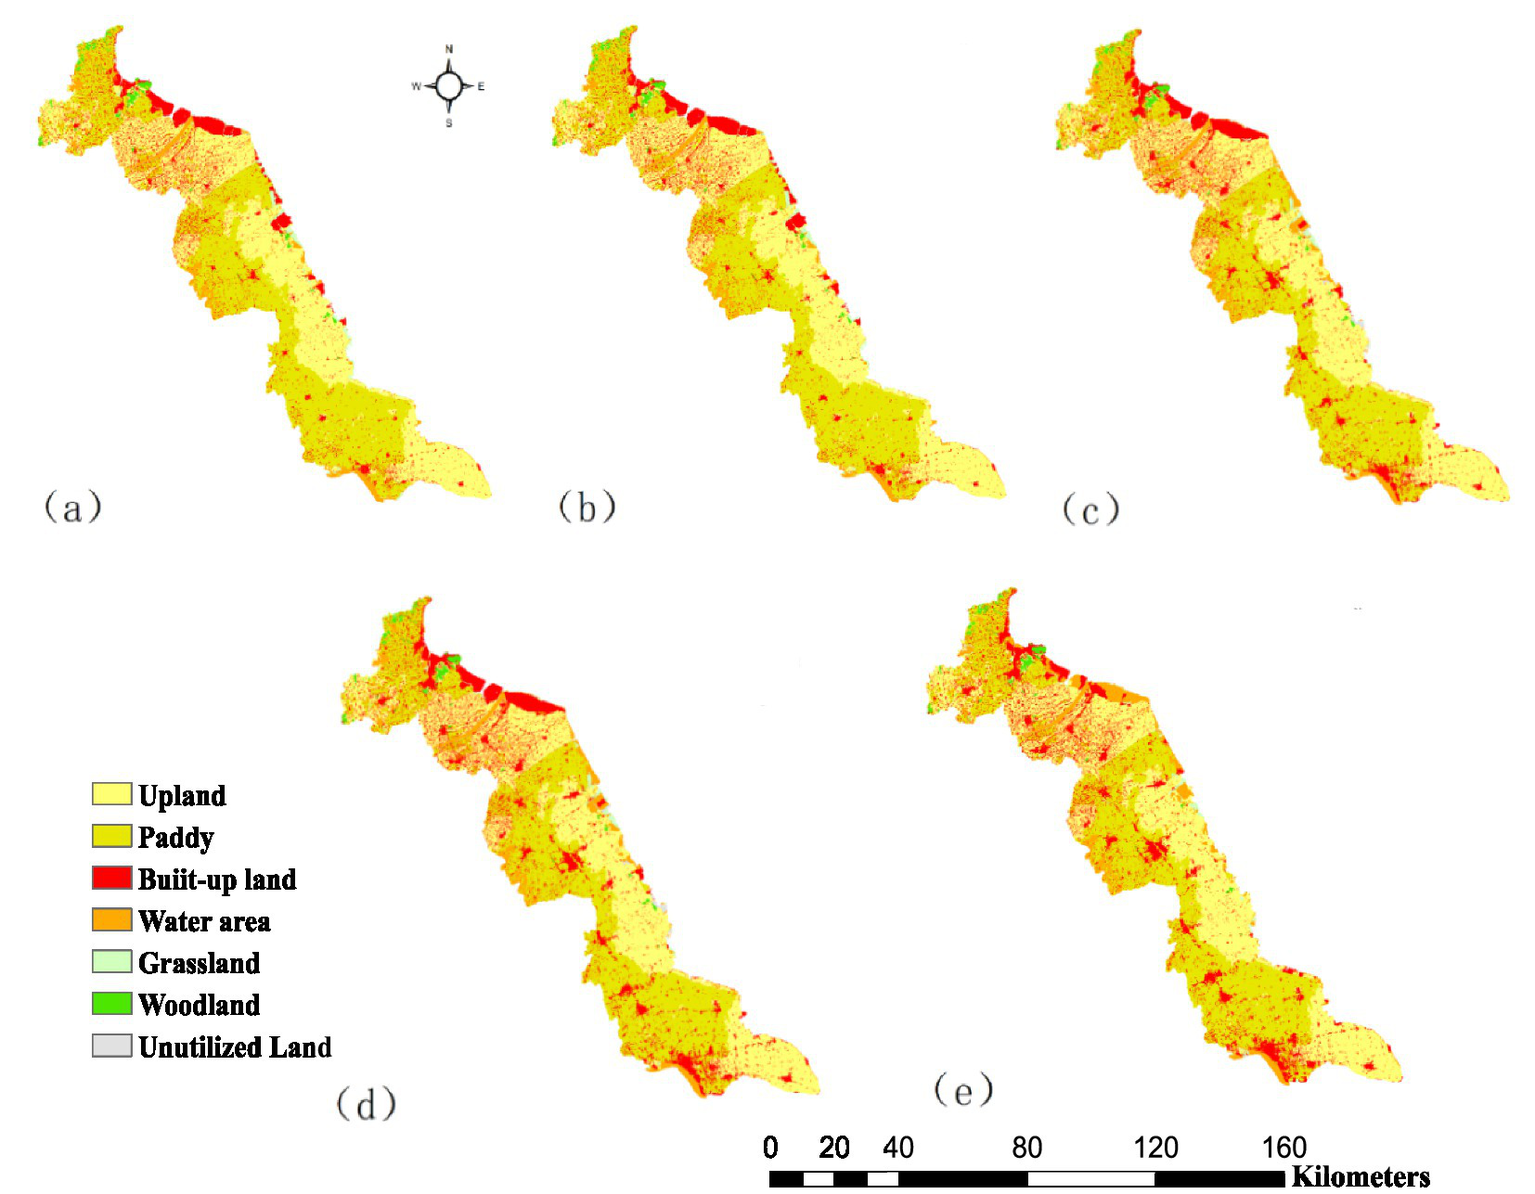
Distribution diagram of every land use types of 2000 (a), 2005 (b), 2010 (c), 2015 (d) and 2020 (e).
2.3.2 Land use change transfer matrix
Using the land use data collected at five-year intervals from 2000 to 2020, a land use change transfer matrix was constructed to quantify transitions among different land use types over time. Based on the principles of map algebra, the land use change map between two consecutive periods k and k + 1 can be derived by comparing the land use status Aij^k at period k with that at period k + 1, denoted as Aij^(k + 1). By applying Equation 1, the land use change map Cij was generated using map algebra operations. This map visually illustrates the spatial patterns and types of land use conversions during the specified time interval. In addition to the spatial representation, a quantitative transfer matrix was also produced, capturing the mutual transitions among various land use categories. This approach enables the analysis of both the magnitude and direction of land use changes across multiple periods, thereby facilitating a comprehensive understanding of the temporal evolution and transformation processes of land use in the study area (Qu et al., 2018). The formulation of the land use transfer matrix is presented below.
ArcMap software was employed to calculate the land use transfer matrix between any two consecutive periods through a spatial overlay analysis approach. By aligning land use maps from different time slices, the overlay method enabled the identification and quantification of transitions between land use types over time.
2.3.3 Analysis of changes in land use structures
The change in land use structure refers to the characteristics of the total amount and rate of each land use type evolving over time. This evolution is primarily manifested by the magnitude and velocity of land use transitions (Wang et al., 2019). The magnitude of land use change indicates the absolute extent of land use transformation over the study period, with specific calculation methods detailed in Equations 2, 3.
The Dynamic Degree of Land Use (DDLU) is a widely utilized metric for analyzing changes in land use patterns. DDLU quantifies the amplitude of land use changes during the study period, providing insights into the rate and scale of these transformations (Zhai et al., 2021). The mathematical model for DDLU is presented in Equation 4.
where K1 is the total change in a particular land use type during the study period; K2 is the annual magnitude of change in a particular land use type during the study period; K3 is the dynamics degree of change of a particular land use type over the study period; Ua is the quantity of a particular land use type at the beginning of the study period; Ub is the quantity of a particular land use type at the end of the study period; and T is the study period length.
2.3.4 Scenario analysis
Based on land use data, this study integrates the Patch-generating Land Use Simulation (PLUS) model with the Markov chain model to project the land use patterns of coastal cities in Jiangsu Province in 2035 under three distinct scenarios: natural development, ecological conservation, and farmland protection.
-
The Land Expansion Analysis Strategy (LEAS) module was utilized to identify the areas of expansion for various land use types by overlaying land use data from 2010 and 2020. To assess the spatial development probability of each land use type and its driving factors, a random forest algorithm was applied (Liang et al., 2021). The driving factors are detailed in Table 2. For the random forest model configuration, a sampling rate of 0.8 was used, with 50 regression trees and an mTry parameter set to 12. These settings were chosen to optimize the model’s predictive accuracy while balancing computational efficiency.
-
The Cellular Automaton based on Multiple Random Seeds (CARS) was utilized to simulate land use changes within the study area (Li et al., 2021). This approach utilizes multiple random seeds to enhance the stochasticity and realism of the simulation process. Neighborhood weights for different land use types were calculated following the methodology proposed by Baosheng Wang et al. (2019)Equation 5. These weights are critical for determining the influence of adjacent cells on the state transitions of any given cell, thereby affecting the overall pattern and dynamics of land use change. By integrating these neighborhood weights into the CARS model, the simulation more accurately reflects the complex interactions and transitions between various land use categories within the study region.
where Wi represent the neighborhood weights of land use type I, TAi represent the area of i type of land use expansion, TAmin represent the minimum expansion area of various types of land use, TAmax represent the max expansion area of various types of land use.
-
The Kappa coefficient, which ranges from 0 to 1, was used to assess the agreement between simulated and observed land use maps. A Kappa value exceeding 0.7 is generally considered to indicate statistically acceptable model performance (Gao et al., 2022). In this study, the Kappa coefficient reached 0.8935, and the overall classification accuracy was calculated as 0.9274, demonstrating a high level of simulation accuracy and model reliability.
-
A Markov chain model was applied to conduct future land use simulations, generating a transition probability matrix for the period 2010–2020. This matrix was subsequently used to project land use demands for the year 2035 under the simulated scenarios (Li et al., 2021).
3 Results
3.1 Land use characteristics
From 2000 to 2020, paddy occupied the largest share of land use, ranging from 43.1 to 39.5%, followed by upland, which accounted for 37.7 to 36.5%. Built-up land constituted 12.1 to 16.3% of the total area, while water area, woodland, grassland, and unutilized land each represented less than 10%. Due to its minimal contribution, unutilized land was excluded from further analysis. Notably, among the remaining categories, water area had the largest proportional coverage (Table 3). Furthermore, during the study period (2000–2020), upland and paddy experienced absolute decreases of 381.35 km2 and 1,086.67 km2, respectively (Figure 3a).
Table 3
| Land use types | Year | |||||||||
|---|---|---|---|---|---|---|---|---|---|---|
| 2000 | 2005 | 2010 | 2015 | 2020 | ||||||
| Area(km2) | Proportion(%) | Area(km2) | Proportion(%) | Area(km2) | Proportion(%) | Area(km2) | Proportion(%) | Area(km2) | Proportion(%) | |
| Paddy | 13231.2 | 43.1% | 13178.3 | 42.9% | 12483.4 | 40.6% | 12291.6 | 40.0% | 12144.6 | 39.5% |
| Upland | 11589.6 | 37.7% | 11590.3 | 37.7% | 11206.9 | 36.5% | 11097.3 | 36.1% | 11208.3 | 36.5% |
| Woodland | 351.3 | 1.1% | 352.7 | 1.1% | 323.4 | 1.1% | 320.5 | 1.0% | 293.3 | 1.0% |
| Grassland | 422.7 | 1.4% | 374.0 | 1.2% | 254.0 | 0.8% | 237.3 | 0.8% | 241.8 | 0.8% |
| Water area | 1398.9 | 4.6% | 1378.5 | 4.5% | 1694.1 | 5.5% | 1734.4 | 5.6% | 2081.6 | 6.8% |
| Built-up land | 3724.4 | 12.1% | 3845.0 | 12.5% | 4704.9 | 15.3% | 4997.6 | 16.3% | 4728.0 | 15.4% |
| Unutilized Land | 0.9 | 0.0% | 0.3 | 0.0% | 75.1 | 0.2% | 63.1 | 0.2% | 20.0 | 0.1% |
Land use structural feature of Jiangsu coastal cities from 2000 to 2020.
Figure 3
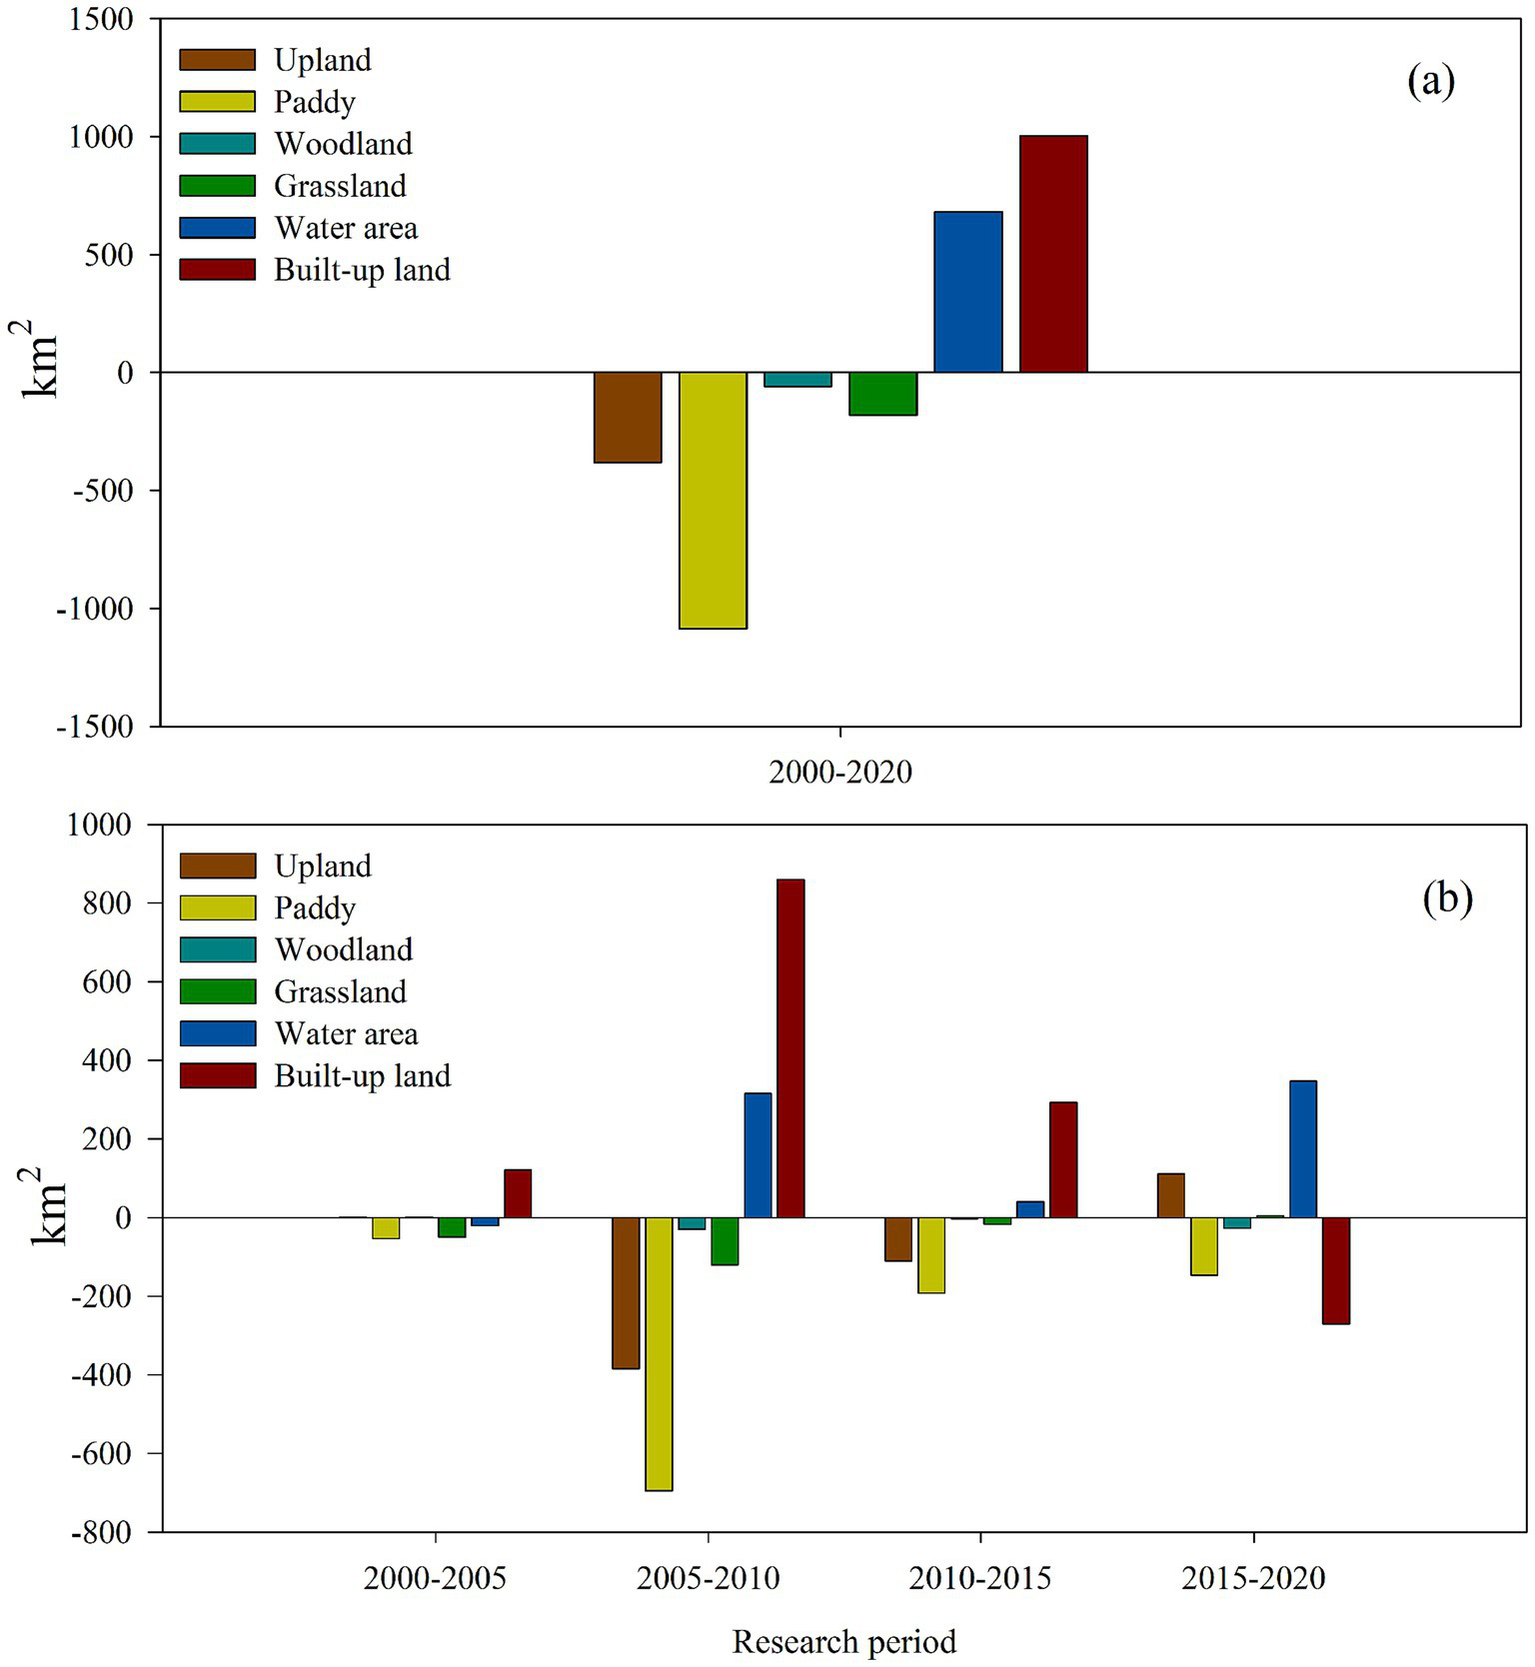
Total change amplitude of land use in Jiangsu coast from 2000 to 2020 (a) and the change every 5 years (b).
When the period from 2000 to 2020 was divided into four distinct intervals, the area of paddy showed a continuous decline, with the most significant reduction occurring between 2005 and 2010, amounting to 694.84 km2 (Figure 3b). Upland also decreased during 2005–2010 and 2010–2015 by 383.4 km2 and 109.6 km2, respectively, followed by a partial recovery of 110.96 km2 during 2015–2020 (Figure 3b).
In contrast to the decreasing trend in farmland, the areas of water area and built-up land expanded throughout the study period. Specifically, water area increased by 682.67 km2 and built-up land by 1,003.61 km2 (Figure 3a). The expansion of water area occurred primarily during 2005–2010 and 2015–2020, with increases of 315.6 km2 and 347.16 km2, respectively. Meanwhile, built-up land exhibited substantial growth in each interval, with increases of 859.96 km2, 292.69 km2, and 120.6 km2, respectively. Notably, both water area and built-up land showed higher rates of change during 2005–2010 compared to other periods, indicating a significant land conversion dynamic between these two categories during that time.
Regarding woodland and grassland, their areas experienced net decreases of 57.95 km2 and 180.90 km2, respectively, over the entire study period (Figure 3b).
3.2 Changes in land use composition
Between 2000 and 2005, both paddy and water area experienced net decreases, amounting to 106.64 km2 and 61.06 km2, respectively. During this period, paddy was predominantly converted into built-up land. Notably, built-up land expanded by a net area of 154.25 km2, with 56.5% derived from paddy and 33.9% from upland (Figure 4a).
Figure 4
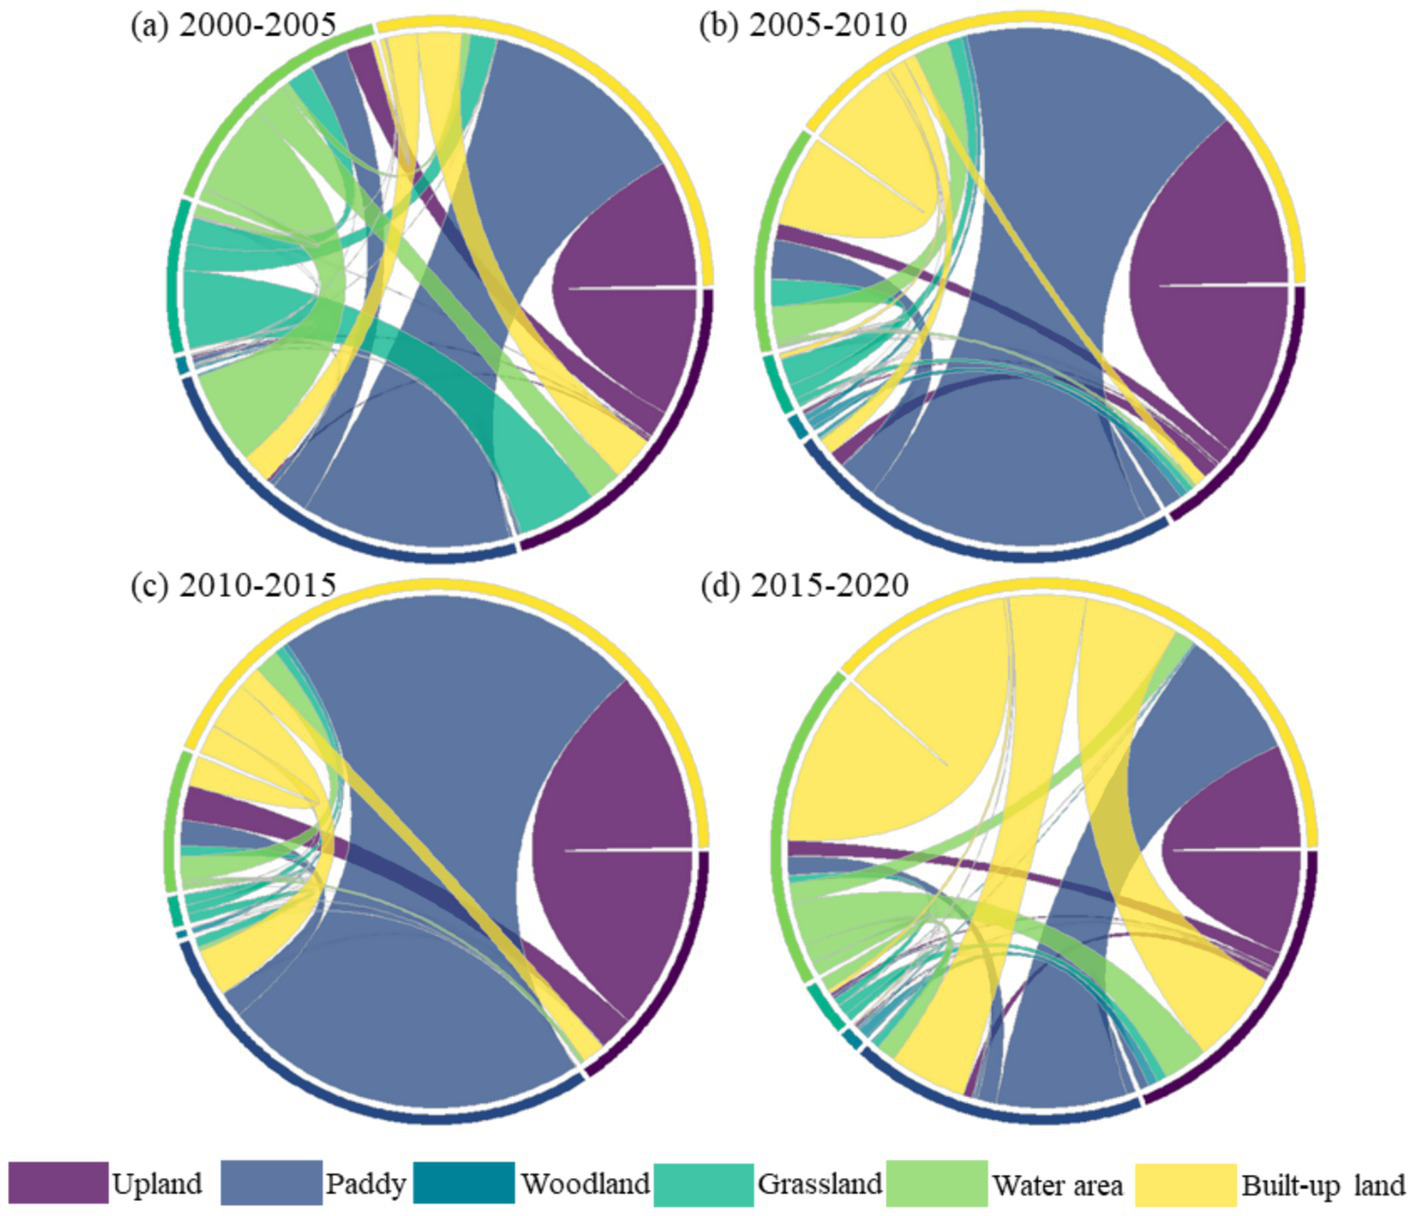
Chord diagram of land use transfer matrix in coastal cities of Jiangsu for 2000–2005 (a), 2005–2010 (b), 2011–2015 (c), and 2015–2020 (d).
Since 2005, upland and paddy have experienced net decreases, while built-up land has seen a net increase of 1,154.93 km2. The expansion of built-up land was primarily driven by the conversion of paddy (55.4%) and upland (34.0%; Figure 4b). Between 2010 and 2015, both upland and paddy continued to undergo net losses, amounting to 111.55 km2 and 194.93 km2, respectively, with most of these areas being transformed into built-up land. In terms of contributions to the newly added water area, upland, paddy, and built-up land accounted for 34.7, 25.4, and 29.5%, respectively. Furthermore, the expansion of built-up land during this period was predominantly sourced from paddy (62.3%) and upland (30.9%; Figure 4c).
From 2015 to 2020, paddy and built-up land experienced net decreases of 470.61 km2 and 996.47 km2, respectively. Paddy was primarily converted into built-up land, water area, and upland, with built-up land accounting for the largest share (79.3%). Meanwhile, built-up land was mainly transformed into water area (49.0%), upland (27.2%), and paddy (22.3%). During this period, both upland and water area showed net increases. The expansion of upland was predominantly driven by conversions from water area (125.92 km2, 26.2%) and built-up land (271.14 km2, 56.5%). The water area experienced a net increase of 609.51 km2, of which 80.0% originated from the conversion of built-up land (Figure 4d). Woodland exhibited a net loss of 86.48 km2, with 53.60% of this loss attributed to conversion into upland. Grassland also experienced a net decrease of 258.67 km2, with 38.11% of the total outflow corresponding to conversions into water area (98.58 km2).
3.3 Driving factors for land use change
The LEAS module of the PLUS model was employed in this study to evaluate the contributions of multiple driving factors. The selected driving factors were categorized into three groups: natural factors, socioeconomic factors, and accessibility factors, as illustrated in Figure 5. Based on the analysis of 12 explanatory variables, the transition suitability for each land use type was derived. These suitability maps played a dominant role in determining the competitive capacity of each transition unit during the simulation process. The contribution analysis of each driving factor across different land use types revealed that GDP had the greatest influence on the transition of upland farmland, followed by annual precipitation, population density, and annual average temperature, with contribution rates of 15.78, 13.14, 11.91, and 11.24%, respectively (Figure 6). For paddy fields, annual precipitation was identified as the most influential factor, contributing 14.37%. Additionally, annual average temperature, population density, and GDP also showed relatively high impacts on paddy field transitions, with contribution rates of 13.88, 11.13, and 10.14%, respectively (Figure 6). Regarding changes in water area, GDP, population density, annual average temperature, and annual precipitation exhibited relatively higher explanatory power compared to other factors. In the case of built-up land expansion, human economic activities proxied by night-time light intensity was the most significant driver, contributing 16.18% to the transition process. Night-time light data serve as a valuable indicator for understanding how human activities influence dynamic changes in land use. Compared to population density and GDP, night-time light imagery more accurately captures the spatial and temporal patterns of urban expansion driven by anthropogenic activity. Annual average temperature, GDP, and population density also exerted considerable influence, with contribution rates of 11.40, 11.02, and 11.13%, respectively. For woodland and grassland transitions, elevation, slope, annual average temperature, and annual precipitation were identified as the most critical driving factors (Figure 6).
Figure 5
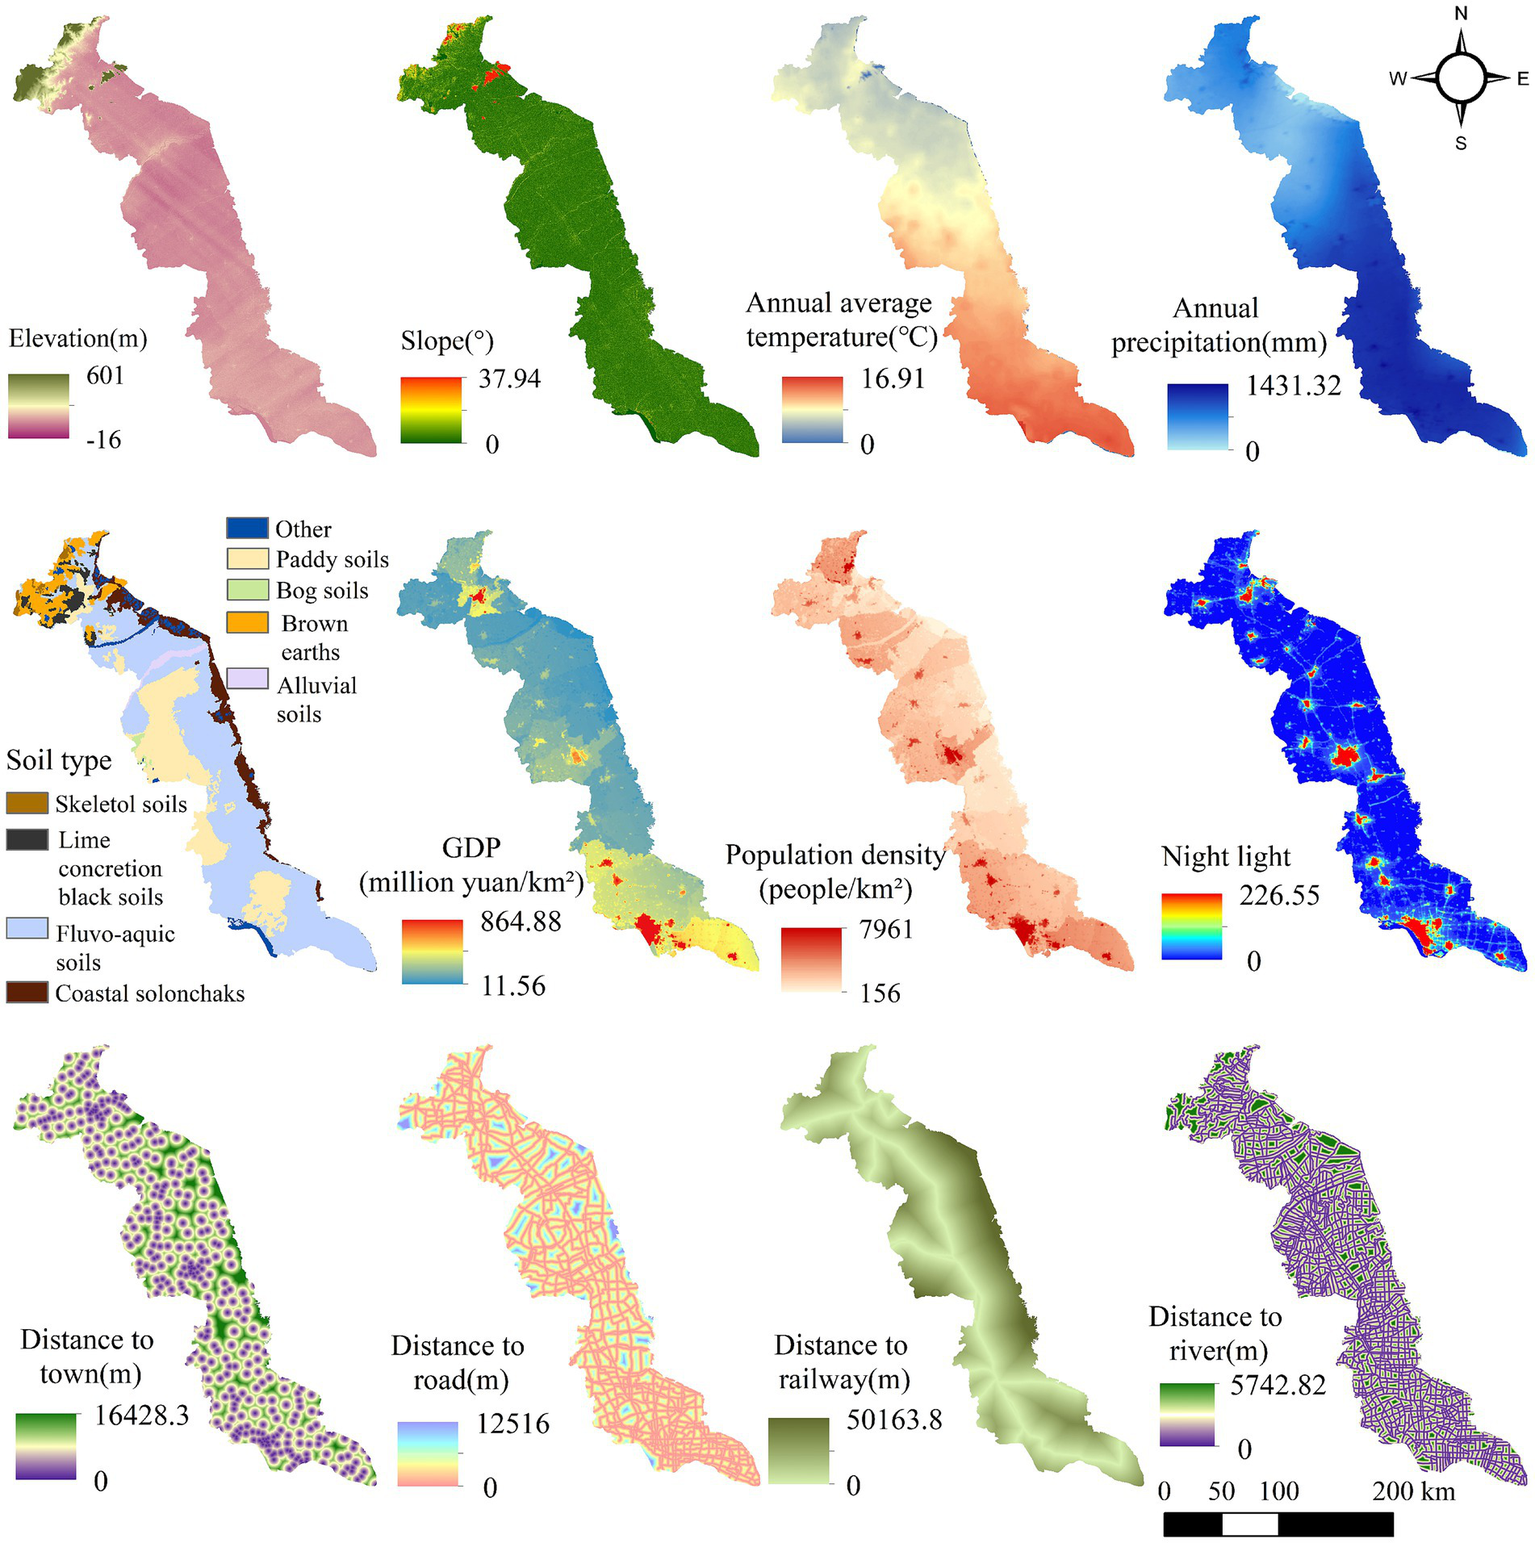
Driving factors for land use change in coastal cities of Jiangsu.
Figure 6
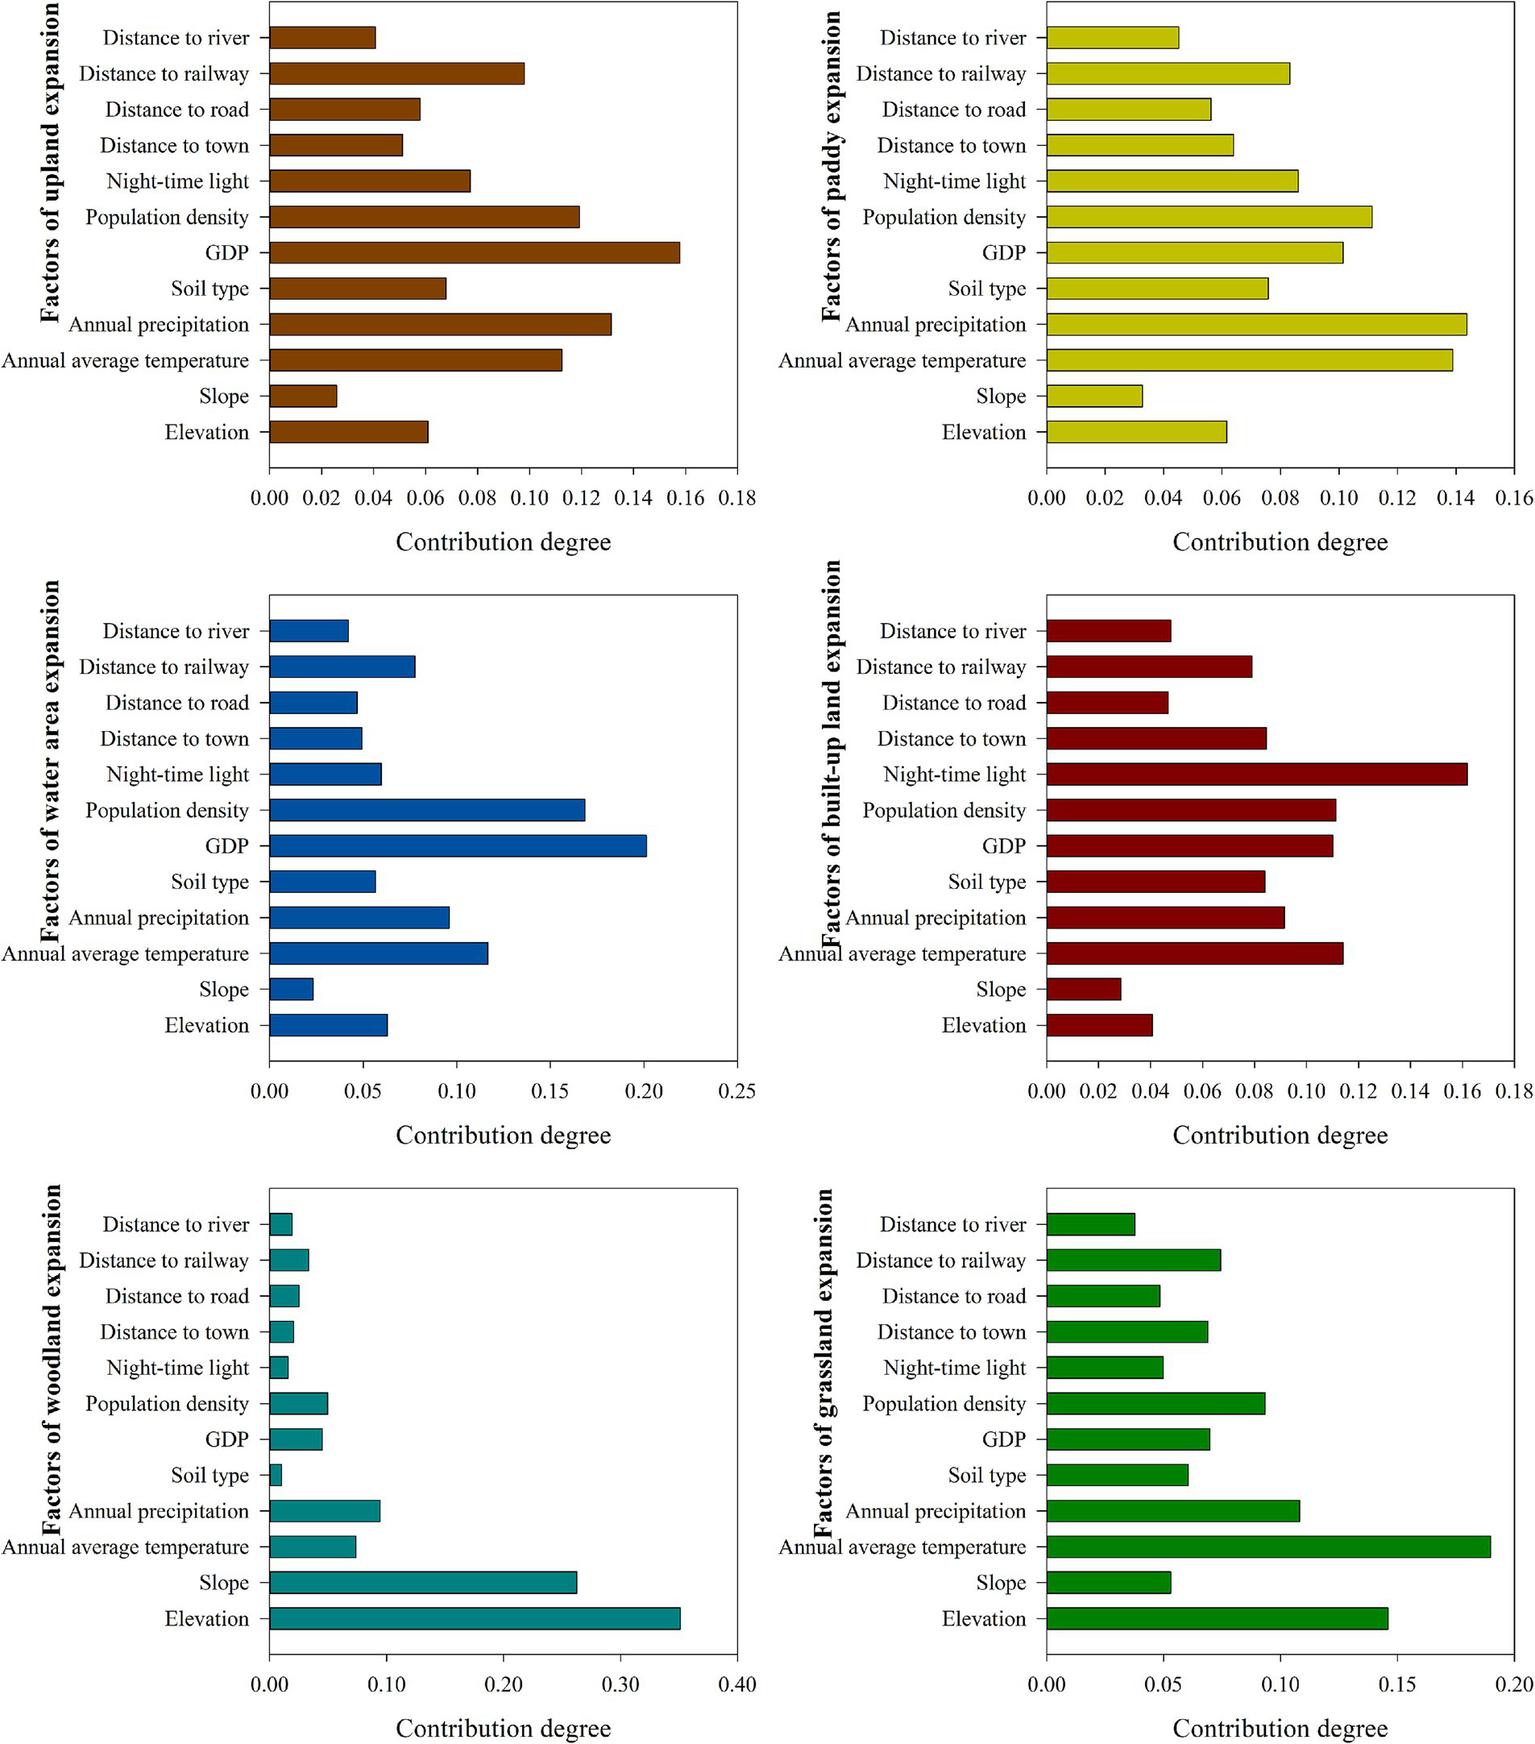
Contributions of driving factors for land use change.
3.4 Spatial pattern of land use in 2035 under three scenarios
To evaluate the reliability of the PLUS model in simulating land use patterns in the coastal cities of Jiangsu Province, this study used the 2010 land use data as input to simulate land use conditions for the year 2020 (Figure 7). The simulated results show a high degree of spatial consistency with the actual land use distribution observed in 2020.
Figure 7
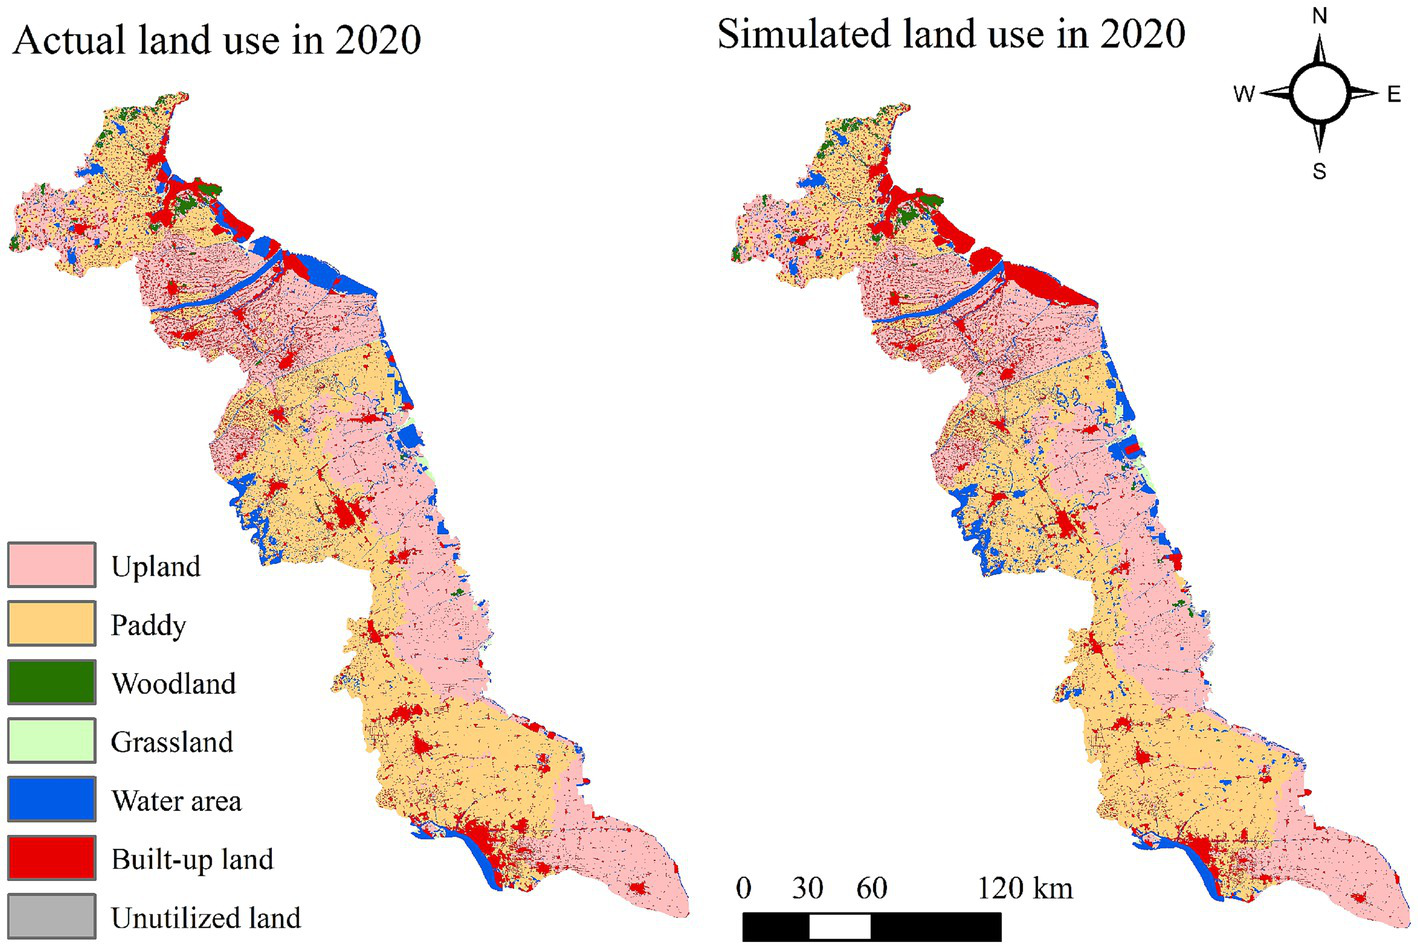
Comparison of actual and simulated results of land use in 2020.
The model achieved an overall accuracy of 0.9274 and a Kappa coefficient of 0.8935, indicating strong agreement between the simulated and observed land use maps. These metrics demonstrate that the PLUS model is highly reliable and capable of accurately reproducing historical land use changes. Therefore, it can be confidently applied to predict future land use patterns in Jiangsu’s coastal cities for the year 2035.
Based on historical land use change patterns and their associated driving factors, this study simulates potential land use configurations in 2035 under different policy scenarios. Land use change is influenced by a variety of socioeconomic and environmental factors, including local economic development strategies, ecological conservation policies, farmland protection measures, and broader land use planning frameworks (Liu et al., 2017). Accordingly, three distinct future scenarios were developed: natural development, ecological protection, and farmland protection (Figure 8). Under the natural development scenario, paddy and water area exhibited the most pronounced changes. The area of water area was projected to increase by 405.9 km2, while paddy decreased by 466.9 km2. In addition, upland, woodland, and built-up land expanded by 32.8 km2, 9.7 km2, and 23.5 km2, respectively (Table 4). Among all land use types, grassland was the only one showing a decline, decreasing by 10.5 km2. In the ecological protection scenario, similar trends were observed for paddy and water area, with water area increasing by 415.1 km2 and paddy declining by 476.8 km2. Under this scenario, upland, woodland, grassland, and built-up land increased by 10.5 km2, 13.9 km2, 19.4 km2, and 18.3 km2, respectively (Table 4). These results indicate that the ecological protection scenario promotes a greater allocation of land to ecologically beneficial uses compared to the natural development scenario. Under the farmland protection scenario, the trend reversed significantly. Paddy increased by 22.6 km2, whereas water area decreased by 71.7 km2, a pattern that contrasts sharply with the projections under the other two scenarios. Upland farmland and built-up land also expanded by 63.1 km2 and 18.3 km2, respectively. However, woodland and grassland experienced reductions of 14.9 km2 and 22.1 km2, respectively (Table 4), suggesting a trade-off between farmland expansion and natural vegetation cover. These findings highlight the significant influence of policy orientation on future land use dynamics and emphasize the importance of scenario-based modeling in supporting sustainable land management and planning decisions.
Figure 8
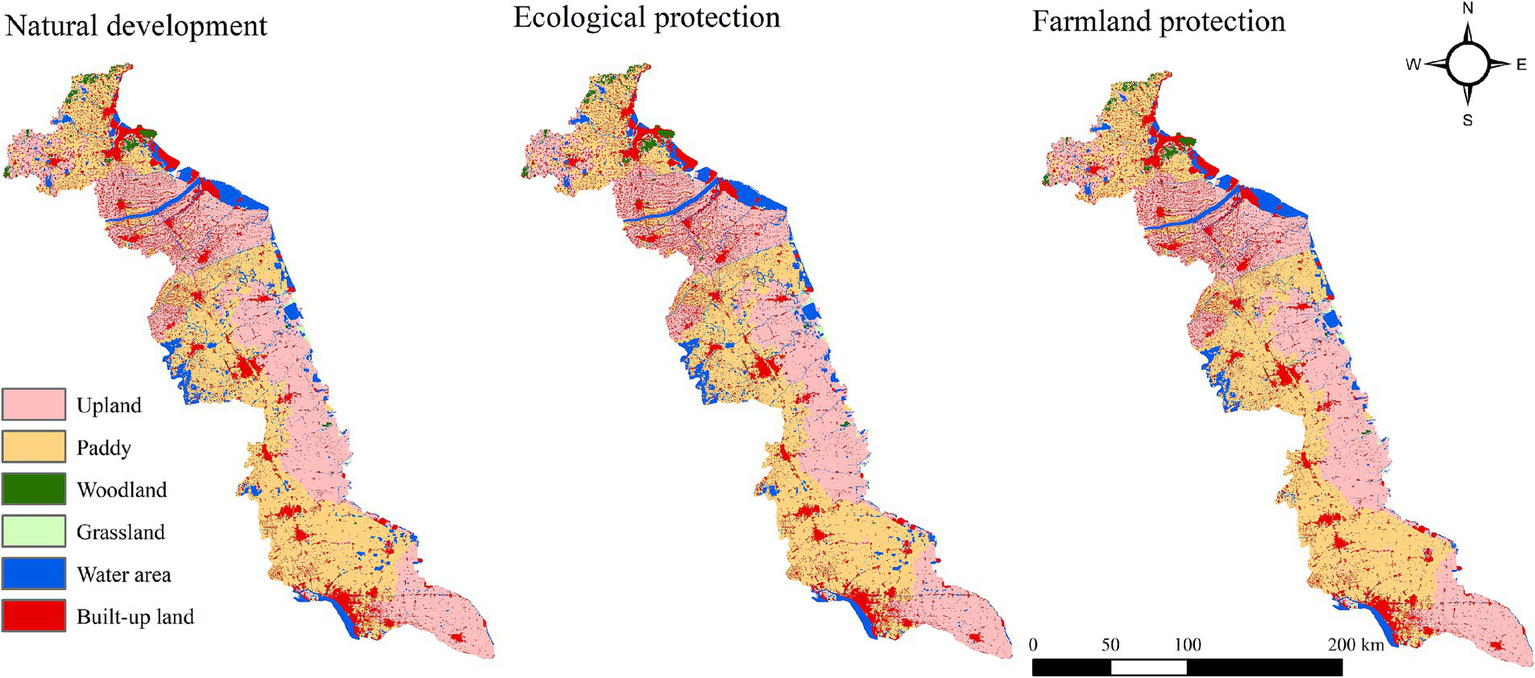
Spatial distribution of land use under three different scenarios in 2035.
Table 4
| Type of land use | In 2020 | In 2035 | |||||
|---|---|---|---|---|---|---|---|
| Natural development | Changes | Ecological protection | Changes | Farmland protection | Changes | ||
| Upland | 11204.9 | 11237.6 | 32.8 | 11215.3 | 10.5 | 11267.9 | 63.1 |
| Paddy | 12155.5 | 11688.6 | −466.9 | 11678.7 | −476.8 | 12178.1 | 22.6 |
| Woodland | 293.6 | 303.3 | 9.7 | 307.5 | 13.9 | 278.8 | −14.9 |
| Grassland | 231.7 | 221.2 | −10.5 | 251.1 | 19.4 | 209.6 | −22.1 |
| Water area | 2061.3 | 2467.2 | 405.9 | 2476.4 | 415.1 | 1989.6 | −71.7 |
| Built-up land | 4731.5 | 4754.9 | 23.5 | 4749.8 | 18.3 | 4749.8 | 18.3 |
Changes in land use area of Jiangsu coastal cities in 2035 under different scenarios (km2).
4 Discussion
The land use change analysis revealed that farmland remained the dominant land use type in the study area from 2000 to 2020. However, both the total area and proportion of farmland in Jiangsu’s coastal cities exhibited a gradual decline over this period. Specifically, the farmland area decreased from 24,820.9 km2 (80.8% of the total study area) to 23,352.8 km2 (76.0%). Farmland in this study is categorized into two secondary types: paddy and upland. Over the same period, paddy decreased by 1,086.67 km2, while upland declined by 381.35 km2. The reduction in both paddy and upland was primarily attributed to their conversion to built-up land, with 1,315.13 km2 and 846.64 km2, respectively, being transformed for urban development. Consequently, built-up land expanded significantly, increasing from 3,724.8 km2 to 4,997.6 km2, with its proportion rising from 12.1 to 15.4%. This trend aligns with previous studies indicating that farmland has historically been the largest land use type in Jiangsu’s coastal cities, but has faced substantial loss due to rapid urbanization, particularly in China’s more developed eastern regions (Huang et al., 2019). Given the region’s accelerated economic growth and high population density (Xu et al., 2022), the pressure on farmland resource has intensified. Farmland serves as a critical resource for ensuring food security; thus, its reduction can significantly impact food production capacity and, consequently, the balance of regional socio-economic development (Kong, 2014). Striking a sustainable balance between urban expansion and farmland protection remains a key challenge for policy-makers in coastal urban areas. Therefore, understanding the mechanisms through which urbanization affects farmland dynamics is essential. To better understand these dynamics, the land use transfer matrix provides valuable insights into the direction and magnitude of transitions among different land use types (You et al., 2023). By analyzing the transfer matrices across multiple time intervals, we further explored the temporal characteristics of land use changes and clarified the transformational relationships between farmland and built-up land (Riao et al., 2020; Wen et al., 2023).
The period from 2000 to 2020 was divided into four distinct intervals to examine the dynamic variation characteristics of paddy, upland, and built-up land. The analysis revealed a significant outflow of paddy and upland between 2005 and 2010, with reductions of 694.84 km2 and 383.4 km2, respectively. During this time, a strong mutual transformation relationship was observed among these three land use types. Specifically, the area converted from paddy and upland to built-up land was 4.40 and 2.56 times greater, respectively, than the reverse conversion from built-up land back to agricultural uses. This pattern likely resulted from accelerated urban expansion and the implementation of farmland occupation and compensation mechanisms (Chen et al., 2016). Notably, during 2005–2010, the centroid of farmland occupation initially shifted southward before making a sharp northward movement. Meanwhile, the centroid of farmland supplementation migrated from northern to southern Jiangsu. These shifts indicate substantial regional disparities in the balance rate between farmland occupation and supplementation. Moreover, built-up land accounted for the majority of farmland conversion, with rural residential areas contributing approximately 50.83% of this transformation (Chen et al., 2016). The rapid expansion of built-up land closely corresponded with the swift socio-economic development in Jiangsu Province. By 2015, the area of built-up land had increased by 5,060.3 km2 compared to 2004, representing a 30.66% increase relative to the 2004 baseline (Department of Land and Resources of Jiangsu Province, 2017). In contrast, the period from 2015 to 2020 exhibited a reversal trend: upland expanded by 110.96 km2, while built-up land decreased by 264.29 km2. Although the magnitude of change was relatively small, the underlying causes warrant further investigation. A plausible explanation is the strengthening of farmland protection policies during this period. In particular, the implementation of the Farmland Requisition-Compensation Balance Policy helped mitigate the loss of arable land due to non-agricultural development during China’s rapid urbanization (Qie et al., 2023). Despite sustained economic growth, Jiangsu has maintained a firm commitment to farmland protection (Yao, 2013). To reinforce this policy framework, the Jiangsu Provincial Government issued the Interim Provisions for the Accountability of Party and Government Leading Cadres of Jiangsu Province for Violating Land Management Regulations in April 2010. Furthermore, in July 2016, agreements on primary responsibility for farmland protection were signed between the provincial government and local authorities as part of the “13th Five-Year Plan.” These agreements mandated that farmland occupation be preceded by prior supplementation (“first supplement, then occupation”) and required strict oversight of the balance between land occupation and compensation during land use approval processes (Chen et al., 2016). As a result of these regulatory interventions, upland experienced net gains, while built-up land declined between 2015 and 2020.
Land use policy represents one of the key anthropogenic factors influencing land use change. In reality, land use dynamics are shaped by a combination of natural conditions and human activities (Wang et al., 2021). Understanding the underlying driving mechanisms and capturing the spatial evolution of land use changes at the patch level is essential for accurately simulating future land use patterns. Such insights can provide critical support for formulating more scientifically grounded land management and planning strategies. In this study, based on 12 driving factors and land use expansion data, we employed the random forest algorithm to analyze both the spatial suitability probability of different land use types and the contribution rates of each driving factor to land expansion. This approach allows for a comparative assessment of the influence intensity of various factors on land use transitions. The results indicate that each driving factor exerts varying degrees of influence on the expansion of different land use types. A comprehensive analysis reveals that GDP, population density, annual precipitation, and annual average temperature are the dominant drivers of land use change. Specifically, paddy expansion was most strongly influenced by annual precipitation, followed by annual average temperature, GDP, and population density. For upland, GDP, population density, annual average temperature, and annual precipitation also emerged as major contributing factors. Meanwhile, the expansion of built-up land was predominantly driven by night-time light intensity, population density, GDP, and annual average temperature. These findings suggest that the decline in farmland area is influenced by both natural and anthropogenic factors, whereas built-up land expansion is primarily driven by socio-economic development. Wu et al. (2022) similarly emphasized the significant role of socio-economic factors in shaping built-up land dynamics, further supporting the conclusion that human activities may be the decisive force behind urban expansion in Jiangsu’s coastal region. Jiangsu’s coastal cities are characterized by rapid economic growth and high population density. As a result, increasing demand for residential housing, public infrastructure, and recreational spaces has led to continuous expansion of built-up land, often at the expense of farmland resource. The excessive concentration of human activity heightens the risk of disharmony between people and nature (Li Y, et al., 2020), potentially triggering land use conflicts. Moreover, unchecked expansion or reduction of specific land use types can increase the likelihood of such conflicts (Güneralp et al., 2020). Therefore, it is crucial for policymakers in Jiangsu’s coastal regions to remain vigilant about the ongoing loss of farmland due to rapid urbanization. Ensuring food security while accommodating urban development requires a balanced and sustainable land use strategy that integrates ecological, economic, and social considerations.
Against the backdrop of ongoing built-up land expansion and declining farmland resource, this study aims to predict future land use patterns in Jiangsu’s coastal cities. With ecological sustainability and food security as primary objectives, we sought to identify an optimized land use structure that could help alleviate the growing human-land conflict in the region. To achieve this, we simulated future land use spatial patterns under three distinct scenarios: natural development, ecological protection, and farmland protection. The differences in simulated land use patterns for 2035 across these scenarios are illustrated in Figure 6. The simulation results indicate that built-up land growth and urban expansion remained relatively consistent across all three scenarios, with no significant acceleration observed. This finding contrasts with the commonly held assumption that, under a natural development trajectory, built-up land would continue to expand rapidly (Huang et al., 2019). Furthermore, under both the natural development and ecological protection scenarios, water area expanded significantly, while paddy fields decreased compared to the actual land use pattern in 2020. In particular, the emergence of numerous new water patches in 2035 was a notable feature of land use change under these two scenarios. Grassland expansion was only evident under the ecological protection scenario. These simulation outcomes suggest that policy interventions—such as those promoting ecological or farmland protection—can effectively moderate the pace of urban sprawl in Jiangsu’s coastal cities. However, current policies appear insufficient in safeguarding farmland, especially paddy. Although upland showed slight increases under two of the scenarios by 2035, the area of paddy declined sharply, primarily being replaced by water area. This highlights the urgent need to develop targeted policies specifically aimed at protecting paddy under the current land use transition trends. In contrast, under the farmland protection scenario, paddy ceased transitioning into other land use types, indicating the effectiveness of this policy framework in preserving arable land. However, this scenario also resulted in losses of water area, grassland, and woodland, suggesting that greater attention must be paid to maintaining the balance between farmland preservation and the conservation of ecological land use types. Food security constitutes a critical component of national security, while ecosystem services are equally vital for long-term sustainable development (Lei et al., 2020). Therefore, achieving a harmonious balance between farmland and ecological land use is essential for ensuring both food supply stability and ecological resilience in Jiangsu’s coastal cities. To this end, further research is needed to explore integrated land use policies that can identify and implement optimal land use structures, ones that simultaneously protect farmland and maintain the ecological functions necessary for sustainable urban development in coastal regions.
5 Conclusion
Based on historical land use data from the coastal cities of Jiangsu Province, this study characterizes the spatiotemporal dynamics of farmland resource and simulates future spatial patterns of farmland under three scenarios: natural development, ecological protection, and farmland protection, for the year 2035. The results reveal a continuous decline in farmland area over the past two decades, primarily due to conversions into built-up land. This loss of coastal farmland intensifies the pressure on already limited agricultural resource. However, analysis of the magnitude of land use change between 2015 and 2020, together with the simulated land use patterns for 2035, suggests that the consistent implementation of farmland protection policies, particularly when integrated with targeted measures for paddy field conservation, could effectively constrain urban expansion while ensuring the preservation of arable land. Therefore, it is crucial to develop integrated land use policies that not only safeguard farmland but also regulate the spatial distribution and intensity of built-up land development. Such strategies can help prevent unplanned urban sprawl and reduce land use conflicts arising from competing demands between urbanization and agricultural production. Simultaneously, greater emphasis should be placed on maintaining a balance between farmland and ecologically significant land use types in Jiangsu’s coastal cities. Overall, this research offers valuable insights into the spatiotemporal patterns of land use change and establishes a solid foundation for formulating effective farmland protection strategies in coastal regions.
Statements
Data availability statement
The raw data supporting the conclusions of this article will be made available by the authors, without undue reservation.
Author contributions
YtL: Conceptualization, Funding acquisition, Methodology, Resources, Writing – original draft, Writing – review & editing. SZ: Methodology, Software, Writing – original draft. YjL: Formal analysis, Software, Writing – original draft. YX: Writing – original draft. NW: Writing – original draft. YF: Writing – original draft.
Funding
The author(s) declare that financial support was received for the research and/or publication of this article. This research was funded by the Basic Science (Natural Science) Foundation of colleges and universities in Jiangsu Province (21KJB210001).
Acknowledgments
Acknowledgement for the data support from “National Earth System Science Data Center, National Science & Technology Infrastructure of China (http://www.geodata.cn)”. Special thanks to Proof-Reading-Service.com for English language editing.
Conflict of interest
The authors declare that the research was conducted in the absence of any commercial or financial relationships that could be construed as a potential conflict of interest.
Generative AI statement
The author(s) declare that no Gen AI was used in the creation of this manuscript.
Publisher’s note
All claims expressed in this article are solely those of the authors and do not necessarily represent those of their affiliated organizations, or those of the publisher, the editors and the reviewers. Any product that may be evaluated in this article, or claim that may be made by its manufacturer, is not guaranteed or endorsed by the publisher.
Footnotes
References
1
Chen S. Yao S. (2023). Identifying the drivers of land expansion and evaluating multi-scenario simulation of land use: a case study of Mashan County, China. Ecol. Inform.77:102201. doi: 10.1016/j.ecoinf.2023.102201
2
Chen C. Zhang Q. Lv X. Huang X. (2016). Analysis on spatial-temporal characteristics and driving mechanisms of cropland occupation and supplement in Jiangsu Province. Econ. Geogr.36, 155–163.
3
Chen Z. Yu B. Yang C. Zhou Y. Yao S. Qian X. et al . (2021). An Extended Time Series (2000–2018) of Global NPP-VIIRS-Like Nighttime Light Data from a Cross-Sensor Calibration. Earth Syst Sci Data.13, 889–906. doi: 10.5194/essd-13-889-2021
4
Department of Land and Resources of Jiangsu Province (2017). Land use change survey data in Jiangsu Province (2004–2016). Nanjing: Department of Land and Resources of Jiangsu Province.
5
Gao B. Wu Y. Li C. Zheng K. Wu Y. Wang M. et al . (2022). Multi-scenario prediction of landscape ecological risk in the Sichuan-Yunnan ecological barrier based on terrain gradients. Land11:2079. doi: 10.3390/land11112079
6
Güneralp B. Reba M. Hales B. U. Wentz E. A. Seto K. C. (2020). Trends in urban land expansion, density, and land transitions from 1970 to 2010: a global synthesis. Environ. Res. Lett.15:044015. doi: 10.1088/1748-9326/ab6669
7
Hagenlocher M. Lang S. Tiede D. (2012). Integrated assessment of the environmental impact of an IDP camp in Sudan based on very high resolution multi-temporal satellite imagery. Remote Sens. Environ.126, 27–38. doi: 10.1016/j.rse.2012.08.010
8
Hansen M. Potapov P. Margono B. Turubanova S. Tyukavina A. (2014). Response to comment on high-resolution global maps of 21st-century forest cover change. Science344, 981–982. doi: 10.1126/science.1248817
9
Huang Z. Du X. Castillo C. S. Z. (2019). How does urbanization affect farmland protection? Evidence from China. Resour. Conserv. Recycl.145, 139–147. doi: 10.1016/j.resconrec.2018.12.023
10
Jiang P. Chen D. Li M. (2021). Farmland landscape fragmentation evolution and its driving mechanism from rural to urban: a case study of Changzhou City. J. Rural. Stud.82, 1–18. doi: 10.1016/j.jrurstud.2021.01.004
11
Kong X. (2014). China must protect high-quality arable land. Nature506:7. doi: 10.1038/506007a
12
Lei J. Chen Z. Chen X. Li Y. Wu T. (2020). Spatio-temporal changes of land use and ecosystem services value in Hainan Island from 1980 to 2018. Acta Ecol. Sin.40, 4760–4773.
13
Li F. Ding D. Chen Z. Chen H. Shen T. Wu Q. et al . (2020). Change of sea reclamation and the sea-use management policy system in China. Mar. Policy115:103861. doi: 10.1016/j.marpol.2020.103861
14
Li Y. Kong X. Zhu Z. (2020). Multiscale analysis of the correlation patterns between the urban population and construction land in China. Sustain. Cities Soc.61:102326. doi: 10.1016/j.scs.2020.102326
15
Li C. Wu Y. Gao B. Zheng K. Wu Y. Li C. (2021). Multi-scenario simulation of ecosystem service value for optimization of land use in the Sichuan-Yunnan ecological barrier, China. Ecol. Indic.132:108328. doi: 10.1016/j.ecolind.2021.108328
16
Liang X. Guan Q. Clarke K. C. Liu S. Wang B. Yao Y. (2021). Understanding the drivers of sustainable land expansion using a patch-generating land use simulation (PLUS) model: a case study in Wuhan, China. Comput. Environ. Urban. Syst.85:101569. doi: 10.1016/j.compenvurbsys.2020.101569
17
Liu X. Liang X. Li X. Xu X. Ou J. Chen Y. et al . (2017). A future land use simulation model (FLUS) for simulating multiple land use scenarios by coupling human and natural effects. Landsc. Urban Plan.168, 94–116. doi: 10.1016/j.landurbplan.2017.09.019
18
Qian F. Chi Y. Lal R. Lorenz K. (2020). Spatio-temporal characteristics of cultivated land fragmentation in different landform areas with a case study in Northeast China. Ecosyst. Health Sustain.6:1800415. doi: 10.1080/20964129.2020.1800415
19
Qie L. Pu L. Tang P. Liu R. Huang S. Xu F. et al . (2023). Gains and losses of farmland associated with farmland protection policy and urbanization in China: an integrated perspective based on goal orientation. Land Use Policy129:106643. doi: 10.1016/j.landusepol.2023.106643
20
Qu S. Wang L. Lin A. Zhu H. Yuan M. (2018). What drives the vegetation restoration in Yangtze River basin, China: climate change or anthropogenic factors?Ecol. Indic.90, 438–450. doi: 10.1016/j.ecolind.2018.03.029
21
Riao D. Zhu X. Tong Z. Zhang J. Wang A. (2020). Study on land use/cover change and ecosystem services in Harbin, China. Sustain. For.12:6076. doi: 10.3390/su12156076
22
Shen Y. Feng N. Zhou Q. (2006). The status and its influence of reclamation on Jiangsu coast. Mar. Sci.30, 39–43. doi: 10.1016/S1001-8042(06)60021-3
23
Wang Q. Guan Q. Lin J. Luo H. Tan Z. Ma Y. (2021). Simulating land use/land cover change in an arid region with the coupling models. Ecol. Indic.122:107231. doi: 10.1016/j.ecolind.2020.107231
24
Wang B. Liao J. Zhu W. Qiu Q. Wang L. Tang L. (2019). The weight of neighborhood setting of the FLUS model based on a historical scenario: a case study of land use simulation of urban agglomeration of the Golden triangle of southern Fujian in 2030. Acta Ecol. Sin.39, 4284–4298.
25
Wen J. Chuai X. Zuo T. Cai H. H. Cai L. Zhao R. et al . (2023). Land use change on the surface area and the influence on carbon. Ecol. Indic.153:110400. doi: 10.1016/j.ecolind.2023.110400
26
Wu J. Luo J. Zhang H. Qin S. Yu M. (2022). Projections of land use change and habitat quality assessment by coupling climate change and development patterns. Sci. Total Environ.847:157491. doi: 10.1016/j.scitotenv.2022.157491
27
Xia C. Zhai G. (2023). Territorial spatial vulnerability assessment based on PSO-BP neural network: a case study in Shenzhen, China. Ecol. Inform.75:102088. doi: 10.1016/j.ecoinf.2023.102088
28
Xu Y. Pu L. J. Zhang R. S. Zhu M. (2012). Spatial-temporal dynamics of land use and land cover change in the coastal zone of Jiangsu Province. Resour. Environ. Yangtze Basin21, 565–571. doi: 10.1007/s11783-011-0280-z
29
Xu N. Wang Y. Huang C. Jiang S. Jia M. Ma Y. (2022). Monitoring coastal reclamation changes across Jiangsu Province during 1984–2019 using landsat data. Mar. Policy136:104887. doi: 10.1016/j.marpol.2021.104887
30
Yan C. Sun W. Lu X. Yang D. (2007). Study on coastal wetlands use and its ecological protection of Jiangsu Province. Ecolog. Sci.26, 263–268.
31
Yao H. (2013). Characterizing landuse changes in 1990–2010 in the coastal zone of Nantong, Jiangsu province, China. Ocean Coast. Manag.71, 108–115. doi: 10.1016/j.ocecoaman.2012.09.007
32
You W. Ji Z. Wu L. Deng X. Huang D. Chen B. et al . (2017). Modeling changes in land use patterns and ecosystem services to explore a potential solution for meeting the management needs of a heritage site at the landscape level. Ecol. Indic.73, 68–78. doi: 10.1016/j.ecolind.2016.09.027
33
You M. Zou Z. Zhao W. Zhang W. Fu C. (2023). Study on land use and landscape pattern change in the Huaihe River ecological and economic zone from 2000 to 2020. Heliyon.9:e13430. doi: 10.1016/j.heliyon.2023.e13430
34
Zhai H. Lv C. Liu W. Yang C. Fan D. Wang Z. et al . (2021). Understanding spatio-temporal patterns of land use/land cover change under urbanization in Wuhan, China, 2000–2019. Remote Sens.13:3331. doi: 10.3390/rs13163331
35
Zhou Y. Chen T. Feng Z. Wu K. (2022). Identifying the contradiction between the cultivated land fragmentation and the construction land expansion from the perspective of urban-rural differences. Ecol. Inform.71:101826. doi: 10.1016/j.ecoinf.2022.101826
Summary
Keywords
sustainable agricultural development, farmland resource, land use change, multiscenario forecasting, coastal cities
Citation
Li Y, Zhuang S, Li Y, Xu Y, Wang N and Feng Y (2025) Current and prospective development trends of farmland resource conservation in coastal cities: a case study of Jiangsu, China. Front. Sustain. Food Syst. 9:1572321. doi: 10.3389/fsufs.2025.1572321
Received
06 February 2025
Accepted
24 June 2025
Published
14 July 2025
Volume
9 - 2025
Edited by
Cláudia M. Viana, University of Lisbon, Portugal
Reviewed by
Nan Xu, Hohai University, China
Wenyin Wu, Anqing Normal University, China
Updates
Copyright
© 2025 Li, Zhuang, Li, Xu, Wang and Feng.
This is an open-access article distributed under the terms of the Creative Commons Attribution License (CC BY). The use, distribution or reproduction in other forums is permitted, provided the original author(s) and the copyright owner(s) are credited and that the original publication in this journal is cited, in accordance with accepted academic practice. No use, distribution or reproduction is permitted which does not comply with these terms.
*Correspondence: Yuting Li, liyt@yctu.edu.cn
Disclaimer
All claims expressed in this article are solely those of the authors and do not necessarily represent those of their affiliated organizations, or those of the publisher, the editors and the reviewers. Any product that may be evaluated in this article or claim that may be made by its manufacturer is not guaranteed or endorsed by the publisher.