 Yumeng Sun
 Mingli Wang
- Institute of Agricultural Economics and Development, Chinese Academy of Agricultural Sciences, Beijing, China
Based on panel data from 31 provinces in China covering the beef cattle industry from 2009 to 2022, this paper constructs a framework for carbon emission measurement and systematically analyzes the spatial and temporal evolution of carbon emissions, the spatial agglomeration effect, and its driving factors in the beef cattle industry using life cycle assessment, Kernel density estimation, Moran’s index, and the spatial Durbin model. The study found that: (1) The total carbon emissions of China’s beef cattle industry exhibit a steady growth trend, with significant regional distribution differences. Emissions grow at a slower rate in the eastern region, while the emission levels in the central and western regions, particularly in the western region, are significantly higher than the national average.1 (2) Carbon emissions exhibit “high-high” and “low-low” spatial agglomeration patterns. Emission reduction is effective in the eastern region, while the central region is gradually catching up. The western region remains the core of high emissions. (3) Carbon emission dynamics indicate a trend of spreading from high-emission regions to peripheral areas, with medium- and small-scale farming regions having greater potential for emission reduction. (4) Improvements in environmental governance, mechanization, and education significantly reduce carbon emissions per unit of beef, driving emission reductions in neighboring regions through spatial spillover effects. Large-scale farming and urban–rural income disparities positively impact carbon emissions, while the role of scientific research inputs in emission reduction remains insignificant in the short term. This study provides a theoretical basis for promoting low-carbon development and regional synergy in the beef industry, suggesting the strengthening of research, development, and promotion of low-carbon technologies, improving the mechanism for regional synergy in emission reduction, and promoting the development of integrated crop-livestock systems to support the realization of the “dual-carbon” goal and the high-quality development of agriculture in the future.
1 Introduction
As global climate change intensifies, controlling and reducing greenhouse gas (GHG) emissions has become a central issue in the global pursuit of sustainable development. The report of the 20th National Congress of the Communist Party of China emphasized that “Chinese-style modernization is the modernization of harmonious coexistence between humanity and nature” (CPC Central Committee, 2022). As an integral component of this vision, the construction of ecological civilization is not only a strategic task, but also a fundamental requirement for building a strong nation and realizing national rejuvenation. As the world’s largest developing country, China, facing the dual pressures of sustained economic growth and environmental protection, urgently needs to strike a balance between economic development and ecological protection. In this process, the low—carbon transformation of agriculture, especially the livestock industry, is of particular importance. In accordance with the “Opinions of the Central Committee of the Communist Party of China and the State Council on Comprehensively and Accurately Implementing the New Development Philosophy and Doing a Good Job in Carbon Peaking and Carbon Neutrality” and the “Carbon Peaking Action Plan Before 2030,” as well as the relevant arrangements of the “Implementation Plan for Agricultural and Rural Emission Reduction and Carbon Sequestration,” emphasis is placed on emission reduction and carbon reduction in the livestock industry. The livestock sector is a significant source of GHG emissions, accounting for approximately 14.5% of global anthropogenic emissions [Gerber et al., 2013; Food and Agriculture Organization of the United Nations (FAO), 2023]. Methane (CH4), carbon dioxide (CO2), and nitrous oxide (N2O) are the primary GHGs emitted by the livestock sector, with CH4 and N2O exhibiting much higher global warming potentials (GWP) than CO2. Consequently, methane and nitrous oxide emissions from the livestock sector play a particularly crucial role in driving global warming. Among major livestock species, cattle (including both beef and dairy) are the largest contributors to methane emissions, primarily through enteric fermentation. Methane produced by cattle accounts for approximately 62% of total livestock-related greenhouse gas emissions [Food and Agriculture Organization of the United Nations (FAO), 2023].2 In recent years, considerable academic research has concentrated on quantifying and mitigating GHG emissions from the livestock sector. For example, life cycle assessment (LCA) methods have been utilized to assess the carbon footprint of various production systems, providing scientific evidence for global GHG mitigation strategies (Wei et al., 2023). In China, rapid economic development and urban–rural disparities present significant challenges to achieving the nation’s “dual carbon” objectives, particularly in the livestock sector (Bai et al., 2021; Yu et al., 2021).
As the scale of beef cattle breeding continues to expand, carbon emissions from the industry have exhibited a persistent upward trend, making it a critical focus for promoting low-carbon transformation in China’s agricultural sector. According to official statistics, beef production in China increased from 6.17 million tons in 2015 to 7.53 million tons in 2023, representing a total growth of 22.04%. This continuous growth, while essential for ensuring domestic meat supply, has also intensified environmental pressures. Therefore, achieving emission reduction in this sector is not about limiting production, but about improving production efficiency, promoting green technologies, and strengthening coordinated policy support. Since the carbon emissions of the beef cattle industry account for a large proportion of livestock farming emissions, its emission reduction potential has become the key to promoting the green transformation of agriculture (Chen et al., 2020; He et al., 2023). The report of the 20th National Congress of the Communist Party of China pointed out that it is necessary to accelerate the construction of a modern economic system and promote the high—quality development of agriculture, emphasizing “promoting green development and building a new pattern of modernization for harmonious coexistence between humanity and nature.” Against this strategic backdrop, promoting the low—carbon transformation of the beef cattle industry has become one of the important measures for China to achieve high—quality agricultural development (Li and Yang, 2024). The beef cattle industry, a key component of the livestock sector, exhibits complex and regionally heterogeneous sources of GHG emissions. Major emission sources include enteric fermentation, manure management, and feed production, with enteric fermentation contributing most to methane emissions in beef cattle (Tongwane and Moeletsi, 2020). Furthermore, manure management generates significant nitrous oxide emissions, while feed production emits both carbon dioxide and nitrous oxide (Pelton et al., 2024). GHG emissions from beef cattle production have been rising globally, driven by increasing demand for beef. This trend is particularly evident in China, where rising income levels and shifts in meat consumption patterns have led to a significant increase in GHG emissions from beef cattle farming (Xu et al., 2019). Simultaneously, there are significant regional differences in carbon emission efficiency. Previous studies have shown that among the major livestock products in China, beef has the highest greenhouse gas (GHG) emission intensity per kilogram of meat, followed by mutton, chicken, and pork (Wei et al., 2023). In addition, a dietary carbon footprint analysis based on protein content indicated that beef possesses the largest per-unit carbon footprint, with lamb and pork ranking second and third, respectively (Li et al., 2024). For instance, in Yan and Zhang (2023), the carbon emission efficiency in China’s primary beef-producing regions exhibited a spatial pattern of higher efficiency in the east and lower efficiency in the west, highlighting significant regional disparities in mitigation capacity. Similarly (Du et al., 2024), estimated emissions across various regions in China, finding that the central and western regions lag far behind the eastern coastal areas in both emission intensity and the implementation of mitigation measures. Some scholars also demonstrated that feed selection and management practices in U.S. beef cattle production systems are critical in determining GHG emissions (Rotz et al., 2019). Therefore, in-depth research on the emission characteristics and influencing factors of the beef cattle industry is crucial for understanding regional carbon emission dynamics and providing a scientific foundation for region-specific mitigation policies.
Building upon the substantial scholarly progress in GHG emissions research within livestock systems, certain complexities in beef cattle production still warrant more nuanced analysis to deepen our understanding. First, most studies focus on emissions at the macro level, lacking in-depth investigations into regional heterogeneity and the emission reduction potential of underdeveloped areas (Jin et al., 2020). This gap in understanding hinders the formulation of precise and effective mitigation policies tailored to regional conditions. Second, studies on the drivers of GHG emissions often focus on individual variables, such as technological investment or production scale (Pelton et al., 2024), without sufficiently addressing the complex interactions between economic development, policy support, and technological advancement. Therefore, future research should focus more on regional collaborative governance, the effects of environmental policies, and the comprehensive impact of technological innovation on carbon emissions, particularly in underdeveloped areas, while exploring adaptable and effective emission reduction measures and policies. Additionally, feasible solutions should be proposed to overcome barriers in promoting low-carbon technologies, such as insufficient infrastructure, lack of funding, and inadequate technical training. Regarding technology, research should concentrate on advancing the application of low-carbon aquaculture technologies such as feed optimization, manure treatment, and energy efficiency improvements, and develop targeted emission reduction pathways based on local resource endowments and economic foundations to ensure the effectiveness and sustainability of GHG emissions reduction in different regions. Through differentiated policies and technological support, it is anticipated that the beef cattle industry will transform towards a greener and more sustainable direction, achieving simultaneous improvements in emissions reduction and production efficiency.
2 Measurement of carbon emissions, data sources, and research methods
2.1 Measurement boundary of carbon emissions
This study employs the LCA method in combination with carbon emission coefficients to comprehensively assess the carbon emissions of the beef cattle industry chain in China, based on its actual development conditions (Shi et al., 2022; Ma and Xiao, 2024). The beef cattle industry is divided into three primary stages: upstream cultivation, midstream farming, and downstream processing. The carbon emissions from each stage are calculated based on its primary sources, including feed crop cultivation, feed transportation and processing, enteric fermentation in beef cattle, manure management systems, energy consumption during cattle farming, and beef product processing (D’aurea et al., 2021; Liang and Wang, 2024; Wu et al., 2022). The carbon emission factors involved in the calculation process are detailed in Appendix.
2.2 Calculation of carbon emissions in specific stages
2.2.1 Upstream cultivation stage
2.2.1.1 Feed crop cultivation
Beef cattle feed mainly consists of roughage (e.g., straw, silage corn) and concentrate feed (e.g., corn, soybean meal, wheat bran). Among these, soybean meal and wheat bran are by-products of soybean and wheat, so only the carbon emissions from corn cultivation are considered (O’Brien et al., 2020; Wu et al., 2021; Tian et al., 2014). The emissions are calculated using the following formula:
In Equation 1, represents the annual beef production (unit: tons); represents the feed consumption coefficient per unit of beef product (unit: kg/kg); represents the proportion of corn in concentrate feed (unit: %); represents the CO₂ emission factor during the cultivation process of type grain.
2.2.1.2 Feed transportation and processing
Feed ingredients (e.g., corn, soybeans, wheat) are transported from production sites to processing facilities, where they undergo cleaning, grinding, mixing, and other processing steps. This process involves significant energy consumption, resulting in corresponding greenhouse gas emissions. The calculation formula is as follows:
In Equation 2, represents the carbon emission factor for feed transportation and processing, while the definitions of other variables remain the same as previously described.
2.2.2 Midstream farming stage
2.2.2.1 Enteric fermentation of beef cattle
As ruminants, beef cattle produce significant amounts of methane (CH₄) during their enteric fermentation process, which is a major source of carbon emissions in the livestock sector.
In Equation 3, represents the average annual number of beef cattle (unit: head); represents the emission factor for enteric fermentation in beef cattle (unit: kg/head); represents the global warming potential of CH4, with a value of 21.
2.2.2.2 Manure management system
During the storage and treatment of beef cattle manure, both methane (CH₄) and nitrous oxide (N2O) are emitted. The emissions of these two gases are calculated separately and then summed.
In Equation 4, represent the emission factors for CH4, N2O in the manure management system, respectively; represents the global warming potential (GWP) of CH₄, with a value of 21; represents the global warming potential (GWP) of N2O, with a value of 310.
2.2.2.3 Energy consumption in beef cattle farming
During the beef cattle farming process, significant amounts of electricity and coal are consumed to maintain the operation of facilities, such as temperature control, ventilation, and manure treatment, which results in carbon dioxide emissions. The calculation formula is as follows:
In Equation 5, and represent the electricity cost and coal cost per head of beef cattle, respectively; and represent the unit prices of electricity and coal, respectively; and represent the CO2 emission factors for electricity consumption and coal combustion, respectively.
2.2.3 Downstream processing stage
During the process of beef production from slaughter to market sale, multiple processing stages, such as slaughtering and packaging, are involved. The energy consumption and associated carbon emissions of each stage need to be accounted for. The calculation formula is as follows:
In Equation 6, represents the energy consumption coefficient per unit of beef product for the processing stage; represents the CO2 emission factor for electricity consumption.
2.3 Total carbon emissions calculation for the beef cattle industry
Following the life cycle assessment (LCA) framework, total carbon emissions from the beef cattle industry are calculated as the sum of emissions across all production stages, as shown in the formula below:
In Equation 7, each term represents the CO₂, CH₄, and N₂O emissions generated from respective stages, including feed cultivation, enteric fermentation, manure management, energy consumption, and processing. By summing up the emissions from all stages, the total carbon emissions of the beef cattle industry are obtained.
2.4 Data sources
This study utilizes data from 31 provinces in China (excluding Hong Kong, Macau, and Taiwan) spanning from 2009 to 2022 to investigate the carbon emissions of the beef cattle industry. The data primarily come from sources such as the China Rural Statistical Yearbook, the Statistical Bulletin of the People’s Republic of China on National Economic and Social Development, the National Compilation of Cost–Benefit Data of Agricultural Products, the Statistical Yearbook of China’s Population and Employment, the Statistical Yearbook of China, the Statistical Yearbook of China’s Environment, the Statistical Yearbook of China’s Ecological Environment, and the statistical yearbooks of provinces and cities. The data used to analyze the impact factors of carbon emissions primarily derive from relevant literature and official statistics, including the China Environmental Statistics Yearbook, the China Ecological Environment Statistics Yearbook, the China Statistical Yearbook, the China Rural Statistics Yearbook, the China Agricultural Statistics Yearbook, the China Population and Employment Statistics Yearbook, and the China Animal Husbandry and Veterinary Statistics Yearbook.
2.5 Research methods
2.5.1 Spatiotemporal evolution analysis of carbon emissions in the beef cattle industry
To comprehensively analyze the dynamic evolution characteristics of carbon emissions in the beef cattle industry across Chinese provinces, this study employs the Kernel Density Estimation method. This method effectively estimates and analyzes the distribution patterns of carbon emissions in different regions, revealing their spatiotemporal evolution trends (Tian et al., 2024). By using this method, the study visually demonstrates the changes in the distribution of carbon emissions across provinces at various time points. This helps to further identify and understand the dynamic evolution patterns of carbon emissions. The analysis provides robust data support for subsequent policy recommendations and industrial development, offering valuable references for local governments to formulate more precise carbon emission control policies (Wen et al., 2024).
2.5.2 Analysis of factors influencing carbon emissions in the beef cattle industry
To examine the factors influencing carbon emissions in the beef cattle industry, a spatial econometric model is constructed. This model simultaneously accounts for spatial dependencies and temporal effects, uncovering both the direct and indirect influences of various factors on carbon emissions. The specific formulation is as follows:
In Equation 8, represents the per-unit carbon emissions of beef production in region ; is the spatial autoregressive coefficient, representing the spatial lag effect of the dependent variable in neighboring regions; is the spatial weight matrix, describing the spatial relationships between different regions; represents the explanatory variables for region ; is the coefficient of the explanatory variables, indicating the impact of each explanatory variable on carbon emissions in region ; is the spatial lag coefficient of the independent variables, reflecting the influence of the independent variables in neighboring regions on carbon emissions in region ; is the error term for region .
3 Carbon emission measurement results and spatial differentiation characteristics of the beef cattle industry
3.1 Trends in carbon emissions
By calculating the carbon emissions from beef cattle production across 31 provinces from 2009 to 2022, it is observed that national carbon emissions in the beef cattle industry show a steady upward trend (Table 1). The total emissions increased from 96.98 million tons in 2009 to 140.55 million tons in 2022, with an average annual growth rate of 2.90%. Specifically, carbon emissions in the eastern region grew at the slowest rate, with an average annual growth rate of just 1.31%. This reflects the region’s advanced adoption of intensive farming practices and low-carbon livestock technologies. In the central region, carbon emissions also increased relatively modestly, with an average annual growth rate of 0.42%, suggesting that emission reduction measures have achieved some success. However, the western region experienced the fastest growth in carbon emissions, with an average annual growth rate of 4.08%. This is primarily attributed to extensive farming practices and grazing-based livestock systems prevalent in the region, which have led to substantial increases in emissions. These findings emphasize the considerable challenges that the western region continues to face in achieving effective emission reductions.
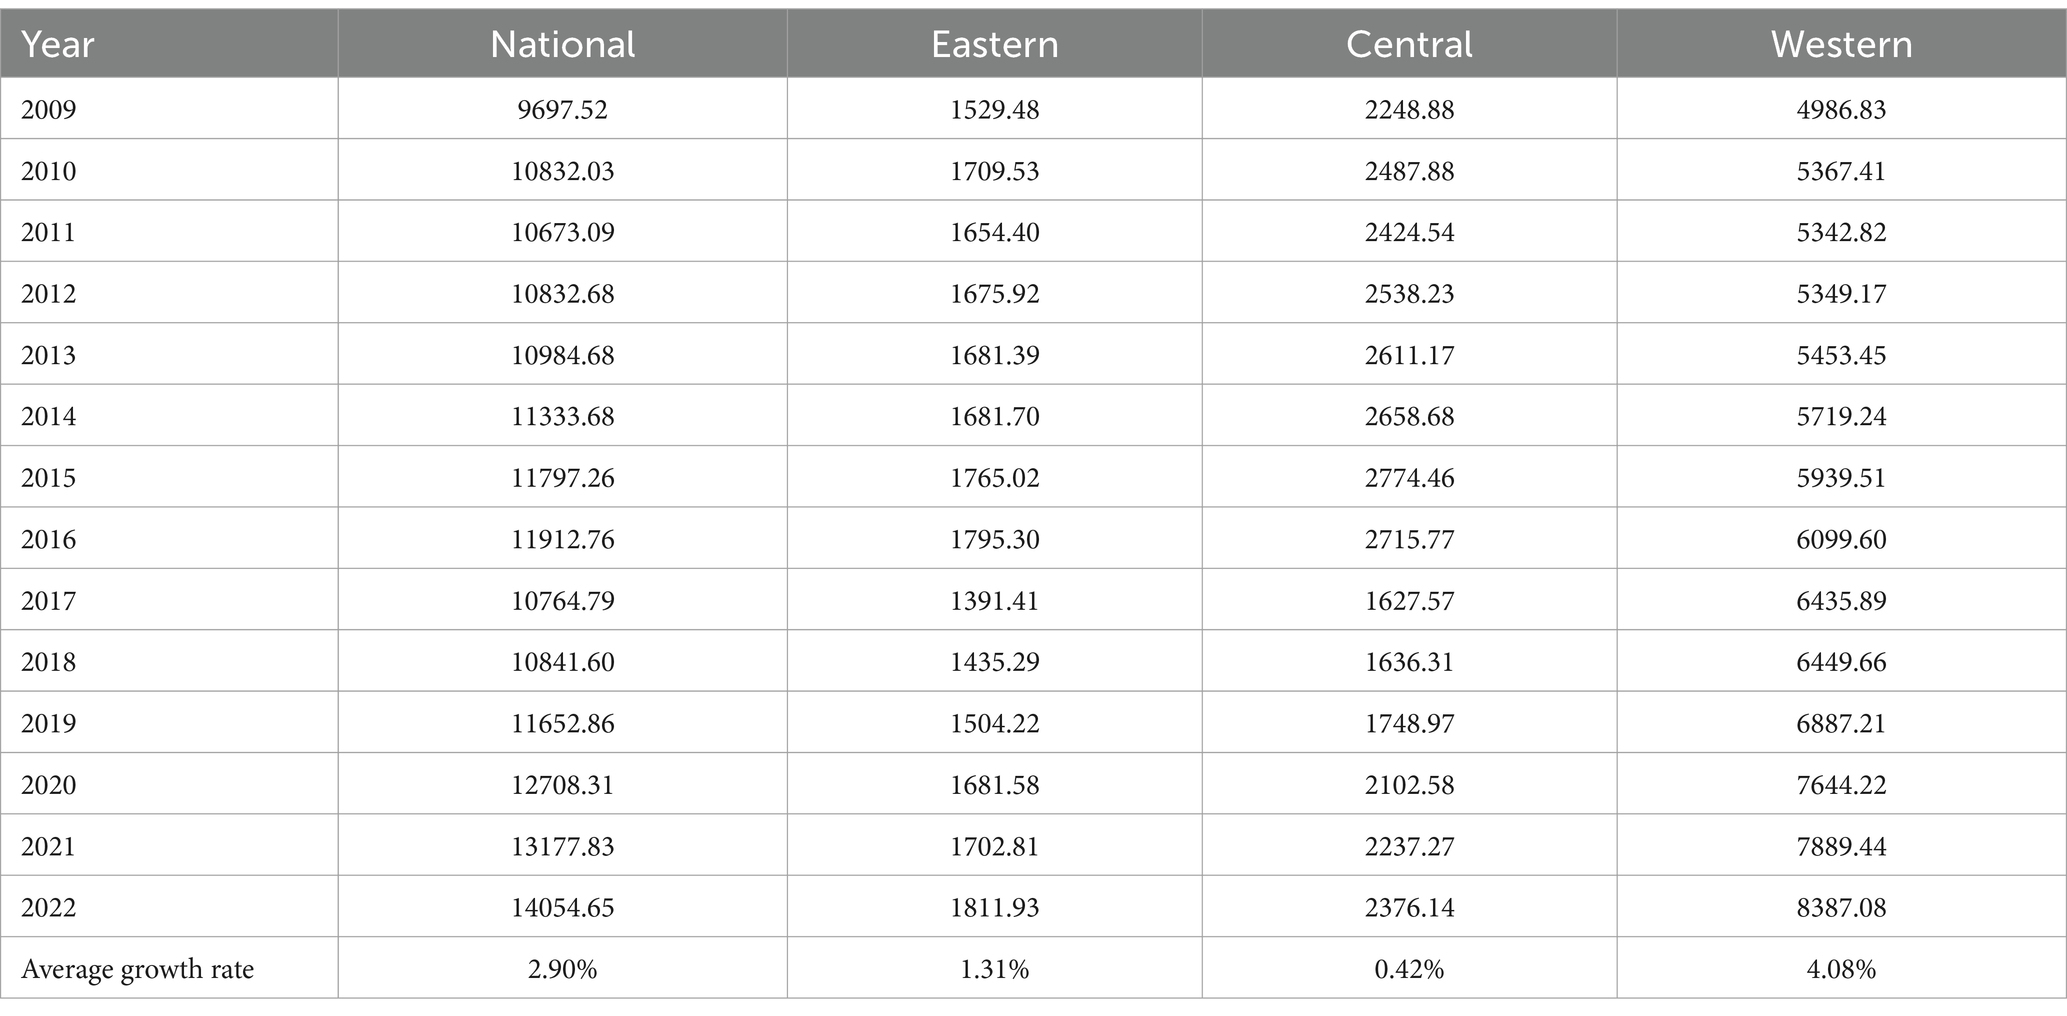
Table 1. Changes in carbon emissions of the national and eastern, central, and western beef cattle industry from 2009 to 2022 (unit: ten thousand tons CO2-eq).
In the various stages of the beef cattle industry, carbon emissions from the upstream cultivation stage, primarily stemming from feed crop cultivation, increased significantly from 10.7318 million tons to 17.0982 million tons, with an average annual growth rate of 3.65% (Table 2). This notable growth is closely linked to the rising demand for feed and the expansion of cultivation areas. The midstream farming stage also saw an increase in carbon emissions, with enteric fermentation and manure management systems as the primary sources. The increase in emissions from these two processes is closely linked to the expansion of farming scale and the release of greenhouse gases. The average annual growth rate for this stage was 2.78%. However, the relatively moderate growth reflects the adoption of emission reduction technologies in some regions. In contrast, carbon emissions from the downstream processing stage grew at the slowest rate, rising from 0.74 million tons to 0.85 million tons, with an average annual growth rate of only 1.06%. This suggests that emissions in this stage remain relatively low, with limited potential for further reductions. Overall, the majority of carbon emissions in the beef cattle industry are concentrated in the upstream cultivation and midstream farming stages, while emissions from the downstream processing stage exhibit slower, more stable growth. These findings underscore the need to focus emission reduction efforts on feed cultivation and farming practices to maximize the industry’s potential for carbon mitigation.
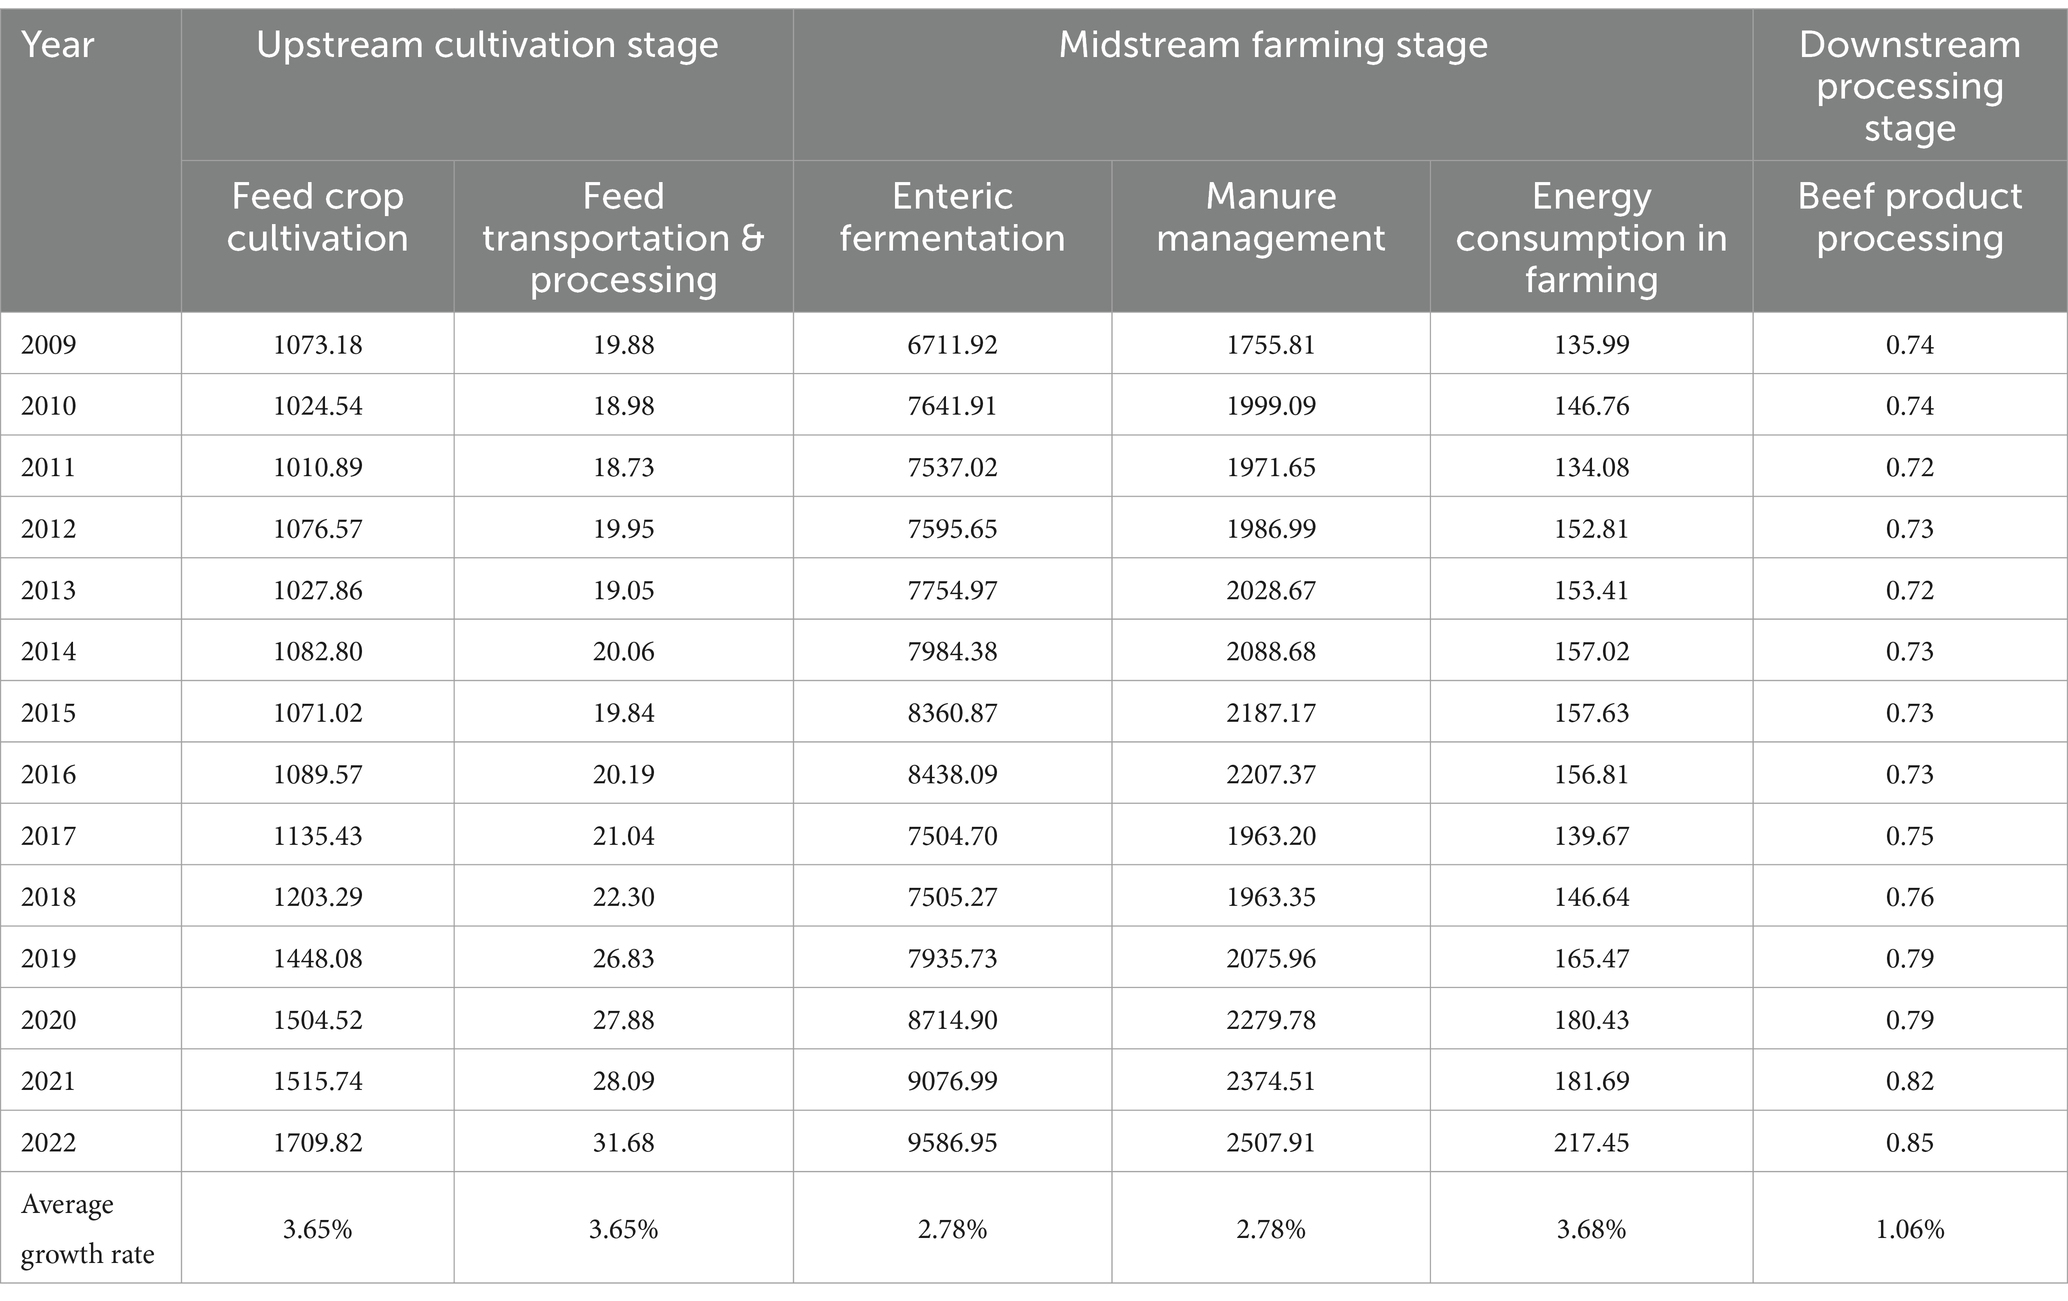
Table 2. Changes in carbon emissions at different stages of the national beef cattle industry from 2009 to 2022 (unit: ten thousand tons CO2-eq).
3.2 Spatial differentiation characteristics of carbon emissions
In this study, ArcGIS visualization maps were used to illustrate the spatial patterns and temporal trends of carbon emissions across provinces for the years 2009, 2013, 2017, and 2022 (Figure 1). These maps provide an intuitive depiction of interprovincial differences, employing color gradients to reflect the relative intensity of carbon emissions over time. Overall, with the promotion of intensive farming practices and the implementation of green technologies and policies, carbon emissions from China’s beef cattle industry have gradually decreased, especially in the eastern and central regions, where emission reduction efforts have been most successful. Specifically, from 2009 to 2013, carbon emissions remained high nationwide, particularly in the western and northern regions, such as Inner Mongolia and Qinghai, which are key livestock farming areas. Emissions in these regions remained consistently high due to extensive grazing practices. However, following the adoption of intensive farming practices and green technologies after 2017, particularly in the eastern provinces, carbon emissions have steadily declined annually, highlighting the effectiveness of green production technologies and modern management practices.
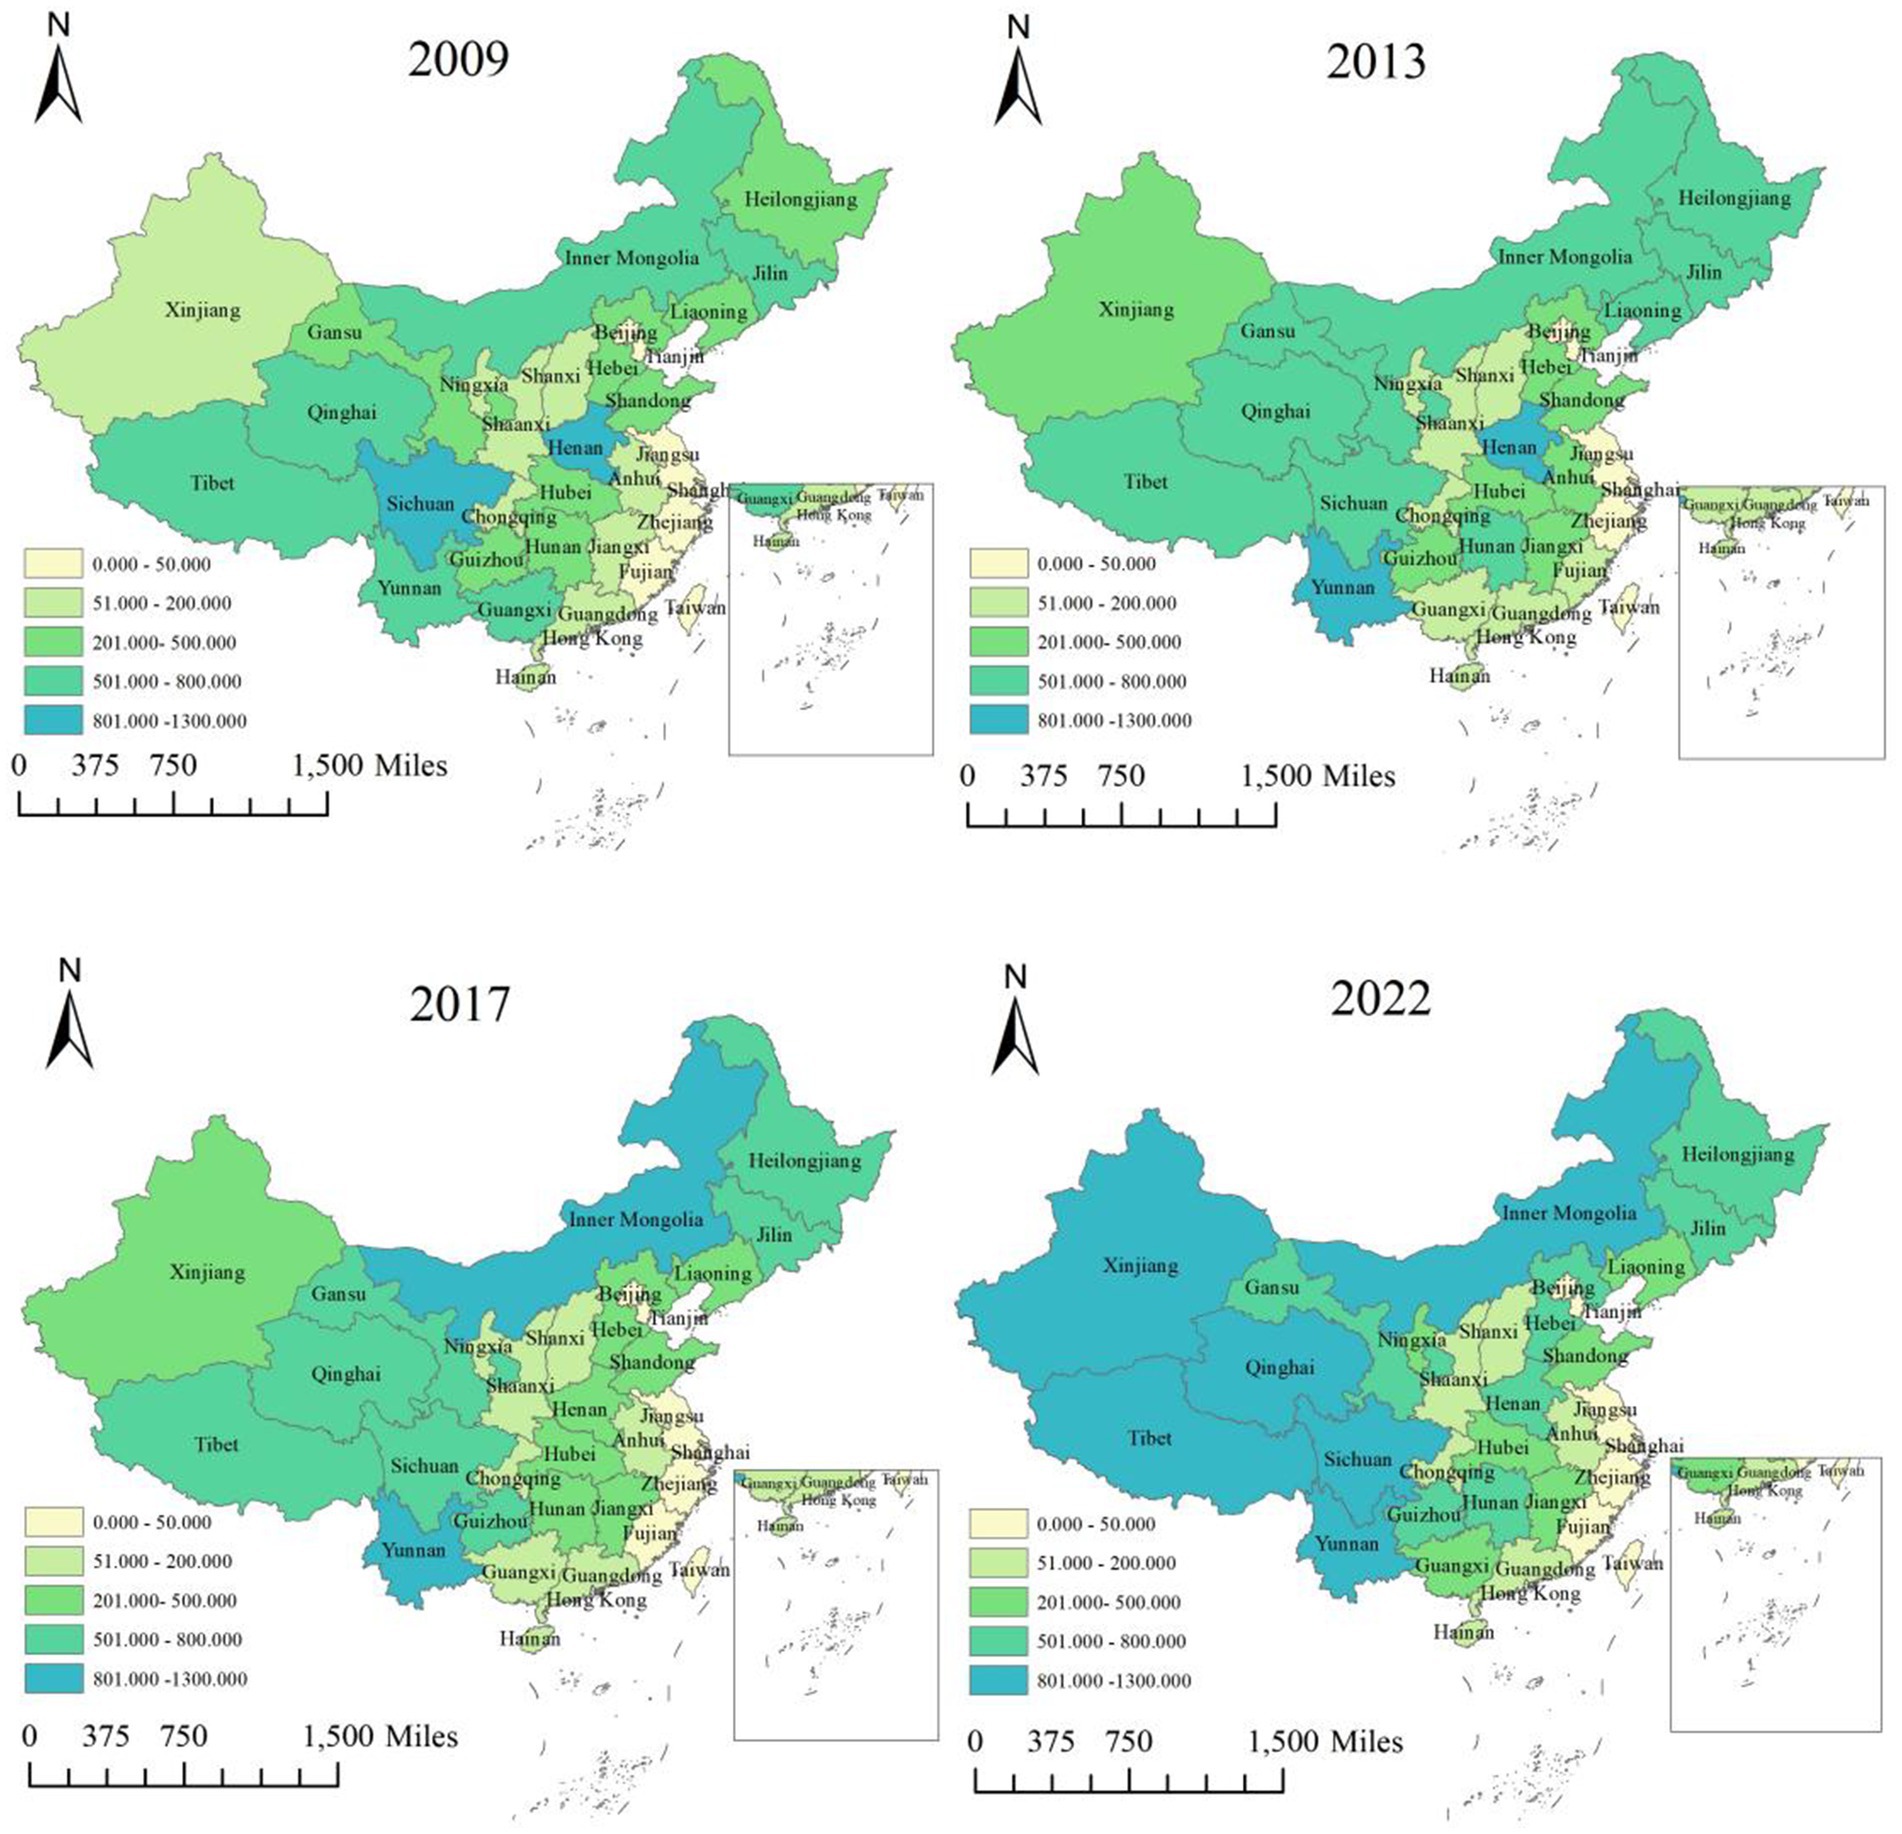
Figure 1. Spatial distribution of carbon emissions from the national beef cattle industry in each province.
Nonetheless, the western and central regions have exhibited slower progress in reducing emissions. Specifically, the western region, despite demonstrating some reduction in carbon emissions by 2022, continues to exhibit relatively high levels. This suggests that these regions continue to face significant challenges in reducing emissions, primarily due to traditional grazing practices, low production efficiency, and delays in the adoption of advanced technologies and policies. Overall, the eastern region has achieved the most significant reductions in carbon emissions, primarily due to the implementation of intensive farming practices, technological advancements, and strong policy guidance. In contrast, while the western and central regions possess considerable potential for emission reductions, achieving substantial progress will require greater efforts and increased support to meet reduction targets.
In analyzing carbon emissions, the kernel density map offers a clearer perspective on the distribution of carbon emissions across different periods and regions, with particular focus on changes in the distribution of per-unit beef carbon emissions. This study utilizes the kernel density estimation method to illustrate the distribution characteristics of sample data across regions. By plotting the kernel density distribution curves for the entire country and the three major regions, the analysis examines the position of the density curves, the shape of the main peaks, the extent of distribution, and the number of peaks. As illustrated in Table 3 and Figure 2, the kernel density curves of carbon emissions per kilogram of beef across China and its regions from 2009 to 2022 exhibit an initial rightward shift followed by a leftward shift, reflecting that carbon emissions initially increased and subsequently decreased. This change signifies that China has attained significant progress in implementing low-carbon policies and advancing technological improvements, thereby laying a strong foundation for achieving the “dual carbon” goals. Additionally, the main peak of the kernel density curve gradually decreases in height and widens, indicating substantial regional variations in carbon peak trajectories and timing across China.
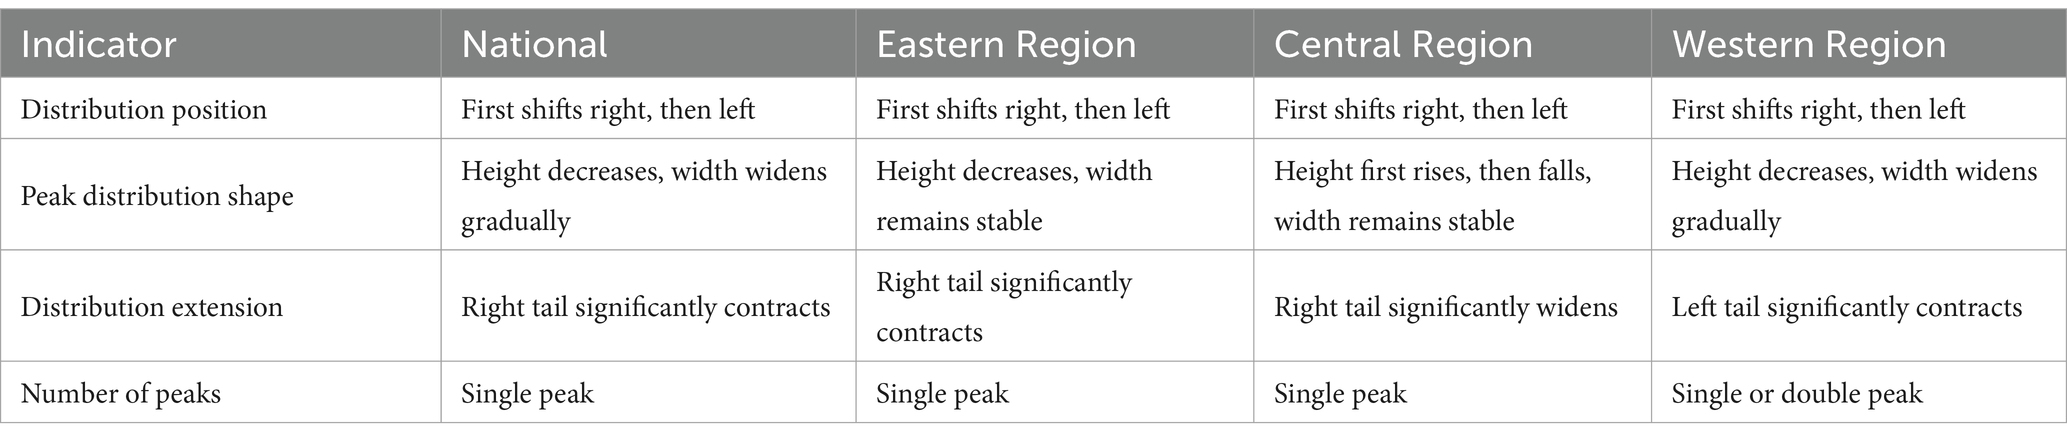
Table 3. Dynamic evolution characteristics of agricultural carbon emissions in china and the eastern, central, and western regions.
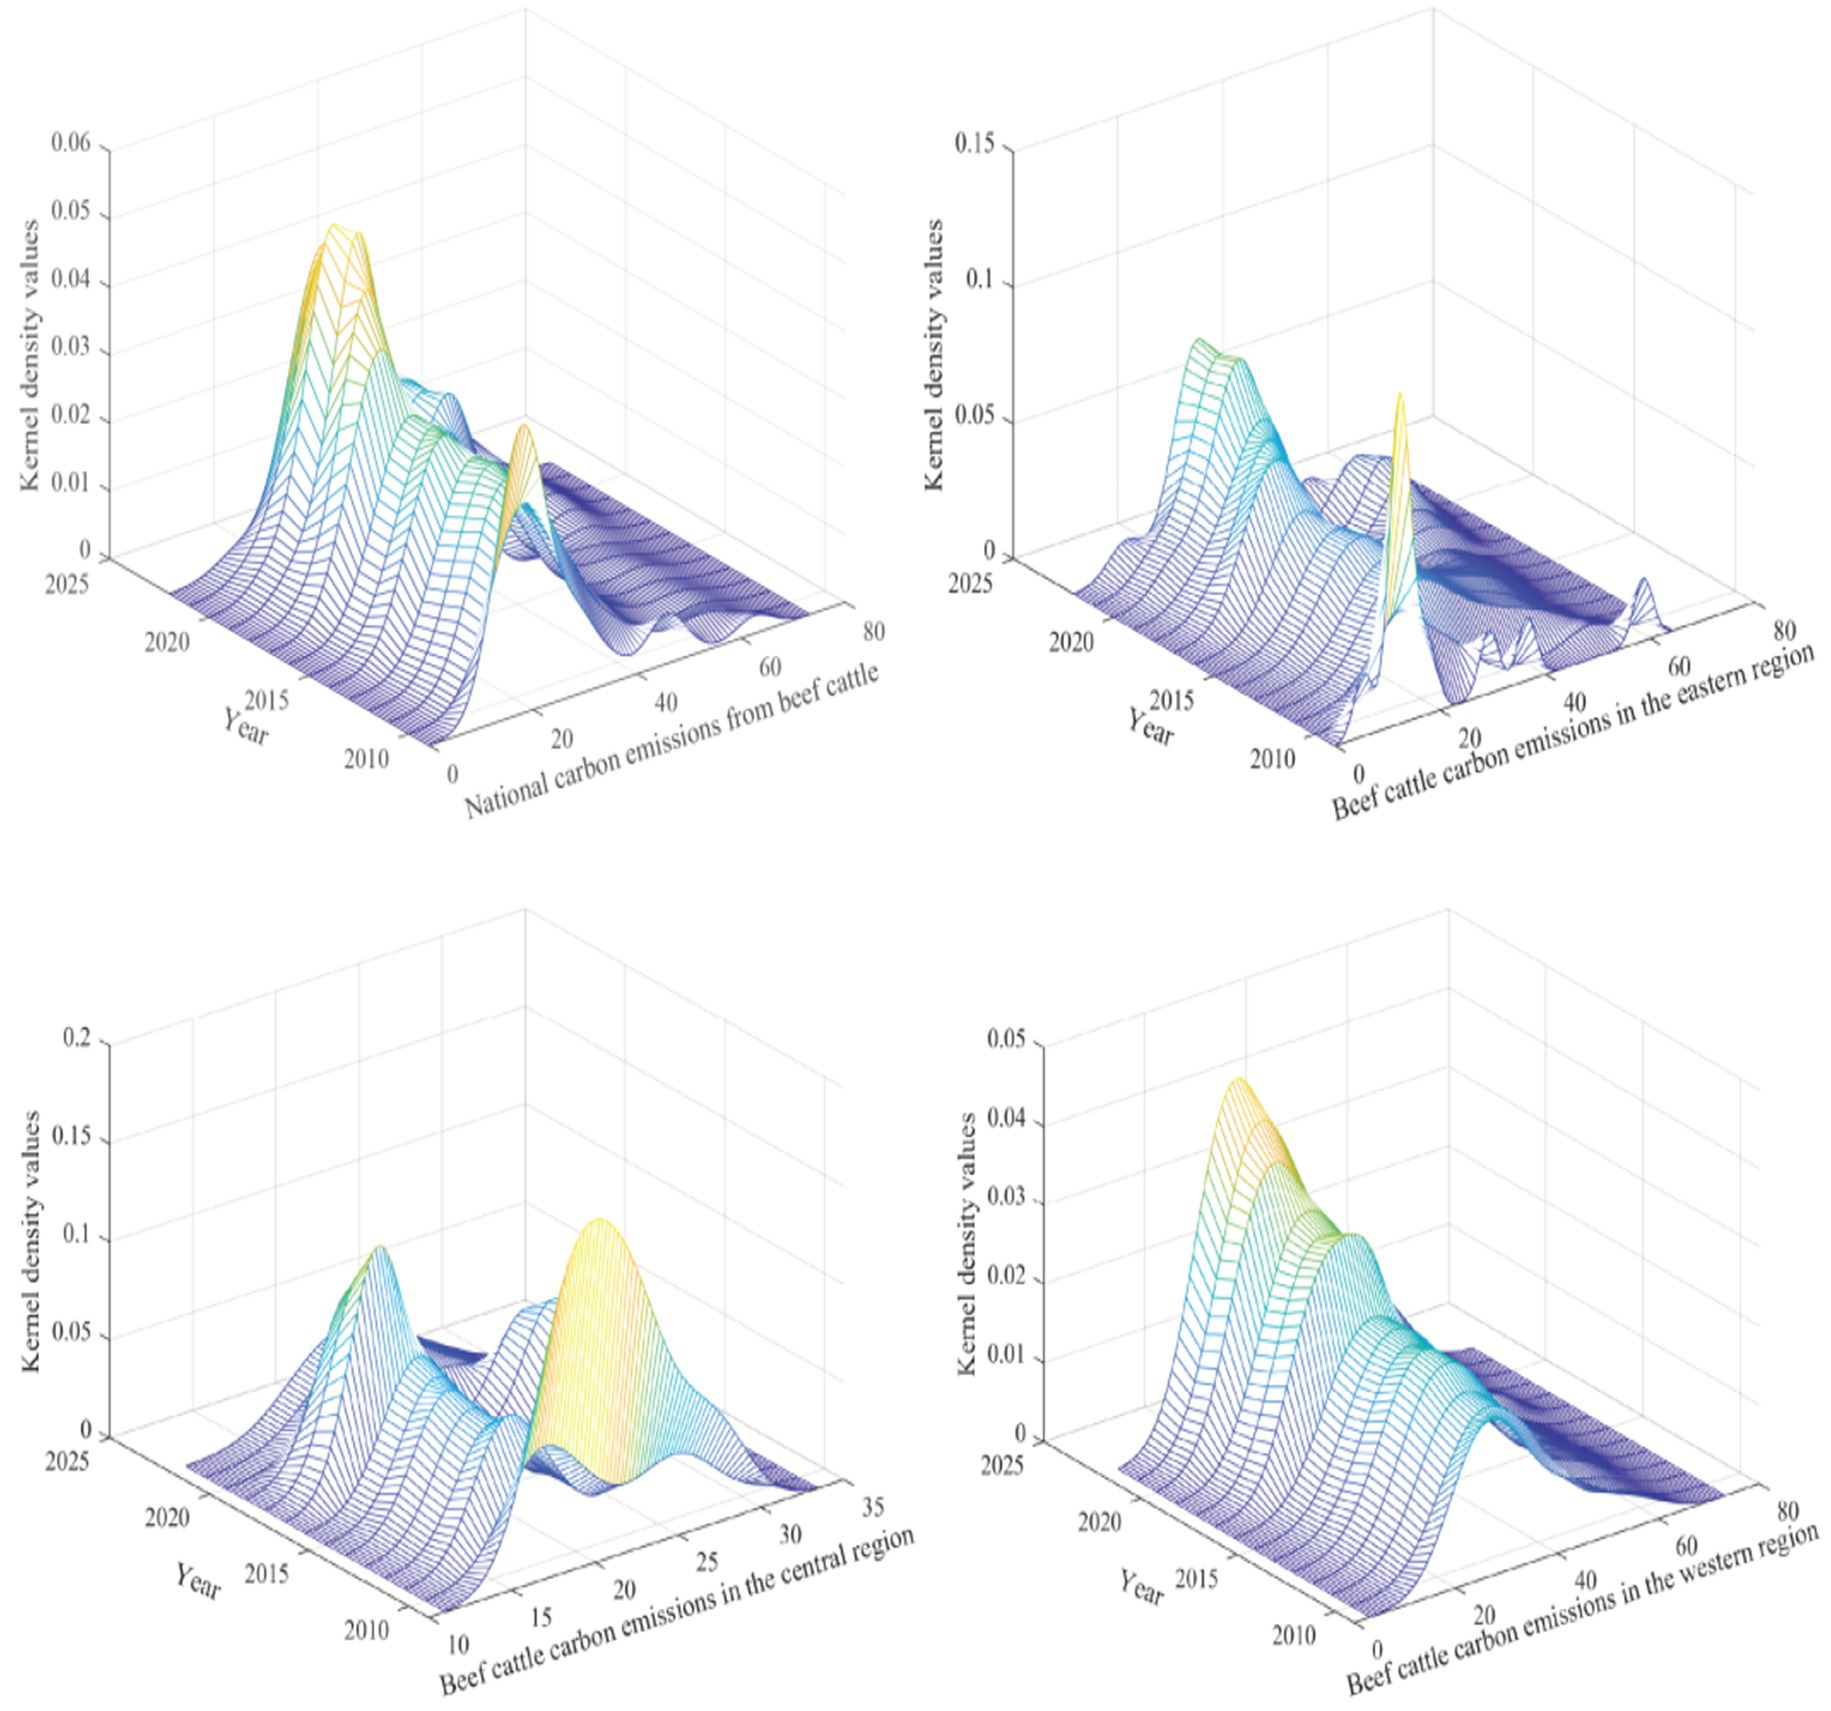
Figure 2. The dynamic evolution of the distribution of carbon emissions per kilogram of beef in the whole country and the eastern, central and western regions.
At the regional level, the range of variation in the kernel density curve for the eastern region remains limited. The peak position is concentrated in the low-emission interval, and the right-tail distribution has substantially converged, indicating that internal differences in carbon emissions within the region are gradually narrowing, although emission reduction pressures remain significant. The kernel density curve for the central region exhibits a main peak characteristic of “initial increase followed by a decrease,” with little change in width. This suggests that internal differences in emissions within the region are stable; however, some provinces continue to exhibit high emissions, and progress in emission reductions remains sluggish. In the western region, the kernel density curve demonstrates a decreasing main peak height and increasing width, with a “double-peak” phenomenon observed in certain years, indicating a degree of carbon emission polarization within the region.
In terms of distributional extensibility, a common right-tailing phenomenon is observed across the country and in all regions, indicating the presence of high-emission values across regions. Among these, the right-tailing in the eastern region is relatively well-contained. The central region exhibits limited distributional extensibility, while the western region gradually demonstrates a left-tailing characteristic, indicating significant reductions in carbon emissions in certain provinces. The possible reasons for these patterns can be attributed to the following factors: the eastern region benefits from technological innovation and policy support, facilitating a relatively rapid carbon emission reduction process. As a major grain-producing area, the central region’s industrial structure includes a higher proportion of extensive farming practices, complicating efforts to reduce emissions. In contrast, the western region, characterized by substantial ecological and economic disparities, exhibits significant internal imbalances in carbon emissions. These differences suggest that achieving balanced agricultural carbon-emission reductions across the country requires further advancement in policy making and technology dissemination tailored to local conditions. Additionally, greater resource allocation and enhanced support should be directed toward the central and western regions to better align regional development with the realization of the carbon-neutrality goal.
3.3 Spatial correlation test based on Moran’s index
Through an analysis of the overall carbon emissions of China’s beef cattle industry, this study highlights the spatial distribution and dynamic changes in carbon emissions at both the national and regional levels. Although total carbon emissions reflect the overall emission levels of a specific region or industry, they fail to adequately capture the relationship between emissions and outputs, particularly the variations in beef production scale, efficiency, and production methods across regions. Consequently, relying solely on total carbon emissions to evaluate the green development levels of different regions introduces inherent limitations. To more accurately assess the carbon emissions of the beef cattle industry in each region and establish a direct connection with regional economic development and environmental sustainability, this study employs per-unit beef carbon emissions as a refined and standardized indicator. This approach provides a more meaningful analytical perspective, offering insights that are highly relevant to practical application (Wu, 2015).
This study systematically investigates the spatial dependence of per-unit beef carbon emissions through Moran’s Index. Considering that the spatial autocorrelation of carbon emissions may be influenced by both geographical and economic distances, this study employs three types of spatial weight matrices: the adjacency matrix, the geographical distance matrix, and the spatial economic-geographical nested matrix. The Moran’s Index for each year is calculated using global spatial autocorrelation analysis (Table 4). From 2009 to 2022, the Moran’s Index values for all three matrices remained positive and statistically significant, confirming the presence of spatial autocorrelation in per-unit beef carbon emissions. Specifically, the Moran’s Index values increased over time and consistently remained significant at the 1, 5%, or 10% levels each year. For instance, in 2009, the Moran’s Index values for the adjacency matrix, geographical distance matrix, and spatial economic-geographical nested matrix were 0.331, 0.111, and 0.100, respectively, indicating a notable degree of spatial clustering in per-unit beef carbon emissions. By 2022, these values had risen to 0.506, 0.161, and 0.162, reflecting a stronger and more stable spatial autocorrelation in per-unit emissions over time. This spatial dependence implies that carbon emission levels in one region are shaped not only by its own development but also by the emission levels and policies of neighboring regions. Therefore, policymakers must consider these spatial linkages and coordinate emission reduction measures at the regional level to enhance the effectiveness of low-carbon development.
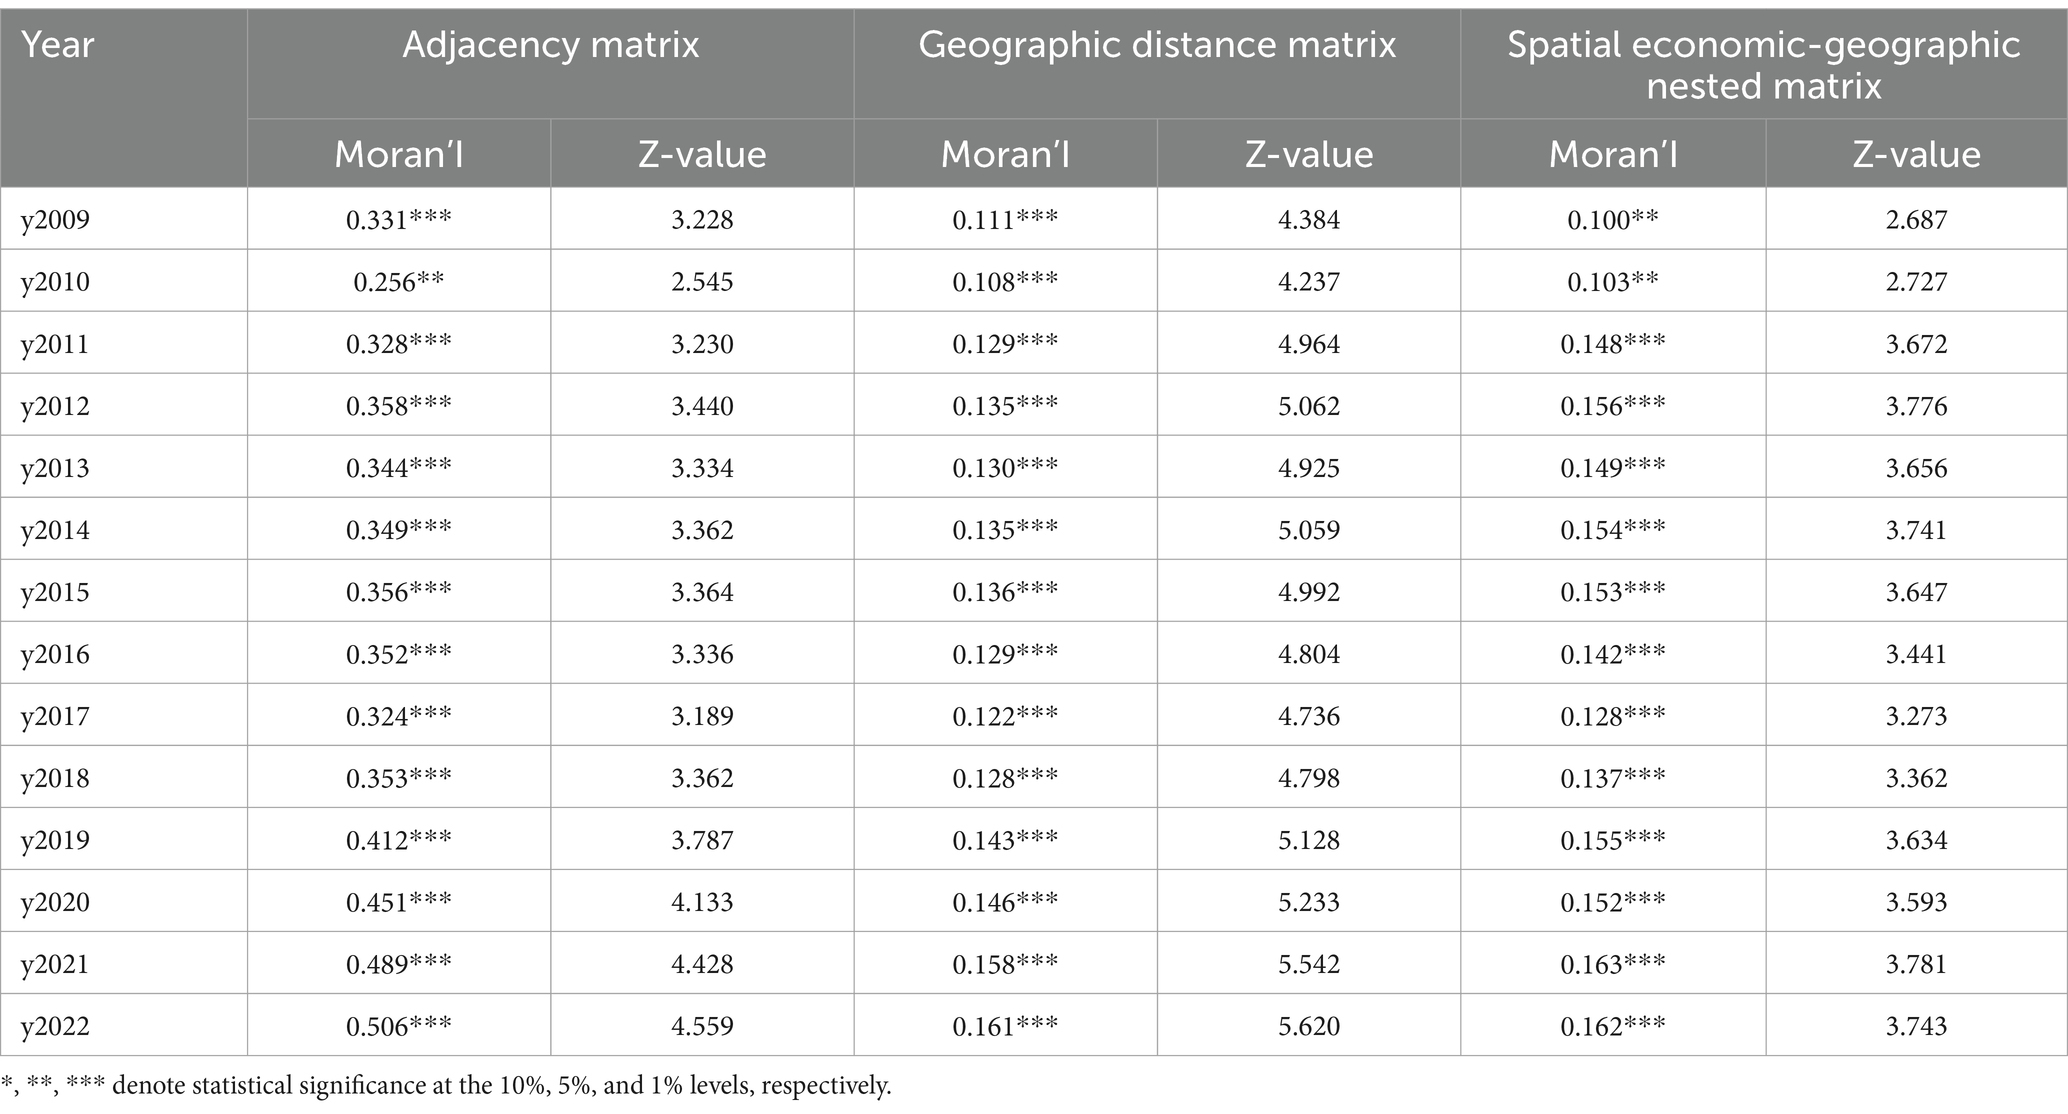
Table 4. Moran’s I index results.
4 Influence factors study
4.1 Logical analytical framework
According to green development theory, promoting a low-carbon economy is central to achieving sustainable development. As a key component of animal husbandry, the carbon emission characteristics of the beef cattle industry are directly linked to achieving the “dual-carbon” goals. This study examines the key factors influencing carbon emissions per unit of beef from multiple perspectives and explores their spatial heterogeneity. The level of economic development is a significant factor influencing carbon emissions (Table 5). According to the Environmental Kuznets Curve (EKC) theory, economically developed regions are more likely to adopt green technologies and low-carbon production models earlier, thereby effectively reducing carbon emissions per unit. In contrast, regions characterized by a significant urban–rural income gap often experience inefficient resource allocation and irrational consumption patterns, resulting in higher carbon emissions per unit. Technological progress plays a crucial role in carbon reduction, particularly improvements in research funding, mechanization, and technical expertise. These advancements optimize resource utilization and production processes, effectively reducing carbon emissions per unit of output e (Ning et al., 2023). However, in some regions, short-term research investments may not directly result in productivity gains, and improvements in mechanization may lead to inefficient energy consumption if not coupled with green technologies.
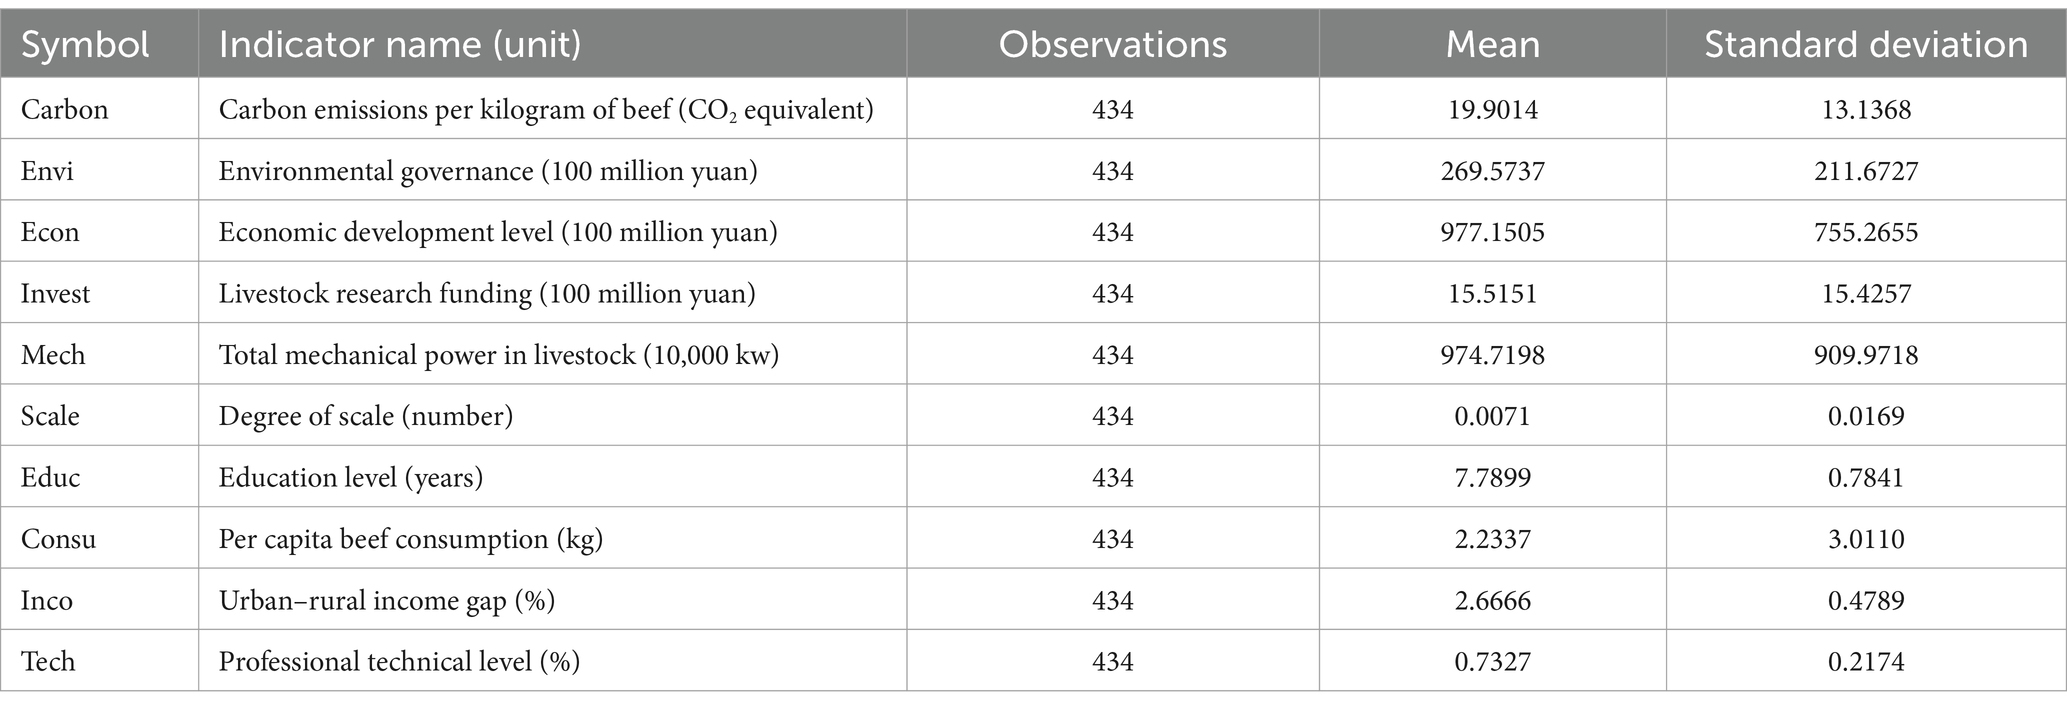
Table 5. Variable definitions and descriptive statistics.
Large-scale farming has the potential to reduce carbon emissions per unit by lowering marginal costs and enhancing resource use efficiency. However, this benefit can be offset if environmental protection technologies are not adequately integrated, potentially leading to increased overall carbon emissions. Additionally, per capita beef consumption plays a significant role in determining production intensity. In regions with higher demand, increased production pressure often results in elevated carbon emissions. Furthermore, environmental governance and education levels are crucial social factors influencing carbon reduction. Effective environmental governance can improve resource use efficiency through targeted policy guidance, creating positive spillover effects that benefit surrounding areas (Shi and Wang, 2024). Similarly, improving education levels can enhance public environmental awareness, facilitate the adoption of green technologies, and indirectly reduce carbon emissions per unit.
According to spatial economics theory, carbon emissions per unit of beef exhibit significant spatial heterogeneity due to differences in natural resource endowments, economic development levels, and technological capabilities. In the eastern region, which is economically developed and has widely adopted green technologies, carbon emission levels are lower. In contrast, the western region, characterized by traditional farming methods and lower production efficiency, experiences higher carbon emissions. This study constructs a multi-dimensional analytical framework that incorporates factors such as economic development, technology, scale, environmental governance, education, and consumption. The goal is to explore how these factors influence carbon emissions per unit of beef using a spatial econometric model, revealing their spatial heterogeneity. The findings aim to provide both theoretical and empirical support for the formulation of targeted low-carbon policies.
4.2 Model specification
When selecting a spatial econometric model, it is crucial to perform correlation tests on the data to identify the most appropriate model. This study employs the Hausman test to determine whether a fixed effects model or a random effects model is more suitable (Table 6). The test results show that, at the 1% significance level, the null hypothesis is rejected, indicating that the random effects model is not appropriate. As a result, the fixed effects model is chosen as the preferred model. In addition, the study conducts Lagrange Multiplier (LM) tests, Wald tests, and Likelihood Ratio (LR) tests to further validate the selection of the spatial econometric model. Building on the traditional Spatial Autoregressive Model (SAR) and Spatial Error Model (SEM), the Spatial Durbin Model (SDM) is deemed more appropriate for this research. The test results demonstrate that the Spatial Durbin Model more effectively captures spatial correlations, aligning with the research requirements. The specific test results are as follows:
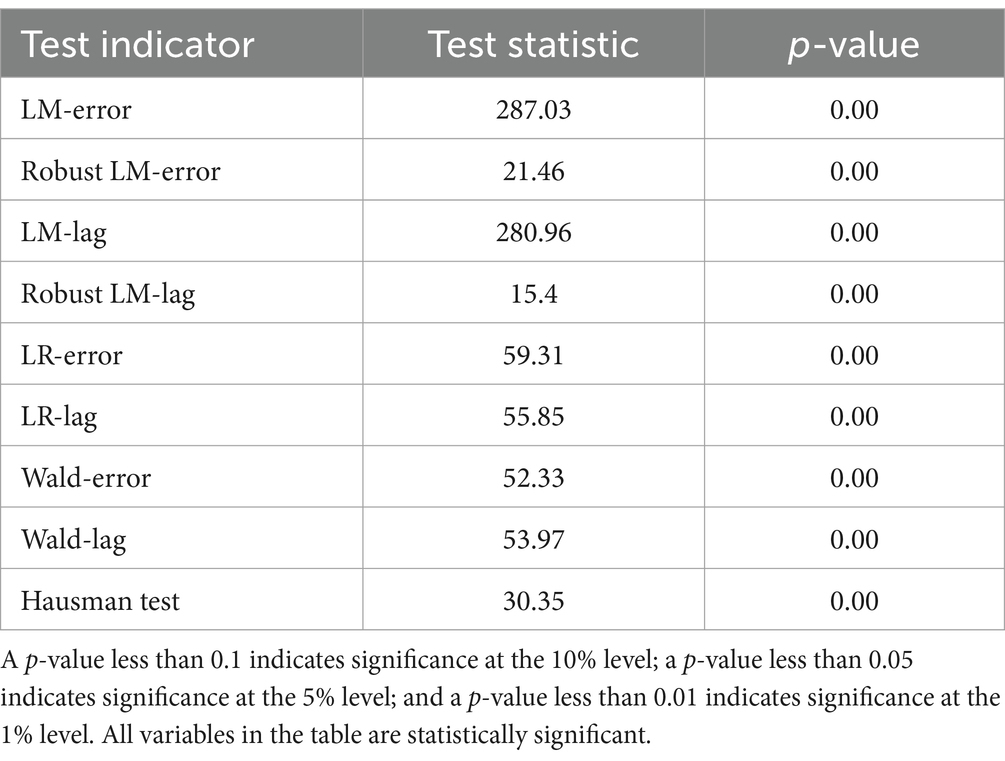
Table 6. Variable definitions and descriptive statistics.
4.3 Analysis of baseline regression results
This study employs the Spatial Durbin Model (SDM) to identify the key factors influencing carbon emissions per unit of beef in China’s beef cattle industry. The regression results are analyzed using three different spatial weight matrices: the adjacency matrix, the geographic distance matrix, and the spatial economic-geographical nested matrix. The regression coefficients and their significance levels are shown (Table 7), and the following section provides an in-depth analysis of the results based on these matrices. Firstly, environmental governance consistently demonstrates a significant negative impact across all three matrices, indicating that strengthening environmental governance is essential for reducing carbon emissions per unit of beef. The regression coefficients for environmental governance are −0.012, −0.013, and −0.014 in the adjacency matrix, geographic distance matrix, and spatial economic-geographical nested matrix, respectively, all of which are statistically significant at the 1% level. This suggests that improving environmental governance not only enhances resource utilization efficiency but also helps reduce carbon emissions, regardless of geographical or economic proximity.
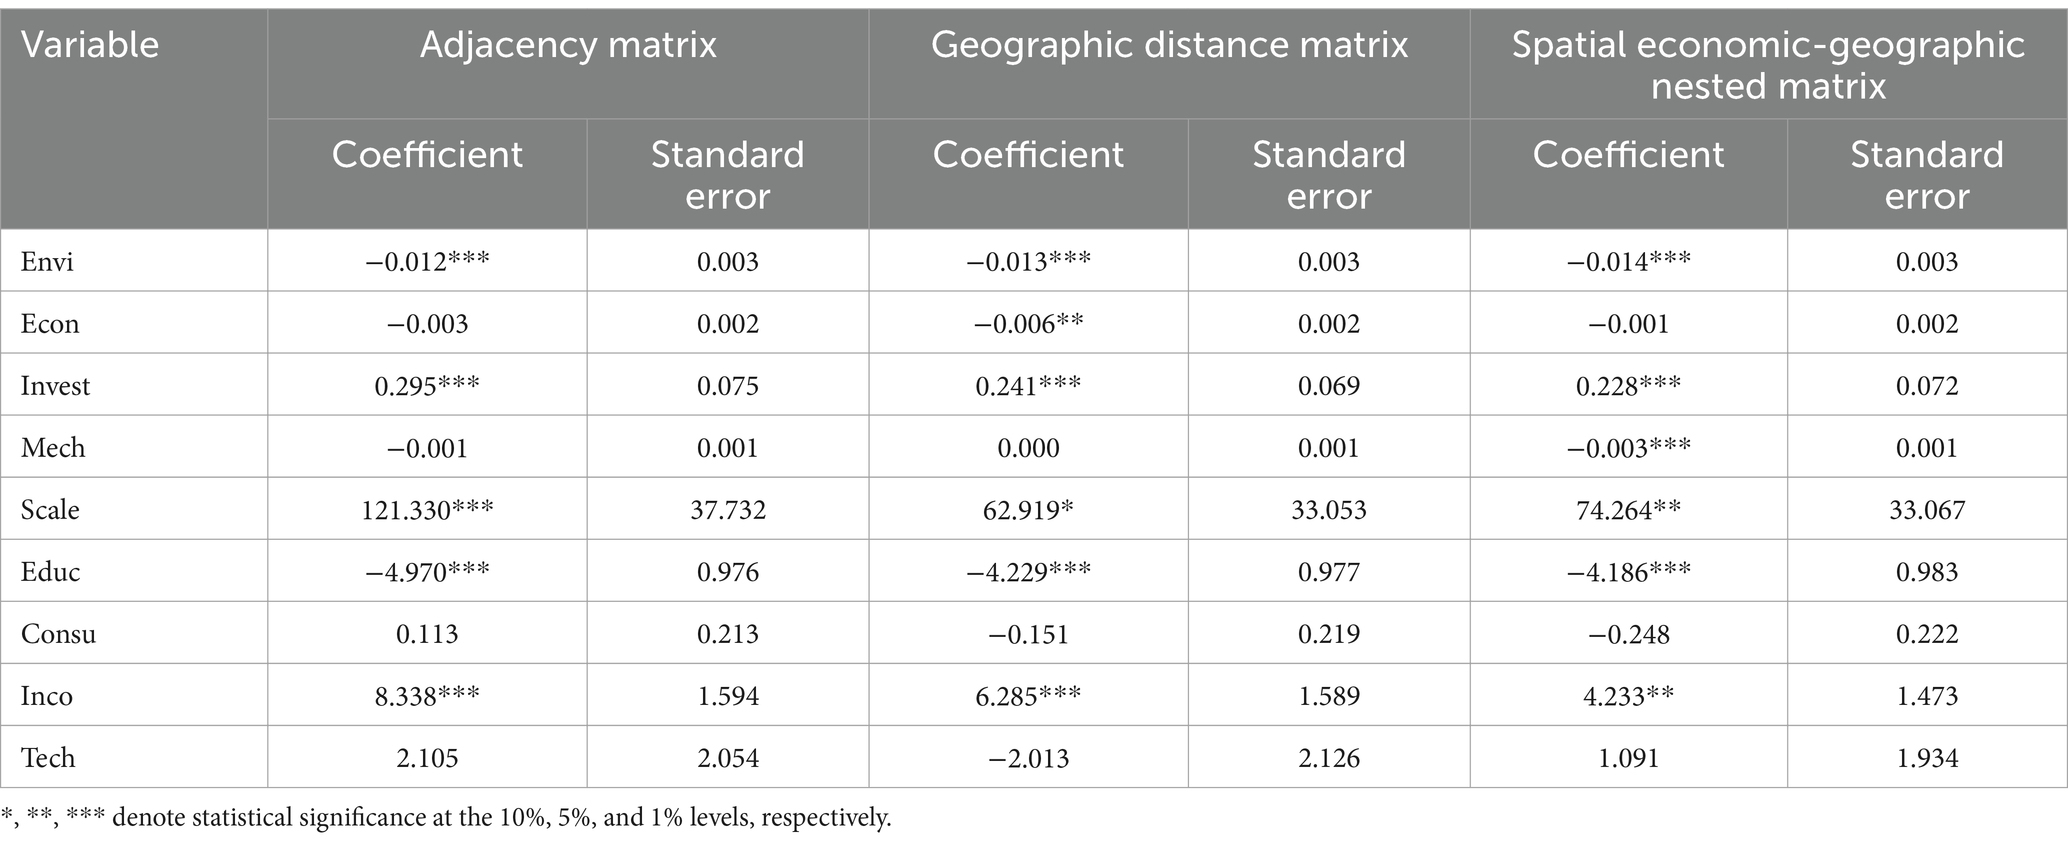
Table 7. Regression results analysis of the Spatial Durbin Model.
The effect of economic development level varies across the matrices. In the adjacency matrix, the regression coefficient is −0.003, which is not statistically significant, suggesting that the direct impact of economic development on carbon emissions is minimal. However, in the geographic distance matrix, economic development level is negatively correlated with carbon emissions, and this effect is significant. In the spatial economic-geographical nested matrix, however, the relationship is not statistically significant. These findings imply that more economically developed regions may adopt green technologies and low-carbon farming practices earlier, thus reducing carbon emissions, but the influence of this effect varies across regions. Research investment (invest) consistently shows a significant positive relationship with carbon emissions in all three matrices. Whether using the adjacency matrix, the geographic distance matrix, or the spatial economic-geographical nested matrix, research investment remains significantly positive at the 1% level. While increased research investment can drive technological advancements, it may not immediately result in carbon reduction technologies or management practices. This delay can be attributed to the time required to effectively apply research outcomes and to the pace at which new technologies are implemented.
The degree of scale exhibits a strong positive relationship with carbon emissions in the adjacency matrix, where the regression coefficient is 121.330, indicating a highly significant association. This suggests that larger-scale farming operations may lead to increased carbon emissions, possibly due to the insufficient application of environmental protection technologies. Although large-scale farming can improve production efficiency, it may also result in higher carbon emissions and resource waste if green technologies are not fully integrated. Education level consistently shows a significant negative impact on carbon emissions, with regression coefficients of −4.970, −4.229, and −4.186 across the three matrices, all statistically significant. These results imply that higher education levels promote greater environmental awareness, which in turn encourages the adoption of low-carbon technologies, leading to a reduction in carbon emissions. The urban–rural income gap is positively associated with carbon emissions, with regression coefficients of 8.338, 6.285, and 4.233. This suggests that regions with larger income disparities tend to have higher carbon emissions, likely due to lower production efficiency and less sustainable consumption patterns in these areas. Mechanization level shows a significant negative impact only in the spatial economic-geographical nested matrix, with no significant effects observed in the other two matrices. Increased mechanization can enhance production efficiency and reduce energy consumption, but the benefits may not be fully realized in certain regions where technological upgrades are incomplete.
Technological level does not show a significant effect on carbon emissions in any of the three regression models. This suggests that, within the scope of the study, technological advancements have not yet translated into substantial reductions in carbon emissions, possibly because some regions have not yet fully implemented low-carbon technologies. In conclusion, environmental governance and education levels have a significant negative impact on carbon emissions per unit of beef, highlighting the importance of environmental policies and educational investments in reducing carbon emissions. On the other hand, factors such as research investment, scale, and the urban–rural income gap present more complex relationships, which require further exploration of their mechanisms in different regions and production models. From a spatial perspective, the regression results from the three matrices reveal spatial dependencies in regional carbon emissions, suggesting that green development levels in different areas are influenced by geographic distance, economic ties, and other spatial factors. As such, policy development should take these regional differences into account, tailoring emission reduction strategies to local conditions.
4.4 Analysis of spatial spillover effects
Building upon the regression analysis using the Spatial Durbin Model (SDM), this study further investigates the spatial spillover effects of various variables. The results reveal that environmental governance has significant negative spillover effects in both the geographic distance matrix and the spatial economic-geographical nested matrix (Table 8). This finding suggests that effective environmental governance not only reduces carbon emissions within the local area but also contributes to the reduction of carbon emissions in neighboring regions through cross-regional policy coordination (Xu et al., 2022).
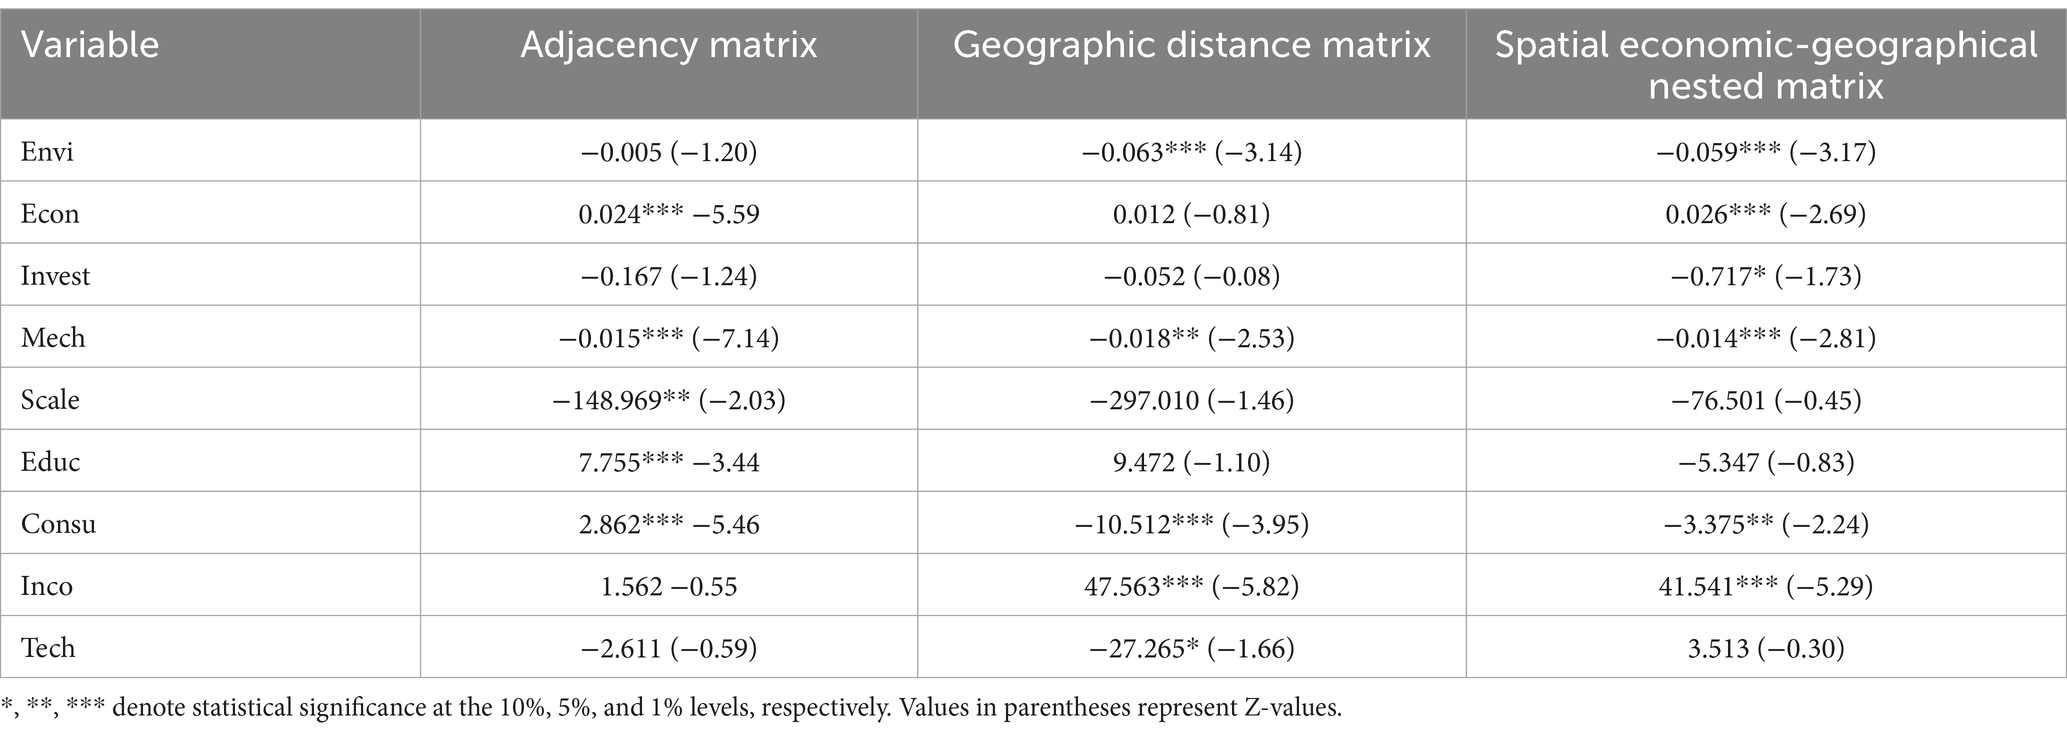
Table 8. Analysis of spatial spillover effect results.
The economic development level exhibits a significant positive spillover effect in both the adjacency matrix and the spatial economic-geographical nested matrix. This suggests that economic growth not only drives local low-carbon development but also enhances carbon reduction efficiency in neighboring regions through economic linkages. However, in the geographic distance matrix, the spillover effect of economic development is not significant, indicating that the impact of economic growth on neighboring areas may vary depending on spatial relationships (Chen et al., 2020; Ayyildiz and Erdal, 2021). Research investment, on the other hand, shows a negative spillover effect in the spatial economic-geographical nested matrix. This suggests that the concentration of research resources in specific regions may hinder the diffusion of benefits to adjacent areas in the short term, possibly due to limited dissemination of research advances and the slow adoption of effective carbon reduction technologies across regions.
The mechanization level consistently shows significant negative spillover effects across all matrices, suggesting that increased mechanization reduces carbon emissions in neighboring regions by enhancing production efficiency and lowering energy consumption. The degree of scale and education level, however, exhibit distinct spillover effects under the adjacency matrix. The spillover effect of scale is negative, indicating that large-scale farming primarily reduces carbon emissions in adjacent regions. In contrast, the spillover effect of education is positive, suggesting that higher education levels in one region can lead to increased carbon emissions in neighboring areas through labor mobility and the diffusion of knowledge. Per capita beef consumption demonstrates a positive spillover effect in the adjacency matrix, implying that increased consumption demand drives production and consumption in neighboring regions. However, in more distant areas, it shows a negative spillover effect, likely due to resource competition that limits the carbon reduction benefits.
Overall, environmental governance, economic development, and mechanization levels demonstrate significant spillover effects, emphasizing their cross-regional influence. In contrast, research investment, scale of production, and education levels tend to have a more localized impact. Policymakers should take these disparities into account by promoting regional collaborative governance and optimizing resource allocation to effectively advance low-carbon development goals (Xiong et al., 2022; Hang et al., 2024).
5 Conclusion and recommendations
This study employs panel data from 31 provinces in China, covering the period from 2009 to 2022, to estimate the carbon emissions of the beef cattle industry and identify the factors influencing these emissions. The findings yield several key conclusions. Firstly, between 2009 and 2022, carbon emissions from China’s beef cattle industry demonstrated an overall declining trend, with particularly notable reductions in the eastern and central regions. These declines were largely driven by the widespread adoption of intensive farming practices and the dissemination of green emission-reduction technologies. Nevertheless, methane emissions from beef cattle gastrointestinal fermentation and manure management remain the primary sources of carbon emissions, and are closely linked to the expansion of farming scales. Secondly, spatial analysis reveals a pronounced spatial clustering effect in the carbon emissions per unit of beef across China. The factors influencing carbon emissions predominantly include environmental governance, economic development level, and degree of mechanization. Notably, environmental governance has a significant positive impact on reducing carbon emissions. While research investment and scale farming have enhanced production efficiency, they have not effectively reduced carbon emissions in the short term and may even have adverse effects. Additionally, education levels and urban–rural income disparities significantly influence carbon emissions, with higher education levels fostering low-carbon development.
Based on these findings, the study proposes the following policy recommendations. Firstly, it is essential to dismantle regional barriers and establish collaborative regional emission reduction mechanisms. Given the significant spillover effects of carbon emissions in the beef cattle industry, emission reduction measures confined to individual regions may fail to achieve the desired outcomes. Therefore, promoting cross-regional collaborative governance, sharing emission reduction experiences and technologies, and fostering synergies are crucial to amplify emission reduction benefits. Secondly, attention should be directed towards the innovation and dissemination of low-carbon technologies to accelerate the green transformation of the industry. Technological innovations, especially in areas such as feed optimization, manure management, and energy efficiency, hold the potential to significantly reduce carbon emissions. As such, the government should enhance funding support and policy guidance for the research and development of low-carbon technologies. By leveraging tax incentives, financial subsidies, and other policy tools, the rapid adoption and application of green production technologies can be ensured, facilitating their swift transition into productive capacities. In the future, systematic research on the low-carbon development of the beef cattle industry should focus on integrated innovations across the entire industrial chain. Key areas include: biotechnological approaches such as precision nutritional regulation and genetic improvement; optimization of manure recycling and waste resource utilization systems; development of intelligent carbon footprint monitoring technologies; and ecological regulation mechanisms for integrated crop-livestock systems. Furthermore, future research should aim to couple policy tool innovation with the localization of international best practices, addressing the practical challenges of translating advanced technologies into scalable industrial applications. Priority should also be given to overcoming bottlenecks in key low-carbon technologies and to advancing techno-economic feasibility studies through interdisciplinary research, thereby facilitating the sustainable transformation of the industry.
Furthermore, advancing integrated crop-livestock systems offers a promising pathway for achieving carbon emission reductions by enhancing resource recycling and promoting low-carbon agricultural practices. By rationally utilizing agricultural by-products as livestock feed, dependence on external feed sources can be minimized, thereby reducing carbon emissions and improving the efficiency of resource utilization. In this context, promoting the development of integrated crop-livestock systems is essential. This involves designing region-specific farming models and emission reduction strategies that take into account the diverse natural resource conditions across different areas. Such strategies will not only contribute to reducing carbon emissions within the beef cattle industry but also play a pivotal role in advancing China’s agricultural sector toward a low-carbon, green, and sustainable transformation. In turn, these efforts will provide crucial support in meeting China’s “Dual Carbon” goals—carbon peaking and carbon neutrality—by fostering a more sustainable agricultural landscape. Therefore, promoting the development of integrated crop-livestock systems is critical for optimizing resource use and reducing carbon emissions in the beef cattle industry. By tailoring farming models and emission reduction strategies to the specific natural resource conditions of each region, it becomes possible to enhance both environmental sustainability and agricultural productivity. Such integrated systems not only facilitate significant reductions in carbon emissions but also contribute to the broader transformation of China’s agriculture towards a low-carbon, green, and sustainable future. This approach plays a pivotal role in advancing China’s agricultural sector towards achieving the “Dual Carbon” goals of carbon peaking and carbon neutrality, offering essential support for national and global sustainability objectives.
Data availability statement
The original contributions presented in the study are included in the article/supplementary material, further inquiries can be directed to the corresponding author.
Author contributions
YS: Conceptualization, Data curation, Formal analysis, Investigation, Methodology, Project administration, Resources, Software, Validation, Visualization, Writing – original draft. MW: Funding acquisition, Supervision, Validation, Writing – review & editing.
Funding
The author(s) declare that financial support was received for the research and/or publication of this article. This work was supported by The Key Project of National Natural Science Foundation of China (grant no. 72033009) and Science and Technology Innovation Project of Chinese Academy of Agricultural Sciences (ASTIP-IAED-2025-01).
Conflict of interest
The authors declare that the research was conducted in the absence of any commercial or financial relationships that could be construed as a potential conflict of interest.
Generative AI statement
The author(s) declare that no Gen AI was used in the creation of this manuscript.
Publisher’s note
All claims expressed in this article are solely those of the authors and do not necessarily represent those of their affiliated organizations, or those of the publisher, the editors and the reviewers. Any product that may be evaluated in this article, or claim that may be made by its manufacturer, is not guaranteed or endorsed by the publisher.
Footnotes
1. ^Note: Regional classification in this study follows the standard of the National Bureau of Statistics of China, which divides the country into eastern, central, and western regions. The eastern region includes Beijing, Tianjin, Hebei, Shanghai, Jiangsu, Zhejiang, Fujian, Shandong, Guangdong, and Hainan; the central region includes Shanxi, Anhui, Jiangxi, Henan, Hubei, and Hunan; and the western region includes Inner Mongolia, Guangxi, Chongqing, Sichuan, Guizhou, Yunnan, Tibet, Shaanxi, Gansu, Qinghai, Ningxia, and Xinjiang.
2. ^Note: According to the Food and Agriculture Organization of the United Nations (FAO) (2023) report, cattle (including both beef and dairy) emit approximately 3.8 gigatons of CO₂-equivalent annually, representing 62% of total greenhouse gas emissions from the global livestock sector. Pigs, chickens, buffaloes, and small ruminants account for 14, 9, 8, and 7%, respectively. By product type, meat contributes about two-thirds of total emissions, while milk accounts for around 30%, and eggs make up the remainder.
References
Ayyildiz, M., and Erdal, G. (2021). The relationship between carbon dioxide emission and crop and livestock production indexes: a dynamic common correlated effects approach. Environ. Sci. Pollut. Res. 28, 597–610. doi: 10.1007/s11356-020-10409-8
Bai, Y., Guo, C., Li, S., Degen, A. A., Ahmad, A. A., Wang, W., et al. (2021). Instability of decoupling livestock greenhouse gas emissions from economic growth in livestock products in the Tibetan highland. J. Environ. Manag. 287:112334. doi: 10.1016/j.jenvman.2021.112334
Chen, Z., An, C., Fang, H., Zhang, Y., Zhou, Z., Zhou, Y., et al. (2020). Assessment of regional greenhouse gas emission from beef cattle production: a case study of Saskatchewan in Canada. J. Environ. Manag. 264:110443. doi: 10.1016/j.jenvman.2020.110443
CPC Central Committee (2022). Report to the 20th National Congress of the Communist Party of China. Beijing: People’s Publishing House.
D’aurea, A. P., da Silva Cardoso, A., Guimarães, Y. S. R., Fernandes, L. B., Ferreira, L. E., and Reis, R. A. (2021). Mitigating greenhouse gas emissions from beef cattle production in Brazil through animal management. Sustain. For. 13:7207. doi: 10.3390/su13137207
Department of Climate Change, NDRC (2011). Provincial greenhouse gas inventory compilation guide. Beijing: China Environmental Publishing House.
Du, M., Kang, X., Liu, Q., Du, H., Zhang, J., Yin, Y., et al. (2024). City-level livestock methane emissions in China from 2010 to 2020. Sci. Data. 11:251. doi: 10.1038/s41597-024-03072-y
Food and Agriculture Organization (FAO) (2006). Livestock’s long shadow: Environmental issues and options. Rome: Food and Agriculture Organization of the United Nations.
Food and Agriculture Organization of the United Nations (FAO). (2023). Pathways towards lower emissions – A global assessment of the greenhouse gas emissions and mitigation options from livestock agrifood systems. Rome: FAO. doi: 10.4060/cc9029en
Gerber, P. J., Hristov, A. N., Henderson, B., Makkar, H. P. S., Oh, J., and Leloup, F. (2013). Mitigation of greenhouse gas emissions in livestock production: A review of technical options for non-CO2 emissions. Rome: Food and Agriculture Organization of the United Nations.
Hang, S., Xu, Y., Lyu, Y., Gong, H., and Li, J. (2024). Expanding supporting land to reduce greenhouse gas emissions from livestock farms: case studies in northern China. J. Clean. Prod. 467:142784. doi: 10.1016/j.jclepro.2024.142784
He, D., Deng, X., Wang, X., and Zhang, F. (2023). Livestock greenhouse gas emission and mitigation potential in China. J. Environ. Manag. 348:119494. doi: 10.1016/j.jenvman.2023.119494
IPCC (2019). 2019 refinement to the 2006 IPCC guidelines for national greenhouse gas inventories. Japan: IGES.
Jin, G., Guo, B., and Deng, X. (2020). Is there a decoupling relationship between CO2 emission reduction and poverty alleviation in China? Technol. Forecast. Soc. Chang. 151:119856. doi: 10.1016/j.techfore.2019.119856
Li, H., Hu, S., and Tong, H. (2024). Carbon footprint of household meat consumption in China: a life-cycle-based perspective. Appl. Geogr. 169:103325. doi: 10.1016/j.apgeog.2024.103325
Li, J., and Yang, X. (2024). Ecological connotations and path analysis of high-quality development in animal husbandry: interpreting the spirit of the 20th National Congress of the CPC. Econ. Issues. 12, 11–18. doi: 10.16011/j.cnki.jjwt.2024.12.011
Liang, Y. W., and Wang, M. L. (2024). Scale development of China's pig industry and carbon emissions: promotion or suppression? J. Huazhong Agric. Univ. Soc. Sci. Ed. 4, 71–80. doi: 10.13300/j.cnki.hnwkxb.2024.04.007
Ma, R. Y., and Xiao, H. F. (2024). Carbon emissions in China's animal husbandry: connotations, research progress, and forward-looking insights. J. China Agric. Univ. 29, 185–195. doi: 10.11841/j.issn.1007-4333.2024.12.16
Meng, X. H., Cheng, G. Q., Zhang, J. B., Wang, Y. B., and Zhou, H. C. (2014). Spatiotemporal characteristics of life cycle greenhouse gas emissions from China's livestock industry. China Environ. Sci. 34, 2167–2176. doi: 10.3969/j.issn.1000-6923.2014.08.035
Ning, J., Wang, Z., Du, G. M., and Li, Y. J. (2023). Characteristics of agricultural carbon emissions and decoupling analysis of agricultural economy in Northeast China. Econ. Geogr. 43, 173–180. doi: 10.15957/j.cnki.jjdl.2023.11.018
O’Brien, D., Herron, J., Andurand, J., Caré, S., Martinez, P., Migliorati, L., et al. (2020). Life beef carbon: a common framework for quantifying grass and corn based beef farms’ carbon footprints. Animal 14, 834–845. doi: 10.1017/S1751731119002519
Pelton, R. E. O., Kazanski, C. E., Keerthi, S., Racette, K. A., Gennet, S., Springer, N., et al. (2024). Greenhouse gas emissions in US beef production can be reduced by up to 30% with the adoption of selected mitigation measures. Nat. Food 5, 787–797. doi: 10.1038/s43016-024-01031-9
Rotz, C. A., Asem-Hiablie, S., Place, S., and Thoma, G. (2019). Environmental footprints of beef cattle production in the United States. Agric. Syst. 169, 1–13. doi: 10.1016/j.agsy.2018.11.005
Shi, R., Irfan, M., Liu, G., Yang, X., and Su, X. (2022). Analysis of the impact of livestock structure on carbon emissions of animal husbandry: a sustainable way to improving public health and green environment. Front. Public Health 10:835210. doi: 10.3389/fpubh.2022.835210
Shi, Z. H., and Wang, R. X. (2024). Coupling coordination between agricultural modernization and carbon emission efficiency in China. J. Arid. Land Resour. Environ. 38, 1–12. doi: 10.13448/j.cnki.jalre.2024.157
Sun, Y. N., Liu, J. J., and Ma, Z. H. (2010). Assessment of greenhouse gas emissions from large-scale dairy farms. Trans. Chin. Soc. Agric. Eng. 26, 296–301. doi: 10.3969/j.issn.1002-6819.2010.06.052
Tian, Y., Xia, R., and Li, B. (2024). Re-estimating carbon emissions from China’s livestock industry: Status, dynamic evolution, and spatial correlation. China Environ. Sci. 45, 1686–1698. doi: 10.19674/j.cnki.issn1000-6923.20241101.003
Tian, Y., and Yin, M. H. (2022). Re-estimation of agricultural carbon emissions in China: basic status, dynamic evolution and spatial spillover effects. China Rural Econ. 3, 104–127. doi: 10.13300/j.cnki.zgncjj.2022.03.104
Tian, Y., Zhang, J. B., and Luo, X. F. (2014). Regional comparison of the coordination between net carbon benefit and economic benefit in China's cropping industry. Econ. Geogr. 3, 142–148. doi: 10.15957/j.cnki.jjdl.2014.03.024
Tongwane, M. I., and Moeletsi, M. E. (2020). Emission factors and carbon emissions of methane from enteric fermentation of cattle produced under different management systems in South Africa. J. Clean. Prod. 265:121931. doi: 10.1016/j.jclepro.2020.121931
Wei, Y., Zhang, X., Xu, M., and Chang, Y. (2023). Greenhouse gas emissions of meat products in China: a provincial-level quantification. Resour. Conserv. Recycl. 190:106843. doi: 10.1016/j.resconrec.2022.106843
Wen, T., Sun, P. X., and Zhang, L. (2024). Dynamic evolution and regional patterns of China's agricultural carbon emissions. Econ. Geogr. 44, 165–175. doi: 10.15957/j.cnki.jjdl.2024.10.017
Wu, H. (2015). Carbon reduction in Chinese provinces: spatial-temporal patterns, evolutionary mechanisms, and policy recommendations—a study based on spatial econometrics theory and methods. Manag. World. 11, 3–10. doi: 10.19744/j.cnki.11-1235/f.2015.11.004
Wu, G. Y., Chen, Y., and Sun, X. J. (2021). Regional differences, dynamic evolution, and convergence of carbon compensation rates in China's cropping industry. Chin. J. Eco-Agric. 10, 1774–1785. doi: 10.13930/j.cnki.cjea.210225
Wu, Q., Zhang, Y. Y., and Zhang, M. Y. (2022). Quantitative evaluation, spatial-temporal characteristics, and dynamic evolution of carbon emissions in China's animal husbandry: 2001–2020. J. Arid Land Resour. Environ. 6, 65–71. doi: 10.13448/j.cnki.jalre.2022.148
Xiong, X. Z., Sun, Y. M., and Yang, C. (2022). Spatial-temporal coupling and coordination between animal husbandry and resource-environment carrying capacity in China. Econ. Geogr. 2, 153–162. doi: 10.15957/j.cnki.jjdl.2022.02.017
Xu, P., Houlton, B. Z., Zheng, Y., Zhou, F., Ma, L., Li, B., et al. (2022). Policy-enabled stabilization of nitrous oxide emissions from livestock production in China over 1978–2017. Nat. Food. 3, 356–366. doi: 10.1038/s43016-022-00513-y
Xu, P., Liao, Y., Zheng, Y., Zhao, C., Zhang, X., Zheng, Z., et al. (2019). Northward shift of historical methane emission hotspots from the livestock sector in China and assessment of potential mitigation options. Agric. For. Meteorol. 272-273, 1–11. doi: 10.1016/j.agrformet.2019.03.022
Yan, J. H., and Zhang, Y. J. (2023). Spatial-temporal evolution characteristics and spatial distribution patterns of carbon emission efficiency in China's major beef cattle production areas. Geogr. Sci. 43, 879–888. doi: 10.13249/j.cnki.sgs.2023.05.012
Yu, F. W., Huang, X., and Wang, G. L. (2021). High-quality development of animal husbandry: theoretical interpretation and implementation path. China Rural Econ. 4, 85–99. doi: 10.20077/j.cnki.11-1262/f.2021.04.006
Appendix
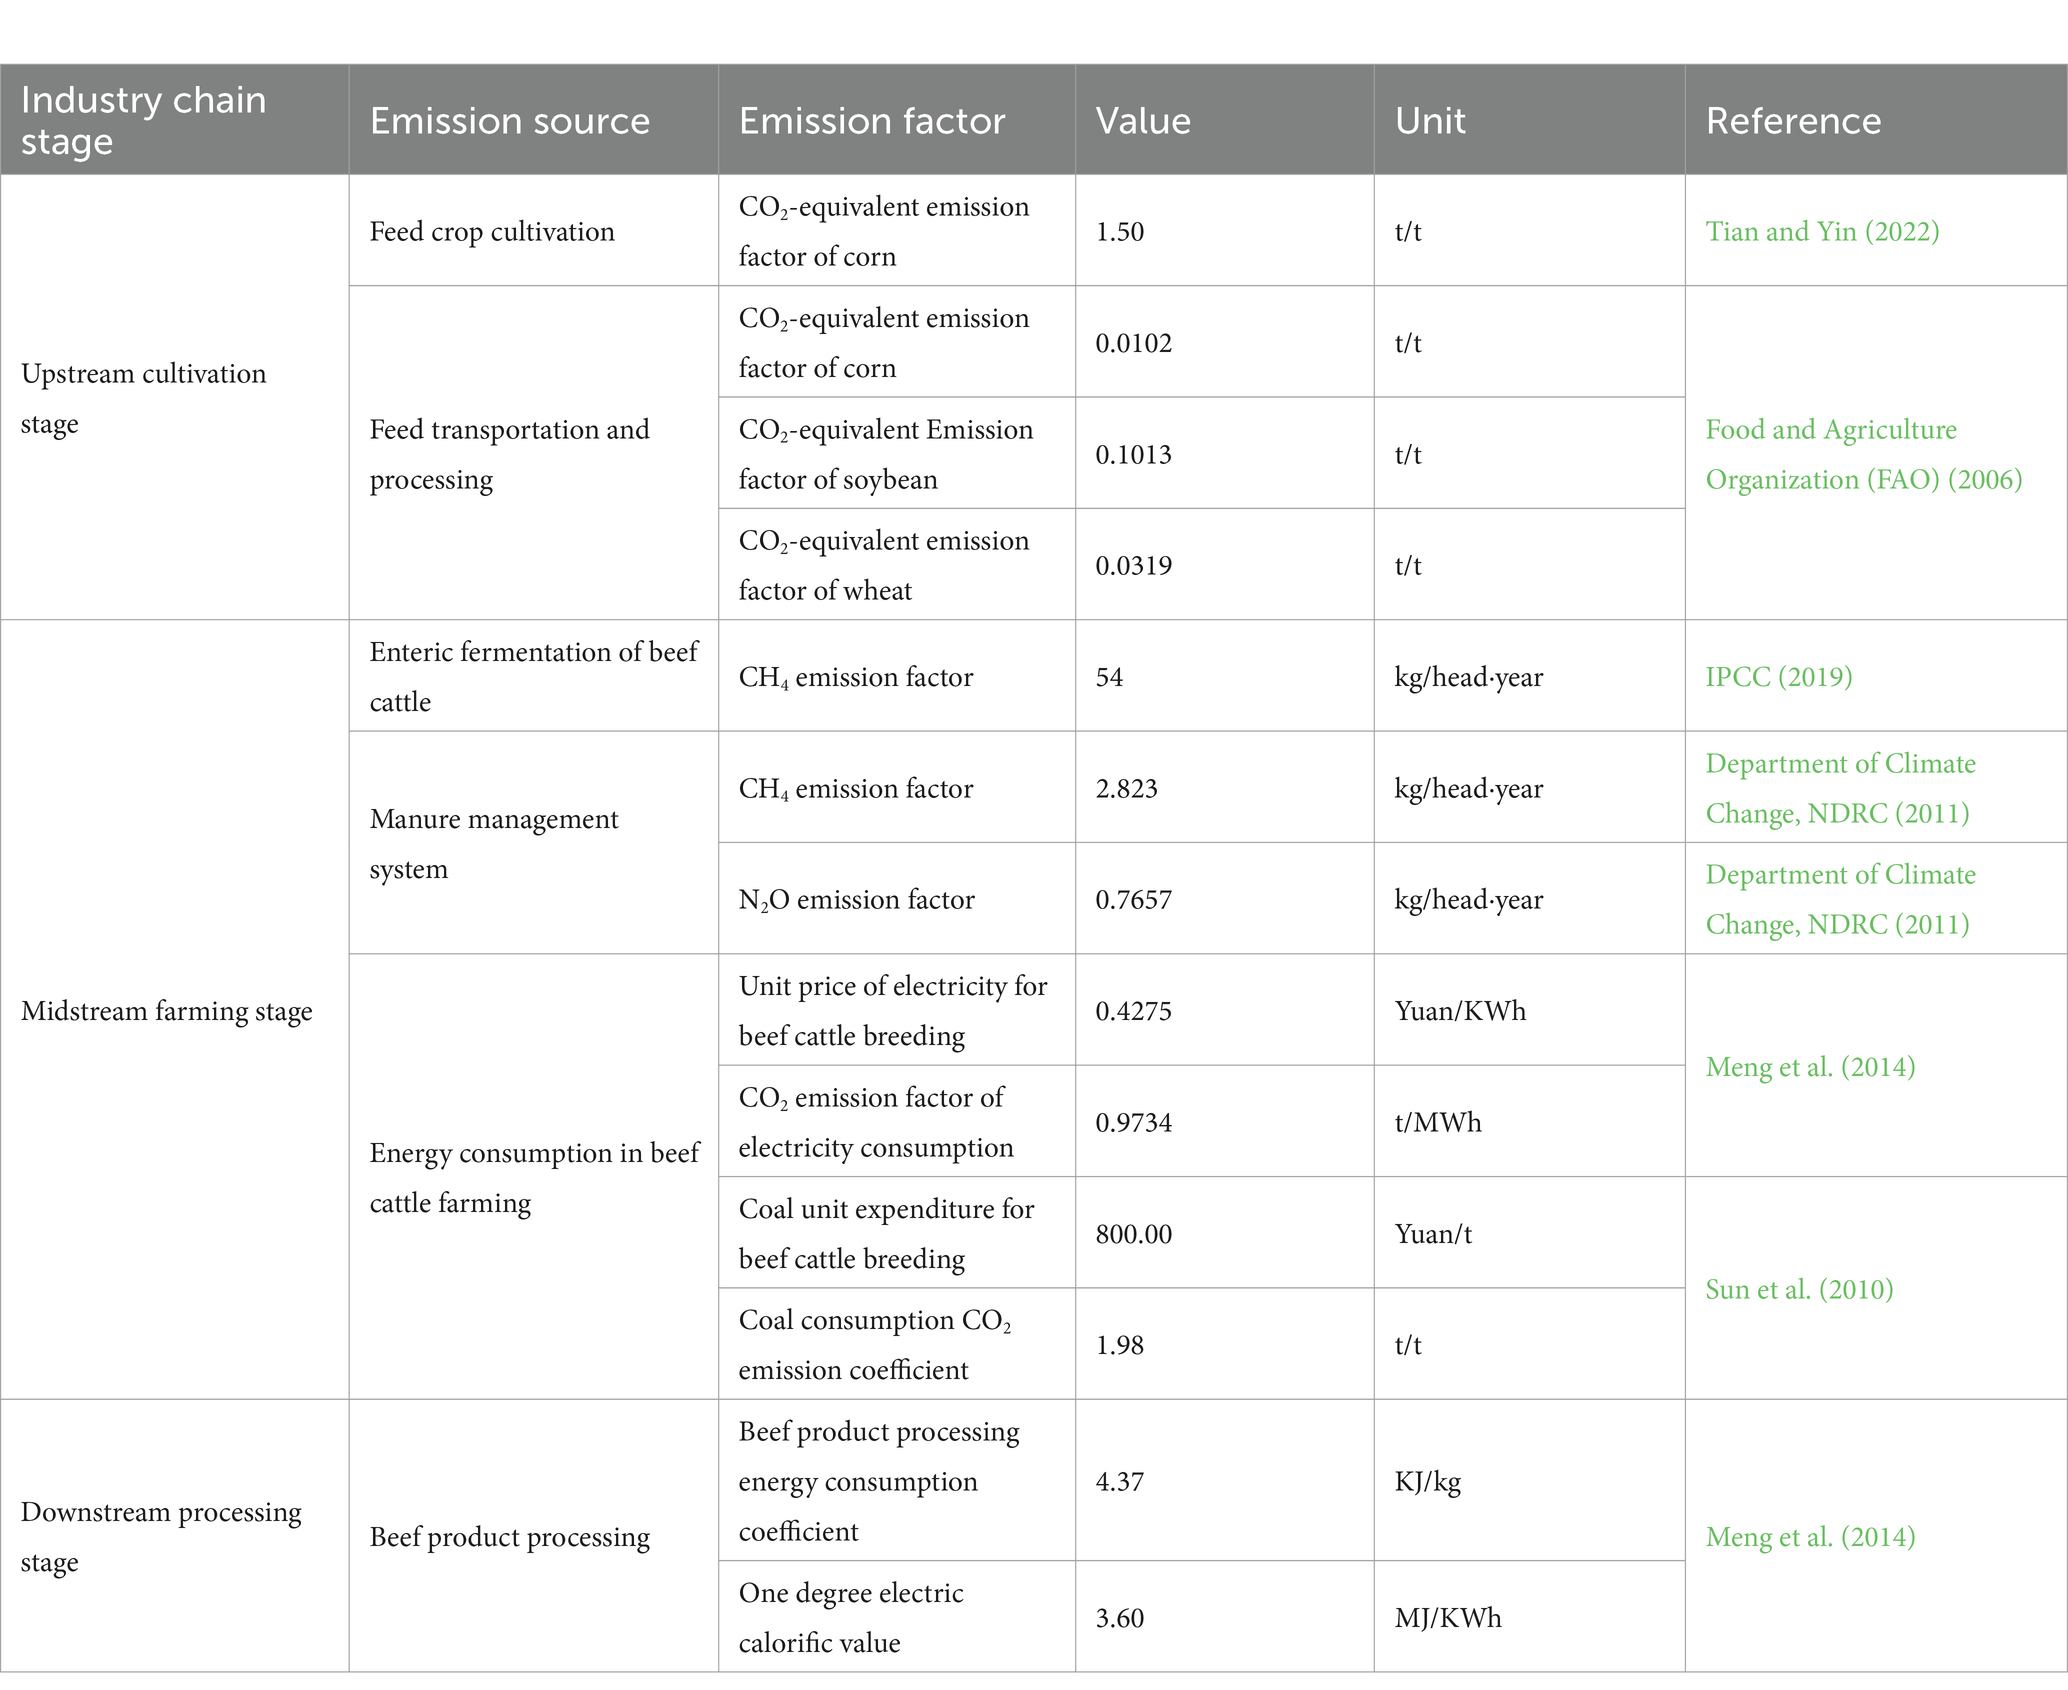
Table A1. Emission factors for carbon accounting in the beef cattle industry.
Keywords: beef cattle industry, carbon emissions, spatial and temporal evolution, regional disparities, emission reduction pathways
Citation: Sun Y and Wang M (2025) Spatiotemporal heterogeneity and its influencing factors: a perspective on the carbon emissions in China’s beef cattle industry. Front. Sustain. Food Syst. 9:1578081. doi: 10.3389/fsufs.2025.1578081
Edited by:
Oyegunle Emmanuel Oke, Federal University of Agriculture, NigeriaReviewed by:
Rugang Tian, Inner Mongolia Academy of Agricultural and Animal Husbandry Sciences, ChinaSukma Aditya Sitepu, Syiah Kuala University, Indonesia
Copyright © 2025 Sun and Wang. This is an open-access article distributed under the terms of the Creative Commons Attribution License (CC BY). The use, distribution or reproduction in other forums is permitted, provided the original author(s) and the copyright owner(s) are credited and that the original publication in this journal is cited, in accordance with accepted academic practice. No use, distribution or reproduction is permitted which does not comply with these terms.
*Correspondence: Mingli Wang, d2FuZ21pbmdsaUBjYWFzLmNu