 Honghong Yu
 Suwan Li
 Jiameng Yang
- 1School of Economics and Management, Changzhou Institute of Technology, Changzhou, China
- 2College of Economics and Management, Nanjing Forestry University, Nanjing, China
Introduction: The work of forest horizontal ecological compensation has progressed from policy guidance to practical exploration. Scientifically defining the responsible entities and measuring the compensation standard is an important component of improving the forest horizontal ecological compensation mechanism.
Methods: This study selects Chongqing as a case study. From the perspective of the carbon budget, the carbon emissions, forest carbon sequestration, and non-forest carbon sequestration of 38 districts and counties in Chongqing were measured. Additionally, by incorporating carbon market transaction prices, economic development levels, and resource endowment conditions of different regions, the forest horizontal ecological compensation standards for each district and county were calculated.
Results: From 2012 to 2021, the payer and receiver entities for forest horizontal ecological compensation in Chongqing generally remained stable, overall presenting a spatial pattern of “southwest compensating the east.” The total compensation amount that forest ecological protection areas in Chongqing should receive showed a steady increase from 2012 to 2021. The total compensation amount that ecological payment areas should pay showed a fluctuating upward trend. The spatial distribution of forest horizontal ecological compensation priorities in Chongqing changed significantly.
Discussion: The issue of carbon supply and demand mismatch exists in various districts and counties in Chongqing, therefore it is essential to further clarify the forest compensation responsibility based on the carbon budget of each district and county. Taking into account the ecological characteristics of forests, carbon supply and demand, economic development level, as well as other factors, differential regional compensation standards should be established to achieve a synergistic symbiosis between regional forest ecology and economic development.
1 Introduction
Global climate change has become the greatest challenge facing the world today (Espinoza et al., 2018; Shen et al., 2020). In 2020, China proposed the goal of “peaking carbon dioxide emissions before 2030 and striving to achieve carbon neutrality before 2060” (Hepburn et al., 2021). Forests, as the largest “carbon sink” on land, provide multiple ecological functions, including carbon sequestration and oxygen release, water conservation, wind prevention and sand fixation (Brockerhoff et al., 2017), which can contribute to the achievement of the dual-carbon goal. However, the ecological services provided by forests have significant externalities and public good characteristics, often leading to the unfair phenomenon of “society as a whole benefits, but only a few bear the burden” (Deng et al., 2011). Ecological compensation has become an effective policy tool to address environmental pollution problems and protect the ecological environment (Jack et al., 2008). Although China has implemented forest ecological compensation policies, the compensation standards remain low and the scope of compensation is limited, resulting in the failure to achieve the expected effects (Zhao et al., 2023; Sheng et al., 2017). The underlying reason is that current ecological compensation mainly depends on fiscal transfers from higher-level governments. With low compensation standards and insufficient intrinsic incentives for ecological protection, there is an urgent need to broaden the funding channels for compensation. At present, the establishment of horizontal ecological compensation system has become a consensus among both the government and the academic community. In April 2024, the State Council of China issued the Regulations on Ecological Protection Compensation, which defines the basic system rules for ecological protection compensation in the form of administrative regulations. The regulations also emphasize the practical implementation of “horizontal compensation between regions” to guide the development of an effective mechanism that links the interests of ecological protection areas with those of ecological beneficiary areas. In practice, under the guidance of national policies, some regions have explored and developed forest horizontal ecological compensation schemes that meet their own development realities, such as Chongqing, Linyi City in Shandong Province, and Ezhou City in Hubei Province. Since the benefit direction of basin ecosystem services is relatively clear, scholars often designate the upstream government as the compensation recipient and the downstream government as the payer (Zhou et al., 2022). This framework typically uses cross-sectional water quality as the assessment index (Yang et al., 2019), thereby aligning the rights and responsibilities associated with basin ecosystem services. However, for other ecosystems, such as farmland and forests, the direction of ecosystem service flow is uncertain, which results in services spanning multiple regions and makes it difficult to identify specific beneficiaries (Lin et al., 2019). Many scholars argue that the ecological compensation responsibilities of different regions should be measured from the perspective of regional ecological supply and demand (Zhao et al., 2021; Wang L. et al., 2023; Wang T. et al., 2023).
Economically developed regions often have a higher demand for forest ecosystem services. In contrast, economically underdeveloped regions typically bear the responsibility for forest conservation. From the perspective of shared responsibility and obligation, horizontal compensation mechanisms are needed to adjust ecological and environmental interests between regions without administrative affiliation and promote coordinated regional development (Liu, 2007; Nie and Cheng, 2019). Clarifying the responsible entities and calculating compensation standards of forest horizontal ecological compensation are the fundamental work of implementing horizontal ecological compensation. These actions help optimize and guide the flow of compensation funds, while also promoting coordinated regional development. In practice, some provincial regions set forest coverage targets for the areas under their jurisdiction. This method focuses solely on forest quantity and fails to account for the ecological attributes of forests in a comprehensive manner. It also overlooks the consumption and demand degree of forest ecosystem services. Especially in some districts and counties where forest resources are relatively abundant but the forest coverage is close to the required threshold, the forest coverage zoning method cannot accurately determine compensation responsibilities. Under the dual carbon goals, the annual carbon sequestration of forestry accounts for more than 60% of the total carbon sequestration of terrestrial ecosystems (Keenan and Williams, 2018), playing a crucial role in carbon absorption (Fang et al., 2001; Zhang C. et al., 2013; Zhang M. et al., 2013). Scholars have gradually paid attention to the field of forest carbon compensation (Latta et al., 2016; Liu et al., 2024), but few studies have been carried out on forest horizontal ecological compensation based on forestry carbon sequestration function. Carbon budget, as one of the methods for measuring carbon sequestration and emissions, is commonly used in carbon compensation zoning for functional areas (Liu et al., 2024; Xia and Yang, 2022). However, there are few studies on the application of carbon budget accounting system to forest horizontal ecological compensation. Regarding the calculation of compensation standards, many scholars argue that compensation standards should reflect factors such as regional economic levels and resource endowments conditions (Wang et al., 2016; Jiang, 2018). Therefore, based on the practice of horizontal forest ecological compensation in Chongqing, this study adopts the carbon budget method to reflect the ecological consumption and input relationship between carbon emissions from production and domestic activities and forestry carbon sequestration. It comprehensively considers forest carbon sequestration service function and ecological supply–demand issues, and clarifies the responsibilities for horizontal forest ecological compensation in different districts and counties. Furthermore, the compensation standards for different districts and counties are determined according to their resource endowment conditions and economic development differences.
2 Materials and methods
2.1 Study area
Chongqing is located in the upper reaches of the Yangtze River and the core area of the Three Gorges Reservoir Area (Figure 1). Its healthy forest ecosystem plays a vital role in advancing the New Era of Western Development, promoting the green development of the Yangtze River Economic Belt, and ensuring the well-being of people’s livelihoods and production activities.
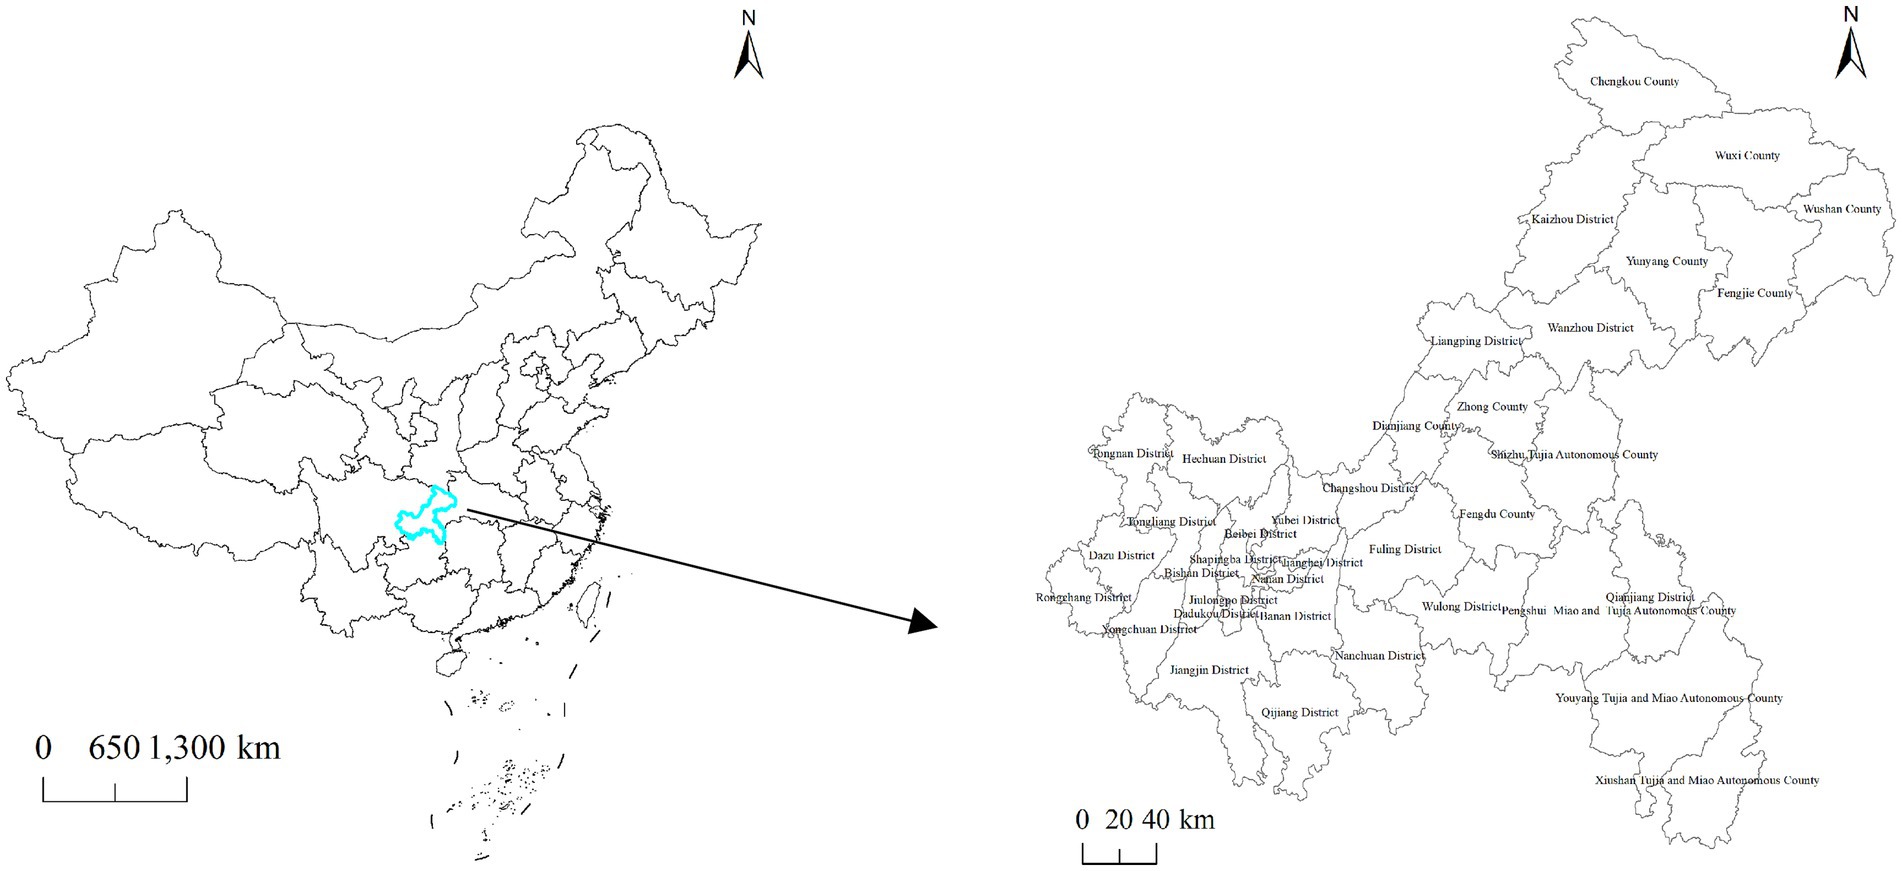
Figure 1. Location map of Chongqing.
In 2018, Chongqing launched a large-scale land greening enhancement initiative and introduced the “Implementation Plan for Horizontal Ecological Compensation to Increase Forest Coverage Rate in Chongqing (Trial) (hereinafter referred to as the Plan), which set targets for the forest coverage rate of 38 districts and counties according to the natural conditions and main functional positioning of the city. For example, nine districts or counties identified as major grain or rapeseed production areas (excluding national key ecological function areas) were assigned a minimum forest coverage rate target of 50%; six districts or counties that served as both major grain and rapeseed production areas (excluding national key ecological function areas) were given a target of no less than 45%; and the remaining 23 districts and counties were assigned a target of at least 55%. The Plan proposed that districts and counties struggling to meet forest coverage rate requirements may purchase forest coverage rate quotas from districts and counties that exceed the target. These purchased quotas would count towards the purchasing district’s or county’s forest coverage rate. However, the seller’s forest coverage rate must remain above 60% after deducting the sold forest area. This approach aims to explore diversified ecological compensation mechanisms that combine vertical government transfer payments with horizontal ecological compensation between regions.
Regarding the standards for forest horizontal ecological compensation, the Plan mandated that buyers and sellers should negotiate to determine the price of forest area quotas, based on factors such as the forest’s location, quality, afforestation, and management costs, with a minimum price set at 1,000 yuan per mu. Additionally, the buyer was required to pay forest management fees from the time of purchase, which should not be lower than 100 yuan per mu per year, with a minimum management period of 15 years. These management fees could be paid annually or in 3–5 installments.
2.2 Research methods
2.2.1 Carbon budget method
The carbon budget method is the primary approach used for carbon compensation accounting. In existing research, it is commonly applied to construct carbon emissions and carbon sequestration accounting systems based on greenhouse gas inventories and carbon absorption coefficients provided by the Intergovernmental Panel on Climate Change (IPCC) (Jing et al., 2021; Mohan, 2018). Alternatively, researchers conduct carbon budget calculations using remote sensing data, such as nighttime light data (Tang et al., 2024). Guided by the IPCC inventory method, this study calculates carbon emissions and carbon sequestration with reference to relevant scholarly findings. Carbon emissions are calculated based on existing research (Kong et al., 2023), considering factors such as energy consumption, human respiration, livestock, agricultural production activities, and wastewater.
(1) Energy carbon emissions
where represents the carbon emissions of energy consumption in region , represents the total energy consumption in region (tons of standard coal), and denotes the carbon emission coefficient per unit of energy consumption, which is 1.87 t C/t (Liao et al., 2024).
(2) Carbon emissions from human and animal respiration
where represents the carbon emissions from human and animal respiration in a specific region, represents the number of humans and animals in that region, and represents the carbon emissions exhaled by each person (head) in a certain area every year. The carbon emissions exhaled by each person, each pig and each cow every year are 0.079 t, 0.082 t, and 0.796 t, respectively (Zeng et al., 2016).
(3) Carbon emissions from agricultural production
where represents the carbon emission of agricultural machinery, is the planting area of crops, represents the total power of agricultural machinery, indicates the carbon emission of farmland irrigation, represents the area of farmland irrigation, represents the carbon emission of chemical fertilizer, and represents the amount of chemical fertilizer used. refers to the carbon emission of agricultural film, and indicates the amount of agricultural film used. , , , , and are the carbon emission coefficients, with values of 16.47 kg C/hm2, 0.18 kg C/kW, 266.48 kg C/hm2, 857.54 kg C/Mg, and 5.18 kg C/kg, respectively (Kong et al., 2023).
(4) Carbon emissions from wastewater
where represents the carbon emission in domestic wastewater, indicates the population, refers to the organic content in the biochemical oxygen demand (BOD) per capita, SBF is the proportion of BOD easily deposited, is the emission factor of BOD, FTA is the proportion of BOD without oxygen degradation in wastewater, represents the carbon emission in industrial wastewater, represents the volume of industrial wastewater discharged, represents the chemical oxygen demand, and is the maximum CH4 production capacity.
Carbon sequestration mainly considers five types of ecosystems: cropland, forest land, grassland, water wetland, and unused land. The calculation formula for carbon sequestration of each type of land use is as follows
where represents the carbon sequestration of each type of land use in region , is the area of each type of land use in region , is the carbon sequestration coefficient per unit area for each type of land use, and the carbon sequestration coefficients of cropland, forest land, grassland, water wetland, and unused land are 0.13 t/(hm2·a) (Zhang C. et al., 2013; Zhang M. et al., 2013), 5.77 t/(hm2·a) (Li et al., 2019), 0.022 t/(hm2·a) (Fang et al., 2007), 0.253 t/(hm2·a) (Wang et al., 2017), and 0.005 t/(hm2·a) (Lai, 2010), respectively.
where represents the net carbon emissions for region , is the total carbon emissions for the district and county in Chongqing, and represent the carbon sequestration from non-forest land and forest land in the district and county , respectively. The carbon emissions from each region are first offset by the carbon sequestration from non-forested land. If the carbon sequestration from non-forest land is insufficient to fully offset the emissions, the remaining emissions are then offset by the carbon sequestration from forest land. If is positive, it indicates that the carbon emissions in the region are greater than the carbon sequestration, meaning the region has a carbon deficit and should pay compensation, making it an ecological payment area. If is negative, it indicates that the carbon emissions are less than the carbon sequestration, meaning the region should receive compensation, making it an ecological acceptance area.
The preliminary calculation results show that the method of Equation 10 is too simple. At the current stage, if the subject and object of forest horizontal forest ecological compensation are divided entirely based on net carbon emissions, large errors may occur in actual applications. There are two key reasons for this issue. On the one hand, carbon emissions exceed carbon sequestration in many regions. If compensation responsibilities are defined based solely on the carbon sequestration of forested and non-forested areas, along with regional carbon emissions, it could result in an imbalance between compensation providers and recipients, thereby hindering the effective implementation of the compensation mechanism (Wu and Tian, 2022). On the other hand, the carbon budget framework typically considers only net carbon emissions, without adequately accounting for regional differences in carbon intensity and resource endowments, which affect the fairness and effectiveness of forest horizontal ecological compensation (Li et al., 2023). Therefore, this study seeks to adjust net carbon emissions by considering regional economic development and resource endowment differences.
Carbon emission intensity (carbon emissions per unit of GDP) is an indicator to measure the relationship between carbon emissions and economic efficiency. Generally speaking, carbon emission intensity gradually decreases with technological progress and economic growth. To comprehensively reflect the differences in carbon emission intensity in different regions and increase the offset payment costs required for inefficient carbon emissions (Wan et al., 2020), this study makes appropriate adjustments to carbon emissions. The specific calculation formula is as follows:
where represents the adjusted carbon emissions of the district and county in Chongqing, is the carbon emissions adjustment coefficient of the district and county , is the carbon emission intensity of the district and county , and θ represents the carbon emission intensity of Chongqing.
Considering the differences in resource endowments among various districts and counties in Chongqing, regions with larger populations and more abundant forest resources should be allowed to have relatively more carbon emissions. To ensure the fairness of forest horizontal ecological compensation, this study refers to the practice of Li et al. (2023), and introduces the carbon emission benchmark threshold based on regional differences in resource endowments.
where represents the carbon emission benchmark threshold adjusted for resource endowment differences in region , represents the population of region , and refers to the forest area in region .
Based on the above analysis, appropriate adjustments are made to the net carbon emissions, and the formula for calculating the adjusted net carbon emissions is as follows:
where represents the adjusted net carbon emissions of the district and county in Chongqing. if , it indicates that the district and county is the payment area of forest horizontal ecological compensation; if not, it indicates that the district and county is the acceptance area of forest horizontal ecological compensation.
2.2.2 Forest horizontal ecological compensation standards and priority calculation
Based on the net carbon emissions of each district and county in Chongqing and the price of forestry carbon sequestration, the compensation amount that each district and county should pay or receive is calculated. It is worth noting that the net carbon emissions calculated by Equation 14 need to be converted to net CO2 emissions. The method for calculating the forest horizontal ecological compensation amount is as follows:
where refers to the average transaction price of carbon in the Chongqing carbon trading market in 2021, which is 30 yuan per ton.
Due to the disparities in economic development across regions, the compensation capacity should vary accordingly. The exponential form is adopted to reflect the nonlinear relationship between regional economic development and compensation responsibility. Considering the actual payment capacity and willingness of each region, this study builds on the research of Zhao et al. (2016) and Kong et al. (2023). Based on the economic development levels of different areas, the improved Peal growth curve model is employed to adjust the calculated amounts of forest horizontal ecological compensation. The calculation formula is as follows:
where represents the revised amount of forest horizontal ecological compensation in region , is the compensation capacity of region , defined as the ratio of GDP of region to the total GDP of Chongqing, and are constants, taking the value as 1 (Zhao et al., 2016), and is the Engel coefficient of Chongqing.
In the process of forest horizontal ecological compensation, in order to improve the forest protection rate and ensure the effective use of funds, this study considers the urgency of compensation funds in different districts and counties. The GDP captures the scale of economic activities that benefit from ecological services and correlates more directly with regional carbon emissions. Drawing on approaches from relevant literature (Li et al., 2023; Chen and Jiang, 2018; Wang et al., 2020), the study calculates the priority for acceptance or payment in forest ecological receiving areas and forest ecological paying areas. The specific calculation formula is as follows:
where, represents the GDP of district and county in Chongqing. represents the priority of forest horizontal ecological compensation in region .
If the priority index of ecological compensation in forest ecological payment areas is lower, it indicates that the economic impact of paying the compensation in this area is smaller, suggesting that these areas should be prioritized for payment. On the other hand, if the priority index of horizontal ecological compensation in forest ecological protection areas is higher, it means that the compensation funds have a greater impact on the economic development of these areas, indicating that they are more urgent in terms of receiving compensation and should be prioritized for compensation funds.
If the priority index of ecological compensation in forest ecological payment areas is smaller, it indicates that the impact on the economic development of this area after paying the compensation amount is smaller, suggesting that these areas should be prioritized for payment. On the other hand, if the priority index of horizontal ecological compensation in forest ecological protection areas is higher, it means that the compensation funds have a greater impact on their economic development, indicating that they are more urgent to receive compensation funds and should be given priority to obtain compensation funds.
2.3 Data sources
Data used in this study were obtained from the Chongqing Statistical Yearbook (2013–2022), Statistical Yearbook of various districts and counties in Chongqing from 2012 to 2021, the Statistical Bulletin on national economic and social development in Chongqing from 2012 to 2021, the China Energy Statistical Yearbook (2013–2022), the Bureau of Statistics of Chongqing’s districts and counties, and the China Forestry and Grassland Statistical Yearbook (2012–2021). The land use type data of Chongqing from 2012 to 2021 is obtained from the Institute of Remote Sensing Information Processing, Wuhan University1, with a spatial resolution of 30 meters.
3 Results
3.1 Analysis of net carbon emissions results in Chongqing
3.1.1 Spatial and temporal characteristics of carbon budget in Chongqing
According to Equations 1–8, the carbon emissions of various districts and counties in Chongqing in 2012, 2015, 2018, and 2021 were calculated, and it was found that the total carbon emissions in Chongqing were in a fluctuating upward trend, with the total carbon emissions increasing from 179.50 million tons in 2012 to 249.77 million tons in 2021, with an average annual growth rate of 3.91%. In terms of the composition of carbon emissions, carbon emissions from agricultural production and animal husbandry account for a relatively small proportion, while the carbon emissions from energy accounted for the largest proportion, rising from 96.87% in 2012 to 97.67% in 2021. In terms of regions, Fuling District had the highest total carbon emissions, increasing from 12.11 million tons in 2012 to 17.30 million tons in 2021, of which energy carbon emissions reached 17.07 million tons. Chengkou County, Wuxi County, Youyang Tujia and Miao Autonomous County (hereinafter referred to as Youyang County), Shizhu Tujia Autonomous County (hereinafter referred to as Shizhu County) and Wushan County had lower total carbon emissions, each not exceeding 2 million tons. From the trend of total carbon emissions in each district and county, the total carbon emissions of Yunyang County, Tongnan District, Rongchang District, Liangping District, Fengdu County, Yuzhong District, Zhong County, Tongliang District and Wulong District have increased significantly, with a relatively fast growth rate. By 2021, the growth rate in these areas has exceeded 100% compared to 2012. In contrast, The total carbon emissions of Wuxi County, Yubei District, Qianjiang District, Nanan District, Shizhu County, Youyang County, Wanzhou District, Shapingba District and Chengkou County decreased, among which the total carbon emissions of Chengkou county decreased from 0.77 million tons in 2012 to 0.30 million tons in 2021, a decrease of 60.58%. From the perspective of spatial distribution, carbon emissions exhibit a pronounced spatial clustering. Areas with higher carbon emissions are primarily distributed in economically developed areas such as urban functional core areas and urban development zones in the southwestern region. Notably, districts and counties like Fuling District, Yubei District, Jiangjin District, and other counties have well-developed manufacturing, electronic information industries, and energy industries, resulting in substantial carbon emissions. In particular, Fuling District, as one of the few districts in Chongqing with a GDP exceeding 100 billion yuan, accounts for 5.07% of Chongqing’s total GDP. In addition, there is less ecological land in Fuling District, which leads to the district’s carbon emissions ranking among the top. In contrast, the counties and districts located in the northeastern ecological conservation development zone and the southeastern ecological protection development zone of Chongqing have relatively low total carbon emissions due to relatively rich ecological resources and relatively underdeveloped industrial development. For instance, Chengkou County’s carbon emissions in 2021 were 0.30 million tons, accounting for only 1.76% of Fuling District’s carbon emissions. Overall, there is a pronounced polarization in carbon emissions across the counties within Chongqing.
According to Equation 9, the carbon sequestration of different land use types in various districts and counties of Chongqing from 2012 to 2021 was calculated. The carbon sequestration increased from 26.16 million tons in 2012 to 26.44 million tons in 2021, a year-on-year increase of 1.05%. The growth rate was slow, indicating that the carbon sequestration capacity of different land types still requires further enhancement. Among them, the carbon sequestration of forest land accounts for over 98% in total. In contrast, the carbon sequestration of grasslands and unused lands is relatively low, primarily due to the limited area of these land types and their inadequate carbon sequestration capacity. In terms of regions, Pengshui Miao and Tujia Autonomous County (hereinafter referred to as Pengshui County), Fengjie County, Chengkou County, Wuxi County, and Youyang County exhibited higher carbon sequestration levels, each exceeding 1.5 million tons. The carbon sequestration of Yuzhong District, Dadukou District, Jiangbei District, Rongchang District, Nan’an District, Jiulongpo District, Shapingba District and Tongnan District ranked last in Chongqing, and none of them exceeded 50,000 tons. In terms of changes in carbon sequestration, the carbon sequestration of Yuzhong District, Nan’an District and Jiangbei District decreased significantly during the study period, with each area showing a decline of over 20% from 2012 to 2021. The carbon sequestration in Yunyang County, Hechuan District, Zhong County, Kaizhou District and Tongnan District increased significantly, with the values in 2021 exceeded 10% compared with 2012. Among them, Tongnan District showed the largest increase, with a carbon sequestration increase rate of 20.67%. Overall, the carbon sequestration in various districts and counties did not exhibit substantial fluctuations, with changes occurring at a relatively slow pace. From the perspective of spatial distribution, the spatial differences in carbon sequestration of these areas in Chongqing from 2012 to 2021 were large. Regions with higher carbon sequestration were primarily located in areas with rich forest ecological resources, such as Youyang County, Wuxi County, Fengjie County, Chengkou County, Pengshui County, and Kaizhou District. In 2021, the carbon sequestration of these five districts accounted for 41.44% of Chongqing’s total carbon sequestration. Relatively speaking, regions with lower carbon sequestration were mainly districts and counties with faster economic development in the western part of Chongqing, such as Yuzhong District and Dadukou District. In addition to economic factors, issues such as deforestation and urbanization also contribute to the lower intensity of carbon sequestration in these areas.
3.1.2 Analysis of the regional results of the adjusted net carbon emissions
In general, the total carbon emissions in Chongqing are far greater than the carbon sequestration. If the compensation subject and object are divided only by the initial net carbon emissions, more than 85% of the districts and counties in Chongqing may be classified as ecological payment areas, which is not only unrealistic but also aggravates the unfairness of development between regions. Therefore, it is necessary to adjust the carbon emissions. This paper uses Equations 11–14 to adjust the carbon emissions and calculate the net carbon emissions from 2012 to 2021. Carbon sequestration from different land types is divided into forest carbon sequestration and non-forest carbon sequestration. The baseline value of carbon emissions for each district and county must first be offset by the non-forest carbon sequestration, followed by the offset from forest carbon sequestration. After adjusting the carbon emissions and sequentially offsetting with non-forest and forest carbon sequestration, the net carbon emissions for 38 districts and counties in Chongqing can be obtained. According to the positive or negative of net carbon emissions and the natural break point method in ArcGIS, the net carbon emissions of each district and county in Chongqing from 2012 to 2021 were classified into four categories (Figure 2).
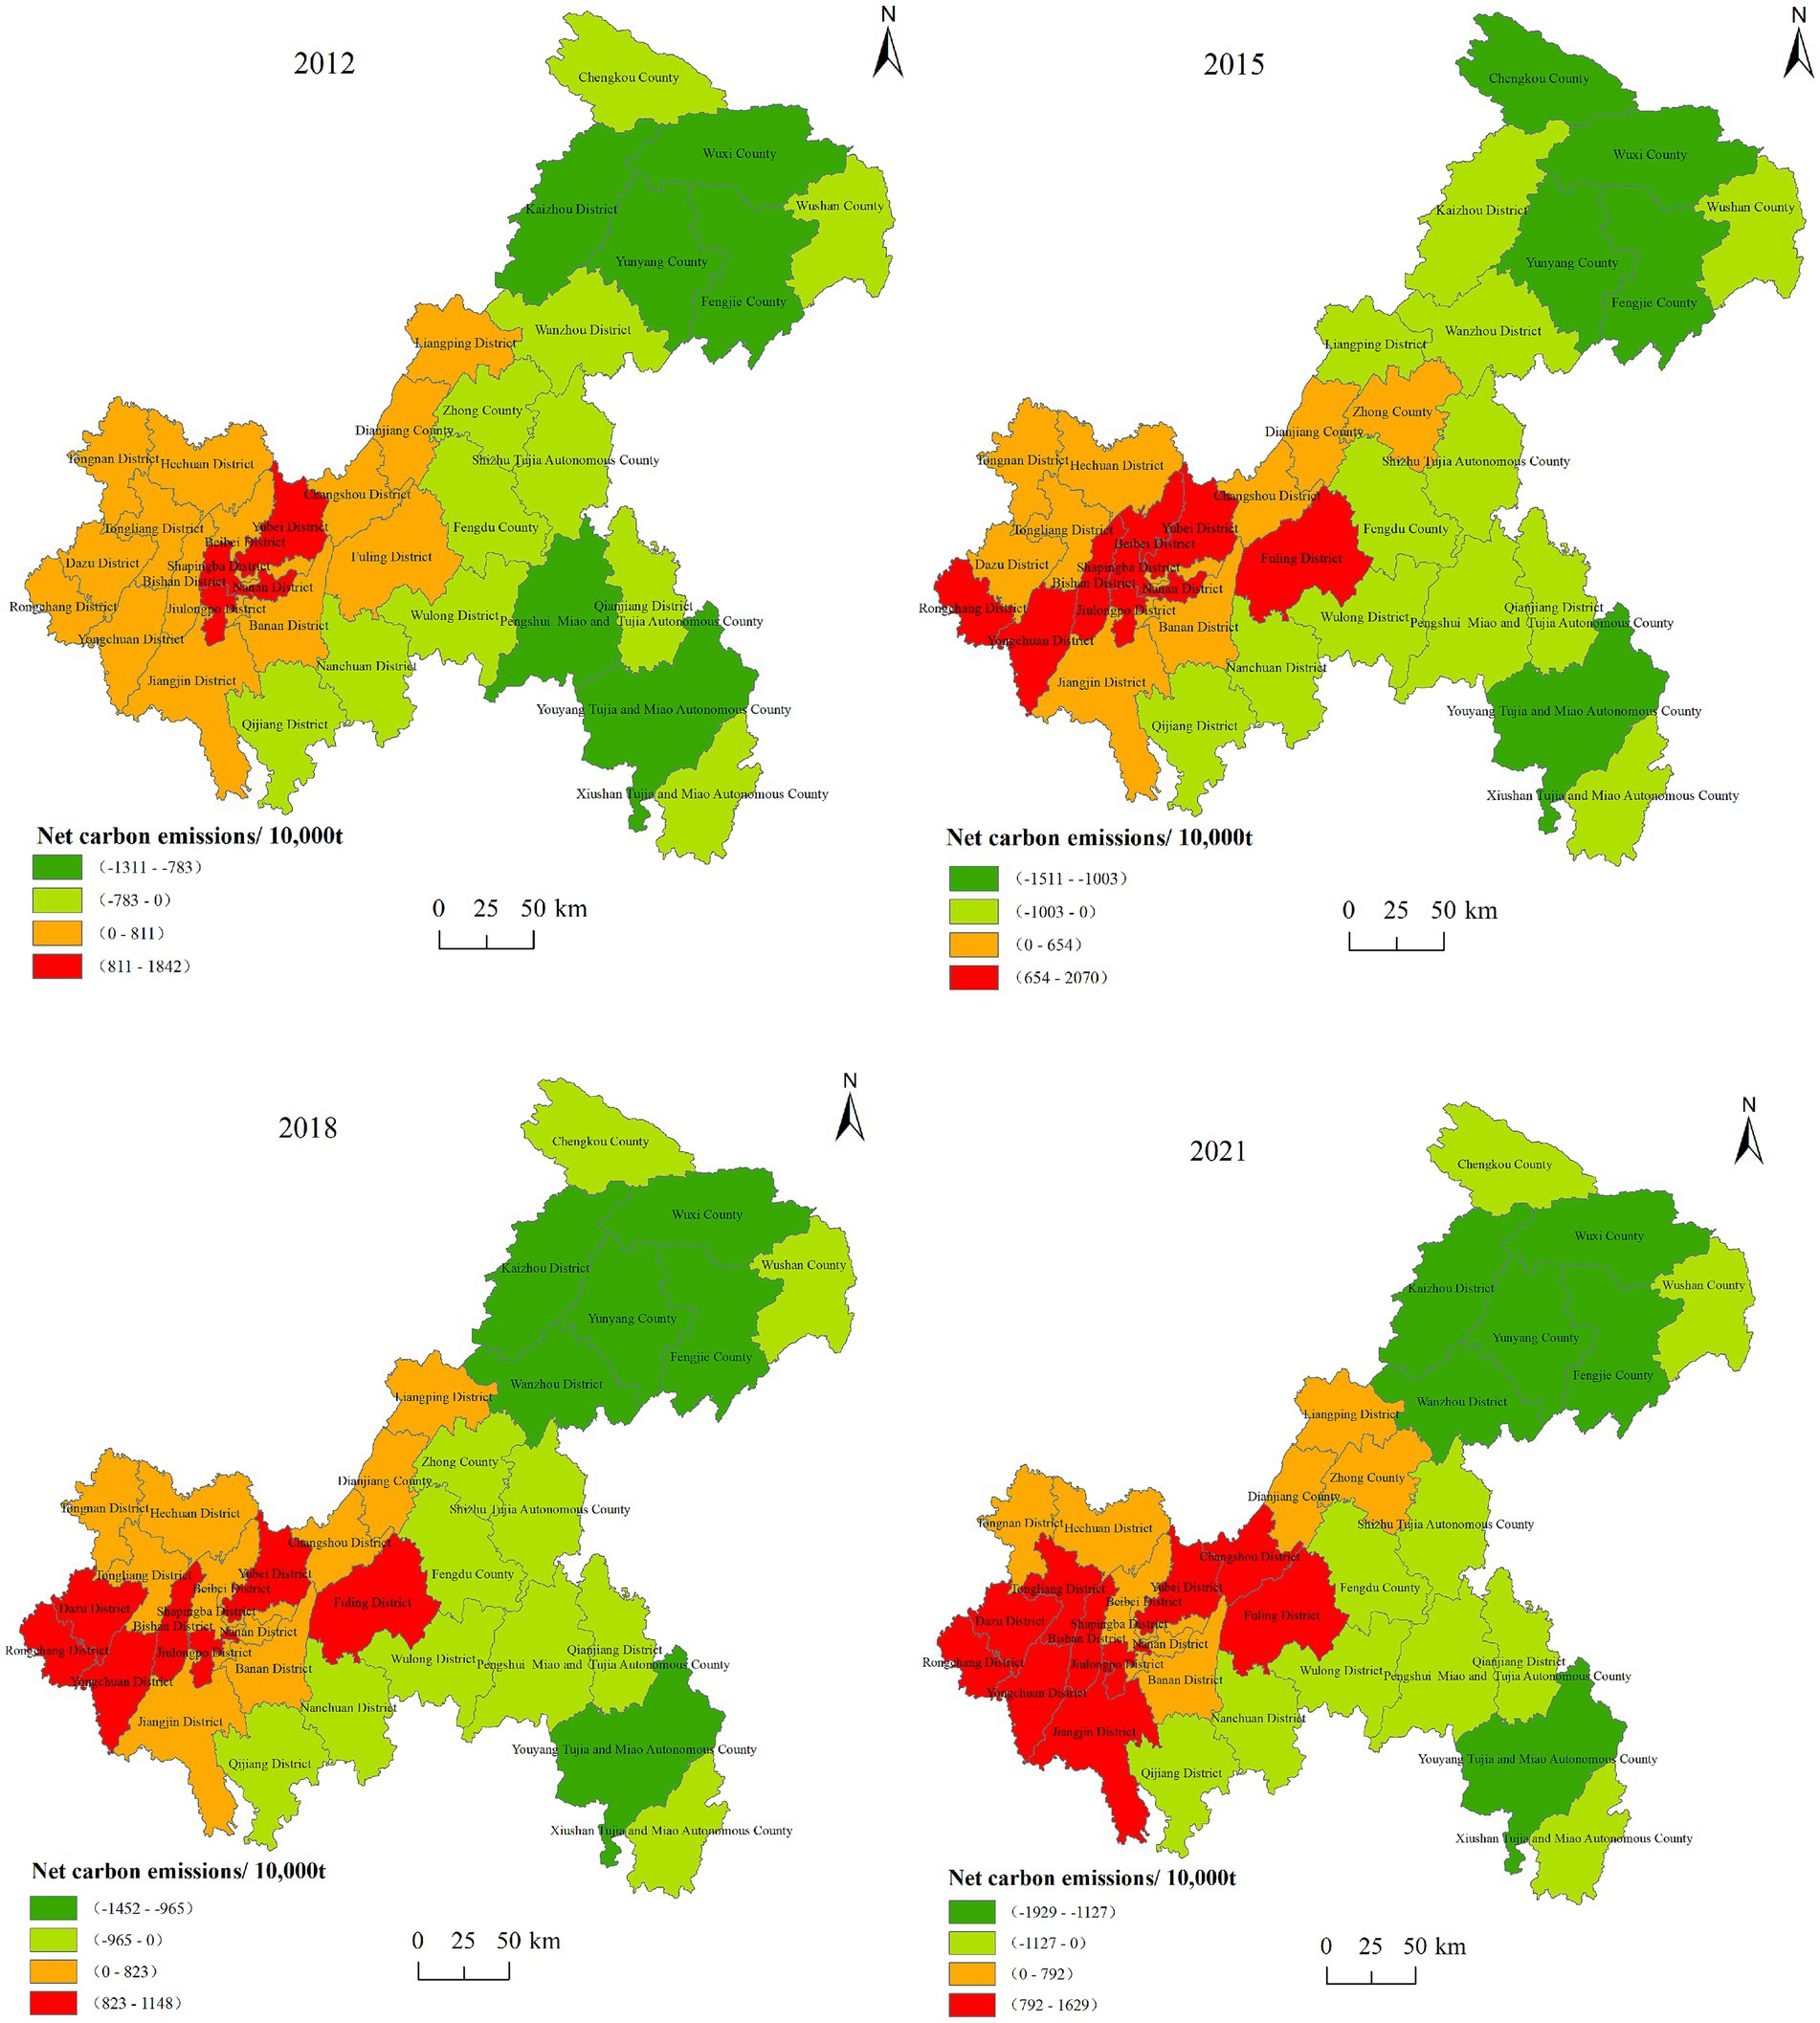
Figure 2. Spatial distribution of net carbon emissions in each districts and counties in Chongqing. The dark green and light green areas represent regions with negative net carbon emissions, indicating forest horizontal ecological compensation acceptance areas. The deeper the green degree, the stronger the carbon surplus capacity of the region. The yellow and red areas represent regions with positive net carbon emissions, which are designated as ecological payment areas. The yellow areas indicate that carbon emissions slightly exceed carbon sequestration, while the red areas indicate that carbon emissions substantially exceed the sequestration capacity.
As shown in Figure 2, the compensation responsibilities of most districts and counties remained unchanged from 2012 to 2021, with only a few experiencing shifts. For example, the compensation responsibilities of Liangping District and Zhong County changed during this period. Liangping District transitioned from a payment area to a acceptance area in 2015, but reverted back to a payment area in 2018 and 2021. Zhong County changed from a acceptance area to a payment area from 2012 and was classified as a payment area again in 2021. In 2021, among the 38 districts and counties in Chongqing, 16 were identified as acceptance areas eligible for receiving compensation funds, while 22 were classified as payment areas responsible for paying compensation amounts. Chongqing’s net carbon emissions from 2012 to 2021 exhibited an overall upward trend, increasing from 14.16 million tons to 24.34 million tons. In terms of districts and counties, Wanzhou District, Kaizhou District, Yunyang County, Xiushan Tujia and Miao Autonomous County (hereinafter referred to as Xiushan County), Fengjie County, Wuxi County, Youyang County, and Pengshui County had a large total carbon surplus in forest land. In contrast, Fuling District, Jiulongpo District, Changshou District, Yongchuan District, and Rongchang District had significant carbon deficits. As shown in Figure 2, the spatial distribution of net carbon emissions is highly consistent with the spatial distribution of carbon sequestration. High carbon surplus areas are primarily distributed in the northeastern ecological conservation and development area of Chongqing. Wuxi County, Fengjie County, Yunyang County, and other counties have abundant forest resources and strong carbon sequestration capacities. Conversely, high carbon deficit areas are concentrated in the western metropolitan core areas of Chongqing, including Yubei District, Fuling District, and Jiulongpo District, characterized by high population density, large construction land and total carbon emissions, coupled with weaker carbon sequestration capabilities. From the perspective of spatial distribution changes, the spatial distribution of carbon deficit and surplus areas in Chongqing has remained relatively stable from 2012 to 2021, although there was a noticeable trend of expanding carbon surpluses and diminishing carbon deficits, which may be caused by the national ecological civilization construction and industrial transformation and upgrading under the dual carbon goals.
3.2 Standard calculation of forest horizontal ecological compensation in Chongqing
The economic development of various districts and counties in Chongqing City is imbalanced, leading to a mismatch between forest ecological carrying capacity and regional economies, as well as discrepancies in carbon supply and demand, which indicates that the ecological compensation standards of various districts and counties should be different. Based on the transaction prices in Chongqing’s carbon trading market, the forest horizontal ecological compensation standards in each district and county were calculated for the years 2012, 2015, 2018, and 2021 using Equations 15–17, clarifying the extent of compensation responsibilities for each district and county (Table 1).
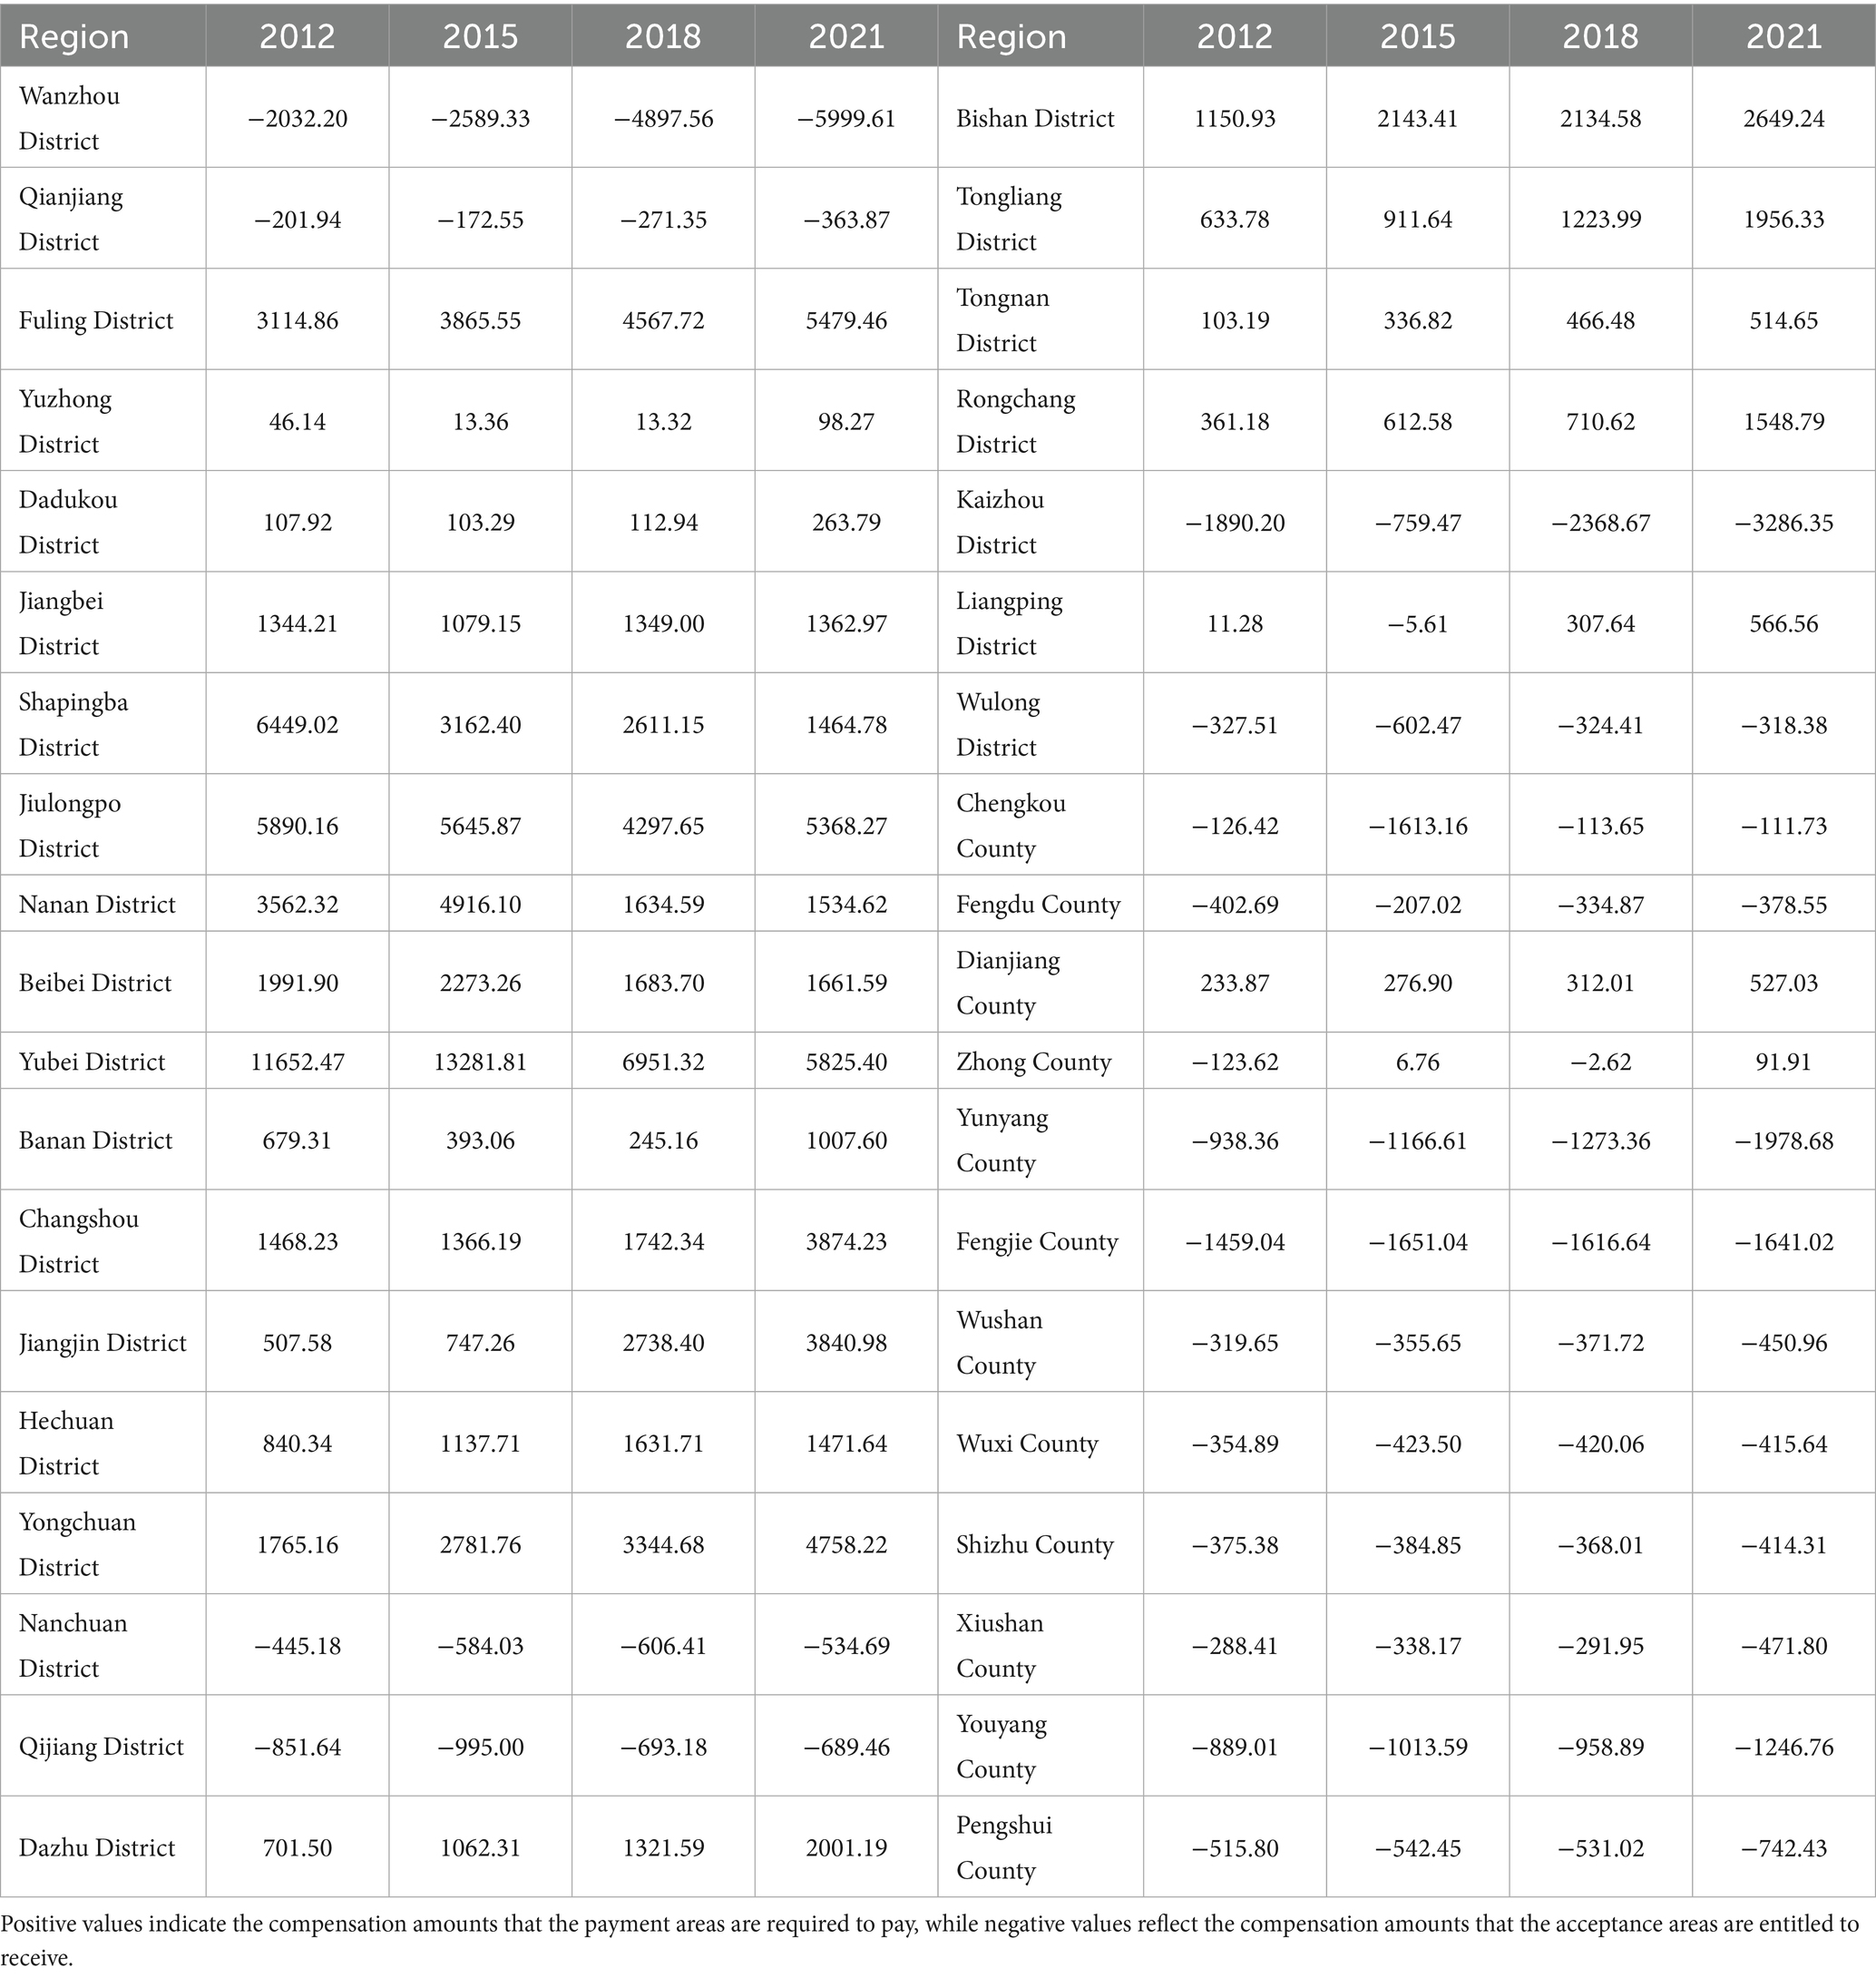
Table 1. Forest horizontal ecological compensation standards in each district and county of Chongqing from 2012 to 2021.
3.2.1 Temporal and spatial changes of forest ecological compensation standards in each district and county
From the perspective of changes in payment standards in forest ecological payment areas, the forest ecological compensation amounts paid in Chongqing showed a fluctuating upward trend from 2012 to 2021. During this period, the number of districts and counties responsible for forest ecological payments in Chongqing remained relatively stable, decreasing from 17 to 16. However, the compensation amount in 2021 increased by 12.32% compared with 2012, with an average annual growth of 1.37%. In 2018, the total amount of forest ecological compensation reached 394.01 million yuan, a decrease of 14.56% compared with 2015, which was caused by the reduction of compensation amount to be paid in some areas with large carbon deficit, such as Nan ‘an District, Shapingba District and Yubei District, indicating that the carbon emissions of these districts and counties have been optimized to a certain extent. From 2012 to 2021, the highest compensation amount was consistently for Yubei District, but the payment amount showed an overall trend of first increasing and then decreasing. The payment amount in 2021 reached 58.25 million yuan, which was a 50.01% reduction compared to 2012. As of the end of 2021, Yubei District had established 3 national-level green factories and built 28 municipal-level digital workshops, indicating that it relied on the advantages of economic development to actively promote technological innovation for a long time and reduce carbon emissions. From the perspective of changes in the compensation standards for forest ecological protection areas, the number of districts and counties receiving forest horizontal ecological compensation remained relatively stable. Only a few counties and districts, such as Zhong County and Liangping District, saw changes in their compensation responsibilities, shifting from payment area to acceptance area, or vice versa. The total compensation amount showed a steady increase. In 2021, the total compensation amount reached 19.04 million yuan, a 65% increase compared to 2012. This growth was primarily due to the significant ecological advantages of certain districts, such as Youyang County and Xiushan County, where the forest area continuously expanded, carbon sequestration capacity gradually increased, and more carbon surpluses became available for trading. Among them, the district with the highest compensation amount from 2012 to 2021 was Wanzhou District, with the amount of compensation increasing from 20.32 million yuan in 2012 to 60.00 million yuan in 2021, an increase of more than 195.23%.
According to the positive or negative compensation amount and the natural breakpoint method in ArcGIS, the compensation standards of each district and county in Chongqing from 2012 to 2021 were classified into six categories (Figure 3). From 2012 to 2021, the spatial pattern of forest horizontal ecological compensation in various districts and counties in Chongqing was basically stable, showing an overall spatial pattern of “southwest compensates the eastern regions,” but there would be certain changes in some areas (Figure 3). Among them, Wanzhou District, Kaizhou District, Fengjie County, etc. in the northeastern region rank among the top in Chongqing City in terms of compensation amount. The southeastern region also plays a crucial role in ecological protection, but due to its relatively underdeveloped economic status and lower carbon emission economic efficiency, its allowed carbon emission quota was reduced after model adjustments, leading to lower compensation funds compared to those in the northeastern region of Chongqing. This differentiated compensation strategy helps to balance the relationship between economic development and ecological protection, ensuring that each district and county can receive reasonable compensation based on its specific circumstances within the ecological compensation mechanism. It is worth noting that Zhong County experienced significant changes in its compensation responsibilities from 2012 to 2021. It transitioned from an ecological acceptance area in 2012 to an ecological payment area in 2015, and then back to an ecological acceptance area in 2018.
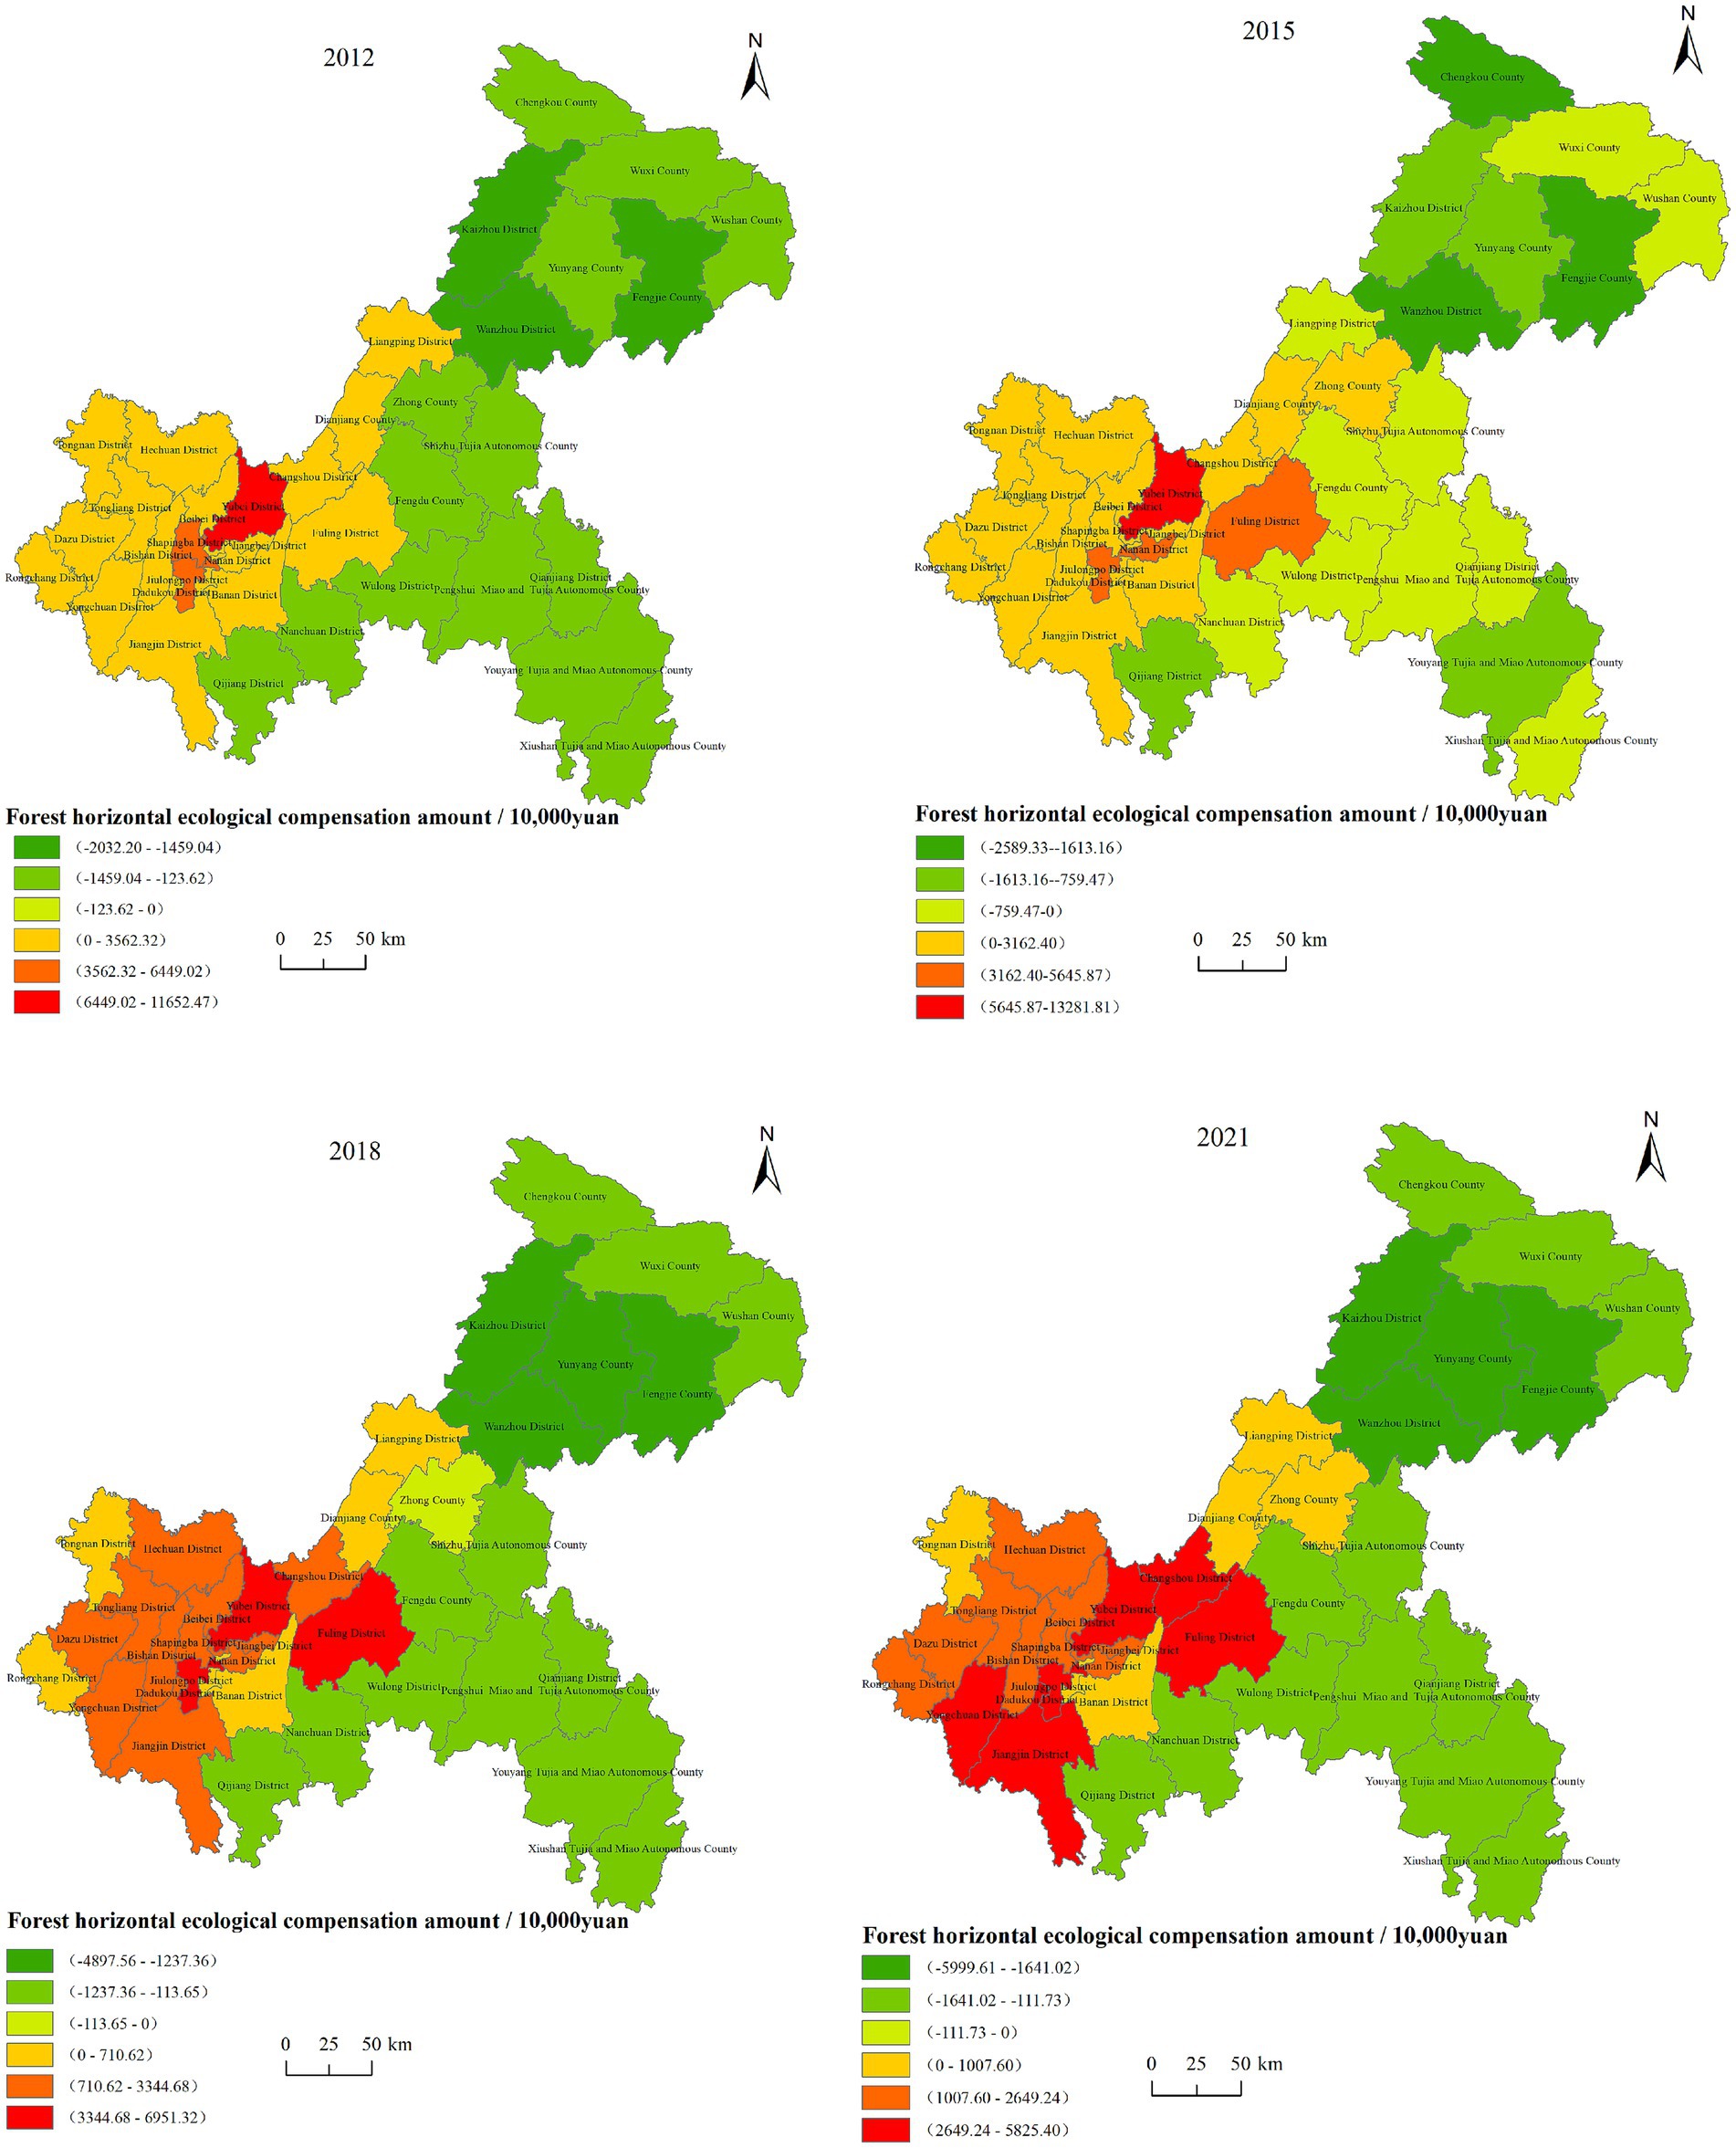
Figure 3. Distribution of forest horizontal ecological compensation amount in the counties of Chongqing. The green indicates the acceptance areas. The darker the green color, the higher the compensation amount. The yellow, orange and red areas represent the payment areas, where the color gradient from yellow to red reflects an increasing amount of compensation to be paid.
3.2.2 Priority of forest horizontal ecological compensation
According to Equation 17, The priority index for each forest ecological payment area in Chongqing City from 2012 to 2021 was calculated. The areas were then classified using the natural breaks method into three categories: priority payment areas, secondary payment areas, and potential payment areas (Figure 4). As shown in Figure 4, priority payment areas mainly included Yuzhong District, Dadukou District, Tongnan District, Dianjiang County, Banan District, etc. These areas had relatively high carbon emissions, but the carbon sequestration capacity of forest lands helped mitigate the pressure from these emissions. The proportion of forest horizontal ecological compensation payments relative to their GDP was small, which meant the impact on regional economic development was minimal. Therefore, these areas should be prioritized for payment. From 2012 to 2021, the priority payment areas gradually developed from contiguous distribution in 2012 to dispersed distribution in 2021, with the number of priority payment areas gradually decreased. In 2012, the secondary payment areas included Changshou District, Fuling District, Beibei District, Bishan District, and Yongchuan District. In 2021, the secondary payment areas included Rongchang District, Dazu District, Tongliang District, Beibei District, Yubei District, and Nan’an District, which were mainly concentrated in the western part of Chongqing. These regions had relatively high carbon emissions and a significant carbon deficit, but their economic development was relatively strong, providing them with sufficient economic capacity to pay the compensation funds. The potential payment areas mainly included Yongchuan District, Jiangjin District, Jiulongpo District, etc. These areas, which were originally scattered in the southwest, gradually formed a block distribution. These areas had relatively high carbon emissions, but weak carbon absorption capacity, making it difficult to achieve a balance between carbon emissions and carbon sequestration. Additionally, these areas were economically underdeveloped, with a high ratio of required compensation funds to their GDP and limited capacity to bear the compensation burden. Therefore, these areas should be the last to pay compensation funds.
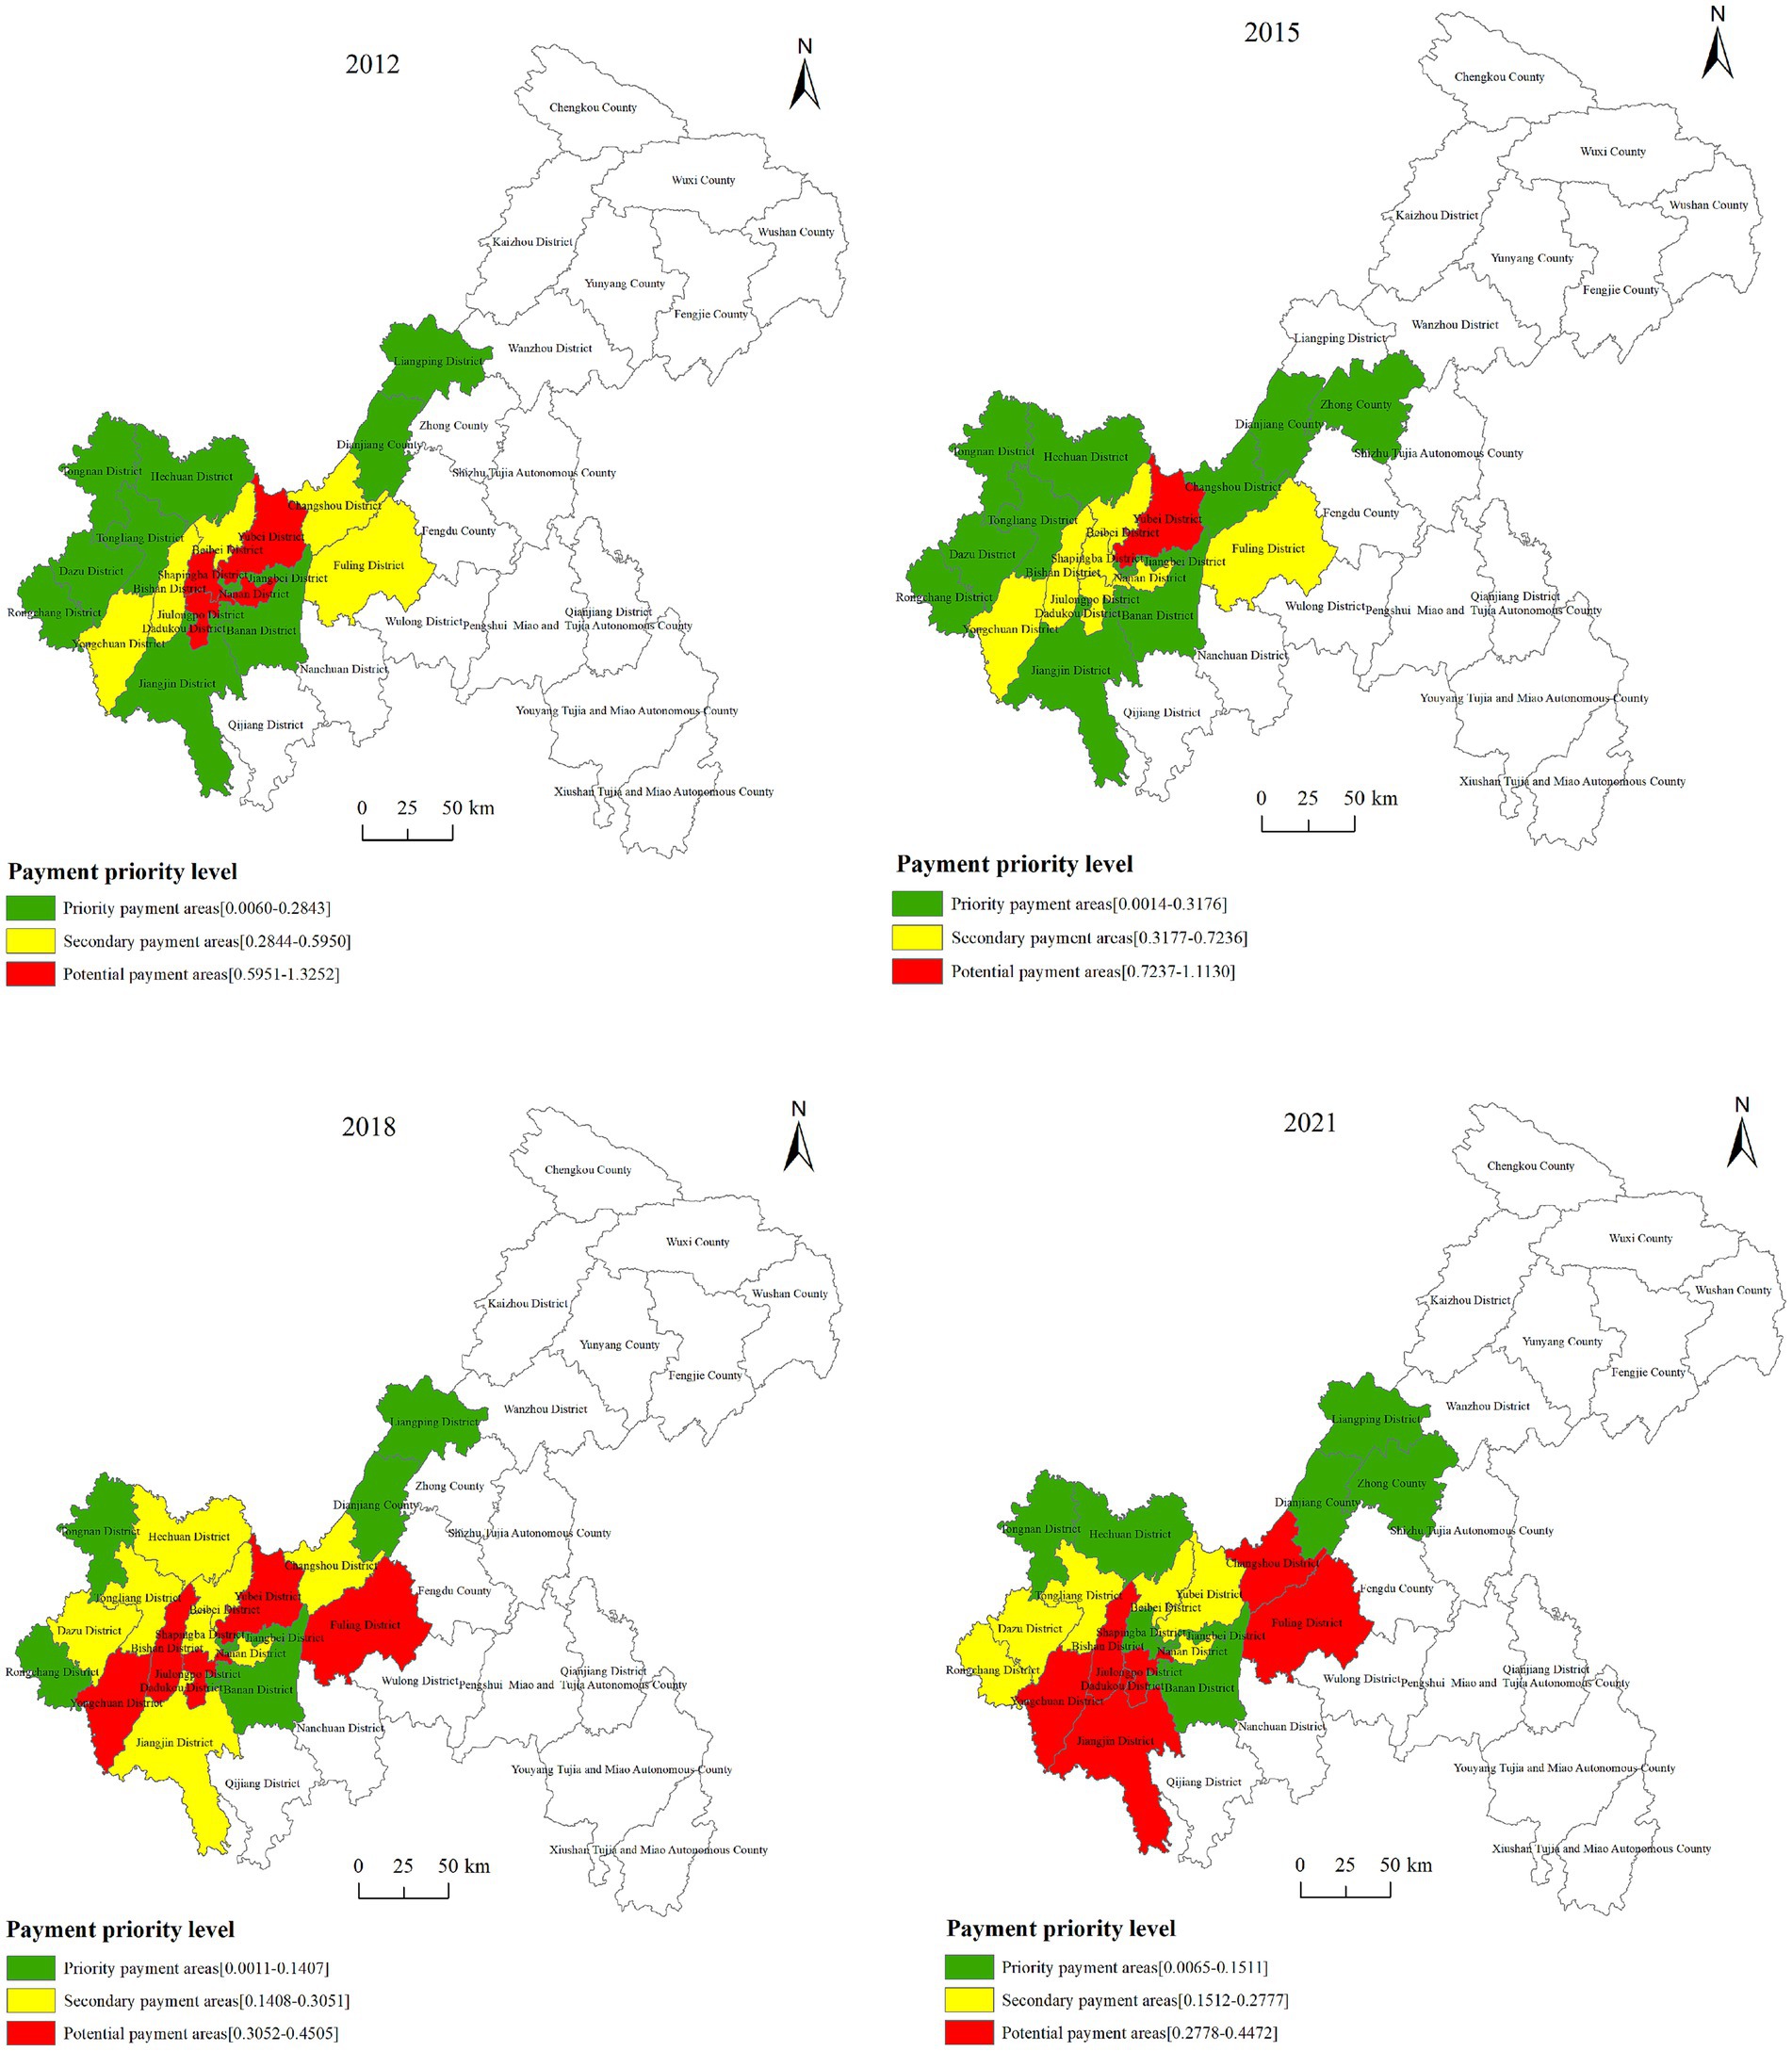
Figure 4. Priority distribution of payment areas for forest horizontal ecological compensation in the counties of Chongqing.
According to Equation 17, the priority index of each forest ecological acceptance area in Chongqing from 2012 to 2021 was obtained. Subsequently, ArcGIS software was utilized to classify these areas based on the natural breaks method into three categories: priority acceptance areas, secondary acceptance areas, and potential acceptance areas, with a corresponding spatial distribution map drawn (Figure 5). The acceptance priority index for areas such as Kaizhou District, Wulong District, Qijiang District, and Fengjie County fluctuated significantly, which may be related to the economic development levels and changes in forest ecological service functions in these regions. As shown from Figure 5, priority acceptance areas were primarily located in the northeastern region of Chongqing, most of which belong to national key ecological function areas and major agricultural production areas, with abundant forest resources and slow economic development. Compensation funds play a greater role in alleviating economic losses caused by forest protection, and should be compensated first. The number of secondary acceptance areas have been reduced from 9 districts and counties in 2012 to 5 districts and counties in 2021, which were mainly sparsely distributed in the eastern region of Chongqing. Shizhu County and Pengshui County in the southeastern region, as well as Yunyang County, Wushan County, and Wuxi County in the northeastern region, are part of Chongqing’s key national ecological function zones. The number of potential acceptance areas has gradually increased from 2 districts and counties in 2012 to 7 districts and counties in 2021, most of which were located in the southwestern region of Chongqing, such as Qijiang District, Nanchuan District, Wulong District, Fengdu County, etc.
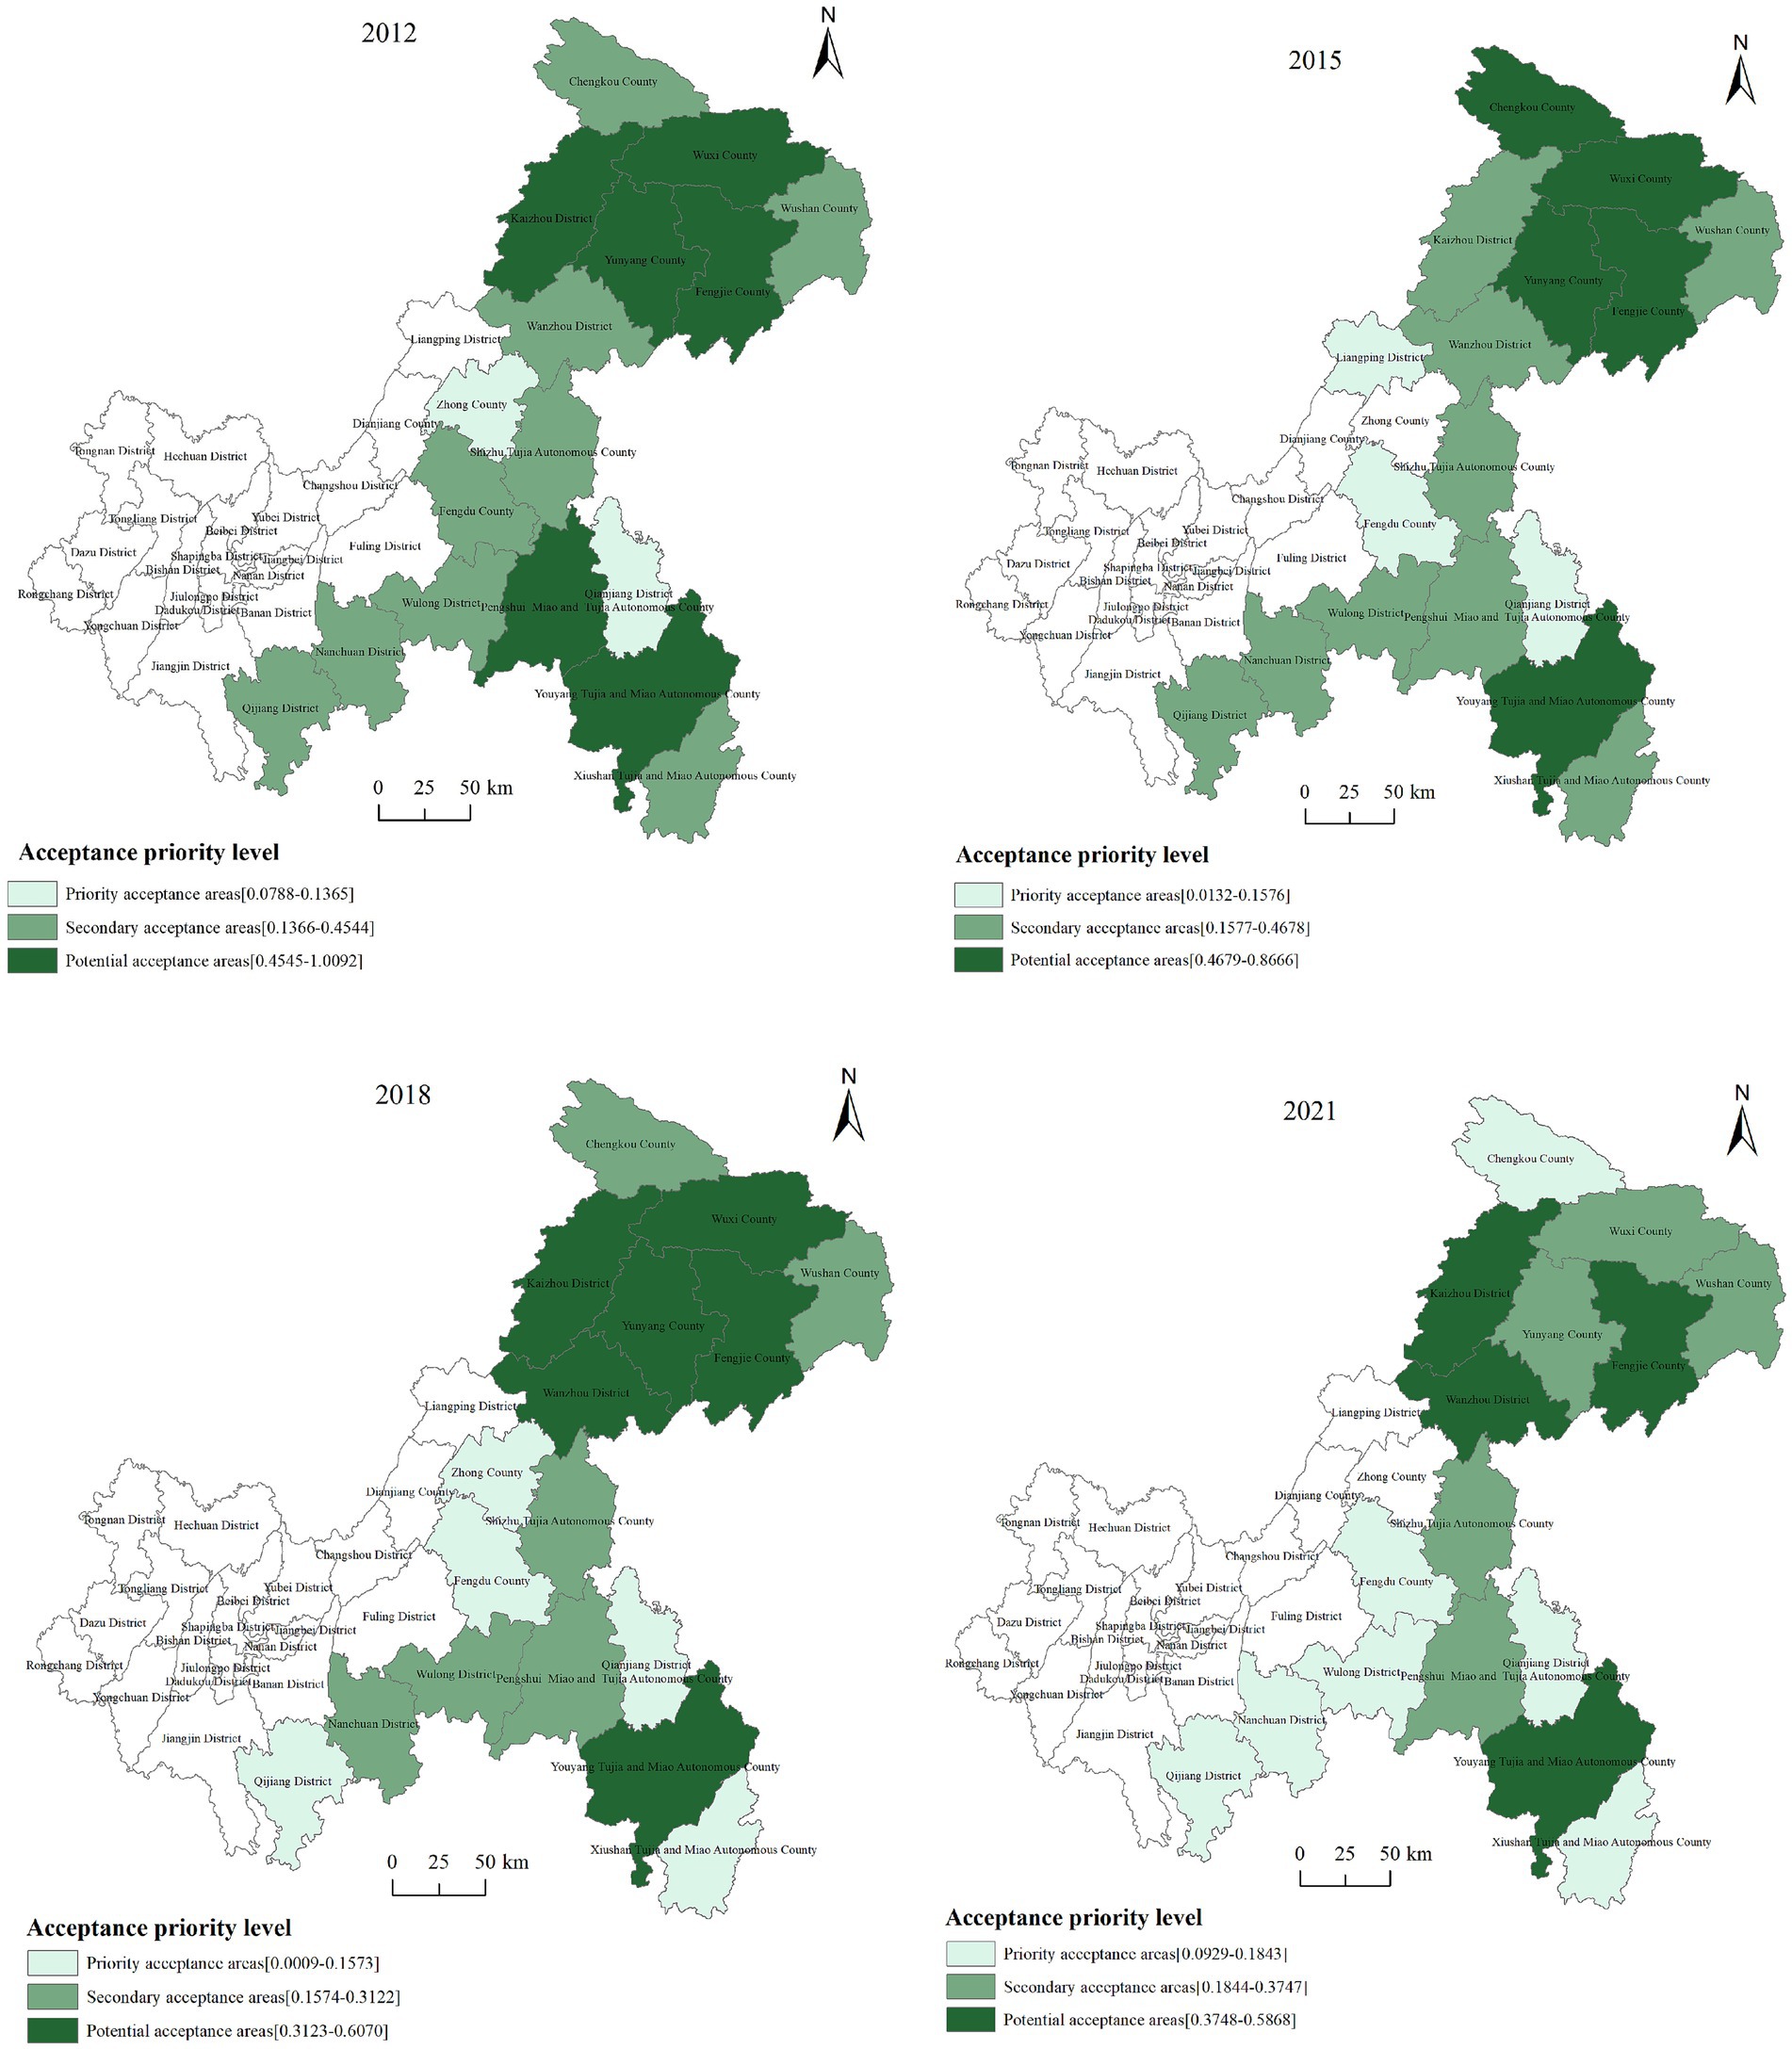
Figure 5. Priority distribution of acceptance areas for forest horizontal ecological compensation in the counties of Chongqing.
4 Discussion
This study examined the net carbon emissions and corresponding forest horizontal ecological compensation standards across all districts and counties in Chongqing. The results show that energy-related carbon emissions were the dominant source, which may be associated with the increased energy demand driven by rapid economic growth and accelerated industrialization. In contrast, forest land accounted for the largest share of carbon sequestration due to Chongqing’s abundant forest resources and strong carbon sink capacity. From the perspective of adjusted net carbon emissions, districts such as Wanzhou District and Kaizhou District exhibited considerable carbon surpluses. Despite high total emissions, their large populations, economic output, and abundant forest resources resulted in high carbon emission efficiency and elevated emission thresholds. Similarly, less industrialized counties such as Yunyang County, Fengjie County, Wuxi County, Youyang County, and Pengshui County are rich in forest resources. Since the launch of large-scale land greening initiatives in Chongqing in 2018, forest areas in these counties have expanded, leading to strong sequestration capacity and surplus status. In contrast, districts such as Fuling, Jiulongpo District, Changshou District, Yongchuan District, and Rongchang District experienced high emission intensity but lacked sufficient forest cover, resulting in weak carbon sinks and significant carbon deficits. These areas consequently bore greater ecological compensation responsibilities. Some districts and counties located in the southwestern of Chongqing, such as Yubei District, Shapingba District and Jiulongpo District, needed to pay higher forest ecological compensation funds. This is due to the rapid economic development in these districts, where industrialization and urbanization inevitably lead to higher carbon emissions, along with significant consumption and demand for environmental resources from enterprises and residents. Relatively speaking, the northeast and southeast regions of Chongqing, as important ecological protection regions of Chongqing, have rich forest resources, good ecological environment, strong forest carbon sink function, and significant contribution to ecological protection, so they should get higher compensation funds. The priority index of some forest ecological payment districts and counties in Chongqing fluctuated greatly from 2012 to 2021, such as Yubei District, Shapingba District, Jiulongpo District, and Nan’an District, which may be related to the economic development speed, ecological protection measures, and changes in regional development planning in these areas. Among the classified compensation acceptance areas, secondary acceptance regions are rich in forest resources and focus on biodiversity protection (Huang et al., 2024; Wang L. et al., 2023; Wang T. et al., 2023), particularly in the Three Gorges Reservoir area. Policy efforts should ensure adequate support to sustain their ecological functions. Potential acceptance areas, with limited carbon surpluses and minimal economic sacrifice, exhibit a relatively balanced ecological–economic relationship. In response, this study proposes the following recommendations: First, high carbon intensity regions should reduce emissions by optimizing the energy structure, promoting the application of green and low-carbon technologies, and improving industrial energy efficiency. Second, efforts should be made to strengthen ecological restoration and improve forest quality in order to enhance the carbon sequestration capacity of forest ecosystems. Finally, a differentiated compensation standard system should be established based on net carbon emissions, forest carbon sequestration capacity, and regional economic development levels.
Chongqing has explored optimization schemes for forest horizontal ecological compensation mechanism, utilizing forest coverage rate as a transaction indicator. Some scholars have conducted research on this policy. For instance, Zhang et al., based on the forest coverage rate targets identified 14 pairs of compensation subjects and recipients according to supply and demand levels, paired assistance relationships, locational relationships, and government purchasing willingness in the districts and counties of Chongqing (Zhang et al., 2023). However, they overlooked whether the forest coverage rate target was reasonable. Simply dividing compensation areas based on the forest coverage rate target may lead to local governments blindly pursuing forest quantity, neglecting improvements in forest quality and management. Therefore, the forest horizontal ecological compensation zoning should consider not only the quantity of forests but also their ecological value, ecosystem services, and supply–demand balance. This study explores the scientific basis for zoning and calculating compensation standards for forest horizontal ecological compensation from the perspective of carbon budget, providing references for policy formulation by relevant government departments in Chongqing and other regions. However, in the calculation of carbon emission and carbon sequestration, this study referred to the carbon emission and sequestration coefficient of relevant results without considering the impact of forest type, forest age structure and climate change in different regions of Chongqing on forest carbon sequestration capacity. In the future, the carbon budget accounting model should be further optimized, and the accuracy of coefficients should be improved by integrating remote sensing data and forest inventory information, so as to enhance the accuracy and scientific validity of carbon emission and carbon sequestration accounting. In addition, forests not only provide ecological services related to carbon sequestration and oxygen release but also fulfill other vital ecological functions such as water conservation, air purification, and biodiversity protection. This study discusses the formulation and optimization of forest ecological compensation zoning and compensation standards solely from the perspective of carbon budget, without considering other ecological service functions and ecological supply and demand. As a result, the calculated forest horizontal ecological compensation standards may be lower than their actual compensation standards. Future research should take into account the diversity of forest ecosystem service functions, combine advanced technical methods such as geographic remote sensing technology and modern science and technology, and consider exploring the optimization of forest horizontal ecological compensation from multiple aspects.
5 Conclusion
The implementation of forest horizontal ecological compensation policies requires a scientifically viable distribution of responsibilities and accurate calculation of compensation standards. In this study, we have determined compensation responsibilities of each district and county based on adjusted net carbon emissions. Furthermore, we have estimated appropriate standards for forest horizontal ecological compensation by considering carbon sequestration market price, regional economic development levels, and payment capacities. Additionally, we have established a sequential approach to payment and acceptance for forest horizontal ecological compensation in Chongqing. The following conclusions are as follows:
(1) From 2012 to 2021, Chongqing experienced an overall carbon imbalance as the total carbon emissions exceeded carbon sequestration. Energy carbon emissions constituted a massive portion of these emissions and forest land played a dominant role in carbon sequestration. In terms of spatial distribution, there were notable disparities in carbon budget among different districts and counties, with a spatial pattern of “low in the southwest and high in the east” observed for carbon sequestration, closely aligned with the distribution of forest coverage rate. Conversely, the spatial distribution of carbon emissions exhibited an opposite trend characterized by a “high in the southwest and low in the east” pattern.
(2) From the perspectives of practical feasibility and fairness, adjustments to carbon emissions are made by incorporating carbon emission intensity and regional resource endowments. The adjusted net carbon emissions classify the 38 districts and counties of Chongqing into forest ecological payment areas and ecological acceptance areas. From 2012 to 2021, there were minor changes in the distribution of ecological payment areas and ecological acceptance areas. The payment areas primarily concentrate in the core economic development zones of the southwestern region with higher levels of economic development, while the acceptance areas are located in economically underdeveloped eastern regions that are rich in forest resources.
(3) By calculating the compensation amount that each district and county should pay or receive based on net carbon emissions and carbon prices, and considering the contribution of each district’s economic development to Chongqing’s overall economy, the compensation standards were adjusted according to regional economic development levels and payment capacities, ensuring fair development across districts. In 2021, the total compensation amount to be paid for the forest ecological payment regions in Chongqing was 478.68 million yuan, an increase of 12.32% compared to 2012. In 2021, the total compensation amount to be received by the forest ecological compensation regions in Chongqing was 190.44 million yuan, a 65% increase compared to 2012. Based on the calculated payment priority index and the acceptance priority index, the priority indexes for the forest ecological acceptance regions and ecological payment regions underwent significant changes from 2012 to 2021, with considerable differences in the priority classification lists.
Data availability statement
The original contributions presented in the study are included in the article/Supplementary material, further inquiries can be directed to the corresponding author.
Author contributions
HY: Data curation, Formal analysis, Investigation, Methodology, Software, Visualization, Writing – original draft. SL: Writing – review & editing. JY: Conceptualization, Supervision, Validation, Writing – review & editing.
Funding
The author(s) declare that financial support was received for the research and/or publication of this article. This research was funded by the National Social Science Fund of China (grant number 20BGL171).
Conflict of interest
The authors declare that the research was conducted in the absence of any commercial or financial relationships that could be construed as a potential conflict of interest.
Generative AI statement
The authors declare that no Gen AI was used in the creation of this manuscript.
Publisher’s note
All claims expressed in this article are solely those of the authors and do not necessarily represent those of their affiliated organizations, or those of the publisher, the editors and the reviewers. Any product that may be evaluated in this article, or claim that may be made by its manufacturer, is not guaranteed or endorsed by the publisher.
Supplementary material
The Supplementary material for this article can be found online at: https://www.frontiersin.org/articles/10.3389/fsufs.2025.1580737/full#supplementary-material
Footnotes
References
Brockerhoff, E. G., Barbaro, L., Castagneyrol, B., Forrester, D. I., Gardiner, B., González-Olabarria, J. R., et al. (2017). Forest biodiversity, ecosystem functioning and the provision of ecosystem services. Biodivers. Conserv. 26, 3005–3035. doi: 10.1007/s10531-017-1453-2
Chen, R., and Jiang, Z. D. (2018). Transverse space ecological compensation of low-carbon agriculture in China. China Popul. Resour. Environ. 28, 87–97. doi: 10.12062/cpre.20170906
Deng, H. B., Zheng, P., Liu, T. X., and Liu, X. (2011). Forest ecosystem services and eco-compensation mechanisms in China. Environ. Manag. 48, 1079–1085. doi: 10.1007/s00267-011-9742-0
Espinoza, V., Waliser, D. E., Guan, B., Lavers, D. A., and Ralph, F. M. (2018). Global analysis of climate change projection effects on atmospheric Rivers. Geophys. Res. Lett. 45, 4299–4308. doi: 10.1029/2017GL076968
Fang, J. Y., Chen, A., Peng, C., Zhao, S., and Ci, L. (2001). Changes in forest biomass carbon storage in China between 1949 and 1998. Science 292, 2320–2322. doi: 10.1126/science.1058629
Fang, J. Y., Guo, Z. D., Piao, S. L., and Chen, A. P. (2007). Estimation of terrestrial vegetation carbon sequestration in China from 1981 to 2000. Sci. China Earth Sci. 50, 1341–1350. doi: 10.1007/s11430-007-0049-1
Hepburn, C., Qi, Y., Stern, N., Ward, B., Xie, C., and Zenghelis, D. (2021). Towards carbon neutrality and China's 14th five-year plan: clean energy transition, sus-tainable urban development, and investment priorities. Environ. Sci. Ecotechnol. 8:100130. doi: 10.1016/j.ese.2021.100130
Huang, H. Y., Gong, Z. W., Chen, X. J., Huo, R., and Wang, Q. Q. (2024). Identification of priority areas for carbon compensation in Chongqing based on the difference in land use carbon budget. Environ. Sci. 45, 5027–5039. doi: 10.13227/j.hjkx.202309069
Jack, B. K., Kousky, C., and Sims, K. R. E. (2008). Designing payments for ecosystem services: lessons from previous experience with incentive-based mechanisms. Proc. Natl. Acad. Sci. 105, 9465–9470. doi: 10.1073/pnas.0705503104
Jiang, Y. Q. (2018). Research on Forest ecological compensation mechanism of Hunhe River basin. Shenyang: Shenyang Agricultural University.
Jing, X. D., Tian, G. L., Li, M. R., and Javeed, S. A. (2021). Research on the spatial and temporal differences of China's provincial carbon emissions and ecological compensation based on land carbon budget accounting. Int. J. Environ. Res. Public Health 18:12892. doi: 10.3390/ijerph182412892
Keenan, T. F., and Williams, C. A. (2018). The terrestrial carbon sink. Annu. Rev. Environ. Resour. 43, 219–243. doi: 10.1146/annurev-environ-102017-030204
Kong, F. B., Cao, L. D., and Xu, C. Y. (2023). Measurement of carbon budget and type partition of carbon comprehensive compensation in the Qiantang River basin. Econ. Geogr. 43, 150–161. doi: 10.15957/j.cnki.jjdl.2023.03.016
Latta, G. S., Adams, D. M., Bell, K. P., and Kline, J. D. (2016). Evaluating land-use and private forest management responses to a potential forest carbon offset sales program in western Oregon (USA). Forest Policy Econ. 65, 1–8. doi: 10.1016/j.forpol.2016.01.004
Li, L., Dong, J., Xu, L., and Zhang, J. F. (2019). Spatial variation of land use carbon budget and carbon compensation zoning in functional areas: a case study of Wuhan urban agglomeration. J. Nat. Resour. 34, 1003–1015. doi: 10.31497/zrzyxb.20190508
Li, L., Xia, Q. Y., Dong, J., et al. (2023). County-level carbon ecological compensation of Wuhan urban agglomeration under carbon neutrality target: based on the difference in land use carbon budget. Acta Ecol. Sin. 43, 2627–2639. doi: 10.5846/stxb202204130976
Liao, W. M., Jiang, L. W., Zou, J. M., Wang, Z. P., Qiu, H. L., Sun, S. E., et al. (2024). Spatial differentiation and functional zoning of carbon budget: evidence from Jiangxi Province. Front. Environ. Sci. 12:1404760. doi: 10.3389/fenvs.2024.1404760
Lin, Y. S., Guo, Z. X., Zheng, Y. M., Zhang, L. R., and Huang, H. B. (2019). Net horizontal payments for ecosystem services: an application in the Bei-jing-Tianjin-Hebei region of China. J. Resour. Ecol. 10, 63–68. doi: 10.5814/j.issn.1674-764x.2019.01.008
Liu, G. M. (2007). Beijing-Tianjin-Hebei: interregional ecological compensation promotes regional coordination. Environ. Econ. 12, 35–39. doi: 10.3969/j.issn.1672-724X.2007.12.009
Liu, X. J., Wei, Y. P., Jin, X. B., Luo, X. L., and Zhou, Y. K. (2024). County-level carbon compensation zoning based on China's major function-oriented zones. J. Environ. Manag. 367:121988. doi: 10.1016/j.jenvman.2024.121988
Mohan, R. R. (2018). Time series GHG emission estimates for residential, commercial, agriculture and fisheries sectors in India. Atmos. Environ. 178, 73–79. doi: 10.1016/j.atmosenv.2018.01.029
Nie, C. J., and Cheng, M. L. (2019). Research on regional lateral forest ecological compensation based on the theory of marginal effect-- taking Beijing and Zhang Cheng district of Hebei province as examples. For. Econ. 41, 24–31+40. doi: 10.13843/j.cnki.lyjj.2019.01.002
Shen, X., Liu, B., Jiang, M., and Lu, X. (2020). Marshland loss warms local land surface temperature in China. Geophys. Res. Lett. 47:e2020GL087648. doi: 10.1029/2020GL087648
Sheng, W. P., Zhen, L., Xie, G. D., and Xiao, Y. (2017). Determining eco-compensation standards based on the ecosystem services value of the mountain ecological forests in Beijing, China. Ecosyst. Serv. 26, 422–430. doi: 10.1016/j.ecoser.2017.04.016
Tang, Y. X., Wang, R., Ci, H., Wei, J. Y., Yang, H., Teng, J. K., et al. (2024). Analysis of the spatiotemporal evolution of carbon budget and carbon compensation zoning in the Core area of the Yangtze River Delta urban agglomeration. Land 13:747. doi: 10.3390/land13060747
Wan, L. L., Lin, C. X., and Chen, Y. (2020). Temporal and spatial patterns of interprovincial carbon compensation in China based on relative carbon deficit. Resour. Environ. Yangtze Basin 29, 2572–2583. doi: 10.11870/cjlyzyyhj202012002
Wang, L., Faye, B., Li, Q. F., and Li, Y. K. (2023). A Spatio-temporal analysis of the ecological compensation for cultivated land in Northeast China. Land 12:2179. doi: 10.3390/land12122179
Wang, Y. J., Xie, B. G., Li, X. Q., Liao, H. Y., and Wang, J. Y. (2016). Ecological compensation standards and compensation methods of public welfare forest protected area. Chin. J. Appl. Ecol. 27, 1893–1900. doi: 10.13287/j.1001-9332.201606.013
Wang, W. W., Ye, J., Zhang, L. G., et al. (2020). Research on ecological compensation from the perspective of main functional areas: a case study of Hubei Province. Acta Ecol. Sin. 40, 7816–7825. doi: 10.5846/stxb201901090075
Wang, G., Zhang, H. B., Xue, F., et al. (2017). Relations between land use carbon budget and economic development at county level in Chengdu city. J. Nat. Resour. 32, 1170–1182. doi: 10.11849/zrzyxb.20160677
Wang, T., Zhou, Q. G., Mao, Y. F., et al. (2023). Study on ecological compensation zoning and measurement in the three gorges reservoir area based on carbon revenue and expenditure. Res. Soil Water Conserv. 30, 394–403. doi: 10.13869/j.cnki.rswc.2023.04.017
Wu, L. J., and Tian, Q. B. (2022). Study on regional carbon ecological security and ecological compensation in China under carbon neutrali-zation target. Geogr. Res. 41, 149–166. doi: 10.11821/dlyj020210778
Xia, S. Y., and Yang, Y. (2022). Spatio-temporal differentiation of carbon budget and carbon compensation zoning in Beijing-Tianjin-Hebei urban agglomeration based on the plan for major function-oriented zones. Acta Geogr. Sin. 77, 679–696. doi: 10.11821/dlxb202203013
Yang, M. J., Yang, K., Li, G., and Niu, X. D. (2019). The cooperation mechanism of water resources protection in trans-boundary river based on game theory: A case study of the Taipu River in the Taihu Lake Basin. J Nat Resour 34:1232–1244. doi: 10.31497/zrzyxb.20190609
Zeng, D. H., Li, S. P., Wu, Y., et al. (2016). Study on carbon budget imbalance problem in five functional areas of Chongqing and its countermeasures. Econ. Geogr. 36, 152–157. doi: 10.15957/j.cnki.jjdl.2016.08.022
Zhang, C. H., Ju, W. M., Chen, J. M., Zan, M., Li, D. Q., Zhou, Y. L., et al. (2013). China's forest biomass carbon sink based on seven inventories from 1973 to 2008. Clim. Chang. 118, 933–948. doi: 10.1007/s10584-012-0666-3
Zhang, M., Lai, L., Huang, X. J., Chuai, X. W., and Tan, J. Z. (2013). The carbon emission intensity of land use conversion in different regions of China. Resour Sci 35, 792–799.
Zhang, S. C., Liu, J. Y., Ran, L. C., et al. (2023). Cross-country horizontal ecological compensation and supply-demand docking to increase forest coverage: a case study of Chongqing. Acta Ecol. Sin. 43, 4651–4663. doi: 10.5846/stxb202201260252
Zhao, R. Q., Liu, Y., Ma, L., et al. (2016). County-level carbon compensation of Henan Province based on carbon budget estimation. J. Nat. Resour. 31, 1675–1687. doi: 10.11849/zrzyxb.20151291
Zhao, Y., Wu, F. P., Li, F., Chen, X. N., Xu, X., and Shao, Z. Y. (2021). Ecological compensation standard of trans-Boundary River basin based on ecological spillover value: a case study for the Lancang-Mekong River basin. Int. J. Environ. Res. Public Health 18:1251. doi: 10.3390/ijerph18031251
Zhao, L., Zhang, J., Duan, R. Q., and Xu, C. (2023). Development and challenges of China's ecological non-commercial Forest certification policy. Forests 14:214. doi: 10.3390/f14020214
Keywords: forest horizontal ecological compensation, carbon budget, compensation zoning, compensation standards, Chongqing
Citation: Yu H, Li S and Yang J (2025) Responsibility definition and standard calculation of forest horizontal ecological compensation: a case study of Chongqing, China. Front. Sustain. Food Syst. 9:1580737. doi: 10.3389/fsufs.2025.1580737
Edited by:
Anteneh Tesfaye Tekleyohannes, Ethiopian Environment and Forest Research Institute, EthiopiaReviewed by:
Xiangjin Shen, Chinese Academy of Sciences (CAS), ChinaZhaojin Yan, China University of Mining and Technology, China
Copyright © 2025 Yu, Li and Yang. This is an open-access article distributed under the terms of the Creative Commons Attribution License (CC BY). The use, distribution or reproduction in other forums is permitted, provided the original author(s) and the copyright owner(s) are credited and that the original publication in this journal is cited, in accordance with accepted academic practice. No use, distribution or reproduction is permitted which does not comply with these terms.
*Correspondence: Jiameng Yang, eWptQG5qZnUuZWR1LmNu