 Karin Weggler
 Elisabeth Gerster2
- 1Fachbereich Grünlandwirtschaft und Futterbau, Landwirtschaftliches Zentrum Baden Württemberg, Aulendorf, Germany
- 2Fachbereich Bildung und angewandte Forschung, Rinderhaltung, Landwirtschaftliches Zentrum Baden Württemberg, Aulendorf, Germany
Agriculture and the dairy sector in particular are required to reduce greenhousegas (GHG) emissions. Fodder production is the third major source of GHG emission in dairy production. The use of small seeded legumes as major fodder could possibly reduce this source of GHG emissions. Since fodder requirements and fodder production are intertwined we used a modelling approach. The GHG emission of four model dairy farms were analyzed using the “calculation standards for GHG balances for single agricultural farms” (BEK). The farms differed in feeding rations and crop production but contained an equal number of dairy cows with similar milk productivity. The major difference was the source of protein used in the feeding strategy, which was a) rapeseed-extraction meal, b) clover-dominated ley silage c) mixed using both previous elements and d) high yielding clover-dominated leys. The landuse based GHG emissions were markedly reduced in the legume-fodder based compared to oilseed-rape based farms and intermediate for farms with a mixed feeding strategy. These reductions in GHG emissions were distinctly influenced by modelled soil humus-C accumulation. The reductions in landbased GHG emissions due to clover-ley as major fodder were notable, with emissions being decreased by generally 164,544 kg CO2e farm−1 and up to 191,562 kg CO2e farm−1 equal to 70 to 82%, compared to the rapeseed-extraction meal based farm. These substantial landuse based reductions in GHG emissions were close to half the amount arising from enteric fermentation of 100 cows from these model farms. When landuse and animal husbandry based GHG emissions are combined then GHG emission per hectare could be reduced by 36% in the legume dominated compared to the conventional farm. The product based GHG emission for milk production was also markedly reduced by 24–27% equal to 0.19–0.22 kg CO2e ECM−1 using the same comparisons. A clover dominated feeding strategy also reduced the N-purchases of farms but increased land requirement for fodder production and reduced available land for tradeable crops. Nevertheless, a feeding strategy including clover dominated leys could be an easily implemented tool to substantially reduce GHG emissions of dairy farms.
1 Introduction
For agriculture in general and the dairy sector in particular there is an increasing need to reduce greenhousegas (GHG) emissions (Woods et al., 2010; Knapp et al., 2014; Fritz, 2022) while keeping up productivity. There are multiple sources of GHG emissions in the dairy farming environment (IPCC, 1997; IPCC, 2006) with the three major sources being methane emission due to enteric fermentation, soil borne nitrous oxide (N2O) emissions in the field following mineral or slurry nitrogen (N)-fertilizer application and slurry storage (Flaig, 2017; Wattiaux et al., 2018; Köke et al., 2021). These account for 46, 29 and 24% of the GHG emissions in the German agricultural sector, respectively (Fuß et al., 2024).
Although methane emission due to enteric fermentations is the major contributing factor, the options to reduce this source, such as feeding management, rumen modifiers and increasing animal productivity (Knapp et al., 2014) can also have some drawbacks. The increased use of concentrate feed, unknown longterm effects of rumen modifiers (Nawab et al., 2020) and the often negative impact of very high animal productivity on required animal replacements are some possible drawbacks (Knapp et al., 2014; Poppinga et al., 2016). Improving the quality and quantity of locally produced fodder was mentioned to be a cost effective strategy to reduce GHG emissions in the dairy sector (Fritz, 2022).
The increased use of legumes with reduced N input are viewed as a promising option to mitigate climate change in agriculture (Prudhomme et al., 2020; Nemecek et al., 2015). Legumes release 5–7 times less GHG per unit area compared with wheat or oilseed-rape (Jeuffroy et al., 2013; Stagnari et al., 2017), enhance the sequestration of carbon in soils (Jensen et al., 2012; Ebertseder et al., 2014; Wu et al., 2017; Kumar et al., 2018; van der Pol et al., 2022) and reduce the need for fossil energy dependent mineral N fertilizer (Jensen et al., 2012). Furthermore, legumes can increase yield in combination with grasses (Weggler et al., 2019) and provide protein-rich fodder required for highly productive dairy cows. Although it was previously stated that an altered “Feed mix “towards a legume based mix was deemed less effective in mitigating GHG emissions compared to other means (Prudhomme et al., 2020), this conclusion was drawn for the use of annual grain legumes and all farming types. Therefore, the effect of using perennial, smallseeded legumes (SSL) as a protein rich fodder crop with low N requirements (Parkin and Kaspar, 2006) on the GHG emissions of conventional dairy farms remains unclear.
In recent decades oilseed-rape (rape) extraction meal (RES) and soy-cake were the major sources of protein rich feed for dairy cows although the need to increase local sources of protein is appreciated. The European Union is still highly dependent on imports of such protein rich feed (Albaladejo Román, 2023). Smallseeded legumes such as clover and lucerne are a local source of protein, with a high nutritional value for dairy cows. As fodder they can increase dry matter intake and milk yield of dairy cows (Johansen et al., 2018). Still their use in conventional dairy farms so far is limited. The cropped area with SSL has increased only moderately from 0.26 million ha in 2016 to 0.35 million ha in 2023 (Statistisches Bundesamt, 2024), about 2.9% of the cropped area in Germany. For comparison, maize-silage as the preferred fodder combination to protein rich feed, took up 2.00 million ha of the cropping area in 2023 (Statistisches Bundesamt, 2024). The import of protein rich feed, due to its carbon footprint, is increasingly questioned in recent years, while at the same time there are many modelling tools for GHG assessments and the choice of the appropriate tool remains difficult.
Numerous assessments of GHG emissions in the farming sector have been conducted (Rotz, 2018; Frank et al., 2019) and the approaches differ in focus and applied system boundaries. They range from analysing specific processes (Huyen et al., 2016; Wattiaux et al., 2018) to whole farming systems (Sutter et al., 2013; Zehetmeier et al., 2014; Guggenberger et al., 2020; Ineichen et al., 2022). Nowadays, upstream emissions are frequently included in GHG estimations (Guggenberger et al., 2020), which should be the preferred option (O’Brien et al., 2012), although according to IPCC guidelines those emissions are not reported in the “landuse” section (IPCC, 2006, 2019). In this so called “cradle to farm gate approach “emissions due to N-fertilizer production, external feed purchases and direct energy use are included (Frank et al., 2019; Guggenberger et al., 2020; Reinsch et al., 2021). Many GHG assessment tools such as REPRO (Hülsbergen, 2003; Frank et al., 2019), Farmlife (Guggenberger et al., 2020; Fritz, 2022), KLIR (Köke et al., 2021; Ineichen et al., 2022) and also the BEK-calculation standards (Arbeitsgruppe-BEK, 2021) use this approach. Since SSL have the potential to reduce GHG emissions on various levels (Jensen et al., 2012) the latter approach is particularly suitable to assess the effect of SSL on the GHG emissions of dairy farms.
The impact of an increased use of SSL-leys on GHG emissions of dairy farms can be assessed by comparing existing or modeled farms. Comparing GHG emissions of existing farms is useful to point out general differences between for example organic and conventional farming systems (Kassow et al., 2009; Frank et al., 2019). Since SSL are commonly used in organic but less so in conventional dairy farms in Germany (Kassow et al., 2009, Reinsch et al., 2021) it is tempting to use farming systems as a surrogate for the effect of SSL on GHG emissions of dairy farms. However, this comparison is flawed since those farming systems also differ in many other important features such as productivity per cow and more. Since the effect of SSL on the GHG emissions of dairy farms was meant to be assessed for conventional farms as well, a model farm approach that incorporates feeding requirements of high yielding dairy cows was deemed suitable to consider the important interactions between animal husbandry, feed production and land management (Frank et al., 2019).
To assess the effect of SSL based fodder on the GHG emissions of a whole farm we assumed four equally structured model farms and modelled their GHG emissions and humus balances with the BEK calculation standards (Arbeitsgruppe-BEK, 2021) using a “cradle to farm gate approach”. We hypothesized that SSL based feeding rations of dairy cows and subsequent management of arable land would result in an improved GHG balance compared to farms based on feeding rations using maize-silage and RES. To analyze this in more detail we assumed two different yield levels of SSL dominated leys: average and high. Secondly, we hypothesized that N-fluxes to and from the farm are improved in SSL compared to maize-silage and RES based farms. Thirdly, we assessed whether a mixed feeding ration, intermediate between the above mentioned ends of the scale, can be a valuable option to improve the GHG balance of farms.
2 Materials and methods
Land management including crop selection and slurry distribution of a dairy farm depends strongly on animal stocks, feeding strategy and resulting fodder requirements. Therefore, the description of the general farm setup including animal husbandry is covered first and details covering land management and GHG emissions, the major focus of the work (Figure 1), are listed thereafter.
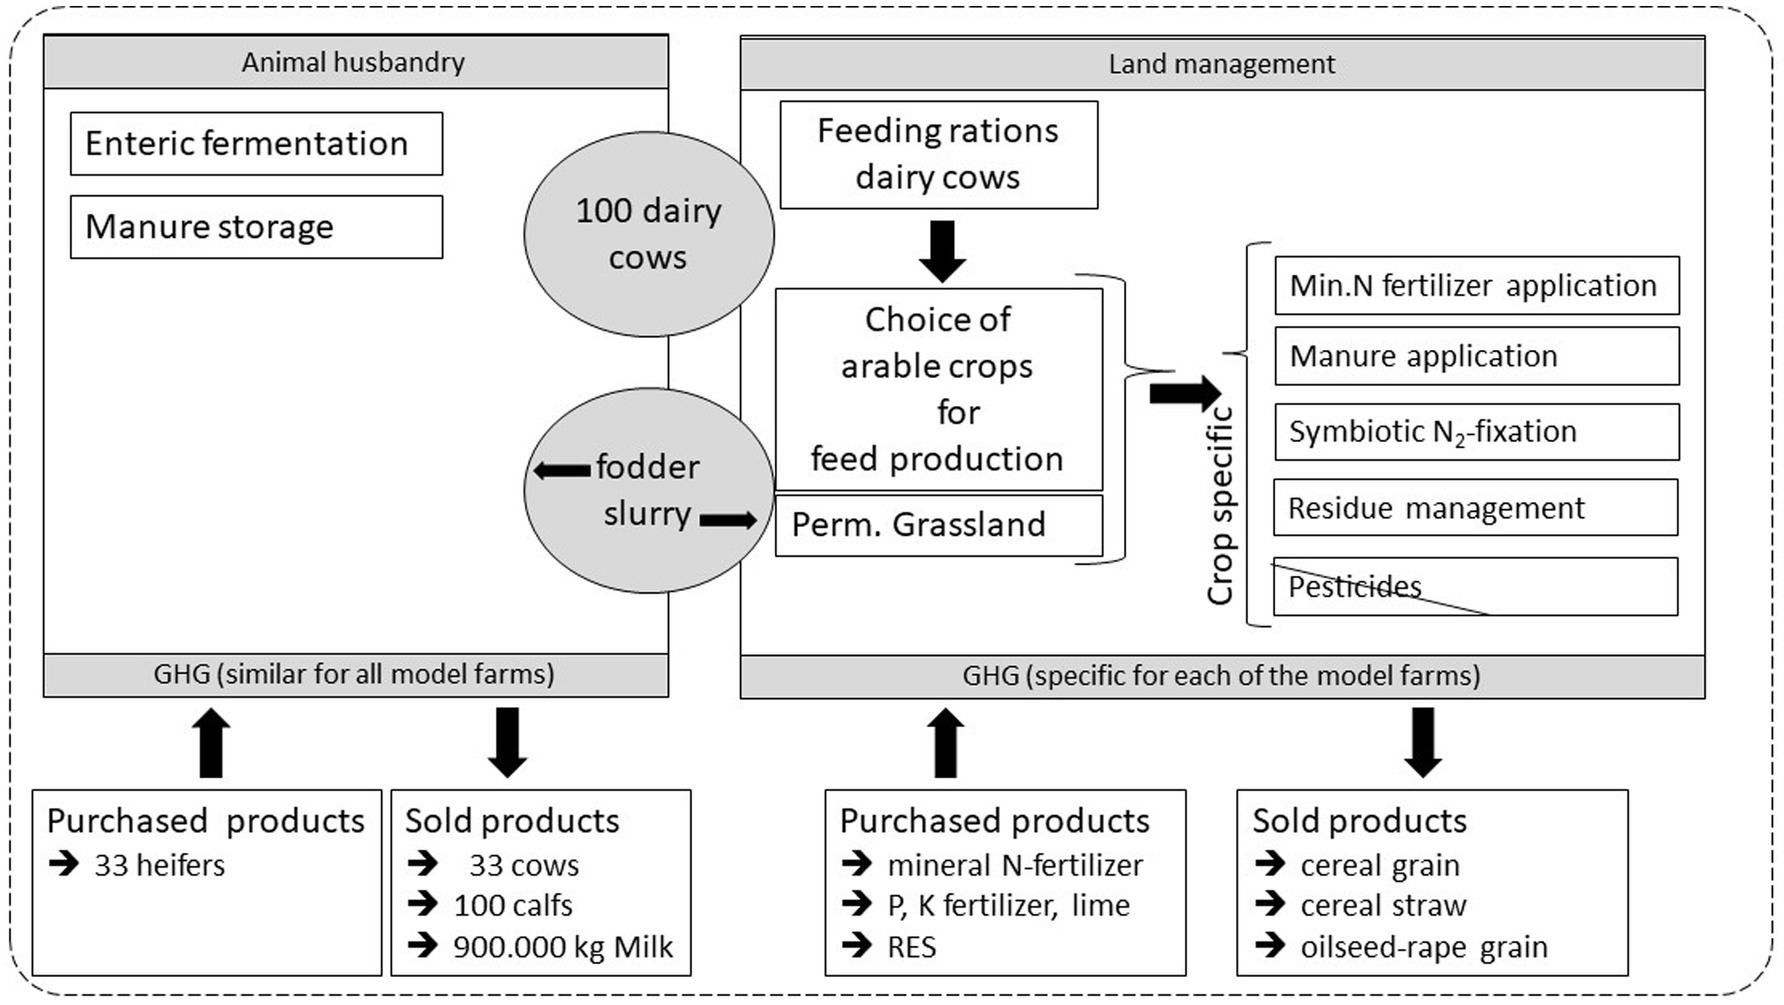
Figure 1. Attributes included in the estimated GHG emissions for the four model farms based on either land management specific for each model FANN or GHG emissions based on animal husbandry similar for all four model farms. Assumed in- and output products for both sectors of the farms are listed.
To simplify the farm systems, we assumed that the farms kept 100 dairy cows (Fleckvieh) during their lactating as well as during their dry phase. Heifer production occurred externally. It was assumed that a similar amount of 33 cows get bought in (650 kg body weight (BW) animal−1) and go out of production (750 kg BW animal−1) annually and 100 calves (45 kg BW animal−1) were sold annually. The dairy cows were assumed to have a yearly milk production in energy corrected milk of 9.000 kg ECM cow−1 year−1 (ECM: 3.4% protein, 4% fat), encompassing the lactating and the dry phase of the cows and a production of 28 kg ECM cow−1 day.
The feeding rations used in the four model farms are listed in Table 1 and were in brief as follows (a) the RapeF feeding ration consisted of a conventional feeding ration of maize-silage, grass-silage, RES, urea, cereal grain and straw (b) the LegF feeding ration was based on legume-rich-silage, grass-silage, cereal-grain and maize-grain (c) the MixF feeding ration was based on a mixture of the previous feeding components including legume rich silage, grass-silage as well as maize-grain and a lower amount of RES and (d) the hLegF feeding ration was similar to the LegF ration, only the yield of the legume-rich leys was assumed to be higher (Table 2).
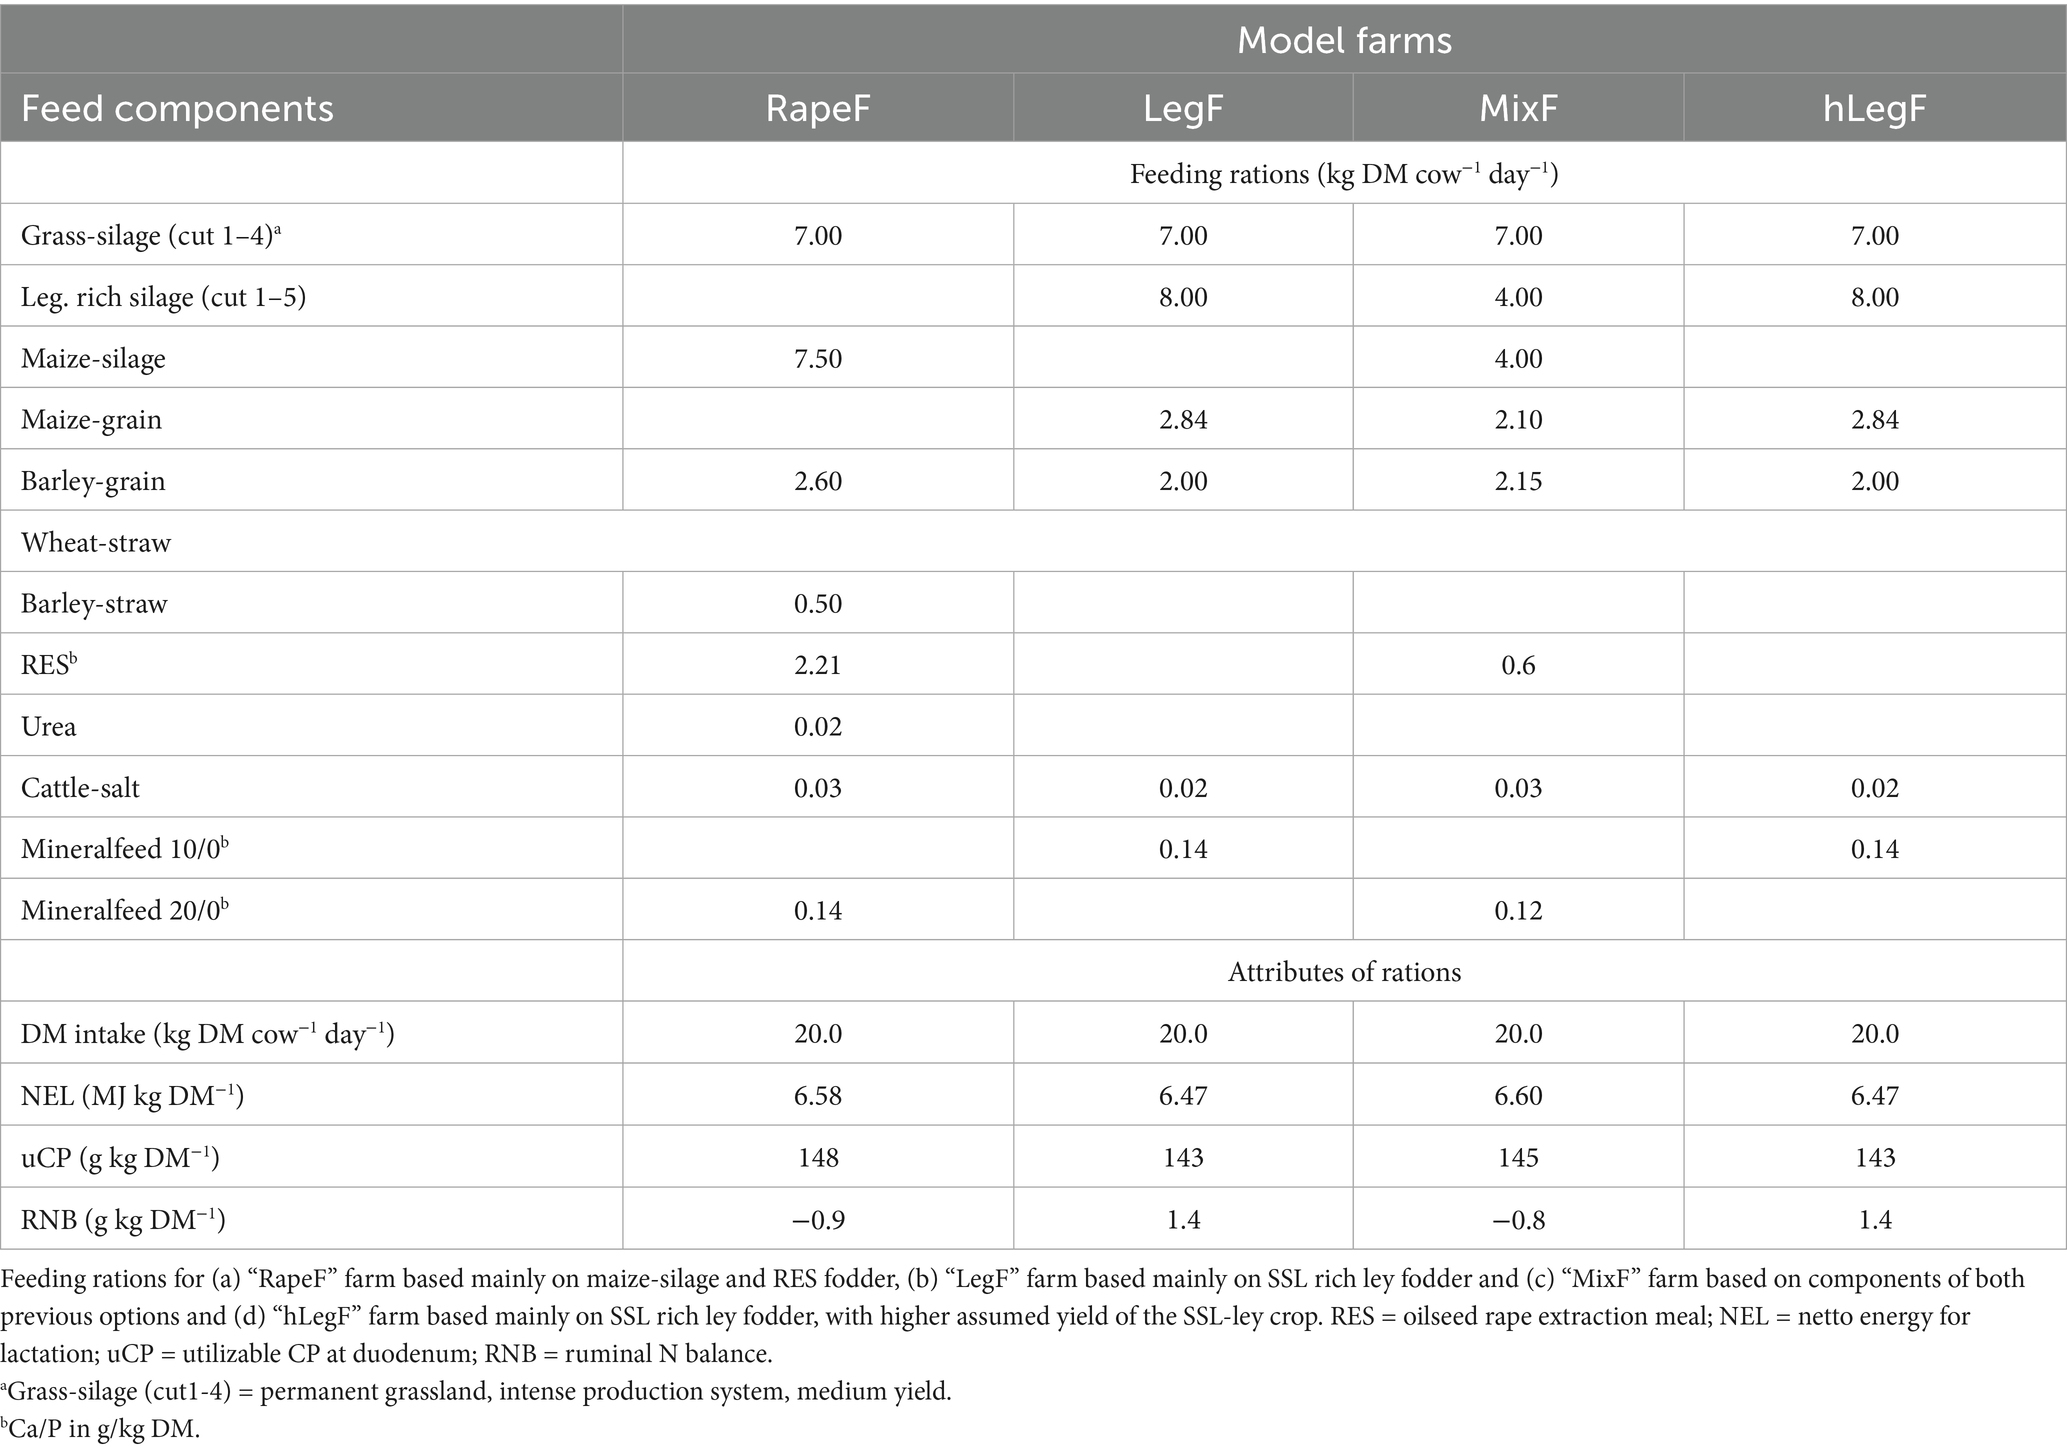
Table 1. Different feeding rations for dairy cows in four model farms with an annual milk yield of 9,000 kg ECM cow−1 year−1.
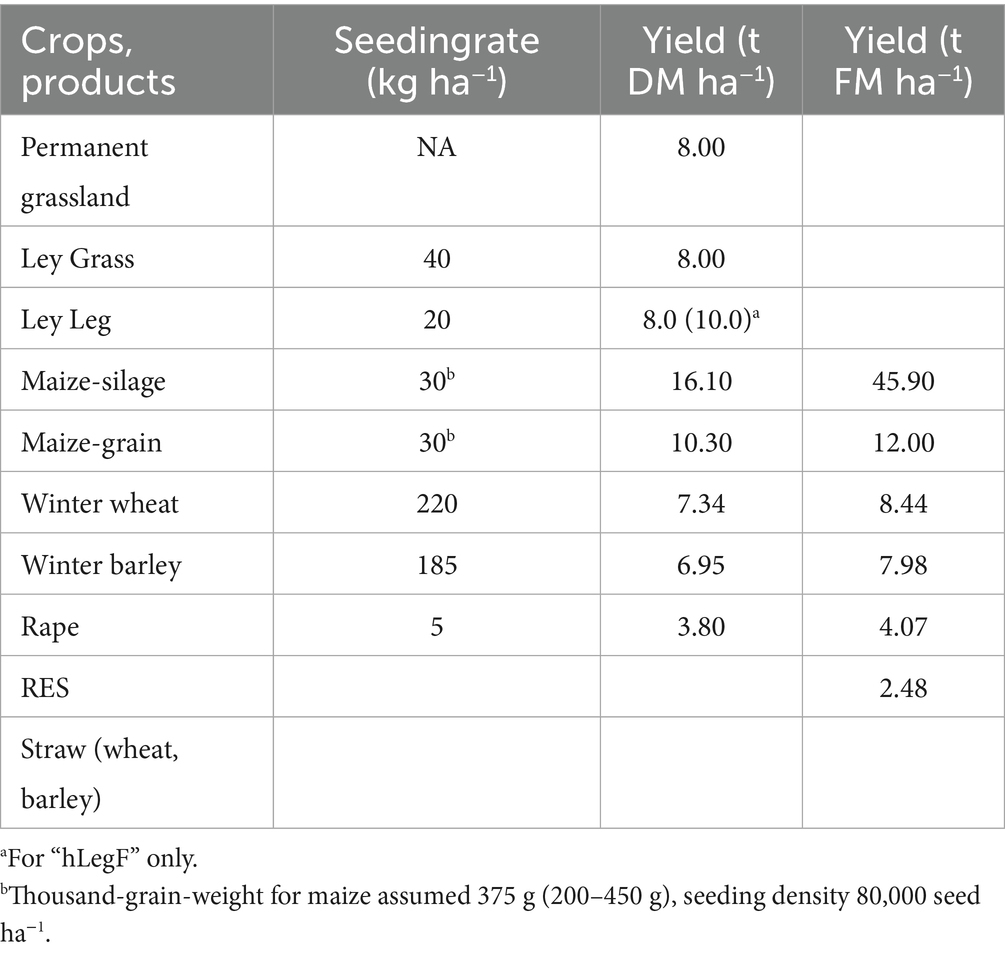
Table 2. Assumed seeding rates and crop yields for the four model farms and revenue for sold products.
The feeding rations were calculated using the model “Unirat” (Unirat, LAZBW, n.d.), which is based on recommendations of the German Society of Nutrition Physiology e. V (GfE, 2001). Common standard crop quality parameters, provided by Unirat (Unirat, LAZBW, n.d.), were used for calculating the feeding rations and are listed in Table 3. For the legume rich ley fodder with a red clover content of about 70–80% standard values were not available. Therefore a comparably low crude protein (CP) content of 178 g kg DM−1 with 20% of rumen undegradable protein was assumed (Table 3). This protein content was measured locally in freshly cut, red clover dominated permanent grasslands as a weighted mean of five cuts (Weggler et al., 2019). Protein losses and degradation due to silage preparation or other harvesting procedures were not considered, since they are dependent on the silage or harvesting method.
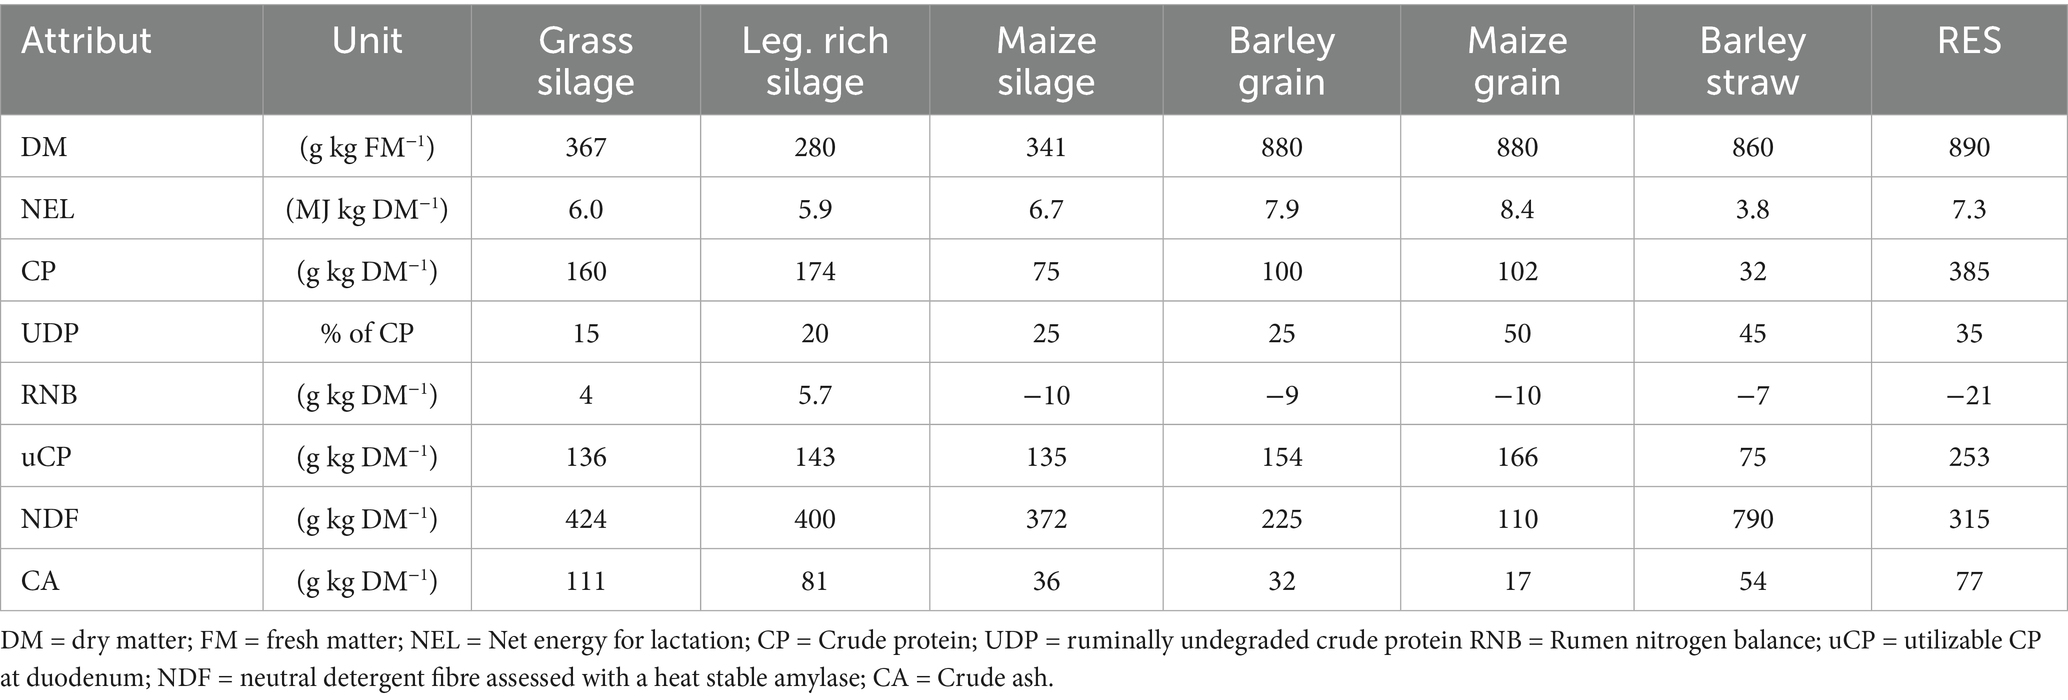
Table 3. Selected attributes of the feed components in the four model farms.
The assumed model farms consisted of 70 ha cultivated land and 30 ha permanent grassland, which is typical for “Oberschwaben”, a major dairy region in the Southwest of Germany (Herrmann et al., 2011). The necessary cropping area for fodder production was determined by the feeding rations of the cows (Table 1) and crop productivity (Table 2). The used crops included grass-leys, legume-grass-leys (legume dominated), maize-silage, maize-grain, wheat, barley and rape. From rape only the protein rich rapeseed extraction meal is used as fodder and is usually purchased by farmers. Since GHG emissions attached to imported rapeseed can vary considerably and cannot be known in detail this crop was included as cultivated crop in the model farms. The arable land not taken up by feed and fodder production was cultivated with wheat. The allocation of crops on the cropping area of the four model farms is shown in Figure 2. Straw, as a subproduct from cereal production, was assumed to be sold except for a base consumption of 20 t DM straw farm−1 year−1 for bedding material. A summary of annual crop yield, feeding requirements, sold and purchased products for the model farms is provided in Table 4.
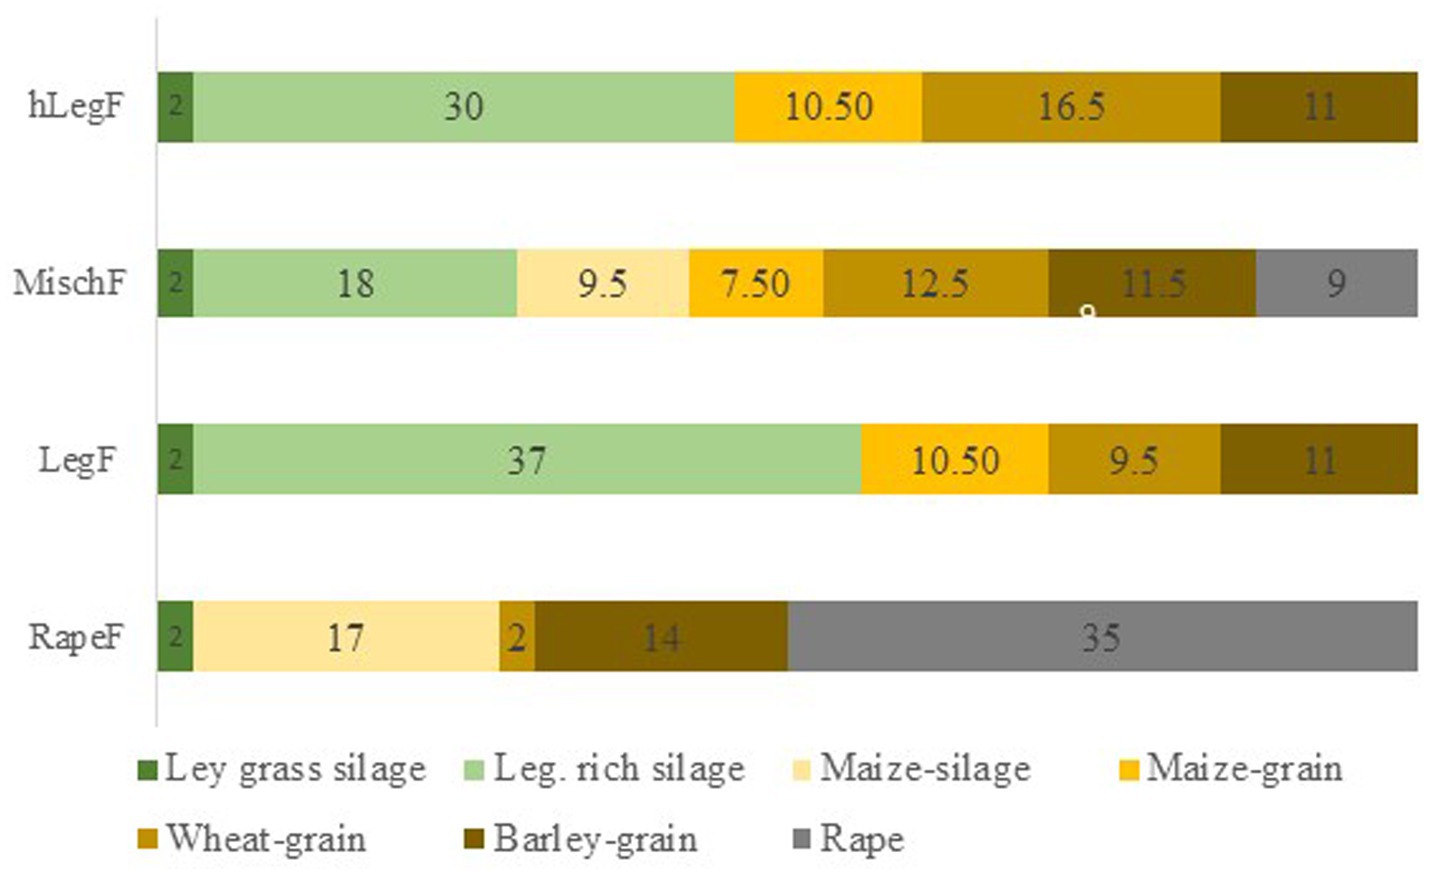
Figure 2. Allocation of cropping area in hectare for the model farms.
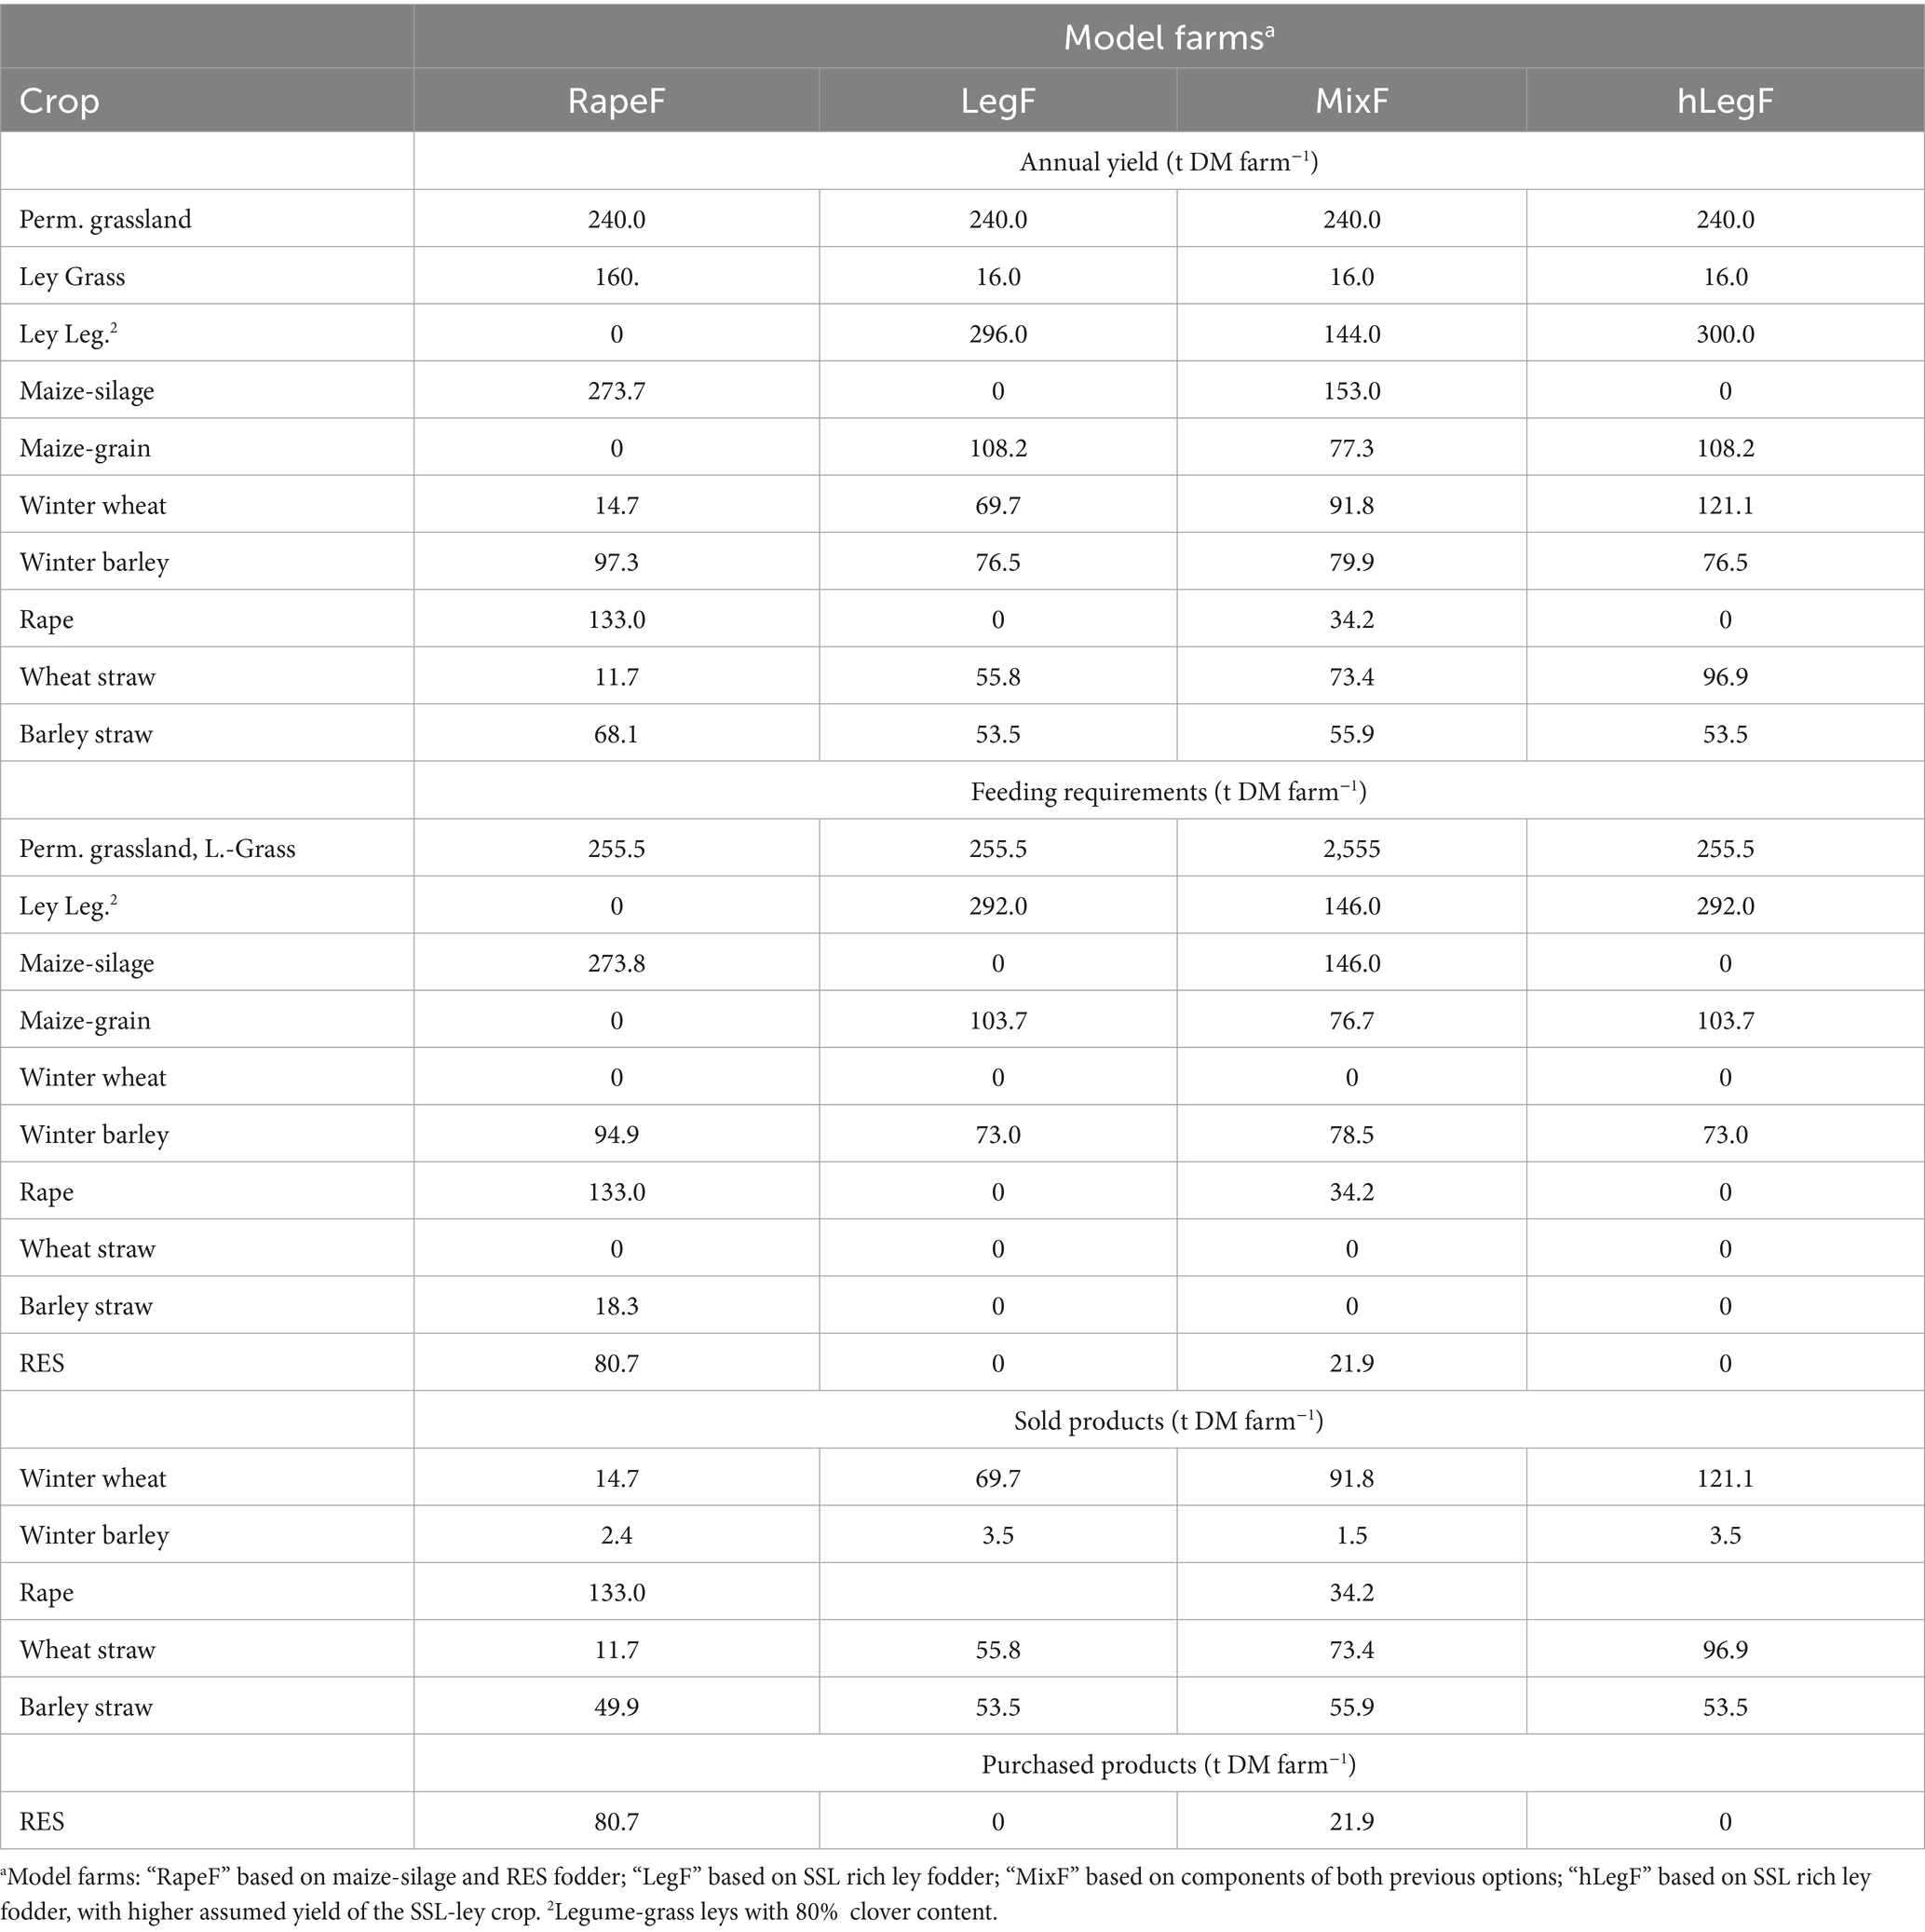
Table 4. Annual crop yield, feed requirements for 100 dairy cows with 9.000 kg ECM year−1, sold and purchased products for the four model farms.
The N-fertilization requirements of crops and grassland was covered by mineral N-fertilizer and the farm sourced slurry-N. The crop and grassland specific N-fertilization rates as organic, slurry-N or mineral-fertilizer-N are shown in Table 5. Calcium ammonium nitrate (CAN, 27% N) was used as mineral N-fertilizer (Table 5). For slurry-N the plant-available N fraction and gaseous losses were estimated as follows. The slurry from 100 dairy cows (21 m3 cow−1 year−1) was assumed to be diluted by 1:1 and had an N-concentration of 2.83 kg N m−3 in the diluted slurry, prior to losses. Slurry N-losses of 15% during storage (Mann et al., 2021) and 7% N during application on arable land and 18% N during application on grassland (Bruckner and Blumenstein, 2024) was assumed prior calculating the effective amount of slurry N-fertilisation for each crop and each model farm (Table 5). The N supply for legumes also consisted of symbiotically fixed-N, which was estimated according to the equation by Carlsson and Huss-Danell (2003), where legume-grass leys with a red clover content of 80% were used as input values. All arable crops were also fertilized with 46 kg P2O5 ha−1 and 200 kg CaO ha−1.
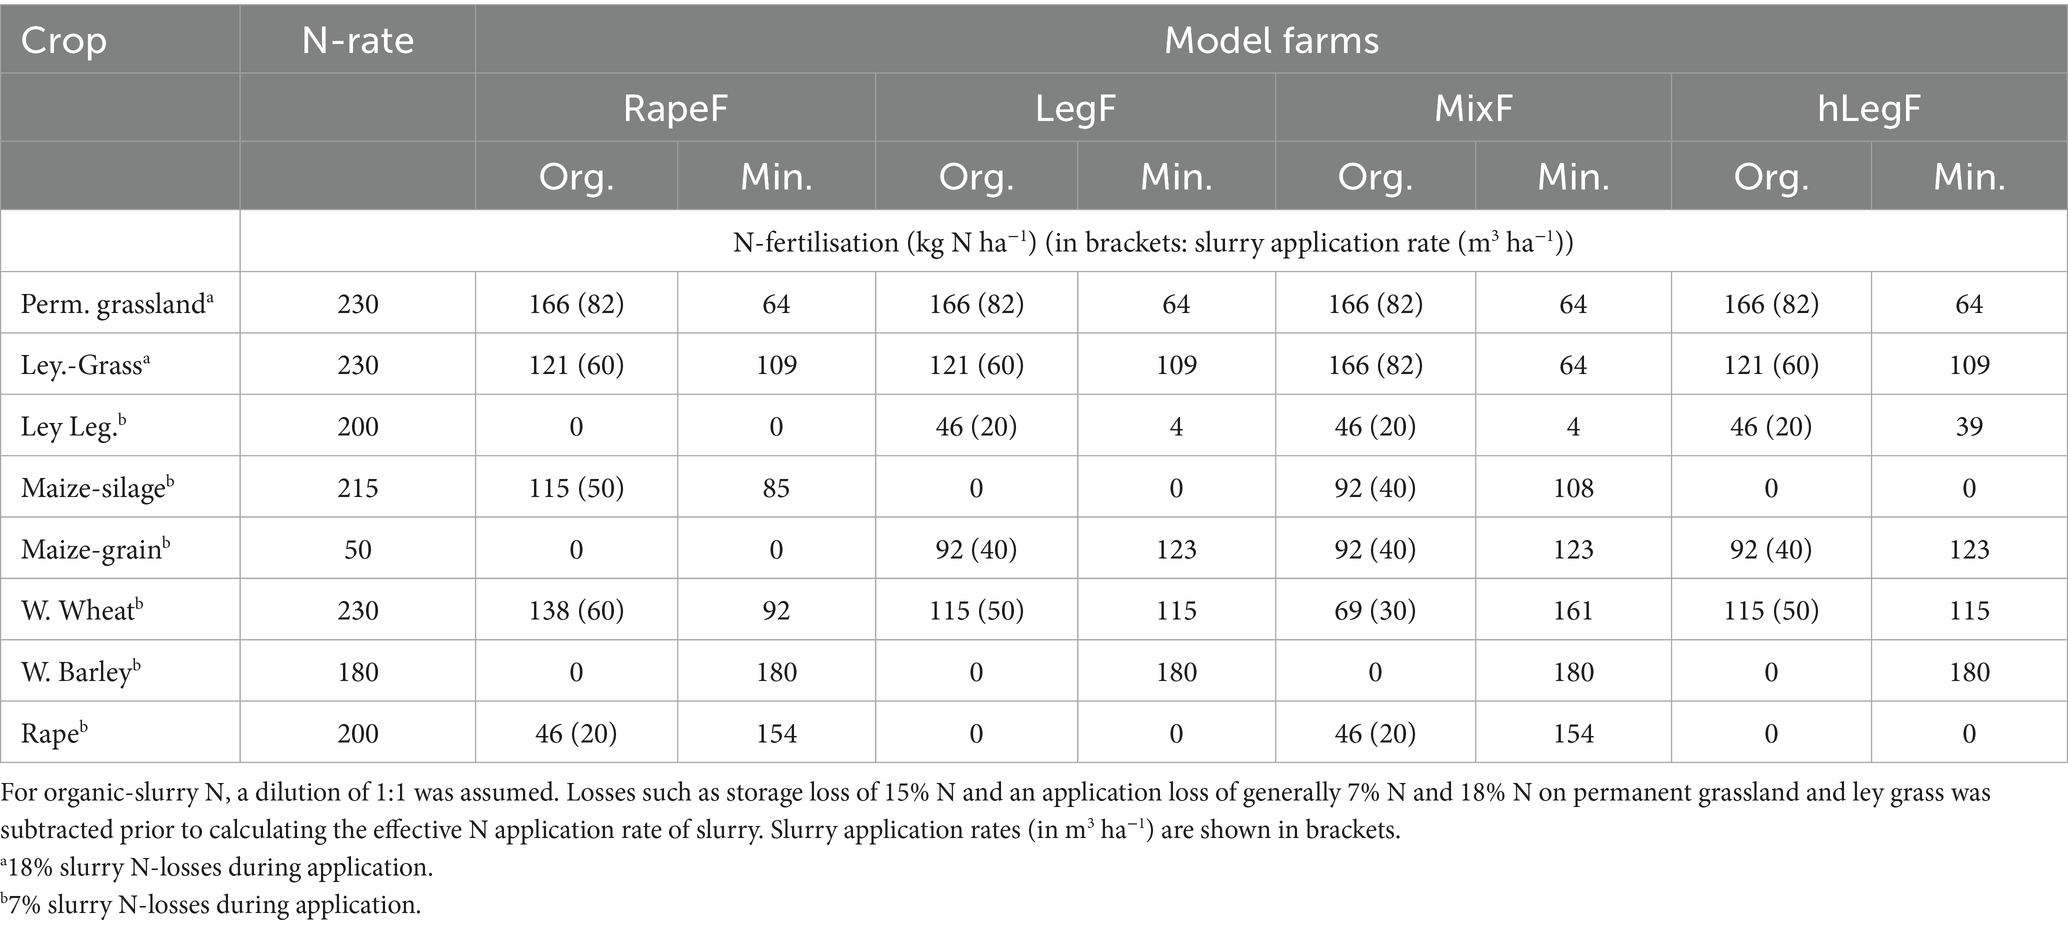
Table 5. Mineral and organic nitrogen (N) fertilizer application rates for the four model farms.
For estimating the GHG emissions of model farms, the BEK calculation standards for GHG balances (Arbeitsgruppe-BEK, 2021) were used. In brief, the calculation standards consider the emission of the three major GHG relevant gases (CO2, CH4, N2O) which are transferred into CO2 equivalents (CO2e) via the GWP-100 metric. Chosen system boundaries for estimated GHG emissions, assumptions and included factors are shown in Figure 1.
For estimating the crop specific GHG emissions, the BEK recommended general set of parameters were used and the crop specific parameters were adapted for each crop. The crop specific parameters and major assumptions used in the GHG estimation are listed in Table 6. The crop specific humus accumulation and reduction values and the humus-build-up-coefficient for byproducts (Ebertseder et al., 2014) applied in the GHG estimation, are also shown in Table 6. For permanent grassland a grassland age of 21–30 years was assumed (Arbeitsgruppe-BEK, 2021). Energy consumption for land management was stated to be 115 L diesel ha−1.
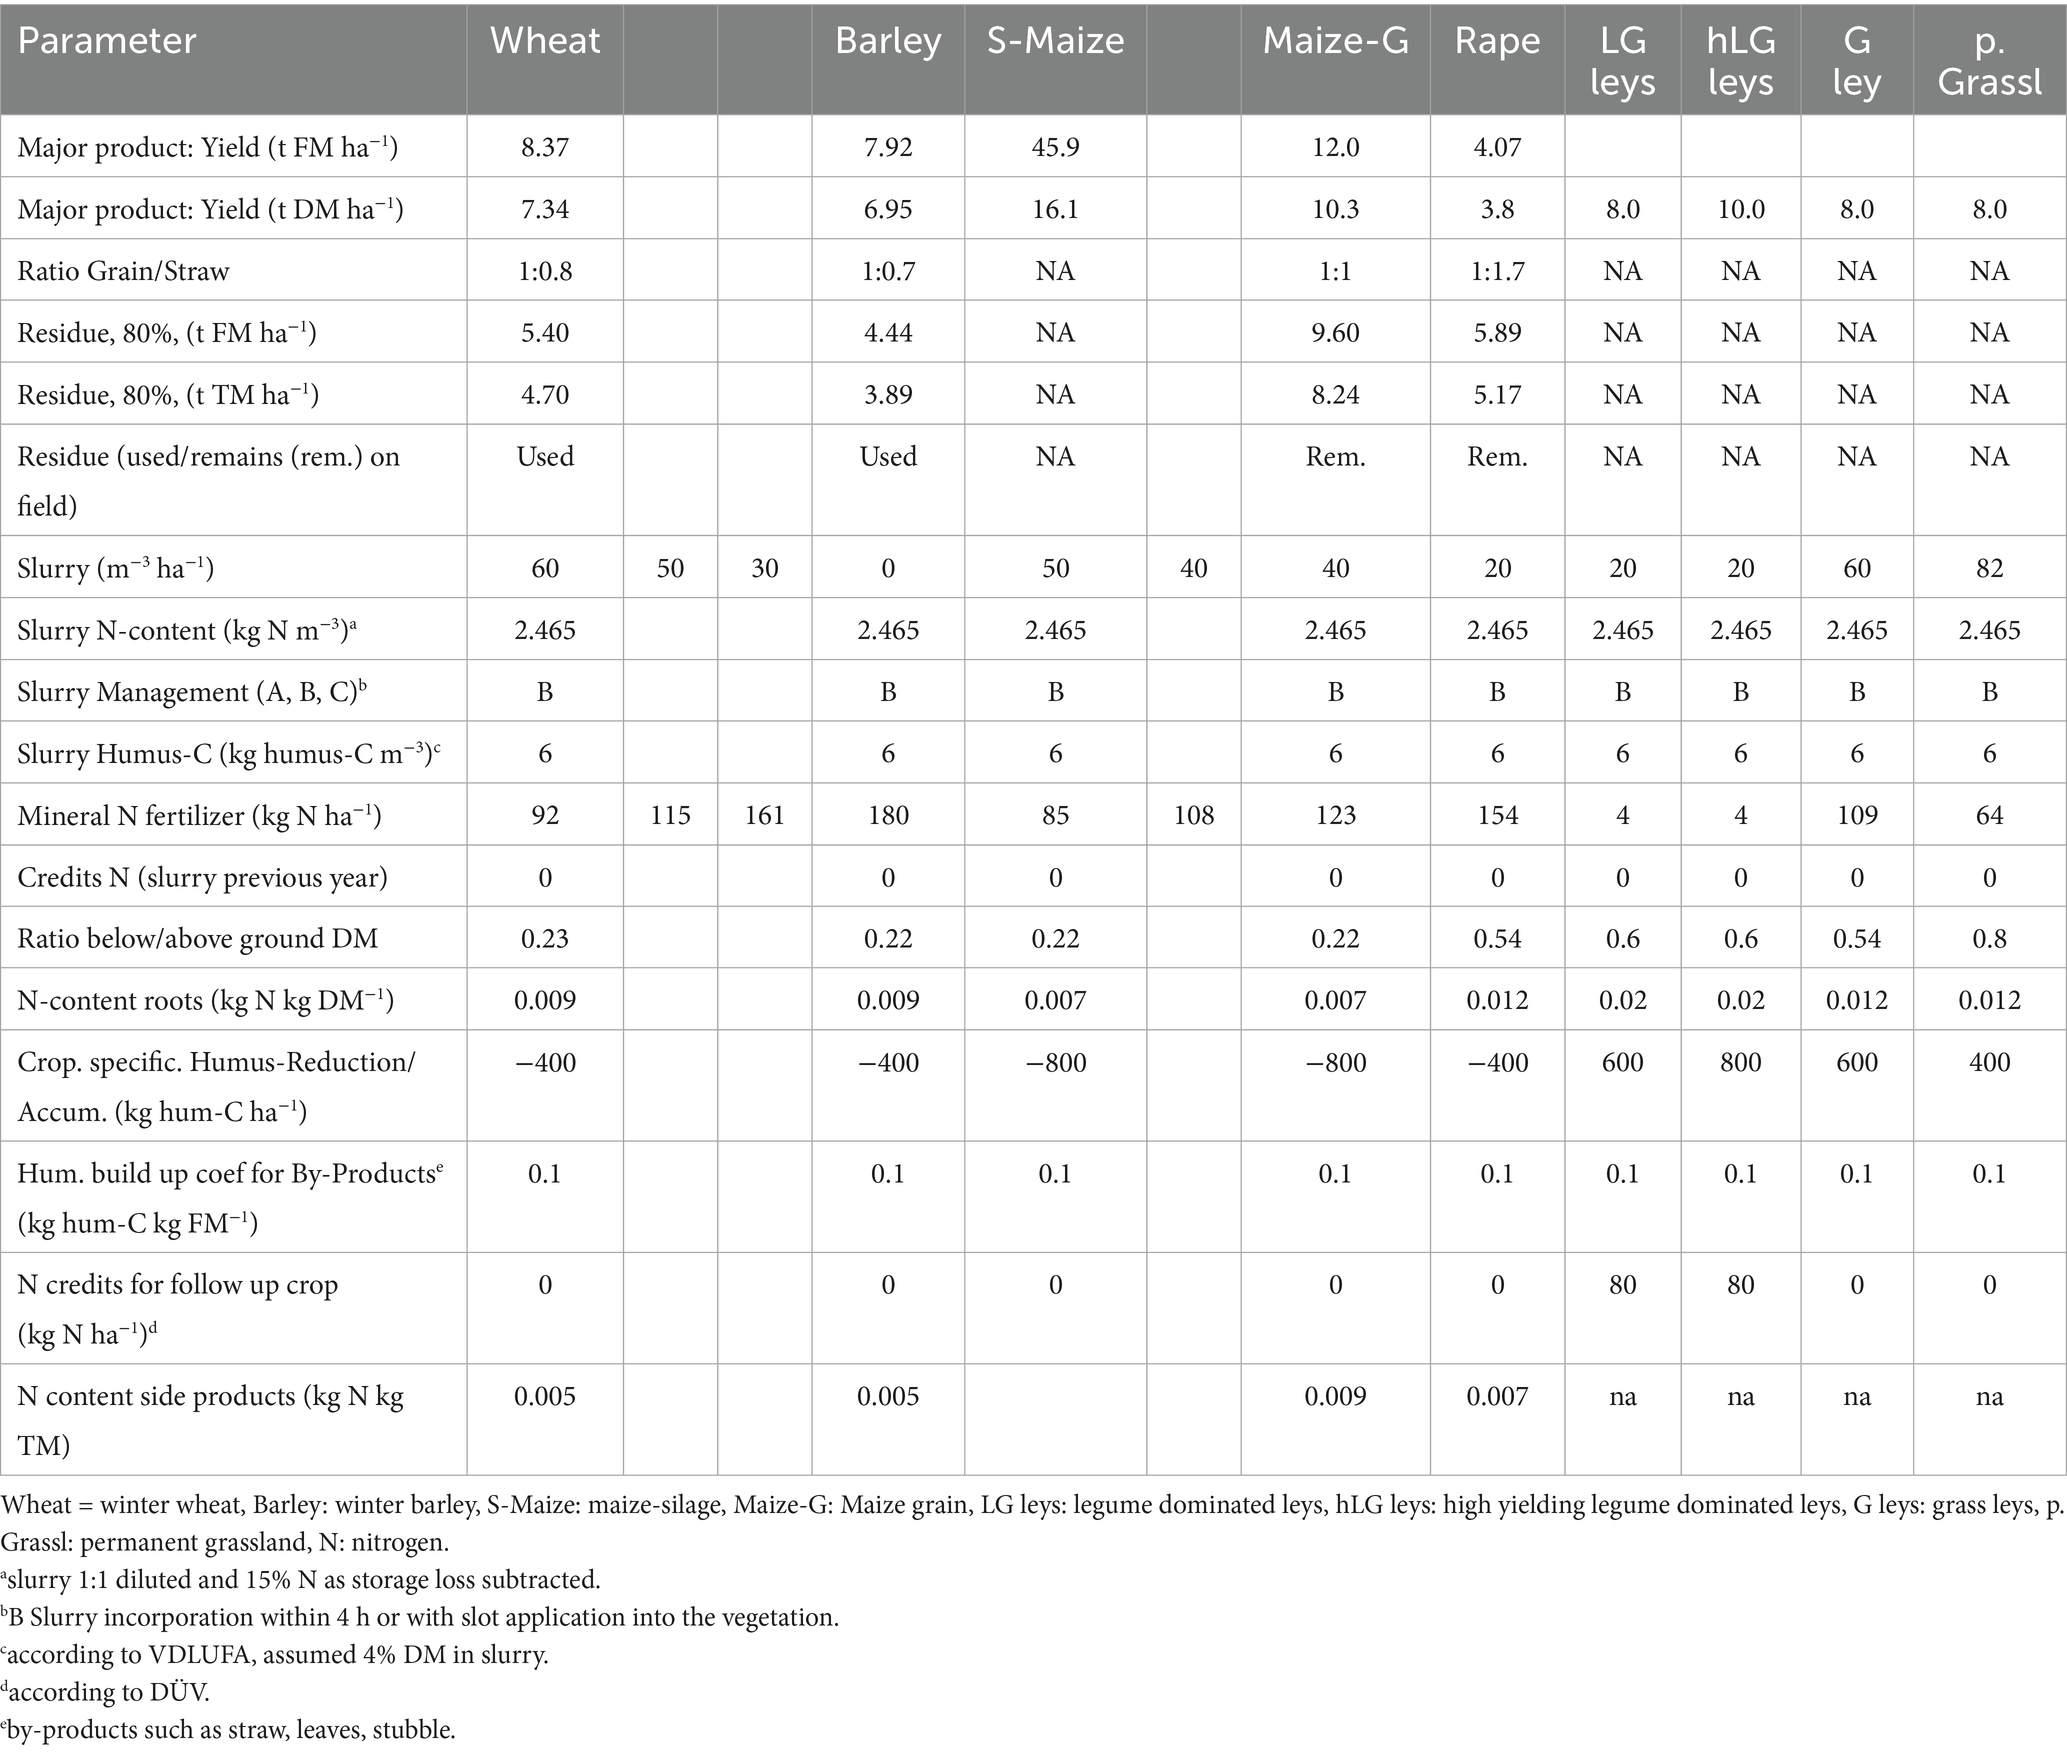
Table 6. Major assumptions and a selection of used parameters for estimating the GHG emissions of farms, using BEK calculations standards.
For some crops such as rape and SSL not all crop specific parameters were provided (i.e., humus creation factor for rape residues). The humus creation factor for cereal residues was also used for rape residue although it was not specifically developed for it. Furthermore, input values such as cereal straw- and rape-residue-management are generally dependent on farm specific crop management. Due to these uncertainties some crop-specific-parameters and straw management options were varied in a small scaled sensitivity analysis and their effect on the GHG balance was determined. For maize-grain and rape, all residues were assumed to stay on the field.
The sum of GHG emissions per model farm was calculated by multiplying crop specific GHG emissions by the respective cropping area. The GHG emissions attached to sold crops were subtracted. To determine the GHG emission related to dairy production, land management based GHG emissions needed to be allocated. The GHG emissions arising due to feed and fodder production were assigned to the internal “dairy production “system whereas surplus crops were assigned to “sold products.” The estimated GHG emissions for rape needed to be split between the internally used RES and the externally sold rape-oil. The GHG emission were split on the basis of the energy contained in the two components, with an allocation factor of 0.35 for RES and 0.65 for oil according to Majer et al. (2015). Similar to this, land requirement from rape also needed to be allocated to internally required RES-protein and externally traded rape-oil, using similar allocation factors.
Cereals also produce two products, grain and straw, which are usually traded independently. Grain has a higher economical value, whereas straw has a higher humus building capacity. Straw can be used as fodder, bedding material or traded externally, whereas grain is frequently traded. Since grain is the product with higher economical value the GHG emissions were assigned to this subproduct. However, GHG benefits for straw-residue such as “humus-building capacity” were assigned to the straw. This is in difference to the BEK calculation methods. If the straw was sold externally the residue credits were assigned to the “sold products“. If straw was incorporated in the soil or used as bedding material the credits were assigned to the internal “dairy production “system. A base consumption of 20 t DM straw year−1 for bedding was assumed for all farms. Harvested straw has usually a DM content of 86%. The straw, as FM, was transferred into humus-equivalents (Häq; 100 Häq t FM−1 = 100 kg C t FM−1, Ebertseder et al., 2014) and expressed as CO2e credits by using the transfer coefficient of 3.67 (Arbeitsgruppe-BEK, 2021). Only 80% of calculated residue were used for estimating residue credits according to recommendations by BEK (Arbeitsgruppe-BEK, 2021).
The GHG emissions for the animal husbandry part of the farms were also estimated using the BEK calculation standards for dairy cows (Arbeitsgruppe-BEK, 2021). The required input values for feeding rations for this set of calculations were 5 kg DM cow−1 day−1 of unspecified concentrate feed and 15 kg DM cow−1 day−1 for roughage fodder. This was equivalent to the feeding rations used in the four model farms. The annual methan (CH4) emission of dairy cows was estimated as follows: kg CO2e cow−1 = 142.43 kg CH4 cow−1 *25 kg CO2e kg CH4−1 (GWP 100) using recommended values (Arbeitsgruppe-BEK, 2021). Meat productivity was low in our model farms, as the balance of animal purchases and sold animals almost balanced out. Therefore, all GHG emissions arising due to fodder production and animal husbandry were assigned to dairy milk production.
The N-flows to and from farms could additionally be calculated using this model farm set up. The N-purchases as mineral-N fertilizer and the N-sales as cereal grain and straw describe these N-flows. Purchases of N in RES were assumed to be balanced with N in rape grain sales. The CP content of sold products was assumed to be as follows: barley grain 19.2 kg N t DM−1 (120 g CP kg DM−1), wheat grain 22.4 kg N t DM−1 (140 CP kg DM−1), straw 4.3 kg N t DM−1. For animal based products the following assumptions were taken: milk 34 g CP kg−1 milk, N-content of dairy cows and calves 0.25 kg N t−1 body weight. The nitrogen concentration in protein was assumed to be 16% for all traded protein products. The symbiotically fixed-N by legumes was estimated as described previously.
3 Results
The estimated GHG emissions for the different crops are listed in Table 7. Potential soil humus accumulation or reductions were already included in those values. Since estimated GHG emission for crops vary between the four farms due to farm specific slurry and mineral N application rates and partly different yield expectations (hLegF farm) the crop and farm specific values are summarized in a table in the supplement. The estimated crop specific GHG emissions were by far the highest for maize-silage of 5,954 kg CO2e ha−1 year−1 followed by wheat and barley of 5,016 kg and 4,534 kg CO2e ha−1 year−1 respectively, when straw residue benefits were excluded. Estimated GHG emissions for oilseed-rape and maize-grain were 2,346 kg and 2,732 kg CO2e ha−1 year−1, respectively, due to residues remaining in the field. This is the common practice for those crops, but residue related values are listed in Table 7 for comparison. By far the lowest amount of GHG emissions were estimated for grass-legume (GL)-leys and high yielding grass legume (hGL) leys, which were even negative and were −816 kg and −1,414 kg CO2e ha−1 year−1, respectively.
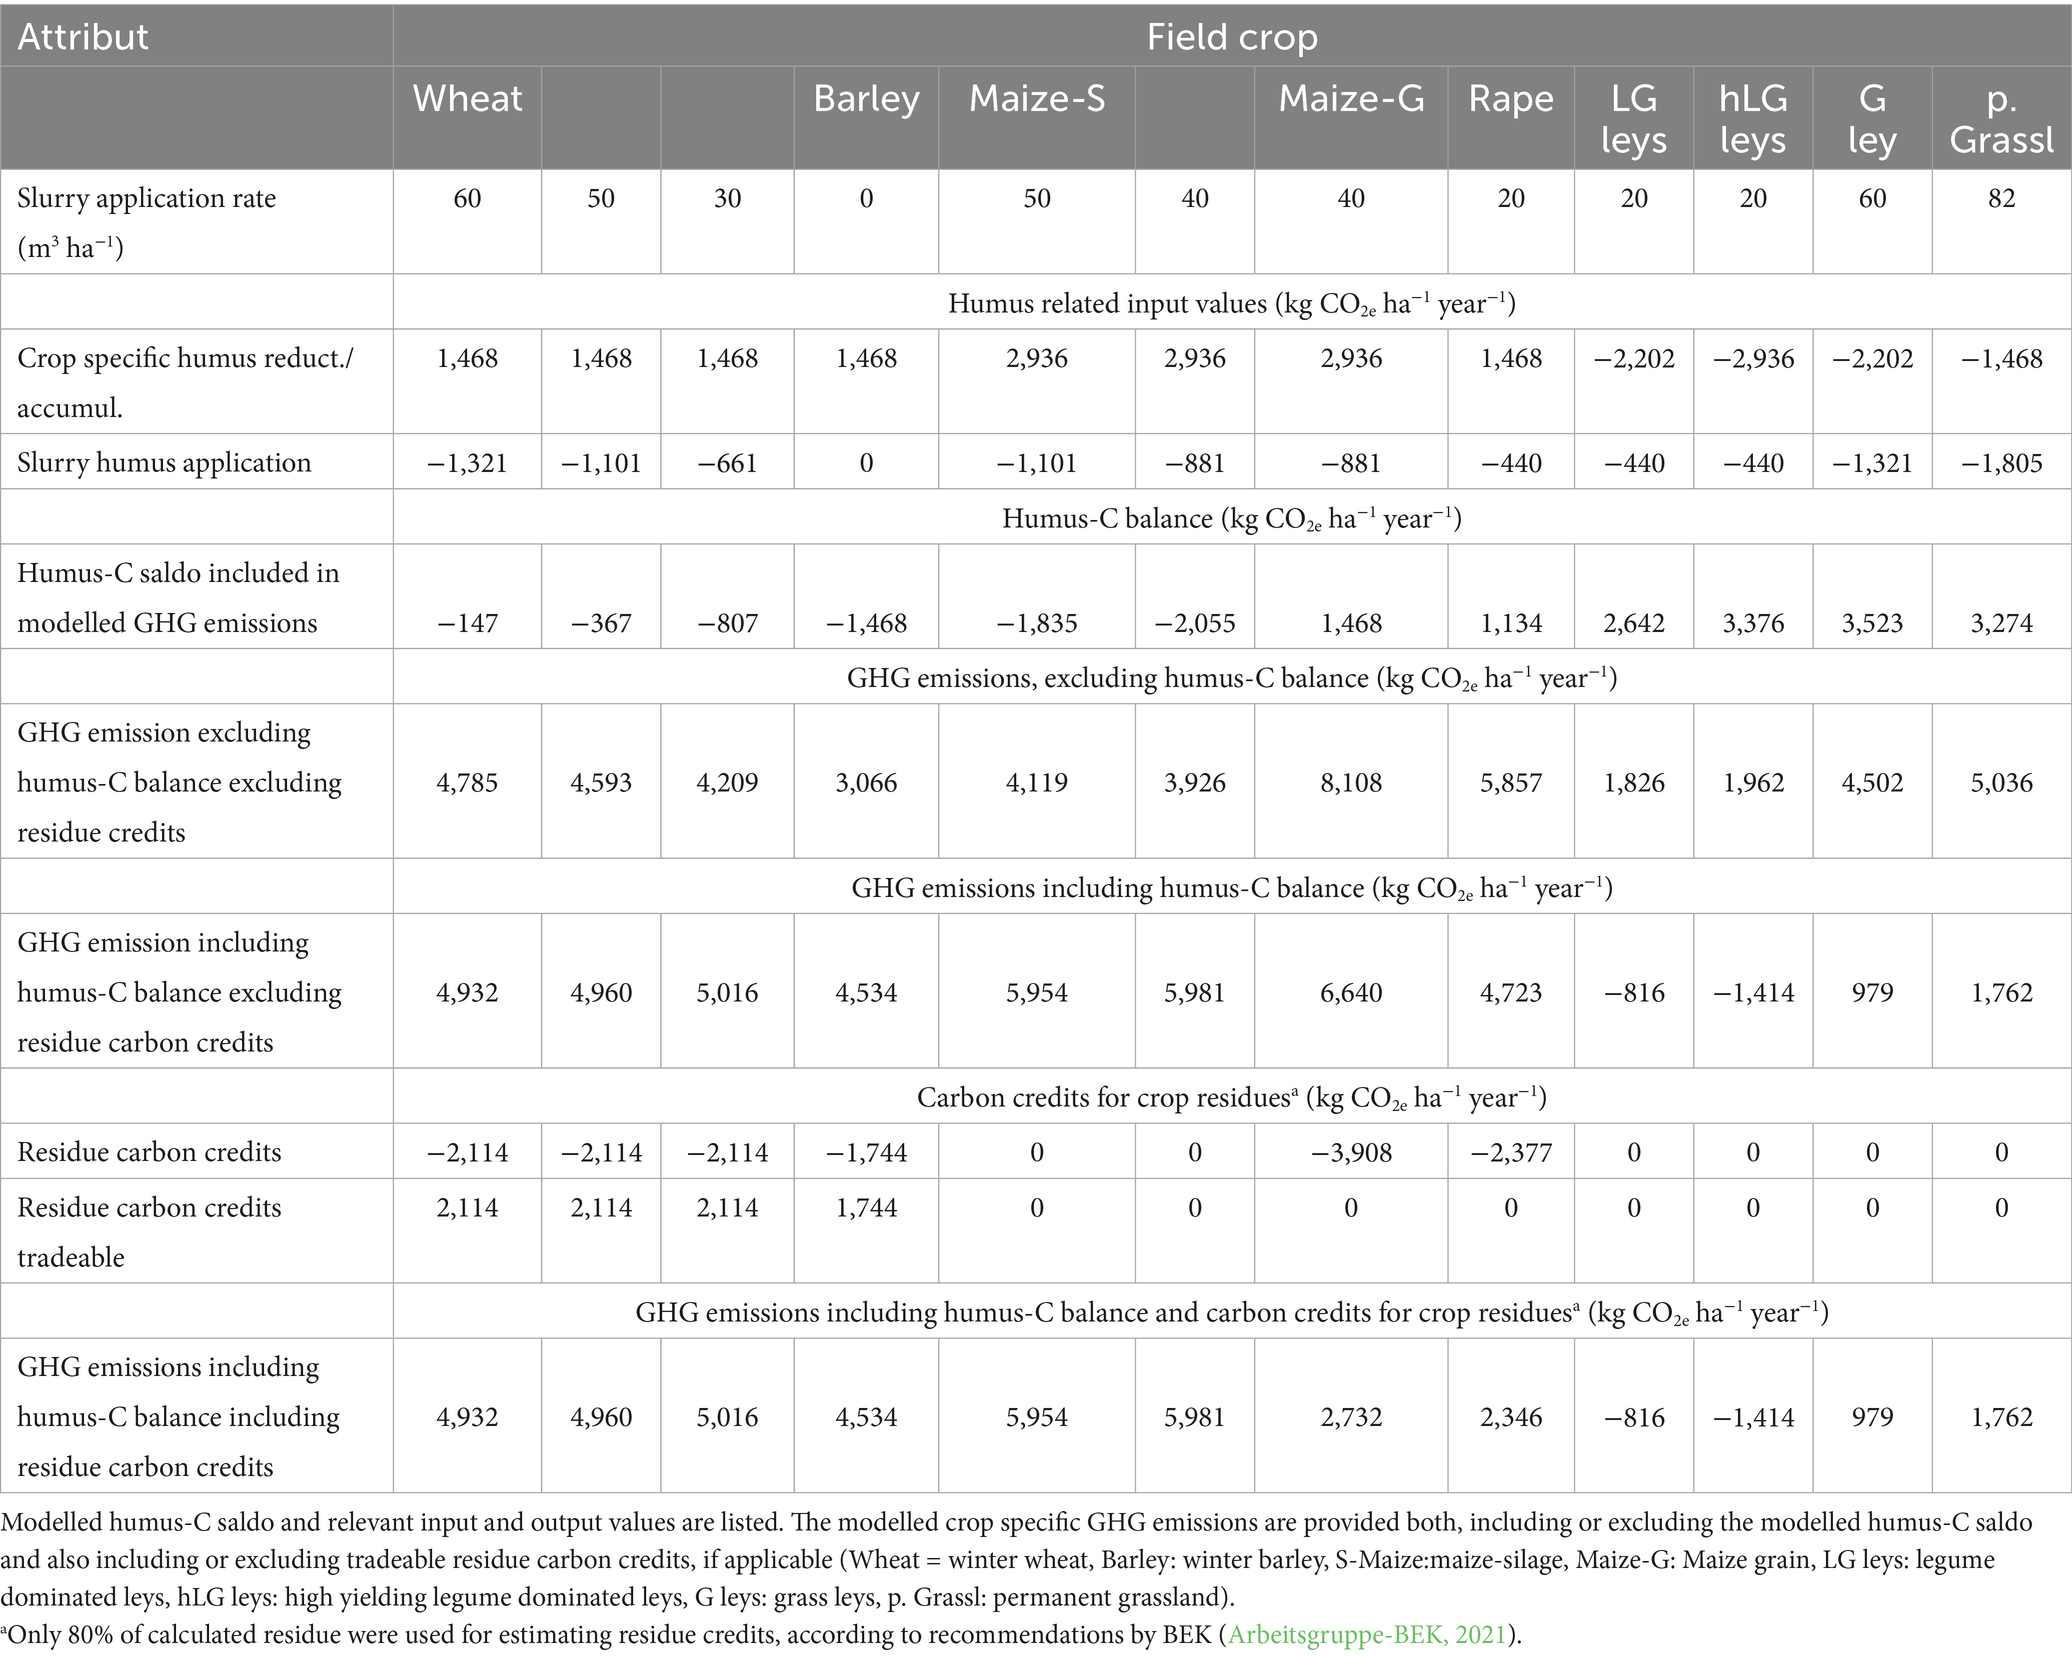
Table 7. Modelled GHG emissions for the different field crops of the model farms.
Land management based GHG balances for each model farm, calculated by multiplying crop specific GHG emissions with their occupied land, are shown in Table 8 and more detailed values in Figure 3. The land based GHG emissions of the RapeF farm of 311,486 kg CO2e farm−1 year−1 was considerably higher than comparable emissions from the LegF farm of 150,306 kg CO2e farm−1. Almost similarly low land based GHG emissions could be achieved with the hLegF farm of 172,798 kg CO2e farm−1 year−1. The MixF farm model resulted in GHG emissions of 251,415 kg CO2e farm−1 year−1, with emissions being in between the RapeF and LegF farms.
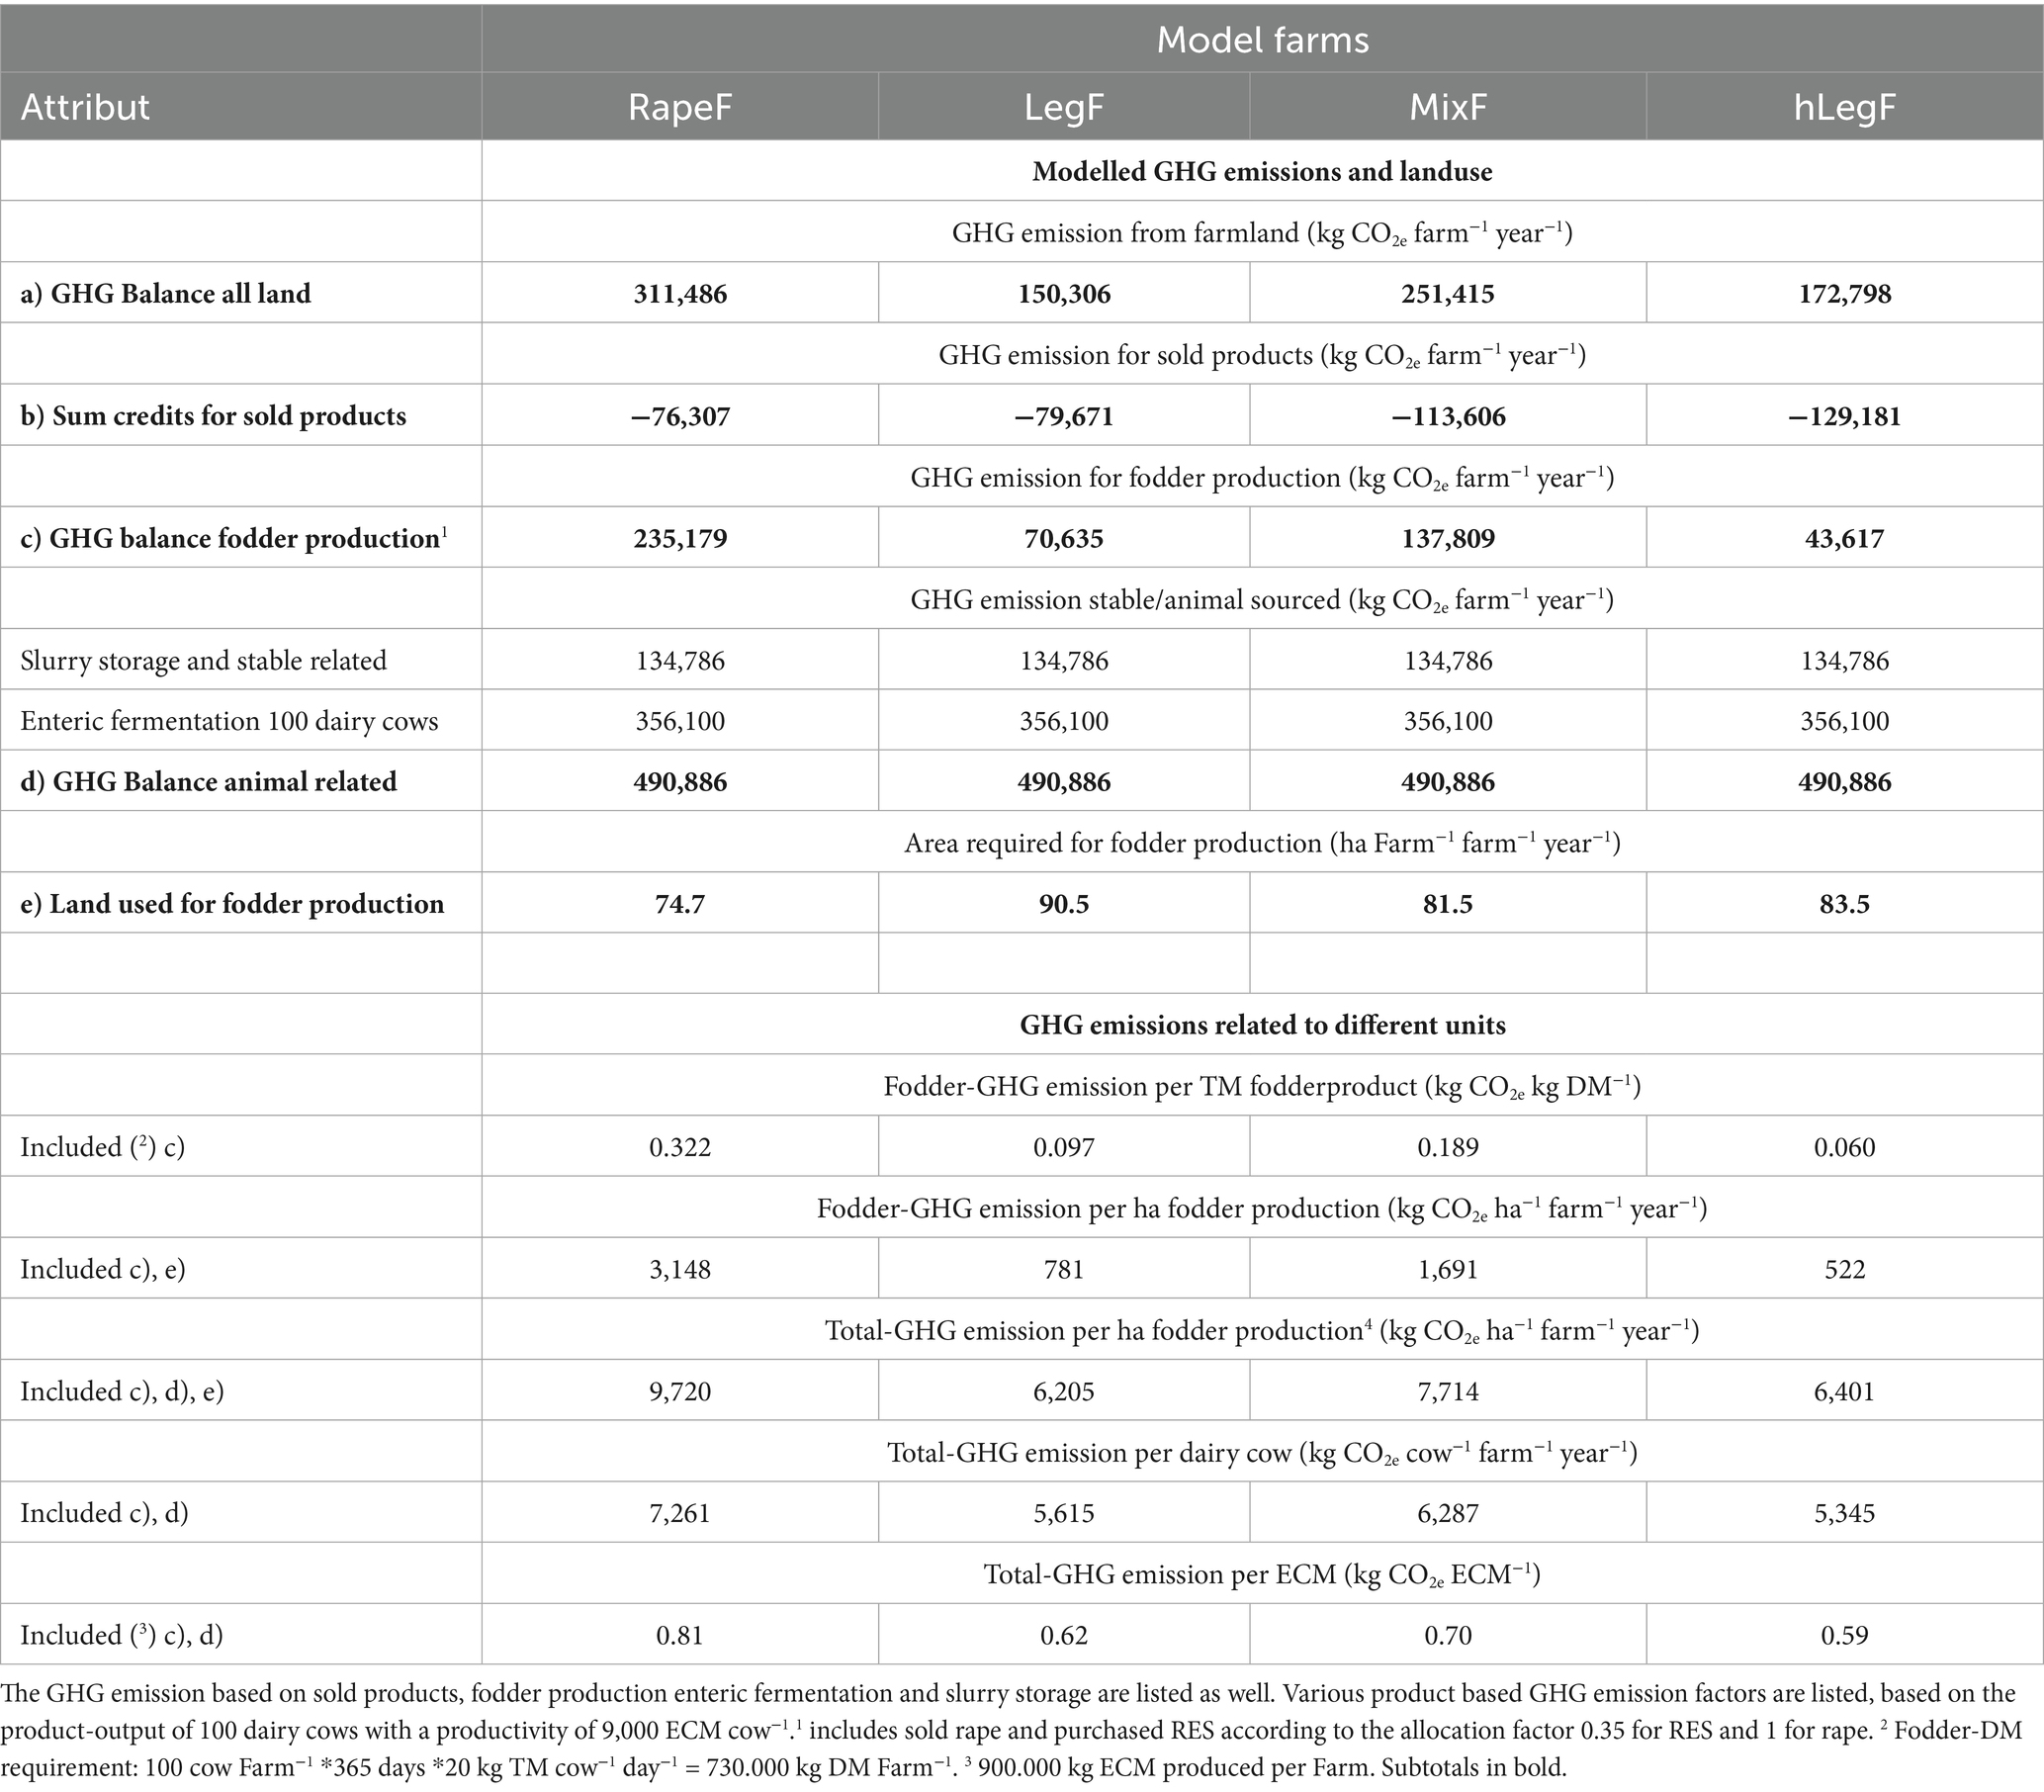
Table 8. Estimated greenhousegas (GHG) emissions for farmland and animal husbandry based sources for four model farms.
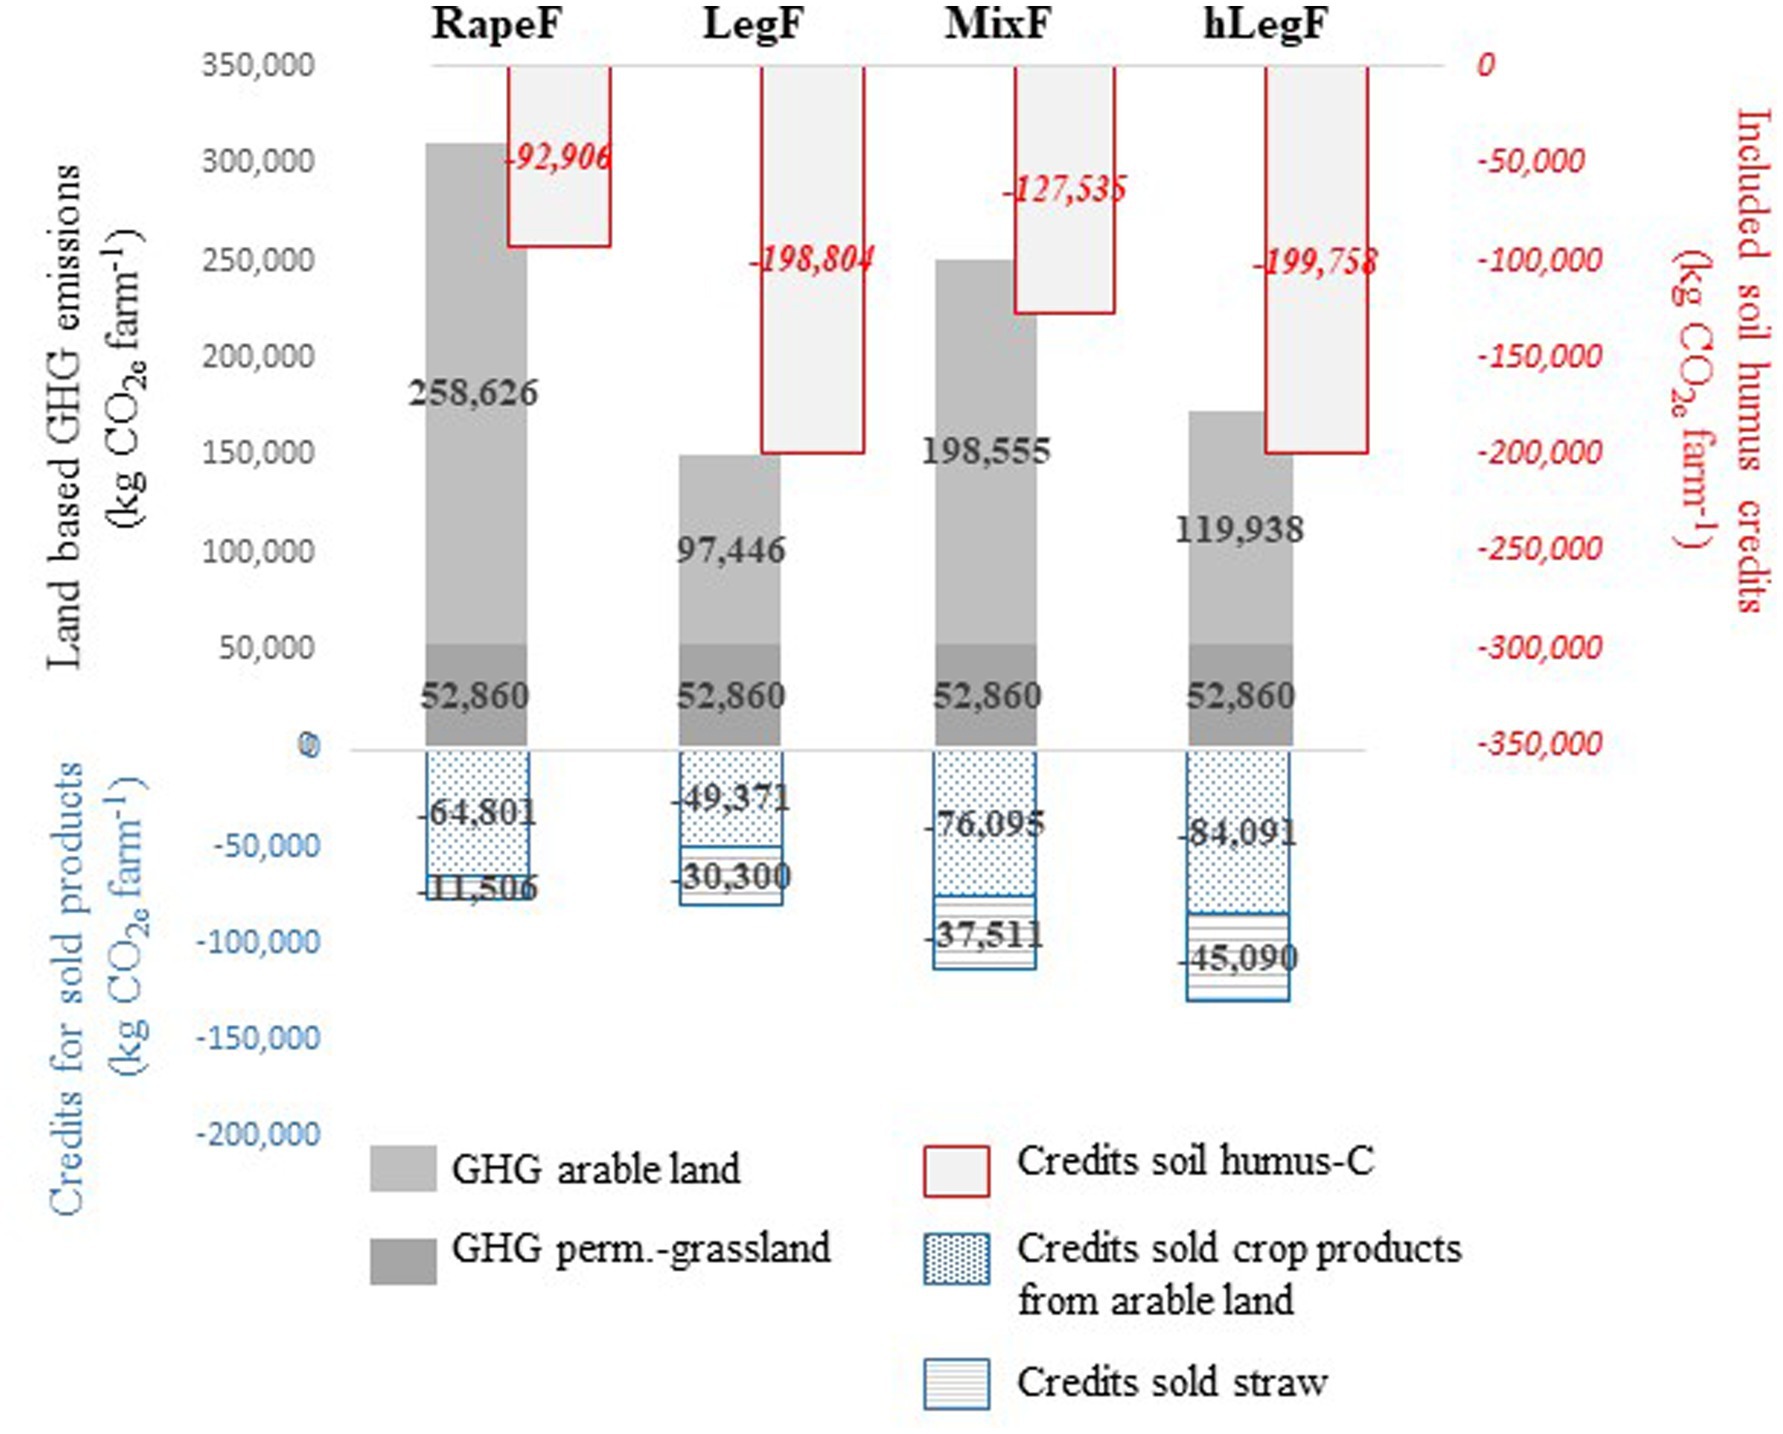
Figure 3. Estimated farmland-based greenhouse gas emissions and credits due to sold crop products from land and straw. Credits due to soil humus accumulation, already included estimated land use based GHG emissions, shown as well.
A further aim was to determine land based GHG emissions for fodder production of the four model farms and therefore GHG emissions or GHG credits attached to sold products such as grain or straw had to be determined and subtracted from the land-based GHG emissions.
Traded crops were mainly wheat-grain, oilseed-rape-oil and cereal straw in our model farms (Table 4). The farms varied significantly in sold wheat-grain, which was highest for the hLegF farm (121 t DM farm−1 year−1), followed by the MixF and LegF and lowest for the RapeF farm (14.7 t DM farm−1 year−1), as shown in Table 4. The oil fraction of oilseed-rape was sold externally, whereas the RES fraction was used internally. This required a splitting of the land requirement and attached GHG emissions between both fractions. The allocation was conducted according to the energy content of the fractions, allocating 35% of the GHG emission and land-requirement to the protein and 65% to the oilseed-rape-oil fraction. As a result of this allocation the model farms received some GHG carbon credits and some reduction in required landuse due sold products (Table 8).
The resulting GHG emissions for just fodder production per farm are shown in Table 8 and Figure 3 with emissions being by far the lowest in the hLegF farm with 43,617 kg CO2e farm−1 year−1 and the LegF farm with 70,635 kg CO2e farm−1 year−1. Equivalent values for the RapeF farm of 235,179 kg CO2e farm−1 year−1 were considerably higher, differing by even a factor of five and estimates for the MixF farm were in between. The required land area for fodder production was adjusted similarly. Land required for feed production and available land for externally traded products are shown in Figure 4. In contrary to GHG emissions the RapeF farm showed the least land requirement (74.7 ha), whereas the LegF farm showed highest requirements (90.5 ha), with the MixF and hLegF showing intermediate values (Figure 4).
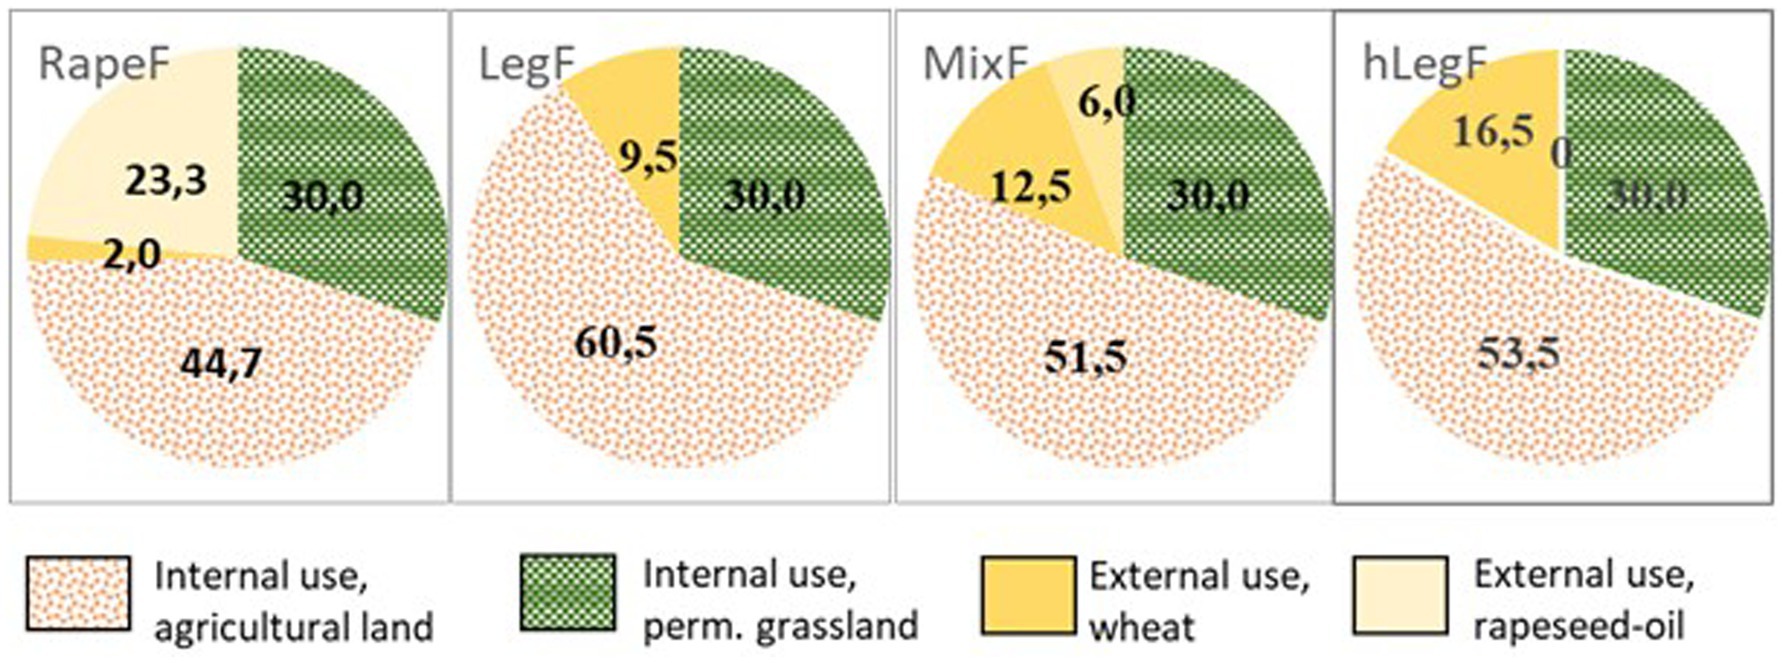
Figure 4. Land requirements for internal feed production and externally sold products for the four model farms.
Landuse based GHG emission can also be expressed in different units, such as per hectare fodder production or per kg fodder-DM. When GHG emissions were expressed in relation to fodder-DM then legume-ley dominated farms showed by far the lowest GHG emission values of 0.097 or 0.060 kg CO2e kg DM−1 compared to values of the RapeF farm (0.322 kg CO2e kg DM−1) differing by 70 to 81%, respectively (Table 8). Similarly the LegF and the hLegF farm showed considerably lower GHG emission per hectar fodder production (781 kg CO2e ha−1 year−1 and 522 kg CO2e ha−1) than the RapeF farm (3,148 kg CO2e ha−1 year−1), differing by 76 and 83%, respectively.
Landuse based GHG emissions need also to be shown in combination with respective animal husbandry based GHG emissions to be able to calculate product based GHG emission. The animal husbandry based GHG emissions due to enteric fermentation from 100 dairy cows (356,100 kg CO2e farm−1 year−1) and due to slurry storage (134,786 kg CO2e farm−1 year−1) are listed in Table 8. The GHG emissions of those two factors were similar for all the four model farms, since the cows received the same amount of concentrate feed and roughage.
The combined landuse and animal husbandry based GHG emissions can be expressed per dairy cow or per milk produced. Expressing them per dairy cow then again the LegF and hLegF farms showed lowest (5,615 or 5,345 kg CO2e cow−1 year−1), the MixF farm intermediate (6,287 kg CO2e cow−1 year−1) and the RapeF farm highest (7,261 kg CO2e cow−1 year−1) GHG emissions. Emission-values of the RapeF and the LegF farm differed by 24%. Similarly the product based GHG emissions such as GHG emission per milk (ECM) produced was highest in the RapeF farm (0.81 kg CO2e ECM−1) and considerable lower in the LegF farm (0.62 kg CO2e ECM−1), differing also by 24%, since milk production per cow and per farm were similar for all farm types.
Landuse based GHG emission and related units depend strongly on the estimated humus-C balance, which in turn can vary considerably owing to residue management of residue producing crops and the choice of input values used in the BEK calculation standards. The impact of residue management on estimated humus-C accumulation for some residue producing crops are shown in Table 7, where residue related CO2e-credits and estimated humus-C balances are listed. The impact of residue management on the soil humus balance is also shown in a small scale sensitivity analysis (Figure 5), where other major factors, such as slurry related humus accumulation and the crop specific humus accumulation and reduction input values (Ebertseder et al., 2014), are shown for comparison.
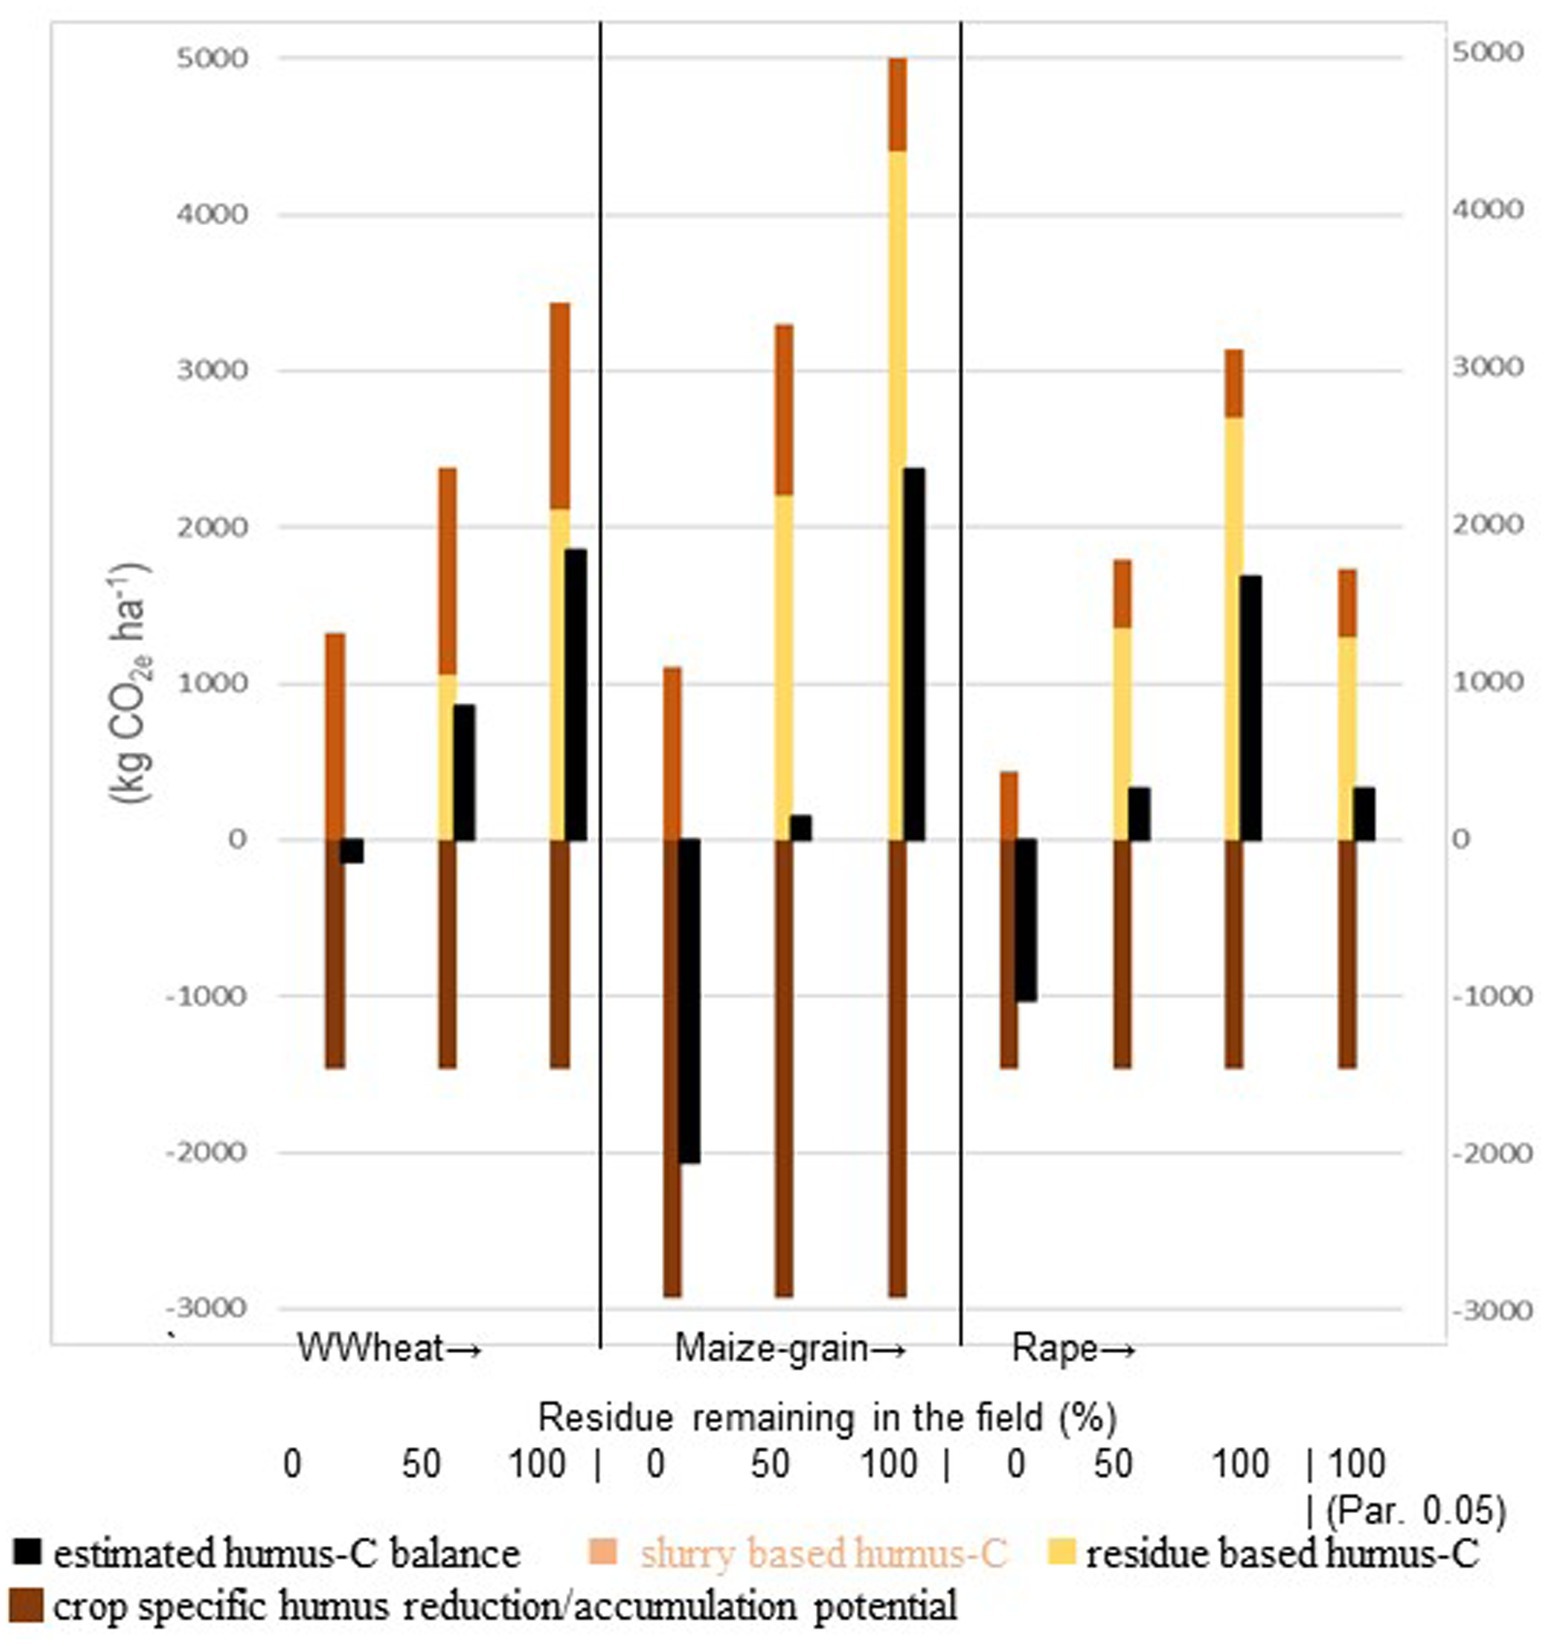
Figure 5. Estimated humus-C balances for residue containing crops such as wheat maize-grain and rape with a varying amount of residue remaining in the field. Additionally for rape the humification quotient was altered from 0.1 to 0.05 (Par. 0.05) in the last comparison (Slurry application rate; WWeat60 m3 ha−1 Maize-grain 40 m3 ha−1 Rape 20 m3 ha−1).
For cereals the amount of straw or residue remaining in the field had a marked effect on the estimated soil humus-C balance of the crop (Figure 5). Similarly for oilseed-rape, the estimated humus-C content varied markedly with residue management. The humus-C content was estimated to increase by 1,674 kg CO2e ha−1 year−1 when 100% residue remained in the field, whereas a reduction of −1,024 kg CO2e ha−1 year−1 was estimated when all residue was removed (Figure 5). Furthermore, the input-parameter that determines oilseed-rape residue humification rate is not well established and at the same time has a significant effect on the humus-C balance. Altering just this factor for oilseed-rape residue from 0.1 to 0.05 halved residue-based CO2e credits and reduced the estimated humus-C balance from 1,674 to 268 kg CO2e ha−1 (Figure 5). Altering this input value would increase the estimated GHG emissions for oilseed-rape from 2,346 to 3,534 kg CO2e ha−1 year−1. In comparison, an increase in diesel consumption from 115 L to 230 L ha−1 year−1 would increase the estimated GHG balance by 449 kg CO2e ha−1 year−1 only.
The model farm set up also allows to determine the N-flows to and from the farms, which are shown in Table 9. The N flows to the farm were mainly determined by N-fertilizer purchases. Potential N flows to the farm due to the N-rich RES fodder were deemed to be balanced with N-exports in the sold oilseed-rape grains, assuming negligible N-losses during processing. The N-balance at farmgate, considering the N-purchases minus N-sales, were markedly lower for the LegF farm (−593 kg N farm−1 year−1, −5.9 kg N ha−1 year−1) and the hLegF farms compared to the RapeF farm which showed the highest N-balance of 5.959 kg N farm−1 (59.6 kg N ha−1). The MixF farm showed an intermediate N balance of 1,725 kg N farm−1 year−1 (17.3 kg N ha−1 year−1). When estimated N2 fixation was included in the N-balance then the total-N-balance was quite similar for all four farm types, varying between 4,728 to 5,959 kg N farm−1 or 47 to 59 kg N ha−1 year−1.
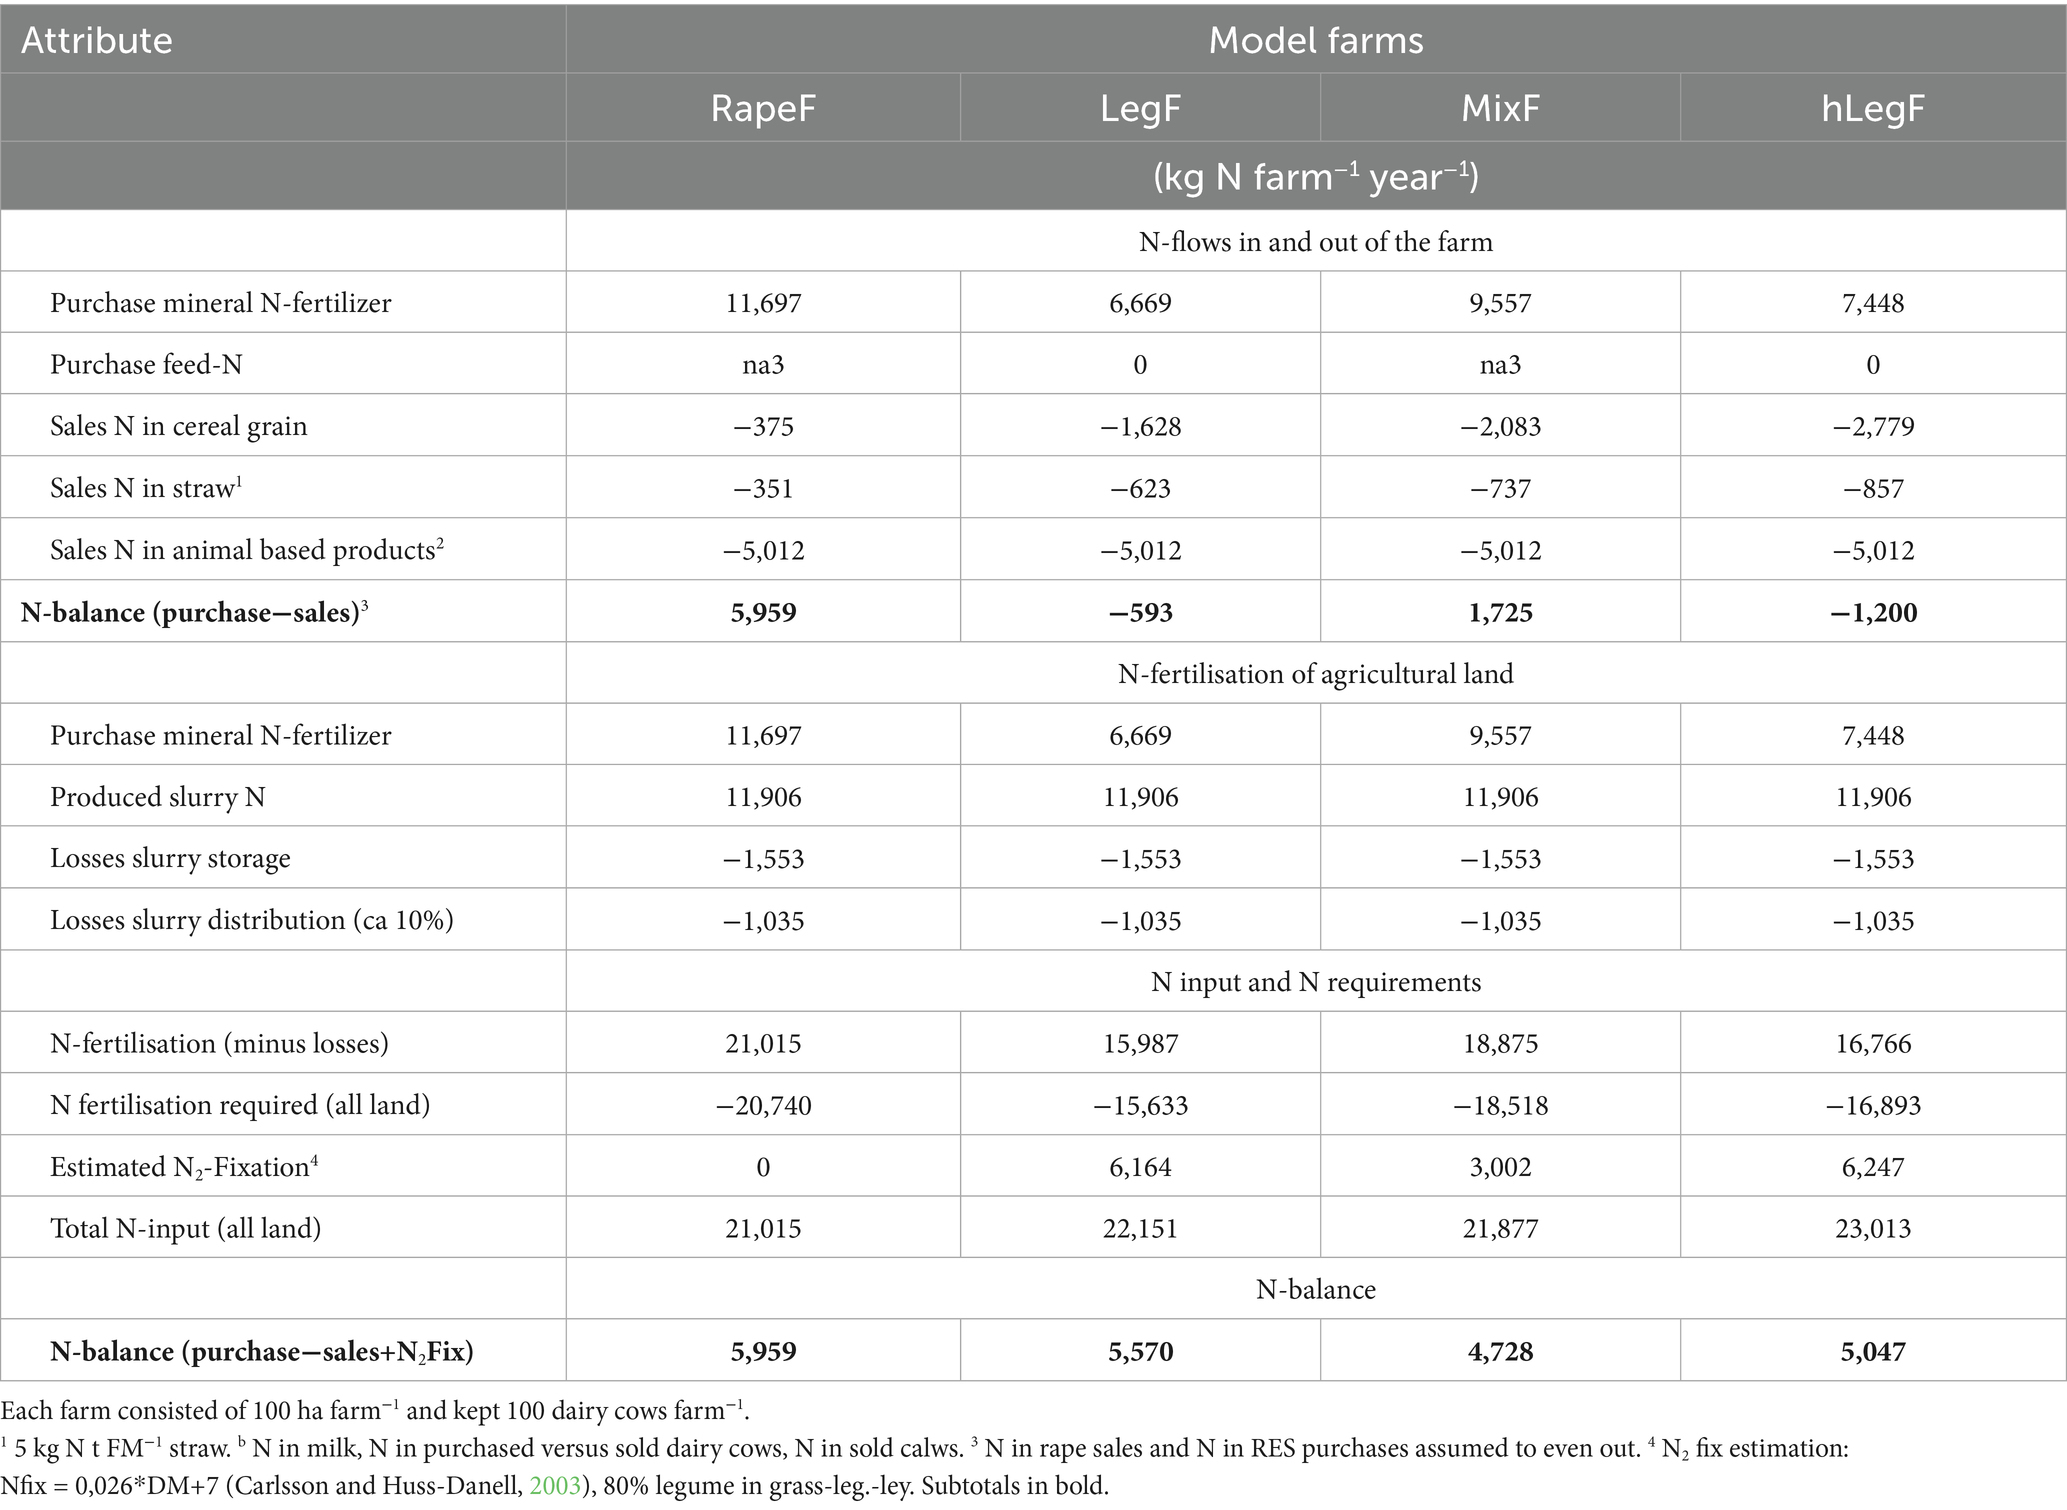
Table 9. Nitrogen (N)-flows in the four model farms varying in crop and fodder production.
4 Discussion
The implications of different feeding and dependent farming strategies on GHG emissions of dairy farms with a similar productivity level were assessed using the BEK calculation standards. The used approach deliberately embraced the whole farming enterprise since most practices have multiple interactive effects on GHG emissions throughout the farm. With a so called cradle to farmgate approach, which includes major external sources of GHG emissions, we could demonstrate, that the increased use of SSL-leys could reduce GHG emissions of dairy farms by a distinct margin. The estimated GHG emissions for different agricultural crops varied considerably from 5,954 kg CO2e ha−1 year−1 for maize-silage to −816 or even −1,414 kg CO2e ha−1 year−1 for Leg or hLeg crops, respectively. Oilseed-rape was somewhere in between with 2,346 kg CO2e ha−1 year−1 estimated GHG emission. Variations in GHG emissions were foremost based on the crop specific humus reduction/ accumulation input value (Ebertseder et al., 2014) and partly due to differences in fertilizer requirements and residue management.
For crops with a sizable amount of residue, such as rape, maize grain and cereals, the estimated amount of GHG emissions varied distinctly with residue management. This was at least the case using our approach, which meant assigning the humification potential of residue to the residue itself instead of the grain as the major tradeable product. Particularly for cereals, where straw can be exported, the estimated GHG emissions varied considerably depending on its use. The estimated GHG emission for wheat varied between 4,932 and 2,818 kg CO2e ha−1 year−1 depending whether straw was exported (and credits used elsewhere) or whether straw remained in the field or on the farm. Therefore straw management could be used as a tool to increase humus-C-balances on farms by making use of a sideproduct of lower financial value or alternatively used on an external farm. However, uncertainty of GHG assessments increase, when residue management is not known from purchased residue containing crops.
The residue of maize-grain and rape in our study was assumed to stay in the field. However, a high percentage of rape as a source for RES is imported (Statista, 2024) and residue management is most likely not known. Due to the uncertainties attached with the “GHG burden “of rape, it was directly assessed in our model farms although it generally is not grown to such an extent on dairy farms. The GHG balance of rape varied between 4,723 and 2,346 kg CO2e ha−1 year−1, depending whether 0% or 100% of the residue remained in the field. Some uncertainty arises due to the parameter “humus build up coefficient for by-products“. The parameter was established for cereal straw and was used for rape due to lack of a rape specific parameter. However, rape straw has a higher water content and a lower C/N ratio than cereal straw (Gan et al., 2011) and may humify to a different extent. The “humus build up coefficient” has a considerable impact on the estimated soil humus-C balances and in consequence on the crop specific GHG emissions of rape (and RES) and other residue containing crops (Figure 3).
The soil humus balance in general was a key factor when crop specific GHG emissions were estimated (Figure 3; Table 8). The crop specific input value for “humus accumulation/reduction” (Ebertseder et al., 2014) was, beside residue management, the major input value affecting the estimated, crop specific soil humus-C balance. For legume-dominated leys, the input value for soil humus accumulation was comparably high and as a result the overall GHG emissions for this crop was estimated to be negative. Admittedly, the used VDLUFA approach for estimating soil carbon changes has been questioned recently, demonstrating little correlation between estimated and measured soil humus values from mid- and longterm trials (Rainford et al., 2024). However, when only longterm data (>37 years) and the effect of residue and organic fertilizer input were considered, then the correlation between measured and estimated soil carbon content improved significantly (Rainford et al., 2024). Additionally, the effect of a change in crop rotation on soil humus-C content was not the focus of this mentioned study. Despite the considerable uncertainties attached to estimating soil carbon changes, it still cannot be omitted in GHG assessments, since those changes can affect the global warming potential markedly (Knudsen et al., 2019). Furthermore, actual increases in soil organic carbon levels have indeed been measured in a number of field studies after including leys in the crop rotation (Prade et al., 2014; Triberti et al., 2016; Loges et al., 2018; Guillaume et al., 2022; Hu and Chabbi, 2022; Jensen et al., 2022; Malisch et al., 2024) suggesting a positive effect of this management strategy. Increases in soil carbon content may also be enabled by less frequent soil preparation of these multiannual ley crops.
The choice of fodder crops with dependent crop specific GHG balances affected the estimated GHG emissions of the four model farms substantially. The sum of GHG emissions estimated for arable land varied from 258,626 to 97,446 kg CO2e farm−1 year−1 for the four model farms, mainly due to including SSL-leys on farms (Figure 3). This was shown by the considerable difference in GHG emission between the RapeF and LegF model farm. This marked difference remained when GHG emissions attached to sold products were subtracted and GHG emission for fodder production was calculated. The GHG emissions based on fodder production were reduced from 235,179 to 70,635 kg CO2e farm−1 year−1, when changing from a conventional RapeF to a LegF farmtype. This change in crop selection would allow for GHG reductions of 169,544 kg CO2e farm−1 year−1.
These marked savings in GHG emissions due to choosing clover-gras leys as a major protein crop (see above: 169,544 kg CO2e farm−1 year−1) are on a comparable scale to GHG emissions due to slurry storage plus stable related slurry emissions (134,786 kg CO2e farm−1 year−1). Estimated savings were close to half the amount originating from enteric fermentation (356,100 kg CO2e farm−1 year−1) for those model farms. This agrees with other studies that found fodder based GHG emission even to be a similar seized source of GHG emissions compared to enteric fermentation based emission (Frank et al., 2019). Absolute values of GHG emission still need to be related to farm productivity to make values comparable to farms differing in productivity levels.
To include farm productivity the estimated GHG emissions are generally expressed in relation to different units such as per milk output, per cow, per ha fodder production, per sold-products and even a biophysical allocation method has been discussed (Ineichen et al., 2022). When estimated GHG emissions are related to land used for fodder production, the cultivation of SSL as fodder reduced the average GHG emissions from 3,148 kg CO2e ha−1 year−1 to 781 kg CO2e ha−1 year−1 for fodder production for the LegF and the RapeF farm, respectively. Reductions on a similar scale from 2,100 kg CO2e ha−1 year−1 to 600–800 kg CO2e ha−1 year−1 were reported by switching from a cereal dominated to a grass-clover containing rotation (Björnsson and Prade, 2014) and from 2,578 kg CO2e ha−1 year−1 to 341 kg CO2e ha−1 year−1 by changing from a conventional to a SSL ley containing fodder regime (Reinsch et al., 2021).
Similarly, when GHG emission are expressed on a fodder per cow basis the benefit of using SSL leys is shown by the marked difference between the RapeF farm of 2,352 kg CO2e cow−1 year−1 and the LegF farm of 706 kg CO2e cow−1 year−1. Values for the LegF farm were even lower than the 1,820 kg CO2e cow−1 year−1 estimated for a range of mainly grass-based systems in Switzerland (Ineichen et al., 2022).
Estimated GHG emissions related to the amount of human consumable products, which was energy corrected milk (ECM), in our model approach, revealed a similarly substantial benefit of SSL. The estimated GHG emission of LegF farm based milk of 0.62 kg CO2e kg ECM−1 was notably lower than the 0.81 kg CO2e kg ECM−1 estimated for the RapeF farm. These values are on the lower end of the scale usually reported in other studies of generally 0.8–1.3 kg CO2e kg ECM−1 (Kristensen et al., 2011; O’Brien et al., 2012; Zehetmeier et al., 2014; Ineichen et al., 2024). Omitting heifer production as a source of GHG emission must have caused the comparably low estimated emissions per sold product in our study since heifer production generally amounts to about 21–24% of total CO2e emissions in dairy farms (Köke et al., 2021; Ineichen et al., 2022). By increasing our values by 21–24% they fall in the range of values generally estimated for existing farms. Despite low absolute values, the relative differences between our model farms can still be used for direct comparisons.
The observed relative differences in GHG emissions of 0.19 kg CO2e kg ECM−1 by changing from a rape-maize-silage (RapeF) to a legume-ley dominated farming model (LegF) would equate to a sizable reduction of 24% of the carbon footprint of milk. Findings are in agreement with reported differences in the GHG product footprint of 0.3 kg CO2e kg ECM−1 (Reinsch et al., 2021; carbon credits included), when an intense conventional farm was compared with a grass-clover-leys based farm with lower milk output. Again, values reveal a significant potential for GHG reductions by using SSL-leys as a major fodder crop.
In all absolute or relative units that modelled GHG emissions were expressed, the benefit of using SSL-leys to reduce GHG emissions were found to be substantial and in agreement with estimated values for existing farms. Comparing our modelled with measured farm data can be questioned since modelling whole farming complexes are inevitably based on a number of assumptions (Köke et al., 2021; Reinsch et al., 2021) and on omitting reality based details. However, also GHG balances of existing farms are based on a number of assumptions (Elmiger et al., 2024) and input information can be imprecise or incomplete at times (Frank et al., 2019). Besides, modelling is a necessary tool to assess new or rarely used feeding and related landuse strategies and their impact on GHG emissions. However, the modelled reductions of 23% of GHG emission per hectar (including landuse and animal husbandry sources) for the LegF compared to the RapeF farm were also determined in an independent modelling approach using the Austrian model Farmlife (www.farmlife.at; data not shown), substantiating current findings. The modelled reductions in GHG emissions due to including SSL leys in crop rotations are large and thus should be paid attention to in the future, when GHG conserving management options may be sought after.
The significant reductions in GHG emissions due to using SSL legumes instead of RES as protein source were estimated by even using conservative values for the product RES. The GHG burden of 1 kg RES in our study can be estimated to be 0.354 kg CO2e kg DM−1 (2,346 kg CO2e ha−1 *0,35 allocation factor protein/ 3,800* 0.61 kg RES-DM ha−1). This value is conservative since it omits carbon costs of transport and industrial processes. A significantly higher value of 0.548 kg CO2e kg DM−1 was determined for RES in a life cycle analysis (Hörtenhuber et al., 2011) including these processes. Differences in farm GHG emissions would even be more marked when a legume based feeding ration would be compared to a soybean meal based one. The estimated GHG emission of soybean meal produced exclusively in the Ukraine of 0.363 kg CO2eq kg soybean meal−1 (Zamecnik, 2023) is comparable to our estimated values for RES. Imported soy for the European Union was mentioned to have on average a GHG footprint of 0.77 kg CO2e kg soy−1 (Escobar et al., 2020). However, using a LCA analysis and including GHG emissions due to land use changes for soybean meal used in Europe a considerably higher GHG footprint of 3.05 kg CO2e kg DM−1 was estimated by Tallentire et al. (2018) and of 3.28 kg CO2e kg DM −1 by Hörtenhuber et al. (2011). The range in estimated GHG footprints of soybean meal is large and demonstrates the complexity of this issue in terms of chosen base values and system boundaries. At the same time the mentioned GHG burden of RES or soybean meal are generally higher than values used in the current comparison. This suggests that the sizable savings in GHG emissions by using SSL as protein source in European dairy farms are estimated on a conservative basis in this study and could be considerably larger.
The feeding strategies and thus the choice of arable crops affected a number of further aspects, such as the N mass flow to and from the farm, land requirement for feed production and last but not least the revenue for farmers, which usually promotes the acceptance of new management options by farmers.
The N mass flow to SSL cultivating farms was significantly reduced compared to a conventional farm (RapeF). The ability of legumes for symbiotic N2-fixation reduced the need for N-fertilizer (Table 9) and as a consequence the N-input to farms by up to 5,028 kg N farm−1 or 43% compared to the conventional farm. At the same time N-exports in plant based products were even somewhat increased compared to the conventional RapeF farm. This arose since the biological N-input to the LegF farm due to N2-fixation of legumes (6,164 kg N farm−1 year−1) plus purchased N-fertilizer, was estimated to be higher than the purchased N-input to the conventional farm. The N mass flow in animal feed purchases was not a factor in our study, since rape as protein source for RES was grown locally on the farms and only rape-oil was traded externally. The environmentally important N balance per hectare was about equal for the four model farms and suggested an N surplus of 47–59 kg N ha−1 year−1, when N2 fixation was taken into account.
The crop specific N requirements minus slurry supplied N determined the N-flow to farms. The slurry-N content of all model farms were kept similar although it can be argued that feeding rations with a higher RNB (LegF, hLegF) result in higher urinary N excretion and in consequence in a higher slurry N-concentration. The RNB between the LegF and the RapeF farm differed by 2.3 g N kg DM−1 feed, which is equal to 46 g N day−1 cow−1 which in turn increases milk urea N concentration (Jilg et al., 1997) and urinary nitrogen excretion (Spek et al., 2013). Using correlations from both authors the urinary N excretion of dairy cows were estimated to be 48 and 60 kg N cow−1 year−1 in the RapeF and LegF farm, respectively. Adding fecal N-excretion of 62 kg N cow−1 year−1 (Huhtanen et al., 2008) the total N excretion would be 110 and 122 for cows in the RapeF and LegF farm, respectively, close to the assumed 119 kg N cow−1 year−1. The RNB based difference in N excretion between those two farm models would be 12 kg N cow−1 year−1 or 1.200 kg N farm−1 year−1. Enhanced slurry N concentrations would arise on SSL leys rich farms with an enhanced RNB in the fodder. However, if slurry-N is analyzed by farmers, then increases in N-concentrations would result in a reduced need for mineral N fertilizer applications and the net changes to estimated GHG emissions are not likely to be significant. If slurry-N was not analyzed, the increase of 1,200 kg N farm−1 year−1 in internal N mass flow would equate to N2O based GHG emissions of 7,534 kg CO2e farm−1 year−1 if slurry was land applied. Stable and storage based N-losses (NH3, N2O) and related GHG emission would also be enhanced by estimated 3,557 CO2e farm−1 year−1 (BEK, KTBL, 2024). Both estimates together are still low compared to a difference in GHG emissions of 164,897 kg CO2e farm−1 year−1 between the LegF and RapeF farms.
The difference in N mass flows to farms obviously affected estimated GHG emissions of farms, since this affects energy requirements for N-fertilizer production, N2O losses during N fertilizer application and N2O losses during N-rich residue decomposition. The estimated differences in N purchase of 5,028 kg N farm−1 as mineral fertilizer between the LegF and RapeF farm would equate to about 17,699 kg CO2e farm−1 (3.52 kg CO2e kg N−1 during the production of mineral N fertilizer in Europe (Arbeitsgruppe-BEK, 2021). These emissions are effectively saved in legume based farms since there is no evidence for significant GHG emissions arising due to symbiotic N2-fixation (IPCC, 2006; Rochette and Janzen, 2005; Barton et al., 2011). The N2O losses from mineral N fertilizer application are a second but larger source of GHG emission (29,758 kg CO2e for 5,028 kg N farm−1 year−1) which can be reduced in legume-leys due to their lower N-fertilizer requirements. Significant reductions of N2O based GHG emissions using legume compared to grass leys were measured in field experiments (Schmeer et al., 2014). The third element, the extent of N2O emissions from residue and in particular legume root residue derived N was broadly factored in by the model by stating the N-content of roots and residues but omitting the fact that this aspect depends on synchronization of N supply and N uptake of crops. Nevertheless, the residue-N based GHG emissions of SSL-leys on 37 hectare (LegF) was estimated to be increased by 9,368 kg CO2e year−1 when compared grass-leys (when compared to a wheat crop it would be increased by 14,558 kg CO2e year−1). Those three mentioned nitrogen based differences in GHG emissions sum up to 38,088 kg CO2e farm−1 year−1 and are significant, but only a part of the modelled differences in GHG emissions of 164,897 kg CO2e farm−1 year−1 between the RapeF and LegF farm.
Fodder crops may be selected based on their effect on GHG emissions, but from a farmers perspective the land requirement of the respective crop is a more important concern since land is often a limiting factor (Ineichen et al., 2023) and spare land can be used to grow tradeable products to increase farm revenues. When calculating land requirement for fodder production of the model farms, the land use by rape needed to be allocated either to internally used RES or the externally traded rape-oil. Land requirement for RES and oil was split according to the energy content, 0.35 to 0.65 (Majer et al., 2015). Since the major portion of rape occupied land was allocated to externally traded oilseed-rape oil, the effective landuse for fodder production was considerably lower for the conventional RapeF (74.7 ha, Table 8) than for the LegF farm (90.5 ha). This enhanced landuse is a notable disadvantage for SSL based farms affecting both from environmental and financial aspects. The landuse could be reduced with high yielding legume-grass leys (83.5 ha, hLegF) and also with a mixed feeding strategy (81.5 ha, MixF).
The MixF farming type in general was set in between the two extremes of either a SSL ley dominated and an oilseed-rape plus maize-silage dominated feeding and farming strategy. The estimated savings in GHG emission by the MixF farm are just slightly more than half the amount gained by using the LegF strategy. For example landuse based GHG emission per ha fodder production could be reduced by 42% in the MixF farm compared to 70% by the LegF farm, using the conventional model farm as the standard. Similarly, the product based GHG emissions per ECM in the MixF farm could be reduced by 14% compared to 24% by the LegF farm. These savings in GHG emissions of the MixF farm model are still substantial compared to the conventional farm type while land requirements were intermediate compared to the conventional farm. The MixF farm may also be a safe option in terms of phytosanitary problems, since the clover-ley proportion was only 25% of arable land compared to 53% in the LegF farm.
Phytosanitary issues may possibly arise, when a high percentage of SSL is included in the crop rotation, since they are known for their self-incompatibility. To sustain legume dominated leys encompassing 43 to 53% of the arable land, as in the hLegF and LegF farm, may be difficult over an extended period of time. But then it still allows for a three year break in the rotation, when SSL-leys are cultivated for three years in a row. Furthermore, successful farming with a considerable percentage of clover-grass leys in the rotation has been described previously for organic farms (Reinsch et al., 2021). Further research is needed to determine a feasible maximum or optimum percentage of SSL-leys that can be sustained in a crop rotation also for conventional agriculture.
The comparison of model farms differing in their extent of cultivating SSL based fodder have shown that substantial reductions in GHG emissions from agricultural land (Table 10) can be achieved by including SSL in the rotation while making use of locally produced protein. These reductions are feasible at least under moderate climatic conditions, where water requirements for SSL growth are met. These marked GHG reductions were largely based on an increased soil humus-C balance due to SSL-leys crops and further enabled by the reduced N purchases of those farms. Then again, disadvantages in terms of enhanced land requirements for fodder production and a reduced availability of land for tradeable products exist. It appears to be difficult to optimize all criteria at the same time (Table 10). A compromise in fulfilling contrary demands is depicted by the MixF farm model showing intermediate reductions in GHG emissions, intermediate land requirements while avoiding the risk for phytosanitary problems. All criteria could only be optimized with high yielding legume-grass leys (hLegF) enabling reduced fodder landuse but ongoing high yields of clover-grass leys may only be possible in selected growth areas favorable for legumes.
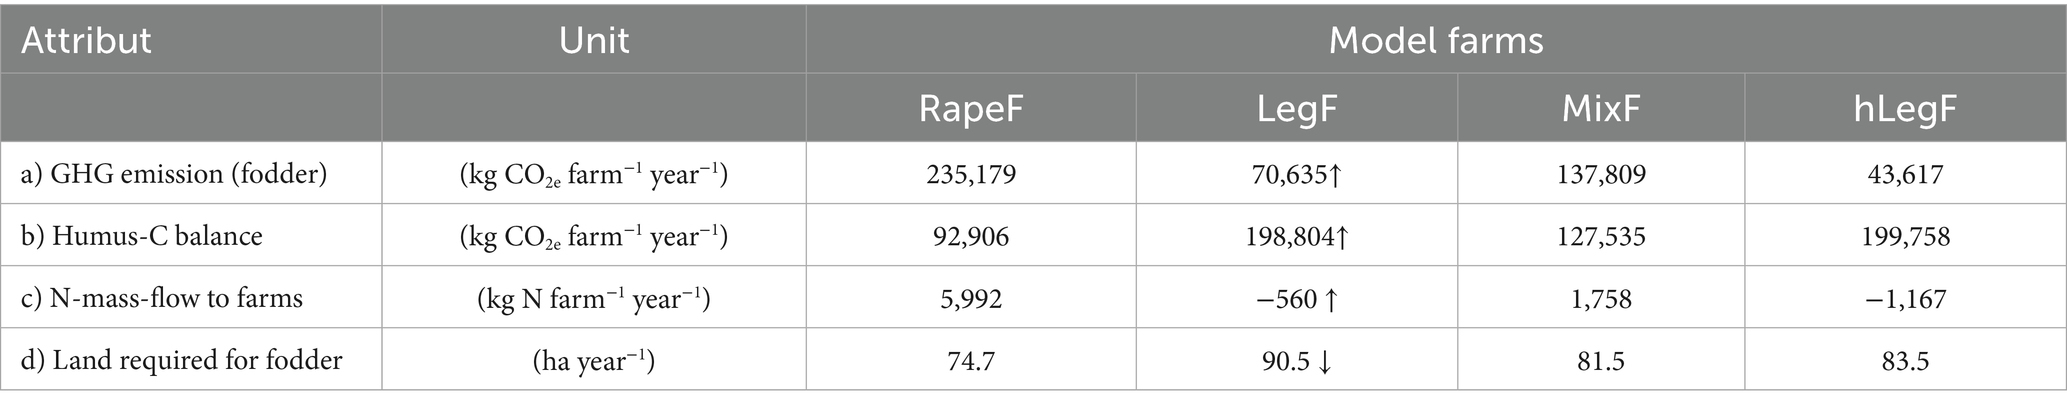
Table 10. Selected criteria to judge the respective benefit of each model farm.
The choice of fodder production determines the criteria which will be optimized (Gislon et al., 2020). If GHG reductions in the dairy system is deemed to be the most important criteria then SSL dominated systems are the most favorable option. However, since land use and presumably related financial revenues show disadvantages for these farm types, the farmers most likely would choose a conventional or mixed farm type. If GHG savings for all arable land is to be rewarded financially the dominant use of SSL as fodder would be of interest to farmers while ensuring high productivity of dairy cows and reducing GHG emissions at the same time. In the meantime increasing the landuse of SSL dominated leys combined with a mixed feeding strategy still offers a practical option to allow for sizeable reductions in GHG emissions in the dairy system.
4.1 Conclusion
The use of a SSL ley based feeding regime for dairy cows and the dependent land use resulted in marked reductions in GHG emissions, partly due to an increase in estimated soil humus-C and supported by a reduced N-Mass flow to farms when compared to a common feeding regime based on maize-silage and RES. Savings in terms of GHG emissions were considerable and on a magnitude comparable to GHG emissions arising from slurry in the stable and during storage. The magnitude of changes in GHG emissions makes a legume-ley based feeding ration a potent tool to reduce GHG emissions in dairy production, particularly since those changes are easily implemented. Interesting to note is that the more tangible factors for GHG emissions such as diesel consumption and N-fertilizer purchases have a lesser effect on GHG emissions compared to less tangible factors such as N2O emissions or scantly recorded factors such as residue management. Although SSL-ley based feeding strategies were the best option to decrease GHG emissions it also showed some disadvantages such as increased land requirement for fodder production and in consequence reduced available land for tradeable products. All three aspects can only be optimized by cultivating high yielding legume-grass leys. A mixed feeding strategy and dependent landuse is an easy to be implemented compromise, achieving moderate reductions in GHG emissions and N-purchases combined with moderate changes in land requirement. In any case, the use of SSL-leys is an effective and easily applicable tool to reduce GHG emissions of dairy farms, which can be up or downscaled, depending on farming circumstances.
Data availability statement
The raw data supporting the conclusions of this article will be made available by the authors, without undue reservation.
Author contributions
KW: Data curation, Formal analysis, Methodology, Writing – original draft, Writing – review & editing. EG: Conceptualization, Investigation, Writing – review & editing. JM: Conceptualization, Funding acquisition, Project administration, Resources, Supervision, Validation, Writing – review & editing.
Funding
The author(s) declare that financial support was received for the research and/or publication of this article. This research was funded by the federal state government of Baden-Württemberg grant number (0369E).
Acknowledgments
The authors would like to thank the staff of the LAZBW-divisions of “Grünland” and “Fachbreich 1 “for their reliable input to this research project. We are grateful to the LAZBW for providing general facilities. We would like to thank the Ministerium für Ländlichen Raum (MLR) from baden Württemberg for supporting the project.
Conflict of interest
The authors declare that the research was conducted in the absence of any commercial or financial relationships that could be construed as a potential conflict of interest.
Generative AI statement
The author(s) declare that no Gen AI was used in the creation of this manuscript.
Publisher’s note
All claims expressed in this article are solely those of the authors and do not necessarily represent those of their affiliated organizations, or those of the publisher, the editors and the reviewers. Any product that may be evaluated in this article, or claim that may be made by its manufacturer, is not guaranteed or endorsed by the publisher.
Supplementary material
The Supplementary material for this article can be found online at: https://www.frontiersin.org/articles/10.3389/fsufs.2025.1583852/full#supplementary-material
References
Albaladejo Román, A. (2023). EU protein strategy. (accessed November 2024). Available online at: https://www.europarl.europa.eu/RegData/etudes/BRIE/2023/751426/EPRS_BRI(2023)751426_EN.pdf
Arbeitsgruppe-BEK. (2021). Berechnungsstandard für einzelbetriebliche Klimabilanzen (BEK) in der Landwirtschaft. Handbuch, Darmstadt, Kuratorium für Technik und Bauwesen in der Landwirtschaft e. V., 2. Auflage. Available online at: www.ktbl.de (accessed May 2024)
Barton, L., Butterbach-Bahl, K., Kiese, R., and Murphy, D. V. (2011). Nitrous oxide emissions from a cropped soil in a semi-arid climate. Glob. Change Biol. 17, 1153–1166. doi: 10.1111/j.1365-2486.2007.01474.x
BEK, KTBL. (2024). Available online at: https://www.ktbl.de/themen/bek (accessed May 2024)
Björnsson, L., and Prade, T. (2014). Introduction of grass clover crops as biogas feedstock in cereal dominated crop rotations. Part II: effects on greenhouse gas emissions. 9th International Conference LCA of Food, San Francisco, USA, 11–18.
Bruckner, A., and Blumenstein, B. (2024). NutriNet Merkblatt: Verlustarme Ausbringung von Wirtschaftsdüngern. BÖL-Bundesprogramm ökologischer Landbau, Bundesministerium für Ernährung und Landwirtschaft.
Carlsson, G., and Huss-Danell, K. (2003). Nitrogen fixation in perennial forage legumes in the field. Plant Soil 253, 353–372. doi: 10.1023/A:1024847017371
Ebertseder, T., Engels, C., Heyn, J., Reinhold, J., Brock, C., Fürstenfeld, F., et al. (2014). Humusbilanzierung. Eine Methode zur Analyse und Bewertung der Humusversorgung von Ackerland.
Elmiger, N., Ineichen, S., Grenz, J., and Reidy, B. (2024). Auswirkungen unterschiedlicher Fütterungs- und Weideamteile auf die Treibhausgasemissionen von Milchkuhbetrieben. Internationale Weidetagung- Tagungsband, 43–46.
Escobar, N., Tizadoc, E. J., Ermgassend, E. K. H. J., Zu Löfgrenf, P., and Börner, J. (2020). Spatially-explicit footprints of agricultural commodities: mapping carbon emissions embodied in Brazil’s soy exports. Glob. Environ. Chang. 62:102067. doi: 10.1016/j.gloenvcha.2020.102067
Frank, H., Schmid, H., and Hülsbergen, K.-J. (2019). Modelling greenhouse gas emissions from organic and conventional dairy farms. J. Sustainable Organic Agric. Syst. 69, 37–46. doi: 10.3220/LBF1584375588000
Fritz, C. (2022) Maßnahmen THG Reduktion-Endbericht. 2. Analyse der Effizienz von Maßnahmen zur Reduktion von Treibhausgas-Emissionen. Endbericht zum Projekt Nr. 101324, HBLFA Raumberg Gumpenstein
Fuß, R., Vos, C., and Rösemann, C.. (2024). Treibhausgasemissionen aus der Landwirtschaft. Available online at: https://www.thuenen.de/de/themenfelder/klima-und-luft/emissionsinventare-buchhaltung-fuer-den-klimaschutz/treibhausgas-emissionen-aus-der-landwirtschaft (accessed December 2024)
Gan, Y. T., Liang, B. C., Liu, L. P., Wang, X. Y., and McDonald, C. L. (2011). C:N ratios and carbon distribution profile across rooting zones in oilseed and pulse crops. Crop Pasture Sci. 62, 496–503. doi: 10.1071/CP10360
GfE. (2001). GfE- Empfehlungen zur Energie und Nährstoffversorgung der Milchkühe und Aufzuchtrinder. Energie- und Nährstoffbedarf landwirtschaftlicher Nutztiere Nr. 8. DLG-Verlag.
Gislon, G., Ferrero, F., Bava, L., Borreani, G., Dal Pra, A., Pacchioli, M. T., et al. (2020). Forage systems and sustainability of milk production: feed efficiency, environmental impacts and soil carbon stocks. J. Clean. Prod. 260:121012. doi: 10.1016/j.jclepro.2020.121012
Guggenberger, T., Herndl, M., Terler, G., Fritz, C., Grassauer, F., Zamberger, I., et al. (2020). Gesamtheitliche Ökoeffizienz von Milchviehbetrieben. 47. Viehwirtschaftliche Fachtagung, Höhere Bundeslehr- Und Forschungsanstalt Für Landwirtschaft, Raumberg-Gumpenstein, 63–79
Guillaume, T., Makowski, D., Libohova, Z., Elfouki, S., Fontana, M., Leifeld, J., et al. (2022). Carbon storage in agricultural topsoils and subsoils is promoted by including temporary grasslands into the crop rotation. Geoderma 422:115937. doi: 10.1016/j.geoderma.2022.115937
Herrmann, K., Elsäßer, M., and Jilg, T. (2011). Nachhaltige Milchproduktion in Baden-Württemberg. Eine regionale Bewertung. Aulendorf: LAZBW.
Hörtenhuber, S. J., Lindenthal, T., and Zollitsch, W. (2011). Reduction of greenhouse gas emissions from feed supply chains by utilizing regionally produced protein sources: the case of Austrian dairy production. Journal of the Science of Food and Agriculture, 91, 1118–1127.
Hu, T., and Chabbi, A. (2022). Grassland management and integration during crop rotation impact soil carbon changes and grass-crop production. Agric. Ecosyst. Environ. 324:107703. doi: 10.1016/j.agee.2021.107703
Huhtanen, P., Nousiainen, J. I., Rinne, M., Kytölä, K., and Khalili, H. (2008). Utilization and partition of dietary nitrogen in dairy cows fed grass silage-based diets. J. Dairy Sci. 91, 3589–3599. doi: 10.3168/jds.2008-1181
Hülsbergen, K.-J. (2003). Entwicklung und Anwendung eines Bilanzierungsmodells zur Bewertung der Nachhaltigkeit landwirtschaftlicher Systeme. Aachen: Shaker Verlag, 240.
Huyen, N. T., Desrues, O., Alferink, S. J., Zandstra, T., Verstegen, M. W., Hendriks, W. H., et al. (2016). Inclusion of sainfoin (Onobrychis viciifolia) silage in dairy cow rations affects nutrient digestibility, nitrogen utilization, energy balance, and methane emissions. J. Dairy Sci. 99, 3566–3577. doi: 10.3168/jds.2015-10583
Ineichen, S., Elmiger, N., Grenz, J., and Reidy, B. (2024). Nettoproteinerzeugung und Klimagasemissionen von graslandbasierten Milchviehbetrieben. Klimaschutz Und Klimawandelanpassung Im Grünland, AGGF Tagungsband, 66. Jahrestagung, 33–35
Ineichen, S., Schenker, U., Nemecek, T., and Reidy, B. (2022). Allocation of environmental burdens in dairy systems: expanding a biophysical approach for application to larger meat-to-milk ratios. Livest. Sci. 261:11. doi: 10.1016/j.livsci.2022.104955
Ineichen, S., Zumwald, J., Reidy, B., and Nemececk, T. (2023). Feed-food and land use competition of lowland and mountain dairy cow farms. Animal 17:12. doi: 10.1016/j.animal.2023.101028
IPCC. (1997). Revised 1996 IPCC guidelines for national greenhouse gas inventories. [accessed July 2024] Available online at: https://www.ipcc-nggip.iges.or.jp/public/gl/invs1.html
IPCC. (2006). IPCC guidelines for national greenhouse gas inventories. Agriculture, forestry and other landuse. [accessed December 2024]. Available online at: https://www.ipcc-nggip.iges.or.jp/public/2006gl/
IPCC. (2019). Refinement to the 2006 IPCC guidelines for national greenhouse gas inventories [accessed October 2024]. Available online at: https://www.ipcc.ch/report/2019-refinement-to-the-2006-ipcc-guidelines-for-national-greenhouse-gas-inventories/#report-chapters
Jensen, J. L., Beucher, A. M., and Eriksen, J. (2022). Soil organic C and N stock changes in grass-clover leys: effect of grassland proportion and organic fertilizer. Geoderma 424:116022. doi: 10.1016/j.geoderma.2022.116022
Jensen, E. S., Peoples, M. B., Boddey, R. M., Gresshoff, P. M., Hauggaard-Nielsen, H., Alves, B. J. R., et al. (2012). Legumes for mitigation of climate change and the provision of feedstock for biofuels and biorefineries. A review. Agron. Sustain. Dev. 32, 329–364. doi: 10.1007/s13593-011-0056-7
Jeuffroy, M. H., Baranger, E., Carrou’ee, B., Chezelles, E.de, Gosme, M., Henault, C., et al. (2013). Nitrous oxide emissions from crop rotations including wheat, oilseed rape and dry peas. Biogeosciences, 10, 1787–1797. doi: 10.5194/bg-10-1787-2013
Jilg, T., Steingaß, H., and Diebold, G. (1997). Einfluß der ruminalen Stickstoffbilanz (RNB) auf Milchleistung und Milchharnstoffgehalt. [accessed December 2024]. Available online at: https://www.landwirtschaft-bw.de/,Lde/Startseite/Service/Einfluss+der+ruminalen+Stickstoffbilanz+_RNB_
Johansen, M., Lund, P., and Weisbjerg, M. R. (2018). Feed intake and milk production in dairy cows fed different grass and legume species: a meta-analysis. Animal 12, 66–75. doi: 10.1017/S1751731117001215
Kassow, A., Blank, B., Paulsen, H. M., Aulrich, K., and Rahmann, G.. (2009). Studies on greenhouse gas emissions in organic and conventional dairy farms. Ressortforschung Für Den Ökologischen Landbau, 65–76.
Knapp, J. R., Laur, G. L., Vadas, P. A., Weiss, W. P., and Tricarico, J. M. (2014). Enteric methane in dairy cattle production: quantifying the opportunities and impact of reducing emissions. J. Dairy Sci. 97, 3231–3261. doi: 10.3168/jds.2013-7234
Knudsen, M. T., Dorca-Preda, T., Djomo, S. N., Pena, N., Padel, S., Smith, L. G., et al. (2019). The importance of including soil carbon changes, ecotoxicity and biodiversity impacts in environmental life cycle assessments of organic and conventional milk in Western Europe. J. Clean. Prod. 215, 433–443. doi: 10.1016/j.jclepro.2018.12.273
Köke, T., Ineichen, S., Grenz, J., and Reidy, B. (2021). Treibhausgase: KLIR-Modell zur einzelbetrieblichen Berechnung der Emissionen auf Milchviehbetrieben. Agrarforsch. Schweiz, 12, 64–72.
Kristensen, T., Mogensen, L., Trydeman-Knudsen, M., and Hermansen, J. E. (2011). Effect of production system and farming strategy on greenhouse gas emissions from commercial dairy farms in a life cycle approach. Livestock Science, 140, 136–148.
Kumar, S., Meena, R. L., Lal, R., Yadav, G. S., Mitran, T., Meena, B. L., et al. (2018). Role of Legumes in Soil Carbon Sequestration. In Legumes for Soil Health and Sustainable Management. Springer Nature Singapore Pte Ltd 109–138. doi: 10.1007/978-981-13-0253-4_4
Loges, R., Bunne, I., Reinsch, T., Malisch, C., Kluß, C., Herrmann, A., et al. (2018). Forage production in rotational systems generates similar yields compared to maize monocultures but improves soil carbon stocks. Eur. J. Agron. 97, 11–19. doi: 10.1016/j.eja.2018.04.010
Majer, S., Gröngröft, A., Drache, C., Braune, M., Meisel, K., Müller-Langer, F., et al. (2015). Technische und methodische Grundlagen der THG Bilanzierung von Biodiesel (Handreichung). Bundesministerium für Ernährung und Landwirtschaft. DBFZ Deutsches Biomasseforschungszentrum gemeinnützige GmbH, Leipzig.
Malisch, C. S., Finn, J. A., Eriksen, J., Loges, R., Brophy, C., and Huguenin-Elie, O. (2024). The importance of multi-species grassland leys to enhance ecosystem services in crop rotations. Grass Forage Sci. 79, 120–134. doi: 10.1111/gfs.12670
Mann, T., Heckelmann, A., Uckele, H., Messner, J., and Elsäßer, M. (2021). Düngeverordnung. Merkblätter für die Umweltgerechte Landbewirtschaftung. Düngeverordnung. Merkblätter für die Umweltgerechte Landbewirtschaftun.
Nawab, A., Li, G., An, L., Nawab, Y., Zhao, Y., Xiao1, M., et al. (2020). The potential effect of dietary tannins on enteric methane emission and ruminant production, as an alternative to antibiotic feed additives – a review. Annals of Animal Science, 20, 355–388.
Nemecek, T., Hayer, F., Bonnin, E., Carrouée, B., Schneider, A., and Vivier, C. (2015). Designing eco-efficient crop rotations using life cycle assessment of crop combinations. Eur. J. Agron. 65, 40–51. doi: 10.1016/j.eja.2015.01.005
O’Brien, D., Shalloo, L., Patton, J., Buckley, F., Grainger, C., and Wallace, M. (2012). Evaluation of the effect of accounting method, IPCC v. LCA, on grass-based and confinement dairy systems’ greenhouse gas emissions. Animal 6, 1512–1527. doi: 10.1017/S1751731112000316
Parkin, T. B., and Kaspar, T. C. (2006). Nitrous oxide emissions from maize–soybean systems in the Midwest. J. Environ. Qual. 35, 1496–1506. doi: 10.2134/jeq2005.0183
Prade, T., Svensson, S.-E., and Björnsson, L. (2014). Introduction of grass-clover crops as biogas feedstock in cereal-dominated crop rotation. Part I: effects on soil organic carbon and food production. 9th International Conference LCA of Food San Francisco, USA, 1–10.
Poppinga, O., Jürgens, K., and Sperling, U. (2016). Weniger ist mehr - Milch nur aus Grundfutter kann sich lohnen! Österreichische Fachtagung Für Biologische Landwirtschaft, 5–8.
Prudhomme, R., Brunelle, T., Dumas, P., LeMoing, A., and Zhang, X. (2020). Assessing the impact of increased legume production in Europe on global agricultural emissions. Reg. Environ. Chang. 20:91. doi: 10.1007/s10113-020-01651-4
Rainford, S. K., Jens Leifeld, J., Siegl, S., Hagenbucher, S., Riedel, J., Gross, T., et al. (2024). No relationship between outputs of simple humus balance calculators (VDLUFA and STAND) and soil organic carbon trends. Eur. J. Soil Sci. 75:e70007. doi: 10.1111/ejss.70007
Reinsch, T., Loza, T., Malisch, C. S., Vogeler, I., KLuß, C., Loges, R., et al. (2021). Towards specialized or integrated systems in Northwest Europe: on-farm eco-efficiency of dairy farming in Germany. Front. Sustain. Food Syst. 5:614348. doi: 10.3389/fsufs.2021.614348
Rotz, C. A. (2018). Modeling greenhouse gas emissions from dairy farms. J. Dairy Science, 101, 6675–6690.
Rochette, P., and Janzen, H. H. (2005). Towards a revised coefficient for estimating N2O emissions from legumes. Nutr. Cycl. Agroecosyst. 73, 171–179. doi: 10.1007/s10705-005-0357-9
Sandeep, K., Meena, R. S., Lal, R., Yadav, G. M., Mitran, T., Meena, B. L., et al. (2018). Role of Legumes in Soil Carbon Sequestration. In Legumes for Soil Health and Sustainable Management. Springer Nature Singapore Pte Ltd, 109–138.
Schmeer, M., Loges, R., Dittert, K., Senbayram, M., Horn, R., and Taube, F. (2014). Legume-based forage production systems reduce nitrous oxide emissions. Soil Tillage Res. 143, 17–25. doi: 10.1016/j.still.2014.05.001
Spek, J. W., Dijkstra, J., van Duinkerken, G., Hendriks, W. H., and Bannink, A. (2013). Prediction of urinary nitrogen and urinary urea excretion by lactating dairy cattle in northwestern Europe and North America: a meta-analysis. J. Dairy Sci. 96, 4310–4322. doi: 10.3168/jds.2012-6265
Stagnari, F., Maggio, A., Galieni, A., and Pisante, M. (2017). Multiple benefits of legumes for agriculture sustainability: an overview. Chem. Biol. Technol. Agric. 4:13. doi: 10.1186/s40538-016-0085-1
Statistisches Bundesamt. (2024) (accessed July 2024). Available online at: https://www.destatis.de/DE/Themen/Branchen-Unternehmen/Landwirtschaft-Forstwirtschaft-Fischerei/Feldfruechte-Gruenland/Tabellen/ackerland-hauptnutzungsarten-kulturarten.html
Sutter, M., Nemecek, T., and Thomet, P. (2013). Vergleich der Ökobilanzen von stall- und weidebasierter Milchproduktion Agrarforsch. Schweiz 4 5 230 237
Statista. (2024). Import- und Exportmenge von Raps und Rübsen in Deutschland in den Jahren 2013/14 bis 2022/23. Available at: https://de.statista.com/statistik/daten/studie/1147497/umfrage/import-export-raps-ruebsen-deutschland/
Tallentire, C., Mackenzie, S., and Kyriazakis, I. (2018). Can novel ingredients replace soybeans and reduce the environmental burdens of European livestock systems in the future? J. Clean. Prod. 187, 338–347. doi: 10.1016/j.jclepro.2018.03.212
Triberti, L., Nastri, A., and Baldoni, G. (2016). Long-term effects of crop rotation, manure and mineral fertilisationon carbon sequestration and soil fertility. Eur. J. Agron. 74, 47–55. doi: 10.1016/j.eja.2015.11.024
Unirat, LAZBW. Available online at: https://lazbw.landwirtschaft-bw.de/,Lde,W-2/Startseite/Themen/Hilfsmittel (Accessed December 2024).
van der Pol, L. K., Robertson, A., Schipanski, M., Calderon, F. J., Wallenstein, M. D., Cotrufo, M. F., et al. (2022). Addressing the soil carbon dilemma: Legumes in intensified rotations regenerate soil carbon while maintaining yields in semi-arid dryland wheat farms. Agriculture, Ecosystem and Environment, 330, 16pp. doi: 10.1016/j.agee.2022.107906
Wattiaux, M. A., Uddin, M. E., Letelier, P., Jackson, R. D., and Larson, R. A. (2018). Emission and mitigation of greenhouse gases from dairy farms: the cow, the manure, and the field. Appl. Anim. Sci. 35, 238–254. doi: 10.15232/aas.2018-01803
Weggler, K., Thumm, U., and Elsaesser, M. (2019). Development of legumes after reseeding in permanent grassland, as affected by nitrogen fertilizer applications. Agriculture 9:207. doi: 10.3390/agriculture9100207
Woods, J., Williams, A., Hughes, J. K., Black, M., and Murphy, R. (2010). Energy and the food system. Philosophical Transactions of the Royal Society B: Biological Sciences 365, 2991–3006. doi: 10.1098/rstb.2010.0172
Wu, G.-L., Liu, Y., Tian, F.-P., and Shi, Z.-H. (2017). Legumes functional group promots soil organic carbon and nitrogen storage by increasing plant diversity. Land Degradation and Development, 28, 1336–1344.
Zamecnik, G. (2023). Carbon footprint of Europe soya- certified soybean meal and soybean oil at ATK. FiBL Austria. Accessed December 2024. Available online at: https://www.google.com/url?sa=t&source=web&rct=j&opi=89978449&url=https://www.donausoja.org/wp-content/uploads/2023/05/Report_-Carbon-Footprint-ATK_ES-Soybean-Meal_20230502.pdf
Keywords: legumes, clover, greenhousegas, dairy farms, GHG, GHG-footprint, nitrogen, soil carbon
Citation: Weggler K, Gerster E and Messner J (2025) The benefit of fodder legumes as dairy feeding source for reducing greenhousegas emissions of modelled farms. Front. Sustain. Food Syst. 9:1583852. doi: 10.3389/fsufs.2025.1583852
Edited by:
Shobha Poudel, Fondazione Eni Enrico Mattei, ItalyReviewed by:
Serkan Ates, Oregon State University, United StatesWei Zhang, Lincoln University, New Zealand
Copyright © 2025 Weggler, Gerster and Messner. This is an open-access article distributed under the terms of the Creative Commons Attribution License (CC BY). The use, distribution or reproduction in other forums is permitted, provided the original author(s) and the copyright owner(s) are credited and that the original publication in this journal is cited, in accordance with accepted academic practice. No use, distribution or reproduction is permitted which does not comply with these terms.
*Correspondence: Karin Weggler, a2FyaW4ud2VnZ2xlckBsYXpidy5id2wuZGU=