 Sukhvir Singh1†
 Amit Guleria1*†
 Parvender Sheoran2
 Pankaj Sood3
 Vishal Mahajan4
 Dharminder Kumar5Satbir Singh6Gurdeep Singh7
 Rajesh K. Rana2
- 1Department of Economics and Sociology, Punjab Agricultural University, Ludhiana, Punjab, India
- 2ICAR-Agricultural Technology Application Research Institute, Ludhiana, Punjab, India
- 3Krishi Vigyan Kendra, Mandi, Himachal Pradesh, India
- 4Krishi Vigyan Kendra, Kathua, Jammu and Kashmir, India
- 5Krishi Vigyan Kendra, Chamba, Himachal Pradesh, India
- 6Krishi Vigyan Kendra, Ropar, Punjab, India
- 7Krishi Vigyan Kendra, Bathinda, Punjab, India
Background: Black gram (Vigna mungo), a key pulse crop in India, serves as a major protein source with significant health benefits. Predominantly grown in Madhya Pradesh, Uttar Pradesh, and Rajasthan, its cultivation in Punjab remains limited due to the paddy-wheat dominance. Understanding the trends in black gram cultivation and market behavior is crucial for improving its production and market efficiency, particularly in the context of policy-driven diversification and market integration.
Methods: This study examines the area, production, and yield trends of black gram from 1970 to 2024, along with wholesale price data from 2014 to 2024 across selected states, to assess market integration and price behavior. Various statistical tools, including CAGR, decomposition analysis, instability analysis, seasonal indices, correlation analysis, Johansen co-integration, Granger causality, Vector Error Correction Model (VECM), impulse response function, and variance decomposition, were used for data analysis.
Results: The findings indicate that black gram production and price dynamics are influenced by multiple factors. Decomposition analysis reveals the varying impact of area, yield, and interaction effects, while the Cuddy-Della Valle index highlights production instability. Seasonal indices confirm price and production fluctuations, emphasizing the need for targeted policy interventions. Strong price integration among states is evident, with high correlation coefficients and long-run equilibrium relationships. VECM suggests efficient price adjustments, and Granger causality identifies Madhya Pradesh as the key price-determining market. Impulse response and variance decomposition confirm the transmission of price shocks across states, reinforcing their interdependence.
Conclusion: To enhance black gram production and market stability, investments in high-yielding and climate-resilient varieties, improved storage, transportation, and processing infrastructure are essential. Strengthening market information systems, refining procurement mechanisms, and expanding digital platforms like e-NAM can improve price discovery and farmer participation. Promoting black gram in Punjab through diversification incentives and assured marketing systems can reduce resource overuse while improving farm incomes.
1 Introduction
Black gram, commonly referred to as ‘Urad Dal’, in India is a known type of pulse crop within the Leguminosae family. Apart from countries like Pakistan, Afghanistan, Bangladesh and Myanmar, where this crop is grown, India holds a significant position as both a major producer and consumer of black gram. Black gram offers valuable nutritional profile containing about 26% of protein which is about three times of cereals along with essential vitamins and minerals. Additionally, due to its property of low glycemic index and the presence of phenolics and dietary fiber, it is considered beneficial for reducing the risk of cardiovascular diseases and diabetes (Kanth et al., 2021). Moreover, it is highly regarded as one of the most nutritive feeds for dairy animals and serves as an effective green manure crop by enhancing soil fertility through nitrogen fixation.
In the 2022–23 period, India produced around 26.31 lakh tonnes of Black gram from a cultivated area of 40.02 lakh hectares, with an average yield of 657 kg per hectare. Black gram accounted for approximately 29% of India’s total pulse acreage and contributed 10.25% to the overall pulse production (Banerjee and Ray, 2023). During the Kharif season in 2022–23, the estimated Black gram production was 17.68 lakh tonnes, covering an area of 30.98 lakh hectares. The states of Madhya Pradesh, Andhra Pradesh, Rajasthan, Uttar Pradesh and Tamil Nadu are the major producers of Black gram in India.
In contrast, Punjab, with a geographical area covering 50.32 lakh hectares, is not a significant producer of pulses. Historically, pulses were integral to Punjab’s farming system, but the area and production have significantly declined due to the prevalence of the paddy-wheat cropping system (Singh et al., 2022). In 2022–23, Punjab cultivated black gram on 1.6 thousand hectares, producing 0.71 thousand tonnes with an average yield of 441 kg per hectare. Given the current challenges of water scarcity and the need for sustainable agriculture, pulses present a viable option for diversifying Punjab’s agricultural practices (Sharma et al., 2023).
Given this background, it becomes evident that studying the price behavior of black gram markets at both state and national levels is crucial for ensuring efficient distribution and enhancing the economic viability of its cultivation. Agricultural commodity prices vary due to fluctuations in supply and demand, which are influenced by the seasonal nature of production and marketing. Assessing market performance through market integration is therefore crucial. Integrated markets are characterized by the flow of price signals between them, enabling physical arbitrage to correct any disruptions (Kaur et al., 2021). This also facilitates the smooth transmission of price signals and information across geographically dispersed markets. Temporal market integration involves arbitrage over time, where price signals are carried over from one year to the next within the same market (Goletti et al., 1995). Poor market integration often points to factors such as government policies, infrastructural shortcomings, or institutional barriers that impede the efficient movement of goods and prices. Market reforms are expected to enhance integration, allowing for faster and more effective transmission of price signals between markets.
While several studies (Ganguly and Gulati, 2022; Bhat et al., 2022; Mishra et al., 2023) have investigated the behavior of pulse markets in India, limited research has focused specifically on black gram, especially in the context of spatial market integration using robust tools such as Johansen co-integration, VECM, and impulse response functions. Furthermore, few studies attempt to connect long-term production trends with price transmission dynamics across producing and consuming regions. This study fills this research gap by combining detailed trend and variability analysis with advanced econometric modeling to examine black gram market efficiency and interlinkages.
Against this backdrop, the present study aims to provide a comprehensive analysis of black gram production and market dynamics in India. Specifically, it examines long-term trends in area, production, and productivity across major states, while also assessing the seasonal and spatial behavior of wholesale prices. To understand the degree of interdependence among markets, the study employs advanced econometric techniques such as Johansen co-integration, Granger causality, and vector error correction modeling. These tools help identify long-run equilibrium relationships and short-term price adjustments between producing and consuming regions. Moreover, the study seeks to offer policy-relevant insights that can inform efforts to strengthen price transmission, improve market efficiency, and promote the sustainable resurgence of black gram cultivation in states like Punjab—where its presence, though historically significant, has diminished under monoculture-driven systems. By linking empirical evidence with policy discourse, this work contributes to ongoing debates on pulse sector reform, regional diversification, and agricultural sustainability.
2 Materials and methods
2.1 Selection of sample and sources of data
The study utilizes time-series analysis to examine the Area-Production-Productivity (APY) trends and market integration of black gram across major Indian states. Six leading black gram-producing states—Madhya Pradesh, Andhra Pradesh, Uttar Pradesh, Tamil Nadu, Rajasthan, and Maharashtra—were selected based on their production shares from 2017–18 to 2022–23. Data on area, production, and yield from 1970–71 to 2022–23 were collected from the Directorate of Economics and Statistics, Ministry of Agriculture & Farmers Welfare, and Indiastat.com. To capture structural changes in agricultural policy and production dynamics, the study period was divided into three distinct phases: Period I (1970–71 to 1989–90), representing the pre-liberalization era characterized by traditional farming practices; Period II (1990–91 to 2004–05), marking the post-liberalization but pre-National Food Security Mission (NFSM) phase; and Period III (2005–06 to 2022–23), defined by intensified government interventions under the NFSM framework. For price transmission and market integration analysis, Madhya Pradesh and Andhra Pradesh were selected as major producers, contributing 32.07 and 13.19% of total black gram production (2017–18 to 2022–23). Uttar Pradesh and Karnataka, key consuming and distributing states, were chosen based on arrival data.1 Punjab was included despite its lower production share due to its agricultural challenges and potential for crop diversification.
The time series data on black gram wholesale price data (January 2014–June 2024) were collected from the Department of Consumer Affairs, Agmarknet, and the Directorate of Economics and Statistics. State-level average monthly wholesale prices were used to capture broader market trends, reducing the impact of localized market fluctuations caused by factors such as weather conditions, transportation issues, and regional supply–demand imbalances, thus, ensuring more stable and comprehensive analysis of market integration. Further, prices were checked for consistency, and any missing values were interpolated using linear trends. No deflation or conversion was applied, as all price series were expressed in nominal terms over a consistent period.
2.2 Data analysis
Various analytical techniques were employed to achieve the study objectives. The Compound Annual Growth Rate (CAGR) and Instability Index were computed to assess the growth trends of black gram in terms of area, production, and productivity at both state and national levels. Decomposition analysis was conducted to determine the relative contribution of area and yield to production changes. To examine the seasonal and cyclical behavior of black gram prices in major producing states, time series analysis was performed. For price transmission and spatial market integration, advanced statistical and econometric methods were applied, including correlation analysis, Johansen co-integration, Granger causality test, Vector Error Correction Model (VECM), impulse response function, and variance decomposition. The analysis was carried out using E-Views software and followed a structured approach.
2.3 Growth analysis
Growth rate measures the percentage change in a given variable over a specified period (Jarrett and Tackie, 2024). The Compound Annual Growth Rate (CAGR) of Black gram area, production, and yield was calculated for selected states from 1970–71 to 2022–23 using the following exponential function:
where:
= Area/Production/Yield of Black gram at time ‘t’
t = Time variable (1, 2, …, n) for each period
a = Constant
b = Growth coefficient.
Taking the natural logarithm of the equation:
Since ln b = ln (1 + r), the growth rate r is derived as:
2.4 Decomposition of change in production
Decomposition analysis was used to determine the relative contribution of area and yield to changes in black gram production over time. The method, developed by Minhas and Vaidyanathan (1965), follows the identity:
Expanding for changes over time:
where:
• Area effect: (ΔA× ) - Contribution of area expansion
• Yield effect: (ΔY× ) - Contribution of yield improvement
• Interaction effect: (ΔA × ΔY) - Joint impact of area and yield changes
2.5 Instability analysis
The Cuddy-Della Valle Index (CDVI) quantifies price instability by adjusting the coefficient of variation (CV) for trends, offering a refined measure of volatility (Cuddy and Della Valle, 1978; Anuja et al., 2013).
where CV is the coefficient of variation in per cent, and r2 = Coefficient of determination from a time trend regression adjusted to its degrees of freedom. The ranges of CDVI: Low instability: 0–15, Medium instability: 15–30 and High instability: >30 (Sihmar, 2014).
2.6 Trend analysis
To analyze price trends, time series data on Black gram prices from selected states was examined. Different functional forms were tested, and the linear trend model was chosen based on the best fit.
2.7 Linear trend model
The annual trend in Black gram prices was estimated using a linear regression model:
where:
• Y = Market price
• a = Constant
• t = Time variable
• b = Regression coefficient
2.8 Seasonal indices
To examine seasonal price variations, a 12-month moving average method was applied (Wan and Tao, 2023), considering year-round availability of data. A multiplicative model was used to estimate seasonal fluctuations:
where,
= Observed value of time series at time t.
= the trend component at time period t.
= the seasonal component at time period t.
= the cyclic component at time period t.
= the irregular component at time period t.
2.9 Correlation analysis
The correlation coefficient (r) measures the strength of the linear relationship between two price series (Burkhanov et al., 2024) indicating market integration. It is calculated as:
Here, X and Y represent the price series for two distinct markets.
The t-test is used with null hypothesis (H0): p = 0 (no integration) and alternative hypothesis (H1): p ≠ 0 (there is integration) to examine the significance of correlation coefficient
at t (n-2) degree of freedom.
r = 1: Perfect integration (prices move parallel).
r ≈ 0: Weak association (prices move independently).
In this study, correlation analysis of irregular variation (residuals) of different price series was also analyzed.
2.10 Stationarity test
Market integration requires a long-term equilibrium, which necessitates stationary price series. Non-stationary series can lead to misleading interpretations. The Augmented Dickey-Fuller (ADF) test (Dickey and Fuller, 1979) was used to assess stationarity by estimating:
where, etc.; P = the price in each market; a0 = constant or drift; t = time trend variable; q = number of lag length selected based on Akaike Information Criterion (AIC).
H₀ (Null hypothesis): The series has a unit root (non-stationary).
H₁ (Alternative hypothesis): The series is stationary.
If H₀ is rejected, the series is considered stationary, allowing reliable market integration analysis.
2.11 Lag length selection criteria
The optimal lag length for co-integration and Vector Error Correction Model (VECM) analysis was selected based on the minimum Akaike Information Criterion (AIC). This ensures efficient parameterization while preserving model stability. A common lag of two was selected across models to maintain uniformity and capture short-term adjustments without overfitting.
2.12 Johansen’s co-integration method
Johansen and Juselius (1990) developed a method to test long-term relationships between variables. Even if individual price series are non-stationary, they are considered cointegrated if a stationary linear combination exists. Once stationarity is confirmed at the same level or differencing order, the Maximum Likelihood (ML) approach is applied to determine the number of cointegrating vectors. The null hypothesis of up to ‘r’ cointegrating vectors is tested against ‘r + 1’ using trace statistics (Johansen, 1989):
The trace statistic formula is:
where:
= estimated Eigen values.
largest squared Eigen value obtained from the II matrix.
T = number of observations.
If it is not possible to reject r = 0, it can be summarized that there is no integration. Alternately, if r = 0 is rejected and r = 1 cannot be rejected, it implies that there is a co-integrating association between the price series. The number of co-integrating vectors indicated by the tests is an important indicator of the extent of co-movement of prices. An increase in the number of co-integrating vectors means an increase in the strength and stability of price linkages. The Eigen values represent the strength of the correlation between the first difference and the error correction.
2.13 Vector error correction model for short-term relationship
While co-integration captures the existence of a stable long-run equilibrium, VECM quantifies how short-run deviations from that equilibrium are corrected over time. It not only models’ short-term interdependence among price series but also incorporates the speed at which variables adjust back to equilibrium following a shock.
VECM is derived from the vector autoregressive (VAR) model but is applicable only when variables are integrated of the same order [typically I (Banerjee and Ray, 2023)] and co-integrated. The model includes an error correction term (ECT), which represents the disequilibrium from the previous period and allows estimation of the rate at which it is eliminated in the current period. The general form of the VECM equations used in this study is as follows:
where:
• and are the first-differenced log-transformed price series,
• ECTt-1 is the lagged error correction term obtained from the long-run co-integrating equation,
• γ is the error correction coefficients,
• αᵢ and βᵢ are short-run coefficients.
A negative and significant γ indicates the speed of adjustment toward equilibrium, while a positive or zero γ suggests divergence. The VECM framework thus facilitates identification of leading markets and quantifies how interlinked state markets respond to price shocks in the black gram value chain.
2.14 Granger causality test
The Granger causality test (Granger, 1969) determines the direction of causality between two markets. If two variables are cointegrated, this test helps analyze their co-movement. The test estimates:
where X and Y are market price series (log-transformed), and t represents time. The null hypothesis tests whether X does not Granger-cause Y (and vice versa). Rejecting the null hypothesis suggests Granger causality between the variables (Gujarati, 2010).
2.15 Impulse response function
The impulse-response function (IRF) analyses how price shocks propagate across markets over time. It measures the effect of a one-unit shock or one standard deviation change in one variable on the future values of all endogenous variables (Rahman and Shahbaz, 2013). The generalized impulse response function (GIRF), developed by Koop et al. (1996) and refined by Pesaran and Shin (1998), accounts for historical dependencies and estimates responses to arbitrary shocks:
2.16 Variance decomposition
Variance decomposition analyses the sources of price variability in a system of markets. It quantifies how much of the forecast error variance in a price series is explained by its own past shocks versus shocks from other markets. Unlike impulse response functions, which trace the effect of a single shock over time, variance decomposition provides a breakdown of influences over different time horizons. This helps in understanding the relative importance of different markets in driving price fluctuations (Canova, 2011).
3 Results and discussion
This section presents a comprehensive analysis of black gram market dynamics across selected states in India. It examines growth trends, compound annual growth rates (CAGR), decomposition of production changes, price variability, and seasonal patterns. Additionally, market integration is explored through cointegration analysis, Granger causality tests, impulse response functions, and variance decomposition. These analyses collectively provide deeper insights into market efficiency, price stability, and the interconnectedness of black gram markets in India.
3.1 Area and production status of black gram in India
The area and production of black gram in India have shown an overall increasing trend from triennium ending (TE) 1972–73 to TE 2022–23 (Table 1). The area expanded from 1,964 thousand ha in TE 1972–73 to a peak of 5,138 thousand ha in TE 2020–21, before declining to 4,259 thousand ha in TE 2022–23. The highest share in total pulse area was 17.73 per cent (TE 2020–21), while the lowest was 8.98 per cent (TE 1972–73). Production rose from 601.33 thousand tonnes in TE 1972–73 to a peak of 2,878 thousand tonnes in TE 2020–21, before slightly declining to 2,546 thousand tonnes in TE 2022–23. The highest share in total pulse production was 12.24% (TE 2020–21), while the lowest was 5.50% (TE 1972–73).
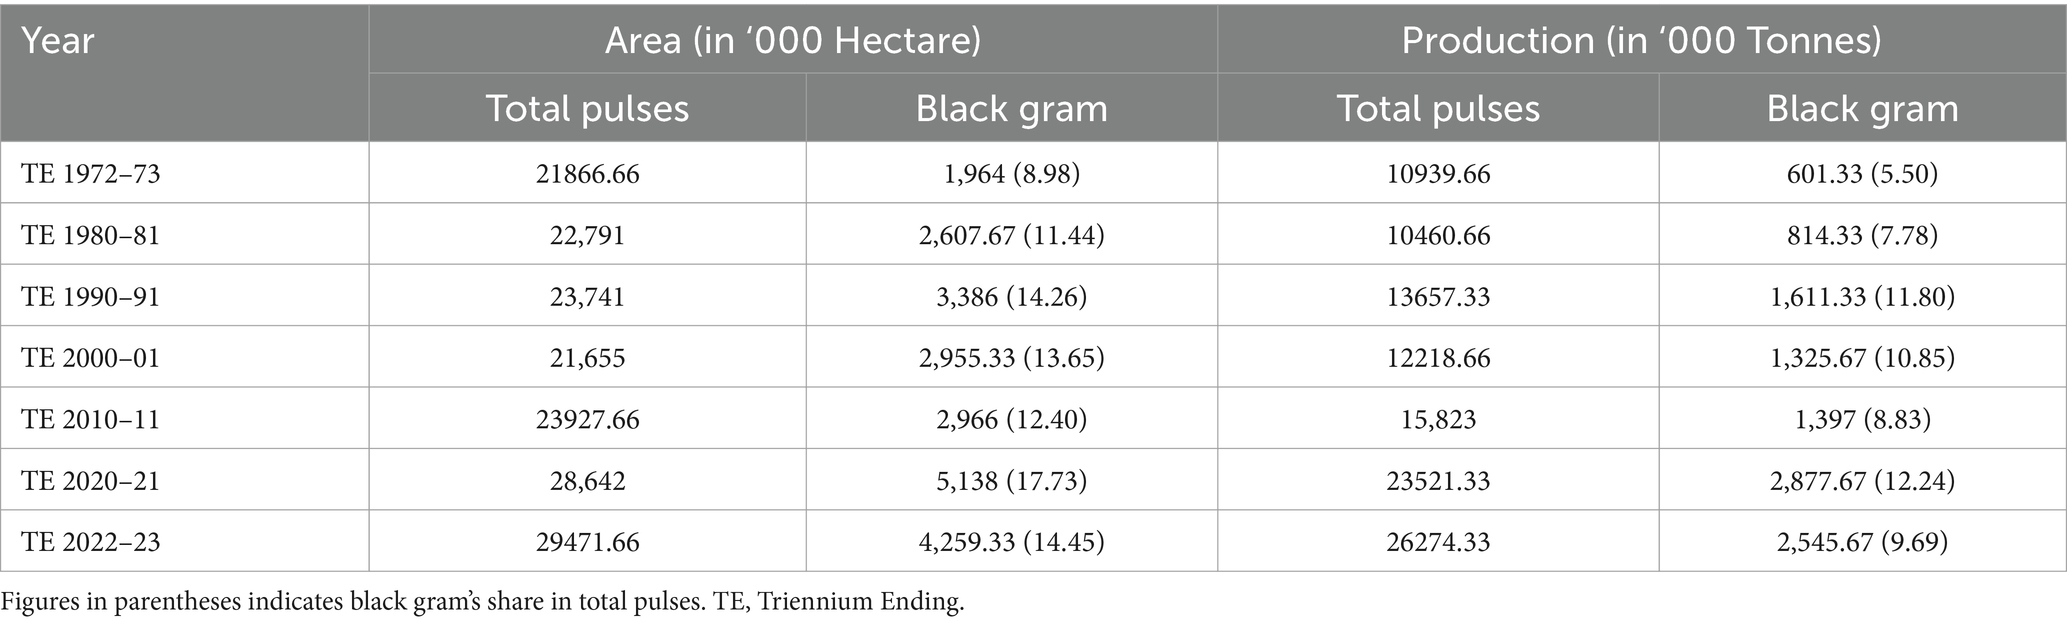
Table 1. Area and production status of black gram in India, 1970–71 to 2022–23.
3.2 Trends of area, production, and productivity of black gram in India
The area, production, and yield of black gram, analyzed over time, have shown a fluctuating trend over the past five decades (Figure 1). In 1970–71, the area was 2,070 thousand ha, with production at 656 thousand tonnes and a yield of 317 kg/ha. By 1999–2000, these increased to 2,970 thousand ha, 1,350 thousand tonnes, and 453 kg/ha, respectively. A significant rise was observed in recent years, with the area peaking at 5,120 thousand ha and production at 3,130 thousand tonnes in 2018–19, though yield remained moderate at 546 kg/ha. In 2022–23, the area declined slightly to 4,260 thousand ha, but production remained high at 2,550 thousand tonnes, with a record yield of 657 kg/ha. This trend visualization highlights key growth phases, turning points, and overall production dynamics, illustrating that while area and production have expanded, yield improvements remain inconsistent (Xu et al., 2025).
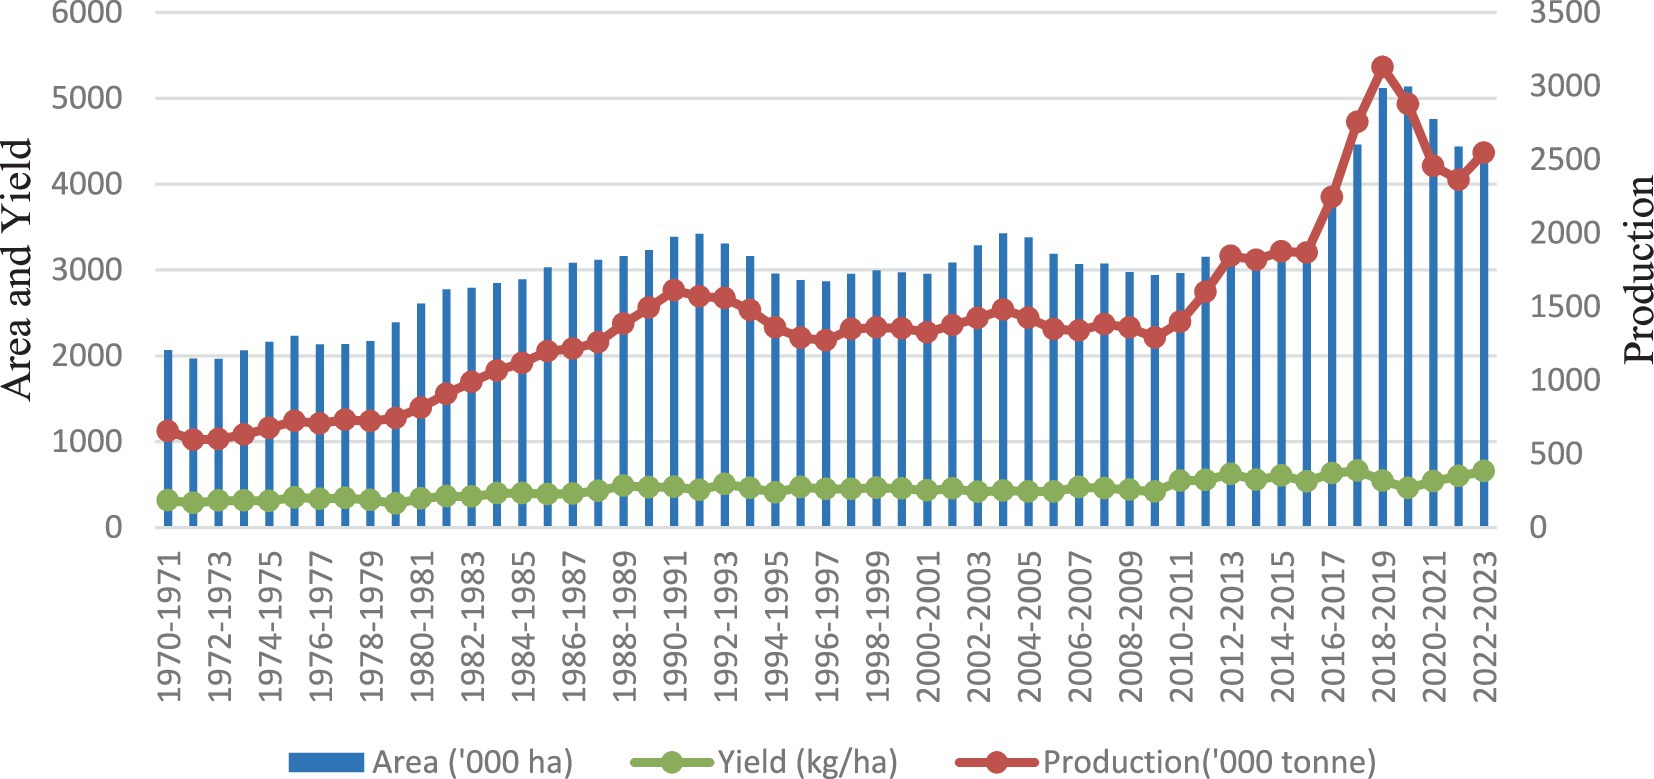
Figure 1. Trends in area, production and productivity of black gram in India, 1970–71 to 2022–23.
3.3 State-wise growth and variability analysis of black gram in India
The compound annual growth rates (CAGR) and instability indices for black gram from 1970–71 to 2022–23 (Table 2) reveal significant variations across states, categorized into three phases: expansion, stagnation, and revival.
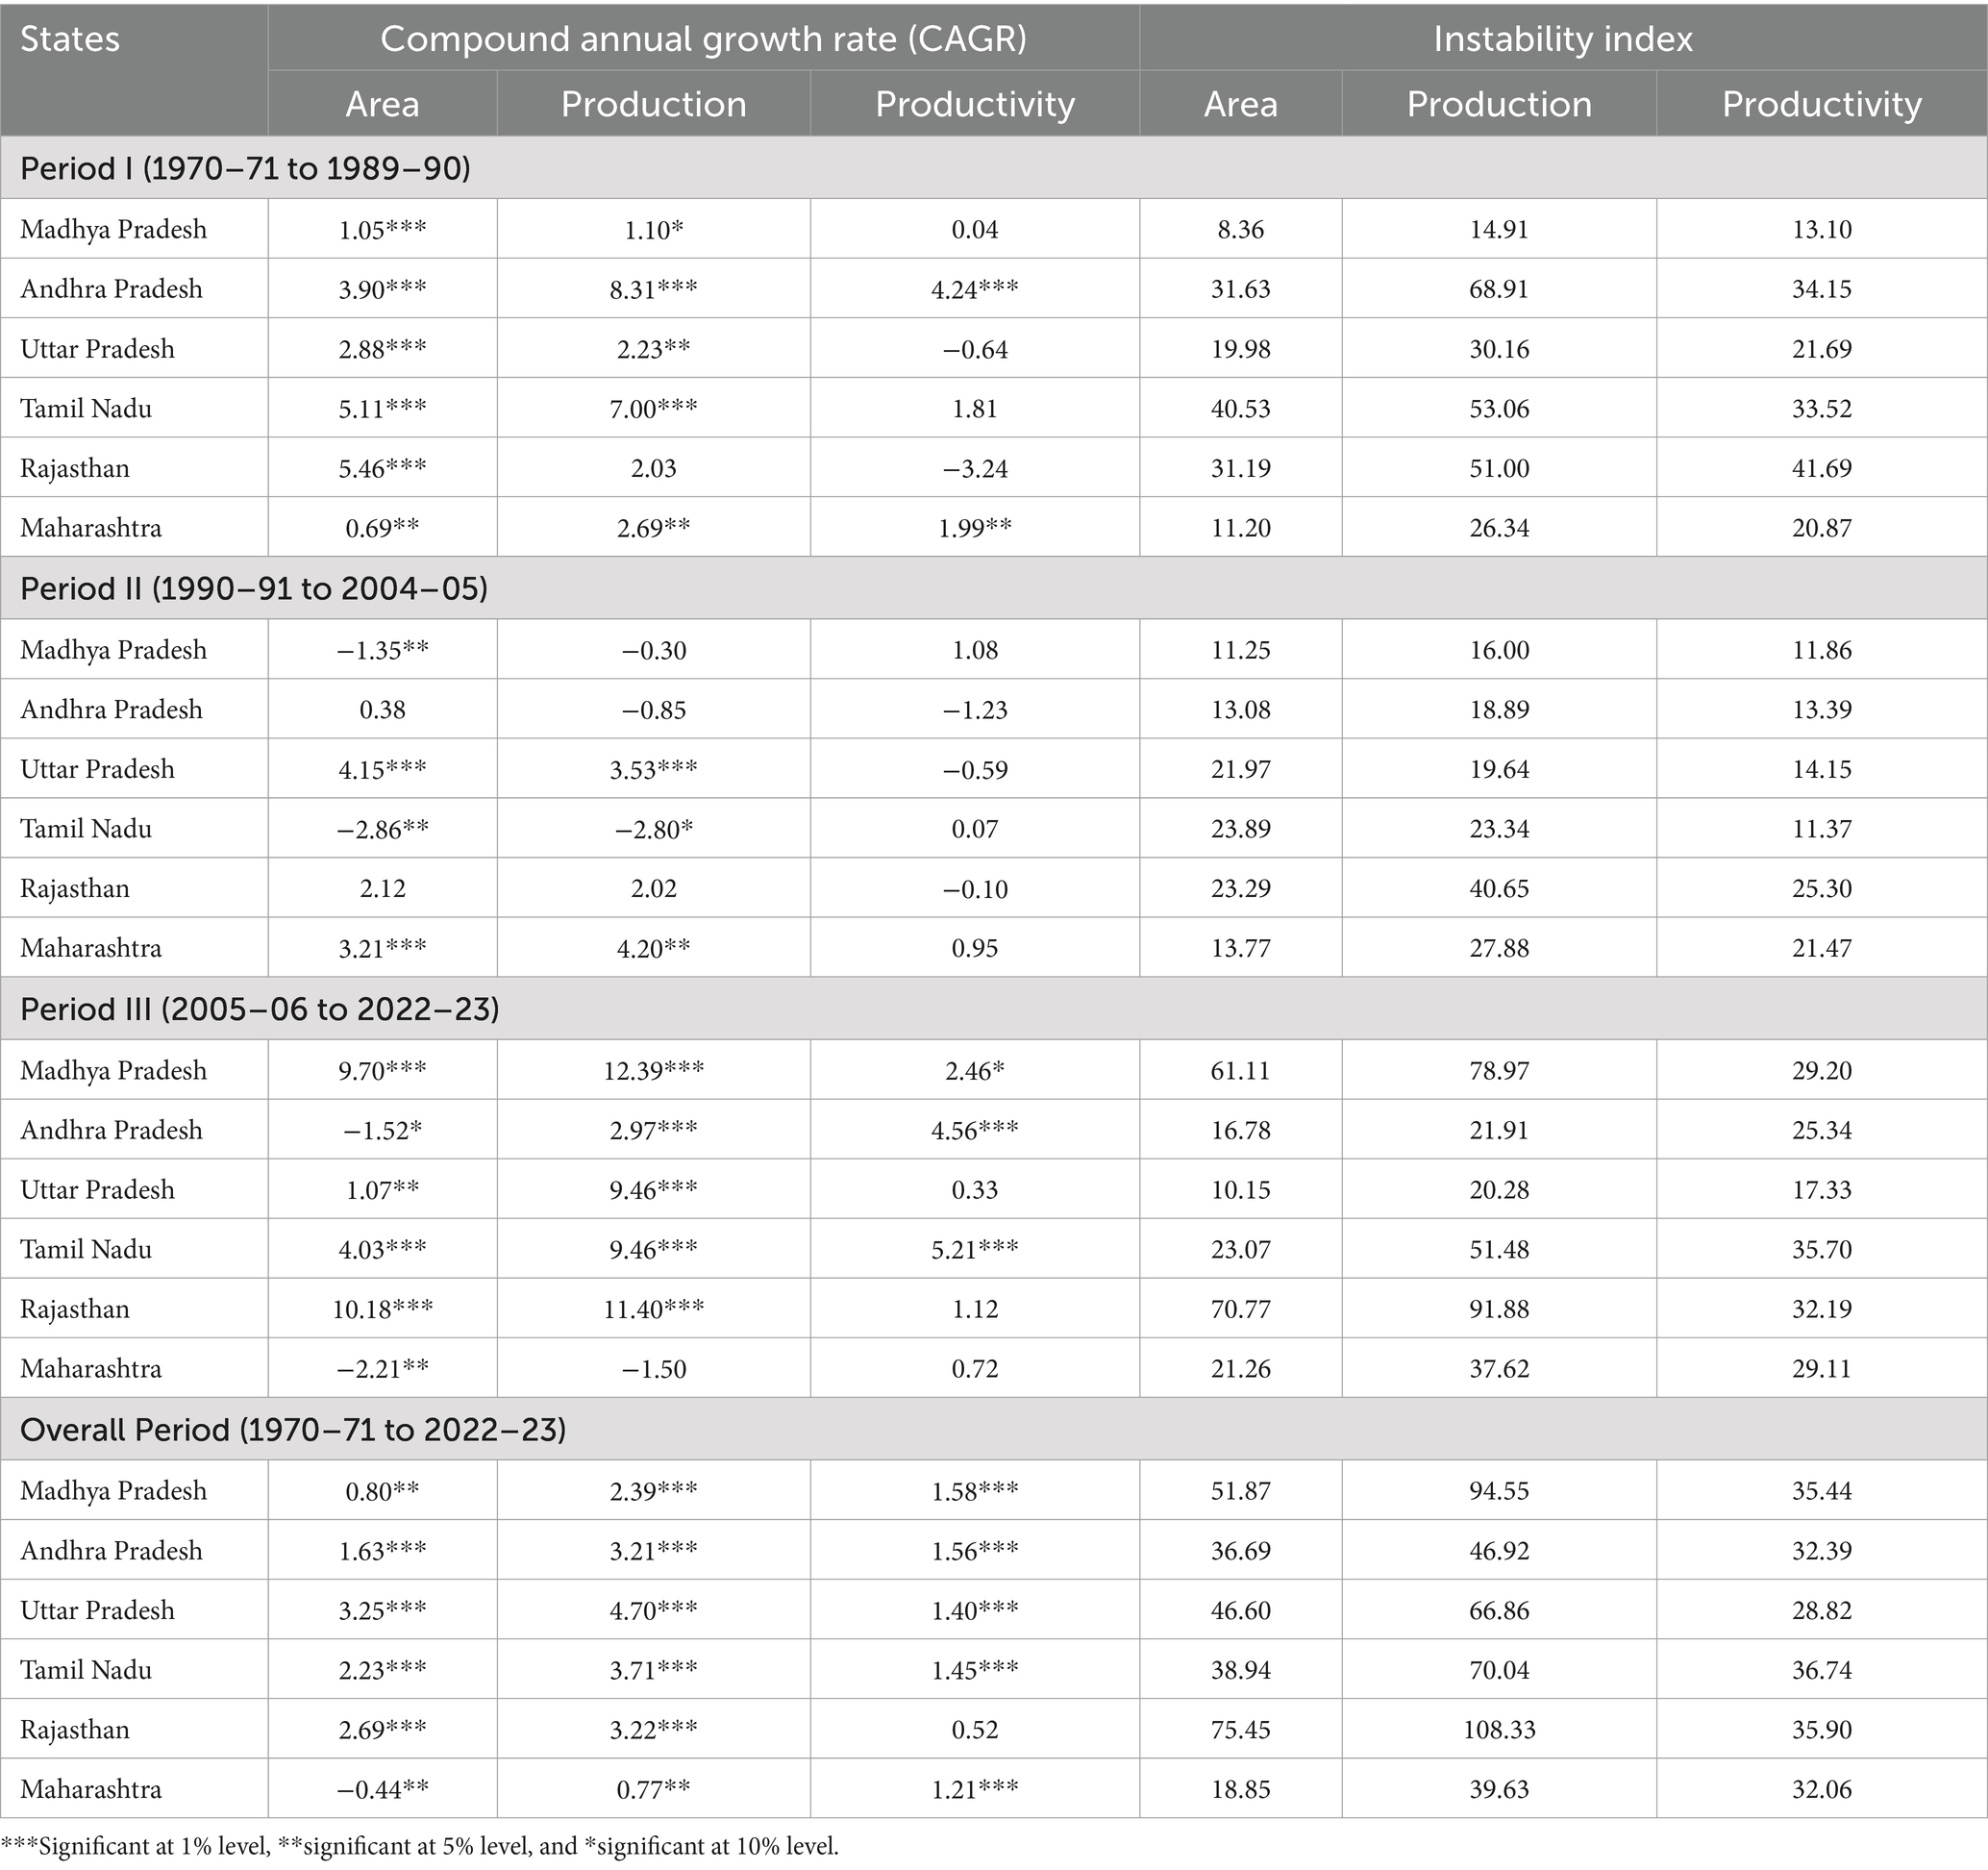
Table 2. State wise compound annual growth rate and variability index of area, production, and productivity of black gram across major producing states in India, 1970–71 to 2022–23 (Per cent).
During Period I (1970–71 to 1989–90), most states saw area and production growth, but productivity gains varied. Madhya Pradesh had modest growth in area (1.05%) and production (1.10%) with minimal yield improvement. Andhra Pradesh led in production (8.31%), driven by area (3.90%) and yield (4.24%) growth, though with high variability (68.91%). Tamil Nadu and Rajasthan saw notable expansion, but Rajasthan’s productivity declined (−3.24%), indicating inefficiencies. Uttar Pradesh and Maharashtra recorded moderate growth, with Maharashtra maintaining stability.
Period II (1990–91 to 2004–05) saw stagnation and decline in black gram cultivation in some states, while others maintained steady growth. Madhya Pradesh (−1.35%) and Tamil Nadu (−2.86%) saw area contraction, leading to marginal or negative production growth. Andhra Pradesh and Tamil Nadu also faced productivity declines, indicating stagnant yields. Uttar Pradesh and Maharashtra sustained positive growth in both area and production, while Rajasthan’s production grew slightly, but yield stagnated. Variability remained high, with production showing greater instability than area and productivity.
The third period (2005–06 to 2022–23) saw a resurgence in black gram cultivation, led by Madhya Pradesh (9.70%) and Rajasthan (10.18%), with significant production growth (12.39 and 11.40%). Tamil Nadu (5.21%) and Andhra Pradesh (4.56%) improved productivity, while Maharashtra saw declines in area (−2.21%) and production (−1.50%), indicating shifting cropping patterns. Variability remained high, particularly in Rajasthan and Madhya Pradesh, despite overall growth.
Over the entire period (1970–71 to 2022–23), Madhya Pradesh, Uttar Pradesh, and Rajasthan led black gram production with sustained growth in both area and production. However, Rajasthan showed the highest instability in area (75.45%) and production (108.33%), indicating fluctuating cultivation patterns. Andhra Pradesh and Tamil Nadu maintained positive growth with yield improvements. On the other hand, Maharashtra was the only state with a negative area growth rate (−0.44%) but saw a slight productivity rise (1.21%).
3.4 Decomposition analysis of black gram in major producing states of India
Decomposition analysis evaluated the contributions of area, yield, and interaction effects to black gram production trends across major Indian states from 1970–71 to 2022–23. The results presented in Table 3, revealed that area expansion was the key driver of black gram production in Rajasthan (261.65%), Tamil Nadu (168.03%), and Uttar Pradesh (60.40%) during Period I (1970–71 to 1989–90), while Tamil Nadu (203.57%) and Madhya Pradesh (70.04%) saw significant yield contributions. Period II (1990–91 to 2004–05) showed a strong area effect in Uttar Pradesh (162.37%) and Tamil Nadu (129.28%), while yield gains were dominant in Andhra Pradesh (94.36%) and Madhya Pradesh (87.67%). In Period III (2005–06 to 2022–23), yield improvements led growth in Andhra Pradesh (159.35%) and Uttar Pradesh (76.20%), while the area effect remained significant in Madhya Pradesh (41.53%). Interaction effects were most pronounced in Maharashtra (71.19%) and Rajasthan (68.96%). Over the entire period (1970–71 to 2022–23), Tamil Nadu (119.18%) and Uttar Pradesh (108.73%) saw the highest area-driven growth, while yield played a crucial role in Andhra Pradesh (72.41%) and Madhya Pradesh (38.37%). At the national level, the area effect (51.60%) and yield effect (52.18%) were nearly equal contributors, indicating that both expansion and productivity improvements are critical for sustainable black gram production.
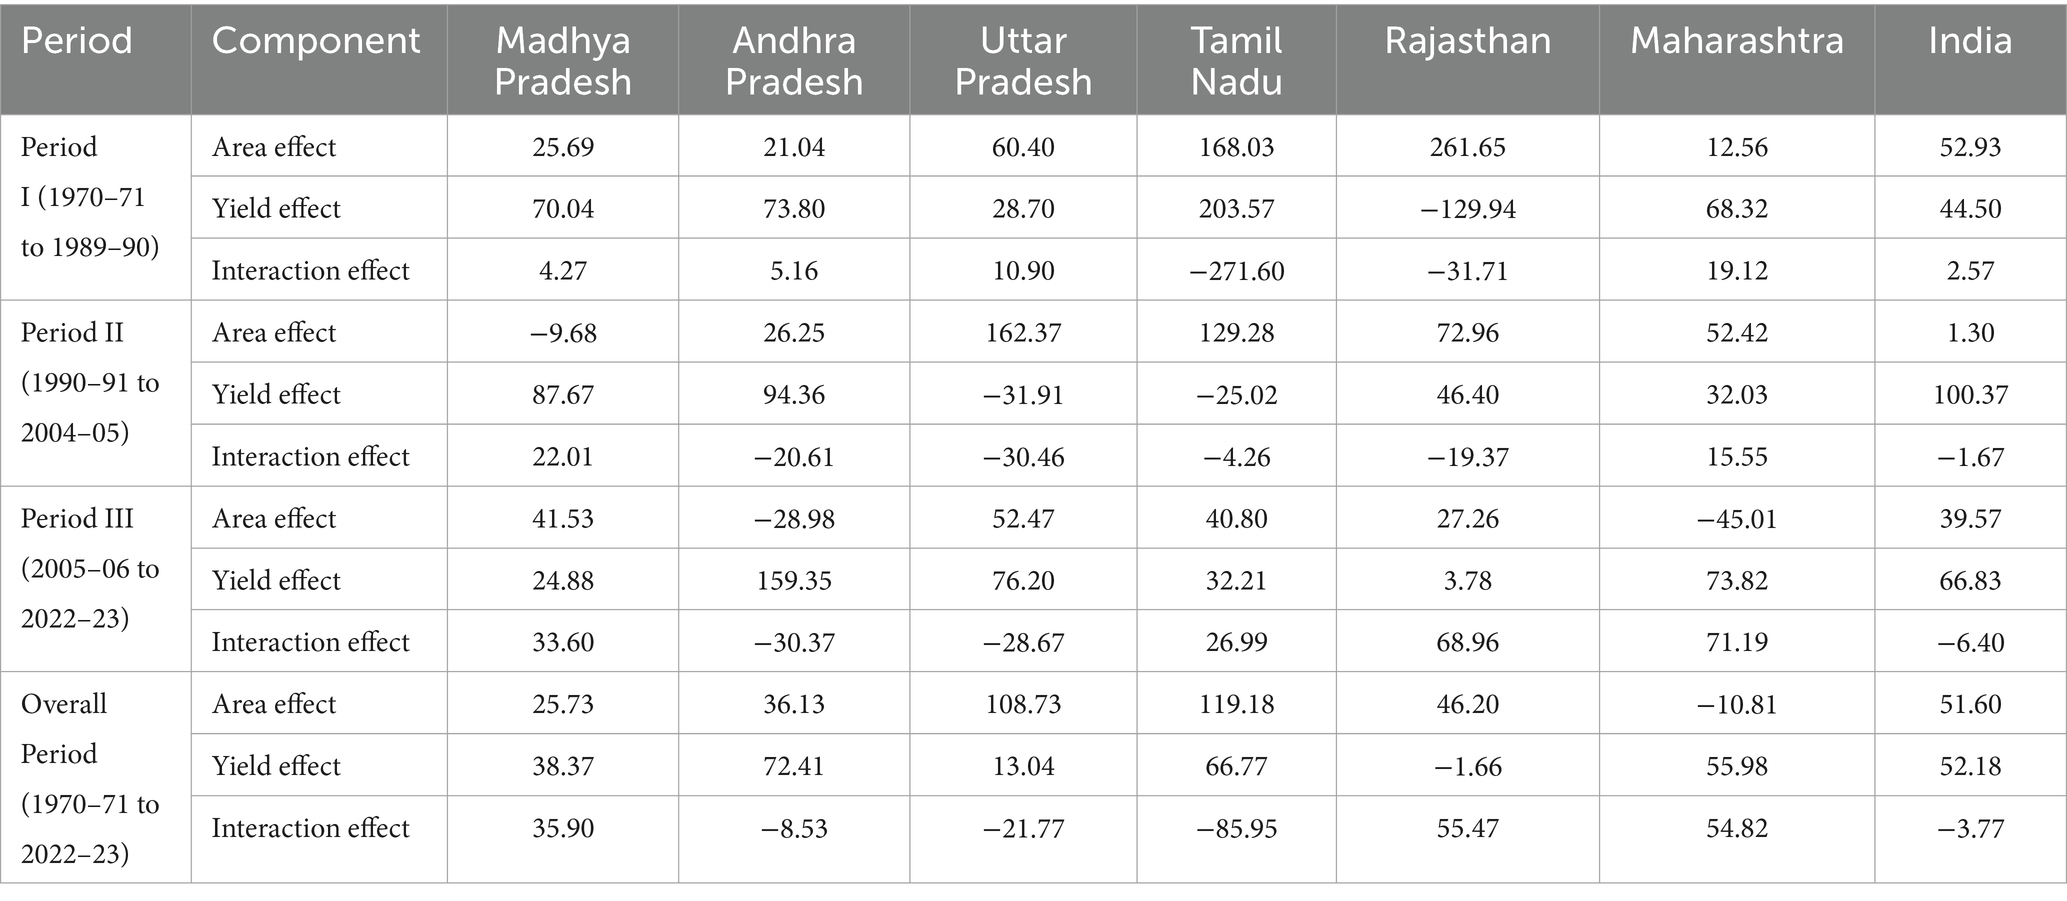
Table 3. Decomposition analysis of black gram in major producing states of India from 1970–71 to 2022–23 (Per cent).
3.5 Variability of black gram prices across selected states
Price instability in black gram across Uttar Pradesh, Andhra Pradesh, Karnataka, Madhya Pradesh, and Punjab was analyzed, with the Cuddy-Della-Valle Index (CDVI) applied to measure fluctuations (Das and Mukhopadhyay, 2024). The results, presented in the Table 4, revealed Andhra Pradesh had the highest variability in January (28.34%) and May (27.64%), while Karnataka peaked in June (26.52%). Madhya Pradesh saw maximum instability in July (28.16%), Punjab in June (27.78%) and August (27.60%), and Uttar Pradesh in May (22.99%). September consistently showed the lowest fluctuations across states. The findings indicate significant seasonal price variations, particularly during peak supply months (Sahoo and Singh, 2017).
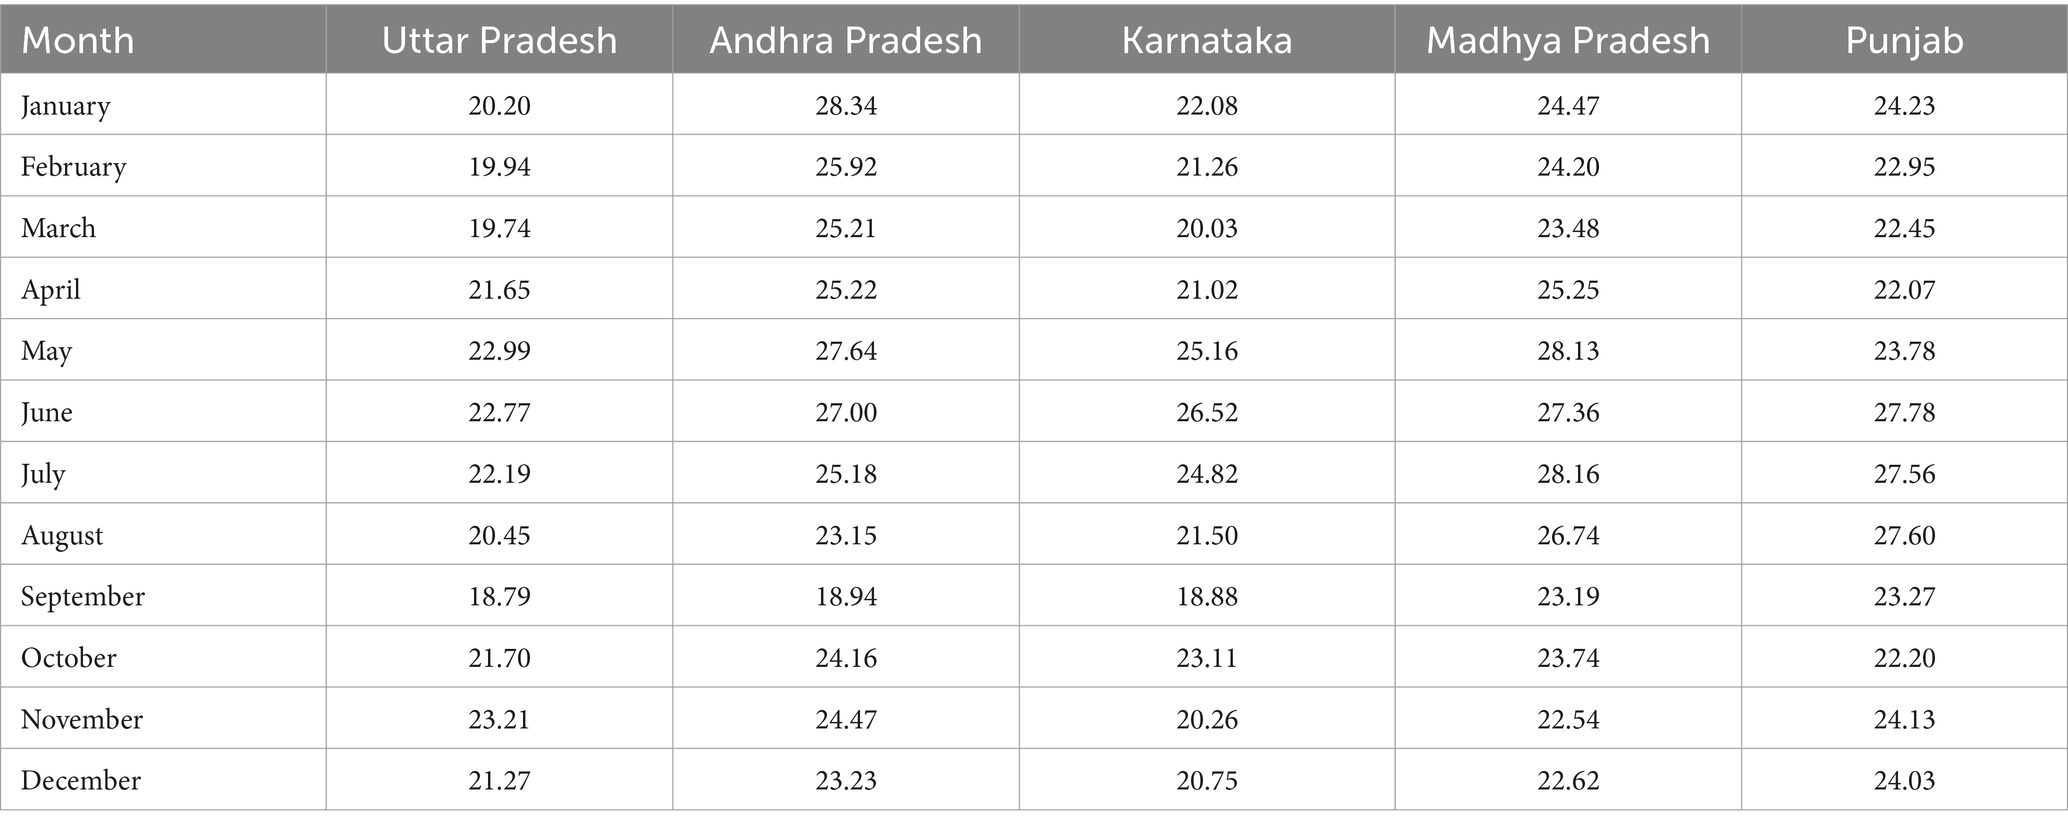
Table 4. Variability of prices of black gram in selected states by Cuddy-Della-Valle index (per cent).
3.6 Trends in black gram prices across selected states
The trend in black gram prices across Uttar Pradesh, Andhra Pradesh, Karnataka, Madhya Pradesh, and Punjab was analyzed using regression equations. The estimated equations, along with R2 values and t-statistics, are presented in the Table 5. In Uttar Pradesh, the price trend equation (y = 7447.4 + 16.93 t) showed a significant upward trend, with an R2 value of 0.1076 and a highly significant t-value (3.87*). Similarly, Madhya Pradesh (y = 7007.90 + 16.45 t) and Punjab (y = 7662.18 + 15.45 t) exhibited positive and significant trends, with t-values of 3.34* and 3.02*, respectively. In Andhra Pradesh, the price trend (y = 9075.81 + 11.46 t) was positive but weakly significant at the 10% level, with an R2 value of 0.0287, indicating limited explanatory power. Karnataka (y = 10373.8 + 0.68 t) showed an almost negligible price trend, with an R2 value of 0.0001 and an insignificant t-value (0.12), suggesting price stability over time. Overall, the analysis indicates that black gram prices in Uttar Pradesh, Madhya Pradesh, and Punjab have shown a significant increasing trend, while price movements in Andhra Pradesh and Karnataka were less pronounced.
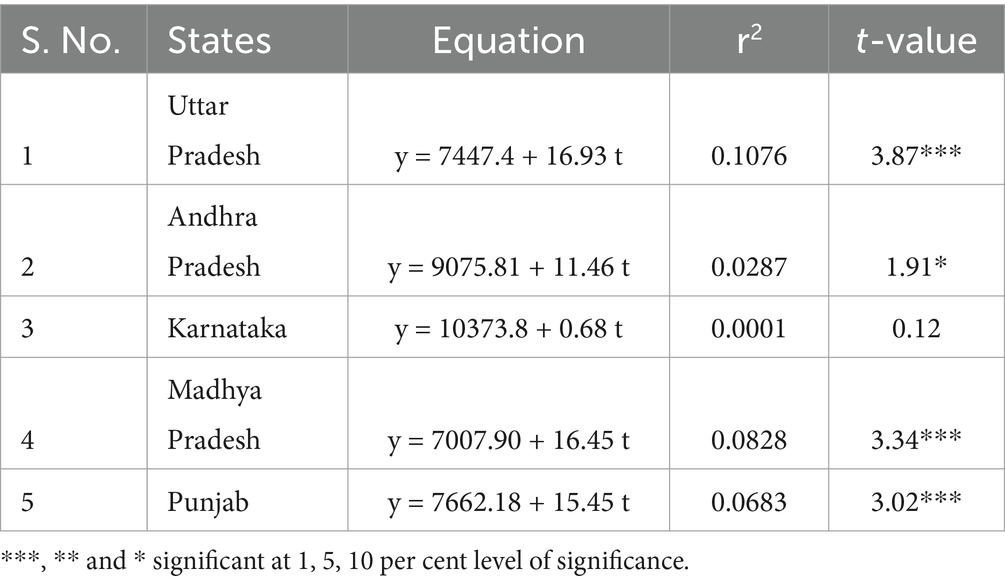
Table 5. Trends in prices of black gram in selected states of India.
The trends in the prices of black gram in selected states were graphically represented in Figure 2. The graph depicts that sharp spike in prices was observed between 2015 and 2016, followed by a decline, and a steady rise in recent years, reflecting market fluctuations.
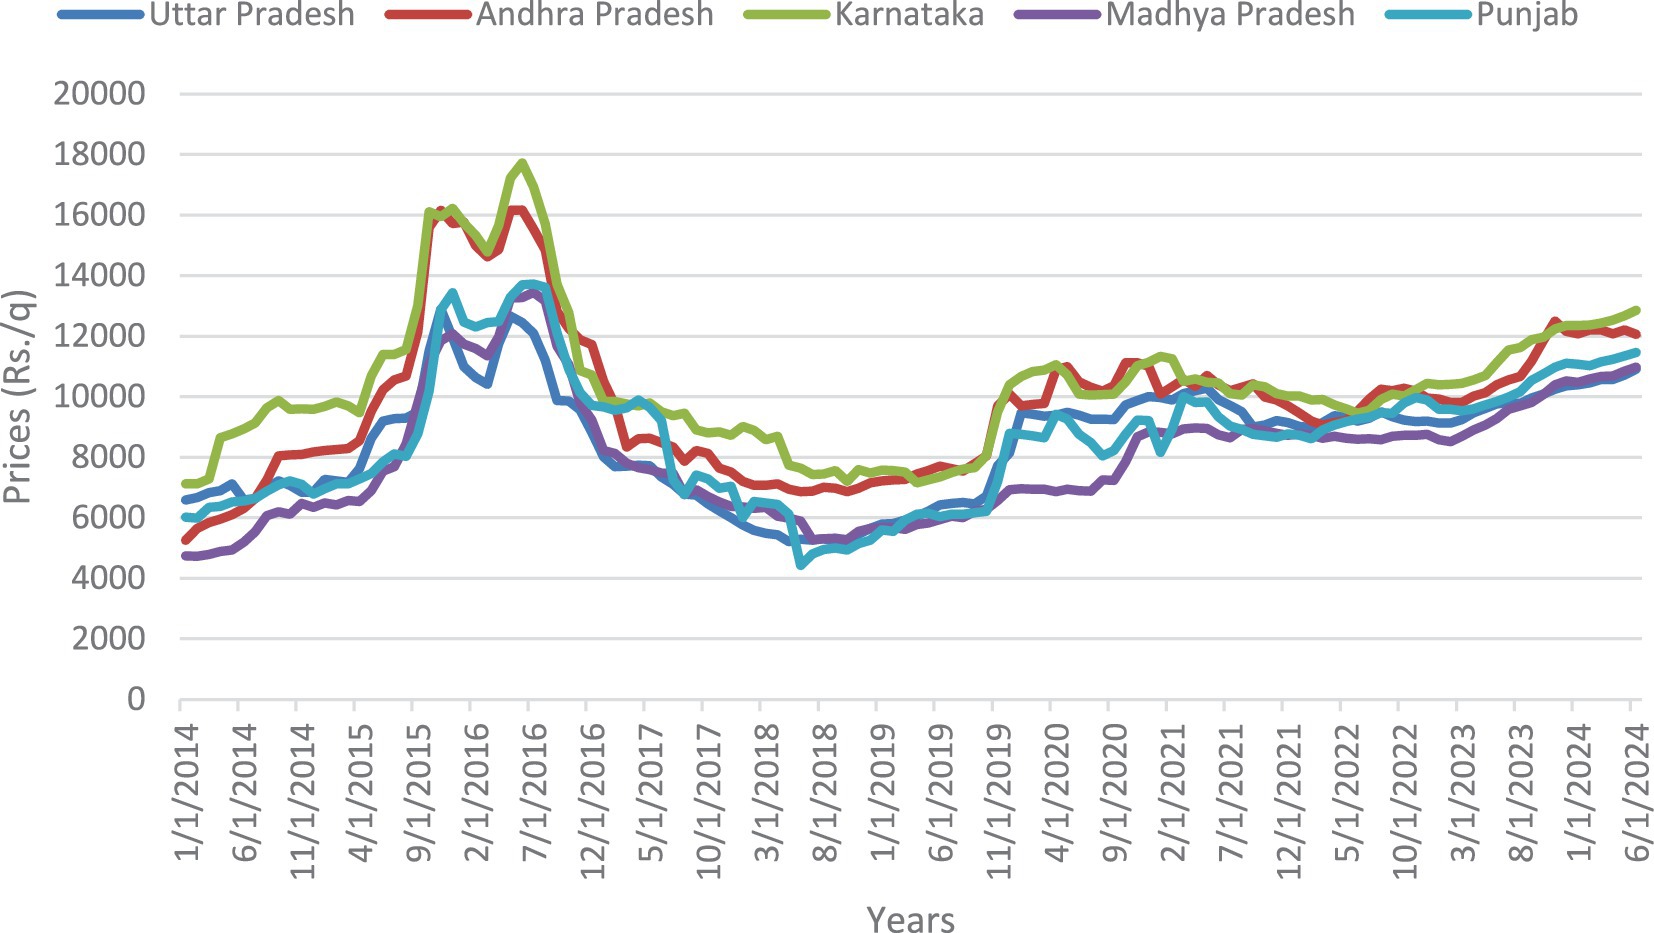
Figure 2. Trends in prices of black gram across major states.
3.7 Seasonal indices of black gram prices in selected states of India
The Table 6 presents seasonal indices of black gram prices across selected Indian states, showing monthly variations as a percentage of the annual average price. While Prices generally decline during peak harvest months (Oct-Nov for Kharif, May-Jun for Summer) due to higher supply, however, fresh arrivals often fetch a premium. In Uttar Pradesh, prices peak in Nov (103.63%) and May (102.46%) due to demand and stockpiling, while Feb sees the lowest (96.27%). Andhra Pradesh shows high post-harvest prices in Nov-Dec (107.51, 106.54%) and a low in March (93.61%). Karnataka and Madhya Pradesh follow similar trends, with peaks in Nov-Dec and lows in Feb-Mar due to procurement and stock adjustments. In Punjab, prices rise in Dec (105.72%), Apr (101.58%), and May (102.40%) due to off-season demand. Despite seasonal dips, fresh produce and market dynamics influence fluctuations.
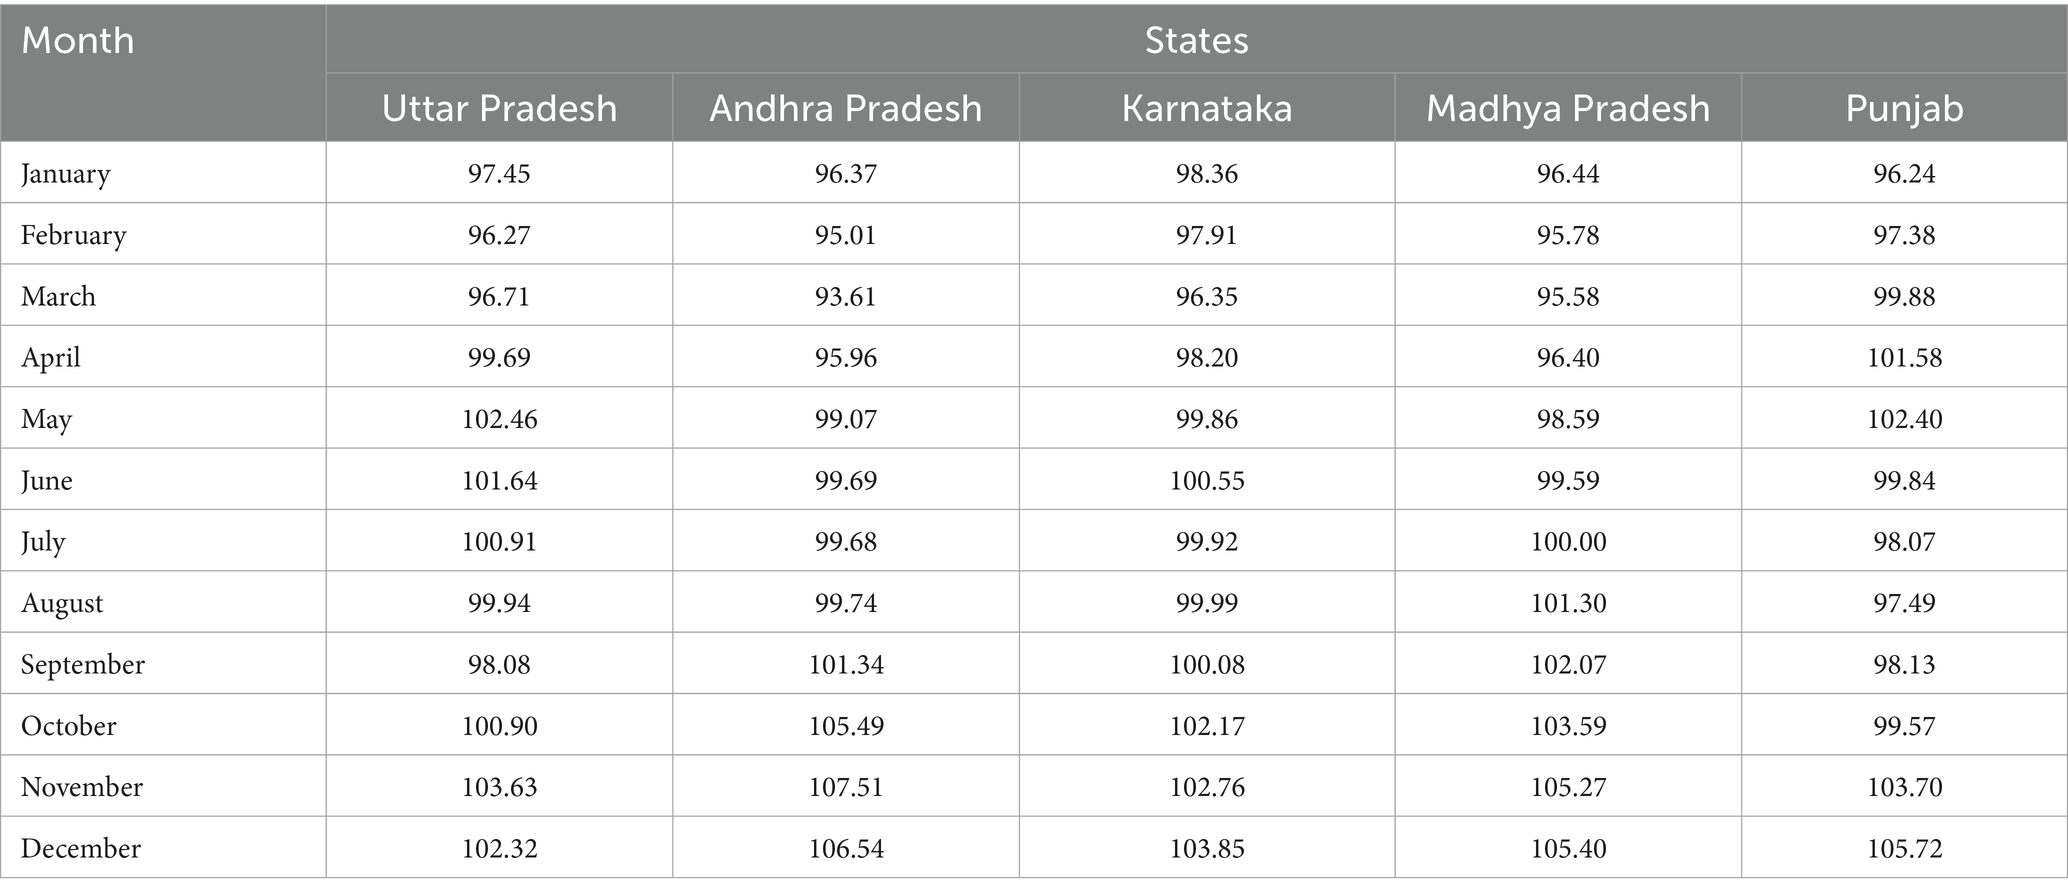
Table 6. Seasonal indices of black gram prices in selected states of India (Per cent).
3.8 Integration of black gram wholesale prices in India
The correlation coefficients of wholesale prices across selected states (Table 7) were highly significant at the 1% level, ranging from 0.878 to 0.953, indicating strong market integration. The highest correlation was between Andhra Pradesh and Karnataka (0.953), while the lowest was between Uttar Pradesh and Karnataka (0.878). Overall, the results indicate that the wholesale prices of black gram moved together and were well-integrated at the state level. Further analysis (Table 8) of residuals also showed strong correlations (0.886–0.965), confirming a high level of price integration even after removing trends and systematic factors. This suggests that price changes in one state are closely mirrored in others, reflecting a well-integrated market.
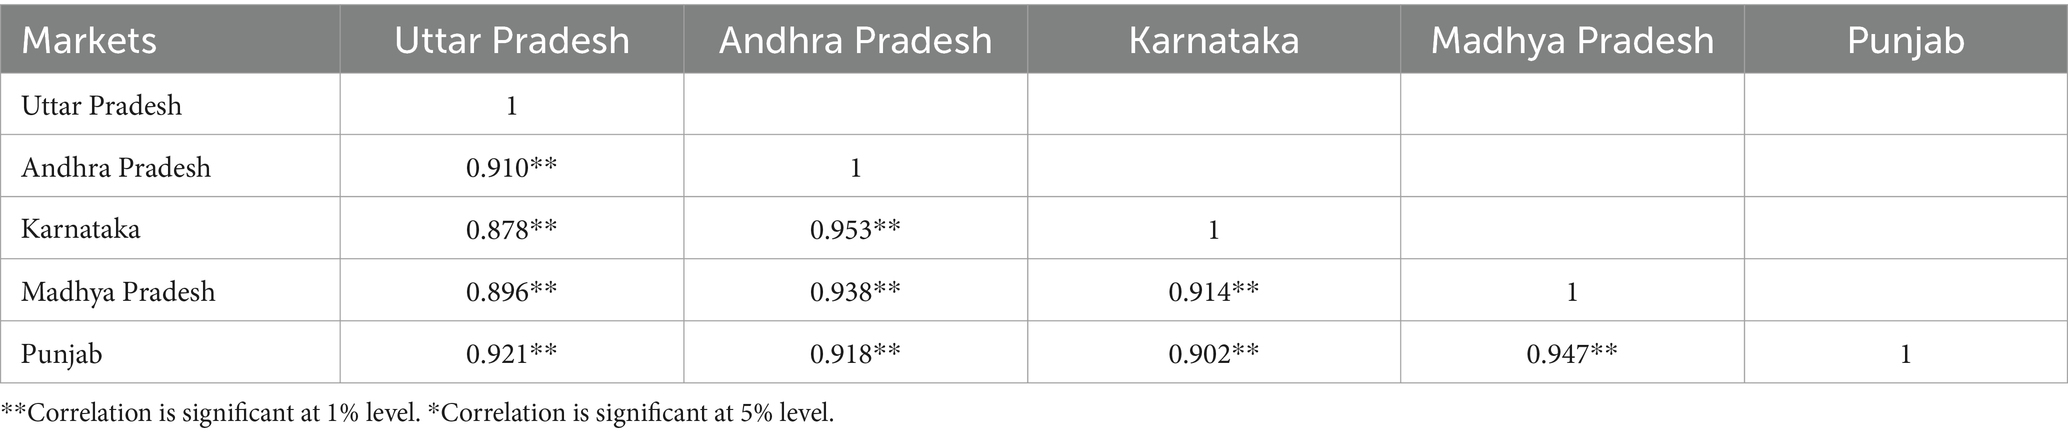
Table 7. Correlation coefficients of monthly black gram (urad dal) wholesale prices in selected states from 2014–15 to 2024–25.

Table 8. Correlation coefficients of residuals of monthly black gram (urad dal) wholesale prices in selected states.
3.9 Augmented Dickey-Fuller test (ADF)
The Augmented Dickey-Fuller (ADF) test was employed to assess the stationarity of the price series, as correlation analysis alone is insufficient for in-depth market integration analysis. To avoid spurious results, it is essential to check the stationarity of the variables (Xu et al., 2024). As shown in Table 9, the price series were non-stationary at their level, but became stationary after taking the first difference, as indicated by significant t-statistics across all markets. This allowed for co-integration analysis, verifying a long-term equilibrium relationship among the price series.
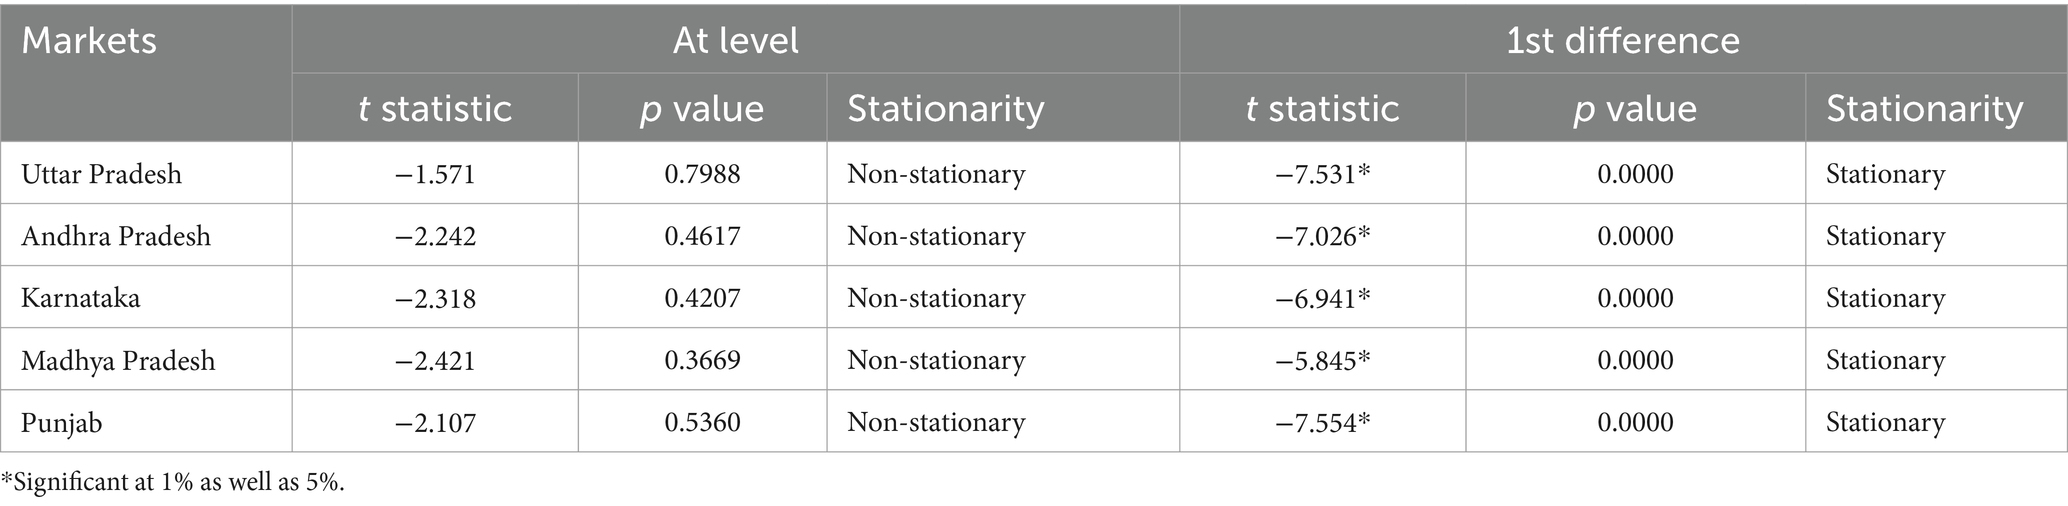
Table 9. Augmented Dickey Fuller test to check the stationarity of the price series.
3.10 Johansen co-integration test
To avoid spurious regression, this study employs the Johansen co-integration test to assess the integration between the selected markets (Fu and Zhang, 2024), with the findings summarized in Table 10. The unrestricted co-integration rank test (based on both the Eigenvalue and trace statistics) revealed the existence of at least five co-integrating equations at the 5% significance level. This indicates that the wholesale prices of black gram in the selected states exhibit a long-term equilibrium, reflecting the stability and strength of price connections among these states.
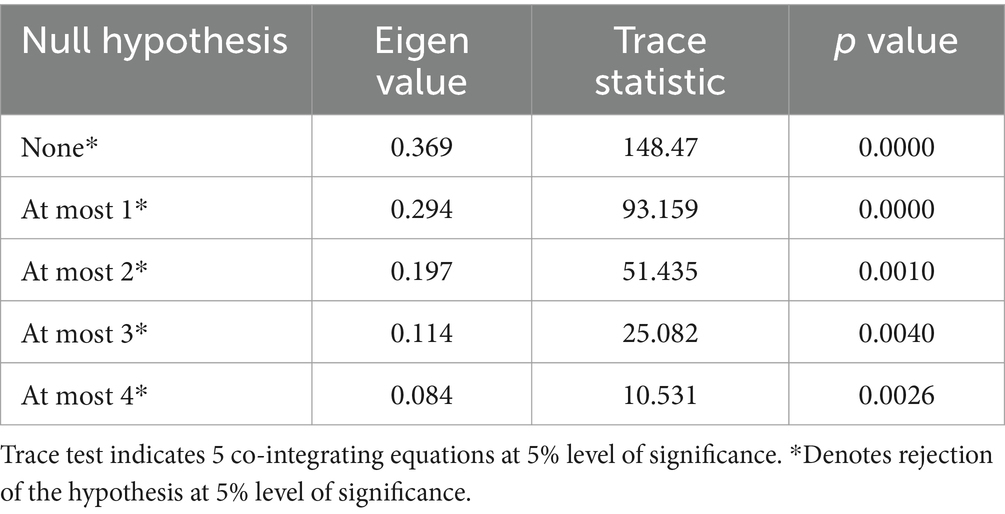
Table 10. Johansen co-integration test for price variation of black gram (urad dal) in selected States.
3.11 Direction of relationship in retail prices
The results of the causal relationships between the wholesale prices of black gram from the selected states at national level are presented in Table 11. The Granger Causality test was used to assess whether wholesale prices in one state influence prices in another. The null hypothesis, stating that the price in one state does not affect another, is accepted when the probability exceeds 0.05, and rejected when the probability is below 0.05. Figure 3 illustrates the direction of causality between markets of selected states. Madhya Pradesh bidirectional link with Punjab and Uttar Pradesh, along with unidirectional influence on Andhra Pradesh and Karnataka, indicates that price signals originating in Madhya Pradesh are consistently transmitted to other major markets. This underscores Madhya Pradesh’s dominance as key market, likely due to its significant production share and early-season arrivals that set national price trends.
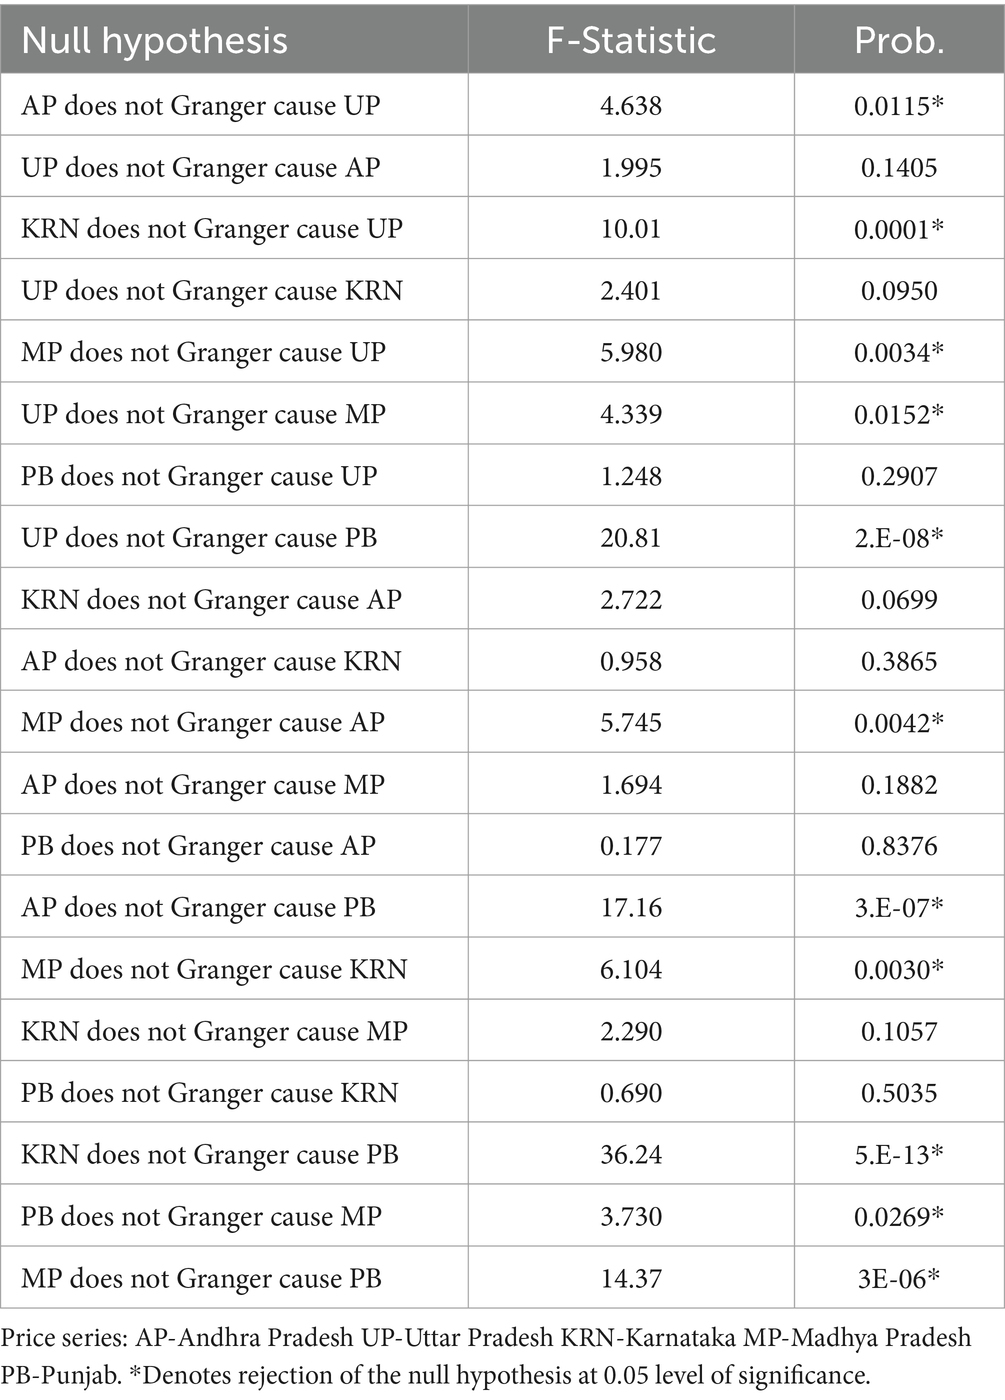
Table 11. Pairwise Granger causality test of selected states (n = 123).
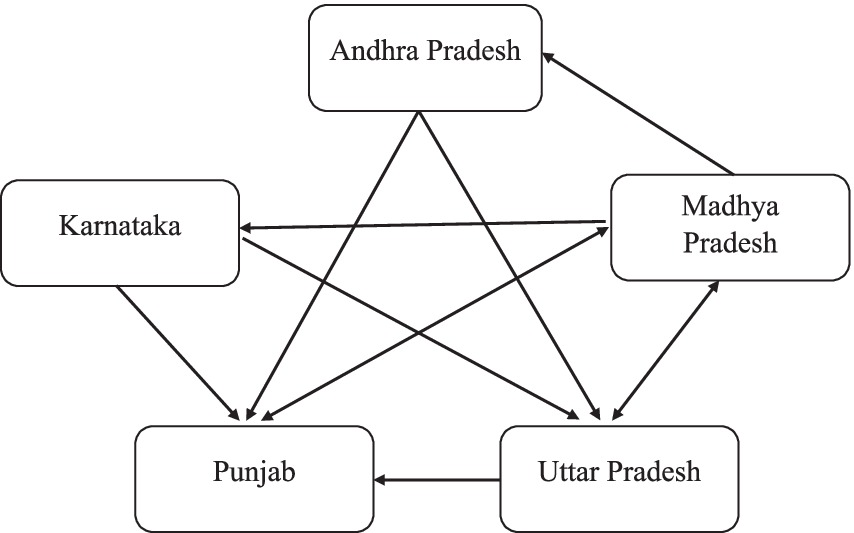
Figure 3. Granger causality direction between selected states pairs.
Conversely, Punjab’s prices were found to be strongly influenced by all other states, suggesting that it is a price-taker rather than a price-maker in the black gram value chain. This reflects its low production base and dependence on inter-state trade. Such asymmetric relationships highlight the importance of monitoring price signals from leading producer states like Madhya Pradesh to inform procurement strategies and price risk management in lagging regions.
3.12 Speed of adjustment to equilibrium in prices
The wholesale price series for all selected states were non-stationary at their levels but became stationary at first differences, indicating integration of order I (Banerjee and Ray, 2023). The Johansen Co-integration test confirmed co-integration among at least five states at the 5% significance level. Consequently, the Vector Error Correction Model (VECM) was applied to analyze short-and long-run price dynamics (Loves et al., 2021). The model’s coefficient represents the speed of adjustment, with a negative value indicating convergence to equilibrium and a positive or zero value suggesting divergence. A two-lag structure, determined by the lowest Akaike Information Criterion (AIC), was used for all selected states.
3.13 Equations of Vector Error Correction Model (VECM) of selected states
The Vector Error Correction Model (VECM) results provide deeper insights into how efficiently state markets adjust to long-run price equilibrium. Punjab’s relatively high speed of adjustment (30.7%) indicates that its market responds quickly to price signals from other states. This behavior is typical of a dependent market, where local prices are driven by external forces, particularly from larger producer states. In contrast, Andhra Pradesh corrects only 13.9% of disequilibrium monthly, suggesting a slower response to external price shifts, possibly due to stronger local demand–supply dynamics or less integration with national market signals. The divergence of Uttar Pradesh and Karnataka from equilibrium reflects short-term volatility or institutional frictions such as procurement delays, transport constraints, or reliance on local supply channels. Interestingly, Madhya Pradesh, despite being a price-dominant state, shows only weak convergence (2.4%), implying that it serves more as a price originator rather than a responder. Its prices are less influenced by other markets, reinforcing its leadership role in the national black gram market structure. These findings emphasize the asymmetric nature of price adjustment across markets, driven by differences in production intensity, market infrastructure, and regional demand. Strengthening market linkages and reducing frictions, especially in lagging states—can enhance the responsiveness and efficiency of India’s black gram trade.
3.14 Impulse response function
The Granger Causality test identified Madhya Pradesh as the key influencer of other markets. The Impulse Response Function and Variance Decomposition analyzed price reactions to shocks in MP. Figure 4 illustrates how a standard deviation shock in Madhya Pradesh (MP) affects prices across integrated markets over period of ten months. The results reveal that Andhra Pradesh and Uttar Pradesh exhibit an immediate and significant response, with prices peaking within two to three months after the shock. This indicates a high level of sensitivity to price movements in Madhya Pradesh, which likely reflects close trade linkages and synchronized harvest periods. Karnataka also responds positively, although with moderate intensity and slightly delayed stabilization. This suggests partial dependence on external price signals, possibly mediated through its own consumption and procurement cycles. In contrast, Punjab shows a distinct pattern. Prices there react sharply and negatively in the short term, before gradually stabilizing over eight to nine months. This could reflect the impact of higher transaction costs, market inefficiencies, or delayed transmission due to lower local production and storage constraints (Yang et al., 2024). The IRF findings highlight the extent and timing of inter-market dependencies, showing that price shocks in dominant producer states propagate asymmetrically across the network. These dynamics are critical for developing early warning systems, formulating regional procurement strategies, and improving buffer stocking decisions in more price-sensitive or dependent states.
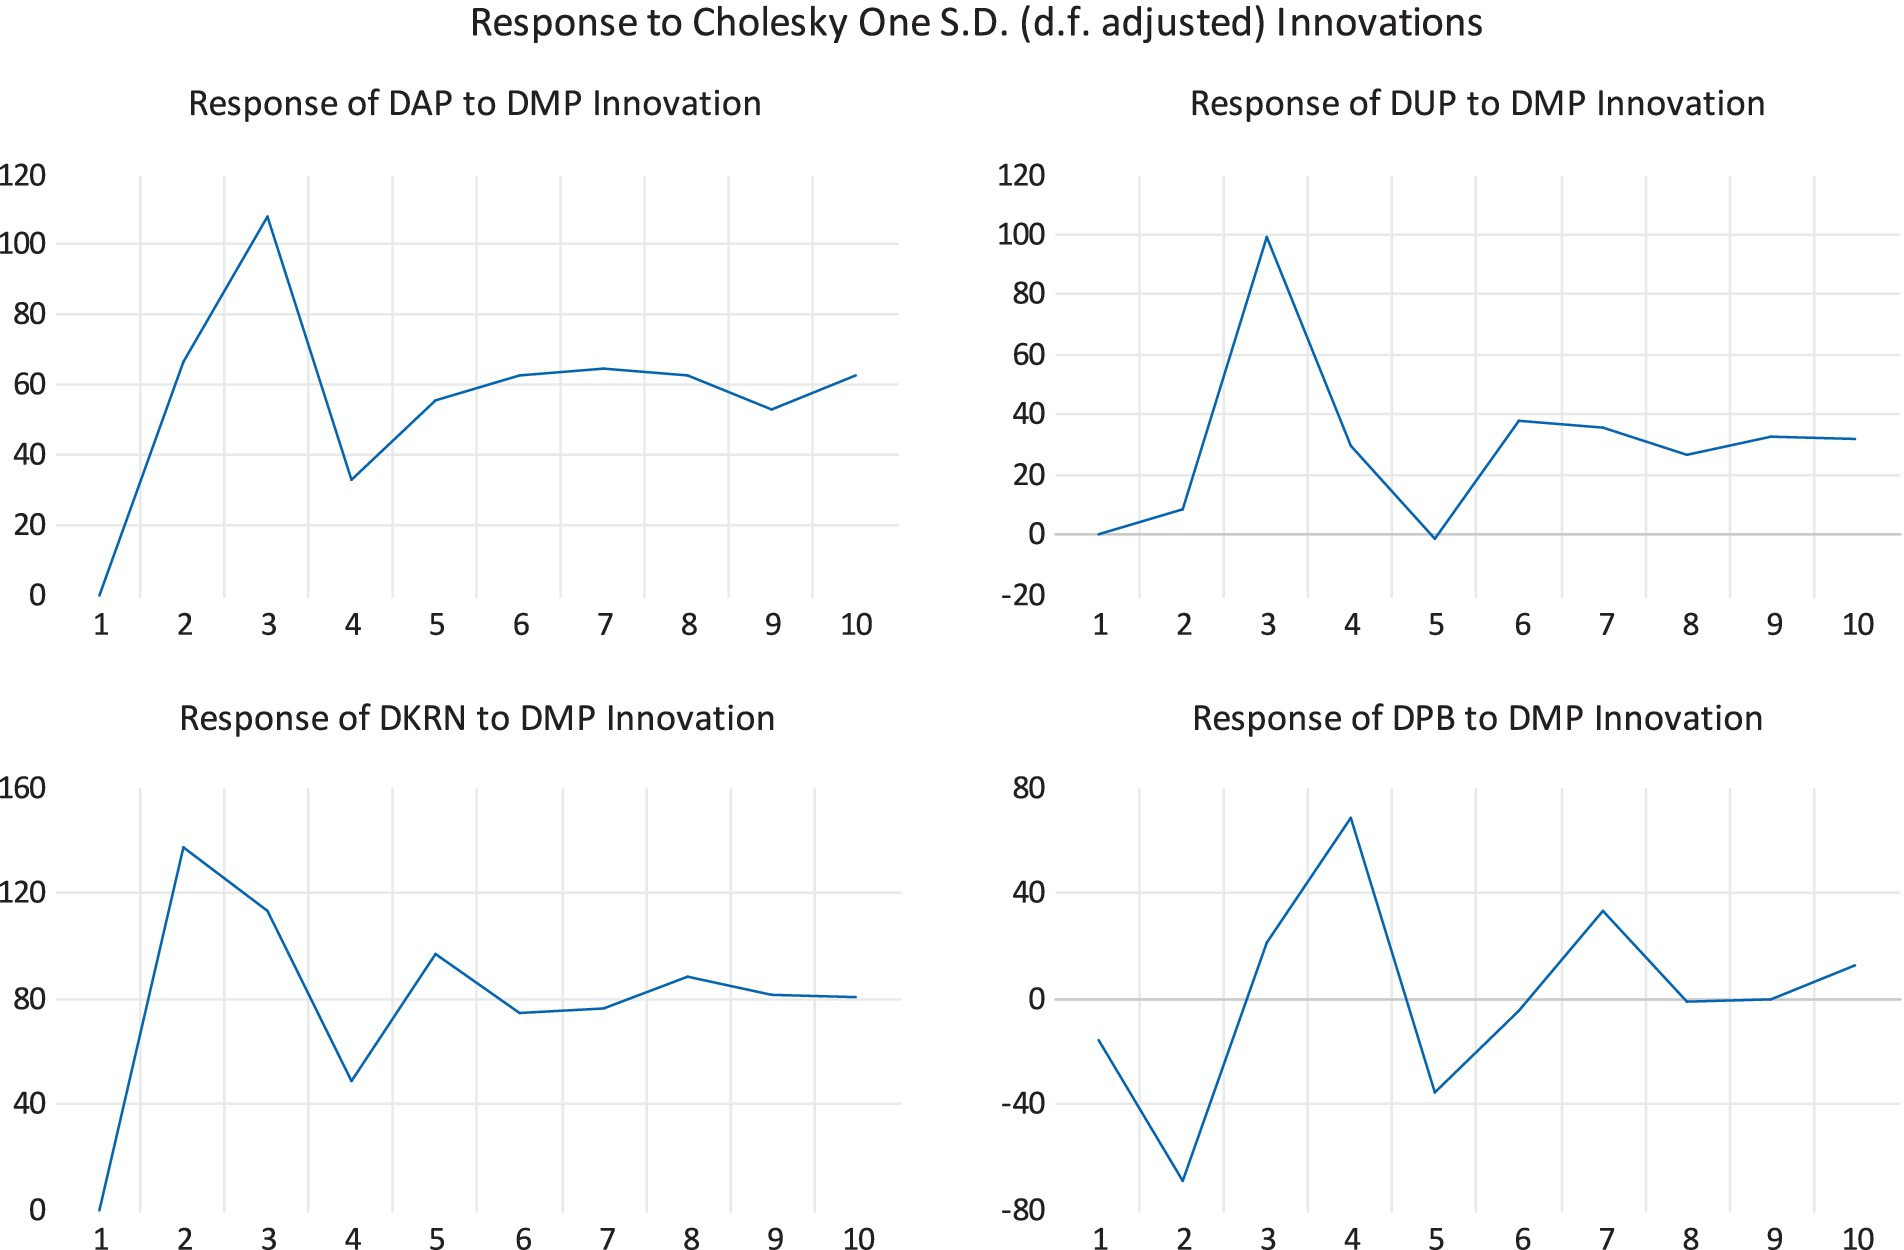
Figure 4. Response of other state markets to change in prices of Madhya Pradesh markets.
3.15 Variance decomposition
Variance decomposition assesses the contribution of external shocks to the forecast error variance (Mukherjee and Singh, 2022) of Madhya Pradesh’s wholesale black gram prices. In the short term, Madhya Pradesh accounts for nearly half of its own forecast error variance, reflecting strong internal market factors and its relative independence from external price movements. However, as the forecast horizon increases, the influence of Andhra Pradesh grows substantially, contributing over 42 percent to the price variation in Madhya Pradesh by the tenth period. This suggests that while Madhya Pradesh may lead in setting initial price signals, price feedback from Andhra Pradesh plays a growing role in shaping long run price movements, possibly due to evolving trade flows or policy interventions. Karnataka also contributes meaningfully over time, while Uttar Pradesh and Punjab exert relatively limited influence, highlighting their lesser roles in driving price dynamics in major producer markets. This reinforces the view that inter-market influence is not uniform and that a few dominant states shape the overall price architecture, while others tend to absorb rather than transmit price shocks (Table 12).
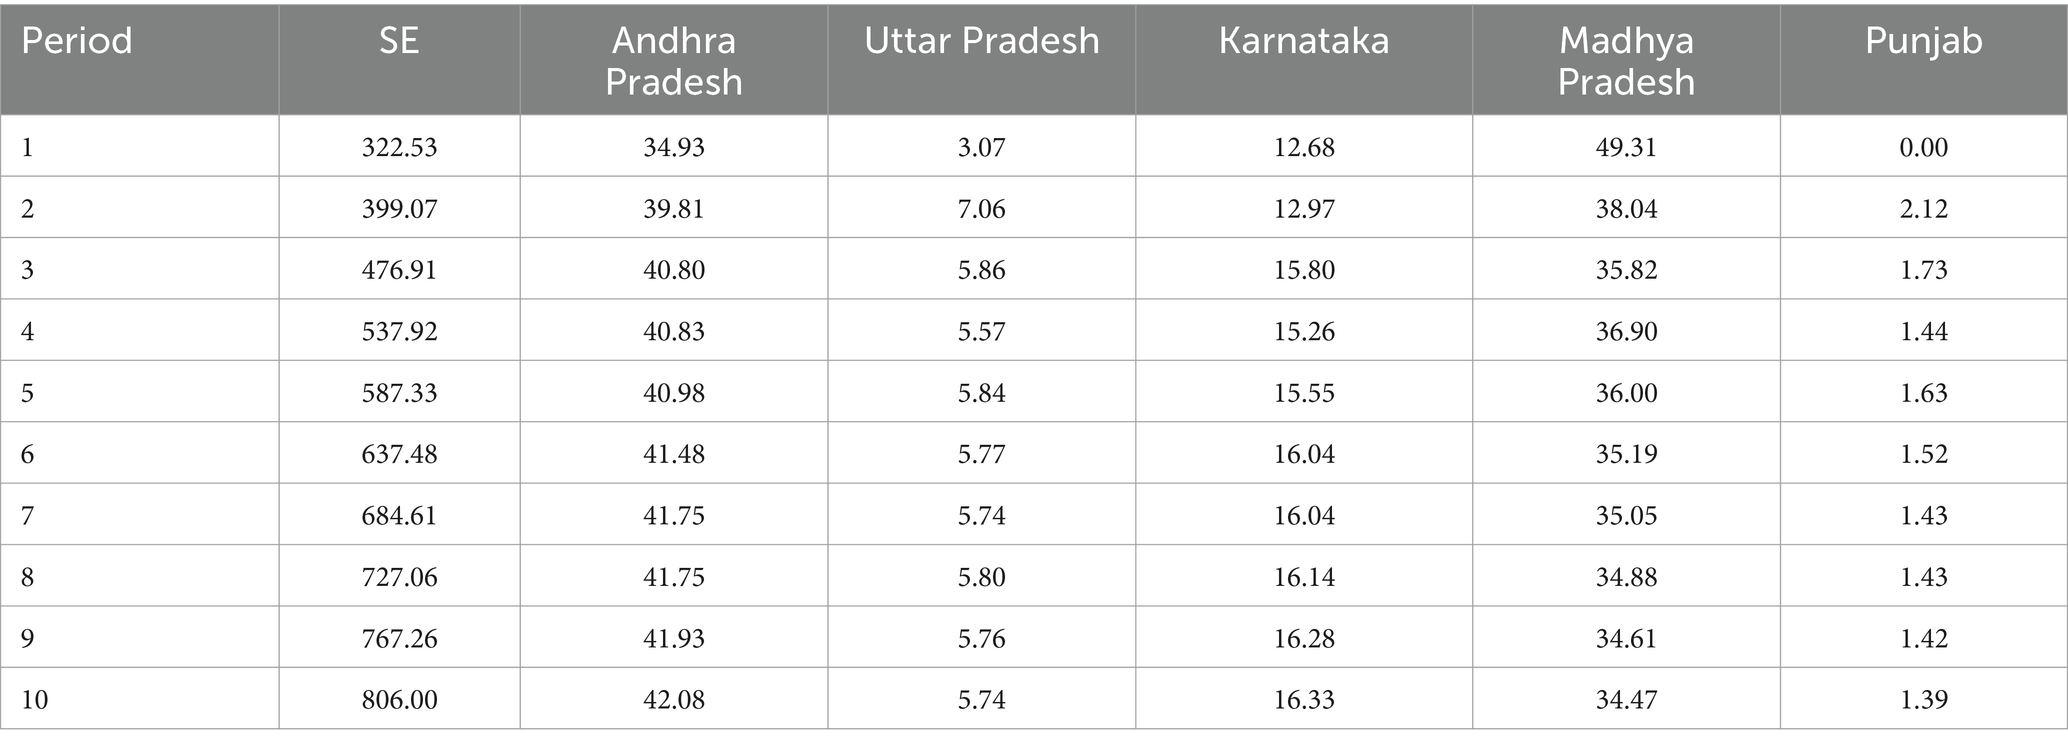
Table 12. Variance decomposition of urad dal prices state of Madhya Pradesh.
While the study presents robust evidence on price behavior and market integration of black gram across major Indian states, certain limitations should be acknowledged. The analysis relies entirely on secondary data, which may be subject to reporting lags, regional discrepancies, and data gaps, particularly at the mandi level. The price series used represent state level averages, which may smooth out important intra-state variations. Additionally, the selection of markets was guided by production and consumption shares, and may not capture all relevant trade corridors, particularly smaller or emerging markets. Finally, the models assume that past price behavior reflects current dynamics, which may not fully account for recent disruptions such as climate shocks, input price inflation, or sudden policy shifts. These limitations do not undermine the validity of the findings but highlight the need for future studies to integrate primary survey data, higher frequency price observations, and market level granularity to further strengthen the evidence base
4 Conclusion and policy implications
This study highlights key trends, challenges, and opportunities in India’s black gram market. Over the past five decades, area and production have generally increased, though fluctuations persist due to agronomic, climatic, and policy factors. While states like Madhya Pradesh, Rajasthan, and Uttar Pradesh have seen steady growth, Maharashtra has experienced a decline in cultivation. Despite expansion, yield improvements remain inconsistent, emphasizing the need for better technology and resource management. Market integration analysis reveals strong price connectivity among states, with correlation coefficients ranging from 0.878 to 0.953. The Johansen co-integration test confirms long-term price equilibrium, while the Granger causality test identifies Madhya Pradesh as a key price-determining market. Findings from the Vector Error Correction Model (VECM) further highlight efficient price adjustments, reinforcing the notion of a well-integrated black gram market. However, challenges such as price volatility and production instability persist, necessitating targeted policy interventions to enhance market efficiency and farmer profitability.
To address these challenges, there is a need to invest in high yielding, climate resilient black gram varieties and to strengthen support systems for their adoption. Developing localized extension services and subsidizing inputs like certified seeds and soil health interventions can help stabilize yield levels in fluctuating environments. Strengthening market infrastructure, especially in states with slower price adjustment such as Punjab and Karnataka, is equally important. Investments in scientific storage, decentralized procurement centers, and transport networks will reduce post-harvest losses and enable smoother market integration. Additionally, enhancing market information systems with timely and transparent price updates can improve decision making for farmers and traders. Introducing mobile based alerts, expanding e-NAM coverage, and developing real time price dashboards linked to major benchmark markets like Madhya Pradesh can improve the speed and accuracy of price transmission. Facilitating interstate trade by removing bottlenecks such as mandi fees, permit restrictions, and logistical barriers will further enhance competitiveness and price alignment across regions. In states like Punjab, where wheat and paddy dominate, structured incentives such as assured procurement for pulses and minimum support price enforcement can motivate farmers to diversify. Creating reliable market linkages through farmer producer organizations (FPOs), cooperatives, and aggregators will empower smallholders to access formal markets and negotiate better prices. Moreover, policy frameworks should recognize the evolving interdependence among state markets. As Andhra Pradesh and Karnataka gain increasing influence in shaping price movements, region specific procurement strategies and buffer stocking plans should be aligned with their market behavior. By addressing these structural and policy gaps, the black gram sector can become more competitive, inclusive, and resilient, delivering both food security and income stability for millions of pulse farmers.
Data availability statement
Publicly available datasets were analyzed in this study. This data can be found at: https://www.indiastat.com/data/agriculture/urad-black-gram; https://agmarknet.gov.in/; https://data.desagri.gov.in/website/crops-apy-report-web.
Ethics statement
This study did not require ethical approval as it relied entirely on publicly available secondary data sources.
Author contributions
SuS: Data curation, Formal analysis, Investigation, Software, Validation, Visualization, Writing – original draft, Writing – review & editing. AG: Conceptualization, Investigation, Methodology, Resources, Software, Supervision, Validation, Writing – review & editing. PSh: Conceptualization, Methodology, Software, Validation, Writing – review & editing. PSo: Data curation, Formal analysis, Writing – review & editing. VM: Data curation, Formal analysis, Writing – review & editing. DK: Writing – original draft. SaS: Writing – original draft. GS: Data curation, Writing – review & editing. RR: Conceptualization, Data curation, Software, Writing – review & editing.
Funding
The author(s) declare that no financial support was received for the research and/or publication of this article.
Conflict of interest
The authors declare that the research was conducted in the absence of any commercial or financial relationships that could be construed as a potential conflict of interest.
Generative AI statement
The authors declare that no Gen AI was used in the creation of this manuscript.
Publisher’s note
All claims expressed in this article are solely those of the authors and do not necessarily represent those of their affiliated organizations, or those of the publisher, the editors and the reviewers. Any product that may be evaluated in this article, or claim that may be made by its manufacturer, is not guaranteed or endorsed by the publisher.
Footnotes
References
Anuja, A. R., Kar, A., Jha, G. K., and Kumar, R. (2013). Price dynamics and market integration of natural rubber under major trade regimes of India and abroad. Indian J. Agric. Sci. 83.
Banerjee, A., and Ray, A. (2023). Influence of different planting dates on the occurrence of key pests affecting black gram in lower Gangetic alluvial plain of West Bengal. Res. Biotica. 5, 139–144. doi: 10.54083/ResBio/5.4.2023/139-144
Bhat, S., Aditya, K. S., Kumari, B., Acharya, K. K., and Sendhil, R. (2022). “Pulses production, trade and policy imperatives: a global perspective” in Advances in legumes for sustainable intensification (Cambridge, MA: Academic Press), 639–656.
Burkhanov, A. U., Popkova, E. G., Galoyan, D. R., Mkrtchyan, T. M., and Sergi, B. S. (2024). Deep learning, irrigation enhancement, and agricultural economics for ensuring food security in emerging economies. Global Trans. 6, 164–172. doi: 10.1016/j.glt.2024.06.002
Canova, F. (2011). Methods for applied macroeconomic research. Princeton: Princeton University Press.
Cuddy, J. D., and Della Valle, P. A. (1978). Measuring the instability of time series data. Oxf. Bull. Econ. Stat. 40, 79–85. doi: 10.1111/j.1468-0084.1978.mp40001006.x
Das, D., and Mukhopadhyay, D. (2024). “An analysis of the Price behaviour of agricultural Commodities in India” in Sustainable agricultural practices: Economic and environmental implications. ed. R. C. Das (Leeds: Emerald Publishing Limited), 43–55.
Dickey, D. A., and Fuller, W. A. (1979). Distribution of the estimators for the autoregressive time series with a unit root. J. Am. Stat. Assoc. 74, 427–431. doi: 10.2307/2286348
Fu, L., and Zhang, H. (2024). Analysis of factors influencing small-scale agricultural product prices from the perspective of the online public—a case study of China. Front. Sustain. Food Syst. 8:1355853. doi: 10.3389/fsufs.2024.1355853
Ganguly, K., and Gulati, A. (2022). “Pulses value chain-pigeon pea and gram” in Agricultural Value Chains in India: Ensuring Competitiveness, Inclusiveness, Sustainability, Scalability, and Improved Finance (London: Springer Nature), 253–286.
Goletti, F., Ahmed, R., and Farid, N. (1995). Structural determinants of market integration: the case of rice markets in Bangladesh. Dev. Econ. 33, 196–198. doi: 10.1111/j.1746-1049.1995.tb00713.x
Granger, C. W. J. (1969). Investigating causal relations by econometric models and cross-spectral methods. Econometrica 37, 424–438. doi: 10.2307/1912791
Jarrett, U., and Tackie, Y. (2024). Re-examining the effect of heat and water stress on agricultural output growth: how is sub-Saharan Africa different? Agric. Econ. 55, 515–530. doi: 10.1111/agec.12830
Johansen, S. (1989). Likelihood-based inference on cointegration theory and applications. Bologna: Centro Interuniversitario di Econometria.
Johansen, S., and Juselius, K. (1990). Maximum likelihood estimation and inference on co-integration with applications to the demand for money. Oxf. Bull. Econ. Stat. 52, 169–210. doi: 10.1111/j.1468-0084.1990.mp52002003
Kanth, A., Goswami, K., and Shukla, P. (2021). Product formulation from black gram and its evaluation for nutritional and sensory quality. Int. J. Chem. Stud. 9, 308–312. doi: 10.22271/chemi.2021.v9.i1f.11748
Kaur, K., Guleria, A., and Katoch, S. (2021). Assessment of co-movement of kinnow prices among the domestic markets in Punjab. J. Agric. Dev. Policy 31, 39–47.
Koop, G., Pesaran, H., and Potter, S. M. (1996). Impulse response analysis in non-linear multivariate models. J. Econom. 74, 119–147. doi: 10.1016/0304-4076(95)01753-4
Loves, L., Usman, M., and Russel, E. (2021). Modeling multivariate time series by vector error correction models (VECM) (study: PT Kalbe Farma Tbk. And PT Kimia Farma (Persero) Tbk). J. Phys. Conf. Ser. 1751:012013. doi: 10.1088/1742-6596/1751/1/012013
Minhas, B. S., and Vaidyanathan, A. (1965). Growth of crop output in India 1951-54 to 1958-61: an analysis by component elements. J. Indian Soc. Agric. Stat. 17, 230–252.
Mishra, P., Al Khatib, A. M. G., Lal, P., Anwar, A., Nganvongpanit, K., Abotaleb, M., et al. (2023). An overview of pulses production in India: retrospect and prospects of the future food with an application of hybrid models. Natl. Acad. Sci. Lett. 46, 367–374. doi: 10.1007/s40009-023-01267-2
Mukherjee, I., and Singh, U. K. (2022). Exploring a variance decomposition approach integrated with the Monte Carlo method to evaluate groundwater fluoride exposure on the residents of a typical fluorosis endemic semi-arid tract of India. Environ. Res. 203:111697. doi: 10.1016/j.envres.2021.111697
Pesaran, M. H., and Shin, Y. (1998). Generalized impulse response analysis in linear multivariate models. Econ. Lett. 58, 17–29. doi: 10.1016/S0165-1765(97)00214-0
Rahman, M. M., and Shahbaz, M. (2013). Do imports and foreign capital inflows lead economic growth? Cointegration and causality analysis in Pakistan. South Asia Econ J. 14, 59–81. doi: 10.1177/1391561413477941
Sahoo, S. P., and Singh, R. (2017). Trend and seasonality in prices and arrivals of Bengal gram. Indian J. Econ. Dev. 5, 1–5.
Sharma, Y., Sidana, B. K., Kumar, S., Kaur, S., Sekhon, M. K., Mahal, A. K., et al. (2023). Pre and post water level behaviour in Punjab: impact analysis with DiD approach. Sustain. For. 15:2426. doi: 10.3390/su15032426
Sihmar, R. (2014). Growth and instability in agricultural production in Haryana: a district level analysis. Int. J. Sci. Res. Publ. 4, 1–12.
Singh, M. J., Kaur, A., Chopra, S., Kumar, R., Sidhu, M. S., and Kataria, P. (2022). Dynamics of production profile of pulses in India. Legum. Res. 45, 565–572. doi: 10.18805/LR-4274
Wan, W., and Tao, J. (2023). The impact of food safety scandals on pork prices from consumer concern perspective: evidence from China. Front. Sustain. Food Syst. 7:1270705. doi: 10.3389/fsufs.2023.1270705
Xu, F., Ni, X., Liu, K., Wang, M., Tan, K., and Hu, J. (2024). Analysis of pork price fluctuations during the special era when African swine fever and COVID-19 epidemic coexisted: an empirical study in Macau, China. Front. Sustain. Food Syst. 8:1370726. doi: 10.3389/fsufs.2024.1370726
Xu, J., Song, Y., Rui, Z., Zhang, Z., Hu, C., Wang, L., et al. (2025). Trend analysis of the application of multispectral technology in plant yield prediction: a bibliometric visualization analysis (2003–2024). Front. Sustain. Food Syst. 9:1513690. doi: 10.3389/fsufs.2025.1513690
Keywords: black gram, production analysis, market integration, price behavior, price shock
Citation: Singh S, Guleria A, Sheoran P, Sood P, Mahajan V, Kumar D, Singh S, Singh G and Rana RK (2025) Price transmission and market integration analysis of black gram (urad dal) across major Indian states. Front. Sustain. Food Syst. 9:1589518. doi: 10.3389/fsufs.2025.1589518
Edited by:
Athula Naranpanawa, Griffith University, AustraliaReviewed by:
Lalam Gangadhar, Sam Higginbottom University of Agriculture, Technology and Sciences, IndiaRagini H. R., Uttar Banga Krishi Viswavidyalaya, India
Copyright © 2025 Singh, Guleria, Sheoran, Sood, Mahajan, Kumar, Singh, Singh and Rana. This is an open-access article distributed under the terms of the Creative Commons Attribution License (CC BY). The use, distribution or reproduction in other forums is permitted, provided the original author(s) and the copyright owner(s) are credited and that the original publication in this journal is cited, in accordance with accepted academic practice. No use, distribution or reproduction is permitted which does not comply with these terms.
*Correspondence: Amit Guleria, YW1pdGd1bGVyaWFAcGF1LmVkdQ==
†These authors have contributed equally to this work and share first authorship