 Ruby Aracely Narváez Cadena
 Diego Fernando Roa Acosta
 Jesús Eduardo Bravo Gómez
- Departamento de Ingeniería Agroindustrial, Universidad del Cauca, Popayán, Colombia
The objective of this study was to subject Sacha inchi (TA) kernels to mechanical (TST), thermo- mechanical (TCT), and chemical (TMH) processes with the aim of obtaining cakes with a high protein content. These were then compared with commercial brands (TP and HC). Proximate analysis, anti-radical capacity (determined using DPPH and ABTS assays), reducing capacity (evaluated using the FRAP assay), and antinutritional compounds (tannins, phytates, and saponins) were quantified. The TCT and TP treatments exhibited relatively low contents of tannins (3.78 ± 0.01 and 2.55 ± 0.02 mg/100 g sample), phytates (3.073 ± 0.004 and 3.214 ± 0.001 mg/100 g sample), and saponins (0.496 ± 0.005 and 0.437 ± 0.002 mg/100 g sample) in comparison to the treatments (TST and HC). Accordingly, TCT, TP, and TMH were selected for the determination of rheological properties and in vitro protein digestibility, as well as the evaluation of interfacial potential at varying pH (4, 5, 7, 9) and temperatures (25 °C, 40 °C, 55 °C). The thermo-mechanical and chemical treatments result in alterations to the configuration of the proteins, which are characterized by the formation of specific secondary structures, including β-sheets, random coils, α-helices, and β-turns. These structural changes impact the interfacial potential of the proteins, influencing the particle size and the zeta potential. The results indicated that the structural changes caused by the treatments could optimize the use of Sacha inchi protein cakes in the food industry, favoring their functionality and use in the development of new products.
1 Introduction
Sacha inchi (Plukenetia volubilis) is a member of the Euphorbiaceae family. It is commonly referred to as the “Inca peanut,” “mountain peanut,” “sacha peanut,” “incha peanut,” or “incha nut.” It is a climbing plant that is native to the Peruvian Amazon basin, where it has been cultivated for a long time. It is well-suited to tropical climates. In recent decades, it has expanded to other regions, including countries such as Colombia, Ecuador, China, Vietnam, Thailand, and Taiwan. This is due to the high interest it has generated in recent years for its remarkable nutritional composition and bioactive properties (Chan et al., 2024; Landines Vera et al., 2024; Cordero-Clavijo et al., 2025).
The main component of Sacha inchi is oil, which contains between 45 and 60% omega-3, 6, and 9 fatty acids. The protein content represents between 25 and 30% of the total composition, including essential amino acids such as cysteine, tyrosine, threonine, and tryptophan. Additionally, the oil contains other nutrients such as vitamin E, polyphenols, tocopherols, minerals, and fiber, which enhances its application in the food industry (Cai, 2011; Wang et al., 2018; Chirinos et al., 2013).
Currently, there is a growing interest in Sacha inchi, not only in oil extraction, but also in the use of the residual cake, which has a high protein content. However, the processing of Sacha inchi presents several challenges that require efficient and specific extraction methods. One of the main challenges is to preserve bioactive compounds such as antioxidants and essential fatty acids, which can be degraded when using processes that involve high temperatures, affecting the final quality of the product (Amparo et al., 2009; Cornelio-Santiago et al., 2021). Furthermore, reducing antinutritional factors is crucial to enhance the digestibility and bioavailability of nutrients without compromising their nutritional value (Taipe Cuadra et al., 2022). Another challenge is to optimize the protein content of the cake, ensuring its bioaccessibility and minimizing protein losses during the extraction process. Furthermore, the stability of the cake is a crucial consideration, as the residual lipid content can be oxidized, influencing the shelf life and affecting the flavor of the final product (Aslam and Schroën, 2023; Sahin, n.d.).
This study aimed to evaluate different oil extraction methods from Sacha inchi and their influence on the quality of the resulting cake. Specifically, the nutritional composition, phenolic and antioxidant compound content, and presence of antinutritional compounds in the cake were analyzed. Additionally, rheological behavior, protein digestibility, and infrared spectroscopy measurements were assessed, along with stability tests using Z potential and particle size. These analyses allowed us to determine the impact of each method on nutritional and bioactive properties, optimizing its potential as a by-product in the food industry.
2 Materials and methods
The Sacha inchi kernels (TA) was provided by the Sacha Tambo Cooperative, located in the San Juaquin District of Tambo, Colombia. The commercial flour extracted from the cake pellet by extrusion at 70°C (TP), and commercial flour extracted cold (HC), were supplied by the company SEGALCO SAS, which is headquartered at Panamericana AV 6 S-225, Jamundí, Colombia.
2.1 Methods of obtaining Sacha inchi cake
The analysis was conducted on Sacha inchi kernels (TA). To obtain the cake, different treatments were applied. Two mechanical extraction methods were used: mechanical extraction with controlled temperature (90°C) (TCT) and mechanical extraction without temperature application (TST). In a third treatment, the cake was obtained through chemical extraction by wet milling (TMH). Additionally, two commercial flours obtained through industrial processes were included for comparison: a commercial flour obtained from the Sacha inchi cake by extrusion at 70°C (TP), and another commercial flour extracted under cold conditions (HC).
2.1.1 Wet milling (TMH)
The milling process was conducted using an Oster blender (Oster, United States) with a 1.25-litre capacity. The Sacha inchi kernel was mixed with water in a 1:3 w/v ratio. The resulting mixture was then filtered through a fabric filter to separate the insoluble extract from the water-soluble extract. The resulting cake was dried in a Binder FD 115 UL drying oven (Binder GmbH, Tuttlingen, Germany) at 55°C for 18 h. Once dry, it was immediately packaged in a polyethylene bag with a hermetic seal for storage until later use (Narváez Cadena et al., 2023; Valles Ramírez et al., n.d.).
2.1.2 Thermo-mechanical method
Sacha inchi kernels were introduced into the hopper of a GOLDEN WALL automatic extractor press, model K28 (GOLDEN WALL, China). Two types of mechanical extraction processes were applied: mechanical extraction with controlled temperature (90°C), referred to as TCT, and mechanical extraction without temperature application, referred to as TST. During the process, the press screw pushed the material through the main pressing cylinder, gradually reducing the chamber volume and increasing pressure. Friction against the cylinder wall facilitated oil extraction, which flowed through the cylinder holes, while the cake was expelled through the outlet nozzle (Narváez Cadena et al., 2023).
2.2 Proximate analysis
The chemical composition of the treatments was determined in accordance with the “Official Method of Analysis” published by the Association of Official Analytical Chemists. To determine the humidity content, the dehydration technique outlined in the AOAC 934.01 protocol was employed using a FD 115 UL drying oven (Binder, Tuttlingen, Germany). The Soxhlet method was employed to quantify ether extract in accordance with the AOAC 920.85 standard, using a Soxhlet extraction system SoxTest SX-6 (Raypa, Barcelona, Spain). To determine ash content, the calcination technique was employed in accordance with the AOAC 942.05 standard, using a muffle furnace Thermolyne 1,400 Furnace (Thermo Fisher Scientific, Waltham, MA, United States). The determination of crude fiber was conducted in accordance with the AOAC 962.09 protocol using a fiber analyzer Fibertest (Raypa, Barcelona, Spain).
The protein content was determined by elemental analysis using the EMA 502 Elemental Micro Analyzer (VELP Scientifica, Usmate Velate, Italy), and calculated using the nitrogen-to-protein conversion factor of 6.25. To measure nitrogen, an EMA 502 VELP Scientific elemental microanalyzer was utilized, employing a CHNS analysis that commences with the pyrolysis of the sample. 3.5 mg was placed inside the VELP combustion furnace at a temperature of 1,030°C, where it was converted into elemental compounds. Subsequently, the flow passes through a chemical trap where all impurities are absorbed and reaches the gas chromatography column, ultimately reaching the TCD detector. The analysis time per sample is approximately 430 s. The calibration curve and the equation used for the respective nitrogen analysis are provided below. Sulphanilic acid was used as the standard for developing the curve (Figure 1). The carbohydrate content present in the raw material was determined by difference, subtracting from 100% the sum of the percentages of water, crude protein, ash, ether extract, and crude fiber obtained, thus expressing the results on a dry weight basis.
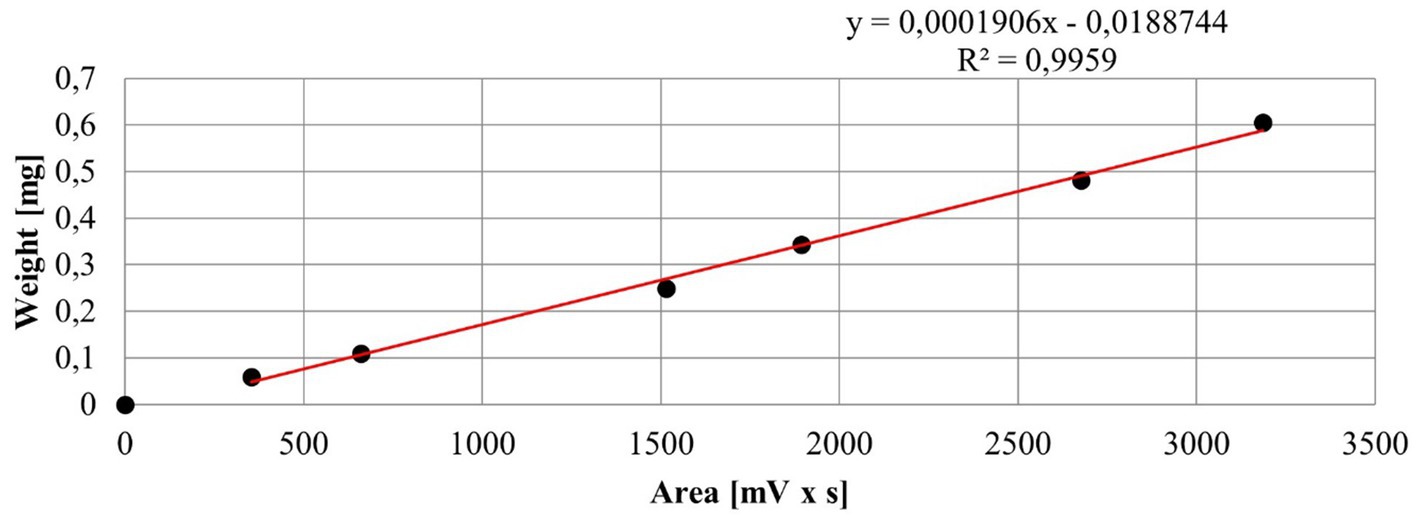
Figure 1. Calibration curve for nitrogen content measurement.
2.3 Phenolic compounds
2.3.1 Extractable phenolic compounds (EPP)
The mixture was shaken at 200 rpm for 25 min at room temperature using an orbital shaker LSI-3016A (LabTech, Korea). After shaking, the mixture was centrifuged at 3500 rpm for 5 min using an Thermo Scientific™ ST Plus Series centrifuge (Thermo Fisher Scientific, Germany). The supernatant was transferred to a separate tube, and 40 μL of 2% EDTA was added. For the second extraction, 8 mL of a 70% acetone solution with 1% formic acid and 30% water was added to the remaining residue, following the same shaking and centrifugation conditions. Both supernatants were combined and adjusted to a final volume of 20 mL with distilled water. The obtained extract was analyzed by the Folin–Ciocalteu method to determine the antioxidant content. A reaction mixture was prepared by mixing 40 μL of the extract with 1800 μL of Folin–Ciocalteu reagent, shaken for 1 min, and allowed to react for 5 min. Then, 1,200 μL of NaHCO₃ was added, and the solution was shaken again and left to stand for 60 min at room temperature. Absorbance was measured at 765 nm using a microplate using Varioskan™ LUX spectrophotometer (Thermo Scientific, Waltham, United States). Results were expressed as mg of gallic acid equivalents (mg GAE) per gram of sample, using a calibration curve prepared with gallic acid (Muñoz-Pabon et al., 2022).
2.3.2 Antiradical and reducing capacity
The extract obtained from the analysis of extractable phenolic compounds (EPP) was subsequently used to evaluate the antioxidant capacity through different in vitro assays.
2.3.2.1 Antioxidant activity by DPPH method
100 μL of the extract and 3.9 mL of the DPPH standard solution were added to a test tube lined with aluminum foil and vortexed for 15 s to initiate the reaction. Subsequently, the sample was incubated at 30°C for 30 min and then centrifuged at 10.000 rpm for 5 min at 25°C using an Thermo Scientific™ ST Plus Series centrifuge (Thermo Fisher Scientific, Germany). The absorbance was determined at a wavelength of 517 nm using the Varioskan™ LUX spectrophotometer (Thermo Scientific, Waltham, United States) (Muñoz-Pabon et al., 2022). The antioxidant activity was expressed in micromoles of Trolox equivalents (μmol TE) per gram of sample, based on a calibration curve constructed with Trolox.
2.3.2.2 Antioxidant activity by the ABTS method
In a test tube, 1.35 mL of the extract and 4 mL of the previously prepared ABTS solution were added. Subsequently, the sample was vortexed for five seconds and then allowed to rest for 30 min. The measurement was taken at 729 nm using the Varioskan™ LUX spectrophotometer (Thermo Scientific, Waltham, United States) (Muñoz Pabon et al., 2024). The antioxidant activity was expressed in micromoles of Trolox equivalents (μmol TE) per gram of sample, according to a calibration curve constructed with Trolox.
2.3.2.3 Reducing activity by the FRAP method
To obtain the extract, 0.4 g of sample was mixed with 10 mL of ethanol in a 50 mL Falcon tube. The solution was vortexed for 15 s and shaken at 37°C and 200 rpm for 30 min using an orbital shaker LSI-3016A (LabTech, Korea). Afterward, it was centrifuged at 5000 rpm for 15 min in the Thermo Scientific™ ST Plus Series centrifuge (Thermo Fisher Scientific, Germany), and the supernatant was filtered. For the assay, 60 μL of the extract and 180 μL of water were mixed and vortexed, then 1800 μL of FRAP reagent was added. The mixture was incubated at 37°C for 30 min, and absorbance was measured at 595 nm using the Varioskan™ LUX spectrophotometer (Thermo Scientific, Waltham, United States). Results were expressed in μmol of ascorbic acid equivalents (μmol AAE) per gram of sample (Castillo-Guaca et al., 2023).
2.4 Antinutritional factors
2.4.1 Tannins
In test tubes, 1 gram of the sample was weighed, and 4 mL of methanol was added. The mixture was vortexed for 15 s and then allowed to stand for 6 h at 40°C using a drying oven FD 115 UL (Binder GmbH, Tuttlingen, Germany). After incubation, the supernatant was filtered and stored for further analysis. Tannin content was calculated as the difference between total phenol content and the remaining phenols after precipitation with PVPP (Palacios et al., 2021). To determine the total phenol content, 0.04 mL of the methanolic extract was mixed with 0.06 mL of distilled water, 0.05 mL of Folin–Ciocalteu reagent diluted to 50% (v/v), and 0.225 mL of 20% sodium carbonate in Eppendorf microtubes. The mixture was vortexed, incubated in the dark for 40 min at room temperature, and then centrifuged at 10,000 rpm for 10 using an Thermo Scientific™ ST Plus Series centrifuge (Thermo Fisher Scientific, Germany). A volume of 0.25 mL of the supernatant was transferred to a microplate, and the absorbance was measured at 725 nm using the Varioskan™ LUX spectrophotometer (Thermo Scientific, Waltham, United States).
For the determination of non-precipitated phenols, 100 mg of PVPP was combined with 1.0 mL of water and 0.75 mL of extract in Eppendorf microtubes. After vortexing, the mixture was kept at 4°C for 15 min and centrifuged under the same conditions. Then, 0.04 mL of the supernatant was taken and analyzed following the same Folin–Ciocalteu procedure described above.
2.4.2 Phytates
Initially, 0.05 grams of the sample were added to 10 mL of 0.64 N hydrochloric acid, and the solution was shaken for 10 s. The mixture was then placed on an orbital shaker at 300 rpm and room temperature for 16 h using an orbital shaker LSI-3016A (LabTech, Korea). After incubation, the samples were centrifuged at 1512 g and 10°C for 20 min using an Thermo Scientific™ ST Plus Series centrifuge (Thermo Fisher Scientific, Germany). The supernatant was filtered through Whatman No. 1 filter paper into pre-weighed tubes containing 1 g of NaCl. The solution was shaken again for 20 min at 1512 g using the same centrifuge, and then stored at −20°C for 20 min. A second centrifugation at 1512 g for 20 min was performed. Then, 5 mL of the supernatant was extracted and diluted in 25 mL of deionized water. From this diluted sample, 3 mL was taken and mixed with 1 mL of Wade’s reagent (0.03% FeCl₃ 6H₂O + 0.3% sulfosalicylic acid), followed by centrifugation at 1512 g for 10 min. Finally, the absorbance of the reaction was recorded at a wavelength of 500 nm using a Varioskan™ LUX spectrophotometer (Thermo Scientific, Waltham, United States). The phytic acid content of the samples was expressed as mg of phytic acid per 100 grams of dry sample (Arjmand et al., 2023).
2.4.3 Saponins
To prepare the extract, 1 g of the sample was weighed and transferred to a 20 mL volumetric flask containing 80% ethanol. The solution was heated in a water bath at 60°C for one hour using a Memmert WNB14 water bath (Memmert GmbH + Co. KG, Schwabach, Germany). Afterward, the sample was centrifuged at 6251 g for 5 min using an Thermo Scientific™ ST Plus Series centrifuge (Thermo Fisher Scientific, Germany) and the supernatant was filtered and left at room temperature for 16 h. For saponin quantification, the extract was first homogenized, and 3 mL was filtered using Whatman paper. Then, 0.5 mL of the filtered extract was diluted in 96% ethanol. The absorbance of the diluted extract and the Liebermann–Burchard (LB) reagent was measured at 417 nm using a Varioskan™ LUX spectrophotometer (Thermo Scientific, Waltham, United States). In parallel, 1 mL of the diluted extract was transferred to a test tube lined with aluminum foil, and 3.5 mL of the LB reagent was added along the walls, followed by shaking for 30 s in a vortex mixer. This shaking process was repeated at minutes 10 and 20, and the mixture was allowed to rest until minute 30. After the 30 min reaction period, the absorbance was measured at 417 nm using a Varioskan™ LUX spectrophotometer (Thermo Scientific, Waltham, United States) (Ulchur Pillimue, 2022).
2.5 In vitro protein digestion
The K-PDCAAS protein digestibility kit was employed to estimate protein digestion. The methodology employed is based on the Protein Digestibility and Amino Acid Score (PDCAAS). This methodology is endorsed by the Food and Agriculture Organization of the United Nations (FAO) and the World Health Organization (WHO). The procedure was conducted in accordance with the instructions provided by the manufacturer (Megazyme, n.d.).
2.6 Infrared spectroscopy
Infrared spectroscopy was conducted on a Nicolet model IS50 spectrophotometer (Thermo Scientific, United States). To this end, a reflectance adapter (ATR) was employed to obtain an average of 32 scans at a resolution of 4 cm−1 and a temperature of 25°C, utilizing a flat tip. Prior to each measurement, a reference spectrum was obtained using air as the standard. The spectra spanned a range of 500 to 4,000 cm−1 and underwent baseline correction, smoothing, and normalization between 0 and 1. A peak deconvolution process was conducted in the region of 1,600 to 1710 cm−1 to identify secondary structures. The measurement was performed in triplicate (Castillo-Guaca et al., 2023).
2.7 ζ-Potential and particle size distribution
Particle size and ζ-potential measurements were made using an Anton Paar Litesizer 500 (Anton Paar GmbH, Graz, Austria) according to the methodology of Polo Muñoz et al. (2025) with some modifications. Particle size and ζ-potential measurements were performed with an Anton Paar Litesizer 500. Disposable polycarbonate cuvettes purchased from Anton Paar were used for dynamic light scattering measurements. This equipment detects scattered light in three scattering directions: forward scattering (15°), side scattering (90°) and backscattering (175°). The optimum scattering angle is automatically adjusted by the Kalliope software. In all measurements, the water was used as dispersant in the preparation of the buffer (refractive index of 1.330 and a viscosity of 0.0008903 Pa·s). The acetate buffer was used in the solutions at pH 4 and pH 5 and phosphate buffer was used in the solutions at pH 7 and pH 9. Dispersions at 0.1%w/w were prepared in 15 mL test tubes, shaken for 3 min in an ultraturrax at 15000 rpm. The dispersions were then allowed to stand for 24 h. 2 mL of the supernatant was then taken and injected into the measuring cells. it was allowed to equilibrate in the instrument for 20 s before measurement at 25°C and 55°C ± 0.1°C. Five measurements were performed for each dispersion with an average of 200 s per measurement.
The ζ-potential was measured using the same instrument as the DLS experiments, which employs a laser Doppler electrophoresis procedure. Using this method, the mobility within an Omega Z cuvette is measured, from which the ζ-potential can be calculated using the Hueckel approximation. Disposable folded capillary cuvettes were used for ζ-potential measurements and the sonicated solutions were loaded with a syringe to ensure that no air bubbles were trapped in the folded capillary.
2.8 Rheological properties
2.8.1 Pasting properties
The pasting properties were determined using an AR 1500 Rheometer (TA Instruments, New Castle, United States). The rheometer was equipped with a starch cell. A 5% (w/w) flour suspension in water was prepared and subjected to a heating and cooling ramp at a rate of 10°C/min (García-Parra et al., 2022). The viscosity curve, the maximum viscosity peak during heating, and the maximum viscosity peak during cooling were determined.
2.8.2 Flow curves
The flow curves of each dispersion were determined on a rheometer (Anton Paar MCR 102e, Austria) equipped with a CC27/T200/SS concentric cylindrical geometry. The dispersion was subjected to analysis at a concentration of 5% and a shear rate from 100 to 0.01 s−1. The results were modelled using the power equation (Equation 1) to determine the consistency (K) and the flow index (n).
Where:
is the shear stress (Pa).
is the shear rate (s−1).
is the consistency coefficient (Pa*s−1).
n is the flow behavior index.
2.8.3 Viscoelastic properties: amplitude sweep
The viscoelastic behavior of the dispersions subjected to the heating and cooling cycle was determined on the rheometer (Anton Paar MCR 102e, Austria) equipped with a CC27/T200/SS concentric cylindrical geometry. The amplitude sweep was conducted at a concentration of 5%, with a constant angular frequency (w) of 10 rad/s and a shear strain that increased from 0.01 to 100% (Pastrana-Pastrana et al., 2025).
3 Statistical analysis
To study the effect of treatments on proximal characterization, phenolic compounds, antioxidant capacity, antinutritional factors and protein digestibility, a one-way ANOVA was used. While, for the analysis of the electric potential and particle size, a two-way ANOVA is used, since the factors are the temperature and pH of the buffers. Tukey’s multiple range test was used to separate the means. Significant differences were determined at p < 0.05.
4 Results
4.1 Raw material
The results obtained from the evaluation of different Sacha inchi flours are presented below. These flours include samples obtained through various extraction methods, as described in the Materials and Methods section.
4.2 Proximal analysis
Figure 2 presents the findings of the proximate analysis conducted on the Sacha inchi kernels (TA), as well as the residual cakes obtained through diverse oil extraction techniques (TST, TCT, TMH) and the commercial cake (TP, HC). The results demonstrate that TA contains 24.1% protein and 59.2% ether extract. The TMH treatment indicates a fat content of 21.6 and 53.2%, while the TST, TCT, HC, and TP treatments indicate higher protein content, with the latter reaching 75.3%. Regarding the lipid content, the TP treatment exhibits a lower percentage of fat, with a value of 5.3%. In contrast, the HC, TST, and TCT treatments indicate a range of extract percentages between 7 and 9%. These results reflect an efficient extraction process. These findings align with those of previous studies, wherein other researchers have reported protein content in Sacha inchi seeds to range between 24.7 and 31.7% (Taipe Cuadra et al., 2022; Gutiérrez et al., 2011; Ruiz et al., 2013). The discrepancies in nutritional content observed across studies can be attributed to the efficacy of the extraction process and the influence of various factors, including the provenance of the seeds, geographical conditions, storage parameters, and post-harvest treatments employed (Wang et al., 2018).
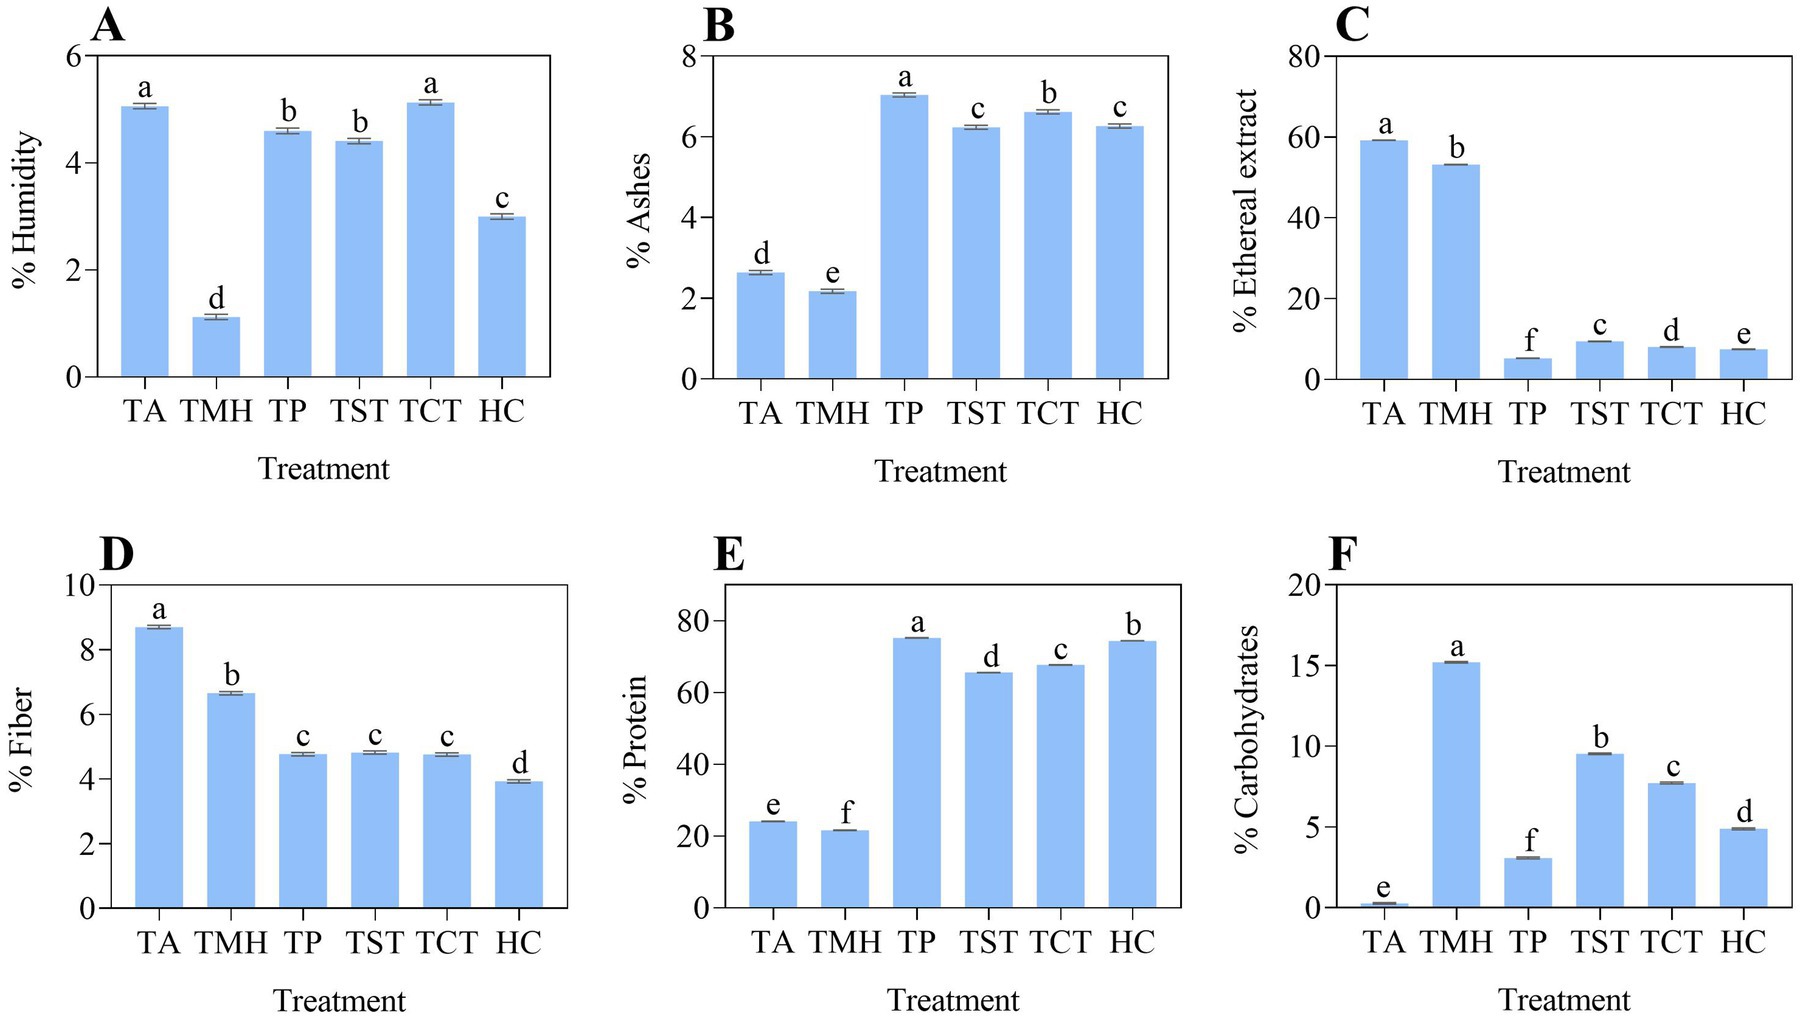
Figure 2. Proximal characterization. The graph (A) refers to humidity, (B) ash, (C) ether extract, (D) fiber, (E) protein and (F) carbohydrates. *The acronym (TA) refers to the Sacha inchi kernels. The (TST) mechanical extraction without temperature application. The (TCT) mechanical extraction with controlled temperature (90°C). The (TMH) designation represents chemical extraction through wet milling. The (TP) commercial flour obtained from the Sacha inchi cake by extrusion at 70°C and the (HC) commercial flour extracted under cold conditions. The use of different letters indicates that there are statistically significant differences between the samples (p < 0.05).
In previous studies, Ruiz et al. (2013) reported a protein content of 59.1%, which differs from the findings of Taipe Cuadra et al. (2022) and Rawdkuen et al. (2016), who reported protein contents between 56 and 56.6%, respectively. Another study found that Sacha inchi cakes contain 40.8% by weight Zambrano et al. (2020). In contrast to the findings of Díaz Céspedes et al. (2021), who reported a protein content of 81.2% in the pelleted cake. Regarding the lipid content, the findings of the present study are in accordance with those of Díaz Céspedes et al. (2021), who determined that the Sacha inchi seed contains 49% fat, while the defatted cake contains 7.8%. Similarly, the study by Taipe Cuadra et al. (2022) yielded comparable results, with 50.7% fat content in the seed and 16.2% in the cake. In contrast, Zambrano et al. (2020) indicated that the defatted cake contains 39.6% ether extract.
The discrepancy in compositional analysis between the various treatments under investigation can be attributed primarily to the extraction techniques employed and the loss of solids that occurs during the process. In the case of the Sacha inchi kernels (TA), which was not subjected to an extraction process, a high fat and protein content was maintained. However, the TMH treatment demonstrated a reduction in protein content and an increase in carbohydrate content (15.2%). This discrepancy may be attributed to the wet milling process, which generates a milky suspension that, upon filtration, may result in the loss of water-soluble proteins, which are retained in the slurry. In contrast, the TCT treatment exhibited a higher protein content relative to TST, which can be attributed to the application of heat during the extraction process. This facilitates a greater removal of the ether extract, thereby leaving a residual cake that is richer in protein. Notwithstanding, the fiber and ash contents of both treatments are comparable, although TST exhibited a higher carbohydrate content. Commercial cakes (TP and HC) also exhibit elevated protein levels, with TP displaying the highest protein content observed in the study (75.3%). This phenomenon can be explained using advanced extraction techniques, such as heated extrusion, which facilitate the more efficient removal of oil, thereby concentrating the protein in the resulting cake.
4.3 Phenolic compounds and antioxidant capacity
The extractable phenolic compounds (EPP) were determined, and the antioxidant capacity was evaluated by different methods (DPPH, ABTS and FRAP), since these antioxidants can act by different mechanisms depending on the reaction system or the source of radicals or oxidants (Palomino et al., 2009). EPPs are free polyphenols that can neutralize free radicals by donating electrons or hydrogen atoms, stabilizing them and thus preventing oxidative damage to cells and tissues (Pandey and Rizvi, 2009; Scalbert et al., 2005).
The FRAP method is based on the reduction of ferric ion (Fe3+) to ferrous ion (Fe2+) in the presence of antioxidants (Mercado-Mercado et al., 2013). This method measures the electron transfer capacity of the antioxidants present in the sample rather than their ability to directly neutralize free radicals as in the DPPH or ABTS assays (Huang et al., 2005). DPPH is a stable methanol-soluble free radical that is neutralized by a hydrogen transfer mechanism, whereas ABTS is generated in reaction that may be chemical, enzymatic, or electrochemical and is neutralized primarily by electron transfer (Aseervatham et al., 2012).
The polyphenol concentrations and their corresponding antioxidant capacities obtained from the analyzed samples are shown in Table 1. The samples from the different treatments (TA, TMH, TST, TCT, and TP) exhibited statistically significant differences (p < 0.05). However, a very significant effect was observed in the antiradical capacity: the samples obtained by the TST, TCT and TP treatments presented high values in the DPPH, ABTS and FRAP tests compared to the low values of the TA and TMH samples.
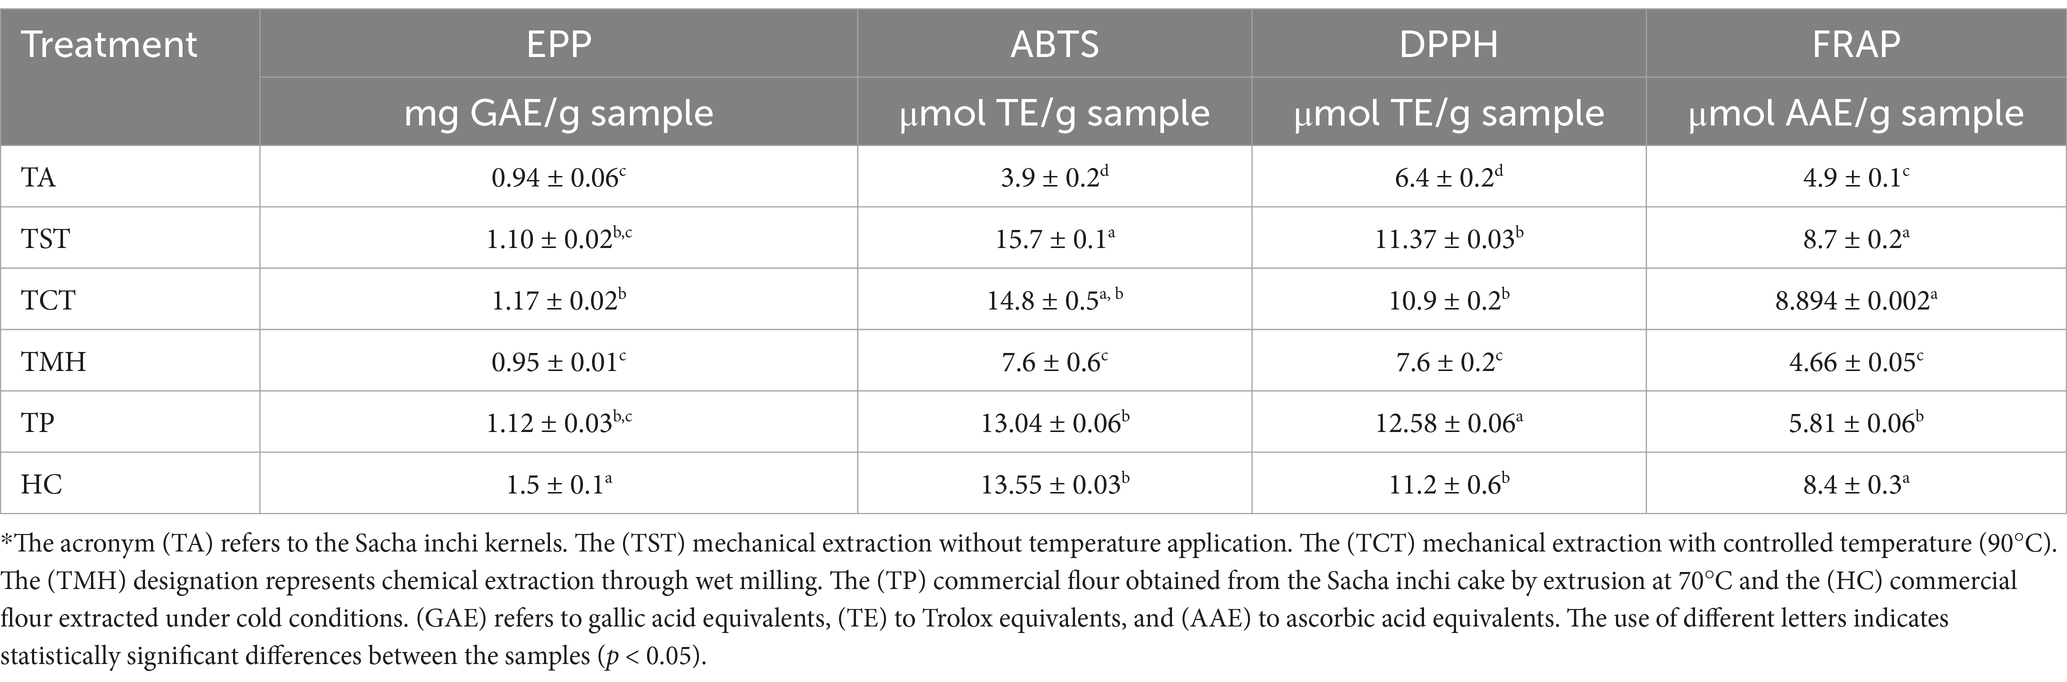
Table 1. Phenolic compounds and antioxidant capacity.
The results indicate that thermomechanical treatments (high temperature and short time) favor the structural breakdown of the seeds, which increases oil extraction and produces a cleaner cake. This makes polyphenols and other compounds, such as denatured proteins or possible glycosides, more available as antiradical agents. The opposite is true for the TA sample, which corresponds to Sacha inchi kernels, which have an excess of fats that interfere with the DPPH, ABTS and FRAP assays. On the other hand, the TMH sample undergoes a process of strong alkali and successive washes, which causes the loss of soluble compounds and the degradation of others by the action of the alkali.
With references to Chirinos et al. (2013) and Rawdkuen et al. (2016), the results of this study were superior in both EPP concentration and antiradical capacity. Although Sacha inchi offers many health benefits, its antioxidant capacity is relatively low due to the low concentration of phenolic compounds such as flavonoids and phenolic acids. However, it does contain tocophenols or vitamin E, which have a low antioxidant capacity compared to flavonoids, but help protect the polyunsaturated fatty acids in the oil (Jang et al., 2020).
4.4 Anti-nutritional factors
Anti-nutritional factors are natural non-fibrous substances produced by the secondary metabolism of plants as a defense mechanism in stressful situations or to counteract attack by molds, bacteria, insects and birds (Elizalde et al., 2009). For example, tannins are synthesized during the development of the seed and the plant with the main objective of defending it against the attack of various pests. However, antinutrients are compounds that affect the nutritional value of some foods by inhibiting the absorption of minerals and proteins, leading to reduced growth by negatively affecting the digestibility of proteins and carbohydrates (Landines Vera et al., 2024). In addition, the presence of these antinutrients, such as tannins and saponins, increases certain unpleasant tastes and limits consumer acceptance of products containing them (Li et al., 2024).
Figure 3 presents the statistical analysis of the results obtained regarding the content of tannins, phytates, and saponins. Regarding tannins, almonds exhibited a higher tannic acid level (6.086 ± 0.005 mg AT/100 g sample), followed by chemical extraction through wet milling (TMH) (5.814 ± 0.002 mg AT/100 g sample). The HC treatment exhibited the lowest level of tannic acid (3.786 ± 0.044 mg AT/100 g sample), followed by the TCT treatments (3.785 ± 0.013 mg AT/100 g sample) and TP (2.553 ± 0.024 mg AT/100 g sample). Other studies have yielded results of 6.35 mg tannins/100 g sample and 1.37 mg tannins/100 g sample after heat treatment, values that are comparable to those obtained in this study (Ruiz et al., 2013; García Chacua and Gallego Perea, 2022).
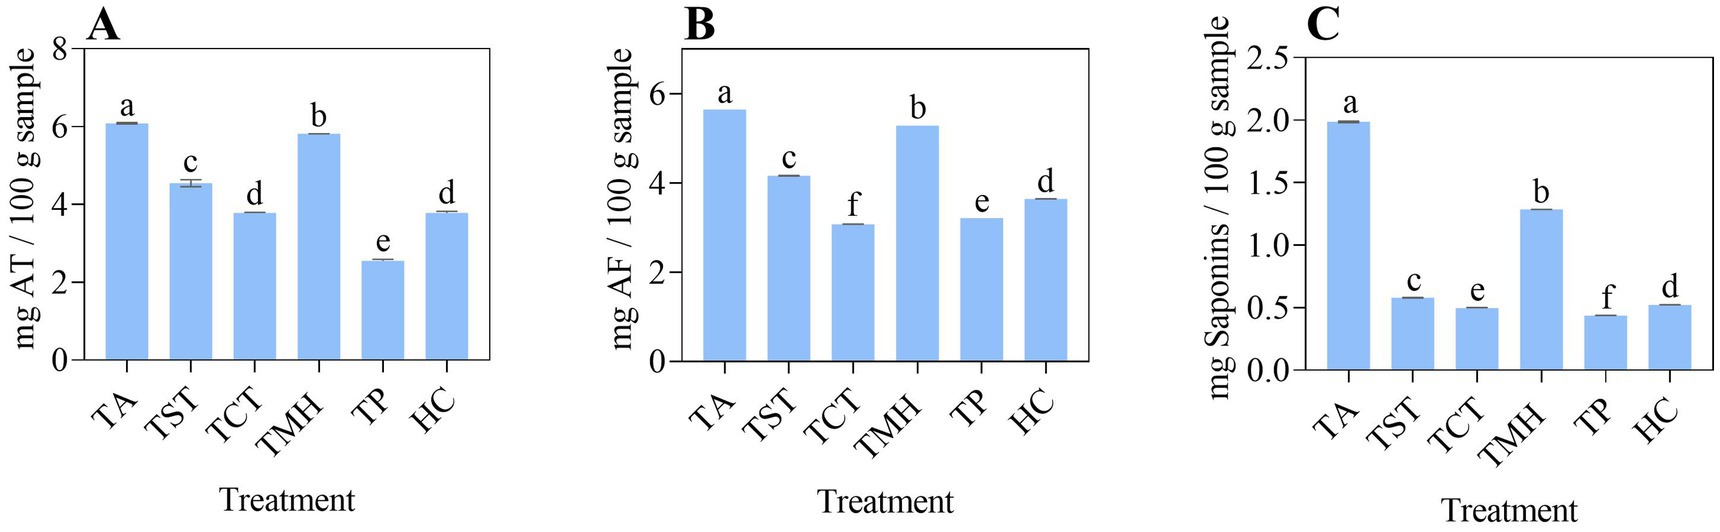
Figure 3. Anti-nutritional compounds. The graph (A) illustrates the concentration of tannic acid (AT), while graph (B) depicts the content of phytic acid (AF). Graph (C) represents the concentration of saponins. *The acronym (TA) refers to the Sacha inchi kernels. The (TST) mechanical extraction without temperature application. The (TCT) mechanical extraction with controlled temperature (90°C). The (TMH) designation represents chemical extraction through wet milling. The (TP) commercial flour obtained from the Sacha inchi cake by extrusion at 70°C and the (HC) commercial flour extracted under cold conditions. The use of different letters indicates that there are statistically significant differences between the samples (p < 0.05).
About phytates, phytic acid is regarded as an antinutrient due to its capacity to bind to minerals, proteins, and starches, thereby reducing their bioavailability (Mohan et al., 2016). The Sacha inchi kernels (TA) almonds exhibited the highest content of aflatoxins (5.643 ± 0.001 mg AF/100 g sample), followed by TMH (5.282 ± 0.001 mg AF/100 g sample) and TST (4.164 ± 0.006 mg AF/100 g sample). The industrial treatments HC (3.640 ± 0.005 mg AF/100 g sample), TP (3.214 ± 0.001 mg AF/100 g sample), and TCT heat treatment (3.073 ± 0.004 mg AF/100 g sample) were observed to achieve the greatest reduction in phytates. Other studies have indicated that thermal processing can effectively reduce phytic acid levels. For instance, a reduction of 32.6% was observed in Sacha inchi cakes, with the initial concentration of 2.64 mg/100 g reduced to 1.78 mg/100 g on a dry basis (Landines Vera et al., 2024). Similarly, a study conducted to determine the phytic acid content in quinoa yielded results indicating a concentration of 451.7 mg per 100 grams of dry weight (Saeid et al., 2024).
With respect to saponins, the highest content was observed in Sacha inchi kernels (TA) (1.986 ± 0.007 mg saponins/g sample), followed by TMH (1.286 ± 0.001 mg saponins/100 g sample) and TST 0. The results demonstrated that the highest concentration of saponins was observed in Sacha inchi TA almonds (580 ± 0.002 mg saponins/100 g sample), followed by CH (0.522 ± 0.003 mg saponins/100 g sample), TCT (0.496 ± 0.005 mg saponins/100 g sample), and TP (0.437 ± 0.002 mg saponins/100 g sample). In other studies, the reported saponin content of Sacha inchi cake was 1.06 g per 100 g (Alcívar et al., 2020), while another study reported 0.048 saponins per 100 g sample (García Chacua and Gallego Perea, 2022).
The results demonstrate that the extraction methods employed significantly impact the reduction of antinutrients (tannic acid, phytic acid, and saponins) present in Sacha inchi cake. Of the methods tested, heat and industrial treatments were found to be the most effective in reducing these antinutrients. Sacha inchi kernels (TA) has been observed to retain high levels of these compounds, which could potentially limit the bioavailability of nutrients (Li et al., 2020). Processes mechanical extraction without temperature application (TST) and mechanical extraction with controlled temperature (90°C) (TCT) have been demonstrated to moderately reduce antinutrients, thereby highlighting the impact of heat on TCT. Conversely, the commercial TP treatment has been shown to result in the most significant reductions in comparison to the other extraction methods.
4.5 Protein digestibility
Proteins are vital macromolecules composed of amino acids, including eight essential ones that must be obtained from the diet. During digestion, enzymatic hydrolysis in the stomach and small intestine breaks down proteins into peptides and amino acids, which are then absorbed and metabolized. Protein quality is commonly assessed using the Protein Digestibility-Corrected Amino Acid Score (PDCAAS), which considers both the amino acid profile and digestibility (Cincap, n.d.; Cui et al., 2023; García Luna and López Gallardo, 2007).
In this study, the TP treatment, corresponding to the cake obtained by extrusion at 70°C, showed the lowest digestibility with a PDCAAS value of 18%. Although this treatment exhibited low levels of antinutritional factors such as tannic acid and saponins, its poor digestibility could be related to the effects of extrusion on protein structure (Martínez Augustin and de Victoria, 2006). It has been demonstrated that intense thermal processes like extrusion can induce Maillard reactions, generate cross-links between amino acids, or promote protein aggregation, thus reducing solubility and accessibility to digestive enzymes (Segura-Campos et al., 2010).
The TCT treatment, extracted by pressing at 90°C, presented a digestibility of 22%. Although slightly higher than TP, this low digestibility may be explained by the combined effect of temperature and pressure on proteins, which can also cause denaturation or structural modifications that limit enzymatic access (Arhewoh et al., 2005). In this treatment, tannic acid and saponin levels were higher than in TP, which may have also negatively affected the bioavailability of essential amino acids, especially lysine (Schaafsma, 2000). In contrast, the TMH treatment, obtained through wet milling and low-temperature drying, reached a PDCAAS value of 84%. This high value can be attributed to the fact that the wet milling process did not involve high temperatures or intense mechanical pressures, thus preserving the protein structure (Schaafsma, 2012). Additionally, water dissolution during the process may have partially reduced the concentration of certain soluble antinutritional factors, improving digestibility (Schaafsma, 2000). Previous studies on in vitro digestibility of sacha inchi cake report similar values (79.6–84.2%) after mild thermal treatments, comparable to that applied in TMH (Boye et al., 2012; Adriana and Ordoñez, 2013).
4.6 Attenuated total reflectance infrared spectroscopy ATR
To analyze the effects of the treatments on the structure of functional groups associated with macromolecules such as lipids, carbohydrates, and proteins, Fourier-transform infrared (FTIR) spectra were obtained in the range of 800 to 3,700 cm−1 (Figure 4). In the region between 1715–1770 cm−1, a band was observed corresponding to the stretching of the carbonyl group (C=O), mainly esters (Ordoñez-Delgado et al., 2024; Córdoba-Cerón et al., 2023), associated with lipid compounds. The signals between 2,800 and 3,000 cm−1 correspond to the symmetric and asymmetric stretching of -CH₂ and -CH₃ groups, also related to lipids (Castillo-Guaca et al., 2023; Ordoñez-Delgado et al., 2024) These bands were more intense in the TMH treatment, suggesting greater preservation or structural rearrangement of lipid components in this sample.
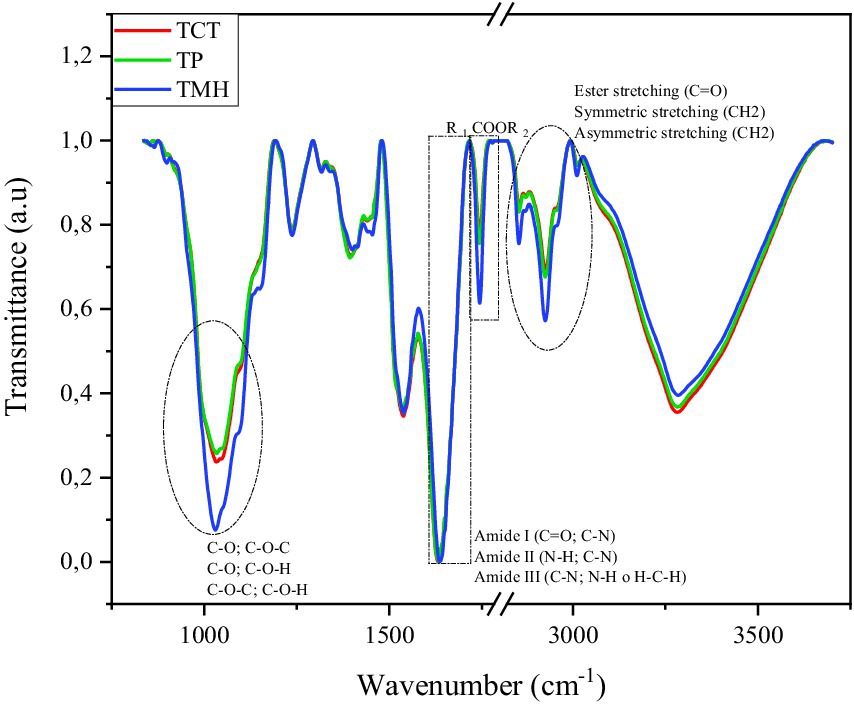
Figure 4. FT-IR spectra. *The acronym (TCT) refers to mechanical extraction with controlled temperature (90°C), (TMH) chemical extraction through wet milling and (TP) commercial flour obtained from the Sacha inchi cake by extrusion at 70°C.
On the other hand, the region between 1,200–850 cm−1, associated with C–O, C–O–C, and C–O–H bond vibrations, showed more intense peaks for the TMH treatment, indicating a higher content or a more organized structure of carbohydrates, possibly starches or dietary fibers (Narváez Cadena et al., 2023; García-Parra et al., 2021).
Regarding proteins, the characteristic bands of Amide I (1700–1,600 cm−1) and Amide II (1600–1,500 cm−1) allow for the assessment of changes in the secondary structure of proteins (Roa-Acosta et al., 2020). As shown in Figure 5 and Table 2, the TP treatment displayed the highest intensities in most of the bands associated with β-sheet structures (1,633 and 1,638 cm−1), random coil (1,649 cm−1), α-helix (1,656 cm−1), and β-turns (1,665, 1,672, and 1,680 cm−1), indicating a greater presence of both ordered and partially disordered structures.
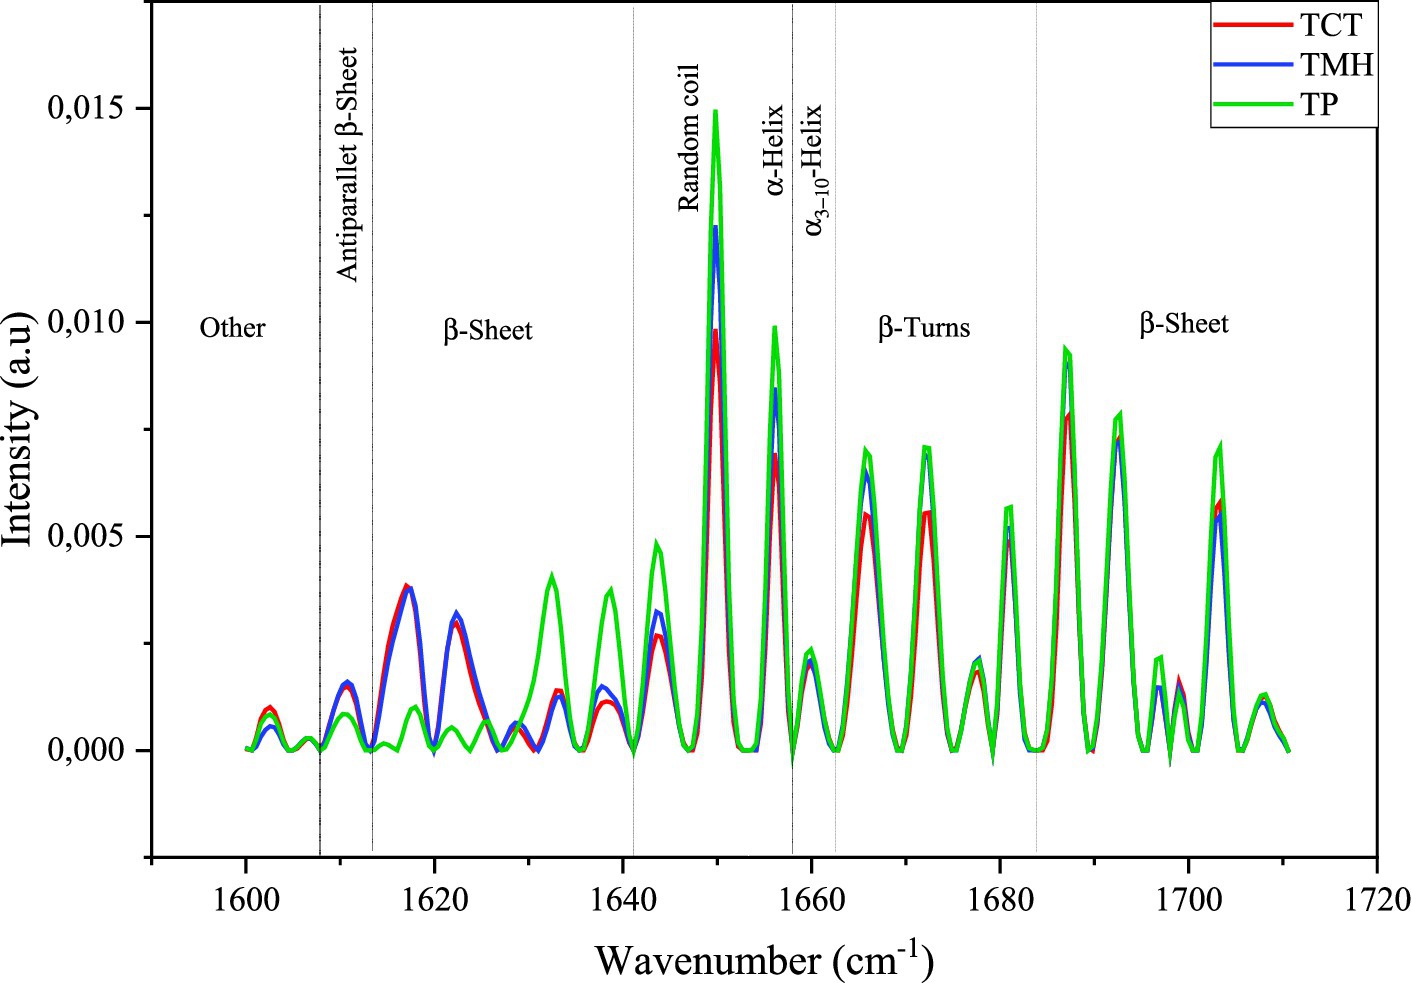
Figure 5. FT-IR spectrum of the second derivative in the protein region. *The acronym (TCT) refers to mechanical extraction with controlled temperature (90°C), (TMH) chemical extraction through wet milling and (TP) commercial flour obtained from the Sacha inchi cake by extrusion at 70°C.
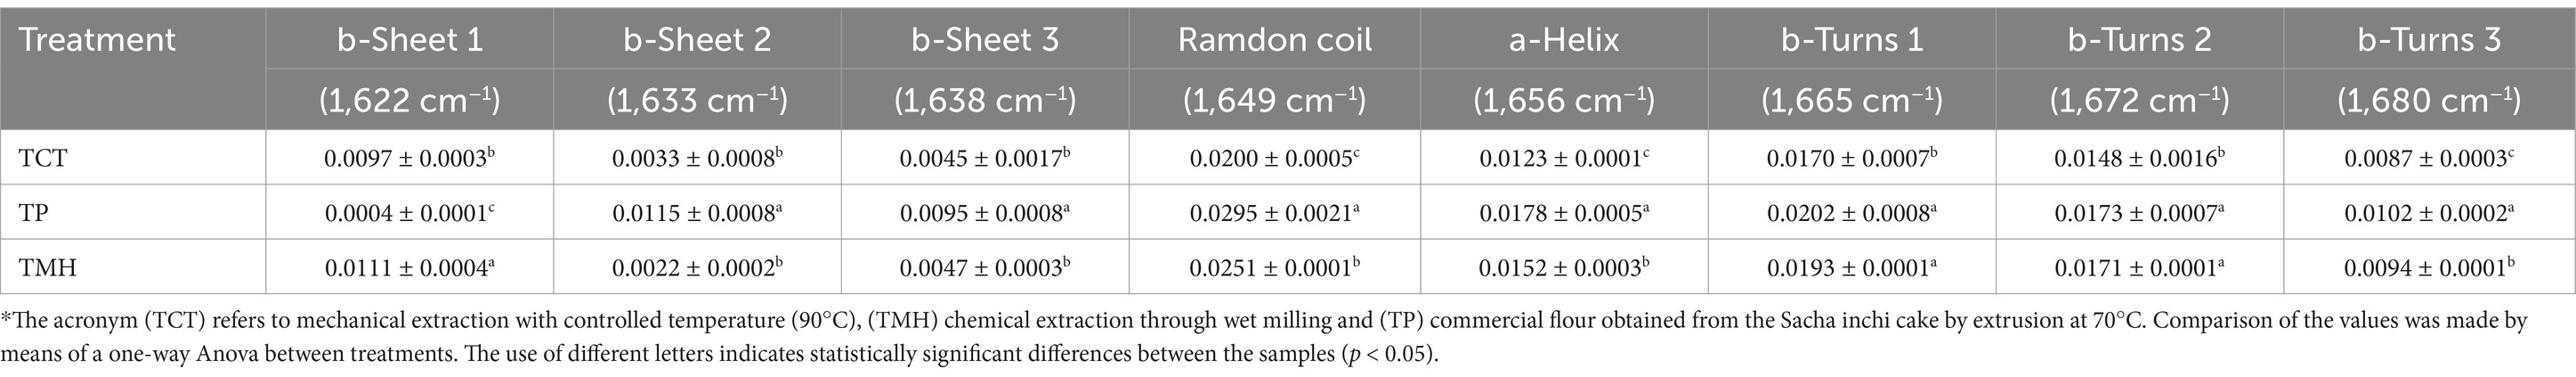
Table 2. Intensity values in the 1,600 cm−1 to 1,700 cm−1 bands of the secondary protein structures present in the Sacha inchi flours.
In contrast, the TCT treatment showed the lowest intensities in these bands, suggesting that the extraction process by pressing at 90°C may have negatively affected protein conformation, possibly due to thermal denaturation. The TMH treatment exhibited intermediate values, which is associated with the moderate effect of the wet milling process that may have better preserved the native protein structures (Polo Muñoz et al., 2025).
4.7 Z-potential and particle size
Zeta potential is a key parameter used to evaluate the colloidal stability of a suspension, as it expresses the electrostatic potential at the slipping plane surrounding a charged particle in motion (Jain et al., 2021). Absolute values equal to or greater than ± 30 mV is associated with high stability due to particle repulsion, whereas values close to 0 mV suggest a tendency toward flocculation or aggregation (Herrera, 2021; Ofir et al., 2007). The hydrodynamic particle size is also an important indicator of the degree of dispersion or aggregation in liquid media (Griffin et al., 2024). These parameters are essential for understanding the behavior of colloidal systems and optimizing their stability during storage (Pastrana-Pastrana et al., 2025).
Figure 6 shows the general behavior of zeta potential and particle size under different temperature conditions (25, 40, and 55°C) and pH levels (Cai, 2011; Wang et al., 2018; Amparo et al., 2009; Taipe Cuadra et al., 2022) for the TP, TCT, and TMH treatments. However, as no significant differences were observed due to temperature, the statistical analysis focused on the standard condition of 25°C, as summarized in Figure 7.
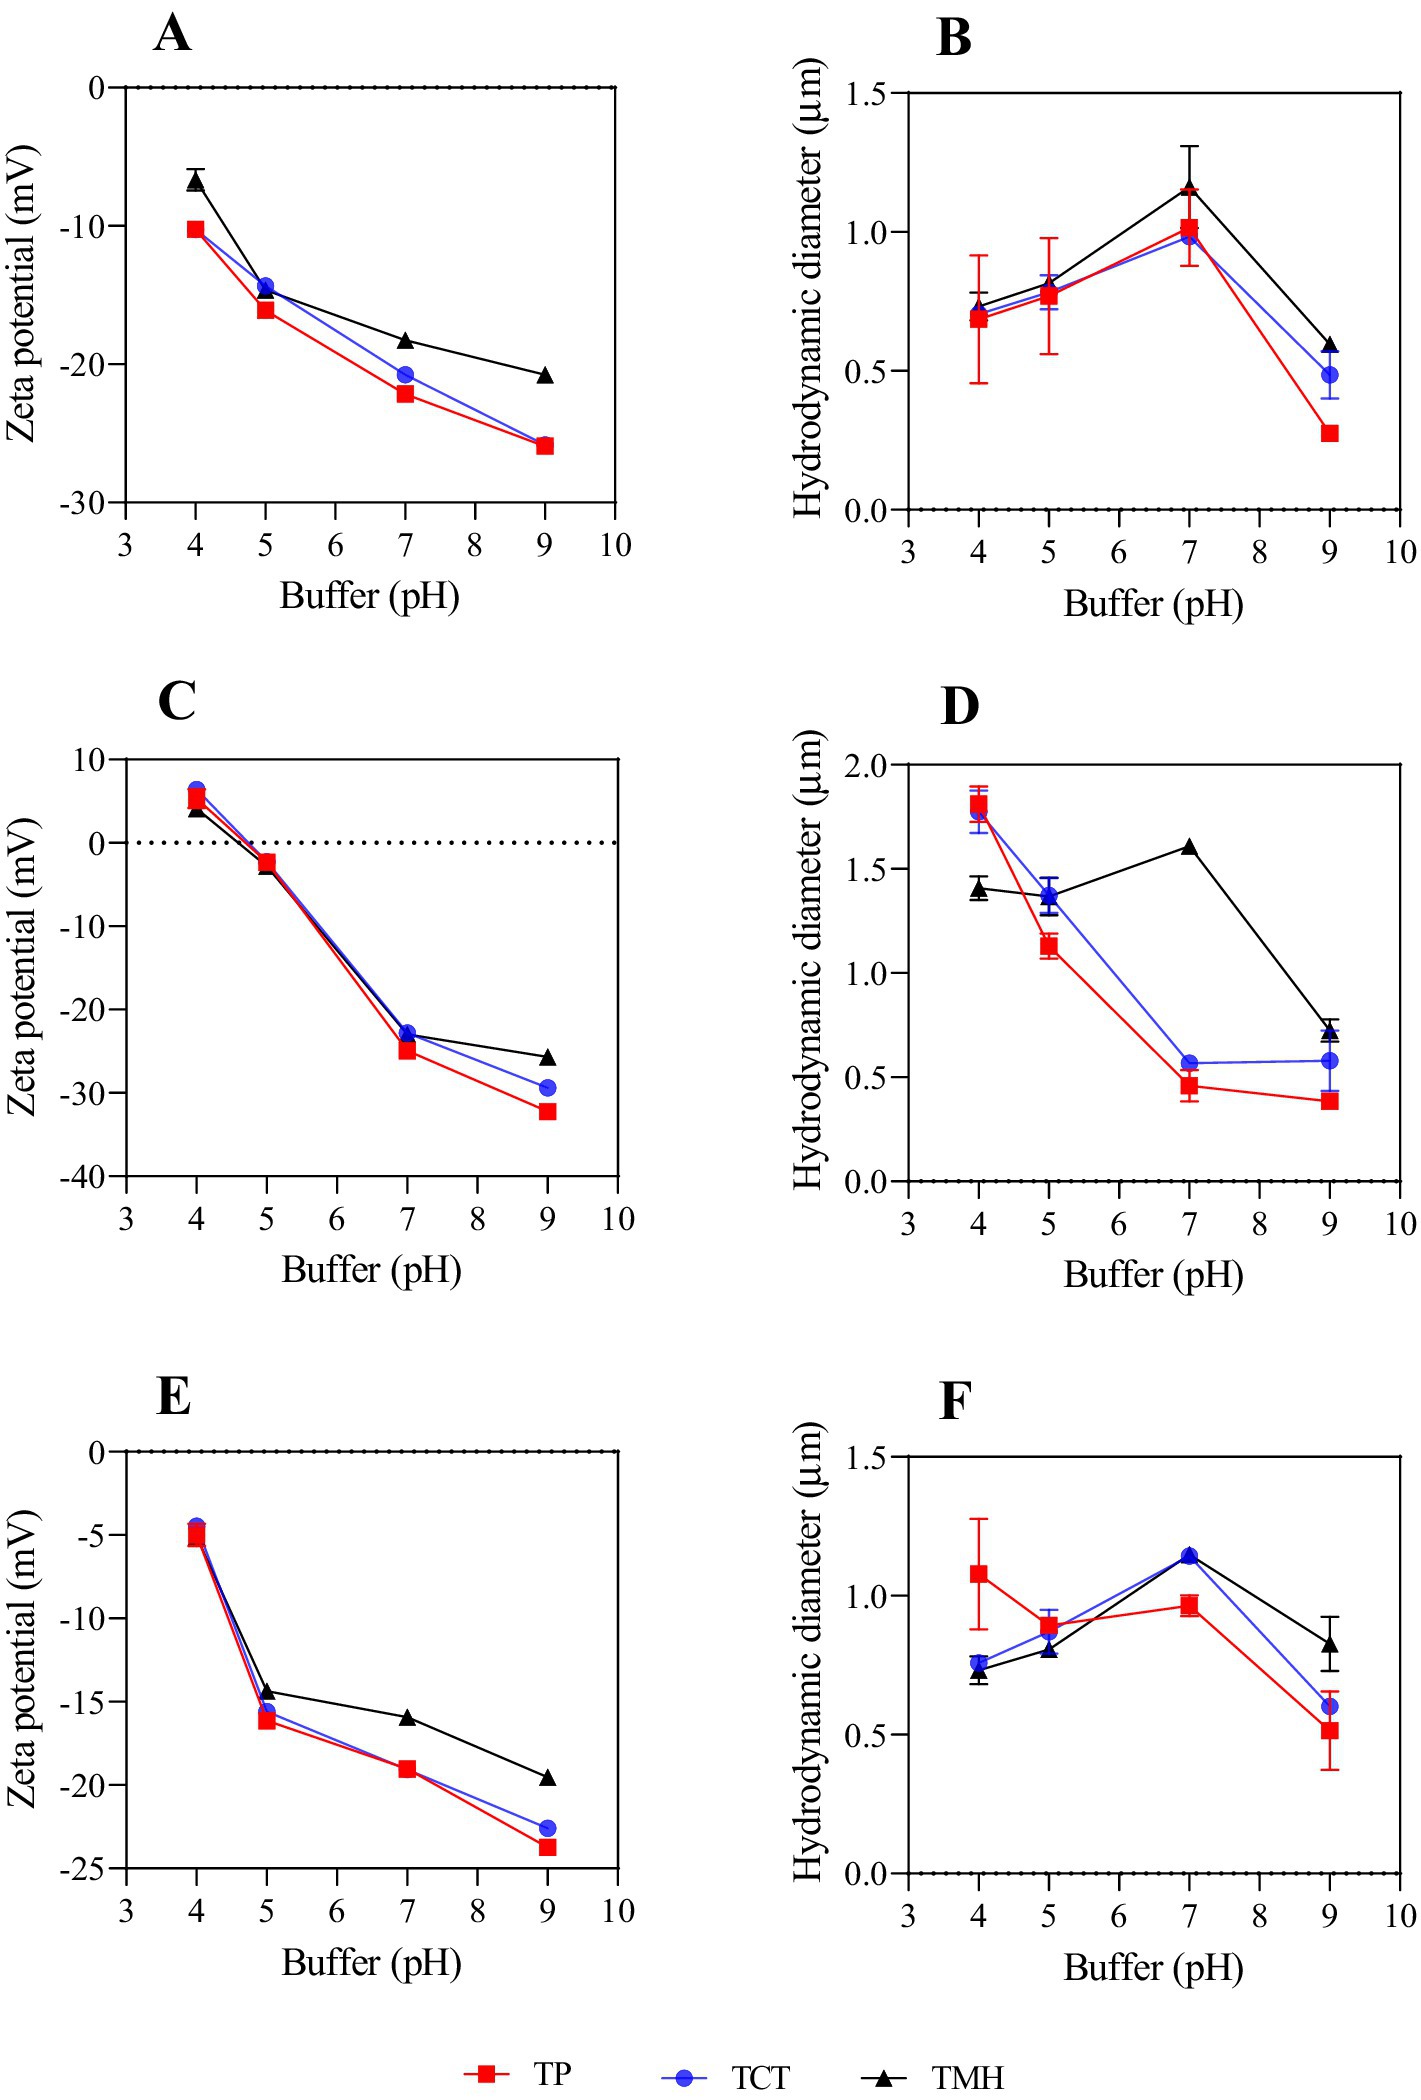
Figure 6. Potential-z and particle size at 25°C, 40°C and 55°C, in buffer solutions at pH 4,5,7 and 9. Graphs (A,B) refer to TCT treatment; graph (C,D) refer to TMH; graph (E,F) refer to TP. The comparison of values was performed by bidirectional Anova between treatments and pH. *The acronym (TCT) refers to mechanical extraction with controlled temperature (90°C), (TMH) chemical extraction through wet milling and (TP) commercial flour obtained from the Sacha inchi cake by extrusion at 70°C.
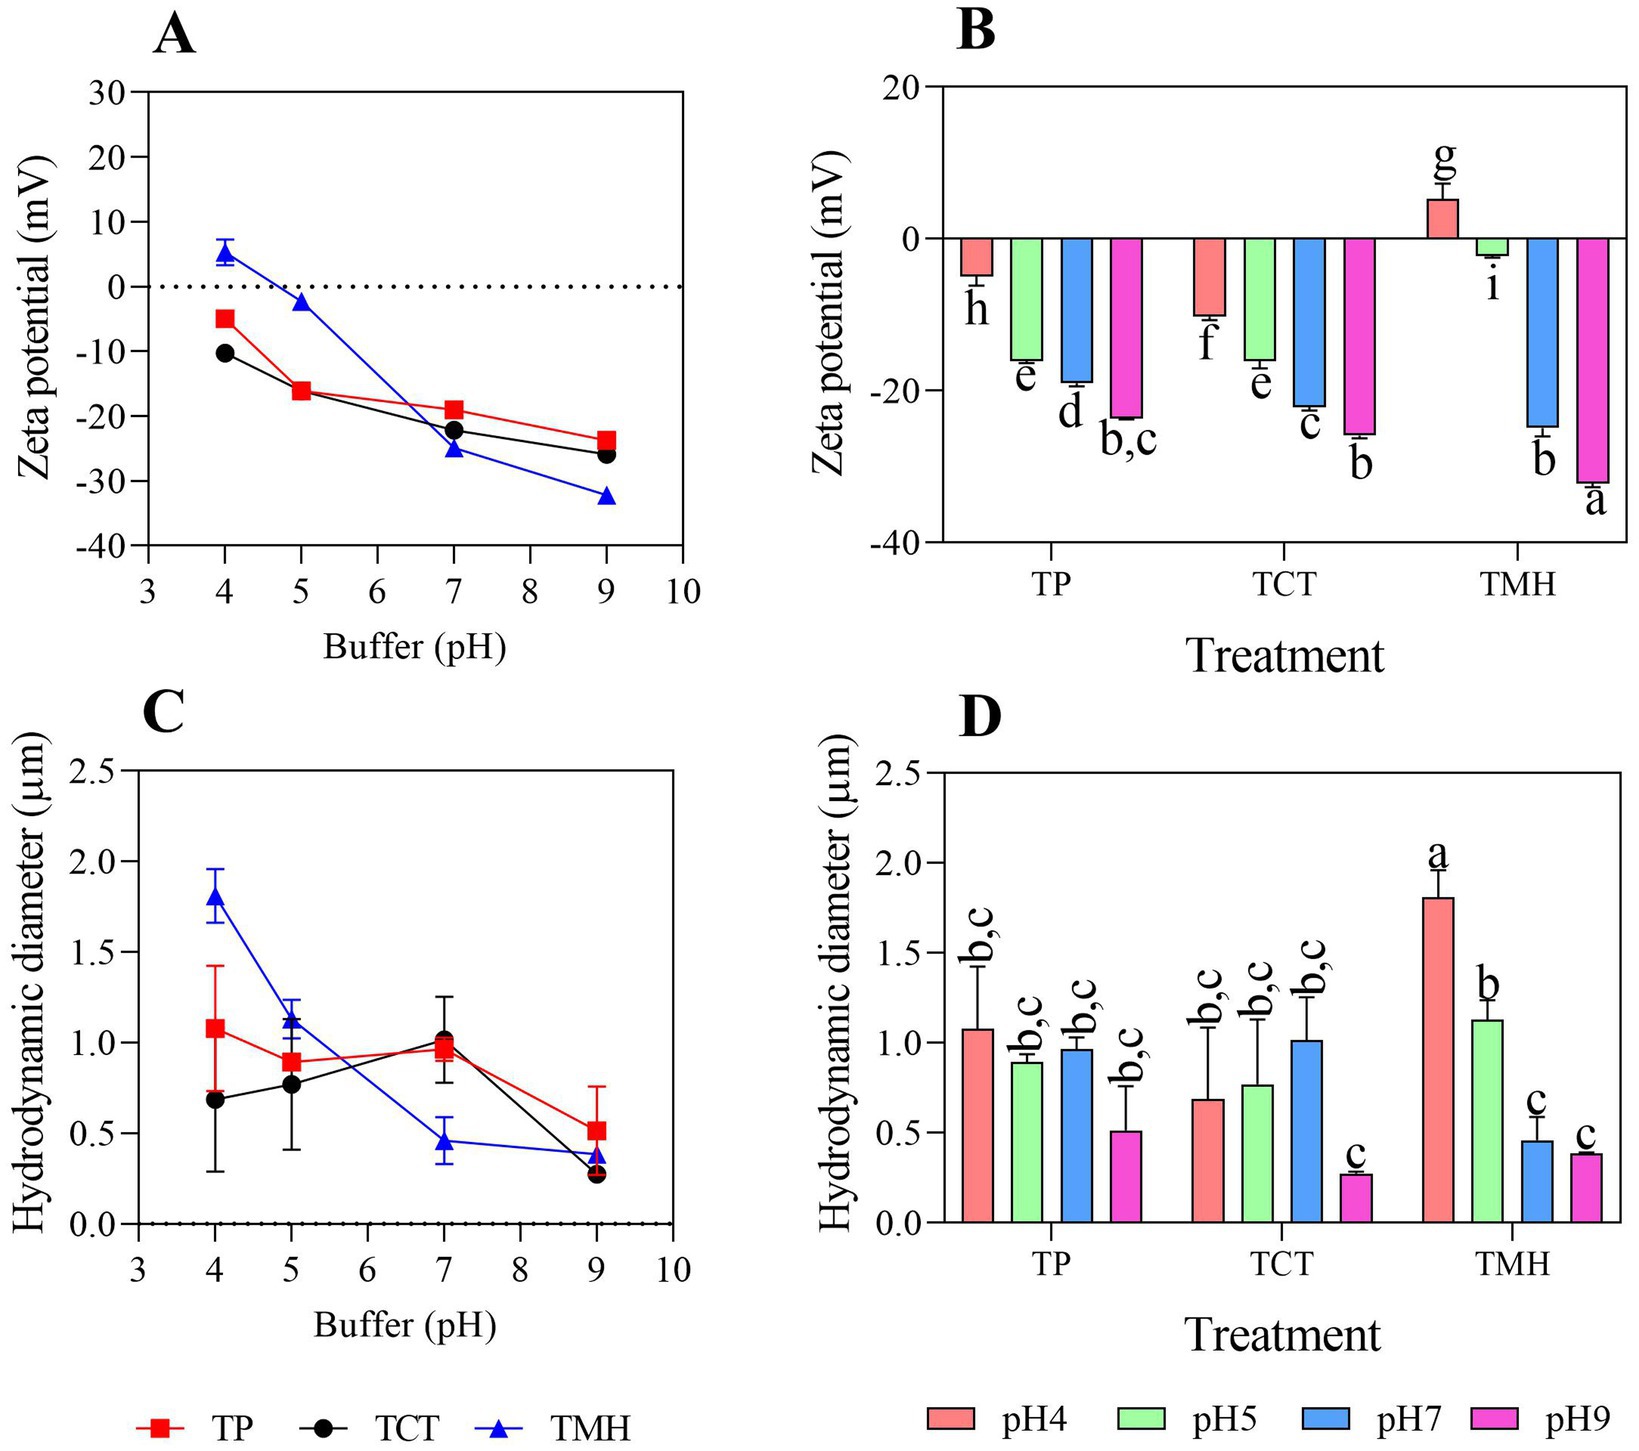
Figure 7. Statistical analysis. Graph (A) shows the determination of the Z potential at 25°C in buffer solutions with pH 4, 5, 7 and 9 for the TP, TCT and TMH treatments. Graph (B) presents the statistical analysis of the Z potential. Graph (C) corresponds to the particle size measurement at 25°C in buffer solutions with pH 4, 5, 7 and 9 for the same treatments. Finally, graph (D) shows the statistical analysis of particle size. *The acronym (TCT) refers to mechanical extraction with controlled temperature (90°C), (TMH) chemical extraction through wet milling and (TP) commercial flour obtained from the Sacha inchi cake by extrusion at 70°C. The use of different letters indicates statistically significant differences between the samples (p < 0.05).
In Figure 7A, it can be observed that zeta potential varies significantly with pH and the treatment applied. For TMH, values became more negative as the pH increased, reaching −32.2 mV at pH 9, indicating greater colloidal stability in alkaline solutions (Herrera, 2021). TCT showed a similar behavior, with values up to −25.9 mV at pH 9. In contrast, TP showed low values at pH 4 (close to −6.7 mV), indicating low stability in acidic media. The statistical analysis of zeta potential (Figure 7B) confirmed these observations: at pH 4, TP and TCT showed significant differences compared to TMH, while at pH 9, TMH was statistically more stable than the other treatments.
Regarding particle size (Figure 7C), a decreasing trend was observed as pH increased, especially in the TMH treatment. At pH 4, TMH exhibited significantly larger particle sizes, consistent with its low zeta potential under this condition. As pH increased, particle size decreased, which is related to greater colloidal stability (Ofir et al., 2007). This behavior is also reflected in Figure 7D, where statistical differences among treatments and pH levels are more evident, especially at pH 7 and 9.
These results suggest that the TMH treatment, based on wet milling and mild drying, promotes better colloidal stability in neutral and alkaline media, while TP and TCT tend to form aggregates under acidic conditions or near the isoelectric point of the proteins, possibly due to hydrophobic interactions, structural reorganization, or Van der Waals forces (Uskoković et al., 2011; Uskoković et al., 2010; Parsons et al., 2011).
4.8 Rheological properties
4.8.1 Flow profile
The flow profile (Figure 8), evaluated after the pasting process, characterizes the rheological behavior of the suspensions as a function of shear stress and shear rate. All treatments exhibited non-Newtonian behavior, which fit the power law model, with consistency (K) and flow behavior (n) parameters presented in Table 3.
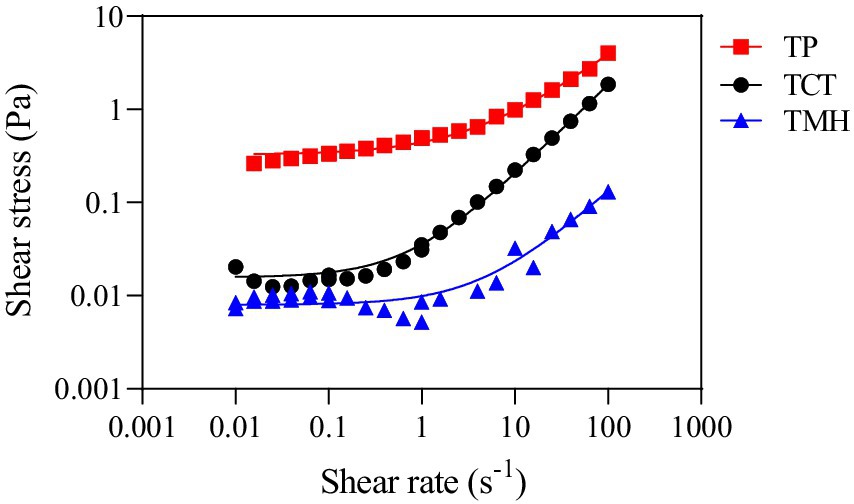
Figure 8. Flow profile behavior. *The acronym (TCT) refers to mechanical extraction with controlled temperature (90°C), (TMH) chemical extraction through wet milling and (TP) commercial flour obtained from the Sacha inchi cake by extrusion at 70°C.
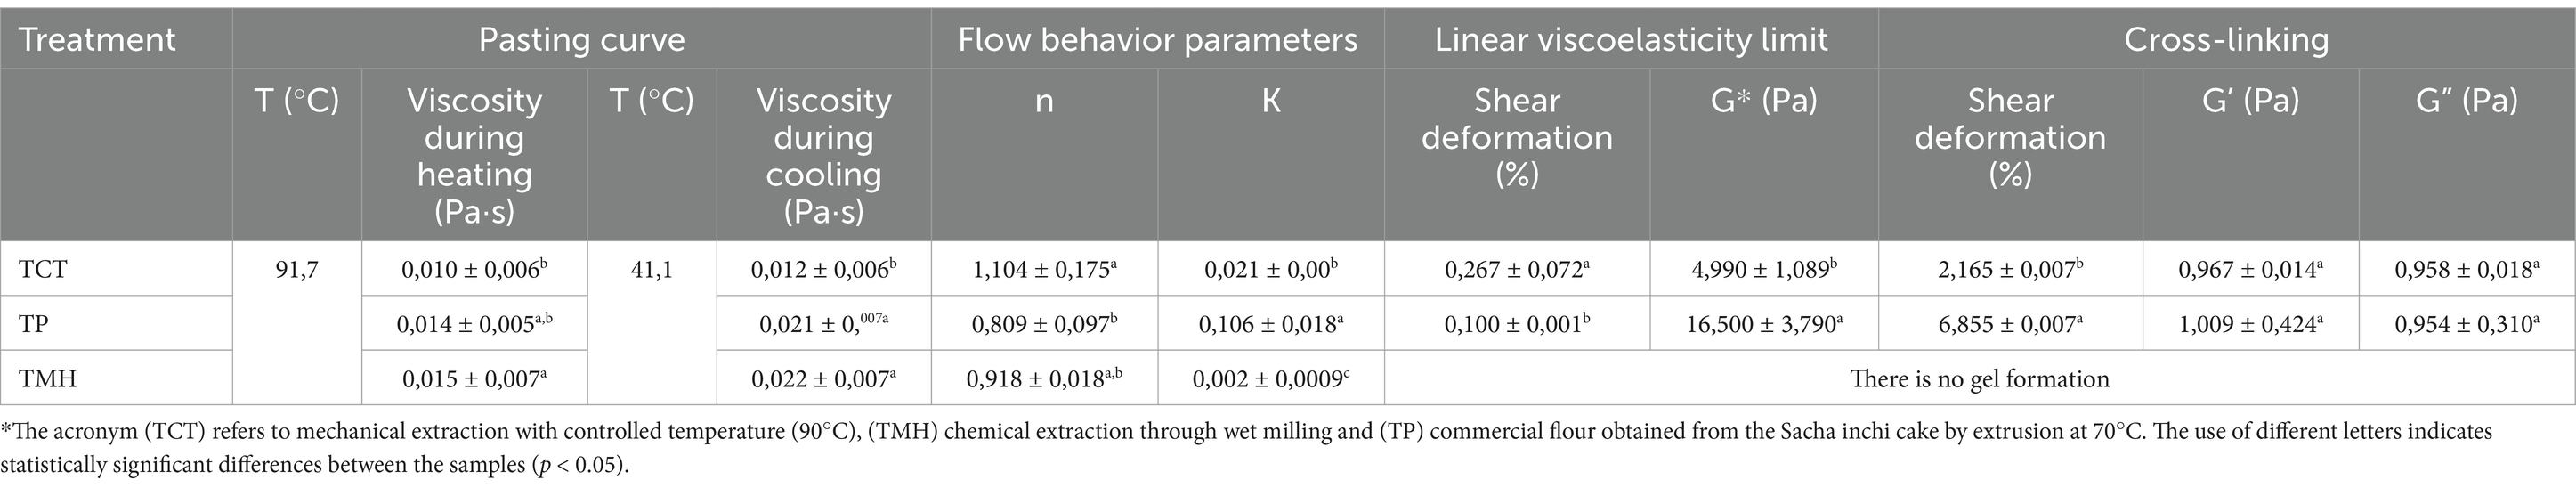
Table 3. Rheological properties of Sacha inchi flours obtained through different extraction treatments.
The TCT treatment exhibited a flow behavior index (n) greater than 1, indicating a slightly dilatant behavior that is, an increase in apparent viscosity as shear rate increases. This may be related to an internal structure that, under shear, increases friction due to interactions among partially reorganized polymers. Such behavior could result from the thermal treatment at 90°C applied during mechanical extraction, which may promote crosslinking or alignment of protein and polysaccharide components, forming a weakly expanding network under stress (Narváez Cadena et al., 2023; Polo Muñoz et al., 2025; García-Parra et al., 2022).
In contrast, TP showed a pseudoplastic behavior, characterized by a decrease in viscosity as shear rate increases. This behavior may be linked to a more compact and cohesive structure, reinforced by the extrusion conditions (temperature and pressure), which likely favor protein–protein interactions and partial gelatinization. The higher consistency observed suggests a firmer matrix, which could be advantageous for applications requiring greater viscosity or structural body, such as doughs or semi-solid products (Muñoz-Pabon et al., 2022; Polo Muñoz et al., 2025; Córdoba-Cerón et al., 2023).
TMH also exhibited pseudoplastic behavior, though with lower shear stress compared to TP, suggesting a weaker, less cohesive internal structure. This could be attributed to protein network disintegration during chemical treatment and the absence of intense thermal processing, which limits the formation of a robust structure. The low consistency observed supports this interpretation and suggests that the suspension may be more suitable for low-viscosity applications, such as beverages or liquid formulations (Narváez Cadena et al., 2023; Roa-Acosta et al., 2020).
4.8.2 Pasting test
The measurement of the pasting curve was carried out with the purpose of inducing gel formation and analyzing the behavior of each treatment during the heating and cooling stages, simulating conditions similar to baking processes. As shown in Table 3, the TCT treatment presented a low maximum viscosity during heating (0.010 ± 0.006 Pa·s) and a non-significant increase during cooling (0.012 ± 0.006 Pa·s), indicating weak and inconsistent gel formation. This behavior may be due to limited structural development, possibly associated with the extraction temperature (90°C) being insufficient to induce effective gelatinization or to establish a stable protein network (García-Parra et al., 2022; Roa-Acosta et al., 2020).
In the case of the TMH treatment, a slightly higher viscosity was observed during both heating (0.015 ± 0.007 Pa·s) and cooling (0.022 ± 0.007 Pa·s). However, a typical gel structure was not evidenced either, suggesting that the chemical treatment applied may have caused disintegration of proteins and polysaccharides, limiting the formation of a cohesive matrix (Narváez Cadena et al., 2023; Polo Muñoz et al., 2025).
For its part, the TP treatment reached a viscosity of 0.014 ± 0.005 Pa·s during heating and 0.021 ± 0.007 Pa·s during cooling, showing better development of the structural network compared to TCT and TMH. These results suggest that the extrusion conditions applied (70°C and pressure) favored protein–protein interactions and possible partial starch gelatinization, generating a more compact and flow-resistant structure. This behavior is desirable in applications where higher viscosity or body is required, such as semi-solid products or water-retentive formulations (Córdoba-Cerón et al., 2023; Roa-Acosta et al., 2020).
4.8.3 Viscoelastic properties (amplitude sweep)
Figure 9 shows the viscoelastic behavior of the evaluated flours through amplitude sweep tests, where the storage modulus (G′), loss modulus (G″), and complex modulus (G*) are plotted as a function of applied strain. The results corresponding to the TCT treatment (Figure 9A) show a progressive decrease in both G′ and G″ as the strain increases, indicating a weak structure with a low linear viscoelastic limit (5.0 Pa), as shown in Table 3. This behavior can be attributed to the effect of the thermal treatment at 90°C combined with mechanical shear, which induces modifications in protein conformation (see Figures 5, 6), limiting the formation of strong and stable structural networks (García-Parra et al., 2022; Roa-Acosta et al., 2020).
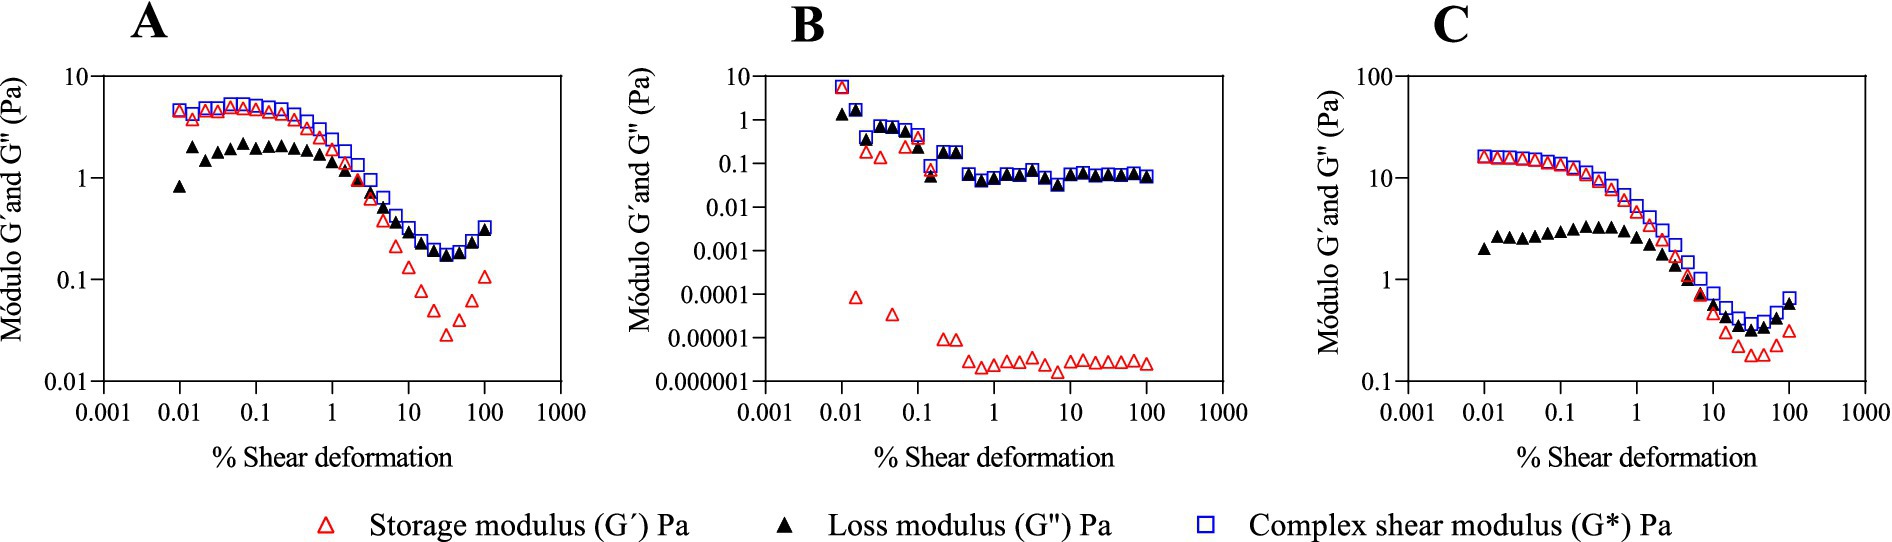
Figure 9. Amplitude swept viscoelastic behavior. Viscosity curve where graph (A) presents the results of the TCT treatment; (B) for TMH; (C) for the TP treatment. *The acronym (TCT) refers to mechanical extraction with controlled temperature (90°C), (TMH) chemical extraction through wet milling and (TP) commercial flour obtained from the Sacha inchi cake by extrusion at 70°C.
In the case of the TMH treatment (Figure 9B), no defined crossover points between G′ and G″ was observed, indicating the absence of a gelled structure and an inability to withstand increasing deformation. This is related to the disruption of protein and polysaccharide networks caused by the chemical treatment, which compromises the integrity of the matrix and its ability to crosslink (Narváez Cadena et al., 2023; Polo Muñoz et al., 2025).
On the other hand, the TP treatment (Figure 9C) showed the most solid behavior, with the highest value for the linear viscoelastic limit (16.5 Pa) and a clear dominance of G′ over G″ over a wide range of deformation, reflecting a stronger and more stable gel structure. This result is related to the extrusion conditions applied (70°C and pressure), which favor the formation of a cohesive structural network through protein–protein interactions and partial starch gelatinization. Moreover, TP exhibited the highest G′ value in the cross-linking stage (6,355 Pa), suggesting a greater capacity for elastic energy storage, which is desirable in products requiring firmness and textural stability (Córdoba-Cerón et al., 2023; Roa-Acosta et al., 2020).
5 Conclusion
The results obtained in this study demonstrate that the applied extraction methods have a significant impact on the chemical composition, functional properties, and nutritional value of Sacha inchi flours and cakes. In particular, thermo-mechanical and extrusion treatments notably improved protein concentration (up to 75.3%) and antioxidant capacity, as measured by DPPH, ABTS, and FRAP assays. However, these improvements were accompanied by a decrease in protein digestibility, likely due to structural changes induced by heat. On the other hand, the TMH treatment showed higher digestibility (84%) and more effective preservation of lipids and carbohydrates, although with a lower reduction of antinutritional factors. In contrast, thermal and industrial treatments were more effective in reducing tannins, phytates, and saponins. FTIR spectroscopic analysis revealed significant structural changes in proteins, lipids, and carbohydrates, supporting the physicochemical observations. Altogether, these findings highlight the importance of properly selecting the extraction method according to the desired functional and nutritional profile, thus favoring its application in the development of high value-added food ingredients.
Data availability statement
The raw data supporting the conclusions of this article will be made available by the authors, without undue reservation.
Author contributions
RN: Investigation, Methodology, Writing – original draft. DR: Formal analysis, Investigation, Supervision, Writing – review & editing. JB: Funding acquisition, Resources, Validation, Writing – review & editing.
Funding
The author(s) declare that financial support was received for the research and/or publication of this article. The study received funding from Segalco S.A.S. This funder had no involvement in the study design, data collection, analysis, or interpretation, nor in the writing of the manuscript or the decision to submit it for publication. Their contribution was strictly limited to providing the raw material and offering partial financial support for the article processing charges.
Conflict of interest
The authors declare that the research was conducted in the absence of any commercial or financial relationships that could be construed as a potential conflict of interest.
The handling editor declared a past collaboration with the authors DA and JG.
Generative AI statement
The author(s) declare that Gen AI was used in the creation of this manuscript. AI was used to improve the writing of the text.
Publisher’s note
All claims expressed in this article are solely those of the authors and do not necessarily represent those of their affiliated organizations, or those of the publisher, the editors and the reviewers. Any product that may be evaluated in this article, or claim that may be made by its manufacturer, is not guaranteed or endorsed by the publisher.
References
Adriana, Z., and Ordoñez, H. Análisis composicional de la torta y aceite de semillas de Sacha inchi (plukenetia volubilis) cultivada en Colombia. (2013). Available online at: https://repositorio.unal.edu.co/handle/unal/21717
Alcívar, J. L., Martínez Pérez, M., Lezcano, P., Scull, I., and Valverde, A. Technical note on physical-chemical composition of Sacha inchi (Plukenetia volubilis) cake. Cuban J. Agric. Sci. (2020); 54: 19–23. Available online at: http://scielo.sld.cu/scielo.php?script=sci_arttext&pid=S2079-34802020000100019&lng=es&nrm=iso&tlng=en
Amparo, L., Marchena, U., Alejandra, G., Parra, M., Adelaida, M., Quiroz, C., et al. Efecto de los compuestos bioactivos de algunos alimentos en la salud. Perspectivas en Nutrición Humana. (2009); 11: 27–38. Available online at: http://www.scielo.org.co/scielo.php?script=sci_arttext&pid=S0124-41082009000100003&lng=en&nrm=iso&tlng=es
Arhewoh, I. M., Ahonkhai, E. I., and Okhamafe, A. O. (2005). Optimising oral systems for the delivery of therapeutic proteins and peptides. Afr. J. Biotechnol. 4, 1591–1597. doi: 10.4314/ajfand.v4i13.71761
Arjmand, S., Mollakhalili-Meybodi, N., Akrami Mohajeri, F., Madadizadeh, F., and Khalili, S. E. (2023). Quinoa dough fermentation by Saccharomyces cerevisiae and lactic acid bacteria: changes in saponin, phytic acid content, and antioxidant capacity. Food Sci. Nutr. 11, 7594–7604. doi: 10.1002/fsn3.3679
Aseervatham, S. B., Sasikumar, J., and Kumar, D. (2012). Studies on in vitro free radical scavenging activity of bixa orellana l. bark extract. Int. J. Pharm. Pharm. Sci. 4, 719–726.
Aslam, A., and Schroën, K. (2023). Lipid oxidation in food emulsions: a review dedicated to the role of the interfacial area. Curr. Opin. Food Sci. 51:101009. doi: 10.1016/j.cofs.2023.101009
Boye, J., Wijesinha-Bettoni, R., and Burlingame, B. (2012). Protein quality evaluation twenty years after the introduction of the protein digestibility corrected amino acid score method. Br. J. Nutr. 108, S183–S211. doi: 10.1017/S0007114512002309
Cai, Z. Q. (2011). Shade delayed flowering and decreased photosynthesis, growth and yield of Sacha Inchi (Plukenetia volubilis) plants. Ind. Crop. Prod. 34, 1235–1237. doi: 10.1016/j.indcrop.2011.03.021
Castillo-Guaca, S. M., Muñoz-Pabon, K. S., Bravo-Gómez, J. E., Roa-Acosta, D. F., and Vergara Escobar, J. F. Identification of macronutrients by FT-IR analysis and physicochemical characterization of snacks elaborated from quinoa (Chenopodium quinoa Willd) and sacha inchi (Plukenetia volubilis). F1000Research (2023); 12:1004. Available online at: https://f1000research.com/articles/12-1004
Chan, Y. J., Chiu, C. S., Li, P. H., and Lu, W. C. (2024). Evaluation of different roasting condition on yield, physico-chemical characteristics, and antioxidant activity of cold-pressed sacha inchi (Plukenetia volubilis) oil. LWT 203:116343. doi: 10.1016/j.lwt.2024.116343
Chirinos, R., Zuloeta, G., Pedreschi, R., Mignolet, E., Larondelle, Y., and Campos, D. (2013). Sacha inchi (Plukenetia volubilis): a seed source of polyunsaturated fatty acids, tocopherols, phytosterols, phenolic compounds and antioxidant capacity. Food Chem. 141, 1732–1739. doi: 10.1016/j.foodchem.2013.04.078
Cincap. Importancia de las proteínas; Available online at: http://www.cincap.com.ar/
Cordero-Clavijo, L. M., Mejía-Valdez, D., Antunes-Ricardo, M., Lazo-Vélez, M. A., and Guajardo-Flores, D. (2025). Evaluating sacha inchi (Plukenetia volubilis) oil stability and physicochemical properties: a comparison between conventional extraction and supercritical fluids. Food Chem. 463:141132. doi: 10.1016/j.foodchem.2024.141132
Córdoba-Cerón, D. M., Bravo-Gómez, J. E., Agudelo-Laverde, L. M., Roa-Acosta, D. F., and Nieto-Calvache, J. E. (2023). Techno-functional properties of gluten-free pasta from hyperprotein quinoa flour. Heliyon 9, e18539–e18440. doi: 10.1016/j.heliyon.2023.e18539
Cornelio-Santiago, H. P., Bodini, R. B., and de Oliveira, A. L. (2021). Potential of oilseeds native to Amazon and Brazilian Cerrado biomes: benefits, chemical and functional properties, and extraction methods. J. Am. Oil Chem. Soc. 98, 3–20. doi: 10.1002/aocs.12452
Cui, H., Li, S., Roy, D., Guo, Q., and Ye, A. (2023). Modifying quinoa protein for enhanced functional properties and digestibility: a review. Curr Res Food Sci. 7:100604. doi: 10.1016/j.crfs.2023.100604
Díaz Céspedes, M., Rojas Paredes, M. A., Hernández Guevara, J. E., Linares Rivera, J. L., Durand Chávez, L. M., Moscoso Muñoz, J. E., et al. (2021). Digestibilidad, energía digestible y metabolizable del sacha inchi (Plukenetia volubilis L) peletizado y extruido en cuyes (Cavia porcellus). Revista de Investigaciones Veterinarias del Perú 32:e19654. doi: 10.15381/rivep.v32i5.19654
Elizalde, A. D. D, Pismag Portilla, Y., and Chaparro, D. C. Factores antinutricionales en semillas. Biotecnología en el Sector Agropecuario y Agroindustrial (2009); 7: 45–54. Available online at: http://www.scielo.org.co/scielo.php?script=sci_arttext&pid=S1692-35612009000100007&lng=en&nrm=iso&tlng=es
García Chacua, L. J., and Gallego Perea, M. C. Análisis del uso integral del Sacha inchi (Plukenetia volubilis) en la industria de alimentos. Universidad del Valle; (2022). Available online at: https://hdl.handle.net/10893/24335
García Luna, P. P., and López Gallardo, G. Evaluación de la absorción y metabolismo intestinal. (2007). Available online at: https://scielo.isciii.es/scielo.php?script=sci_arttext&pid=S0212-16112007000500002
García-Parra, M., Polo-Muñoz, M. P., Nieto Calvache, J. E., Agudelo-Laverde, L. M., and Roa-Acosta, D. F. (2022). Physicochemical, rheological and structural properties of flours from six quinoa cultivars grown in Colombia. Front. Sustain. Food Syst. 6:936962. doi: 10.3389/fsufs.2022.936962
García-Parra, M., Roa-Acosta, D., García-Londoño, V., Moreno-Medina, B., and Bravo-Gomez, J. Structural characterization and antioxidant capacity of quinoa cultivars using techniques of FT-MIR and UHPLC/ESI-Orbitrap MS spectroscopy. Plan. Theory (2021); 10:2159. Available online at: https://www.mdpi.com/2223-7747/10/10/2159/htm
Griffin, V. P., Pace, S., Ogunyankin, M. O., Holstein, M., Hung, J., and Dhar, P. (2024). Understanding the impact of combined hydrodynamic shear and interfacial dilatational stress, on Interface-mediated particle formation for monoclonal antibody formulations. J. Pharm. Sci. 113, 2081–2092. doi: 10.1016/j.xphs.2024.04.009
Gutiérrez, L. F., Rosada, L. M., and Jiméneza, Á. (2011). Chemical composition of sacha inchi (plukenetia volubilis l.) seeds and characteristics of their lipid fraction. Grasas Aceites 62, 76–83. doi: 10.3989/gya044510
Herrera, R. D. (2021). Caracterización de suspensiones de nanopartículas de oro en presencia del copolímero poli (N-isopropilacrilamida)-co-poli (3-acrilamidopropil trimetilamonio): Influencia de la fuerza iónica y la temperatura. ACI Avances en Ciencias e Ingenierías 13:18. doi: 10.18272/aci.v13i2.2338
Huang, D., Boxin, O. U., and Prior, R. L. (2005). The chemistry behind antioxidant capacity assays. J. Agric. Food Chem. 53, 1841–1856. doi: 10.1021/jf030723c
Jain, K., Mehandzhiyski, A. Y., Zozoulenko, I., and Wågberg, L. (2021). PEDOT: PSS nano-particles in aqueous media: a comparative experimental and molecular dynamics study of particle size, morphology and z-potential. J. Colloid Interface Sci. 584, 57–66. doi: 10.1016/j.jcis.2020.09.070
Jang, M., You, S. H., and Kim, G. H. (2020). Evaluation of antibacterial and antioxidant activities of Sacha inchi (Plukenetia volubilis L.) leaf from Myanmar. Korean J. Food Preserv. 27, 781–790. doi: 10.11002/kjfp.2020.27.6.781
Landines Vera, E., Villacrés, E., Coello Ojeda, K., Guadalupe Moyano, V., Quezada Tobar, M., Quelal, M. B., et al. (2024). Evaluation of antinutrients, nutritional, and functional properties in sacha inchi (Plukenetia volubilis L) cake treated with hydrothermal processes. Heliyon 10:e37291. doi: 10.1016/j.heliyon.2024.e37291
Li, R., Dai, T., Zhou, W., Fu, G., Wan, Y., McClements, D. J., et al. (2020). Impact of pH, ferrous ions, and tannic acid on lipid oxidation in plant-based emulsions containing saponin-coated flaxseed oil droplets. Food Res. Int. 136:109618. doi: 10.1016/j.foodres.2020.109618
Li, X., Manickavasagan, A., and Lim, L. T. (2024). Reduction of antinutrients and off-flavour in kidney bean flour by acidic and alkaline reactive extrusion. Food Res. Int. 192:114832. doi: 10.1016/j.foodres.2024.114832
Martínez Augustin, O., and de Victoria, E. M. Proteínas y péptidos en nutrición enteral. (2006). Available online at: https://scielo.isciii.es/scielo.php?script=sci_arttext&pid=S0212-16112006000500002
Megazyme. Protein Digestibility Assay Kit-ASAP-Quality Score Method. Available online at: https://www.megazyme.com/protein-digestibility-assay-kit
Mercado-Mercado, G., Carrillo, L. R., Wall-Medrano, A., Díaz, J. A. L., and Álvarez-Parrilla, E. (2013). Compuestos polifenólicos y capacidad antioxidante de especias típicas consumidas en México. Nutr. Hosp. 28, 36–46. doi: 10.3305/nh.2013.28.1.6298
Mohan, V. R., Tresina, P. S., and Daffodil, E. D. (2016). “Antinutritional factors in legume seeds: characteristics and determination” in Encyclopedia of food and health. (eds).B. Caballero, P. M. Finglas, and F. Toldrá (Amsterdam: Elsevier), 211–220. doi: 10.1016/B978-0-12-384947-2.00036-2
Muñoz Pabon, K. S., Roa Acosta, D. F., and Bravo, J. E. (2024). Second-generation snacks prepared from quinoa with probiotic. Physicochemical properties, in vitro digestibility, antioxidant activity and consumer acceptability. Heliyon 10:e36525. doi: 10.1016/j.heliyon.2024.e36525
Muñoz-Pabon, K. S., Roa-Acosta, D. F., Hoyos-Concha, J. L., Bravo-Gómez, J. E., and Ortiz-Gómez, V. Quinoa snack production at an industrial level: effect of extrusion and baking on digestibility, bioactive, rheological, and physical properties. Food Secur. (2022); 11:3383. Available online at: https://www.mdpi.com/2304-8158/11/21/3383/htm
Narváez Cadena, R. A., Salas Zambrano, A. P., Bravo Gómez, J. E., Muñoz Pabon, K. S., and Roa-Acosta, D. F. (2023). Characterization of sacha inchi (Plukenetia volubilis) and taro (Colocasia esculenta) flours with potential application in the preparation of both gluten-free and high protein foods. F1000Res 12:378. doi: 10.12688/f1000research.130394.2
Ofir, E., Oren, Y., and Adin, A. (2007). Electroflocculation: the effect of zeta-potential on particle size. Desalination 204, 33–38. doi: 10.1016/j.desal.2006.03.533
Ordoñez-Delgado, G. E., Roa-Acosta, D. F., and Nieto-Calvache, J. E. (2024). Cacay seed cake flour and papaya dietary fiber concentrates as nutritional supplement and quality improvers for gluten-free breads. NFS J. 36:100188. doi: 10.1016/j.nfs.2024.100188
Palacios, C. E., Nagai, A., Torres, P., Rodrigues, J. A., and Salatino, A. (2021). Contents of tannins of cultivars of sorghum cultivated in Brazil, as determined by four quantification methods. Food Chem. 337:127970. doi: 10.1016/j.foodchem.2020.127970
Palomino, G. L. R., García, P. C. M., Gil, G. J. H., Rojano, B. A., and Durango, R. D. L. Determinación del contenido de fenoles y evaluación de la actividad antioxidante de propóleos recolectados en el departamento de antioquia (colombia). Vitae (2009); 16: 388–395. Available online at: http://www.scielo.org.co/scielo.php?script=sci_arttext&pid=S0121-40042009000300013&lng=en&nrm=iso&tlng=es
Pandey, K. B., and Rizvi, S. I. (2009). Plant polyphenols as dietary antioxidants in human health and disease. Oxidative Med. Cell. Longev. 2, 270–278. doi: 10.4161/oxim.2.5.9498
Parsons, D. F., Boström, M., Lo, N. P., and Ninham, B. W. (2011). Hofmeister effects: interplay of hydration, nonelectrostatic potentials, and ion size. Phys. Chem. Chem. Phys. 13, 12352–12367. doi: 10.1039/c1cp20538b
Pastrana-Pastrana, Á. J., Flores-Gallegos, A. C., Roa-Acosta, D. F., Rodríguez-Herrera, R., and Solanilla-Duque, J. F. (2025). Rheological behavior of quinoa, lentil, and rice flour mixtures under different pH conditions. Food Hydrocoll. 158:110457. doi: 10.1016/j.foodhyd.2024.110457
Polo Muñoz, M. P., Pismag Portilla, R. Y., Bravo Gomez, J. E., Solanilla Duque, J. F., and Roa Acosta, D. F. (2025). Instant quinoa powder: effect of enzymatic hydrolysis and extrusion on its physicochemical and rheological properties. NFS J. 38:100220. doi: 10.1016/j.nfs.2025.100220
Rawdkuen, S., Murdayanti, D., Ketnawa, S., and Phongthai, S. (2016). Chemical properties and nutritional factors of pressed-cake from tea and sacha inchi seeds. Food Biosci. 15, 64–71. doi: 10.1016/j.fbio.2016.05.004
Roa-Acosta, D. F., Bravo-Gómez, J. E., García-Parra, M. A., Rodríguez-Herrera, R., and Solanilla-Duque, J. F. (2020). Hyper-protein quinoa flour (Chenopodium Quinoa wild): monitoring and study of structural and rheological properties. LWT 121:108952. doi: 10.1016/j.lwt.2019.108952
Ruiz, C., Díaz, C., Anaya, J., and Rojas, R. Análisis proximal, antinutrientes, perfil de ácidos grasos y de aminoácidos de semillas y tortas de 2 especies de Sacha inchi (Plukenetia volubilis y Plukenetia huayllabambana). Revista de la Sociedad Química del Perú (2013); 79: 29–36. Available online at: http://www.scielo.org.pe/scielo.php?script=sci_arttext&pid=S1810-634X2013000100005&lng=es&nrm=iso&tlng=es
Saeid, S., Mollakhalili-meybodi, N., Akrami Mohajeri, F., Madadizadeh, F., and Khalili, S. E. (2024). The effect of gamma irradiation treatment on quinoa flour: quantification of saponin, phytic acid, antioxidant activity, and oxidative properties. Radiat. Phys. Chem. 216:111429. doi: 10.1016/j.radphyschem.2023.111429
Sahin, S. Evaluation of stability against oxidation in edible fats and oils. J. Food Sci. Nutr. Res. ; 2: 283–297. Available online at: http://www.fotunejournals.com/evaluation-of-stability-against-oxidation-in-edible-fats-and-oils.html
Scalbert, A., Johnson, I. T., and Saltmarsh, M. (2005). Polyphenols: antioxidants and beyond. Am. J. Clin. Nutr. 81, 215S–217S. doi: 10.1093/ajcn/81.1.215S
Schaafsma, G. (2000). The protein digestibility–corrected amino acid score. J. Nutr. 130, 1865S–1867S. doi: 10.1093/jn/130.7.1865S
Schaafsma, G. (2012). Advantages and limitations of the protein digestibility-corrected amino acid score (PDCAAS) as a method for evaluating protein quality in human diets. Br. J. Nutr. 108, S333–S336. doi: 10.1017/S0007114512002541
Segura-Campos, M., Chel-Guerrero, L., and Betancur-Ancona, D. (2010). Efecto de la digestión en la biodisponibilidad de péptidos con actividad biológica. Revista chilena de nutrición. 37, 386–391. doi: 10.4067/S0717-75182010000300014
Taipe Cuadra, R., Fernández Curi, M., Villanueva Espinoza, M. E., Gómez Bravo, C., Taipe Cuadra, R., Fernández Curi, M., et al. (2022). Composición nutricional y digestibilidad de semilla, torta y cáscara de dos especies de sacha inchi (Plukenetia volubilis y Plukenetia huayllabambana). Ciencia y Tecnología Agropecuaria. 23:2355. doi: 10.21930/rcta.vol23_num2_art:2355
Ulchur Pillimue, J. S. (2022). Evaluación de la actividad antifúngica de saponinas extraídas de subproductos del escarificado de quinoa (Chenopodium quinoa Willd), como alternativa para el control de Botrytis cinerea (Pers.). Popayán, Colombia: Universidad del Cauca.
Uskoković, V., Castiglione, Z., Cubas, P., Zhu, L., Li, W., and Habelitz, S. (2010). Zeta-potential and particle size analysis of human amelogenins. J. Dent. Res. 89, 149–153. doi: 10.1177/0022034509354455
Uskoković, V., Odsinada, R., Djordjevic, S., and Habelitz, S. (2011). Dynamic light scattering and zeta potential of colloidal mixtures of amelogenin and hydroxyapatite in calcium and phosphate rich ionic milieus. Arch. Oral Biol. 56, 521–532. doi: 10.1016/j.archoralbio.2010.11.011
Valles Ramírez, S., Medina-Vivanco, M., and Obregón-Lujerio, A. Obtención de una bebida nutritiva a partir de las semillas de sacha inchic (Plukenetia volubilis L.) obtaining a nutritious beverage from the seeds of inca peanut (Plukenetia volubilis L.).
Wang, S., Zhu, F., and Kakuda, Y. (2018). Sacha inchi (Plukenetia volubilis L.): nutritional composition, biological activity, and uses. Food Chem. 265, 316–328. doi: 10.1016/j.foodchem.2018.05.055
Zambrano, J. C. H., Barreto-Cruz, O. T., Castañeda-Serrano, R. D., Gallego, A. M., Zambrano, J. C. H., Barreto-Cruz, O. T., et al. (2020). Digestibilidad y degradabilidad in vitro de dietas con torta de sacha inchi en rumiantes. Revista de Investigaciones Veterinarias del Perú 31:e17637. doi: 10.15381/rivep.v31i4.17637
Keywords: protein, secondary structure, antioxidants, anti-nutrients, rheology
Citation: Narváez Cadena RA, Roa Acosta DF and Bravo Gómez JE (2025) Effects of thermo-mechanical and chemical processes on the nutritional and functional quality of Sacha inchi (Plukenetia volubilis) flour. Front. Sustain. Food Syst. 9:1591362. doi: 10.3389/fsufs.2025.1591362
Edited by:
Miguel Angel García-Parra, National Open and Distance University, ColombiaReviewed by:
Jhon Edinson Nieto Calvache, University of the Llanos, ColombiaYamilis Maria Cataño Vergara, Universidad de Bogotá Jorge Tadeo Lozano, Colombia
Copyright © 2025 Narváez Cadena, Roa Acosta and Bravo Gómez. This is an open-access article distributed under the terms of the Creative Commons Attribution License (CC BY). The use, distribution or reproduction in other forums is permitted, provided the original author(s) and the copyright owner(s) are credited and that the original publication in this journal is cited, in accordance with accepted academic practice. No use, distribution or reproduction is permitted which does not comply with these terms.
*Correspondence: Ruby Aracely Narváez Cadena, cnVieW5hcnZhZXpAdW5pY2F1Y2EuZWR1LmNv