 Qi Zhen
 Chao Xu
 Tana1*
- 1College of Mechanical and Electrical Engineering, Inner Mongolia Agricultural University, Hohhot, China
- 2College of Energy and Traffic Engineering, Inner Mongolia Agricultural University, Hohhot, China
Potatoes rank among the world’s most important food crops. Traditional storage methods often lack precise environmental control, rendering potatoes vulnerable to rot and spoilage. Scientific storage, which entails accurate regulation of temperature and humidity, is critical for maintaining potato quality during storage. In this study, the focus is on advancing the scientific storage of potatoes. An experimental platform for potato storage was developed, and experiments were conducted to regulate temperature and humidity within the storage environment. A numerical simulation model of the platform was established based on computational fluid dynamics (CFD). The accuracy of the numerical model was validated by comparing with the experimental results. Furthermore, the airflow, temperature, and humidity distribution within the storage environment were analyzed under varying air supply velocities, temperatures, and humidity levels. Based on the storage characteristics of potatoes and practical experience, the optimal conditions for regulating the temperature and humidity in the potato storage environment on this platform are an air supply temperature of 3°C, an air supply velocity of 5 m/s, and an air supply humidity of 90%.
1 Introduction
With the growing significance of potatoes in the food sector, this crop has become one of the most important food sources worldwide (Khan et al., 2025). Serving a dual purpose by providing both tubers and leafy vegetables, potatoes offer substantial nutritional value and demonstrate strong adaptability to diverse geographic regions, including a variety of climates and soil types. This adaptability facilitates widespread cultivation and contributes to a consistent annual increase in global production (Nayem et al., 2024). However, the high yield of potatoes imposes more stringent storage requirements to preserve quality and minimize losses in moisture and weight during storage (Zhang et al., 2024). Potato storage differs markedly from that of many other crops. Due to their longer storage periods and heightened sensitivity to environmental factors such as temperature, humidity, and gas composition, potatoes demand more precise storage conditions (Nam and Chun, 2021; Gutiérrez-Pozo et al., 2024). These unique requirements underscore the necessity for specialized storage solutions tailored to maintaining potato quality throughout the storage lifecycle.
Storage temperature and humidity are significant environmental factors that affect the quality of stored agricultural products, including potatoes (Pudja et al., 2024). To achieve effective storage and preservation, it is essential to consider the characteristics of the stored crops and provide appropriate environmental temperature and humidity (Patel and Sutar, 2023). Traditional potato storage methods typically rely on underground or semi-underground structures lacking active temperature and humidity control, with ventilation limited to small windows (Jubayer et al., 2017; Tiwari et al., 2021; Okache et al., 2025). The absence of environmental regulation in these systems often leads to significant postharvest losses, including excessive moisture loss, microbial decay, and uncontrolled sprouting. The key to scientific potato storage lies in the reasonable construction of a ventilation, temperature, and humidity control system to maintain constant conditions in the storage environment (Foukaraki et al., 2016). Furthermore, a temperature and humidity monitoring system for the potato storage environment is also essential. This system monitors the storage environment’s temperature and humidity in real time and automatically adjusts conditions based on current parameters, ensuring that potatoes are maintained in an optimal environment throughout storage (Çapoğlu et al., 2022; Croquer et al., 2019). Currently, environmental monitoring systems for potato storage face issues with uneven temperature, humidity, and airflow distribution. These uneven distributions can lead to local areas becoming overheated, excessively humid, or accumulating gases, thereby affecting potato quality and preservation (Krishnan, 2025; Mustika et al., 2022). Therefore, it is crucial to monitor the overall distribution of airflow, temperature, and humidity within the storage environment. Monitoring these factors ensures fresh potatoes are protected from inappropriate storage conditions.
In recent years, computational fluid dynamics (CFD) has facilitated the development of advanced numerical modeling techniques that are increasingly applied to optimize potato storage environments. These methods enable detailed prediction and analysis of airflow patterns, as well as temperature and humidity distributions within storage facilities, thereby supporting improved environmental control and storage efficiency (Majed and Sherko, 2023; Chourasia and Goswami, 2007a, 2007b, 2007c). CFD-based models play a significant role in maintaining the quality of stored potatoes. In their comprehensive review, Grubben and Keesman (2015) examined various modeling approaches for post-harvest potato storage, highlighting the effectiveness of CFD techniques in this field. Building on this, they developed both a dynamic one-dimensional mathematical model and a two-dimensional full-scale large-capacity storage model using CFD numerical methods. These models were employed to optimize the design and operational conditions of potato storage facilities, thereby enhancing storage efficiency and product quality (Grubben and Keesman, 2019). Chourasia et al. (2004) and Chourasia and Goswami (2007a, 2007b, 2007c) established a physical model of the low-temperature storage environment for potatoes using CFD numerical techniques to investigate the variations in temperature and moisture content under low-temperature storage conditions. Zhao et al. (2020) established a numerical model for potato storage facilities using computational fluid dynamics (CFD). The results indicate that under reasonable conditions, floor air supply can effectively ensure the desired temperature and airflow distribution. Zewdie et al. (2022) employed a CFD model to design an onion curing system, the developed model was used to assess the air velocity, temperature, and relative humidity distribution to get an insight into the uniformity of curing of onion bulbs using the develop alternative curing system.
Potatoes play a vital role as the primary vegetable and staple food during the winter in Inner Mongolia, China, significantly contributing to local food security. This study aims to enhance the shelf life of potatoes in winter through the regulation of temperature and humidity. Therefore, a storage experimental platform integrating refrigeration, humidification, and controlled atmosphere functions was developed to investigate the impact of temperature and humidity on potato storage quality. Additionally, a monitoring system was implemented to record temperature and humidity variations during storage, ensuring precise control over the platform’s conditions. Furthermore, a computational fluid dynamics (CFD) model was established to regulate temperature and humidity in the potato storage environment, with experiments conducted to validate its accuracy. Different air-cooling systems were utilized to evaluate their effects on the storage environment, predicting the optimal temperature and humidity conditions for potato storage.
2 Materials and methods
2.1 Experimental platform for the temperature and humidity
The environmental parameters monitored include temperature, humidity, oxygen concentration, and carbon dioxide concentration, as illustrated in Figure 1a. The system comprises two adjacent north-south oriented structures, each measuring 5,000 mm in length, 4,000 mm in width, and 2,400 mm in height, resulting in a total base area of 2.0 × 107 mm2. The walls of the storage experimental platform primarily consist of a polyurethane sandwich layer and steel plate with a density of 40 kg/m3 and a thermal conductivity of 0.022 W/(m °C). The platform maintains a temperature range of 0–10°C (±0.1°C) and relative humidity of 20–99% (±0.1%). The O2 concentration ranges from 0 to 21% by mass (±0.05%), and the CO2 concentration ranges from 0 to 10% by mass (±0.05%). After storing the potatoes, the air temperature and gas concentrations stabilize to the specified levels within 24 h, whereas humidity equilibrium is reached much faster, within 0.5 h.
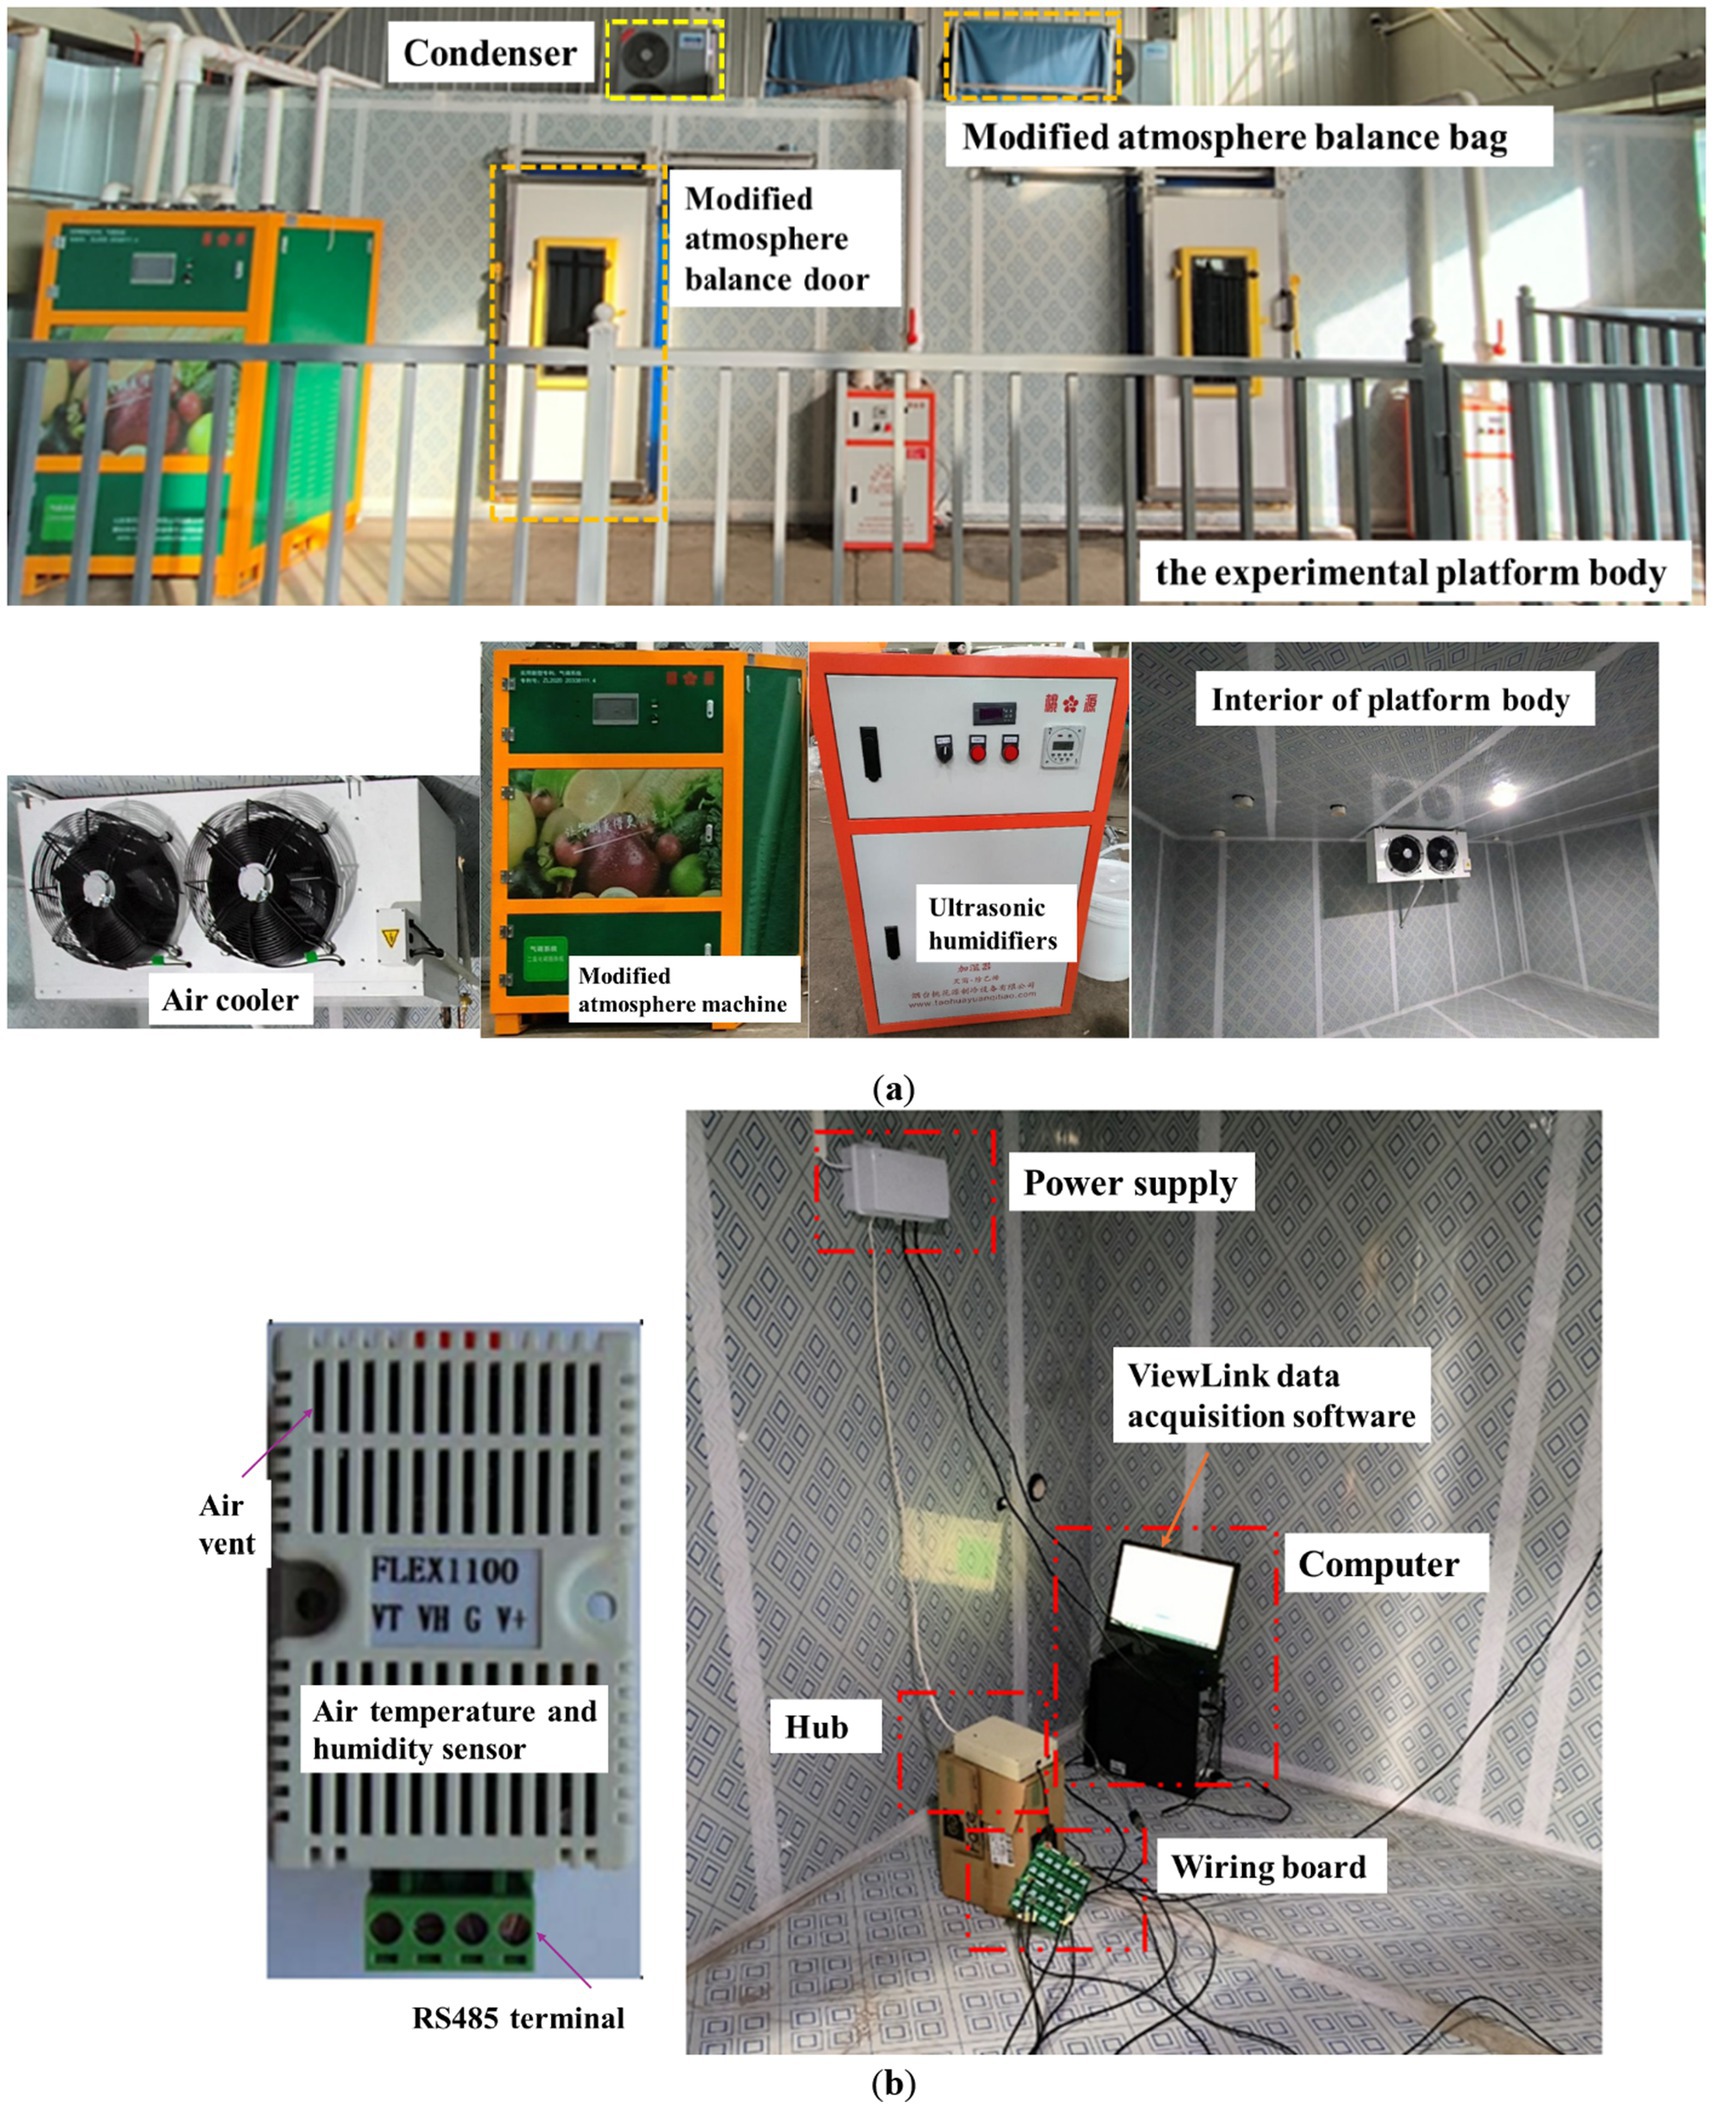
Figure 1. (a) Configuration and appearance of the experimental platform. (b) Connection of the temperature and humidity monitoring system.
The storage experimental platform is furnished with a refrigeration system, air conditioning system, and humidification system. The commercial refrigeration system comprises a cooler (DD60, Hebei Ronghui Co., Ltd., China), a compressor (TE800FC3Q9JK, Hebei Ronghui Co., Ltd., China), condenser, and refrigeration controller. The cooler measures 1,320 mm (length), 300 mm (width), and 600 mm (height), with two air supply outlets, a cooling capacity of 1.2 kW, and an air flow rate of 6,000m3/h. The controller regulates temperature and defrost functions. The air conditioning system (THY-100 model, Shandong Taohuayuan Co., Ltd., China) includes oxygen and carbon dioxide removal equipment, measuring 1800 mm × 1,100 mm × 1,000 mm, with O2 and CO2 removal capacities of 100 kg/24 h each. The humidification system features an ultrasonic humidifier (JSQ-9, Shandong Taohuayuan Co., Ltd., China) with dimensions of 550 mm × 350 mm × 850 mm and a maximum humidification capacity of 9 kg/h.
2.2 Environmental temperature and humidity monitoring system of experimental platform
The monitoring system analyzes the distribution characteristics of air temperature and humidity throughout the temperature and humidity control processes within the storage experimental platform. The data acquisition setup primarily consists of air temperature and humidity sensors, a wiring board, a hub, and a computer, as illustrated in Figure 1b. The FLEX1100 air temperature and humidity sensor (Dalian Zheqin Co., Ltd., China) simultaneously measures both air temperature and humidity. It has dimensions of 90 mm × 47 mm, a temperature measurement range of −40 to +85°C with an accuracy of 0.3°C, and a humidity measurement range of 0–100%RH with an accuracy of ±2%RH. The wiring board (Shandong Renke Co., Ltd., China) is configured with 24 interfaces arranged in a 4 × 6 layout, allowing connection to 23 sensors, while reserving one port for the hub. The hub (Dalian Zheqin Co., Ltd., China) transmits data from all connected sensors to a computer via RS485 to USB interface. The ViewLink data acquisition software, provided by Dalian Zheqin Co., Ltd., enables data acquisition, storage, analysis, and visualization.
2.3 Experimental design
The experiment was conducted between November and December 2024 at the storage experimental platform located in a warehouse within the East Science and Technology Park of Inner Mongolia Agricultural University, Saihan District, Hohhot City (111.43°E, 40.49°N, Inner Mongolia, China). During the winter period, the indoor air temperature in the warehouse was maintained at approximately 15–20°C, with relative humidity levels around 25–30% RH. These conditions closely simulate those of the typical potato storage season, thereby extending the experimental duration and enabling a thorough assessment of air cooling and humidification performance within the facility. The sensing surfaces of the sensors positioned at the top and bottom face the air flow domain, with identical sensor placements applied to the two spatial sections, as illustrated in Figure 2b.
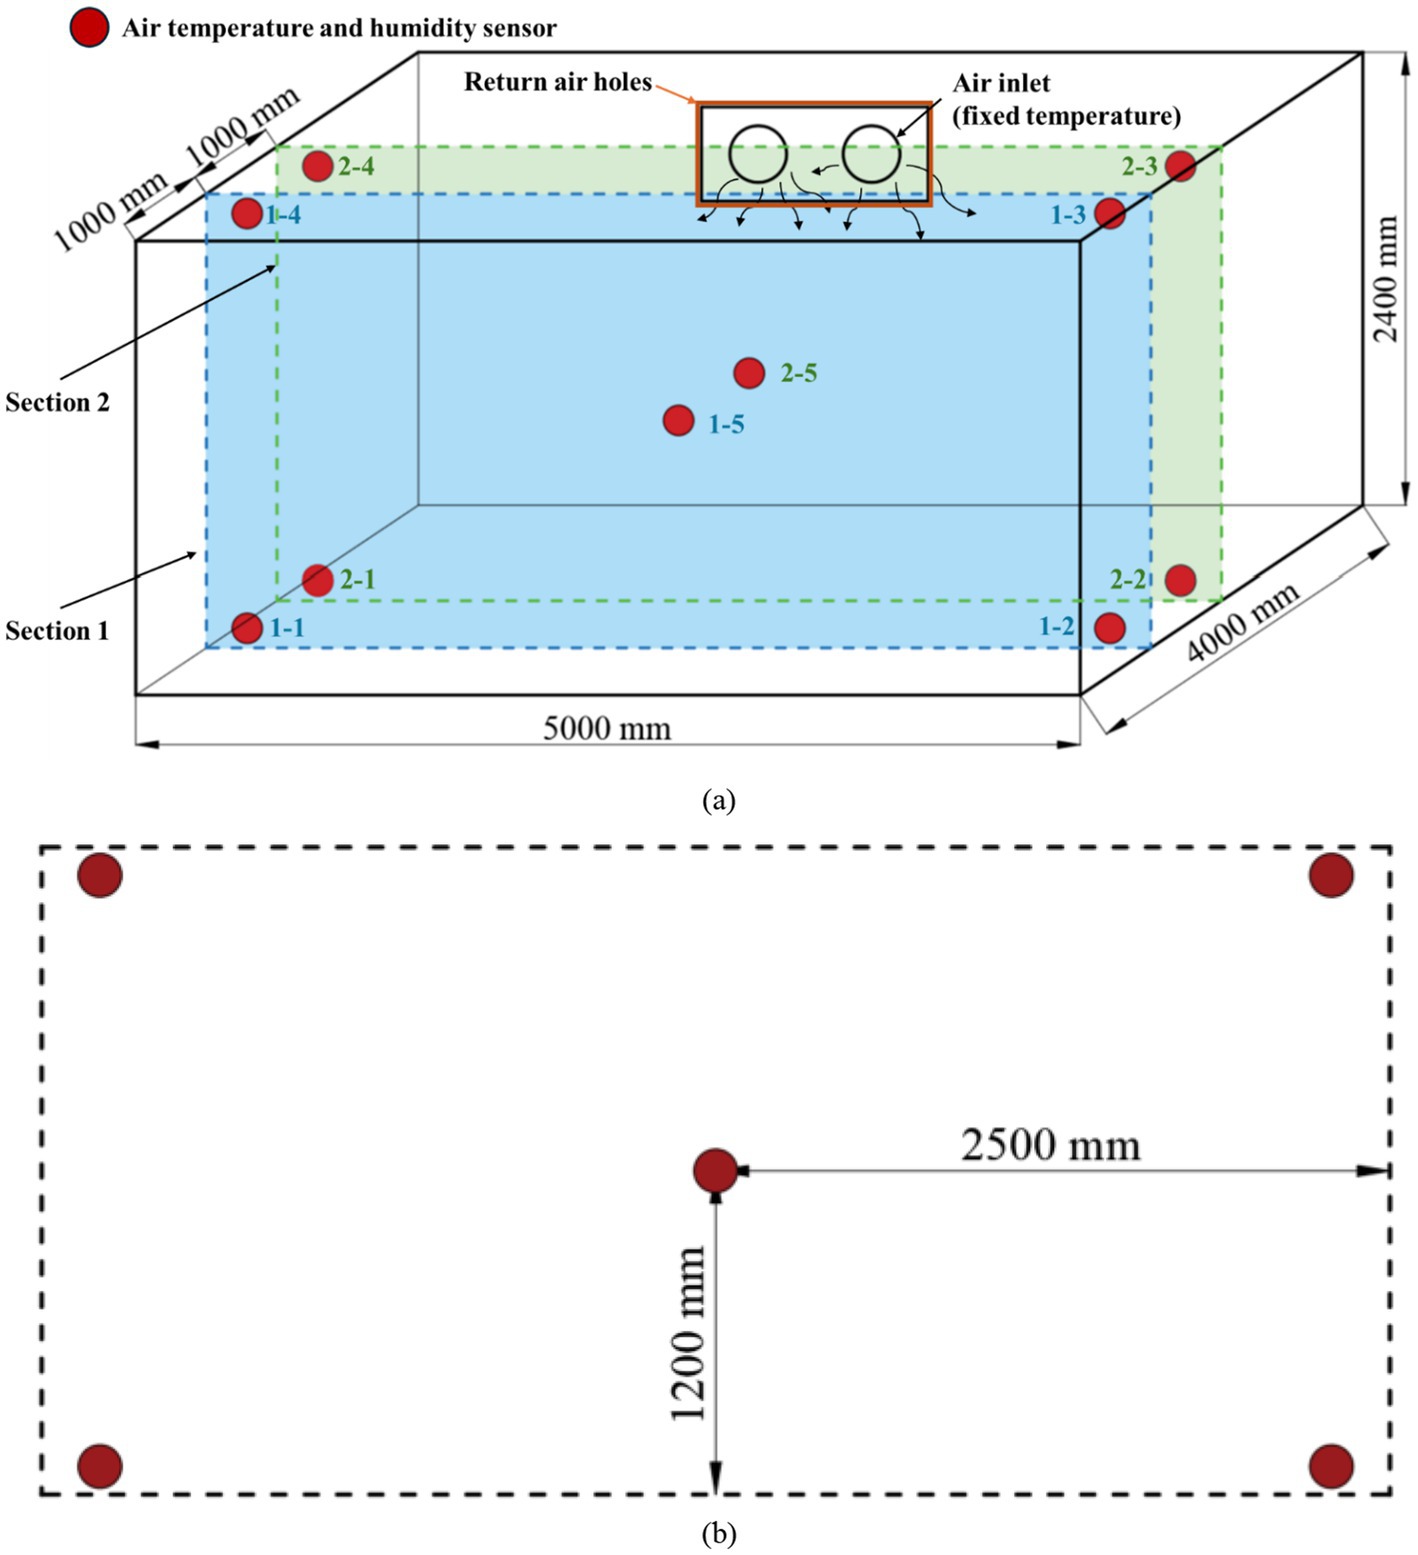
Figure 2. (a) Air temperature and humidity sensor installation position. (b) Sensor distribution in cross-section.
To investigate the distribution patterns of air temperature and humidity during temperature control and combined temperature-humidity control in the storage experimental platform under varying weather conditions, two designated sections—referred to as Section 1 and Section 2—are selected along an east-west axis from the west wall, as shown in Figure 2a. Section 1 is positioned 1 meter from the wall, while Section 2 is located 2 meters away. To minimize data interference, only one sensor per section is used for data collection during each experiment. Additionally, prior to the experiment, the laboratory door is opened to allow sufficient air exchange between the internal air of the storage platform and the ambient environment, ensuring that the initial temperature and humidity at the start of the regulation process closely approximate external conditions.
Five temperature and humidity sensors are positioned in an “X” pattern from west to east on each cross-section of the storage experimental platform, based on its size and structure. Specifically:
Two sensors are positioned at the bottom: one for Section 1-1 and Section 2-1, and another for Section 1-2 and Section 2-2.
Two sensors are placed at the top: one for Section 1-3 and Section 2-3, and another for Section 1-4 and Section 2-4.
One sensor is positioned at the center: one for Section 1-5 and Section 2-5.
2.4 Verification experiment of potato storage model
The potato cultivar Holland 15, sourced from Wuchuan County, China, was selected for this experiment. The potatoes were packed in woven bags measuring approximately 700 mm × 350 mm × 180 mm; however, due to material elasticity, shape irregularities, and variations in loading quantity, the actual bag dimensions may vary slightly. These bagged potatoes were stacked in a pile measuring 1,350 mm (length) × 1,100 mm (width) × 900 mm (height) and placed centrally on the storage experimental platform. To minimize mechanical damage caused by stacking-induced pressure, heat insulation pads were positioned at the base of the platform, as illustrated in Figure 3a. The experimental operating conditions were set to maintain a temperature of 3°C, relative humidity of 90%, and a fan speed of 6 m/s. Data collection focused on Section 2, where eight temperature and humidity sensors were deployed: four sensors were placed within the potato pile, and four sensors were positioned in the surrounding airspace. The sensor placement within the potato pile was determined based on the dimensions of the woven bags (see Figure 3b). The storage experiment was conducted until the temperature and humidity readings recorded by the sensors stabilized, exhibiting minimal fluctuation. Once this steady state was reached, multiple measurements were taken, and their average values were used as the final data points for analysis.
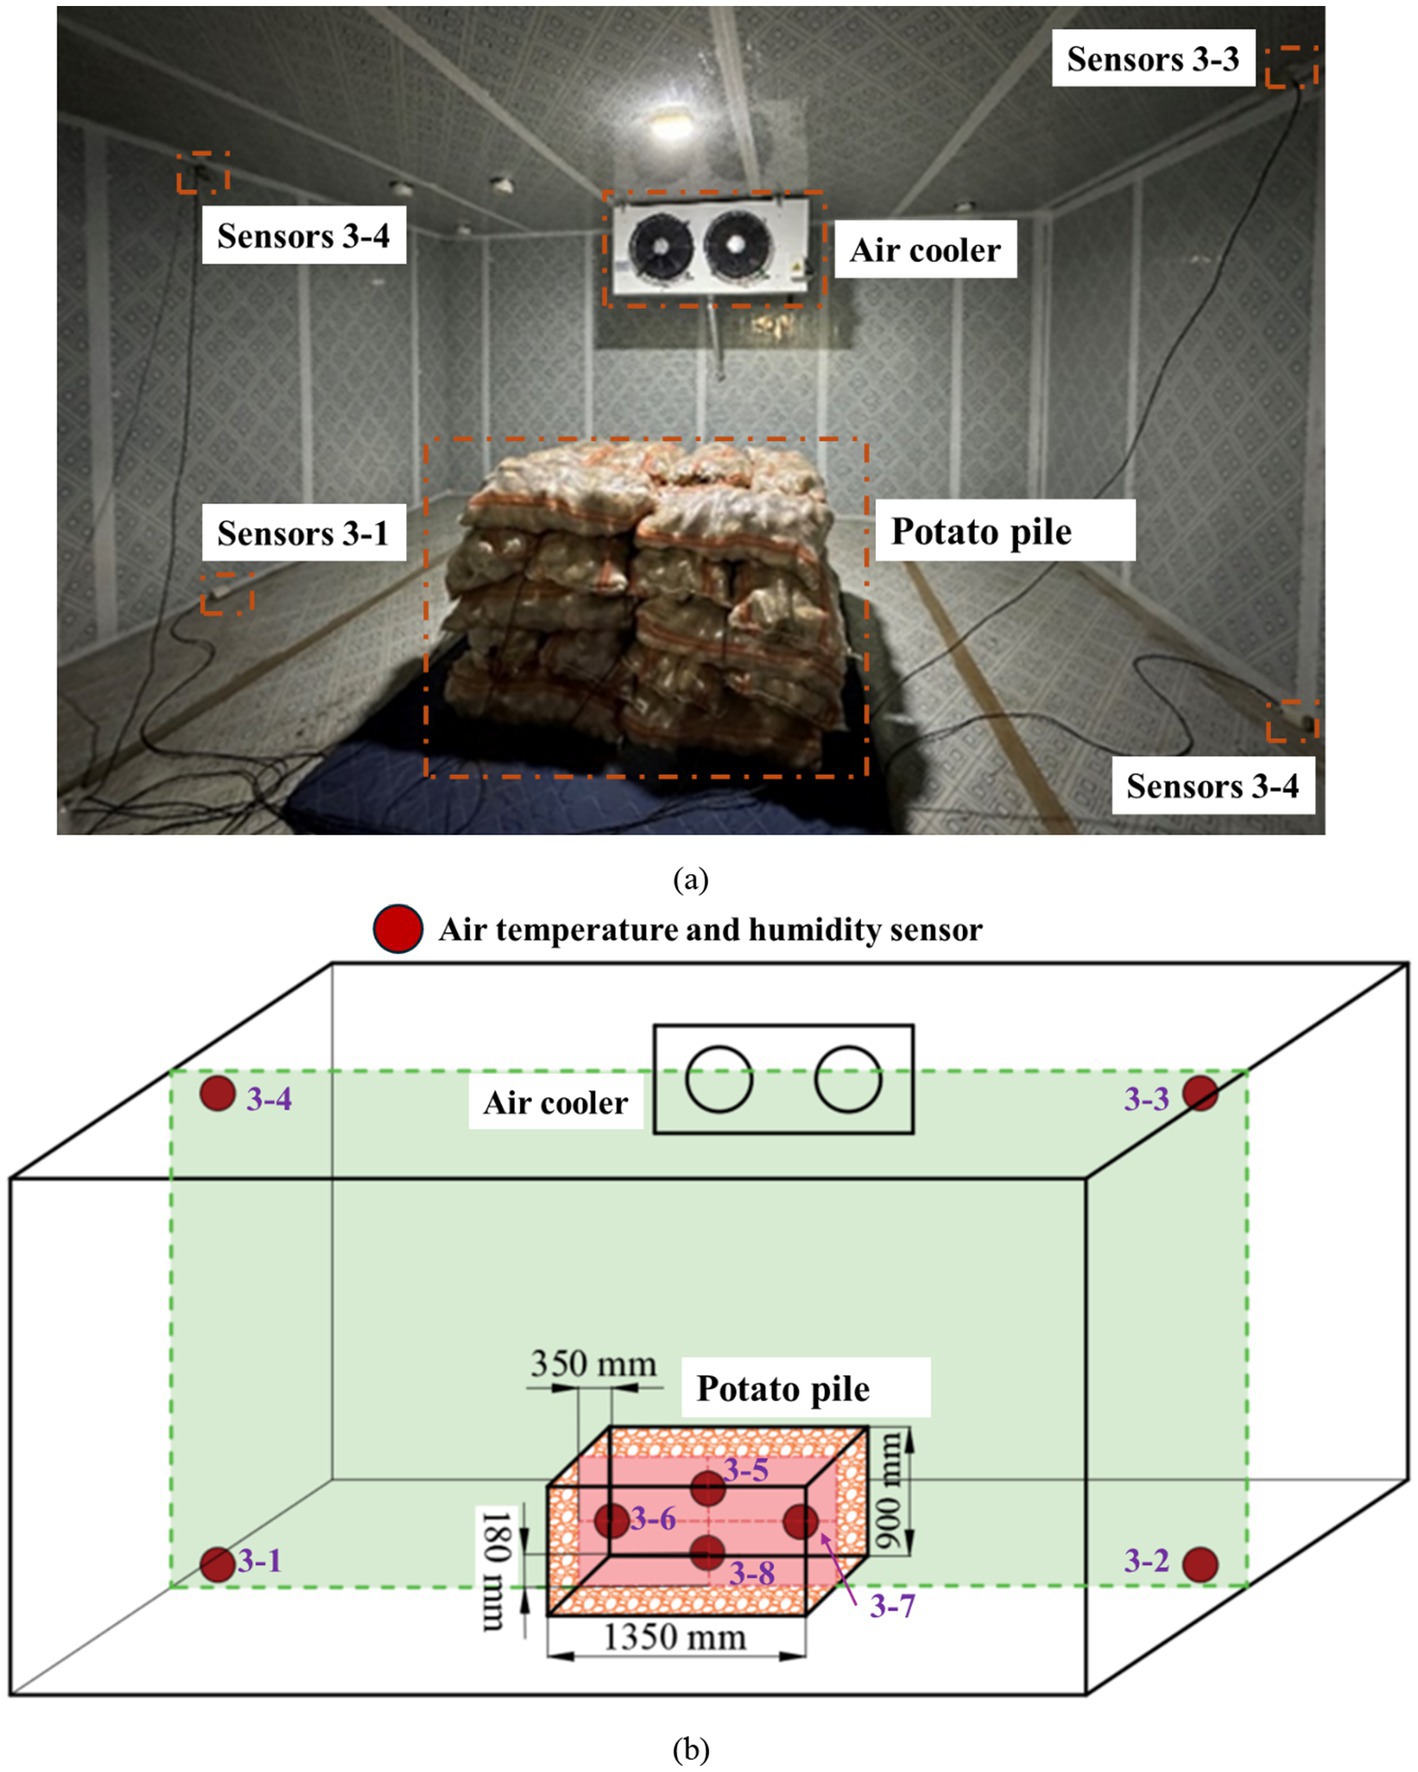
Figure 3. (a) Position of potatoes pile. (b) Schematic diagram of temperature and humidity sensor layout.
2.5 Numerical simulation analysis
A computational fluid dynamics (CFD) model was developed to simulate temperature and humidity regulation in a potato storage environment. Parallel to this numerical study, experimental investigations were conducted under controlled storage conditions to validate the model’s accuracy. The CFD predictions were systematically compared with experimental measurements to verify the model’s precision. To improve computational efficiency while maintaining sufficient accuracy, the model incorporated the following simplifying assumptions based on established practices (Ambaw et al., 2013):
While it is true that air can be compressible, the changes in pressure and density during the operation of the controlled atmosphere storage platform are minimal. Therefore, the air within the storage compartment is assumed to be a homogeneous, incompressible fluid (Han et al., 2023). Airflow is treated as steady turbulence, accounting for only the operational segment of the refrigeration system. The density, thermal capacity, and thermal conductivity of both the potato and platform materials are assumed to be constant. In contrast, air properties are considered temperature dependent.
The platform functions as a closed system, preventing external airflow from affecting the environment. In addition, the primary mode of heat transfer during potato storage is convective heat exchange between the air and the potatoes, while radiation plays a negligible role in overall heat exchange. So, the external airflow and heat radiation outside the storage room are disregarded (So et al., 2021). Only the heat transfer resulting from external convection is considered, and a constant external temperature is maintained.
Due to the irregular shape of potatoes, gaps inevitably occur when they are stacked, which can be considered as a porous medium. To account for the respiratory heat of the potatoes, a solid internal heat source is introduced within the potato pile to simulate this respiratory heat (Tiamiyu, 2020; Nkwocha et al., 2022). The addition of internal heat sources aims to facilitate continuous heat release and improve both heat transfer and hygroscopicity within potato piles. This approach allows for a more accurate analysis of the thermal dynamics and moisture behavior within the potato storage system.
2.5.1 Geometrical configurations
A three-dimensional physical model was developed for both no-load and potato storage experiments (Figure 4 illustrates the potato storage model). The dimensions of the potato pile, platform, and internal facilities match those of the actual experimental setup. The humidification inlet is located near the fan supply port, enabling moisture to mix with the air from the cooler. For steady-state analysis, the humidification port is simplified to coincide with the cooler port. To address distinct flow characteristics and heat/mass transfer mechanisms in the potato porous medium, the warehouse space is divided into two zones: free airflow and potato stacking. This division facilitates detailed analysis of flow field distributions in each region.
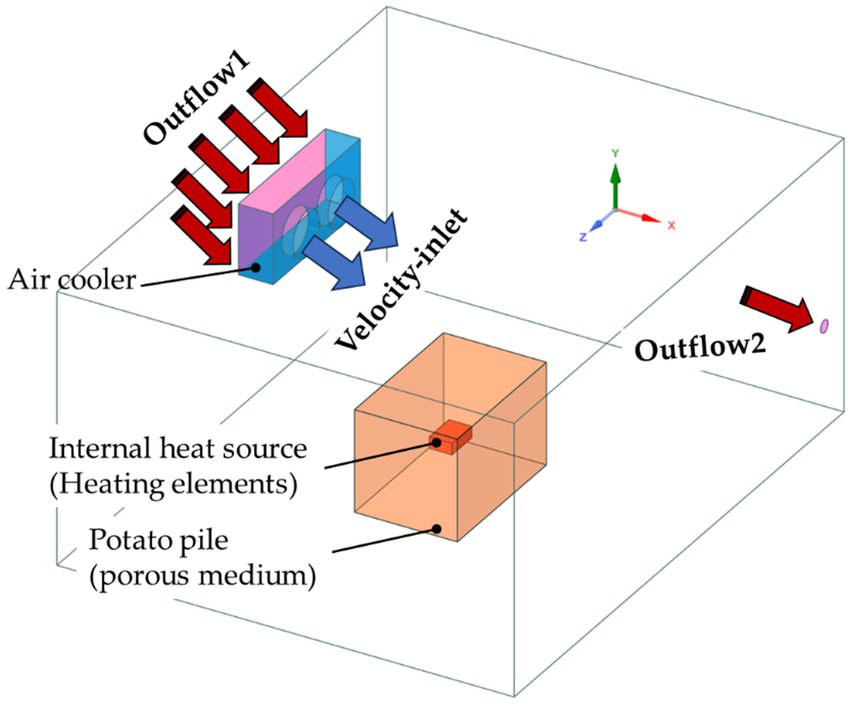
Figure 4. Geometric configuration of the experimental platform with the potato storage.
2.5.2 Governing equations
The fluid flow, heat transfer, and mass transfer within the experimental platform are governed by three fundamental equations: the continuity equation, the energy equation, and the momentum equation. When accounting for mass transfer processes like air humidification, the system must also satisfy the law of conservation of components. The high-velocity airflow generated by the chiller creates turbulent conditions within the storage platform, with heat transfer dominated by convection. In contrast, airflow within the potato piles is significantly reduced due to obstruction, resulting in heat transfer primarily driven by conduction. The flow and heat transfer characteristics in each subdomain are described by their respective governing equations (Verboven et al., 2006).
In the free airflow region, the distribution of airflow and the temperature field can be approximately described as follows:
where is velocity vector (m/s), ρ is the density (kg/m3), t is the time (s), Sφ is the generalized source term, Γφ is the generalized diffusion coefficient, φ is the general variables, the value of which is different, the equation is a different equation.
When φ = 1, the equation is the continuity equation (mass conservation equation):
where , , and are velocity scalars in the three directions of the x, y, and z axes.
When φ = = , this equation is the conservation equation of momentum:
where is the pressure on a microelement on a fluid (Pa), is the component of viscous stress τ acting on the surface of fluid microparticles in x, y, z directions due to molecular viscosity (Pa).
When φ = T, this equation is the energy conservation equation. Among them, T is the local temperature (°C), is the specific heat capacity (J/(kg °C)), λ is the thermal conductivity (W/(m°C)).
To investigate the adjustment of environmental humidity during potato storage, the component transport equation should also be introduced:
where is the mass fraction of component i, ρa is the air density (kg/m3), Ri is the net generation rate of component i, Gi is the additional generation rate caused by discrete phases and custom source terms, Ji is diffusion flux density, is the component flow velocity (m/s). In turbulent motion, the diffusion flow density, Ji of component, i can be calculated using the following:
where Di,m is the mass diffusion coefficient of component, i in the mixed gas, Sct is the turbulent Schmidt number, which takes the value of 0.7, μt is the turbulent viscosity (N s/m2), Di,T is the diffusion coefficient of heat.
The ellipsoidal shape of potatoes creates gaps when stacked, enabling air to flow through. Thus, the potato pile can be modeled as a porous medium. Within this medium, porosity exists, and fluid flow interacts with the solid non-porous regions, generating resistance. This resistance causes a pressure drop and velocity reduction due to inertia and viscous losses. In CFD simulations, the effect of the potato pile on airflow is incorporated by introducing a momentum source term S into the momentum conservation equation. The resistance of the porous medium to gas flow can be described using Darcy’s law, expressed as follows:
where is the permeability, is the inertial drag coefficient, which takes the value of 0.7, is fluid viscosity (N s/m2).
2.5.3 Boundary conditions and computational settings
The thermal and physical properties of the materials used in the storage experimental platform, including the envelope, fan shell, potatoes, air, and internal heat source, are summarized in Table 1. The air supply port of the chiller is modeled as a velocity inlet, with turbulence characteristics defined by a turbulence intensity of 5% and a hydraulic diameter of 0.4 m. Temperature, humidity, and velocity parameters are determined based on subsequent simulations. The chiller returns air outlet and the potato storage model are designated as free outflow boundaries, requiring no additional specifications. All wall surfaces of the storage platform are defined as non-slip adiabatic boundaries. The internal heat source and the initial temperature of the potatoes are set to 10°C, based on the average temperature during the potato storage month, as illustrated in Figure 4.
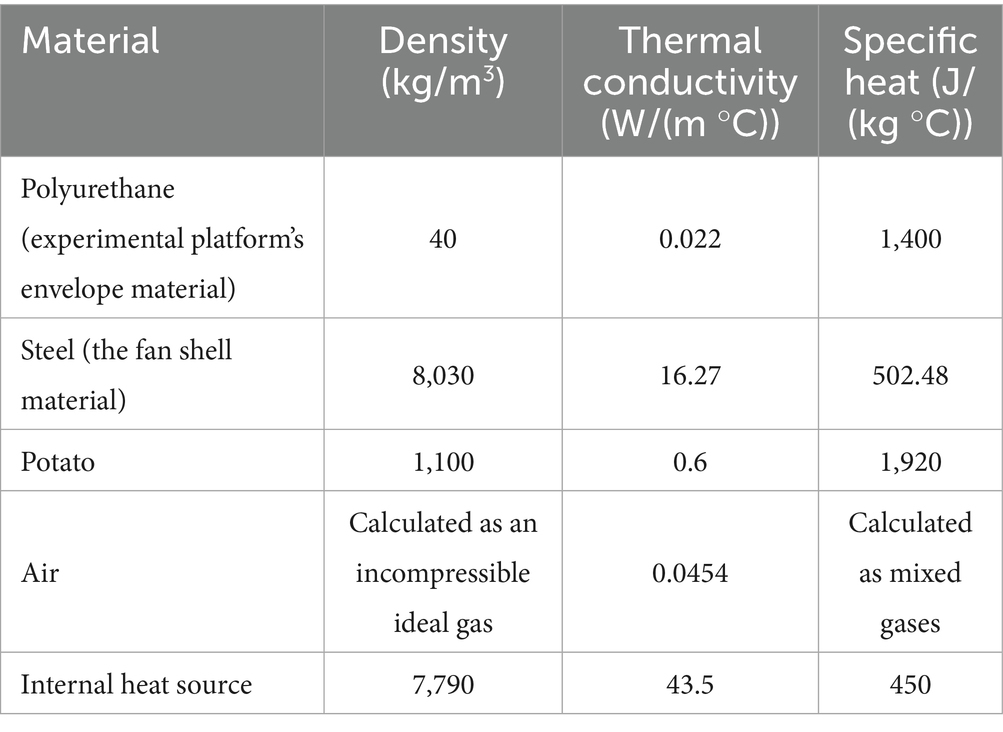
Table 1. Thermophysical properties of different materials.
In selecting a turbulence model, the shear stress transport k-ω model (SST k-ω) was chosen for this study because the SST k-ω model combines the advantages of the standard k-ω model, the standard k-ε model, and the RNG k-ε model. This combination results in an accurate and reliable turbulence prediction model for both the boundary layer and the free shear layer regions (Gong et al., 2021; Defraeye and Radu, 2018). Considering the heat and mass transfer processes in this numerical simulation, it is necessary to enable the energy equation and the species transport model and set the gravitational acceleration to 9.81 m/s2. The semi-implicit method for pressure-linked equations (SIMPLE) is used to couple the pressure to velocity. Additionally, to better describe turbulence and flow, the convective terms are implemented using the second-order upwind scheme. A convergence criterion of 10−6 was imposed for momentum, continuity, and turbulence and 10−20 for the scalar and energy equations. This numerical simulation was conducted on a 64-bit computer equipped with dual 64-core Intel® Xeon® 6430 processors (2.10 GHz) and 256 GB of memory.
2.5.4 Meshing and mesh-independent verification
To enhance the model’s accuracy, local refinement is applied at the inlet and outlet of the air cooler. Based on the physical structure of the experimental platform, a polyhedral mesh is utilized. Considering the balance between computation time and model accuracy, a sensitivity analysis of the mesh is necessary. In this study, the temperature values at two measurement points after 120 s of simulated cooling are selected for comparative analysis to verify the independence of the grid. And the number of divided meshes used for testing is presented in Figure 5.
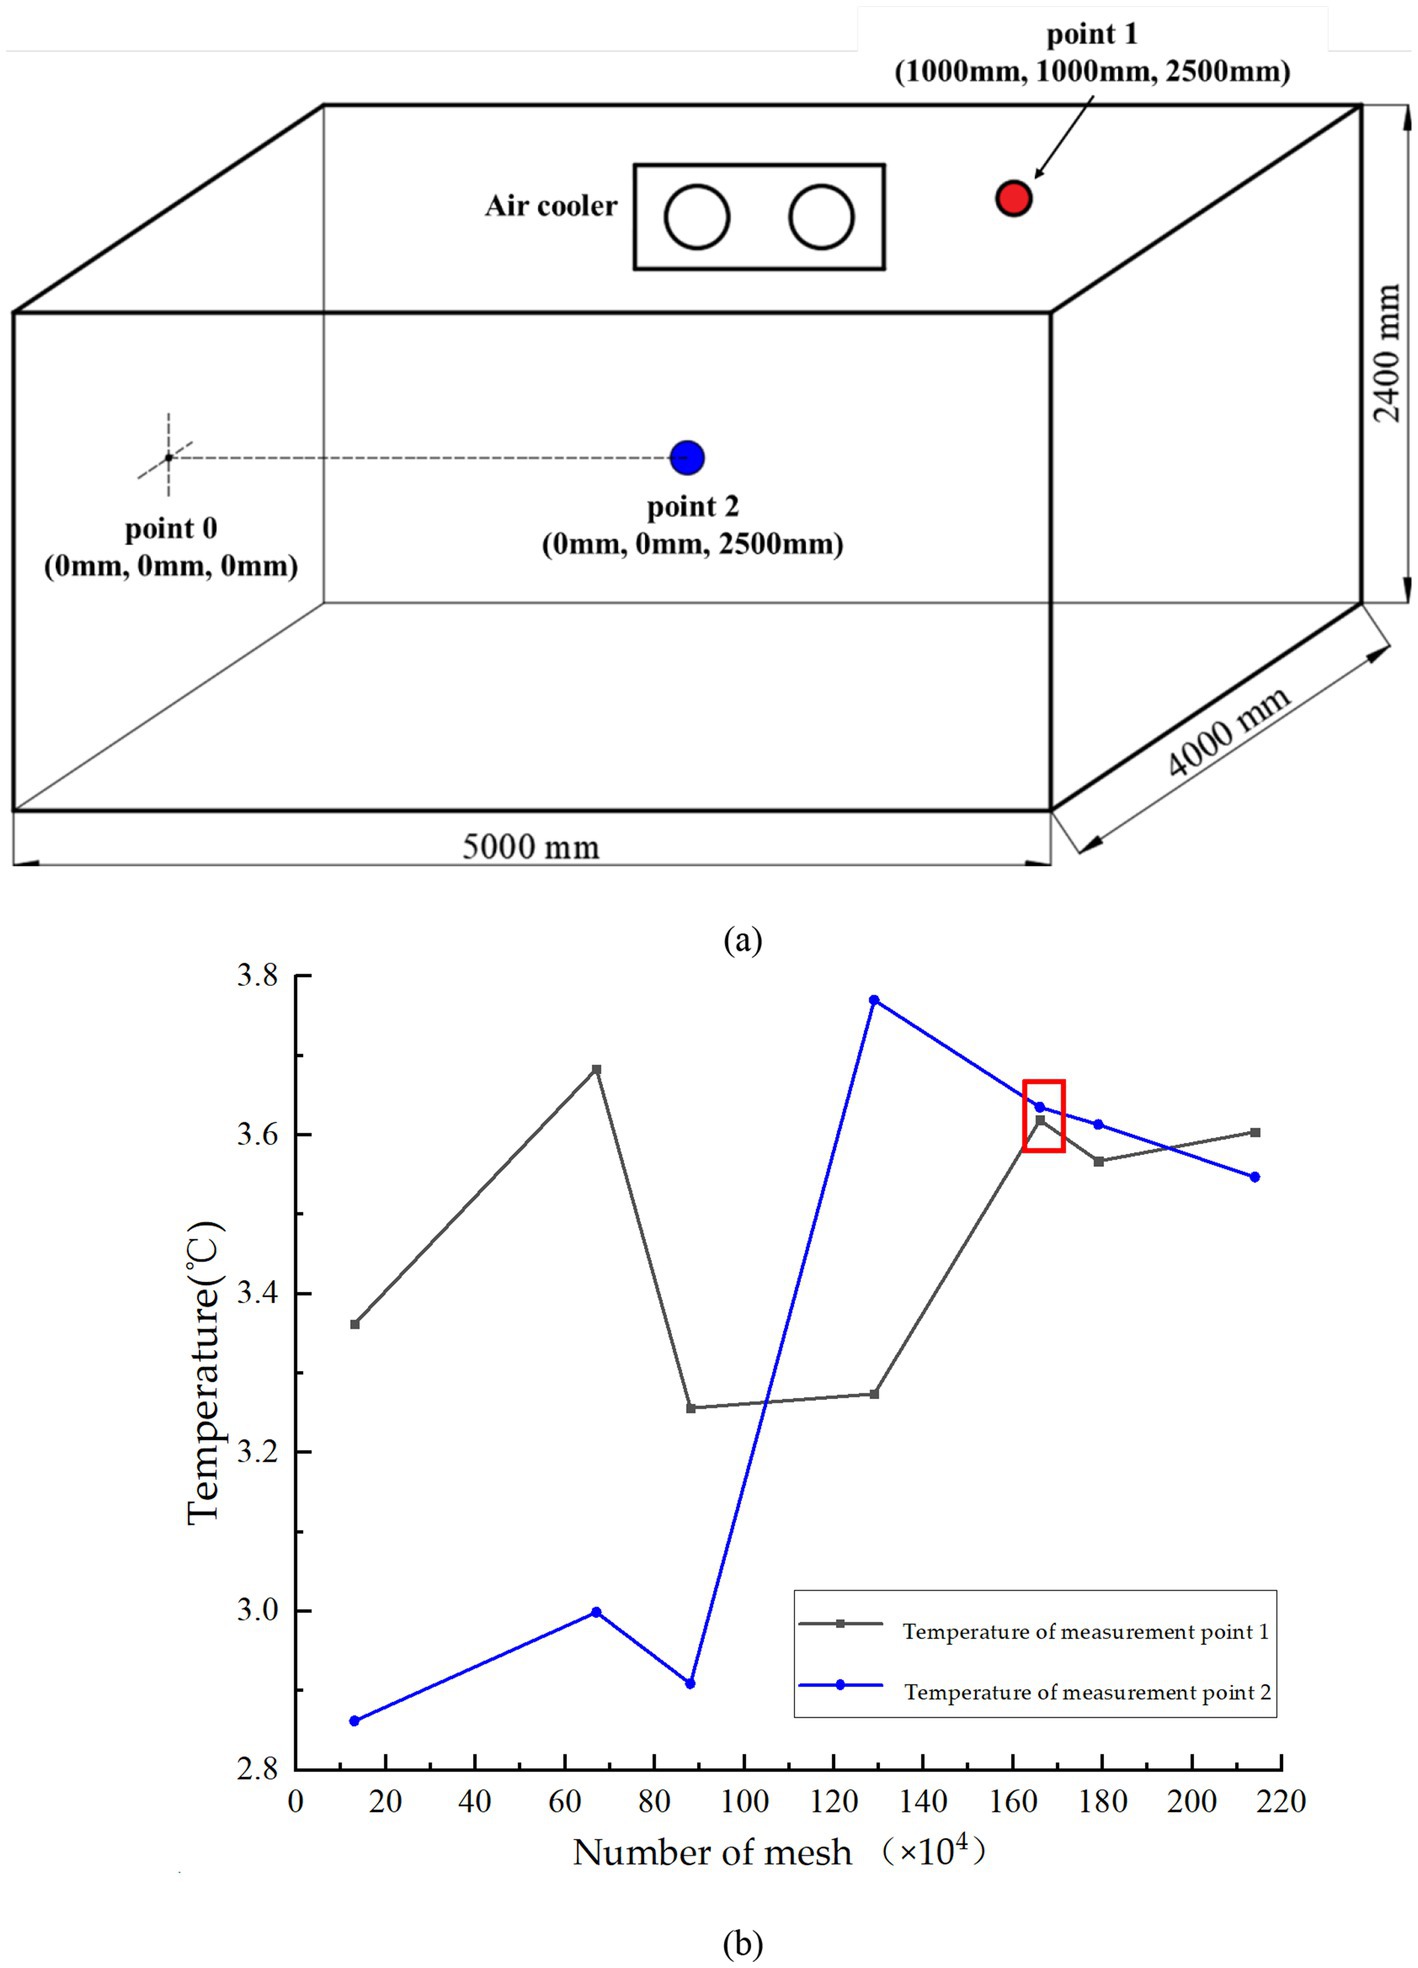
Figure 5. (a) Position of point 1 and 2. (b) Temperature values of two measuring points under different grid quantities.
The temperature values of two designated points following a simulated cooling period of 120 s were compared to assessing the mesh’s independence. Measuring point 1 (coordinates: 1,000 mm, 1,000 mm, 4,000 mm) is situated adjacent to the chiller’s air supply, while measuring point 2 (coordinates: 0 mm, 0 mm, 2,500 mm) represents the three-dimensional center of the storage experimental platform, as shown as Figure 5a. Across seven grid resolutions, the simulation outcomes remained consistent. Line graphs depicting the temperatures at the two measuring points for various grid resolutions are presented in Figure 5b. As the number of mesh increases from 13 × 104 to 214 × 104, the temperature fluctuations at the two measurement points significantly decrease and stabilize once the grid count reaches 166 × 104. Therefore, the influence of grid count on the calculation results can be disregarded when it reaches 166 × 104, indicating that the temperature value at this mesh count falls within an acceptable error range, thereby meeting the criterion for mesh independence. Consequently, the mesh quantity for the potato storage model should exceed 166 × 104. Following the mesh independence verification, the potato storage model was locally refined at the chiller inlet and moisture outlet, resulting in a final mesh count of 172 × 104.
2.5.5 Air temperature and humidity uniformity calculation
Two parameters, the root mean square error (RMSE) and the mean relative deviation (ARD), were introduced to assess the agreement between numerical simulation results and experimental data (Gong et al., 2021). RMSE and ARD are defined as follows:
where Si is the current simulation result, Ei is the existing experimental data, and n is the total number of samples data points.
Uniformity of temperature and humidity distribution refers to the equilibrium of air temperature and humidity across the experimental platform (Defraeye and Radu, 2018; Han et al., 2023). A more uniform distribution of temperature and humidity results in a more consistent storage effect, indicating that the performance of the temperature and humidity control equipment is being fully utilized. To evaluate the uniformity of airflow organization, we introduce the temperature coefficient of variation and the relative humidity coefficient of variation. The temperature coefficient of variation is typically calculated using thermodynamic temperature. A smaller coefficient of variation indicates a more uniform distribution of airflow (Pu et al., 2014). The coefficients of variation for temperature and relative humidity are calculated as follows:
where CVT is the temperature variation coefficient, m is the number of measuring points, Ti is the temperature of the measurement point i, Tave is the average temperature of all measurement points, CVH is the coefficient of variation of relative humidity, Hi is the relative humidity of measuring point i, Have is the average relative humidity of all measurement points.
2.5.6 Air humidity ratio
Air humidity ratio is a critical factor in determining the degree of changes in air humidity, as it can mitigate the effects of the coupling relationship between temperature and humidity in environmental assessments. In experimental settings, the inter-play between air humidity and temperature suggests that when the humidity content remains constant, variations in temperature will alter the air’s capacity to dissolve water vapor. Specifically, an increase in temperature results in a decrease in the relative humidity of the air, while a decrease in temperature leads to an increase in relative humidity (Song et al., 2024). Since the air humidity data collected in experiments is typically expressed as relative humidity, conversion is necessary to derive accurate air humidity ratio measurements. The equation for calculating air humidity ratio is as follows:
where d is the air humidity ratio (g/kg), ε is the ratio of the dry air specific gas constant to the water vapor specific gas constant, which is 0.622; is the relative humidity of air (%), is the saturation pressure of water vapor (Pa), and is the air pressure (Pa), = 9 × 10⁴ Pa according to local conditions.
2.5.7 Dimensionless treatment
The variables of temperature, humidity, and velocity appearing in the numerical results are normalized by defining dimensionless variables utilizing the scaling factors, which were defined by Equations 13, 14:
where is denoted the dimensionless temperature, is the arithmetic average value of the volume-averaged temperatures, is the air temperature, is the initial temperature, is the dimensionless velocity, is the arithmetic average value of the volume-averaged velocity, is the air velocity, is the initial velocity.
3 Results
3.1 Experimental results of temperature and humidity distribution characteristics
The experiments were conducted in November 2024 within an experimental platform located inside a factory building. During winter, the facility maintained effective heating, ensuring an average ambience temperature of approximately 24°C around the platform. To investigate the distribution patterns of temperature and humidity, data from Sections 1 and 2 of both air temperature control and temperature-humidity control processes were analyzed under two distinct initial conditions. The target temperature inside the platform was set between 3°C and 5°C, while the target humidity was maintained at 85 to 90%.
3.1.1 Analysis of air temperature and humidity characteristics under temperature control
Figures 6a,b display the temperature and humidity curves for each measuring point in Section 1 and Section 2 during a 60-min temperature control period on the experimental platform. The initial temperature and humidity at each measurement point ranged from 20°C to 22°C and from 25 to 32%, respectively. After 18 min of operation, the air within the experimental platform enters a cyclic state characterized by “slow passive heating” in response to elevated external temperatures and “rapid active cooling” triggered by the refrigeration system when temperatures surpass a set threshold, as depicted in Figure 6. This transition occurs when the sensor linked to the refrigeration system reaches the desired temperature, prompting the system to stop operating. As a result, temperatures at various measurement points exhibit fluctuations and decline, ultimately stabilizing within the target temperature range of 3 to 5°C after 60 min. The relative humidity of each measurement point is affected by the decrease in temperature fluctuations, and it also shows a phased rise and fall, and the overall slow rise is shown. At 60 min, the humidity of each measurement point is between 44 and 50%.
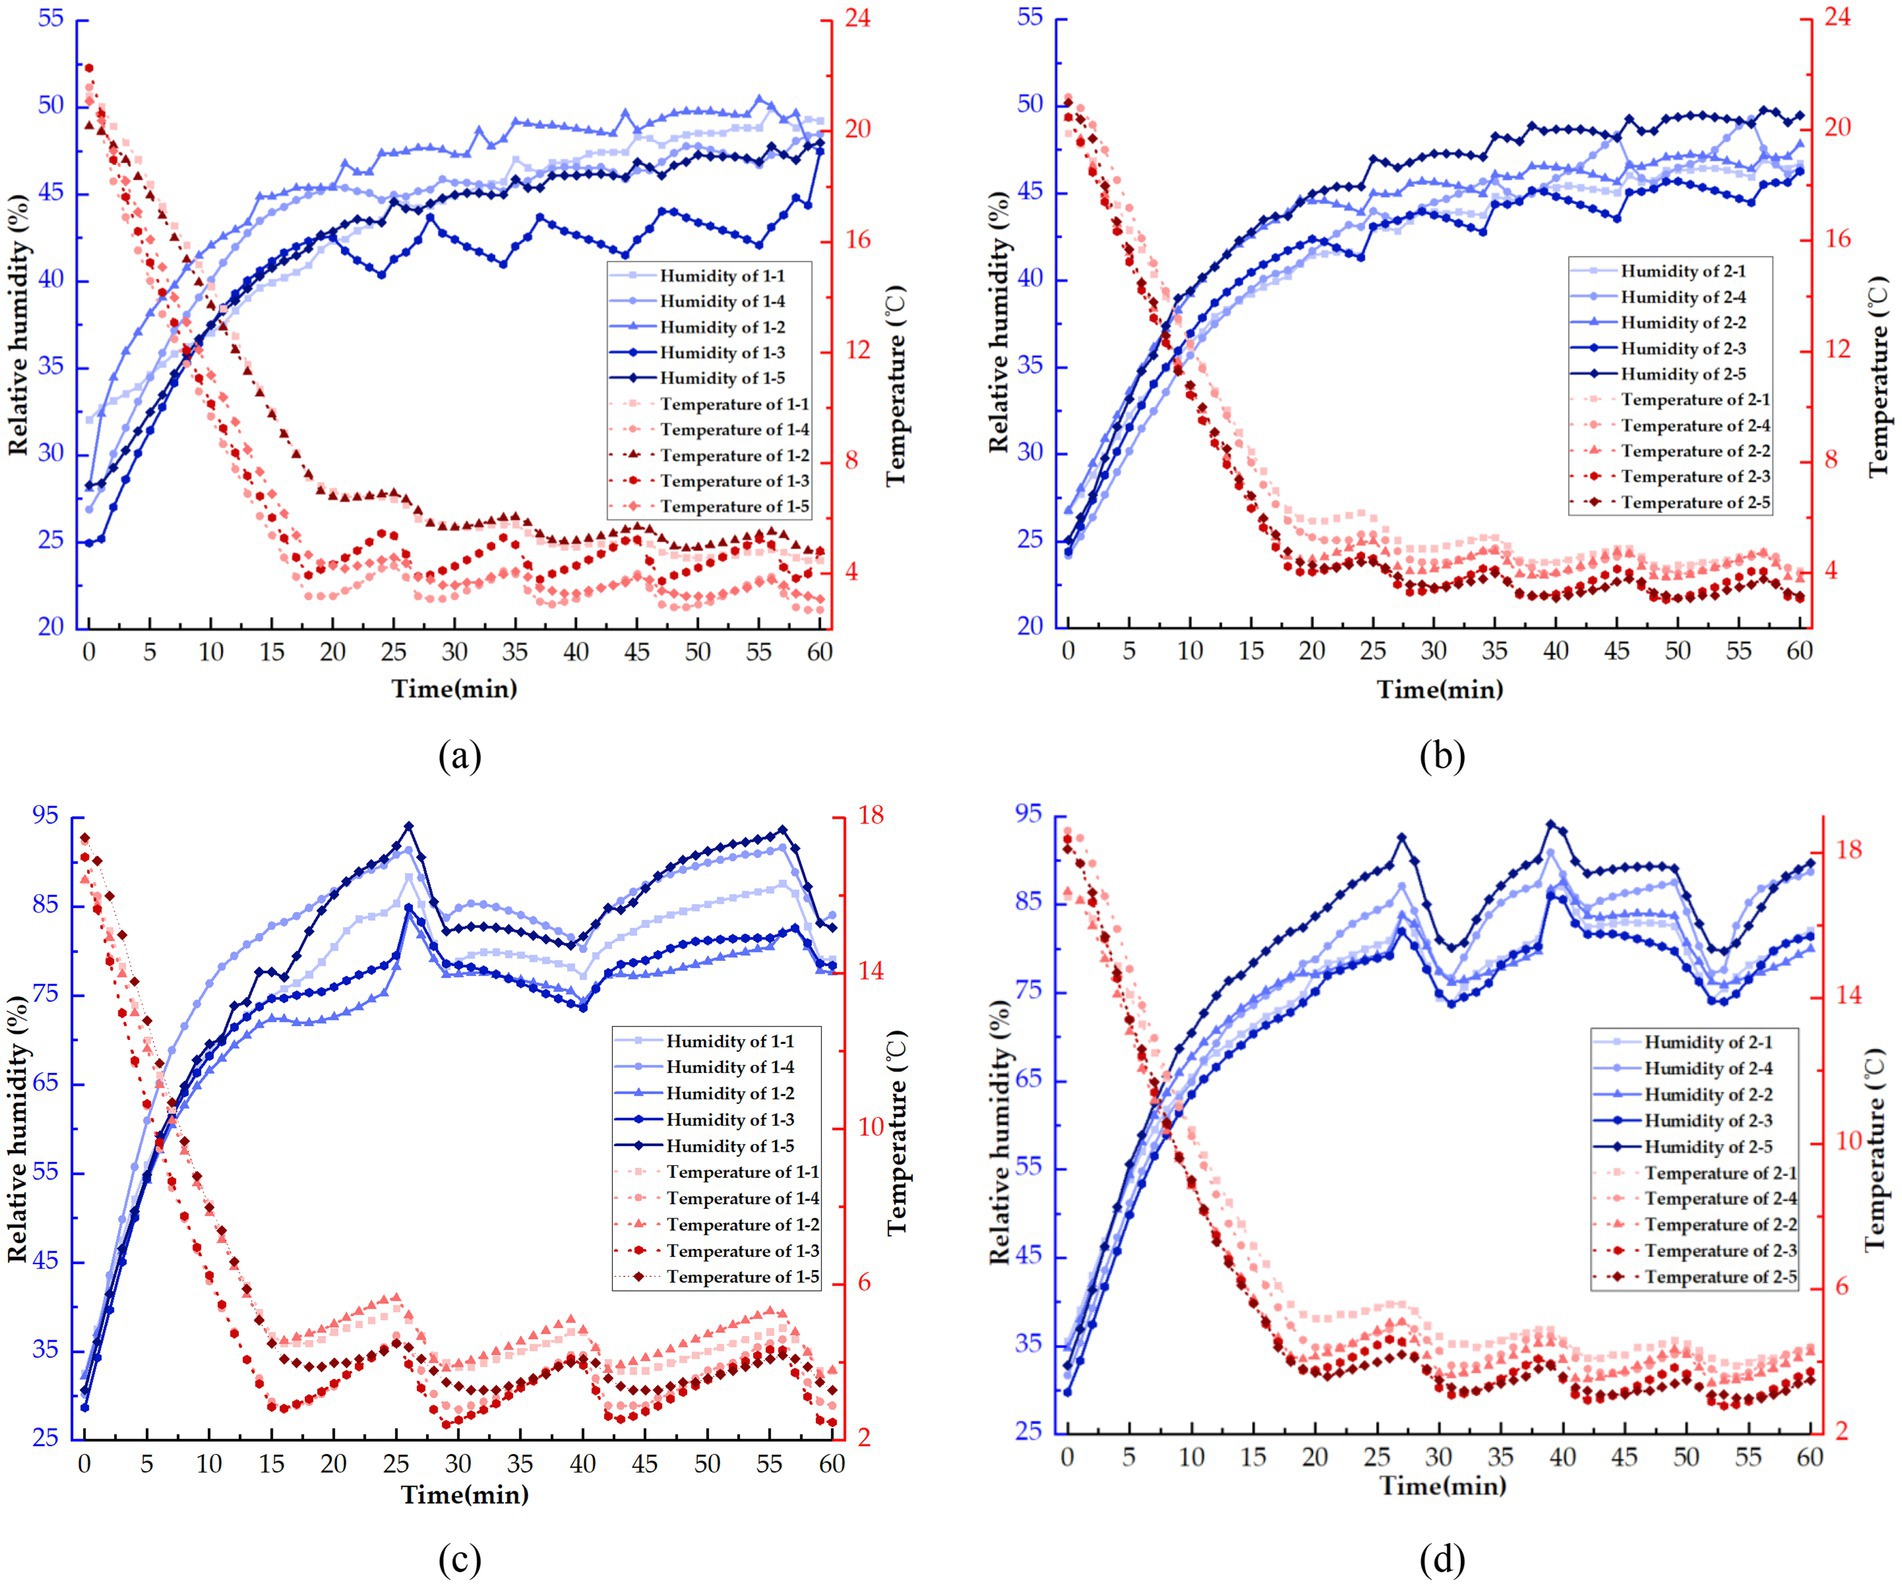
Figure 6. The temperature and humidity change curves at each measuring point during a 60-min temperature control period or temperature and humidity co-control period. (a) Section 1 of temperature control period. (b) Section 2 of temperature control period. (c) Section 1 of temperature and humidity co-control period. (d) Section 2 of temperature and humidity co-control period.
As illustrated in Figure 6a, each measurement point exhibits a rapid decrease within 18 min after the onset of cooling. Notably, the temperatures at measurement points 1-1 and 1-2 decrease gradually, remaining above 7°C after 18 min of cooling. This phenomenon can be attributed to the higher air temperature flowing towards the ground, slower flow rate, and weaker convective heat exchange effect, resulting in a slower temperature decline at these points. Conversely, other measurement points situated at higher spatial positions experience lower temperatures and higher flow velocities during the influx of cold air, leading to a pronounced convective heat transfer effect and consequently faster cooling rates, with temperatures dropping below 5°C by the 18-min mark. Simultaneously, the relative humidity at measuring point 1-1 was relatively high, reaching 32%, due to the influence of human respiration during the setup of the data acquisition equipment. Once cooling commenced, the humidity at each measurement point increased significantly as the temperature rapidly decreased, exceeding 40% within 18 min due to the coupling effect of temperature and humidity.
Figure 6b illustrates the changes in temperature and humidity at each measuring point in Section 2 during a 60-min temperature control of the storage experimental platform. The data indicates that the temperature at each measuring point decreases significantly 18 min after cooling commences. However, due to the obstruction caused by the data acquisition equipment, the rate of temperature decreases at measurement points 2-1 and 2-4 is slightly slower than at the other points, although the overall temperature drop rates across all measurement points remain relatively consistent. Within 18 min, all points, except for 2-1 and 2-4, record temperatures below 5°C. Following this period, the temperature fluctuations at each measuring point are consistent with those observed in Section 1, exhibiting similar variation amplitudes. This synchronous behavior likely results from the distance of these points from the data acquisition equipment, which minimizes its influence. After four cycles of temperature fluctuation, the temperatures at each measuring point stabilize around 3°C to 4°C at the 60-min mark, with minimal differences between the points, indicating effective cooling.
Correspondingly, the initial humidity at each measuring point is approximately 25%. During the first 18 min of cooling, the humidity at all measurement points increases rapidly. However, the humidity at points 2-1 and 2-4 rises more slowly due to the coupling effect between temperature and humidity. The temperature at these points decreases more rapidly than at the other locations, resulting in a slower increase in humidity. By the 18-min mark, the humidity at all measuring points exceeds 40%. Following this period, the humidity at each point rises gradually due to minor temperature fluctuations, and overall, the humidity fluctuations remain minimal. After 60 min, the humidity at all measurement points slowly increases to between 45 and 50%.
3.1.2 Analysis of air temperature and humidity characteristics in the process of temperature and humidity co-control
As depicted in Figures 6c,d, the temperature and humidity change curves for each measurement point in both Section 1 and Section 2 are presented during the temperature and humidity coordinate control of the experimental platform. The initial temperature at each measuring point ranges from 16 to 19°C, and the initial humidity at each measuring point is approximately 30%. After 15 min of operation, the refrigeration system reduced the temperature of all measurement points to below 5°C, with humidity levels exceeding 75%. Each measurement point exhibited a temperature fluctuation pattern similar to that observed during temperature control alone, albeit with a notably weaker overall temperature decrease compared to a simple cooling process. This diminished temperature drop can be attributed to the elevated air humidity within the storage experimental platform, leading to an increase in the specific heat capacity of the air and subsequently reducing the amplitude of temperature fluctuations. Initially, each measurement point reached temperatures ranging from 3 to 5°C upon the initial operation of the refrigeration system. The introduction of humidified air at the inlet significantly influenced the heat exchange process within the platform, enhancing its efficiency.
Upon initiation of the cooling process, Figure 6c illustrates a rapid decrease in temperature across all measurement points. Notably, measurement points 1-4 and 1-3, positioned near the top of the platform in proximity to the air cooler, exhibit accelerated cooling due to enhanced heat exchange with the colder air. Conversely, the cooling rate is comparatively slower at other measurement points. Subsequently, activation of the humidifier leads to a swift increase in humidity levels at all measurement points. Particularly, measurement points 1-4, situated closer to the humidification port, experience a more rapid humidity increase, reaching a peak of 81%. Between 15 and 26 min, a temporary cessation of the refrigeration system causes a rise in temperature at all measurement points, consequently decelerating the rate of humidity increase. Measurement points 1-2 and 1-3, located farther from the humidification port, exhibit a slower rate of humidity increase compared to other measurement points. At 26 min, humidity levels exceeded 85% at all measurement points, with points 1-4 and 1-5 reaching 90%. Subsequently, the humidifier ceased operation, and the cooling system resumed, leading to condensation of water vapor and a rapid decline in humidity levels across all points. Following another pause of the cooling system, the temperature within the storage experimental platform gradually rose, resulting in a gradual decrease in humidity levels at all points due to the interplay of temperature and humidity. At 39 min, the humidifier initiated a new cycle of humidification, causing a subsequent increase in humidity levels at all points. By 56 min, the impact of cold air led to another decline in humidity levels at all points. Overall, following the initial humidification phase by the humidifier, humidity levels at each point generally remained between 85 and 90%.
After the initiation of the refrigeration process, Figure 6d illustrates a rapid decrease in temperature at each measuring point, with a cooling rate of approximately 1.0°C/min. Within 17 min, all measuring points fell below 6°C, entering a fluctuation state consistent with the temperature control process. Concurrently, as the humidification process commenced, there was a swift increase in humidity at each measuring point. Points 2-5 experienced a faster rise in humidity due to increased air flow, while points 2-1 exhibited a slower increase due to equipment obstruction. By the 27th minute, the humidity levels at all experiment points exceeded 80%, with points 2-5 reaching 95%. Subsequently, the humidifier ceased operation, and the refrigeration system resumed, causing condensation of water vapor due to the cold air, leading to a rapid drop in humidity at each measuring point. At the 32nd minute, the humidifier initiated a new round of humidification, resulting in a subsequent rise in humidity at each measuring point. By the 47th minute, the humidity levels decreased again at each point due to the influence of the cold air. At the 53rd minute, the humidifier recommenced operation, leading to a rise in humidity at each point. Following the initial humidification phase, the humidity levels at each point fluctuated around 80%, predominantly maintained between 85 and 90% most of the time, indicating an effective humidification process.
3.1.3 Analysis of air temperature and humidity uniformity
Given the proximity of Section 1 to the sensor of the monitoring system, its air-flow distribution significantly influences the analysis. Therefore, only the temperature and humidity variation coefficients of the temperature control process in Section 1 are examined.
Figure 7a shows the temperature variation coefficient curve of Section 1 at different initial temperatures (16°C and 21°C) during the temperature control process. When the initial temperature is 21°C, the coefficient of temperature variation remains consistently below 0.35%. However, it exhibits a phased fluctuation pattern: during the initial 0–6 min of cooling, there is a rapid increase in the coefficient of temperature variation from 0.16% to over 0.30% due to varying cooling rates at different measuring points. Subsequently, from 6 to 15 min, as the refrigeration equipment continues to operate, there is a slight fluctuation in the temperature variation coefficient, although the overall value remains high. Between 15 and 18 min, as the refrigeration process progresses, the temperatures at each point gradually converge, leading to a decline in the temperature variation coefficient. Following this, from 18 to 25 min, as the refrigeration equipment ceases operation and natural convection facilitates heat transfer, the temperatures at each point further converge, resulting in a continued decrease in the temperature variation coefficient.
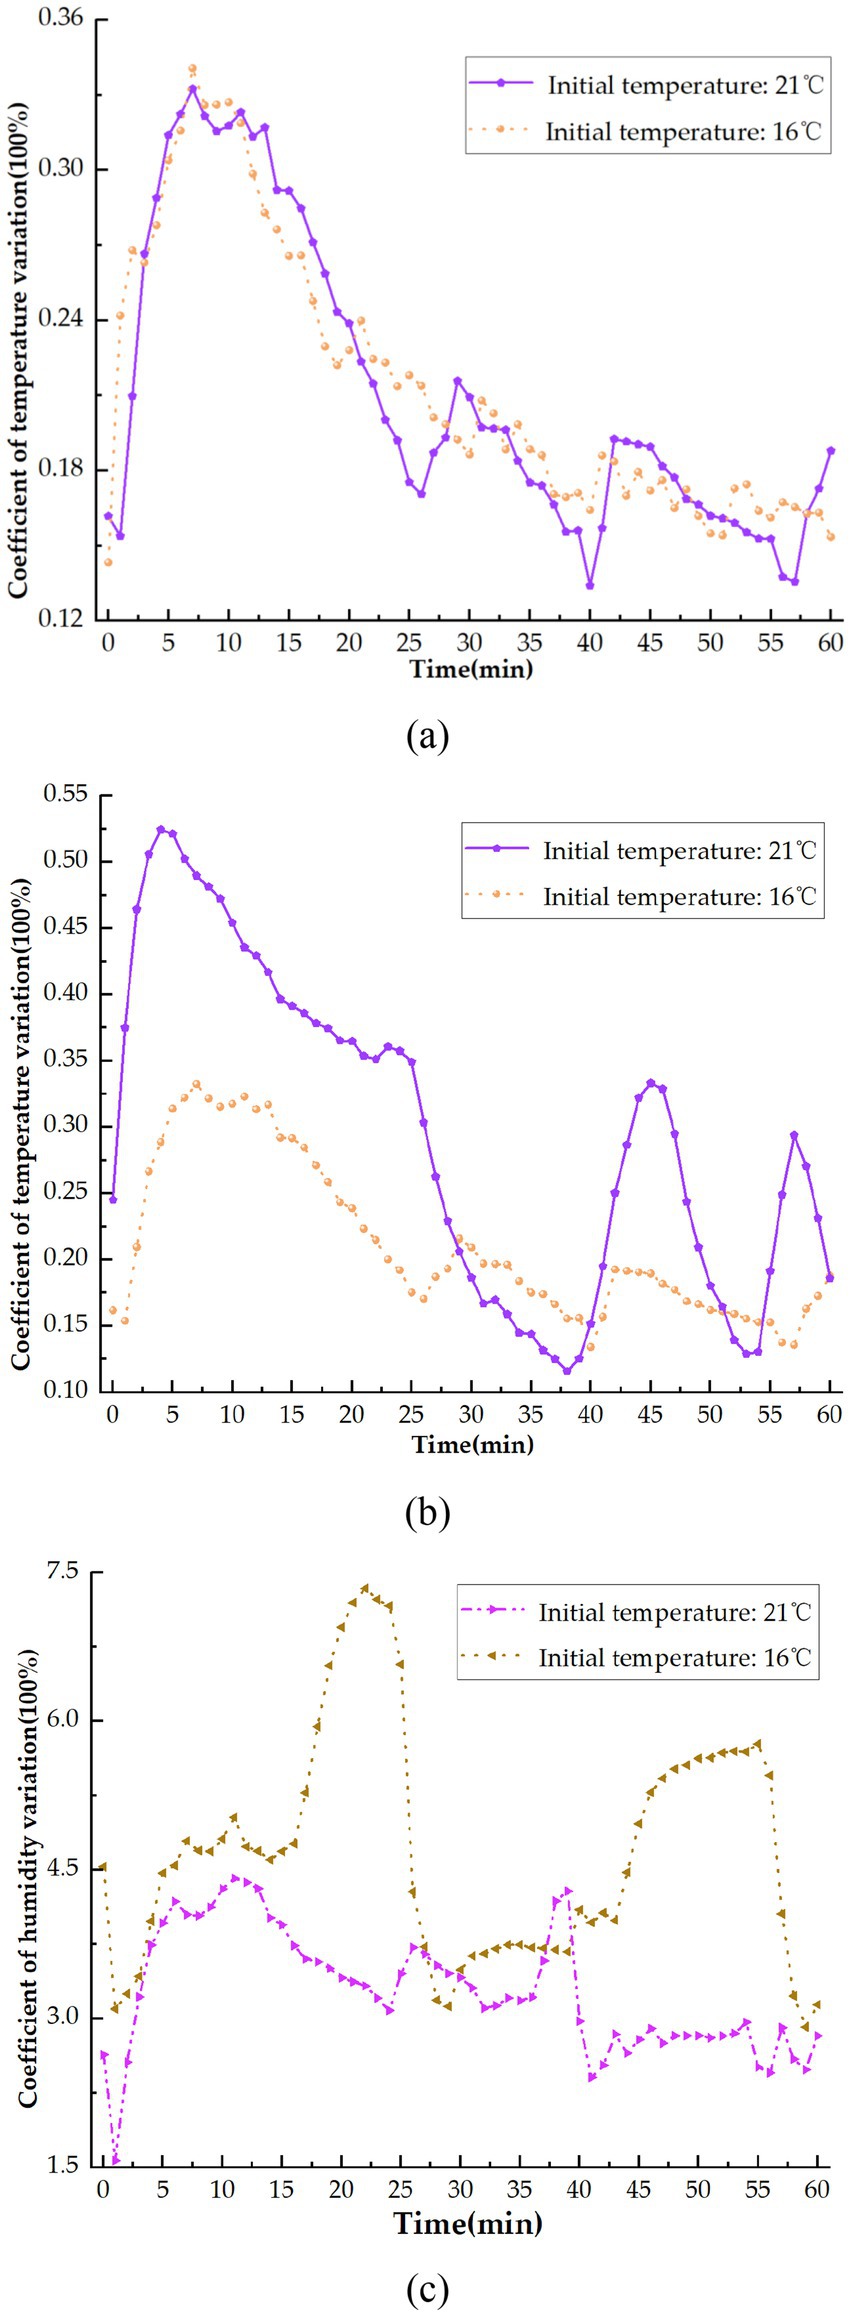
Figure 7. Temperature variation coefficient variation of 60 min temperature control or temperature and humidity co-control at different initial temperatures. (a) Coefficient of temperature variation of temperature control. (b) Coefficient of temperature variation of temperature and humidity co-control. (c) Coefficient of humidity variation of temperature and humidity co-control.
Lastly, from 25 to 60 min, the coefficient temperature variation fluctuates periodically due to the intermittent operation of the refrigeration equipment and natural convection heat transfer, with the value generally staying below 0.20%. During the temperature control process starting at 16°C, the temperature coefficient of variation remains below 0.35%. However, it peaks at 8 min, starts fluctuating slightly, and gradually decreases. By the 39th minute, it drops to around 0.16%, after which the rate of decline slows significantly. Subsequently, the temperature coefficient of variation stabilizes within a narrow range. Notably, after 60 min of temperature control at various initial temperatures, the temperature coefficient of variation remains consistently below 0.2% in Section 1. This indicates excellent air temperature uniformity within the storage experimental platform.
The coefficient of variation trend of temperature in Figure 7b mirrors that of Figure 7a, exhibiting an initial increase, followed by a decrease, and subsequent fluctuations over time. The maximum temperature coefficient of variation in both instances was initially below 1%, stabilizing at less than 0.4% post-initial refrigeration. In comparison, the coefficient of variation for relative humidity surpasses that of temperature, exceeding 3% with a peak surpassing 7%, as shown as Figure 7c. Notably, when the initial temperature is 21°C, significant fluctuations in relative humidity coefficient of variation occur at 2–26 min and 26–56 min due to elevated external temperatures and the concurrent operation of the air cooler and humidifier, aligning with air temperature and humidity patterns. Conversely, at an initial temperature of 16°C, the relative humidity coefficient of variation remains relatively stable, hovering between 3 and 5% after 8 min, reflecting minimal changes in relative humidity. Overall, the relative humidity coefficient of variation aligns with findings in literature (Wang et al., 2023; Guo et al., 2019), underscoring the effective humidification uniformity of the experimental setup.
3.1.4 Analysis of air humidity ratio
The humidification process of the humidifier impacts on the moisture content of the air. Therefore, the analysis focuses solely on the moisture content of the air in Sections 1 and 2 during the temperature control process. Figure 8 illustrates the variation in air humidity ratio across different initial temperatures and cross sections during the temperature control process. Overall, the trend of humidity ratio in the air at each point aligns with the temperature trend.
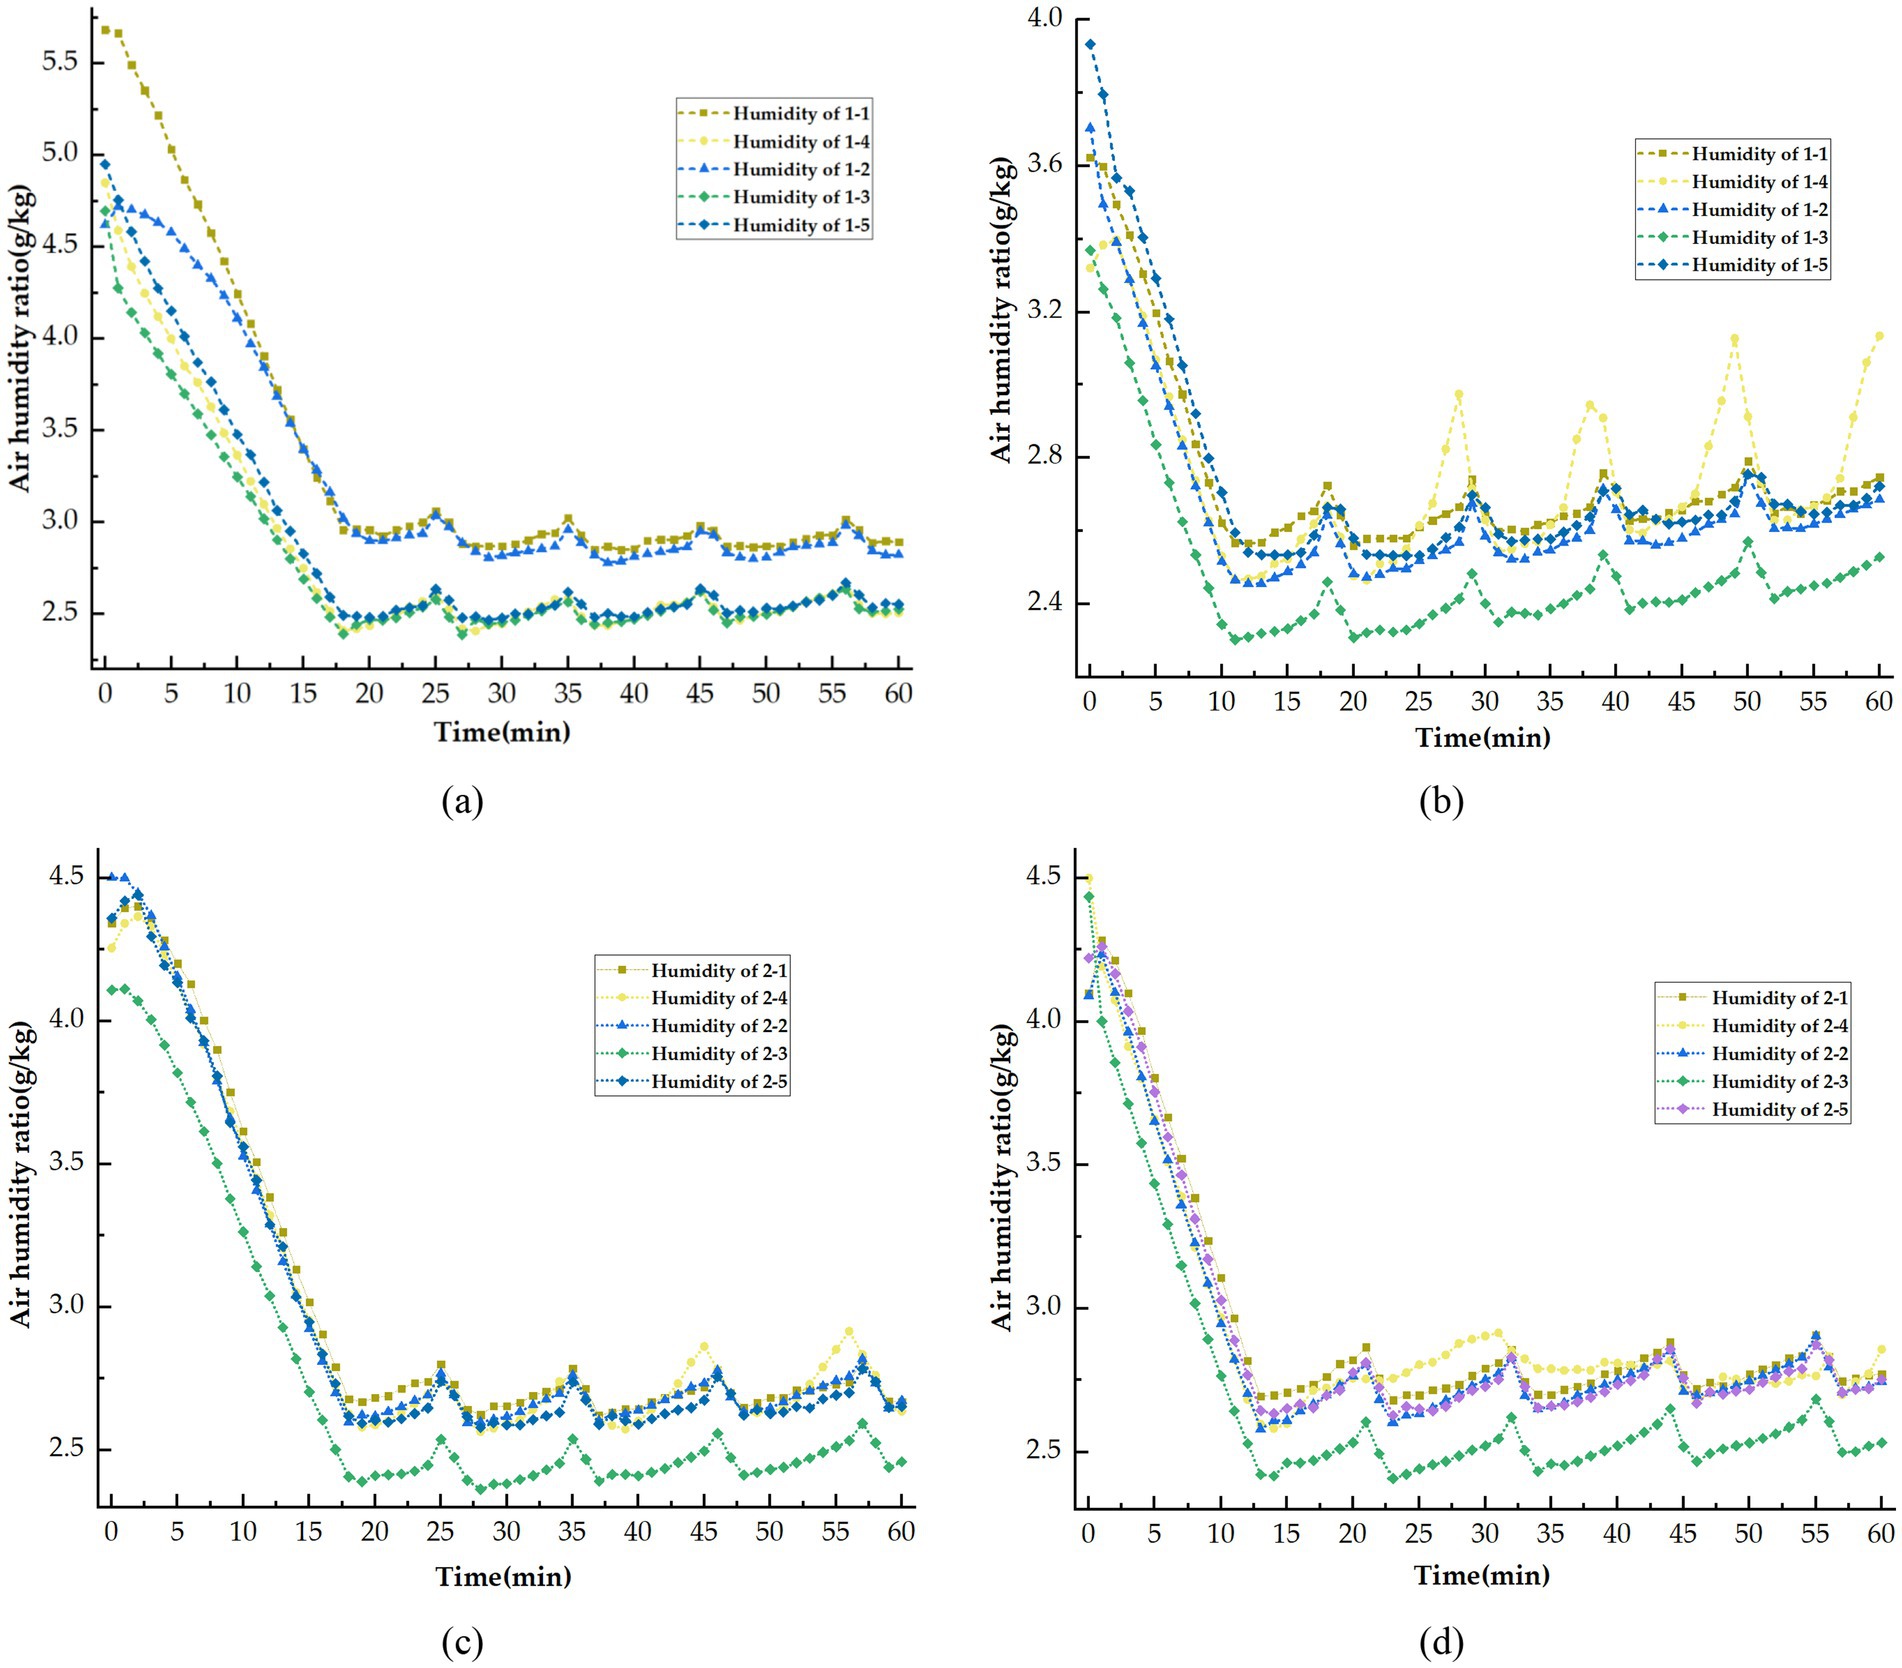
Figure 8. Change curve of air humidity ratio at each measurement point. (a) Initial temperature: 21°C, Section: 1. (b) Initial temperature: 16°C, Section: 1. (c) Initial temperature: 21°C, Section: 2. (d) Initial temperature: 16°C, Section: 2.
Upon cooling initiation, hot air enters the return air outlet of the air cooler and contacts the cooling pipe, leading to pre-condensation of water vapor and subsequent water adherence to the air cooler coil. This process results in a rapid decrease in air humidity ratio at each measurement point, as depicted in Figure 8a. Subsequently, after 18 min, as air temperature naturally rises, water solubility in the air increases, causing some water to evaporate and increase moisture content. Upon the resumption of the fan operation for cooling, some water vapor condensed, further decreasing air moisture content. Numerically, between 18 and 60 min, the fluctuation amplitude of air humidity ratio at all measurement points remains below 0.2 g/kg. The natural recovery period of air humidity ratio aligns with the temperature recovery cycle, approximately 10 min, indicating a natural recovery rate of humidity ratio at each point below 0.02 g/(kg min).
As depicted in Figure 8b, the decrease in air moisture content halts 10 min after cooling due to the low initial temperature, transitioning into a cyclic fluctuation phase. However, the alteration in air humidity ratio differs from that illustrated in Figure 8a. Following the onset of the fluctuation phase, a gradual increase in air humidity ratio is observed at all points, with particularly pronounced fluctuations at measurement point 1-1. The impact of the low initial temperature results in heightened influence from the heat source of the data acquisition equipment, leading to the evaporation and ascent of water under heat. Generally, the air’s moisture content across all points remains within the range of 2.25 to 2.75 g/kg, with the moisture content exhibiting subtle fluctuations, except notably at measurement points 1-4.
The air humidity ratio curve changes in Section 2 at initial temperatures of 21°C and 16°C are depicted in Figures 8c,d, respectively. Following the initial cooling phase, the air humidity ratio exhibits slight fluctuations within a limited range, with fluctuation amplitudes consistently below 0.2 g/kg.
Additionally, there is a subtle increasing trend in the rising phase of humidity ratio over time. Specifically, at 21°C, this period extends to 8 min, whereas at 16°C, it extends to 9 min. The growth rates of humidity ratio are below 0.025 g/(kg min) and 0.022 g/(kg min) for initial temperatures of 21°C and 16°C, respectively. These observations indicate minimal variation in air humidity ratio within the experimental platform, with fluctuations primarily attributed to temperature increases and chiller operation.
3.2 Numerical simulation analysis of temperature and humidity regulation in potato storage environment
3.2.1 Validity verification of numerical method
To assess the numerical model’s efficacy, a steady-state simulation was conducted on the no-load experimental platform model, with an inlet wind speed of 6 m/s and an inlet temperature of 3°C. Due to the proximity of cross Section 1 to the data acquisition device, which significantly influences it through heating and flow obstruction, data from this section were cooled for 60 min after data from cross Section 2, which is less affected, were selected for comparison. Table 2 presents a comparison between actual measured temperatures and simulated values after 60 min of refrigeration at an initial temperature of 21°C. The RMSE and ARD defined by Equations 8, 9, for points 2-1 to 2-5 were calculated. Results indicated that the maximum RMSE was 0.8°C, and the maximum ARD was 19.5%. The above values appear at the point 2-1. Considering the influence of the data acquisition equipment, the model’s simulation results are deemed more accurate.
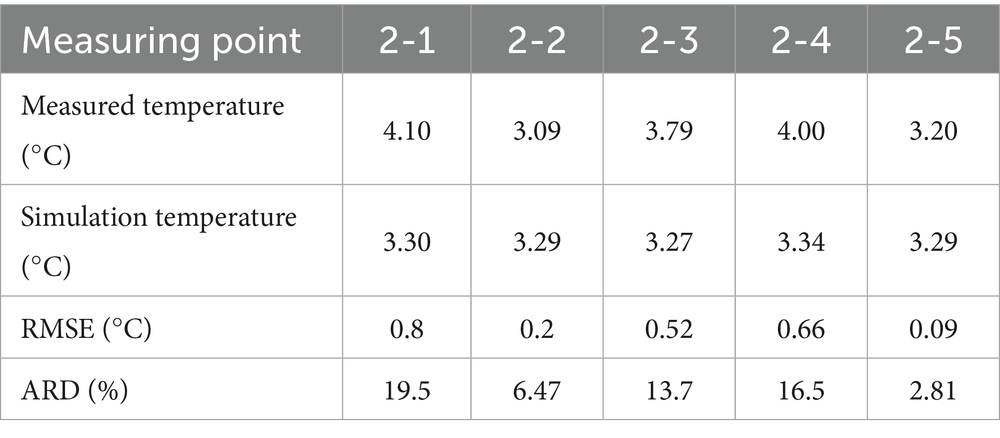
Table 2. Comparison of temperature simulated and measured values in Section 2.
3.2.2 Validity verification of numerical model of potato storage
To validate the precision of the potato storage numerical model, an equivalent-scale numerical model was constructed based on the experimental platform layout detailed in Section 2.4. Steady-state simulation calculations were conducted to regulate the environmental temperature and humidity within the model, using identical boundary conditions as outlined in Section 2.4. During the experiment, the equipment operates until the temperature and humidity data recorded by the sensor stabilizes and the fluctuation amplitude decreases significantly. Calculating the RMSE and ARD by comparing the experimental results with those from numerical simulations. Table 3 presents the measured and simulated temperature and humidity values at each experiment point, along with the corresponding RMSE and ARD. The data reveals a minor disparity between the simulated and measured outdoor air temperatures. Conversely, the air temperature within the potato pile consistently registers lower than the measured values. This discrepancy can be attributed to the hindrance of airflow by the woven bag during storage, resulting in suboptimal temperature regulation. Notably, the maximum RMSE of 1.1°C occurs at measurement point 6.
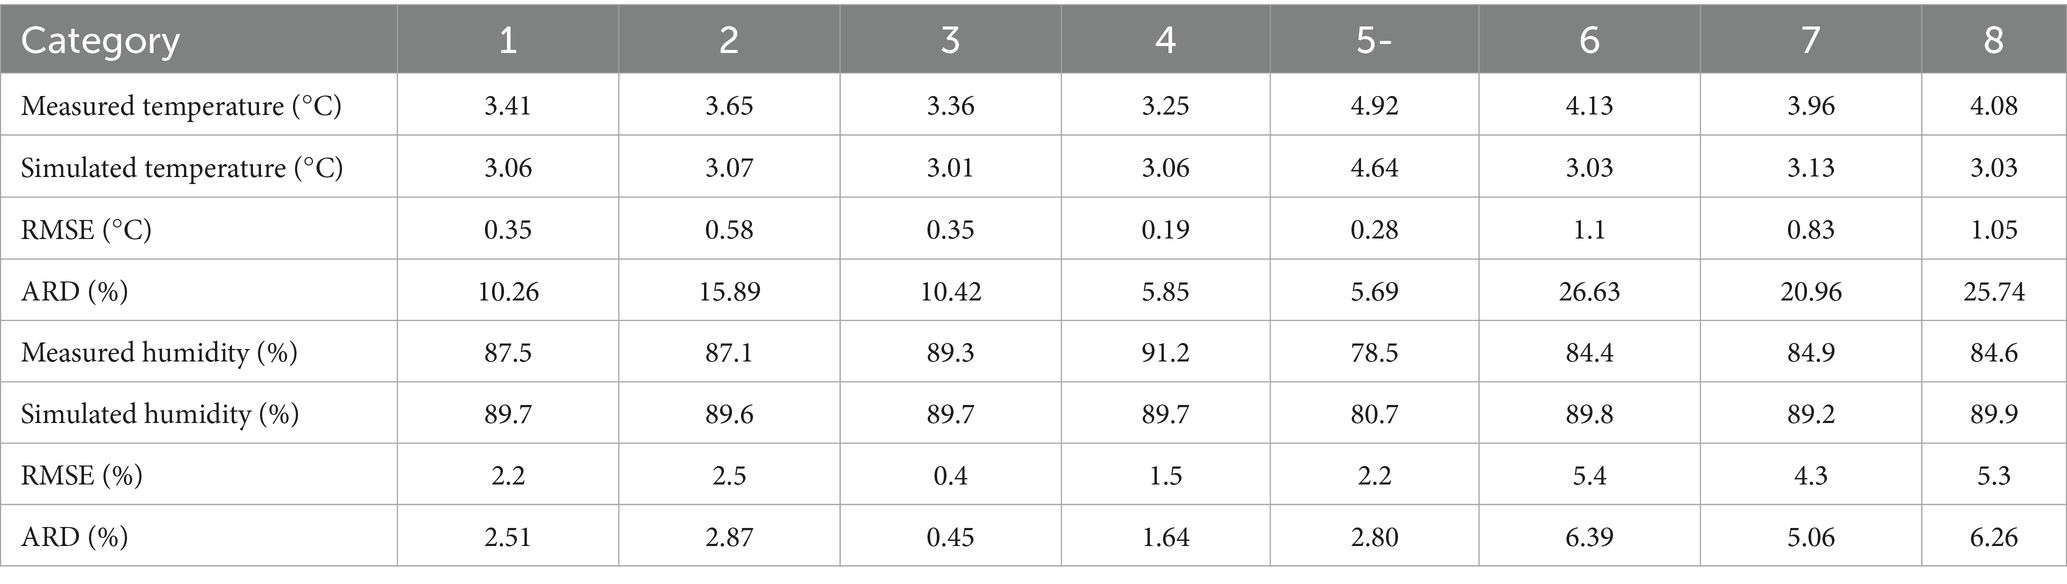
Table 3. Comparison between the measured temperature and humidity and the simulated temperature and humidity.
The modeled external air humidity of the potato pile consistently exceeds the measured values, with a maximum RMSE of 5.4% (and a maximum ARD of 6.39%) observed at measurement point 6. Similarly, the simulated air humidity within the potato pile surpasses the measured values, with higher RMSE and ARD values at each measurement point compared to the external air. This discrepancy can be attributed to the elevated moisture holding capacity of the air, impeded by the woven bags hindering water vapor transmission.
In summary, the error between the simulated and measured temperature and humidity values at each point was minimal, indicating that the numerical simulation method used for setting the internal heat source produces more accurate results. This model will be employed to study the flow field and the temperature and humidity fields of the potato storage environment under different operating conditions, and to analyze the optimal conditions for regulating the temperature and humidity in the potato storage environment.
3.3 Influence of various factors on temperature field, humidity field and flow field of potato storage environment
The air supply temperature, humidity, and wind velocity of the cooler are critical factors influencing the potato storage environment. When other conditions remain constant, varying the air supply temperature, humidity, and wind velocity allows for an exploration of how these different factors affect the temperature field, humidity field, and flow field within the potato storage environment. By adjusting the inverter, the fan can deliver air at varying velocity. Additionally, modifying the temperature setting range and the degree of closure of the humidification device valve enables changes to the air supply temperature and humidity from the air cooler.
3.3.1 Effects of air supply temperature on environmental regulation
Temperature is the primary factor influencing the storage effectiveness of potatoes. By setting the air supply temperature at 2°C, 3°C, 4°C, and 5°C, the impact of varying temperatures on the storage conditions can be compared and analyzed.
Figure 9 illustrates the distribution characteristics of potato storage environmental factors at the center of the potato pile, specifically at Z = 2.5 m and X = 0 m, under varying air supply temperatures. Overall, the temperature distribution within the experimental platform can be divided into two regions based on different air supply temperatures. Region 1 represents the relatively cooler air domain, which encompasses most of the potato pile area. In this region, the temperature distribution is relatively uniform, and the temperature regulation is effective. Region 2, on the other hand, is situated above the warmer potato piles, where the temperature decreases rapidly with an increasing distance from the center, exhibiting a distinct temperature gradient that extends into the air domain. This phenomenon occurs due to the obstruction created by the potato piles and the presence of internal heat sources, which hinder air circulation above the piles, resulting in lower airflow speeds and consequently poor cooling effects.
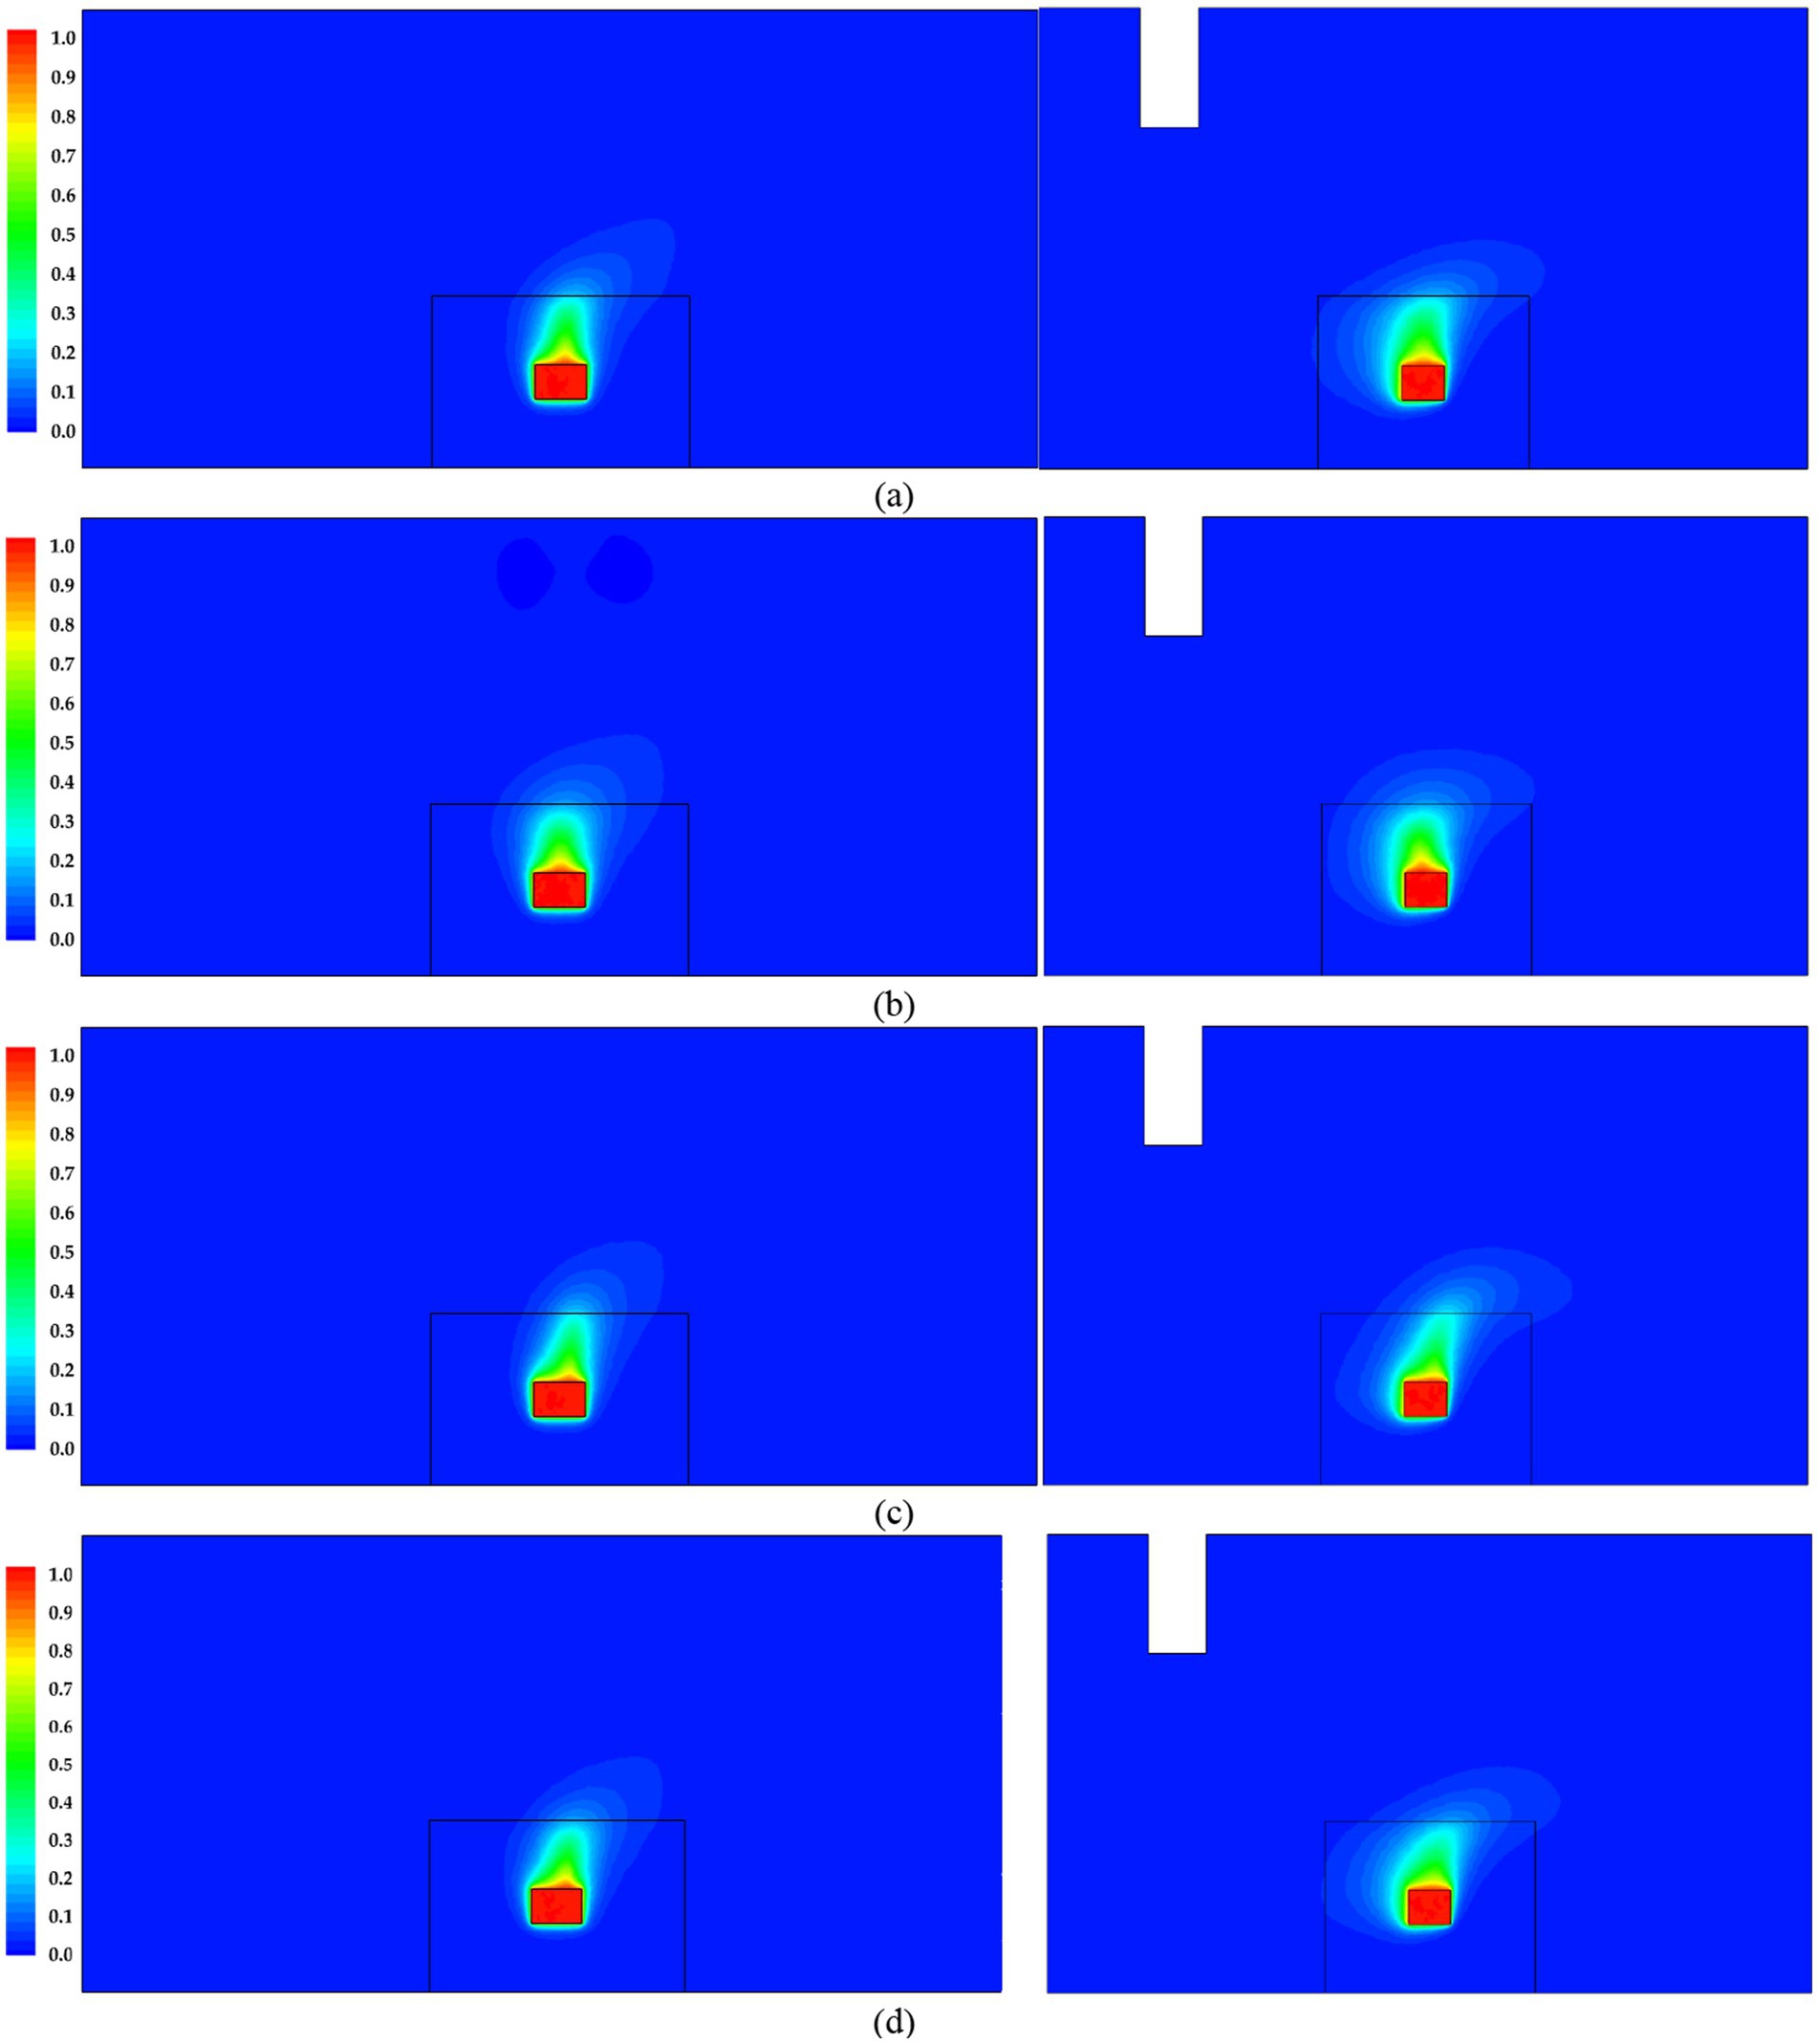
Figure 9. Temperature change of different supply air temperature conditions. (a) Supply air temperature: 2°C. (b) Supply air temperature: 3°C. (c) Supply air temperature: 4°C. (d) Supply air temperature: 5°C.
At an air supply temperature of 2°C, the temperature in Region 1 ranges from 2.15°C to 2.48°C, which is relatively low and poses a risk of frostbite to the potatoes, making it unsuitable for storage. In Region 2, the peripheral temperature varies between 2.67°C and 3.83°C, while the central temperature ranges from 4.12°C to 5.50°C. When the air supply temperature increases to 3°C, the temperature in Region 1 increases to between 3.13°C and 3.56°C. In Region 2, the peripheral temperature ranges from 3.71°C to 4.99°C, and the central temperature varies from 5.21°C to 5.92°C. Notably, the area within the 3°C to 5°C range has expanded significantly. At an air supply temperature of 4°C, the temperature in Region 1 reaches between 4.12°C and 4.37°C, while in Region 2, the peripheral temperature ranges from 4.61°C to 5.51°C, and the central temperature rises to between 5.67°C and 6.37°C, indicating an increase in high-temperature areas. At an air supply temperature of 5°C, the temperature in Region 1 ranges from 5.10°C to 5.43°C, with the peripheral temperature in Region 2 between 5.43°C and 6.27°C, and the central temperature reaching 6.40°C to 6.95°C. The expansion of high-temperature regions correlates with an increase in potato respiration intensity, which is detrimental to storage. Overall, the most suitable potato storage environment occurs at an air supply temperature of 3°C, aligning with the experimental results. Therefore, for practical adjustments in storage conditions, an air supply temperature of 3°C is recommended. This study will continue to explore conditions based on this 3°C air supply temperature.
3.3.2 Effects of air supply velocity on environmental regulation
The air supply velocity of the chiller significantly influences the environmental flow field. Different air supply velocities primarily affect the cooling rate; in a steady-state scenario, they also impact the distribution characteristics of both the flow and temperature fields. By adjusting the input frequency between 0 and 50 Hz, the chiller’s conveying speed can be modified relatively smoothly. While maintaining constant air supply humidity and temperature, the chiller’s conveying speed can be set to 3 m/s, 4 m/s, 5 m/s, and 6 m/s, respectively, to investigate the effect of air supply velocity on the flow fields within the potato storage environment.
Figure 10 illustrates the velocity distribution at section X = 0 m and Z = 2.5 m under various air supply velocities. The figure reveals a zigzag airflow pattern, with noticeable differences observed primarily above the potato pile. As the air supply velocity increases, the air velocity within the potato stack gradually rises, with a more pronounced increase observed below the potato pile. At air supply velocity of 3 m/s and 4 m/s, some air flows from the cold air blower and enters the potato pile from the ground. However, at the air supply velocity of 5 m/s and 6 m/s, this portion of the air exits away from the blower. The variation in flow rates above the potato pile can be attributed to changes in air supply velocity from the cold air blower, resulting in different pressure levels above the pile. When the air supply velocity is low, the airflow above the potato pile is slower, leading to similar pressure levels both inside and outside the pile, which allows air to pass through by inertia. Conversely, at higher air supply velocity, the airflow above the potato pile increases significantly, while the internal airflow does not increase proportionately. This discrepancy creates a larger pressure difference between the potato pile and its surroundings, resulting in air inside the pile flowing outwards, away from the blower. At an air supply velocity of 3 m/s, a small backflow occurs in the middle of the south side. When the air supply velocity increases to 4–6 m/s, a small backflow is observed in the lower part of the north side. However, at an air supply velocity of 5 m/s, no significant backflow is evident. From the perspective of energy utilization, the optimal air supply velocity is determined to be 5 m/s.
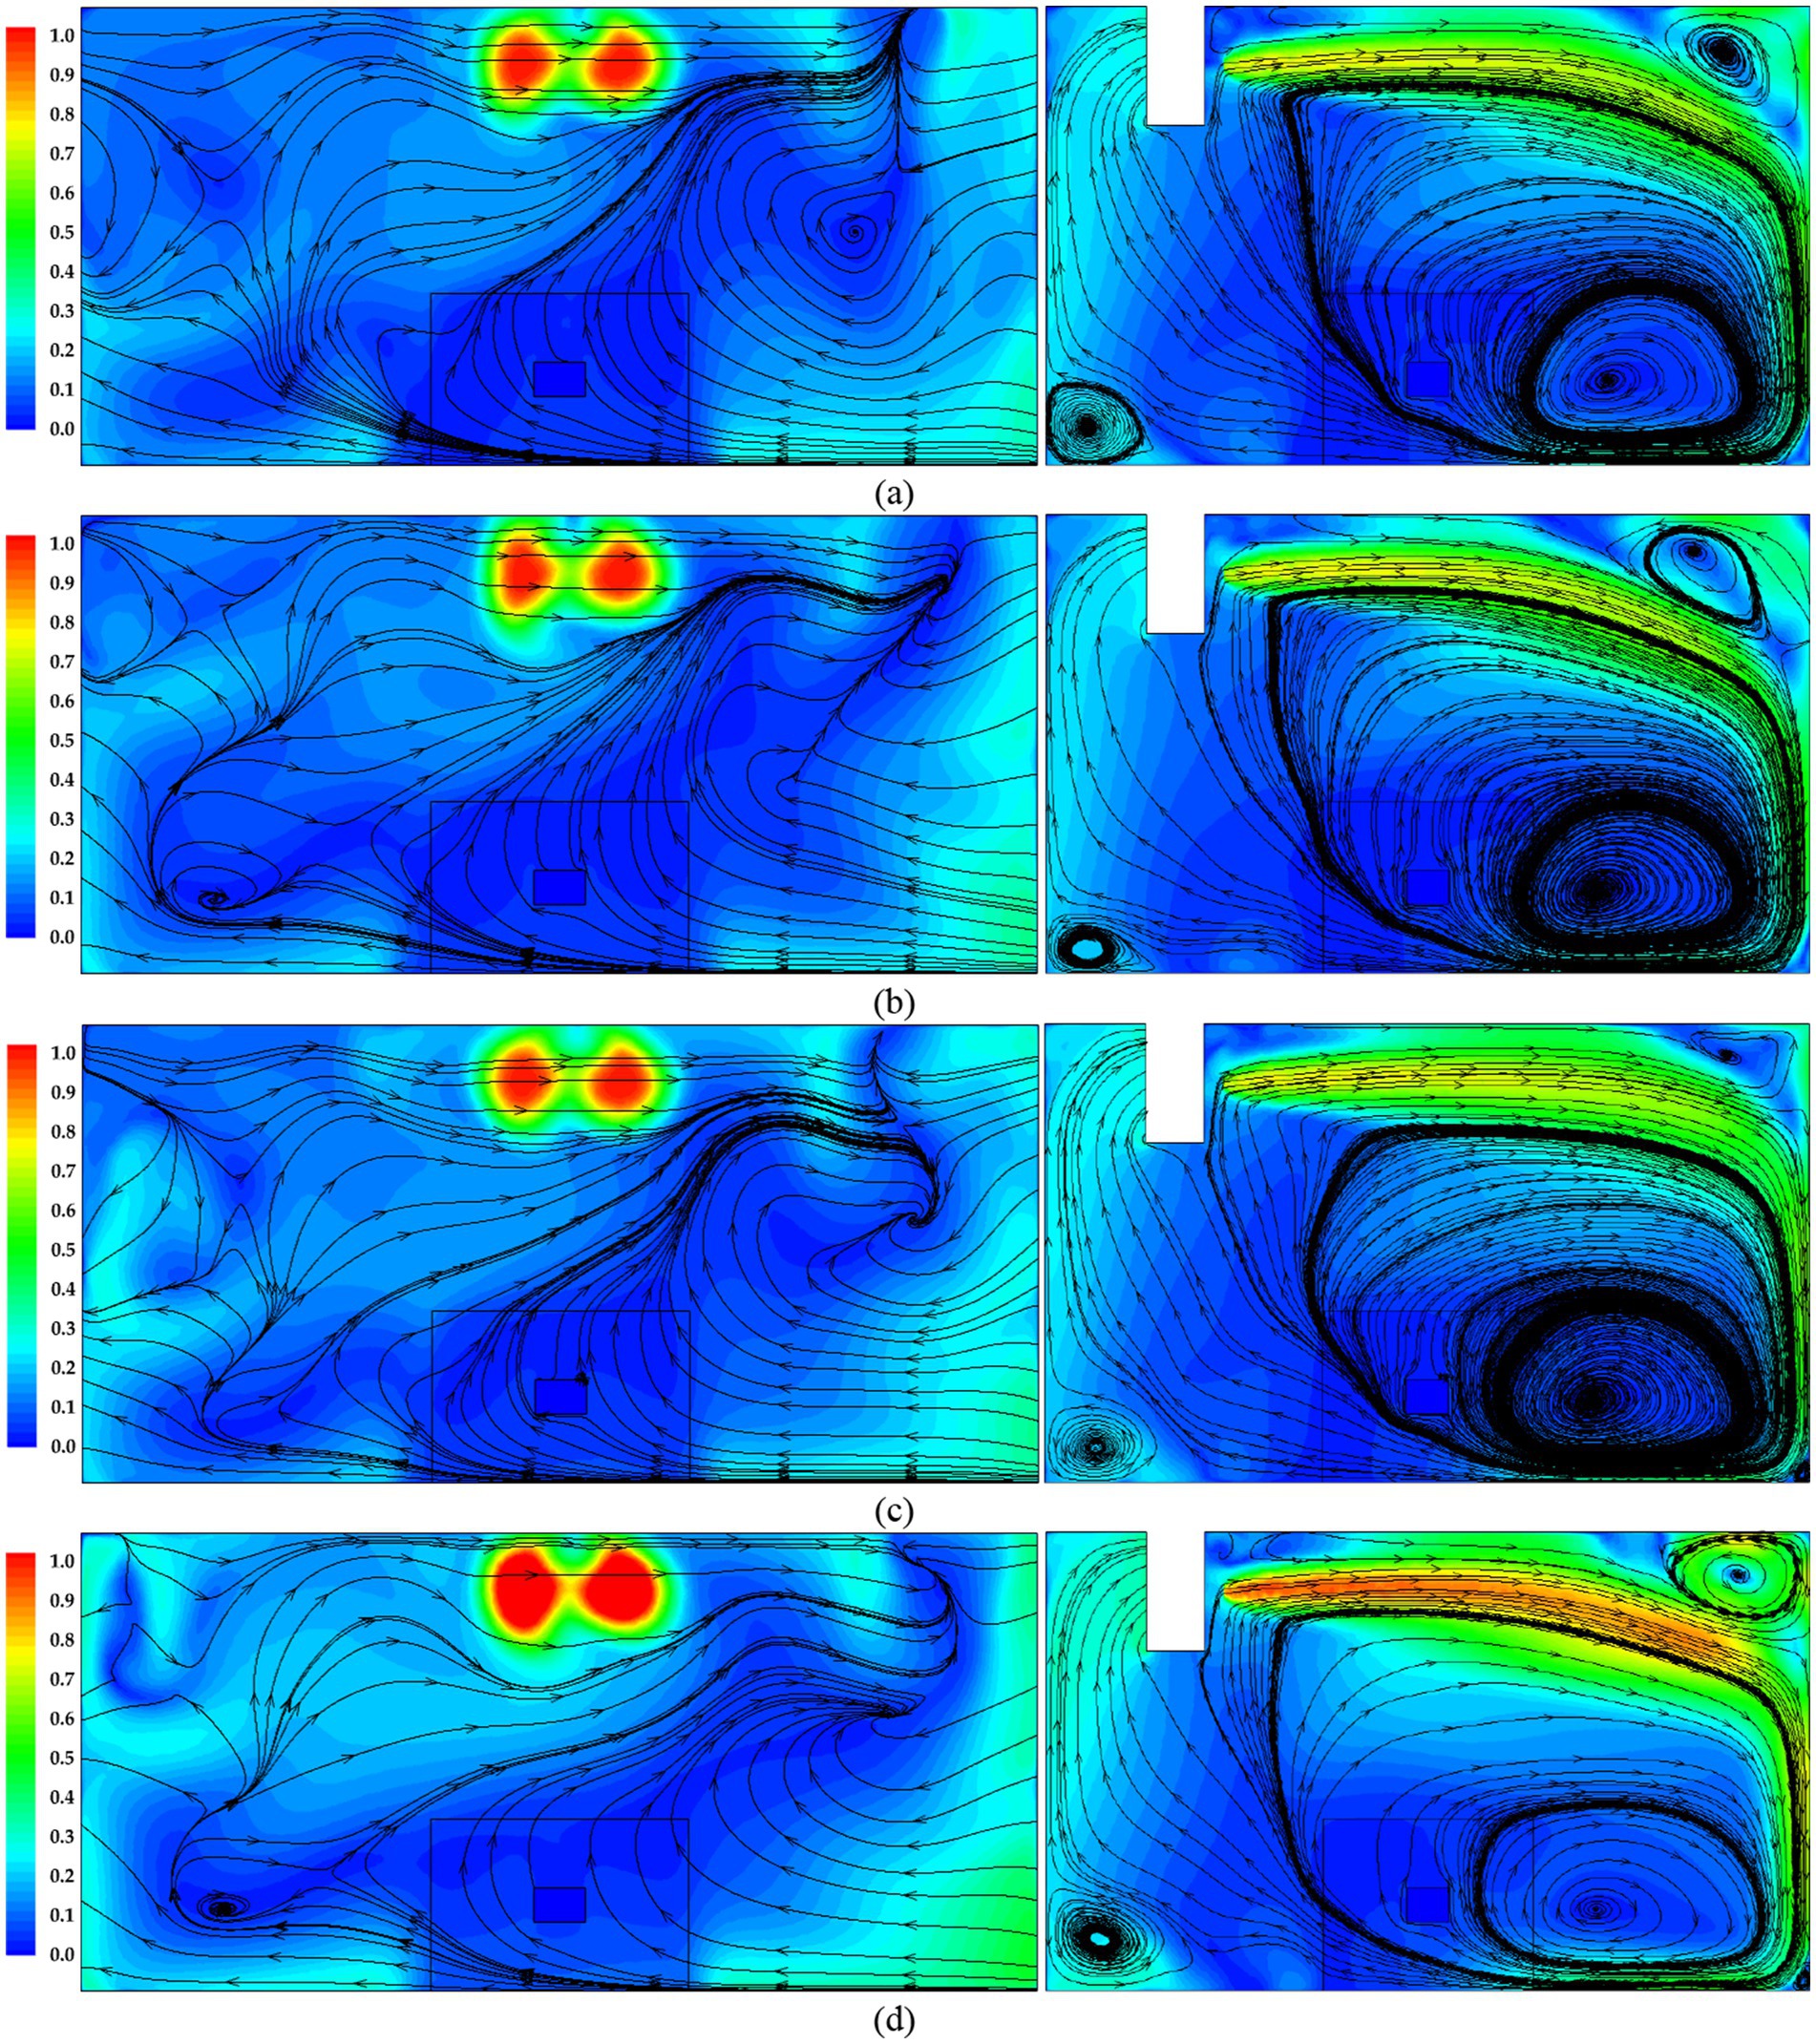
Figure 10. Velocity change of different air supply velocity conditions. (a) Supply air velocity: 3 m/s. (b) Supply air velocity: 4 m/s. (c) Supply air velocity: 5 m/s. (d) Supply air velocity: 6 m/s.
Figure 11 illustrates the temperature distribution at the Z = 2.5 m and X = 0 m sections of the experimental platform under varying wind velocity. It is evident that, at the Z = 2.5 m section, the temperature distribution characteristics across different wind velocities are generally similar, with most air domains and potato regions exhibiting low temperatures, while the area above the potato pile shows higher temperatures. However, the distribution pattern of the high-temperature region above the potato pile varies at air supply velocity of 3–4 m/s, the high-temperature region tilts towards the fan side, whereas at velocity of 5–6 m/s, it tilts away from the fan direction, corresponding to the velocity distribution at those positions. Additionally, as the air supply velocity increases, the area of the high-temperature zone in the center of the potato pile gradually decreases. In the X = 0 m section, the high-temperature areas above the potato pile lean towards the south, and the area extending into the air domain diminishes with increased air supply velocity and enhanced heat transfer rates. At air supply speeds of 3 m/s, 4 m/s, 5 m/s, and 6 m/s, the average temperatures of the potato pile were 3.23°C, 3.21°C, 3.19°C, and 3.20°C, respectively. The average temperature of the potato pile initially decreases and then increases with increasing air supply velocity, reaching its minimum at 5 m/s. This indicates that the spatial extent of high temperatures within the potato pile is minimized at this air supply velocity. Considering the velocity profiles of the sections, there is no significant distinction between the actual cooling rates at 5 m/s and 6 m/s. Consequently, an air supply velocity of 5 m/s is deemed appropriate for regulating the temperature of the potato storage environment.
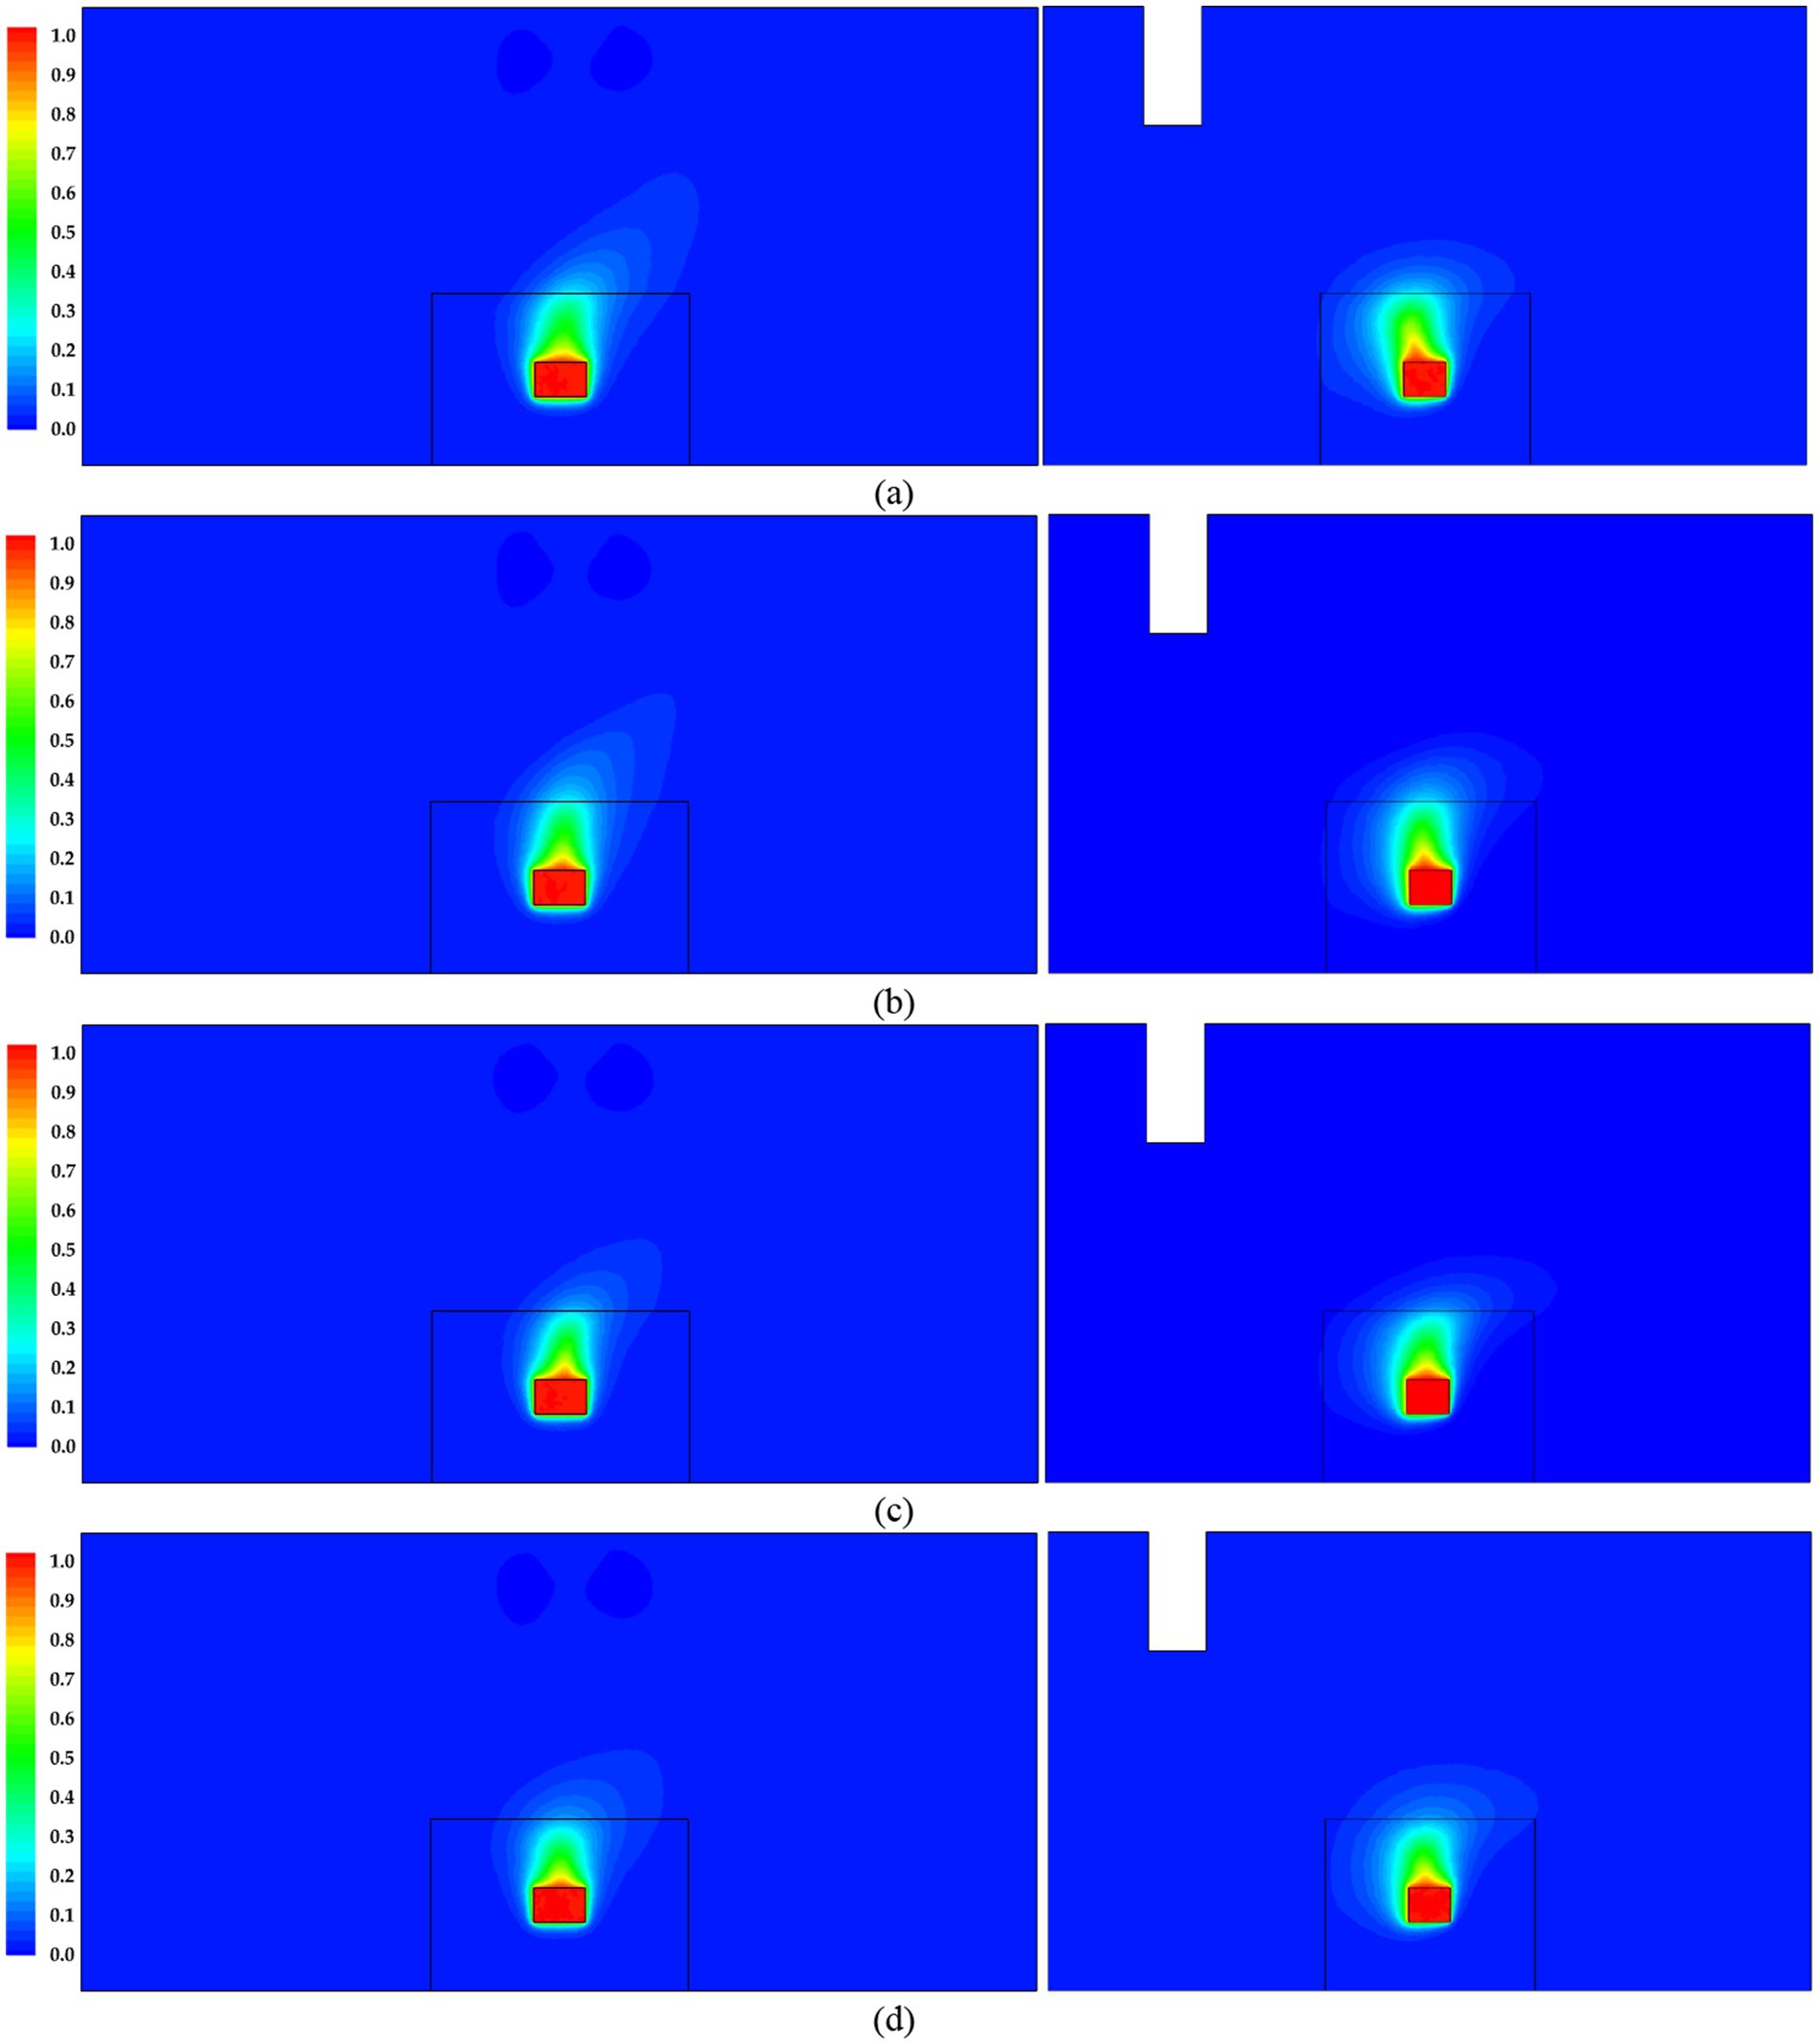
Figure 11. Temperature change of different air supply velocity conditions. (a) Supply air velocity: 3 m/s. (b) Supply air velocity: 4 m/s. (c) Supply air velocity: 5 m/s. (d) Supply air velocity: 6 m/s.
3.3.3 Effects of air supply humidity on environmental regulation
Appropriate humidity distribution plays a crucial role in maintaining potato moisture levels. The humidity of the air supplied by the chiller significantly impacts the storage environment humidity for potatoes. Altering the air supply humidity directly affects the humidity distribution in the storage environment. Thus, this study will investigate the impact of varying air supply humidity levels (86, 88, 90, and 92%) while keeping air supply speed and temperature constant on the humidity field within the potato storage environment.
Figure 12 illustrates the relative humidity distribution at section Z = 2.5 m and X = 0 m under different fan air supply humidity levels, with an air supply velocity of 5 m/s and a temperature of 3°C. It can be observed that the relative humidity distribution remains consistent across different cross-sections and varying fan air supply humidity levels; however, the humidity is slightly lower above the potato pile because of potato respiration heat. Under varying operational conditions, the humidity distribution in the experimental platform can be broadly categorized into two areas: Section 1, which encompasses the air volume with high relative humidity predominantly in the potato stacking zones, and Section 2, located above the potato pile, where relative humidity is low. In this second section, humidity decreases rapidly with increasing distance from the center of the potato pile, exhibiting a distinct humidity gradient. Under conditions of 86% relative humidity, the humidity in Section 1 ranges from 82.71 to 86.35%, while in Section 2, the peripheral humidity ranges from 75.44 to 79.08%, and the central humidity ranges from 60.90 to 75.44%. Overall, the environmental humidity is low, leading to significant moisture loss in the potatoes, which is detrimental to their storage. At 88% relative humidity, Section 1’s humidity increases to between 84.52 and 88.36%. In Section 2, the peripheral humidity falls between 76.85 and 80.69%, while the central section ranges from 61.51 to 76.85%. When the air humidity reaches 90%, the humidity in Section 1 is optimal, ranging from 85.16 to 90.36%, making it suitable for potato storage. In Section 2, the peripheral humidity is between 75.66 and 80.27%, while the central humidity ranges from 63.35 to 71.31%. However, at 92% relative humidity, the humidity in Section 1 rises to between 88.62 and 92.36%, which increases the risk of potato rot. In Section 2, the peripheral humidity is between 63.22 and 81.85%, while the central humidity ranges from 62.47 to 77.42%. Considering the effects of humidification, it is crucial to note that during high humidity conditions, some condensation may occur. Therefore, maintaining an air supply humidity of 90% is most appropriate for regulating the environmental humidity.
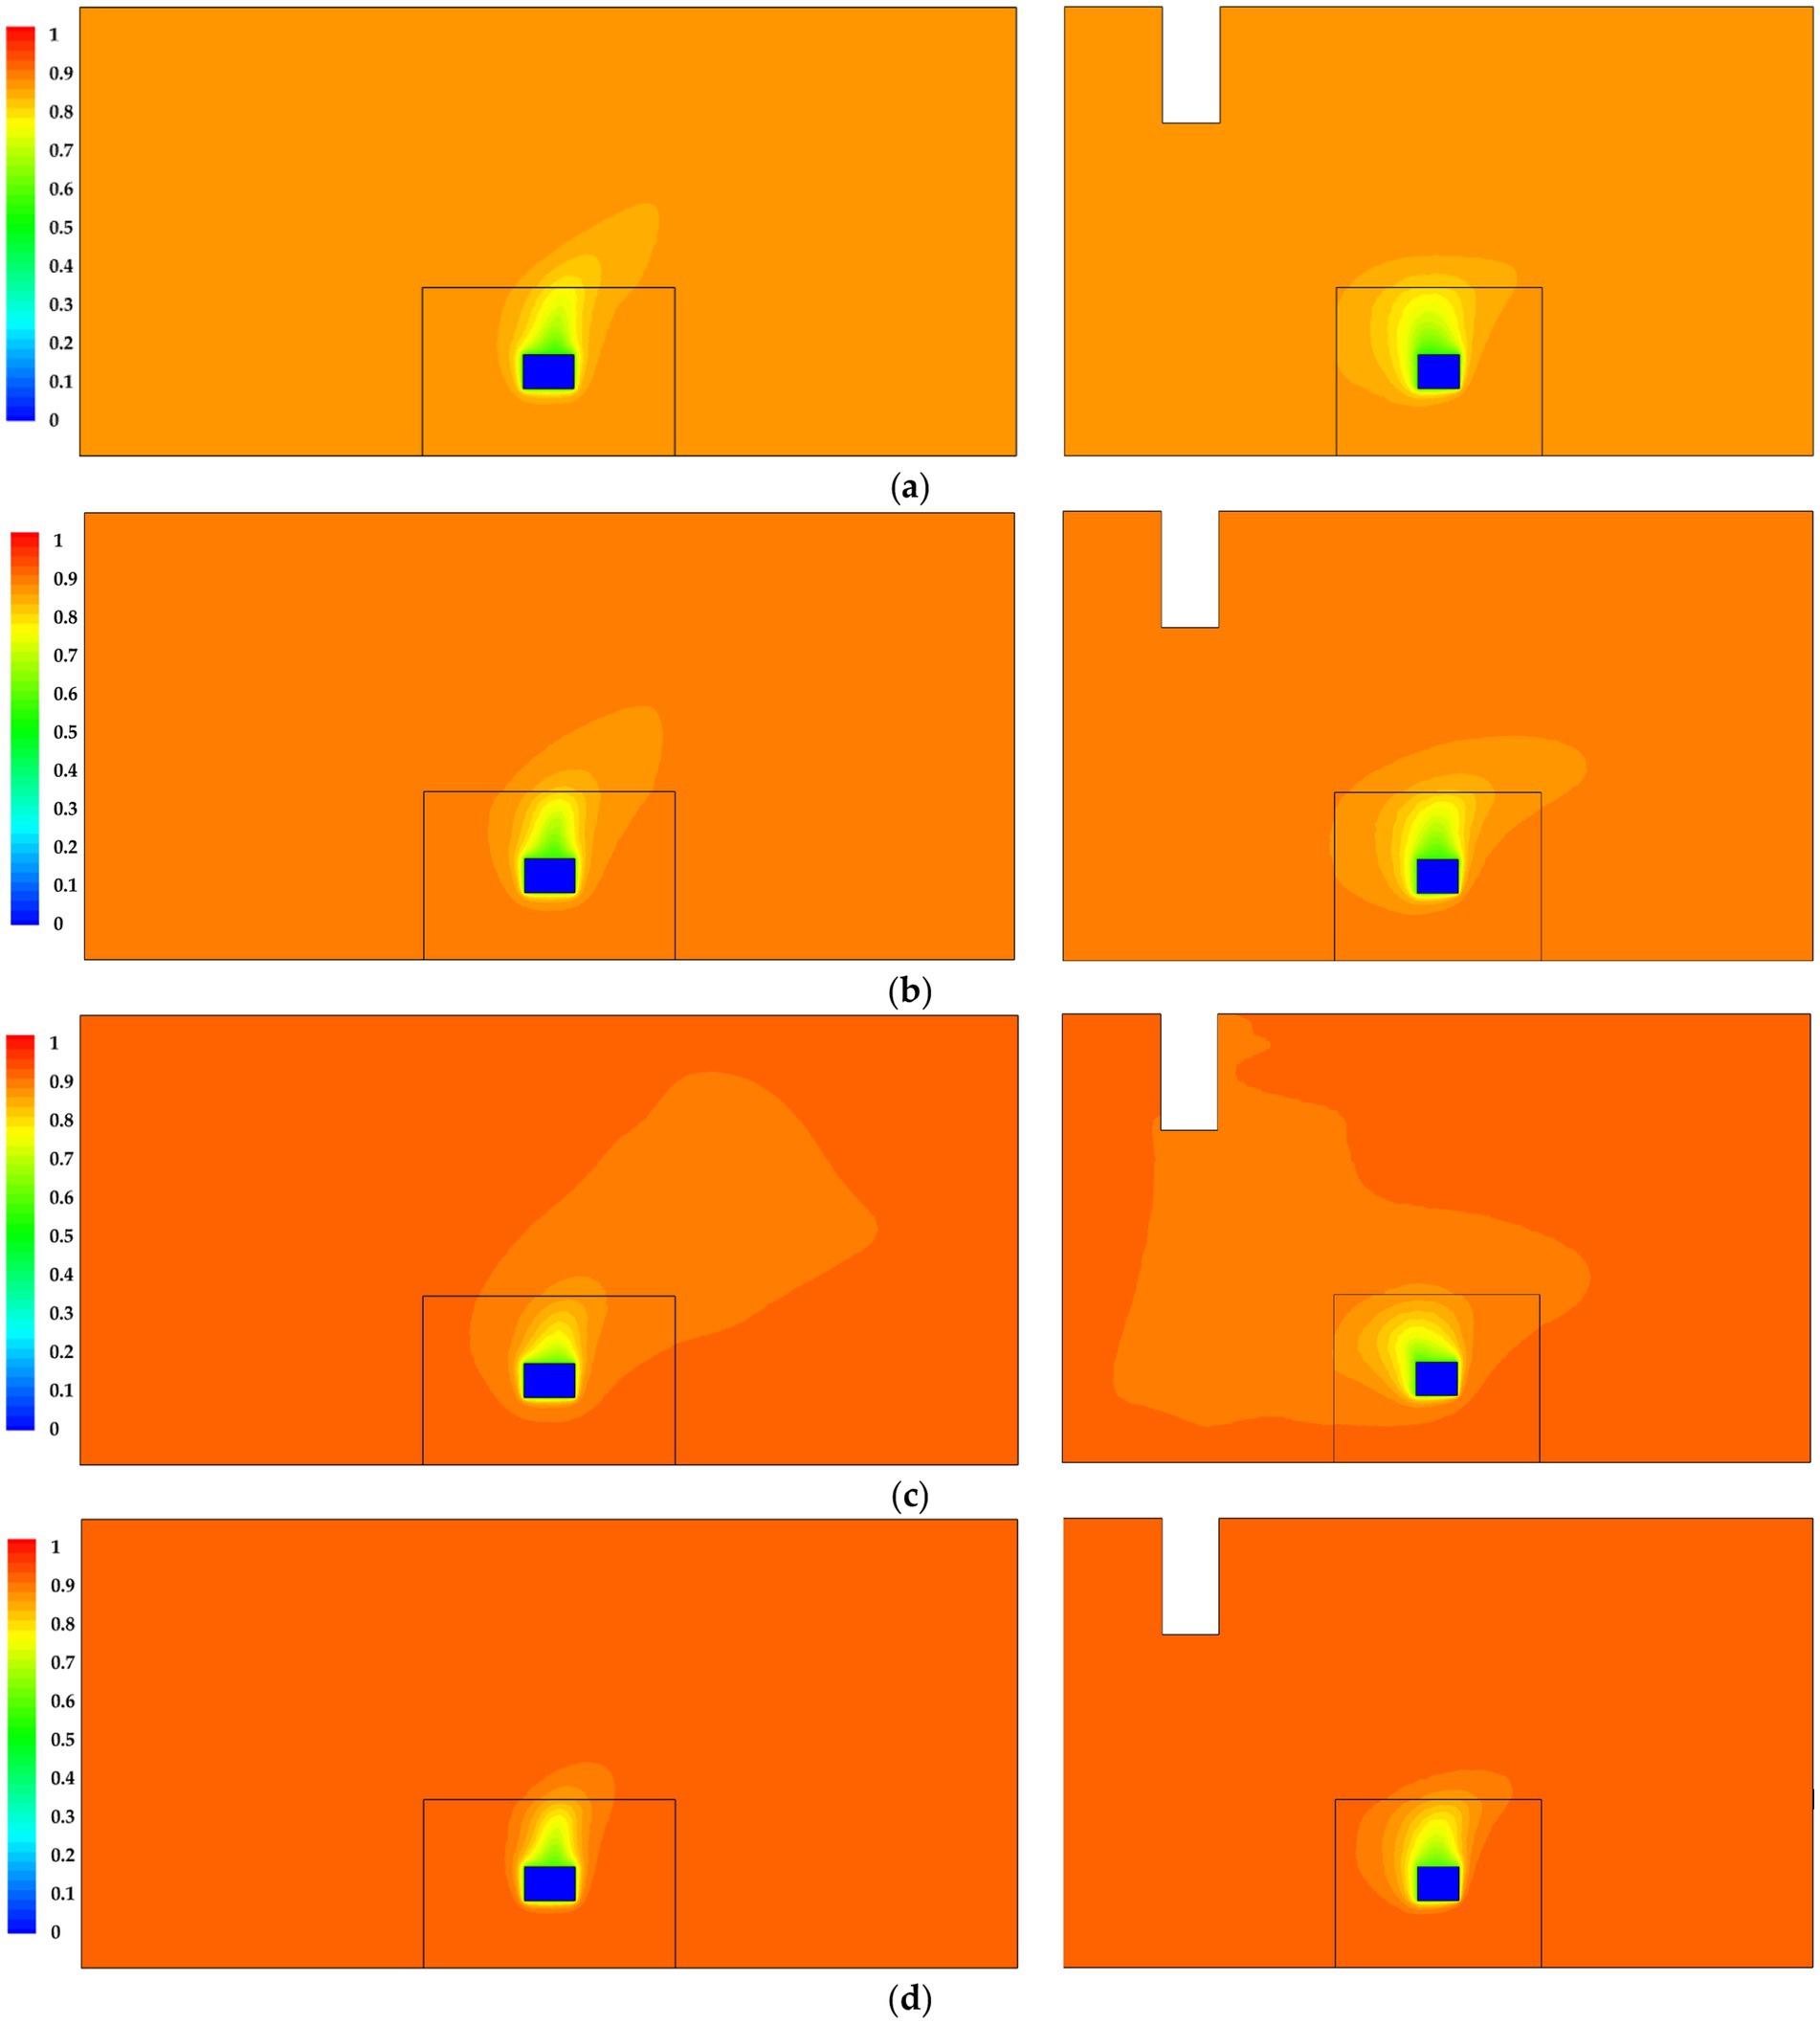
Figure 12. Relative humidity changes of different air supply humidity conditions. (a) Supply air humidity: 86%. (b) Supply air humidity: 88%. (c) Supply air humidity: 90%. (d) Supply air humidity: 92%.
4 Discussion
Effective regulation of storage environmental factors is essential for achieving scientific storage, as appropriate temperature and humidity significantly impact cargo preservation. A real-time temperature and humidity monitoring system was established for a potato air-conditioned storage experimental platform, incorporating refrigeration, humidification, and air conditioning functions. In future work, long-term storage experiments are essential for the controlled atmosphere storage platform to thoroughly evaluate long-term storage benefits. These benefits include capital investment, operating costs, energy efficiency, potato quality retention time, and loss reduction rate. When considering boundary conditions, it is crucial to account for the actual operating conditions of the controlled atmosphere library. This includes factors such as fluctuating ambient temperature and humidity changes, as well as airflow interference from the chiller. Taking these factors into account will help ensure that the numerical model more accurately reflects the real operating state, thereby improving its accuracy.
Previous experimental research (Darwesh and Elmetwalli, 2015) has observed that potato pile temperature decreases with increasing height, likely due to internal airflow, though they did not explain the mechanism. Our results (Figures 9, 10) confirm that airflow strongly affects temperature distribution, supporting their hypothesis. CFD modeling enables visualization of temperature and velocity distributions, improving analysis accuracy. While prior studies (Eltawil et al., 2006) address storage facility design parameters and cooling load calculations, their theoretical approaches often overlook practical constraints. As a result, discrepancies arise between simulated parameters and real-world conditions. The CFD modeling was employed to study transient potato cooling and steady-state heat/mass transfer (Chourasia and Goswami, 2007a). Due to computational limitations at the time, the study used a simplified 2D model, treating the potato pile as a porous medium with surface heating. This approach neglected internal heat generation in potatoes, leading to significant deviations from real-world heat transfer behavior. The study also acknowledged these limitations, including the omission of interactions between adjacent potato piles. A CFD study modeled airflow in apple cold storage, demonstrating how alternating crate stacking affects airflow distribution and product temperature (Alexander et al., 2024). However, the analysis focused solely on temperature and airflow, neglecting humidity—a critical factor for apple preservation. Incorporating coupled temperature-humidity effects would improve model accuracy, particularly in assessing moisture loss due to direct airflow exposure, thereby enhancing the credibility of optimal crate arrangement strategies. In a napa cabbage cold storage, the study investigated mass loss, focusing on temperature-humidity coupling between the vegetable pile and the surrounding environment (Kołodziejczyk et al., 2024). While the model accurately predicted air relative humidity and temperature, its reliance on single-boundary-condition variations limited its ability to capture the full range of velocity, temperature, and humidity fluctuations occurring during refrigeration.
By comparing the variations in air temperature and humidity during both the temperature control process and the temperature and humidity collaborative control process, it was observed that the temperature change trends are similar; however, humidity changes are more complex due to the coupling of temperature and humidity. A computational fluid dynamics (CFD) steady-state simulation model was developed based on experimental results, and temperature and humidity regulation experiments for the potato storage environment were conducted. The model’s accuracy was verified by comparing experimental data with the simulated data. Subsequently, the flow field, temperature field, and humidity field of the potato storage environment were analyzed under different supply air temperatures, wind speeds, and humidity levels from the chiller. It was confirmed that the optimal conditions for adjusting the temperature and humidity in the potato storage environment are a supply air temperature of 3°C, a supply air speed of 5 m/s, and a supply air humidity of 90%. In contrast to traditional storage methods, controlled atmosphere storage systems can effectively preserve the nutrient composition of potatoes. These systems significantly enhance the retention of ash and carbohydrate content, maintain phenolic compounds, and inhibit the formation of harmful substances such as cyanide, saponins, and alkaloids (Okache et al., 2025). The model developed in this study can be utilized in the future to predict the distributions of temperature, humidity, and velocity in potato storage environments. Certainly, this model can also serve as a reliable theoretical foundation for researchers aiming to optimize environmental regulation strategies in controlled atmosphere cold store. Additionally, it has the potential to enhance the post-harvest edible value of various spherical horticultural fruits and vegetables, thereby contributing to better storage practices and improved product quality across a broader range of agricultural produce.
Data availability statement
The raw data supporting the conclusions of this article will be made available by the authors, without undue reservation.
Author contributions
QZ: Writing – review & editing, Funding acquisition, Writing – original draft, Conceptualization. CX: Software, Writing – original draft, Validation. Tana: Writing – review & editing. HW: Software, Writing – review & editing, Validation. XY: Data curation, Writing – review & editing. CY: Visualization, Writing – review & editing. YS: Visualization, Writing – review & editing.
Funding
The author(s) declare that financial support was received for the research and/or publication of this article. This research was funded by Postgraduate Scientific Research Innovation Project of Inner Mongolia Autonomous Region, Grant No. KC2024038B; Inner Mongolia Natural Science Foundation, Grant No. 2024QN03058 and 2022MS03040; First Class Disciplines Research Special Project, Grant No. YLXKZX-NND-009. This work was also supported by research funds of Inner Mongolia Agricultural University, Education Department of Inner Mongolia Autonomous Region and Science and Technology Department of Inner Mongolia Autonomous Region.
Conflict of interest
The authors declare that the research was conducted in the absence of any commercial or financial relationships that could be construed as a potential conflict of interest.
Generative AI statement
The authors declare that no Gen AI was used in the creation of this manuscript.
Publisher’s note
All claims expressed in this article are solely those of the authors and do not necessarily represent those of their affiliated organizations, or those of the publisher, the editors and the reviewers. Any product that may be evaluated in this article, or claim that may be made by its manufacturer, is not guaranteed or endorsed by the publisher.
References
Alexander, L. D., Sanjeev, J., and Dasgupta, M. S. (2024). Optimizing cold storage for uniform airflow and temperature distribution in apple preservation using CFD simulation. Sci. Rep. 14:25402. doi: 10.1038/s41598-024-76385-y
Ambaw, A., Verboven, P., Defraeye, T., Tijskens, E., Schenk, A., Opara, U. L., et al. (2013). Porous medium modeling and parameter sensitivity analysis of 1-MCP distribution in boxes with apple fruit. J. Food Eng. 119, 13–21. doi: 10.1016/j.jfoodeng.2013.05.007
Çapoğlu, Ö. F., Kunt, K. S. T., and Özden, M. (2022). Temperature and relative humidity of sustainable tuff storage facilities located in Central Anatolia, Turkey. Temperature and relative humidity of sustainable tuff storage facilities located in Central Anatolia, Turkey. 57.
Chourasia, M. K., and Goswami, T. K. (2007a). CFD simulation of effects of operating parameters and product on heat transfer and moisture loss in the stack of bagged potatoes. J. Food Eng. 80, 947–960. doi: 10.1016/j.jfoodeng.2006.07.015
Chourasia, M. K., and Goswami, T. K. (2007b). Three dimensional modeling on airflow, heat and mass transfer in partially impermeable enclosure containing agricultural produce during natural convective cooling. Energy Convers. Manag. 48, 2136–2149. doi: 10.1016/j.enconman.2006.12.018
Chourasia, M. K., and Goswami, T. K. (2007c). Steady state CFD modeling of airflow, heat transfer and moisture loss in a commercial potato cold store. Int. J. Refrig. 30, 672–689. doi: 10.1016/j.ijrefrig.2006.10.002
Chourasia, M. K., Saha, R., De, A., and Sahoo, P. K. (2004). Evaluation of storage losses in a commercial potato cold storage. J. Food Sci. Technol. 41, 507–510.
Croquer, S. D., Eddine, A., and Poncet, S. (2019). Numerical modelling of heat and mass transfer in a refrigerated truck trailer. Proceedings of the 25th IIR International Congress of Refrigeration. 3574–3581
Darwesh, M., and Elmetwalli, A. H. (2015). Effect of cold storage conditions on physical properties of potato tubers. Misr J. Agric. Eng. 32, 789–806. doi: 10.21608/mjae.2015.98640
Defraeye, T., and Radu, A. (2018). Insights in convective drying of fruit by coupled modeling of fruit drying, deformation, quality evolution and convective exchange with the airflow. Appl. Therm. Eng. 129, 1026–1038. doi: 10.1016/j.applthermaleng.2017.10.082
Eltawil, M., Samuel, D., and Singhal, O. P. (2006). Potato storage technology and store design aspects. Agric. Eng. Int. VIII, 1–18.
Foukaraki, S. G., Cools, K., Chope, G. A., and Terry, L. A. (2016). Impact of ethylene and 1-MCP on sprouting and sugar accumulation in stored potatoes. Postharvest Biol. Technol. 114, 95–103. doi: 10.1016/j.postharvbio.2015.11.013
Gong, Y. F., Cao, Y., and Zhang, X. R. (2021). Forced-air precooling of apples: airflow distribution and precooling effectiveness in relation to the gap width between tray edge and box wall. Postharvest Biol. Technol. 177:111523. doi: 10.1016/j.postharvbio.2021.111523
Grubben, N. L. M., and Keesman, K. J. (2015). Modelling ventilated bulk storage of agromaterials: a review. Comput. Electron. Agric. 114, 285–295. doi: 10.1016/j.compag.2015.04.011
Grubben, N. L. M., and Keesman, K. J. (2019). A spatially distributed physical model for dynamic simulation of ventilated agro-material in bulk storage facilities. Comput. Electron. Agric. 157, 380–391. doi: 10.1016/j.compag.2018.12.033
Guo, J. M., Wei, X. Y., Du, X. N., Ren, J. J., and Lü, E. L. (2019). Numerical simulation of liquid nitrogen injection in a container with controlled atmosphere. Biosyst. Eng. 187, 53–68. doi: 10.1016/j.biosystemseng.2019.08.015
Gutiérrez-Pozo, M., Verheecke-Vaessen, C., Kourmpetli, S., Terry, L. A., and Medina, A. (2024). Effect of temperature, relative humidity, and incubation time on the mycotoxin production by Fusarium spp. responsible for dry rot in potato tubers. Toxins 16:414. doi: 10.3390/toxins16100414
Han, J. W., Ren, Q. S., Li, J. C., Zhu, W. Y., and Yang, X. T. (2023). Numerical analysis of coupled heat and mass transfer processes in packaged tomatoes throughout the cold chain. Case Stud. Therm. Eng. 42:102687. doi: 10.1016/j.csite.2022.102687
Jubayer, F., Uddin, B., and Ziauddin, A. T. M. (2017). Effectiveness of a developed potato storage system in shelf life and nutritional quality compared to traditional practice in Bangladesh. Potravinarstvo 11, 11–19. doi: 10.5219/659
Khan, N., Fatima, S., and Sadiq, M. B. (2025). Innovative antifungal and food preservation potential of Eucalyptus citriodora essential oil in combination with modified potato Peel starch. Foods 14:602. doi: 10.3390/foods14040602
Kołodziejczyk, M., Śmierciew, K., Gagan, J., Butrymowicz, D., Jakończuk, P., and Pawłowski, M. (2024). Coupled heat, mass and momentum transfer model of a napa cabbage refrigerated storage chamber. Arch. Thermodyn. 45, 223–235. doi: 10.24425/ather.2024.152012
Krishnan, L. N. (2025). Development of an internet of things based smart cold storage with inventory monitoring system. Int. J. Electr. Comput. Eng. 15, 89–98. doi: 10.11591/ijece.v15i1.pp89-98
Majed, Z., and Sherko, F. (2023). Evaluation, monitoring, and improving the airflow and heat transfer in a cold storage of foodstuffs, CFD simulation and experimental investigation. Sulaimani J. Eng. Sci. 10, 24–48. doi: 10.17656/sjes.10165
Mustika, S. N., Noerhayati, E., and Akhlak, M. M. (2022). Design a smartphone app of an internet of things-based monitoring system potato plants on agricultural land. 2022 International Conference on Electrical Engineering, Computer and Information Technology (ICEECIT). 99–103
Nam, J. H., and Chun, J. Y. (2021). Quality characteristics of hot air dried potato flakes according to storage conditions of high relative humidity and various temperature conditions. Food Eng. Prog. 25, 384–390. doi: 10.13050/foodengprog.2021.25.4.384
Nayem, J., Ali, M. S., Jote, J. F., Rahman, M. E., Nahid, M. T. R., Tisha, J. M., et al. (2024). Effect of full, half and quarter size potato tuber seed on growth and yield of potato (Solanum tuberosum L.). J. Agrofor. Environ. 17, 49–54. doi: 10.55706/jae1716
Nkwocha, C. L., Ambaw, A., Fadiji, T., Coetzee, C. J., and Opara, U. L. (2022). CFD-based analysis of the cooling capacity of a refrigerated container as a function of produce loading temperature. Acta Hortic. 1349, 435–442. doi: 10.17660/ActaHortic.2022.1349.58
Okache, T. A., Karim, O. R., Dauda, A. O., Edem, V. E., and Kamaldeen, O. S. (2025). Proximate and antinutrient compositions of potato (Solanum tuberosum) tuber from selected storage methods. Asian J. Food Res. Nutr. 4, 293–305. doi: 10.9734/ajfrn/2025/v4i2245
Patel, B. B., and Sutar, R. F. (2023). Respiration rate and heat of respiration of green chilli (Capsicum annuum L.) as influenced by storage humidity and temperature. Agric. Res. J. 60, 460–466. doi: 10.5958/2395-146X.2023.00067.4
Pu, L., Li, Y., Xiao, F., Ma, Z., and Shen, S. (2014). Effects of different inlet vent positions on the uniformity of humidity inside a building chamber. Energy Buildings 76, 565–571. doi: 10.1016/j.enbuild.2014.03.022
Pudja, R. P., Harsojuwono, B. A., Setiyo, Y., and Gunadnya, I. B. P. (2024). Energy and mass balance in storing seed potato tubers using a para-para system. Tuijin Jishu/J. Propulsion Technol. 45, 2282–2298. doi: 10.52783/tjjpt.v45.i02.6226
So, J., Joe, S., Hwang, S., Jun, S., and Lee, S. (2021). Analysis of the temperature distribution in a refrigerated truck body depending on the box loading patterns. Foods 10:2560. doi: 10.3390/foods10112560
Song, C., Liu, P., Liu, X., Wei, M., Zhang, Z., and Zhang, Z. (2024). Design and verification of an active ventilation strategy using the heterogeneous distribution of temperature and humidity for solar greenhouses in winter. Trans. Chin. Soc. Agric. Eng. 40, 228–238. doi: 10.11975/j.issn.1002-6819.202401147
Tiamiyu, N. (2020). “Exploring next generation packaging systems in a refrigerated container using CFD modelling” in Thesis (MEng) (Stellenbosch: Stellenbosch University).
Tiwari, R. K., Kumar, R., Naga, K. C., and Sharma, S. (2021). “Recent advancements in integrated management of potato diseases” in Recent advances in root and tuber crops (New Delhi: Brillion Publishing), 185–203.
Verboven, P., Flick, D., Nicolaï, B. M., and Alvarez, G. (2006). Modelling transport phenomena in refrigerated food bulks, packages and stacks: basics and advances. Int. J. Refrig. 29, 985–997. doi: 10.1016/j.ijrefrig.2005.12.010
Wang, J. W., Chen, J. N., Han, D., Lin, Z. Y., Huang, C. X., Zheng, S. H., et al. (2023). Design and simulation of the circulating air supply system for a ventilated wall-type plant factory based on the principle of uniform flow plate. Trans. Chin. Soc. Agric. Eng. 39, 213–221. doi: 10.11975/j.issn.1002-6819.202303218
Zewdie, T. A., Delele, M. A., Fanta, S. W., Vanierschot, M., Alemayehu, M., Alemayehu, G., et al. (2022). Design and evaluation of a prototype solar energy driven onion curing system using CFD modeling. Front. Sustain. Food Syst. 6:1030915. doi: 10.3389/fsufs.2022.1030915
Zhang, S., Wang, X., Kinay, P., and Dau, Q. (2024). Climate change impacts on potato storage. Foods 13:1119. doi: 10.3390/foods13071119
Zhao, Y., Zhang, W., Ma, S., and Zhou, J. (2020). Three-dimensional numerical simulation of the flow field in the potato storage in summer. IOP Conf. Ser.: Earth Environ. Sci. 566:012001. doi: 10.1088/1755-1315/566/1/012001
Glossary
C - The inertial drag coefficient
cp - The specific heat capacity (J/(kg k))
CVT - The temperature variation coefficient
CVH - The variation of relative humidity coefficient
Di,m - The mass diffusion coefficient
Di,T - The heat diffusion coefficient
d - Air humidity ratio (g/kg)
Ei - The existing experimental data
Gi - The additional generation rate
g - Gravitational force (N/m3)
Have - The average relative humidity (%)
Hr - Air relative humidity (%)
Ji - Diffusion flux density
m - The number of measuring points
n - The total number of samples data points
Ps - Water vapor saturation pressure (Pa)
Pl - Air pressure (Pa)
- Pressure on a microelement on a fluid (Pa)
R - The net generation rate
Sct - The turbulent Schmidt number (0.7)
Si - The current simulation result
Sφ - The generalized source term
t - Time (s)
T - The local temperature (°C)
T* - Dimensionless temperature
Tave - The average temperature
Tp - The arithmetic average value of the volume-averaged temperatures
TW - Initial temperature
T∞ - The air temperature
- Velocity scalars in the x axis
Vp - The arithmetic average value of the volume-averaged velocity
VW - Initial velocity
V∞ - The air velocity
- Velocity vector (m/s)
- Velocity scalars in the y axis
- Velocity scalars in the z axis
- The mass fraction
- Permeability
λ - The thermal conductivity (W/(m°C))
- Fluid viscosity (N s/m2)
μt - The turbulent viscosity (N s/m2)
φ - The general variables
ε - The ratio of the dry air specific gas constant to the water vapor specific gas constant (0.622)
Γφ - The generalized diffusion coefficient
ρ - Density (kg/m3)
τ - Viscous stress (Pa)
a - Air
i - Component
Keywords: potato, storage, temperature, humidity, CFD, distribution characteristics, numerical modeling
Citation: Zhen Q, Xu C, Tana, Wang H, Yue X, Yan C and Sun Y (2025) Research on the temperature and humidity distribution characteristics in potato storage facilities: experimental analysis and numerical simulation. Front. Sustain. Food Syst. 9:1594791. doi: 10.3389/fsufs.2025.1594791
Edited by:
Yao Tang, Tianjin University of Science and Technology, ChinaReviewed by:
Aphiya Amulya Palle, Indian Institute of Technology Kharagpur, IndiaNikita Wadhawan, Maharana Pratap University of Agriculture and Technology, India
Haiyu Du, Tianjin University of Science and Technology, China
Copyright © 2025 Zhen, Xu, Tana, Wang, Yue, Yan and Sun. This is an open-access article distributed under the terms of the Creative Commons Attribution License (CC BY). The use, distribution or reproduction in other forums is permitted, provided the original author(s) and the copyright owner(s) are credited and that the original publication in this journal is cited, in accordance with accepted academic practice. No use, distribution or reproduction is permitted which does not comply with these terms.
*Correspondence: Tana, amR0YW5hQDE2My5jb20=