 Wendi Wang1
 Yadan Zhao
- 1School of Information and Business Management, Dalian Neusoft University of Information, Dalian, China
- 2School of Foreign Languages, Dalian Neusoft University of Information, Dalian, China
- 3College of Marxism, Dalian University of Foreign Languages, Dalian, China
Based on this version, we have updated the Abstract as follows: The pig supply chain (PSC) is influenced by the pig cycle, environmental regulations, and livestock health and safety incidents, making its supply chain management highly complex. Currently, the primary focus of PSC management is on resilience upgrading, with less emphasis on sustainable development, which, limits the growth of PSC. Taking China, the world’s largest pig producer and consumer, as an example, this paper constructs an influencing indicator system for PSC from the perspective of resilience and sustainability synergy (RSS). It applies Fuzzy DEMATEL to calculate the causal relationships between indicators, ANP to calculate indicator weights, and obtains a comprehensive ranking and identifies key influencing factors (KIFs). Moreover, this paper analyzes the relationships and constraints between influencing factors. The stability of the KIFs and the regional applicability of the indicator system were verified through the fuzzy comprehensive evaluation of RSS in PSC in Zhejiang Province (eastern China), Henan Province (central China), and Sichuan Province (western China). The results show that Enterprise organizational capability (F2), Supply chain environmental interaction across the lifecycle (F13), Trust relationships among entities (F19), Logistics network adaptability (F7), Learning and continuous improvement mechanisms (F12), Supply chain digitalization level (F4), and Technological innovation capability (F8) are key factors influencing RSS in PSC. The findings emphasize that China’s PSC should prioritize resilience while leveraging the synergistic effects of KIFs to achieve sustainable development. This paper provides practical optimization strategies from the perspective of RSS for overcoming challenges related to environmental interactions and redundant configurations in PSC management.
1 Introduction
China is the world’s most significantpig production and consumption market. According to data from the National Bureau of Statistics of China, in 2023, China’s pork production reached 57.94 million tons, and consumption was 57.43 million tons, accounting for more than 50% of the global total. The pig industry is a significant part of Chinese agriculture, with pork being the primary source of meat for Chinese residents, playing a crucial role in the Chinese diet structure (Zhang et al., 2023). Traditionally, there is a saying in China, “Grain and pigs stabilize the world,” reflecting the pivotal role of pigs in ensuring national food security and promoting social stability. The pig supply chain (PSC) mainly comprises five key stages: feed production, pig farming, slaughtering and processing, meat product production, and product sales, with farming, slaughtering, and meat processing being the core stages (Nadal-Roig et al., 2023). However, China’s PSC faces three issues within these core stages. Firstly, Low Intensification: In the pig farming stage, for instance, the market share of the top five companies (CR5) is only 15.83%, with many small and medium-sized farmers involved. Low intensification leads to high costs for technology promotion and disease prevention efforts, unstable supply, and severe pollution from farming waste. Secondly, Inadequate Logistics Network: live pig transport dominates in China, with local slaughtering and local sales being standard practices. The lack of advanced cold chain logistics infrastructure and modern logistics methods results in high morbidity and product loss rates during transportation. Thirdly, Imbalanced Ratio of High-Temperature and Low-Temperature Pig Products: This imbalance reduces the positive impact of the pig industry on residents’ health and distorts the pig product consumption market.
Besides China’s problems, PSC is also influenced by the macro environment. Firstly, Global Pig Market: The global pig market is highly competitive, with market prices primarily driven by supply. Due to the lengthy pig production cycle, industry supply adjustments often lag behind changes in production capacity and market prices, creating an obvious “hog cycle.” Secondly, Policy Environment and Biosecurity: Policies and biosecurity significantly impact the live pig farming industry. China’s new environmental regulations in 2014, the African Swine Fever outbreak in August 2018, and the COVID-19 pandemic starting in February 2020 severely impacted PSC. Finally, Food Safety Standards and Environmental Protection: The increasing stringency of global food safety standards and heightened environmental awareness mean that the interaction between pigs and the environment, pork product quality standards, and quality traceability have become crucial factors affecting the performance of PSC (Kruger et al., 2022). In summary, China’s PSC is subject to various internal and external impacts, necessitating reforming its supply chain management model.
In theoretical research, both supply chain resilience and supply chain sustainability are popular topics in the field of supply chain management. Scholars have conducted extensive and in-depth studies on the key influencing factors and upgrading strategies for resilience and sustainability separately. For PSC, both resilience and sustainability are operational goals. The supply chain must be stable, efficient, and resistant to disruptionswhile maintaining sustainable development across the “economic-social-environmental” dimensions. Therefore, optimizing the supply chain must consider the synergy between resilience and sustainability. However, current supply chain performance assessment typically considers resilience or sustainability as single goals and has not established an assessment indicator system that integrates both. The key factors influencing resilience and sustainability also differ based on the core products of the supply chain (Khezeli et al., 2023). From a synergistic perspective, the key factors affecting the resilience and sustainability in PSC cannot simply be the intersection or union of the two, as some factors do not positively influence both simultaneously and may even have contradictory effects. For example, innovative sales models (such as live e-commerce) can enhance supply chain efficiency and resilience. Still, they can also limit the intensification of the pig industry to some extent, affecting the supply chain’s sustainable development (Zhu et al., 2023). Additionally, the frequent interactions between pig products and the environment during production and transportation require companies to balance decisions between environmental protection and economic efficiency, essentially a game between resilience and sustainability (Ruckli et al., 2022). Thus, balancing the goal weights of resilience and sustainability from a synergistic perspective and identifying the key factors influencing RSS based on regional development stages and conditions are pressing issues currently facing PSC.
To address the issues mentioned earlier, this paper develops an indicator system for the factors influencing the development of RSS in China’s PSC. This system measures not only the response capacity, adaptation strategies, and recovery speed of the pig industry when facing external disturbances (resilience indicators), but also includes a comprehensive assessment of environmental protection, social responsibility fulfillment, and sustained economic growth capacity (sustainability indicators). Moreover, by identifying KIFs, analyzing the causal relationships among them, and conducting regional case analyses, the paper offers refined suggestions for the synergistic development of resilience and sustainability in the PSC. This research is framed as a typical Multi-Criteria Decision-Making (MCDM) problem. The paper combines the strengths of Fuzzy Set Theory, the Decision-Making Trial and Evaluation Laboratory (DEMATEL) method, and the Analytic Network Process (ANP) method to ensure the scientific rigor of the research process and the reliability of the results. This research enriches the theory of multi-objective control in supply chains and provides theoretical support for optimizing the PSC, enabling it to better adapt to dynamic internal and external conditions and enhance its core competitiveness.
The remainder of this paper is organized as follows: Section 2 reviews existing research outcomes, including directions on agricultural products and pig supply chains, supply chain collaboration theory, and key factors influencing supply chain resilience and sustainability. Section 3 introduces the research methods used in this study. Section 4 analyzes the research results. Section 5 discusses the similarities and differences between the research findings and existing studies, providing optimization suggestions for the PSC. Section 6 presents the conclusion.
2 Literature review
2.1 Agricultural product supply chain and PSC
The agricultural product supply chain is a network of interconnected individuals and organizations involved in the production, transportation, distribution, and consumption of agricultural products (Zhao et al., 2023). The goal of agricultural product supply chain management is to ensure the efficient, safe, and sustainable flow of agricultural products from production to consumption while meeting consumers’ needs and expectations (Fang and Ge, 2023). Early research in the field of agricultural product supply chains focused on supply chain organizational models suitable for the market and the characteristics of agricultural products (Routroy and Behera, 2017; Syahruddin and Kalchschmidt, 2012), optimal resource allocation from a supply chain integration perspective (Bian and Tian, 2022; Cui, 2021), supply chain risk management (Behzadi et al., 2018), and supply chain performance evaluation (Kamble et al., 2020). Since 2020, the impact of the global COVID-19 pandemic has led to frequent production disruptions and transportation obstacles (Raihan and Himu, 2023), increasing supply chain interruptions and market uncertainty, and consequently, the incidence of supply chain breakages has risen. Against this backdrop, research on supply chain resilience has become a current hot topic (Roberta Pereira et al., 2014; Scholten and Schilder, 2015; Tukamuhabwa et al., 2015). Its practical value is guaranteed by considering the perishability of agricultural products, circulation losses, and the characteristics of agricultural product supply chain forms under different operational models. Some scholars have also focused on the interaction between the agricultural product supply chain and the environment and society, such as the environmental impact of production processes, carbon emissions during circulation, and the impact of cross-sectoral technological integration on the agricultural product supply chain. This has led to the evolution and improvement of the theoretical system of sustainable development for agricultural product supply chains. Compared to crop-based agricultural products, the management of PSC exhibits certain peculiarities. The upstream elements such as feed, vaccines, veterinary drugs, and piglets; the midstream elements like pig farming and cultivation; and the downstream elements including slaughtering, processing, and sales channels differ significantly from efficiency-oriented agricultural products (such as grains, fruits, and vegetables). However, current research often targets broad categories of agricultural products (Guohua, 2013; Yan et al., 2020), with specialized studies on PSC being relatively rare. This has resulted in overly macro-level research outcomes that lack guidance on the optimization of PSC.
By reviewing the research outcomes of agricultural and pig supply chains, it is evident that in recent years, resilience and sustainability have become the main directions for supply chain optimization. Some scholars have recognized the important relationship between supply chain resilience and sustainability, but there is still a lack of comprehensive research on their synergy. Moreover, research on the synergy of resilience and sustainability within PSC remains largely unexplored.
2.2 Supply chain collaboration theory
As supply chain management research evolves toward networked governance, collaboration theory serves as a fundamental perspective for tackling systemic synergy challenges (Touboulic and Walker, 2015b). Supply chain collaboration is the process of forming a strategic partnership among supply chain members to facilitate deep information exchange, resource integration, goal alignment, and joint decision-making to achieve a shared value-added process (Cao and Zhang, 2011). The fundamental mechanisms of collaborative innovation and benefit sharing create the theoretical foundation for achieving RSS in the PSC. Collaborative innovation necessitates that members jointly invest complementary resources and develop systemic solutions through their collective actions (Soosay et al., 2008). At the resilience level, supply chain collaboration improves visibility, predictive abilities, and risk response speed through information sharing and joint planning (Scholten et al., 2019). At the sustainability level, it encourages the collaborative use of eco-friendly technologies to share risks (Beske and Seuring, 2014). Benefit sharing maintains collaborative viability, fair profit-distribution mechanisms encourage vulnerable entities to engage long-term in resilience-building (Hingley, 2005), while scientifically crafted sharing models convert sustainability initiatives into economic incentives, mutually reinforcing RSS (Touboulic and Walker, 2015a).
In summary, supply chain collaboration theory offers a strong theoretical foundation for understanding and achieving the RSS. However, when examining China’s complex and nationally crucial PSC, which is vital to both the national economy and people’s livelihoods, current research has not yet developed a systematic, clear, and locally contextualized framework for identifying the key factors that drive or constrain resilience and sustainability within this system.
2.3 Factors influencing the resilience of PSC
The resilience of agricultural product supply chains is defined as the ability of agricultural food supply chain stakeholders to ensure an acceptable, adequate, and stable food supply at the required time and place by accurately predicting disruptions and using strategies that delay impacts, aid recovery, and allow for cumulative learning after disruptions (Montanyà and Amat, 2023). Scholars have studied the key factors affecting the resilience of agricultural product supply chains under different conditions and dimensions. From a macro-management perspective, Coopmans et al. (2021) suggest that the resilience of agricultural product supply chains is influenced by diversity, flexibility, openness, and self-organization (Coopmans et al., 2021; Ivanov and Das, 2020) identify production inventory dynamics, customer performance, financial performance, and delivery time performance as determinants of supply chain elasticity (Ivanov and Das, 2020). From the disruption recovery perspective, Dixit et al. quantify supply chain recovery capability through unmet demand capacity and total transportation cost control post-disaster (Dixit et al., 2016). Mishra et al. (2022) indicate that training company personnel in disruption awareness and management is a critical factor (Mishra et al., 2022). Establishing rapid response mechanisms, robust supply chain information systems, highly coordinated partnerships, and pre-planning for post-disaster reconstruction are also key elements for enhancing recovery capabilities. For PSC, Pfeifer et al. (2022) investigate the resilience strategies of European organic pig producers in response to economic, legislative, labor, and climate-related shocks. Analyzing narratives from 18 producers, it identifies three strategies: efficiency-based, nutrient substitution, and farm diversification. Ntakiyisumba et al. confirm the widespread prevalence of Salmonella in the South Korean PSC and identify critical factors that contribute towards the Salmonella contamination of pork carcasses at slaughter (Ntakiyisumba et al., 2023).
Research on the resilience of agricultural product supply chains mainly focuses on operational robustness, flexibility, and post-disruption recovery capabilities. However, existing studies have not comprehensively considered characteristic risks in PSC, such as the hog cycle, environmental regulations, and health safety incidents. There is still no complete assessment system for the resilience of PSC.
2.4 Factors influencing sustainability of PSC
The sustainability of agricultural product supply chains influences food safety, environmental protection, and social welfare. Its key influencing factors have been increasingly discussed by scholars. Researchers have explored the impact of technology diffusion on agricultural product supply chains. Nandi et al. believe that redesigning supply chains through innovative technologies such as blockchain can better manage food safety (Nandi et al., 2021). Fesharaki and Safarzadeh (2022) found that the integration of refrigeration systems and the adoption of IoT (Internet of Things) ecosystems are crucial for overcoming perishability limitations and ensuring equitable distribution of crops. Su et al. (2023) also suggest that utilizing high-tech technologies and using recyclable materials play a vital role in improving environmental sustainability. Social factors have also been widely discussed. Chakrabarty and Nandi (2022) argue that risks related to consumer preferences and market demand are significant constraints on sustainability. Environmental factors are also considered, including the level of sustainable environmental policy support, the state of the natural environment, the ability to reuse organic waste, and ecological compensation.
The sustainability of PSC currently focuses on two main directions. First is the continuous improvement of pig product quality. Scholars have conducted in-depth research on vaccines, breeding, and feed, with current attention points on the traceability of pig products. Second, the coordinated development of PSC and the environment. However, research outcomes in this area are relatively scarce. There is a lack of necessary theoretical support for issues such as the environmental impact of pig farming, the treatment of organic pig waste, and clean emissions in the supply chain.
2.5 Influencing Indicator system
Through a literature review, the factors that influence the synergy between resilience and sustainability in PSC are summarized. Different sub-factors are organized under broader categories based on their meanings, and sub-factors with the same meaning are consolidated, eliminating any duplicates. Based on these steps, this paper proposes a system for the influencing factors of the synergy between resilience and sustainability in PSC, which includes six main categories: (i) Response Capacity, (ii) Adaptive Capacity, (iii) Recovery Capacity, (iv) Environmental Impact, (v) Economic Impact, and (vi) Social Impact. Detailed descriptions of the sub-factors under each main category are provided in Table 1.
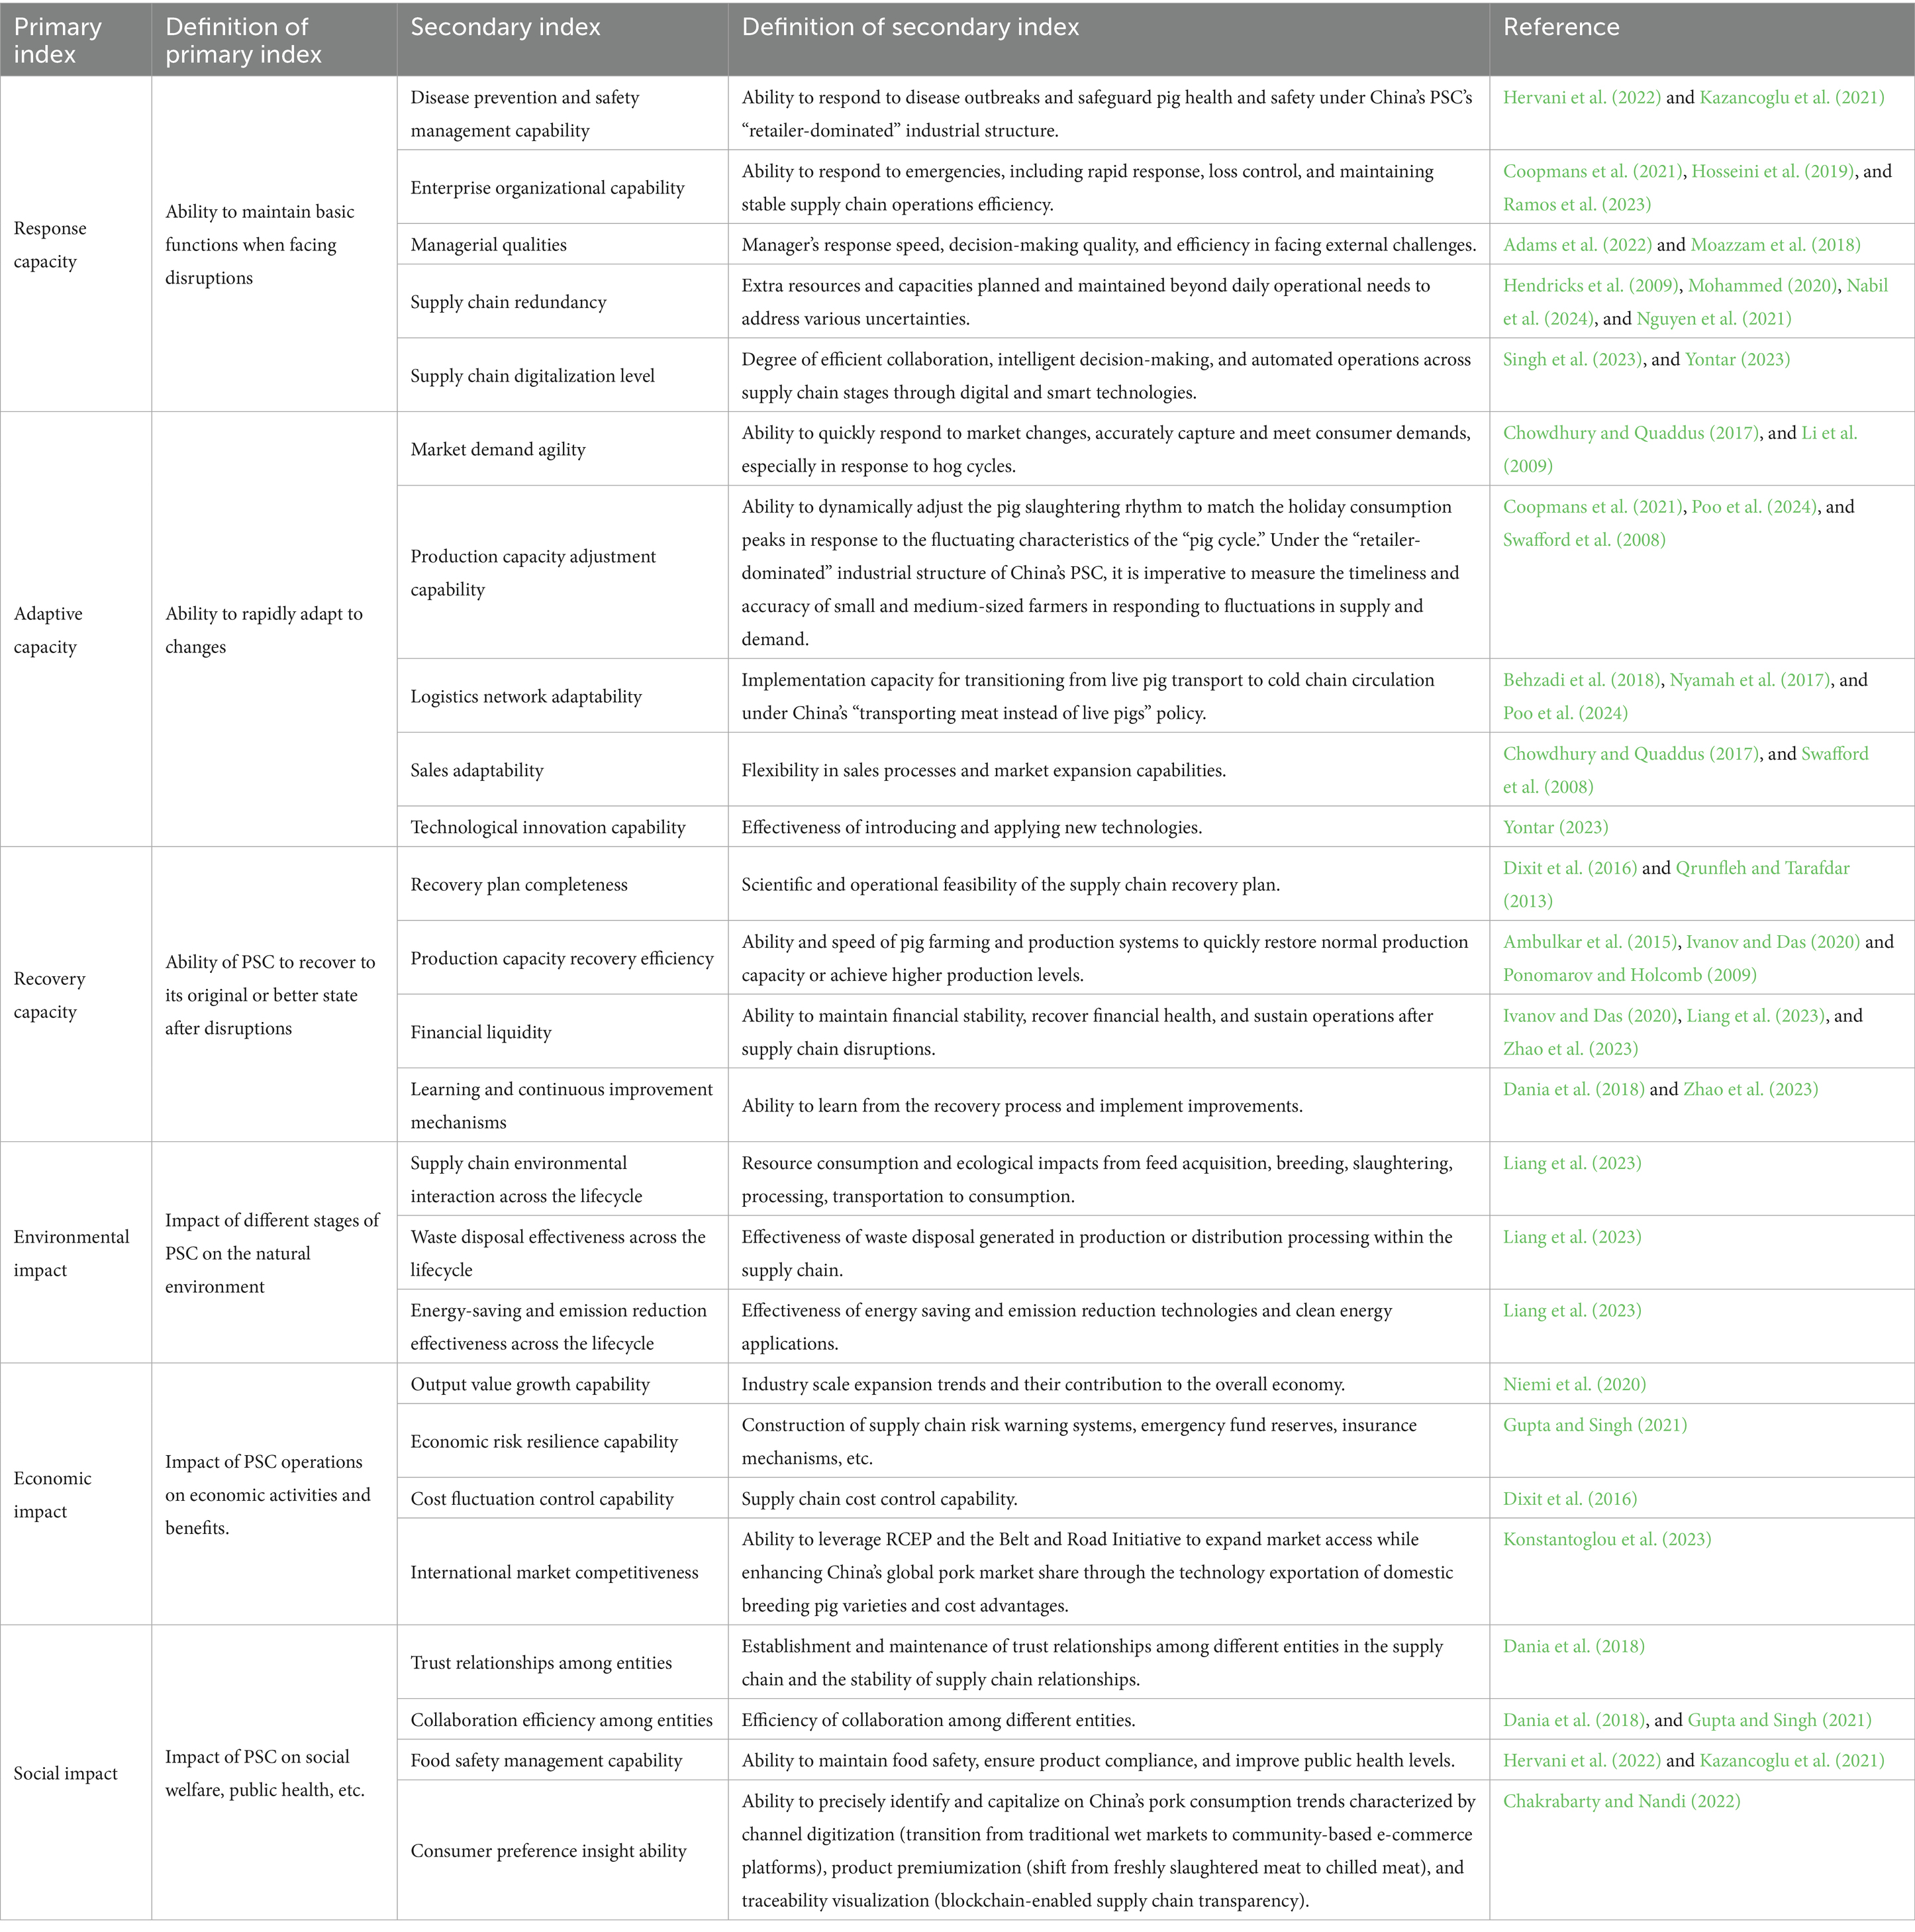
Table 1. Initial influencing indicator system.
3 Proposed method
The research design received approval from the Ethics Committee of the School of Information and Business Management at Dalian Neusoft University of Information. In strict compliance with the Helsinki Declaration, this paper was conducted in accordance with all pertinent guidelines and regulations. Informed consent was obtained from all subjects, who were all duly informed about the purpose of the study and assured of the survey’s anonymity. The outcomes of this research will be exclusively utilized for scientific purposes, with a firm commitment to maintaining the confidentiality of personal information.
The identification and management of key influencing factors in China’s pig supply chain from a synergistic perspective of resilience and sustainability represent a typical Multiple Criteria Decision Making (MCDM) problem. Research process framework for this paper is shown in Figure 1.
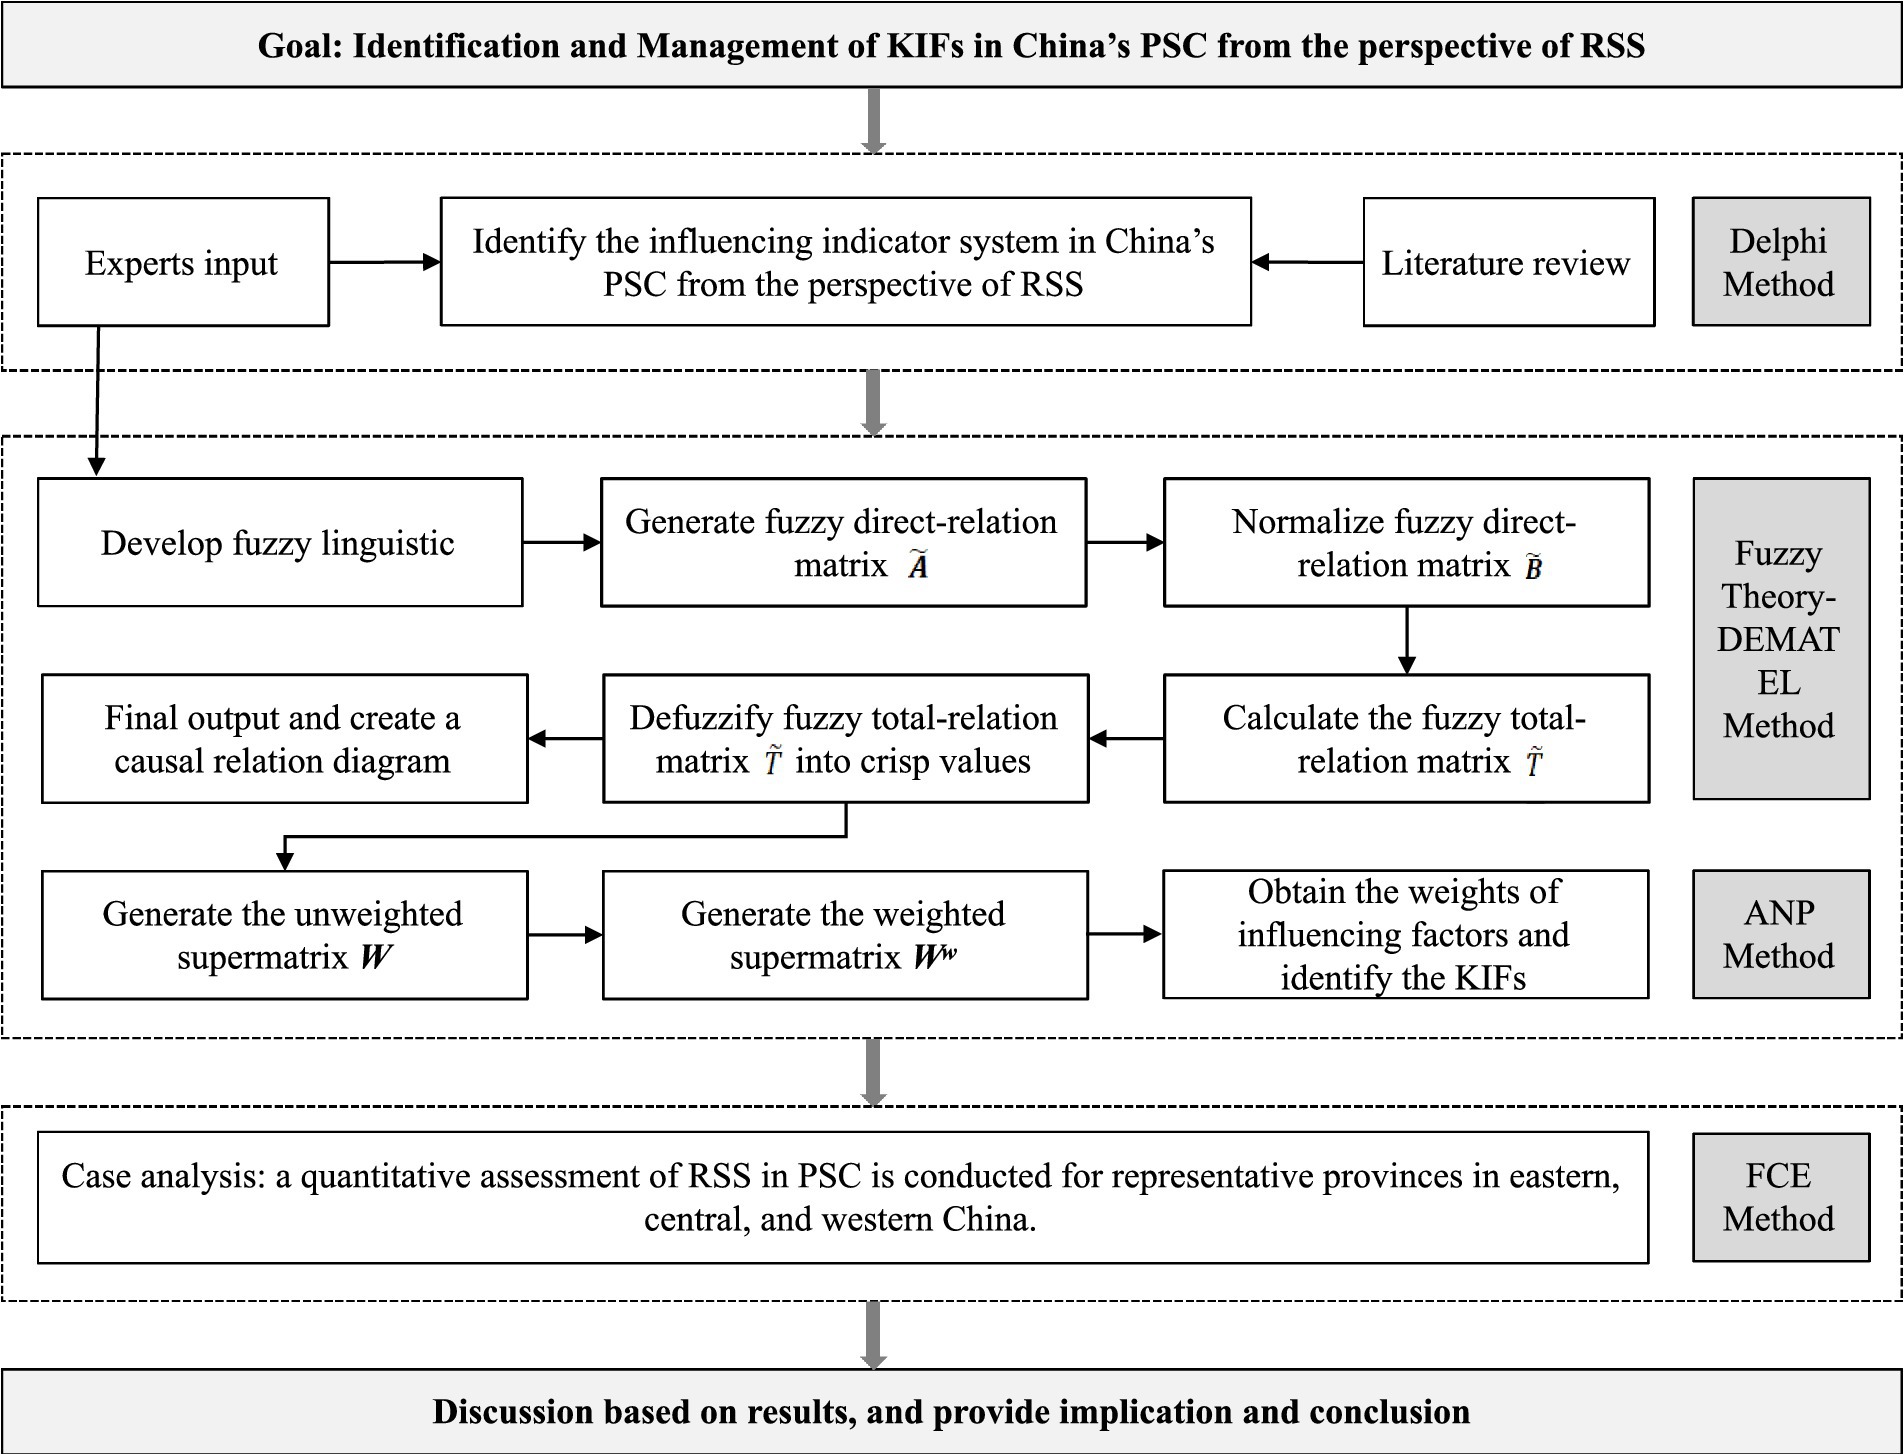
Figure 1. Research process framework for this paper.
3.1 Delphi method
The Delphi method involves sending questionnaires to relevant experts to gather their opinions after the indicator system’s initial construction. Based on the feedback received, the indicator system is refined. After the formation of the first assessment indicator system, the decision on the retention of each indicator entry is based on the results of expert scoring. To ensure the study’s scientific rigor, objectivity, and data quality, this paper employs a generalized Likert scale, assigning values ranging from very important (5 points) to very unimportant (1 point). Experts are asked to rate the importance of each indicator.
For indicator screening, an indicator is considered for exclusion if it meets any of the following criteria: mean score below 3.5, coefficient of variation greater than 0.25, or full score frequency lower than 0.3. To ensure critical indicators are retained, if an indicator fails to meet only one criterion, its retention or exclusion will be determined through a panel discussion. The first round questionnaire is distributed for statistical analysis. Based on the results, a revised questionnaire is developed for the second round. This iterative process continues until expert opinions converge, resulting in the final evaluation index system.
3.2 Fuzzy DANP
This paper combines Fuzzy Theory with the Decision-Making Trial and Evaluation Laboratory (DEMATEL) method to construct a clear map of interactive relationships among influencing factors. This map illustrates the influence and dependence of each factor within the network. Subsequently, by computing a comprehensive influence matrix, it simplifies the weight assignment problem effectively, reducing the complexity of pairwise comparison processes in the Analytic Network Process (ANP) method. Considering the complex and dynamic nature of the PSC environment, the diversity of influencing factors, and the incompleteness of data, the Fuzzy Decision-Making ANP (Fuzzy DANP) method can provide more precise, comprehensive, and adaptive decision support. The key implementation steps are as follows:
3.2.1 Step 1: develop fuzzy linguistic
In fuzzy logic, each number between 0 and 1 represents a degree of truth value, capturing partial truth.
Define on as a triangular fuzzy number (TFN) and its membership function follows Equation 1.
Where, represents the lower value in the TFN, represents the medium value, and represents the upper value.
3.2.2 Step 2: generate fuzzy direct-relation matrix
The influence of the element in each row exerted on the element in each column of this matrix can be represented a fuzzy number, denoted as . If multiple experts’ opinions are used, all experts must complete the matrix, arithmetic mean of all of the experts’ opinions is used to generate the fuzzy direct-relation matrix as shown in Equation 2.
3.2.3 Step 3: normalize fuzzy direct-relation matrix
The normalization process for the aforementioned fuzzy direct impact matrix is computed as shown in Equations 3–5.
Then the normalized fuzzy direct-relation matrix can be obtained using the following formula:
3.2.4 Step 4: calculate the fuzzy total-relation matrix
The fuzzy total-relation matrix can be calculated as Equation 6:
Where , represents the unit matrix.
If each element of the fuzzy total-relation matrix is expressed as , it can be calculated as Equations 7–9:
3.2.5 Step 5: defuzzify fuzzy total-relation matrix into crisp values
The CFCS method proposed by Opricovic and Tzeng has been used to obtain a crisp value of total-relation matrix. The output of the CFCS algorithm is crisp values, calculating total normalized crisp values .
3.2.6 Step 6: final output and create a causal relation diagram
The next step is to find out the sum of each row and each column of (in step 5). The sum of rows ( ) and columns ( ) can be calculated as Equations 10, 11:
Where indicates the degree of influence, reflecting the sum of the influence exerted by indicator on all other indicators. indicates the degree of being influenced, reflecting the fact that indicator is influenced by the sum of all other indicators. When , represent the degree of importance of indicator i in the entire system (the Center Degree), indicating to total impact that indicator exerts and receives from the entire system. represent net effects that indicator contributes to the system (the Cause Degree).
3.2.7 Step 7: generate the unweighted supermatrix
The crisp total-relation matrix (in step 5), which is the unweighted supermatrix of the ANP.
3.2.8 Step 8: generate the weighted supermatrix
The weighted supermatrix can be obtained by normalizing . The standardized procedure is shown as Equations 12, 13.
3.2.9 Step 9: obtain the weights of each indicator and rank
The weighted supermatrix is multiplied by itself until the result converges to a stable limit supermatrix , thereby obtaining the weights of each indicator. Combined with the causal relationship diagram from Step 6, rank the indicators.
3.3 Fuzzy comprehensive evaluation
After ANP obtains the indicators’ weights, this paper uses the fuzzy comprehensive evaluation method to evaluate the resilience and sustainability synergy of the pig supply chain in different regions of China.
3.3.1 Step 1: establish fuzzy evaluation weight set
The relative weights calculated by ANP method are converted into weight sets. Target layer weight set First level indicator weight set QA2 = {WF5, WF6, WF7, WF8}, QA3 = {WF9, WF10, WF11, WF12}, QA4 = {WF13, WF14, WF15}, QA5 = {WF16, WF17, WF18}, QA6 = {WF19, WF20, WF21}.
3.3.2 Step 2: create a comment set
This paper sets the comment set for the indicator, and the corresponding combination value set is .
3.3.3 Step 3: establish fuzzy evaluation matrix
Invite multiple evaluators to evaluate the index level according to the comment set, and quantify the index to get the membership degree of the i-th factor to the j-th evaluation F, so as to establish a fuzzy relationship matrix as shown in Equation 14:
3.3.4 Step 4: Fuzzy comprehensive evaluation results
The method realizes comprehensive evaluation through synthetic operations of weights and fuzzy relationship matrix, and transforms the results into intuitive scores.
4 Results
4.1 Final influencing Indicator system
After creating the initial influencing indicator system for RSS in PSC (as outlined in Table 1), the Delphi method was employed to finalize the RSS impact indicator system. To achieve this, five experts were selected to form a panel, as detailed in Table 2.
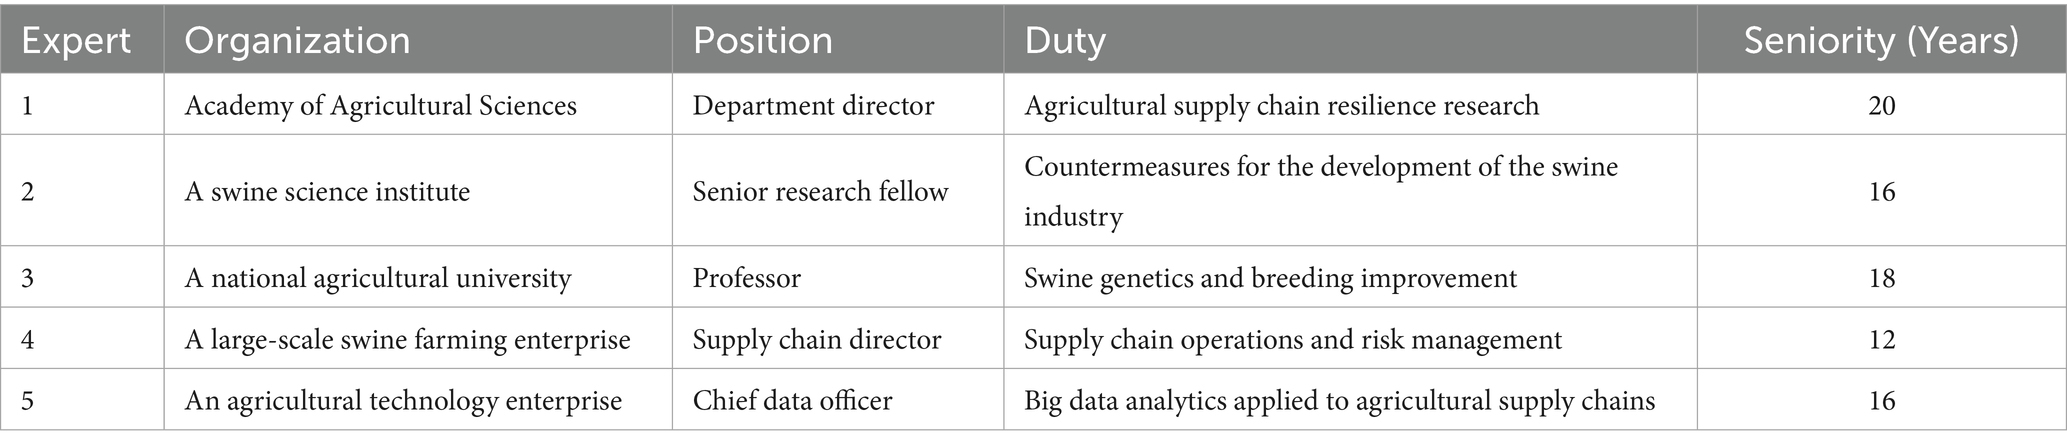
Table 2. Professional backgrounds of five selected experts.
Data were collected through a questionnaire, and two rounds of expert consultations were conducted to achieve consensus among the participants.
The results of the first round of expert consultation, as shown in Table 3, reveal that the average rating for each first-level indicator is above 3.5 points. Additionally, the coefficient of variation (CV) is less than 0.25, and the frequency of Full Scores exceeds 0.3. These findings indicate a strong agreement among experts regarding the importance of the indicators. Since the experts did not suggest any changes to the first-level indicators, no modifications were made during this round.
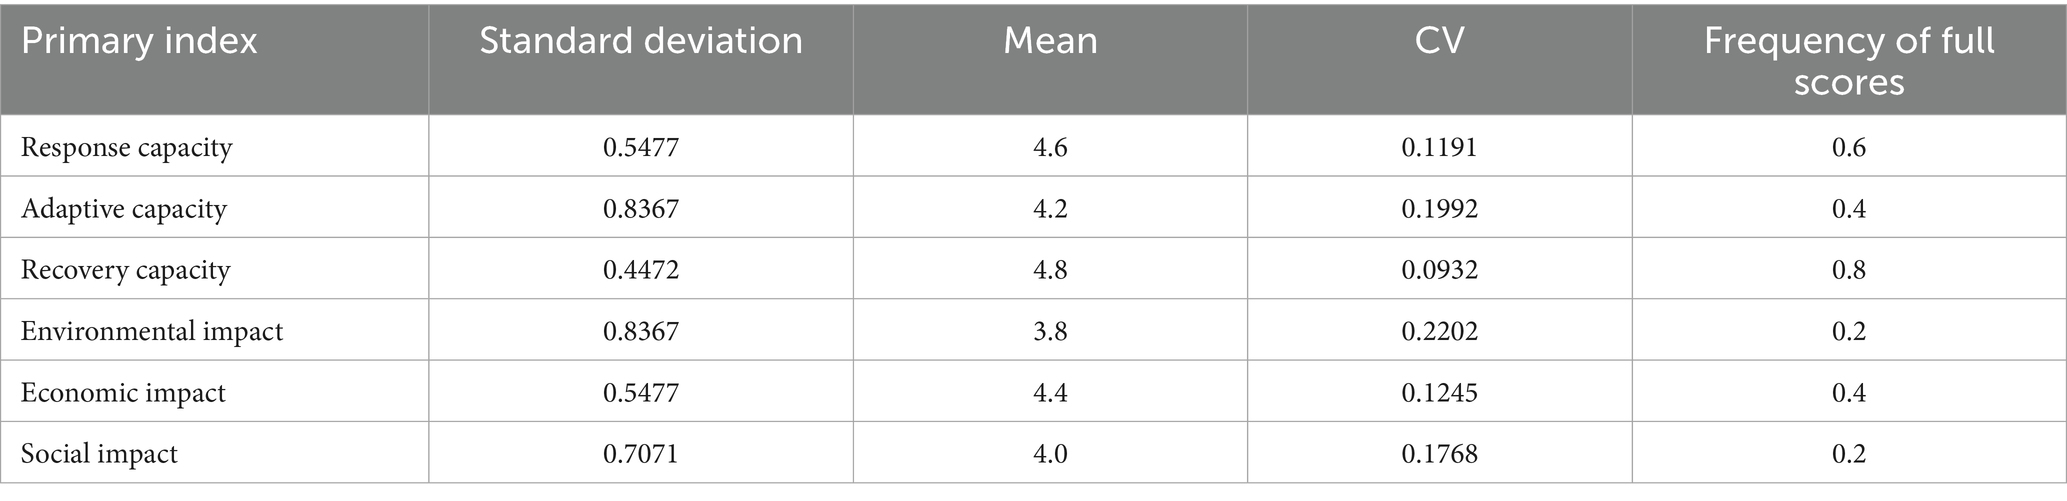
Table 3. Results from the expert consultation regarding tier 1 indicators.
In the results of the consultation regarding secondary indicators, the following indicators did not meet the retention criteria and have been removed: Managerial Qualities, Sales Adaptability, Cost Fluctuation Control Capability, and Collaboration Efficiency Among Entities. The compiled indicators were redistributed to the experts for a second round of consultation, and the results were calculated to meet the retention criteria, as shown in Table 4.
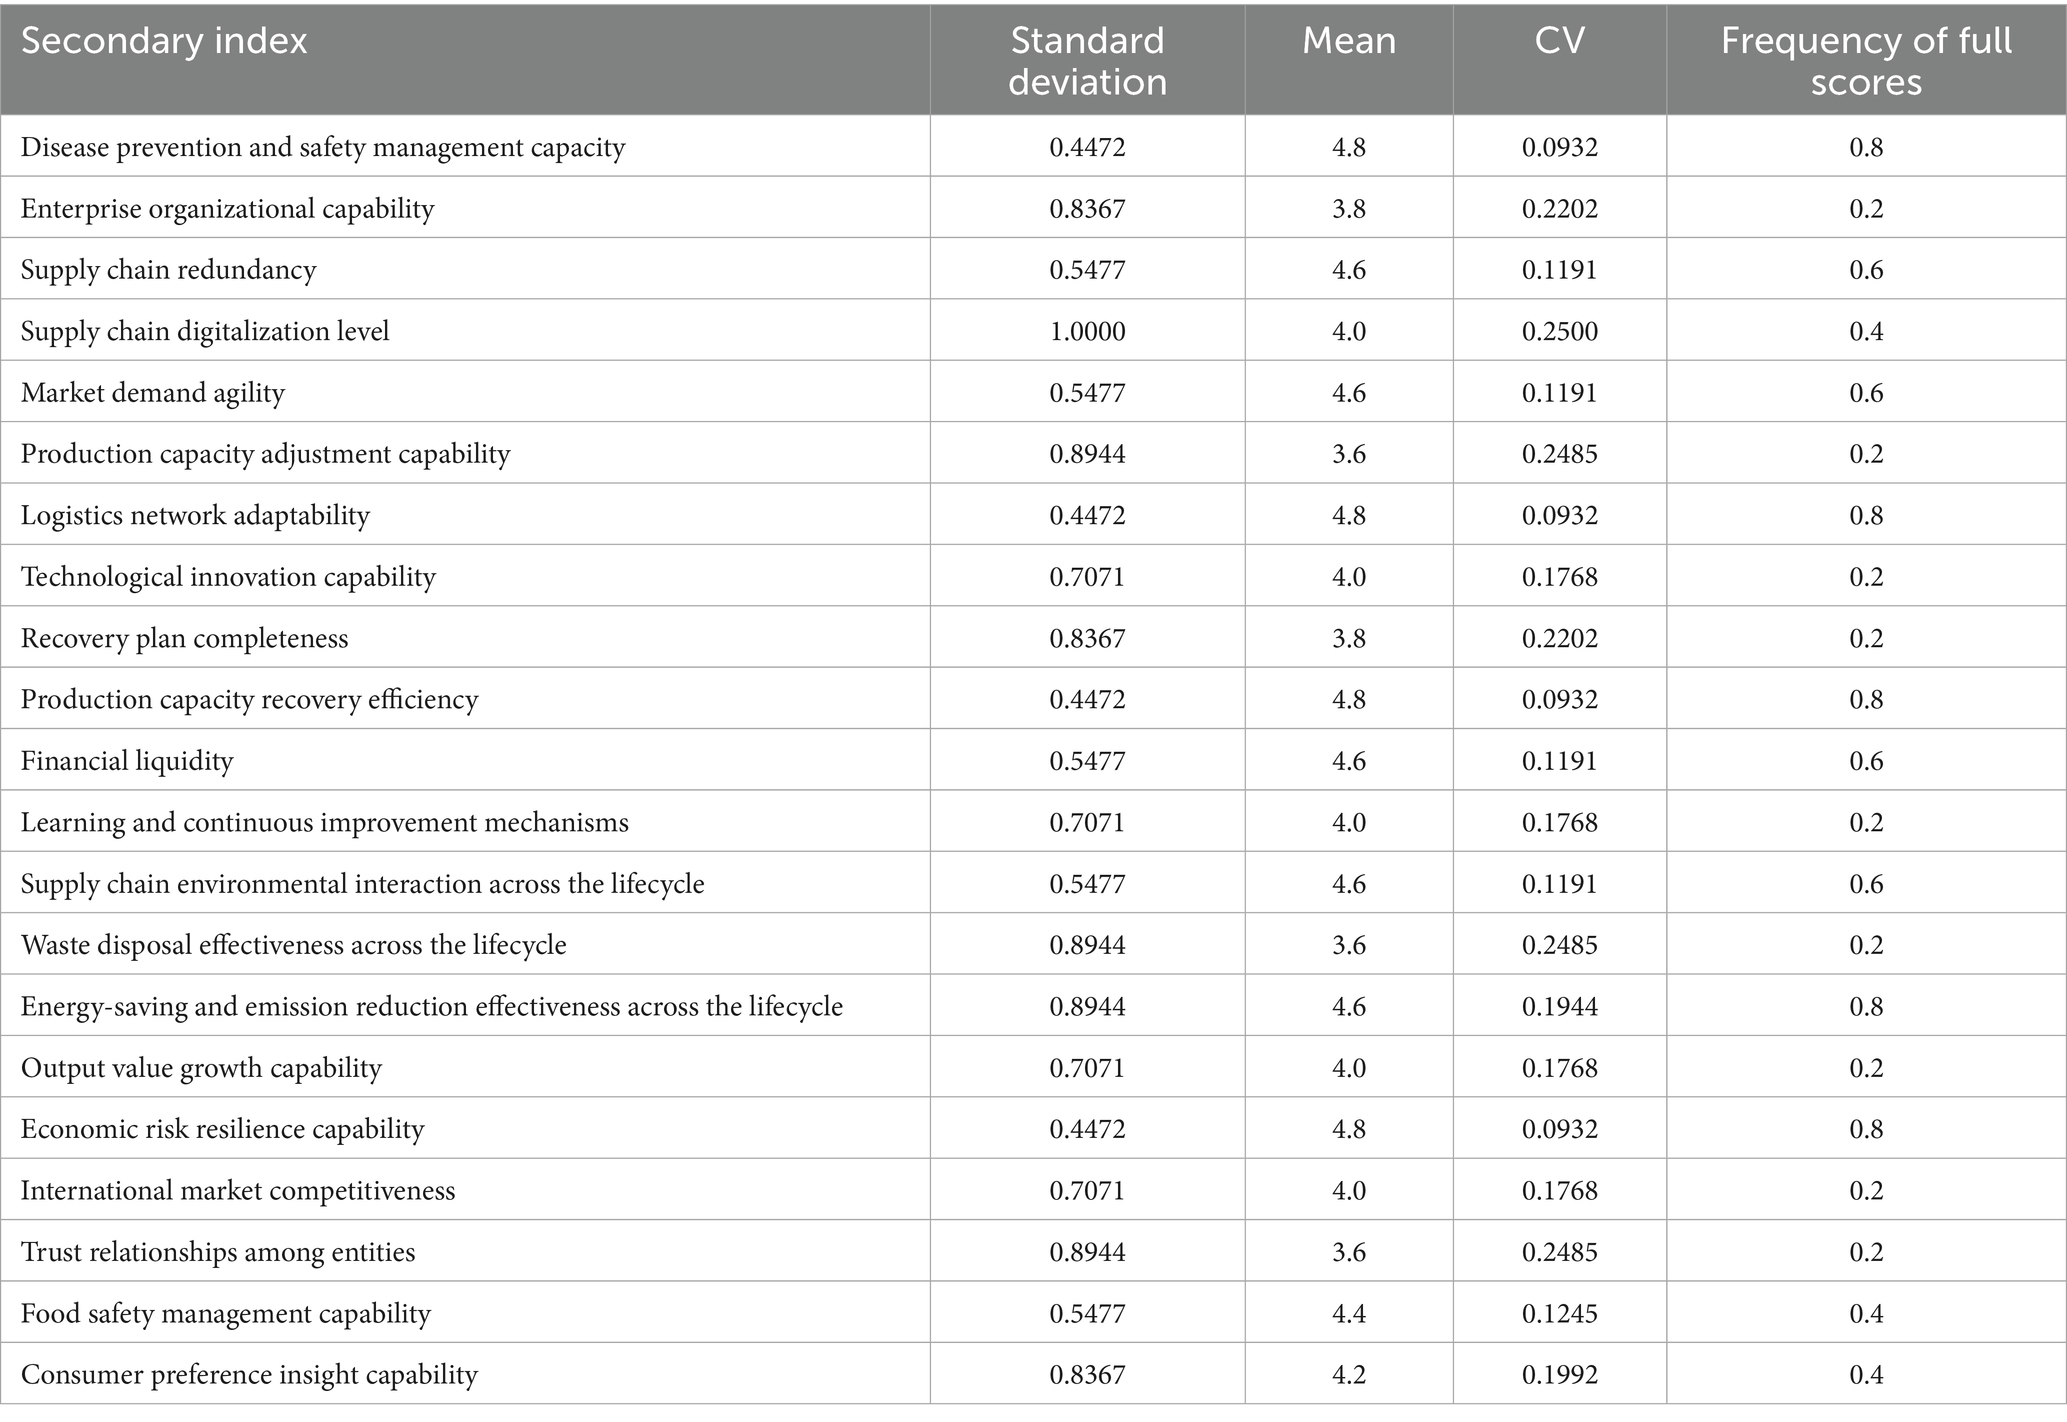
Table 4. Results from the expert consultation regarding tier 2 indicators.
In summary, after two rounds of the Delphi method, this paper establishes an indicator system for RSS influencing factors in PSC, which includes 6 primary indicators and 21 secondary indicators, as shown in Table 5.
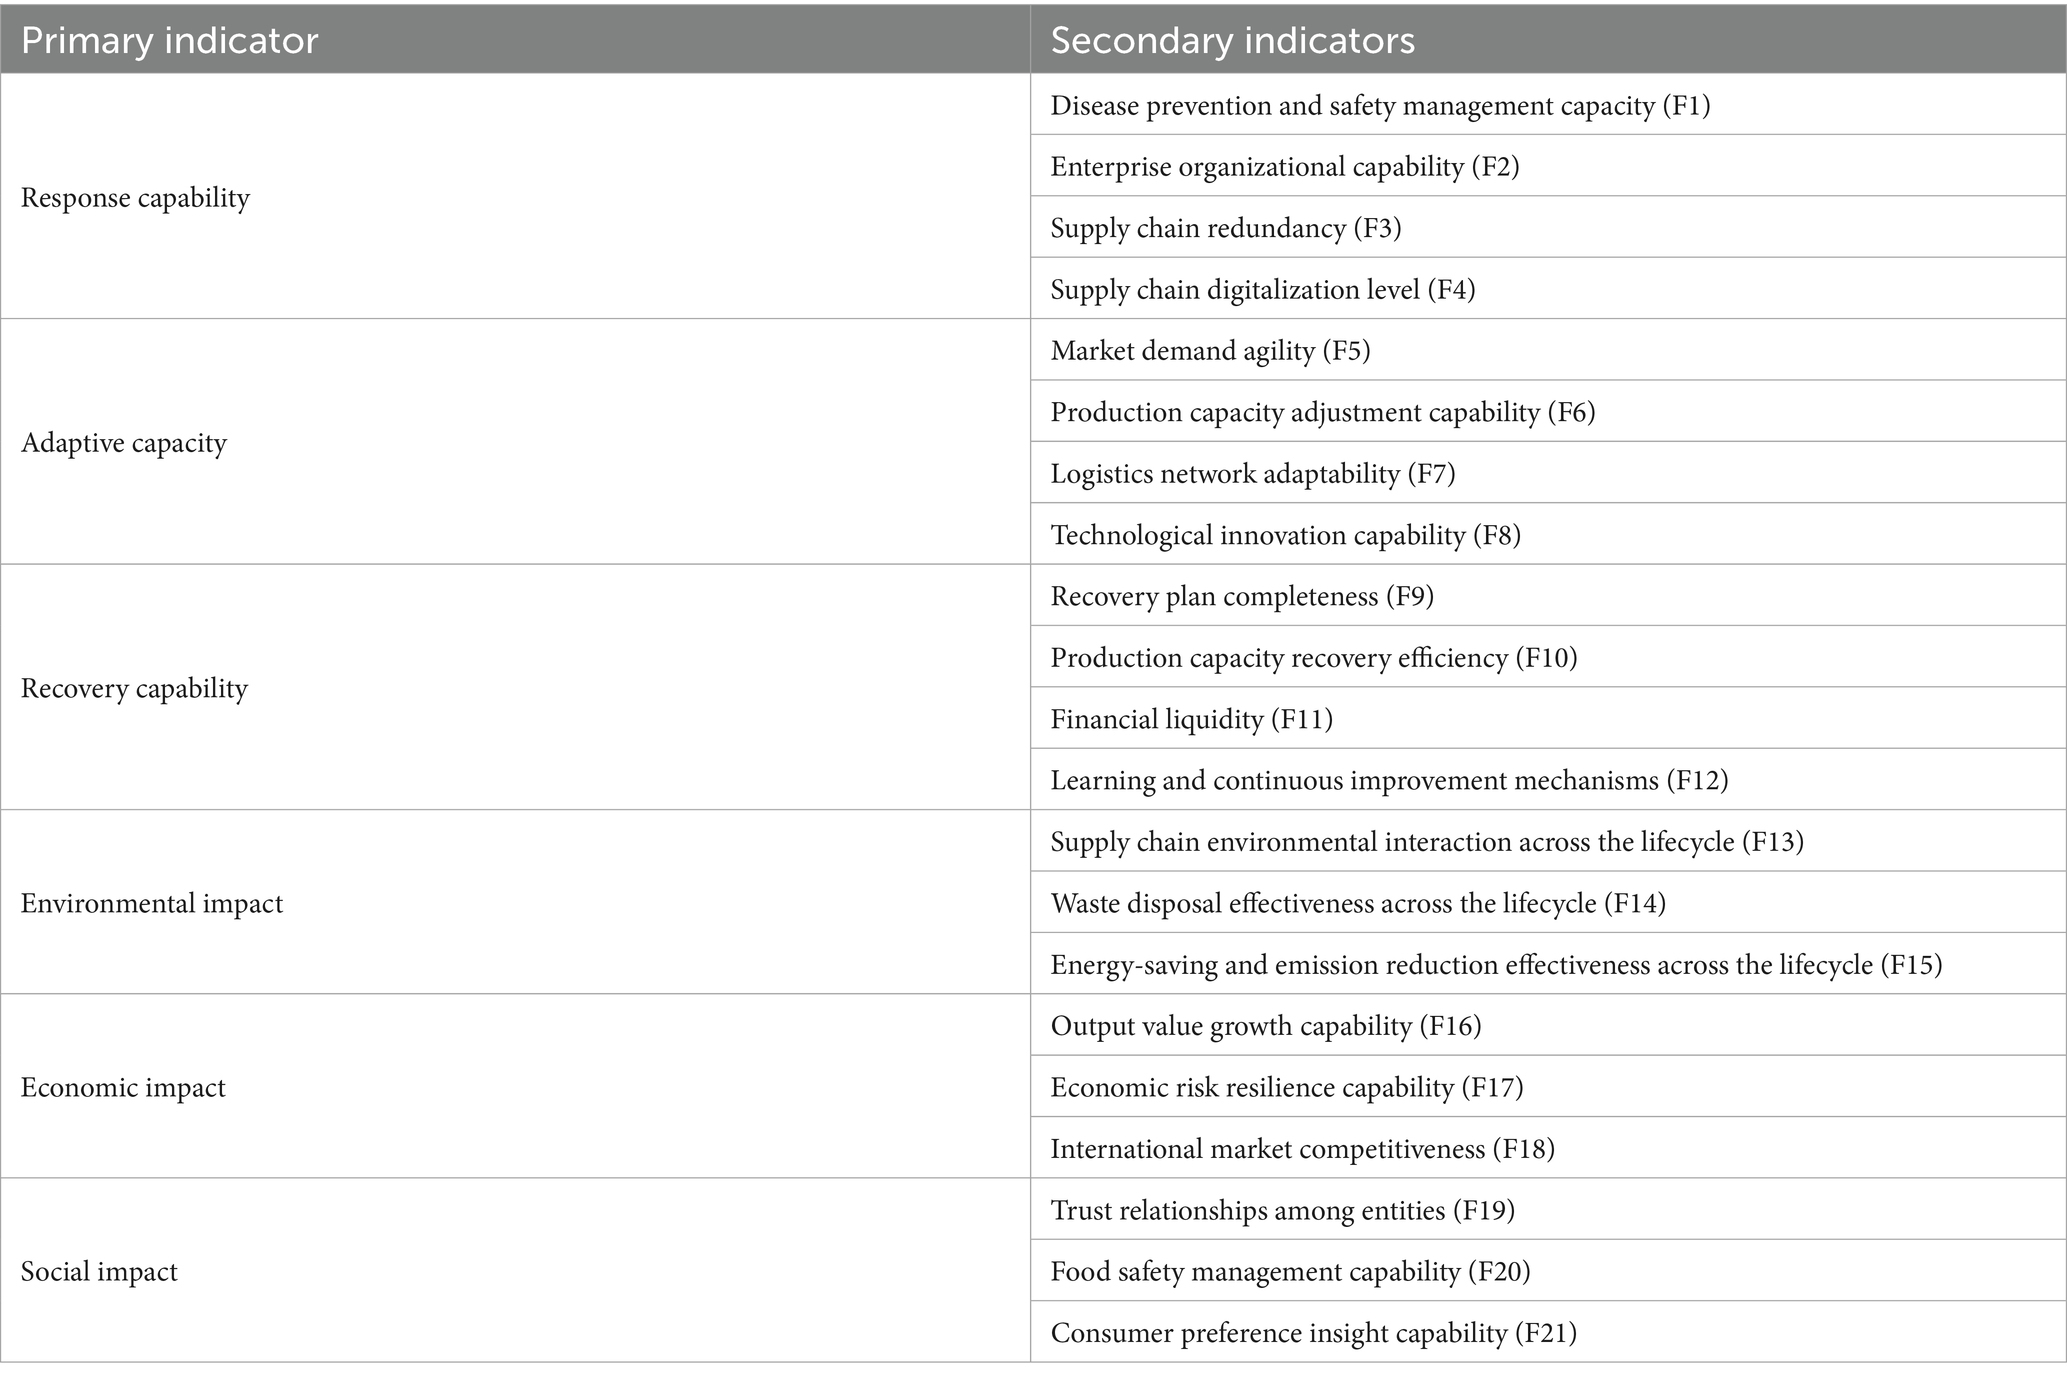
Table 5. Final influencing indicator system.
4.2 Analysis of inter-Indicator relationships based on fuzzy-DEMATEL
In Step 1, based on the final Influencing indicator system, the influence of one factor on another is divided into five scales: no influence (0), very low influence (1), low influence (2), high influence (3), and very high influence (4). The fuzzy linguistic scale is shown in Table 6.
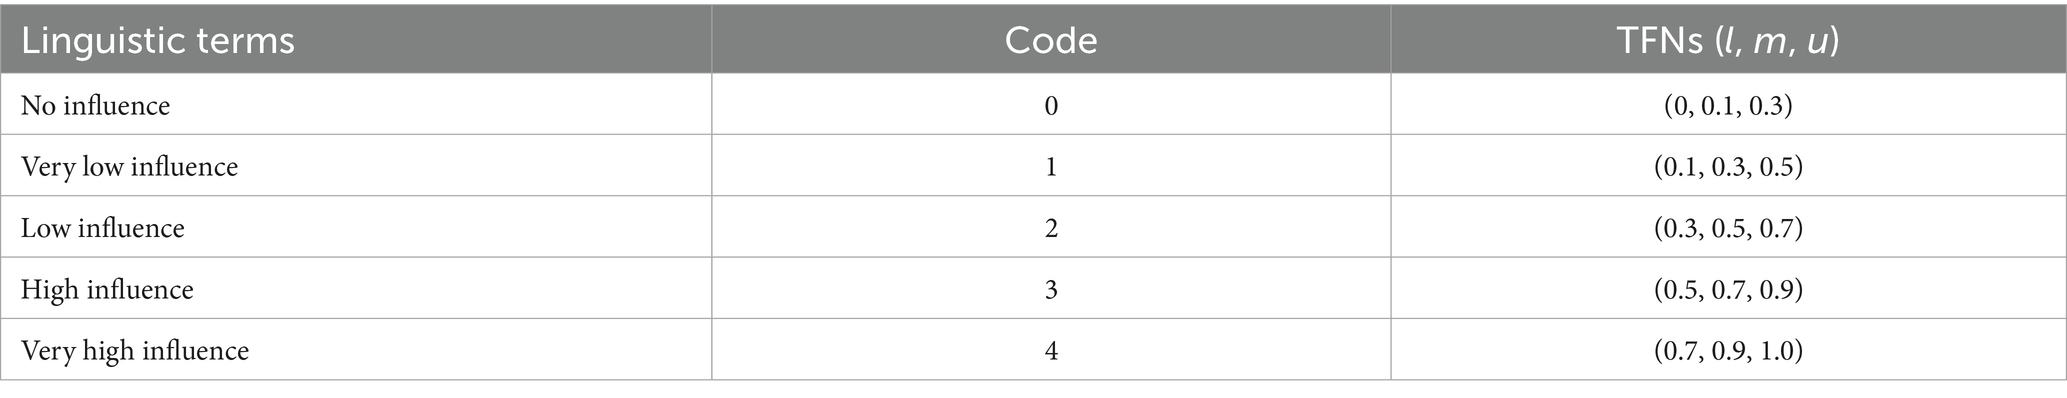
Table 6. Fuzzy linguistic scale.
In Step 2, five experts rated the relationships between factors based on their experience. According to Steps 3–5, the crisp total-relation matrix (defuzzified total influence matrix) is obtained, and the influence degree and influenced degree of each indicator are calculated using the equations in Step 6. This helps determine their center degree and cause degree. Based on the positive or negative values of D-R, the influencing indicators are categorized into two main types: cause indicators and effect indicators, as shown in Table 7.
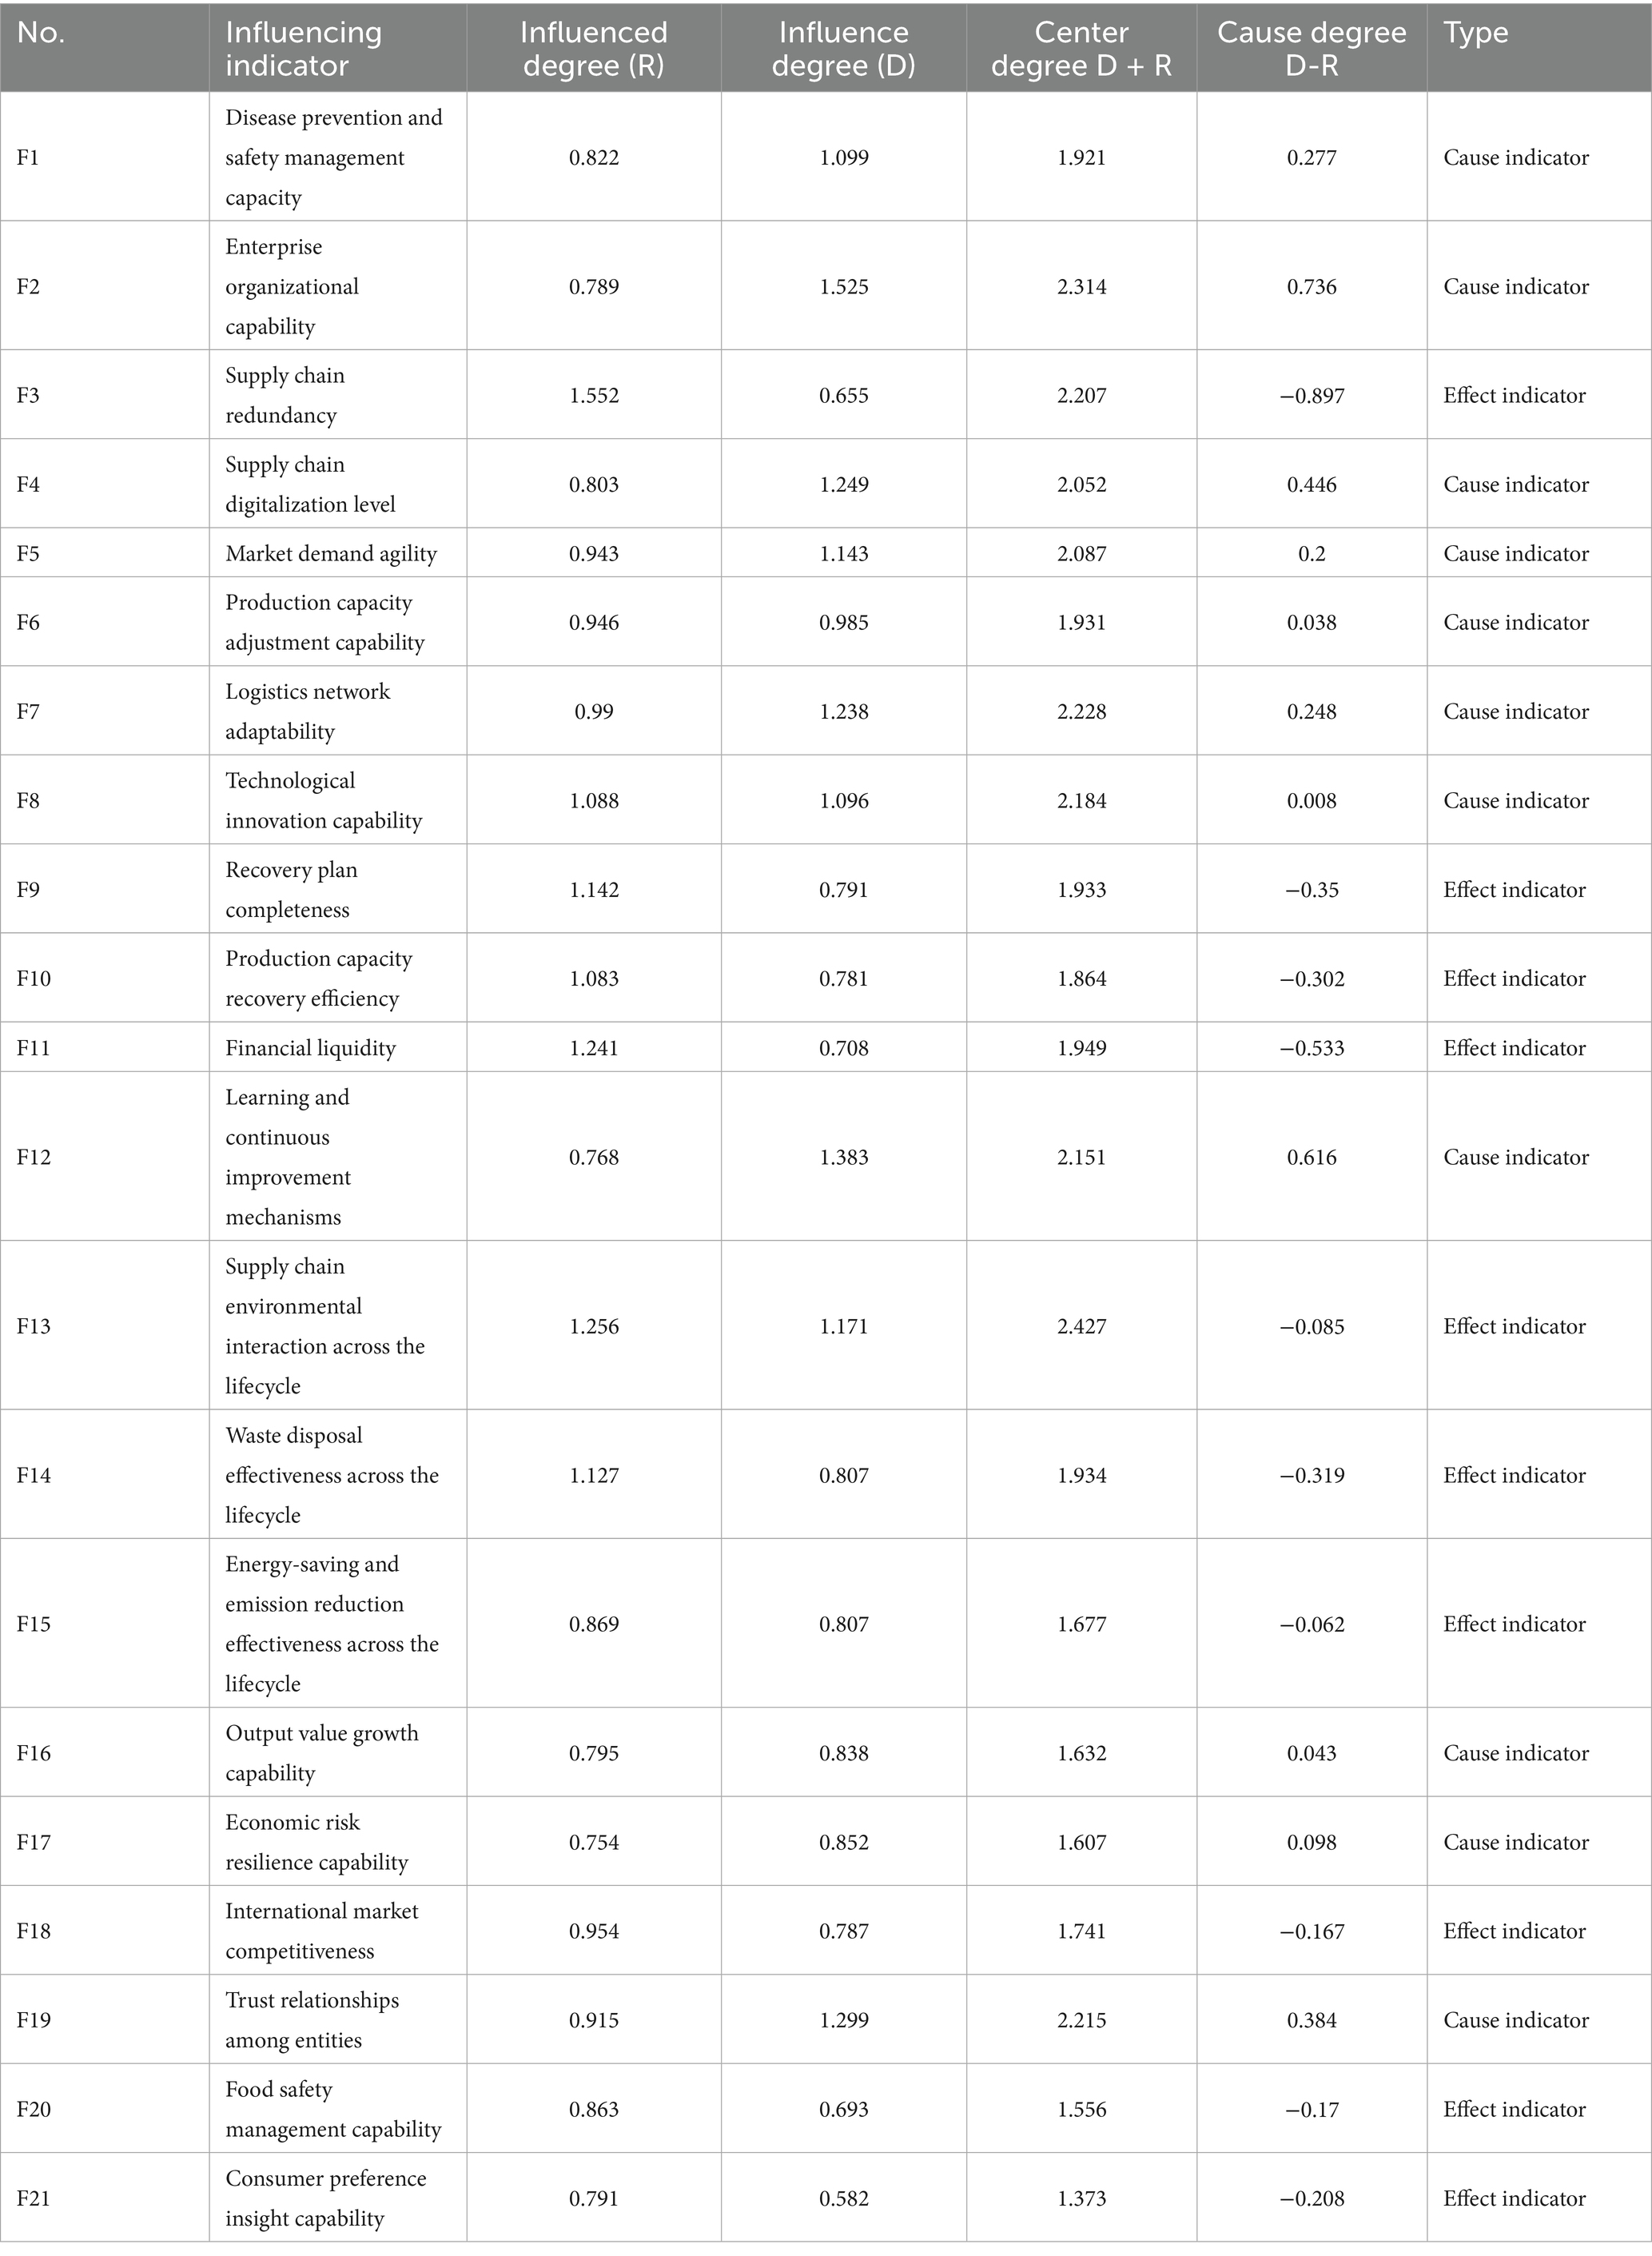
Table 7. The final output.
Ranking the center degree of cause indicators, it can be seen that enterprise organizational capability (F2), logistics network adaptability (F7), and Trust relationships among entities (F19) are the top three in importance. When ranking cause indicators by their cause degree, enterprise organizational capability (F2), Supply chain digitalization level (F4), and Learning and continuous improvement mechanisms (F12) are identified as the most direct influencing indicators. Effect indicators are more affected by other indicators, indicating they are susceptible to influence within the system.
Based on the data in Table 7, a causal quadrant diagram of the key influencing indicators for RSS in PSC is plotted, with center degree on the horizontal axis and cause degree on the vertical axis, as shown in Figure 2.
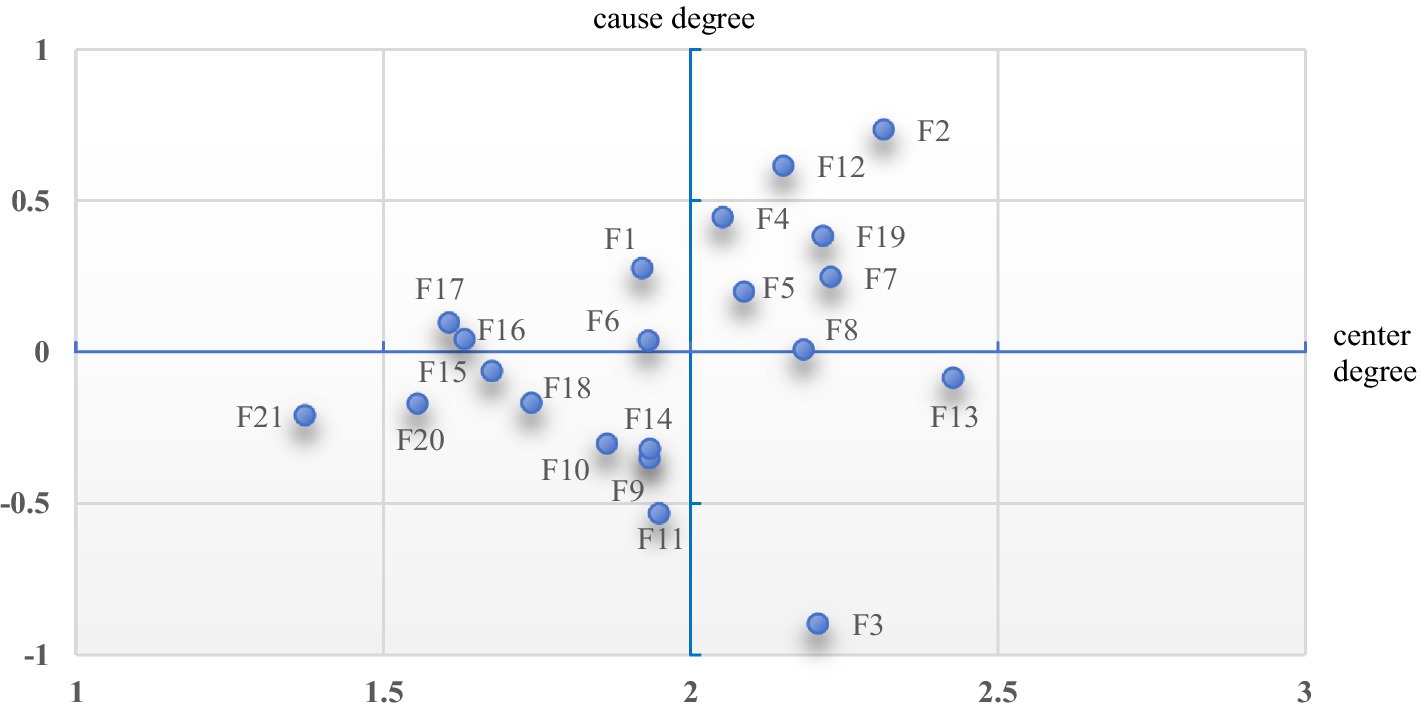
Figure 2. Causal quadrant diagram.
It can be observed that:
4.2.1 Quadrant 1 (center degree > 2, cause degree > 0)
The influencing indicators include enterprise organizational capability (F2), Supply chain digitalization level (F4), and five other indicators. These indicators have the greatest influence on RSS in PSC, and are referred to as “key driving indicators.” The further the indicator is from the quadrant intersection point, the more critical it is.
4.2.2 Quadrant 2 (center degree < 2, cause degree > 0)
The influencing indicators include Disease prevention and safety management capacity (F1), Production capacity adjustment capability (F6), and two other indicators. These indicators have a minor but still positive supporting role on RSS in PSC, and are referred to as “supporting indicators. “.
4.2.3 Quadrant 3 (center degree< 2, cause degree < 0)
The influencing indicators include the Recovery plan completeness (F9), Production capacity recovery efficiency (F10), and five other indicators. These indicators have a smaller impact on RSS in PSC and are effect indicators, referred to as “secondary constraint indicators.”
4.2.4 Quadrant 4 (center degree> 2, cause degree < 0)
The influencing indicators include supply chain redundancy (F3) and Supply chain environmental interaction across the lifecycle (F13). These indicators significantly impact RSS in PSC but are effect indicators, meaning they have high influence but are passive responses, thus referred to as “primary constraint indicators.”
4.3 Weights calculation based on ANP and comprehensive ranking
In Step 7, the unweighted supermatrix of the Analytic Network Process (ANP) method is created from the defuzzified total influence matrix obtained through the Fuzzy-Dematel approach. In Step 8, this unweighted supermatrix is standardized to produce the weighted supermatrix. Step 9 involves applying the power iteration method to the weighted supermatrix until it converges to a stable limit supermatrix. From this stable matrix, the weights of each influencing factor are derived. Finally, by combining the centrality and ANP rankings, the comprehensive ranking results are calculated, as shown in Table 8.
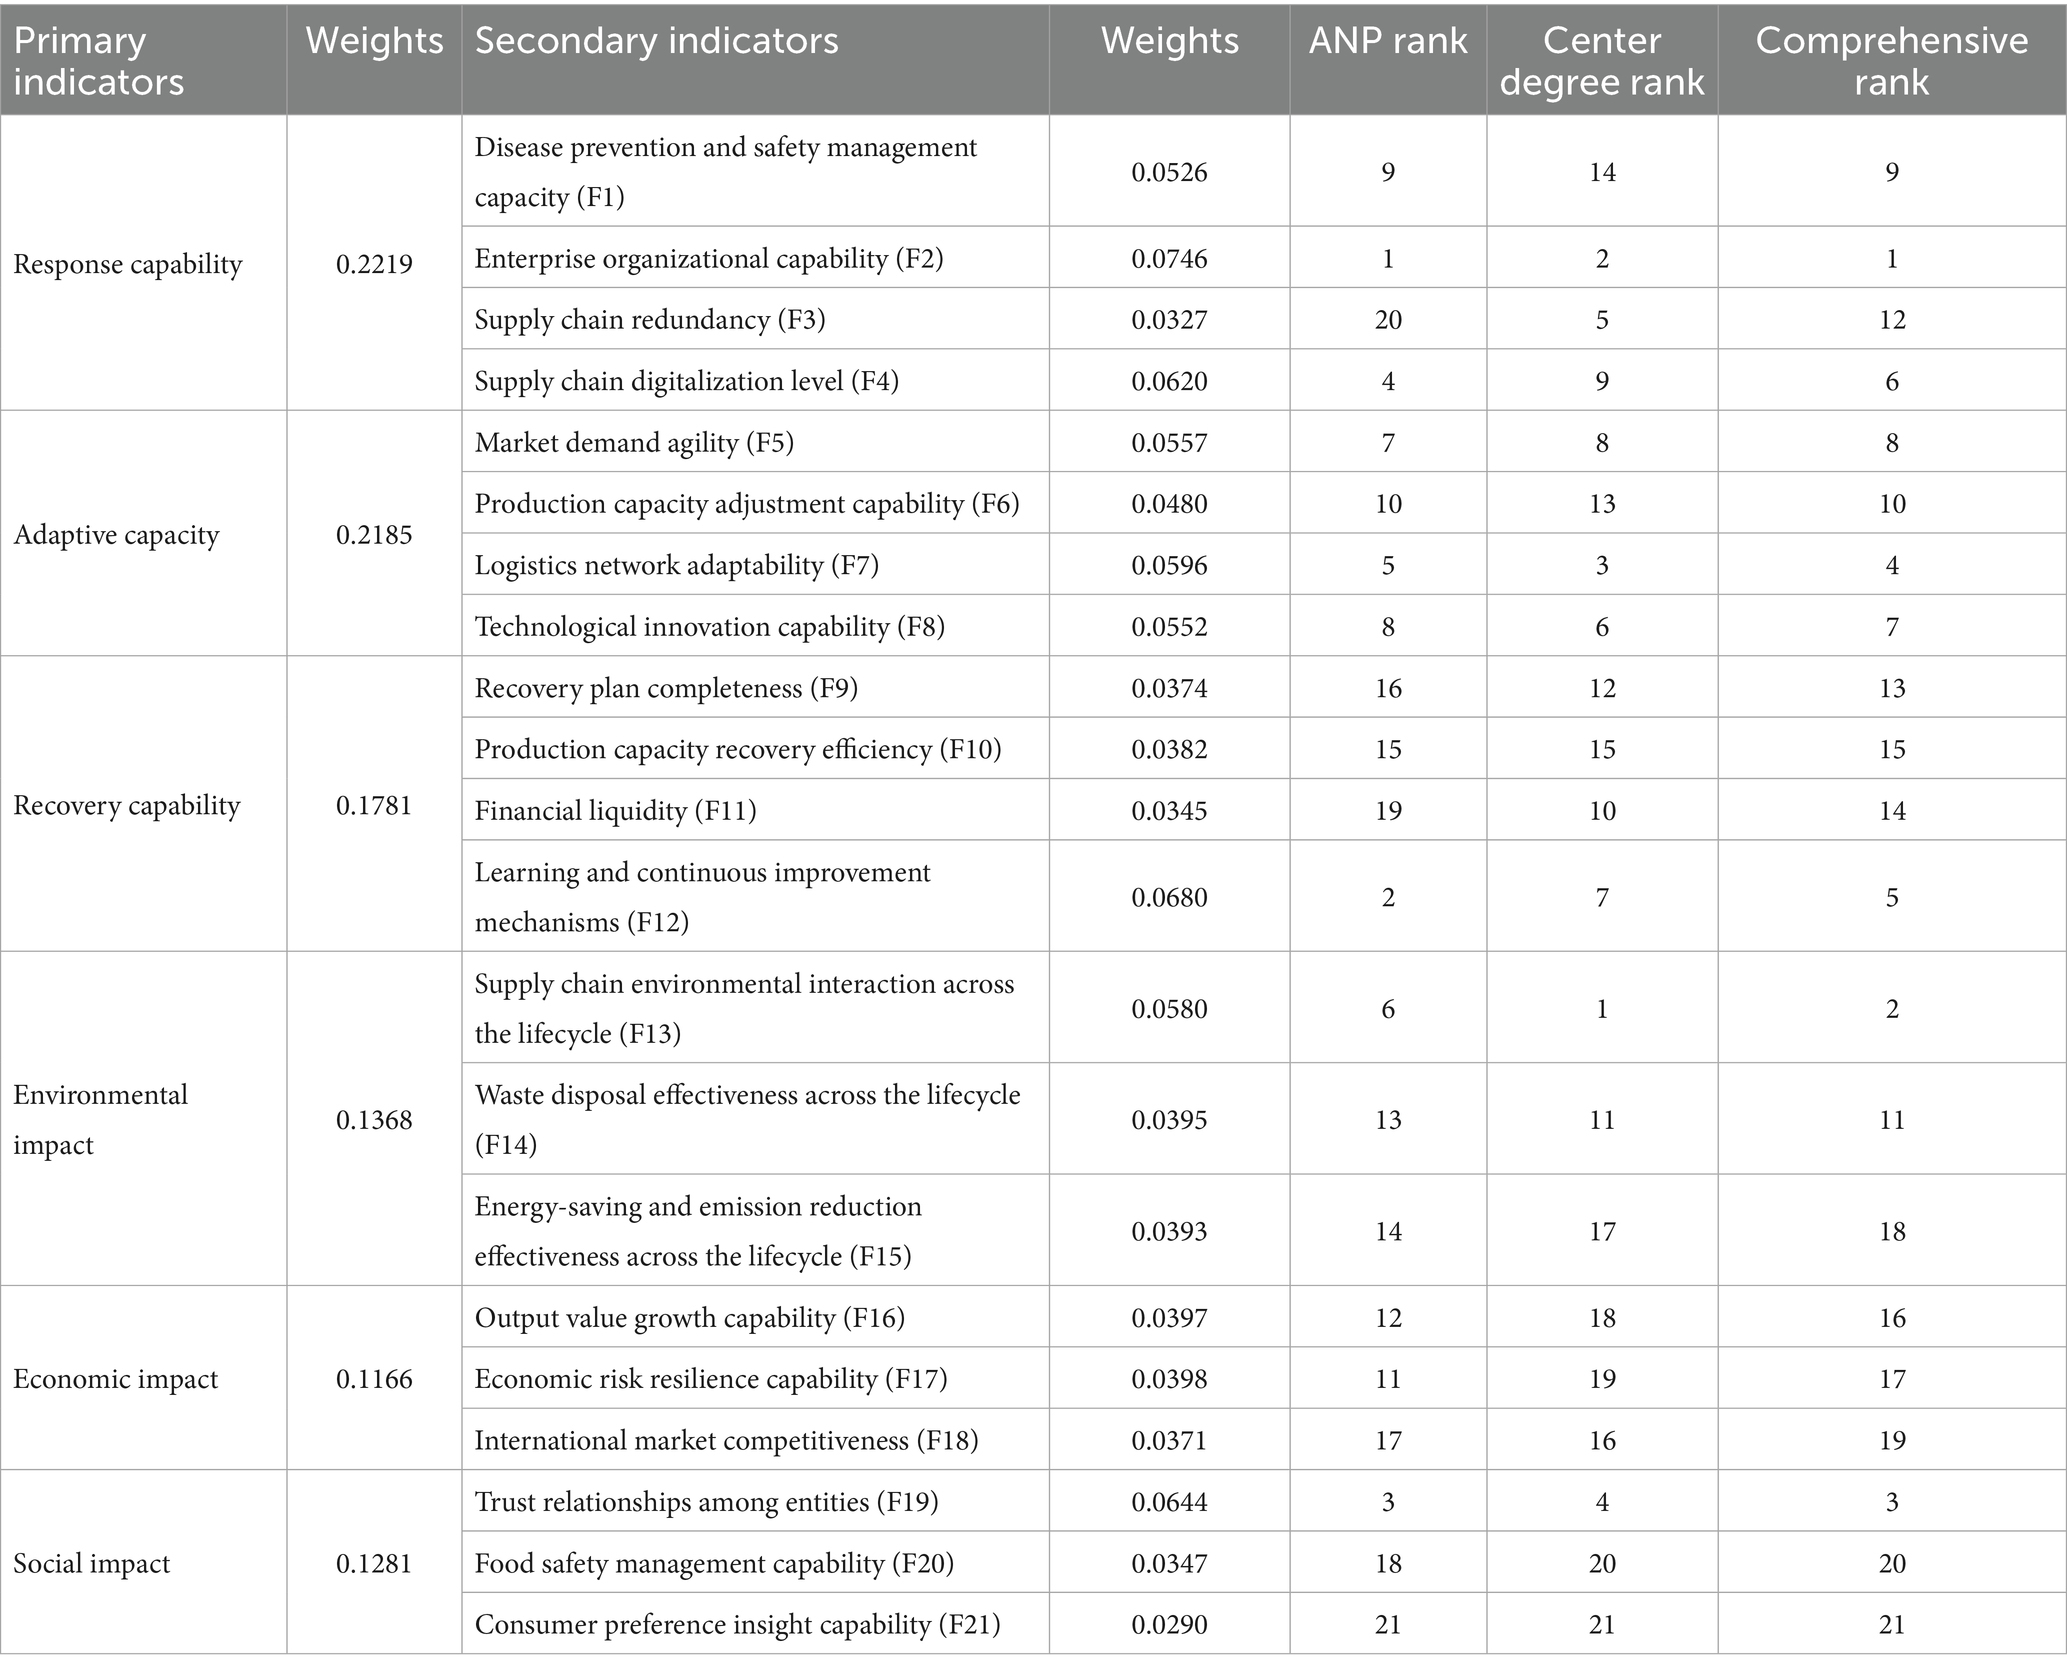
Table 8. Weights and ranking of influencing factors.
Based on the comprehensive ranking, the top 7 influencing factors identified as critical for the synergistic development of resilience and sustainability in the PSC are: Enterprise organizational capability (F2), Supply chain environmental interaction across the lifecycle (F13), Trust relationships among entities (F19), Logistics network adaptability (F7), Learning and continuous improvement mechanisms (F12), Supply chain digitalization level (F4), and Technological innovation capability (F8).
4.4 Regional empirical analysis of RSS in China’s PSC
Based on the level of economic development, pig industry layout and supply chain structure differences in eastern, central and western China, this paper selects Zhejiang Province (Eastern China), Henan Province (Central China) and Sichuan Province (Western China) as the research objects to analyze the RSS of PSC.
Zhejiang Province (Eastern China) represents a typical exogenous consumption-driven PSC model. The province is limited by land resources, and more than 60% of pigs need to be transferred out. However, the downstream of its PSC has significant advantages, relying on the consumption power of urban agglomerations and digital infrastructure to form downstream clusters centered on deep processing and cold chain logistics. The core challenge lies in the lack of resilience in the upstream of the supply chain.
Henan Province (Central China) has built a leading endogenous production-led PSC model. Relying on the resource endowment of the “grain silo of the Central Plains,” its supply chain is characterized by “large-scale production and full-chain integration,” with a self-sufficiency rate of pork reaching 120%, and the annual net outward transfer volume ranking among the top three in the country. Among them, Muyuan Group has an annual production capacity of more than 30 million heads, driving the intensive production of nearly 70% of farms in the province; Shuanghui Group has an annual slaughtering and processing capacity of 15 million heads, and through vertical integration, it has reduced the loss rate of the cold chain to less than 3%. Core challenges center on capacity concentration risks and environmental pressures.
Sichuan Province (Western China) has developed a unique ecologically sensitive composite PSC model. The province integrates ecological free-range farming in the highlands with intensive production in the Chengdu Plain, with a breeding cycle system covering 82 counties and the highest ecological carrying capacity in the West. The current development urgently needs to seek a balance between ecological sensitivity and industrial sustainability, both in terms of resolving restrictions on the expansion of the no-farming zone and the significant risk of logistical disruption due to the geographic conditions of the seismic zone.
This paper invited ten experts to assess the evaluation levels of 21 factors across three provinces, ultimately compiling the provincial RSS evaluation results in Tables 9–11.
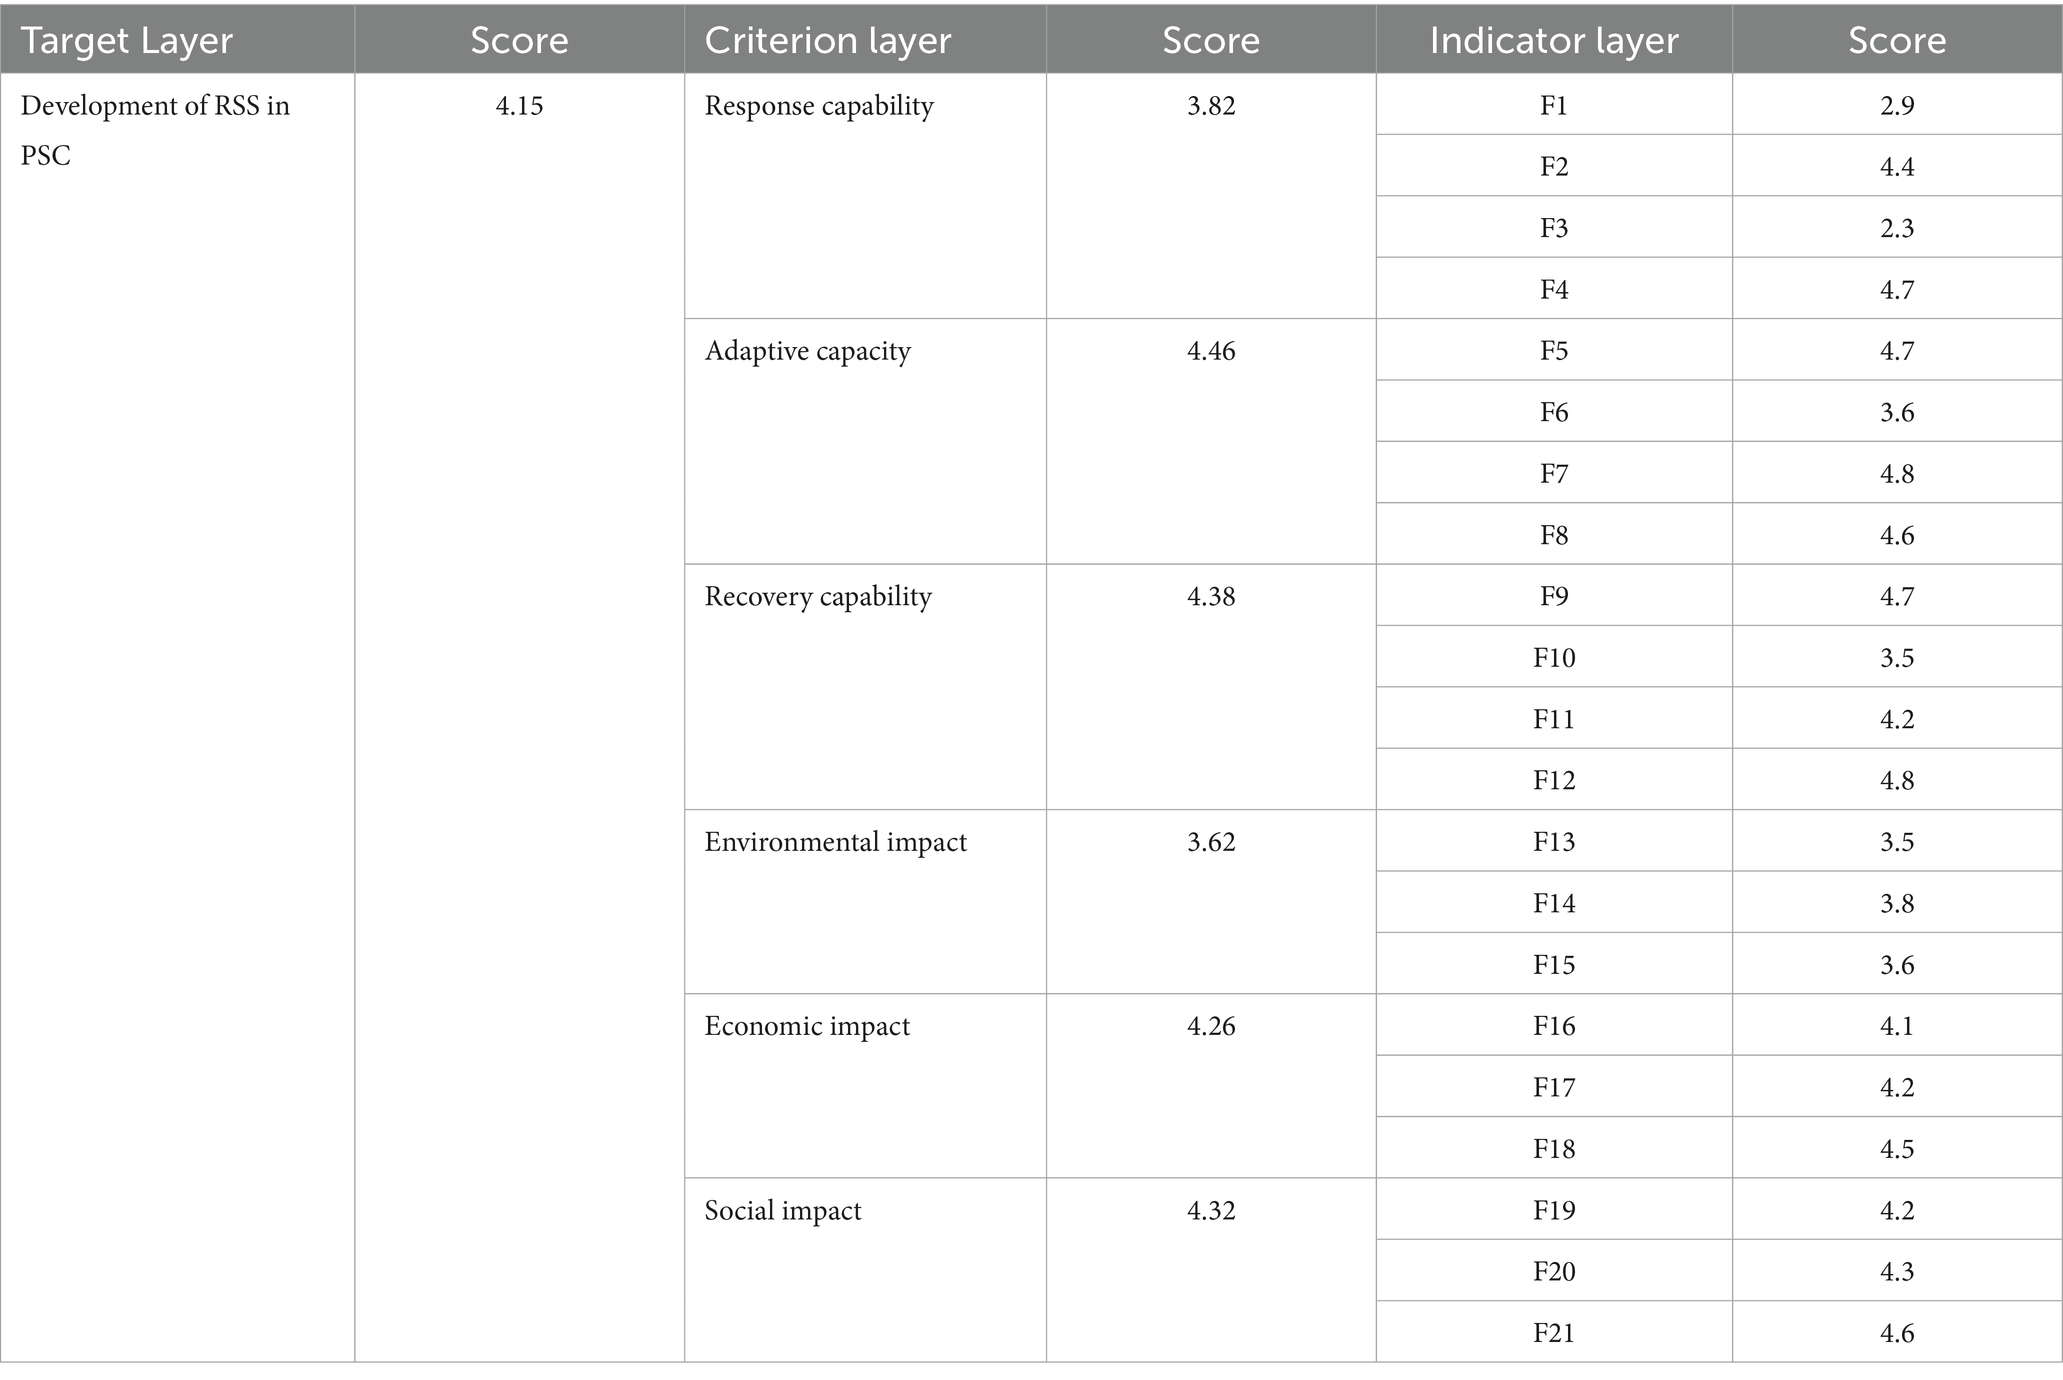
Table 9. Fuzzy comprehensive evaluation results for Zhejiang Province (Eastern China).

Table 10. Fuzzy comprehensive evaluation results for Henan Province (Central China).
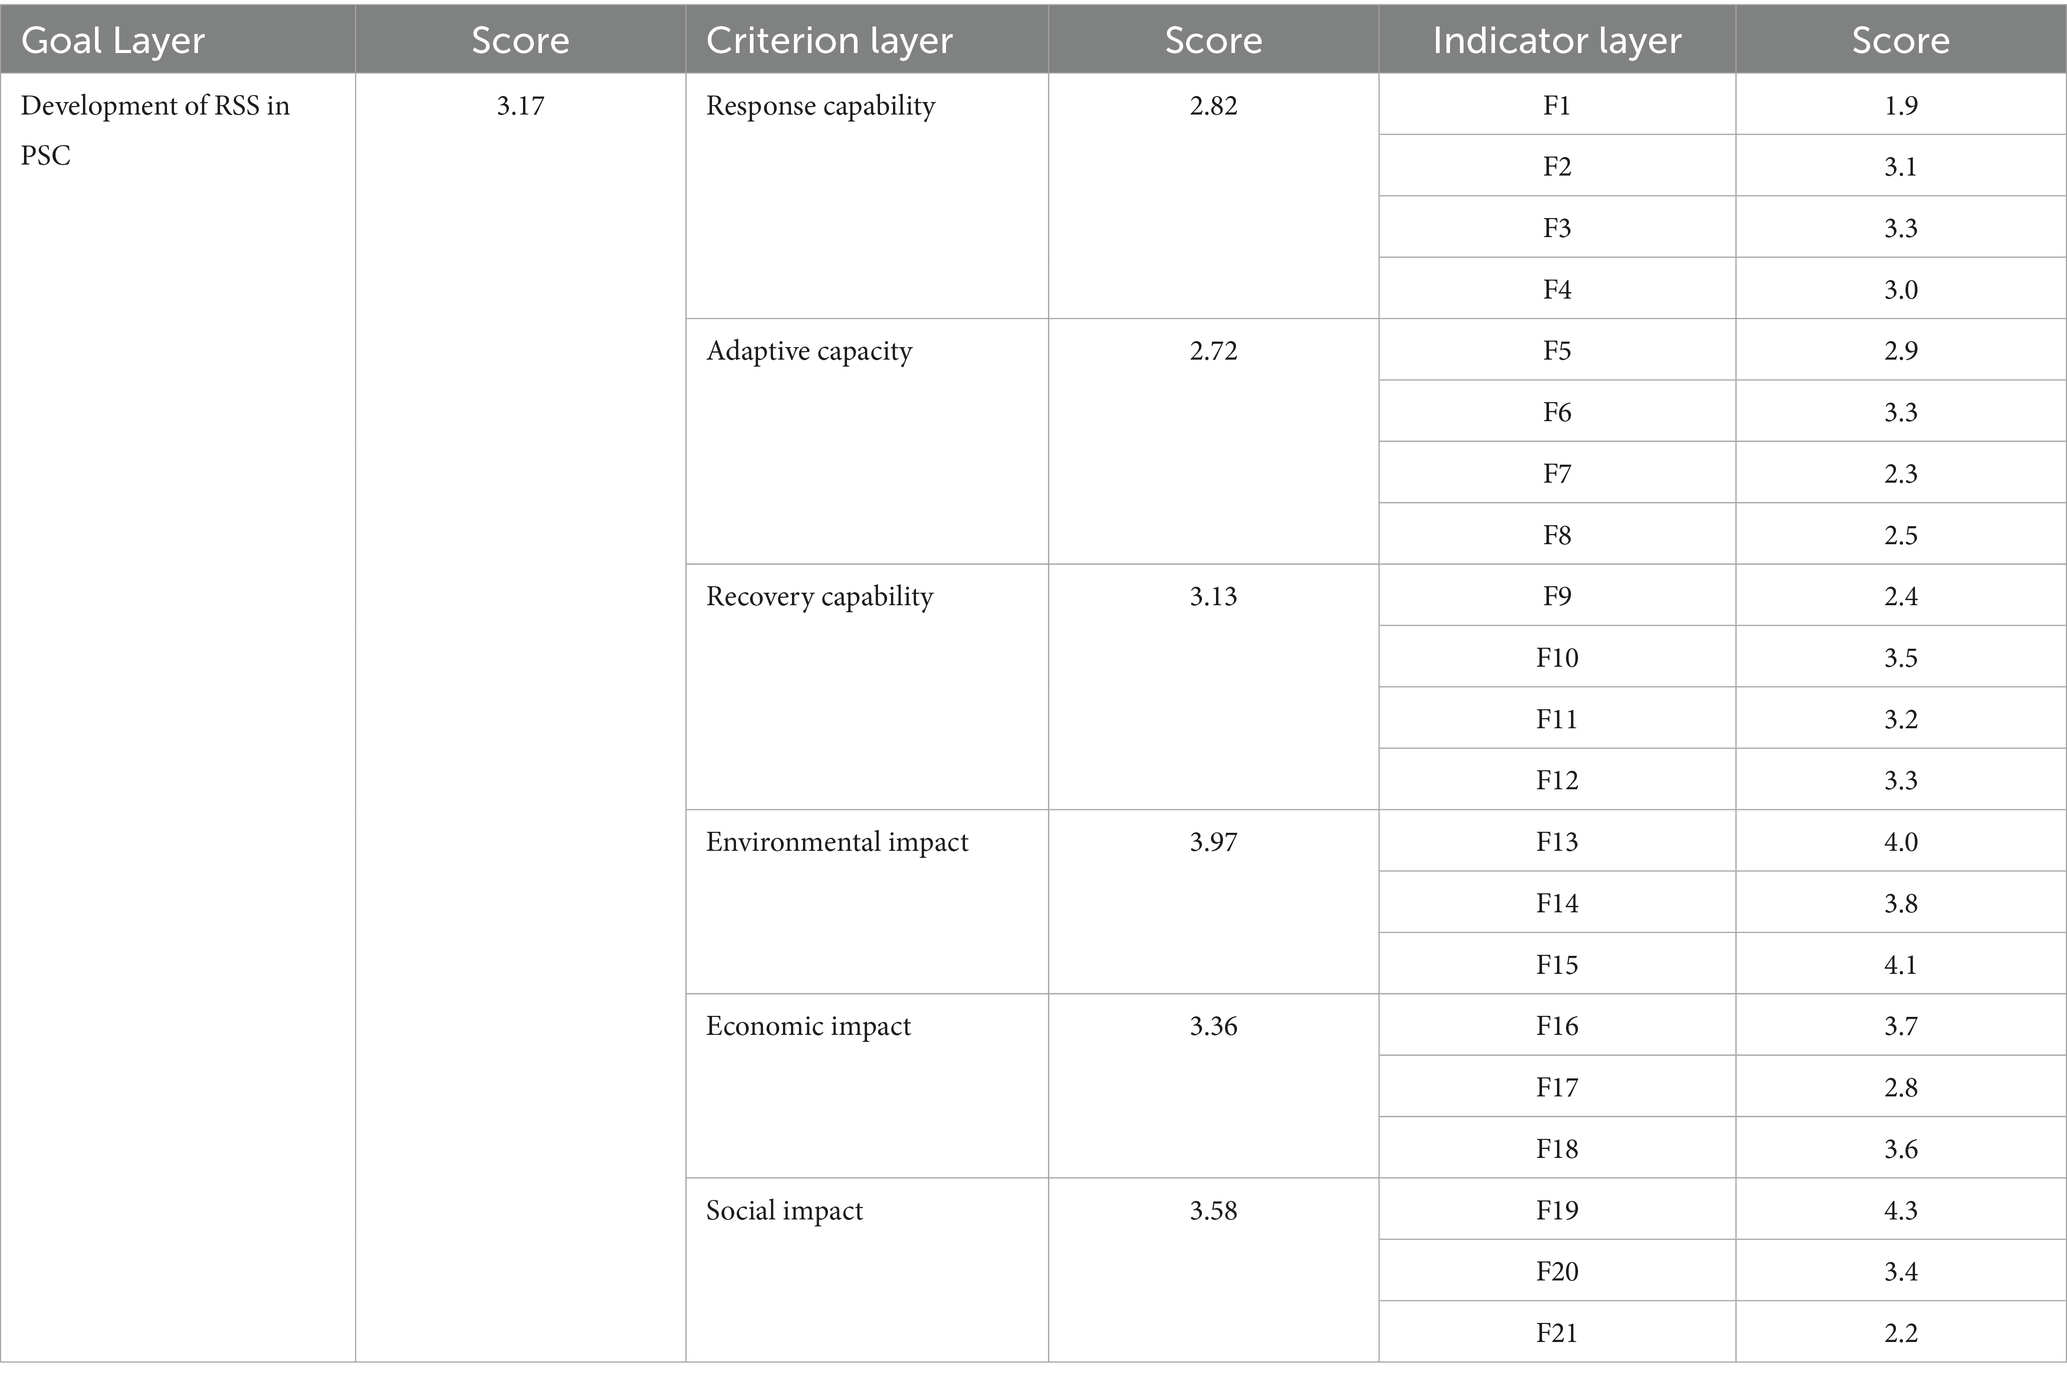
Table 11. Fuzzy comprehensive evaluation results for Sichuan Province (Western China).
The results show that Zhejiang Province (Eastern China) scored 4.15 points for the RSS in PSC, with a rating of “high (lower)”; Henan Province (Central China) scored 3.67 points, with a rating of “relatively high (upper)”; Sichuan Province (Western China) scored 3.17, with a rating of “relatively high (lower).” This result marks a significant departure from the traditional view that “capacity size determines stability,” where “Central China” is ranked higher than “Eastern China,” which is in turn ranked higher than “Western China.” The primary reason for this change is that digitalization on the consumer side enhances resilience beyond the conventional benefits associated with the capacity size. Specifically, the KIFs related to the RSS in Zhejiang, including F4, F5, F7, F8, F9, F12, and F21, all received scores exceeding 4.5 points in the fuzzy composite evaluation, indicating an advanced level of performance and forming a notable competitive advantage.
Moreover, the analysis finds that resilience and sustainable development face a profound conflict. Downstream digitization capacity (F4 of 4.7) in Zhejiang Province improves cold chain responsiveness. At the same time, land resource constraints weaken upstream manure resource utilization capacity (F4 of 3.8), creating a dumbbell imbalance of “high digital resilience-low environmental sustainability.” In Henan Province, the elasticity of large-scale production (F6, 4.1) guarantees a stable supply. Still, high farming density leads to environmental overload (F13, 2.4), reflecting the structural contradiction of “strong production elasticity-weak ecological sustainability.” The highland eco-agriculture model (F15, 4.1) maintains environmental sustainability in Sichuan Province. Still, the logistical vulnerability of the seismic zone (F7, 2.3) threatens the continuity of the supply chain, highlighting the dilemma between ecological protection and operational resilience.
While the differences in the three provinces’ performance on the KIFs reflect differences in regional development priorities, their core set of factors remains consistent: F2 ranks in the top three in all three provinces, confirming its robustness in the first place in the ANP weights; F13 has a significant weight in the ecologically sensitive Sichuan province; and F19 scores the highest in Henan, echoing the strong drive shown in the causal quadrant diagram showing strong drivers. Thus, regional differences did not change the relative importance of the KIFs and verified the stability.
5 Discussion
(1) By arranging the weight results of the primary indicators in the RSS system in descending order, it is evident that the weight rankings of PSC response capability, adaptive capability, and recovery capability are among the top three, all of which fall under the category of supply chain resilience. This result demonstrates that RSS does not imply that resilience and sustainability are always equally important; instead, they need to be dynamically balanced based on the development stage of the supply chain. At the current stage in China, the management of PSC should primarily focus on enhancing resilience. As discussed earlier, the world has recently experienced African Swine Fever and the COVID-19 pandemic, significantly impacting China’s PSCR due to its substantial pig consumption. Additionally, the characteristics of China’s pig industry, such as poor intensification, an inadequate pig logistics network, and an imbalanced ratio of high-temperature to low-temperature pig products, pose challenges to the resilience and sustainability of PSC. There’s an old Chinese saying, “Three feet of ice does not form in a single day,” indicating that the issues facing China’s PSC cannot be entirely resolved in a short period. The findings of this study provide a scientific approach to optimizing the supply chain, suggesting that enhancing resilience should be the primary task while prioritizing the synergistic key indicators’ composite effects in improving resilience and sustainability. The following discussion will address the key indicators and transformation strategies.
(2) According to the comprehensive ranking results, Enterprise organizational capability (F2) is recognized as the most critical indicator in RSS. In studies by Gasco-Hernandez (Gasco-Hernandez et al., 2022) and Cedergren (Cedergren and Hassel, 2024), Enterprise organizational capability (F2) is also considered a key factor in enhancing PSCR, consistent with the findings of this study. If PSC breaks down and cannot be quickly recovered, it can lead to inventory backlogs, capital pledges, and product deterioration in various supply chain segments. Given the poor self-recovery capability of PSC, it cannot rely on spontaneous coordination among entities to recover the chain when it breaks. Strong core enterprises with significant organizational capability are essential to coordinate supply chain entities, recover critical broken links, and rebuild supply chain pathways (Bowman et al., 2013; Nadal-Roig et al., 2019). Besides its impact on resilience, enterprise organizational capability (F2) also significantly influences PSCS. The poor intensification of China’s pig industry means that excellent core supply chain enterprises can leverage their brand effects, financial advantages, and technical capabilities to support more small and medium-sized enterprises and individual farmers, ensuring higher green technology empowerment and better environmental friendliness in their supply chains. Companies like Muyuan and WENS in China have utilized their outstanding supply chain organizational capabilities through mechanisms such as flexible production contracts and joint liability systems to organize their upstream and downstream partners, achieving risk-sharing and technology sharing, and building a RSS-featured “moat” (Zhou et al., 2013).
Trust relationships among entities (F19) and Enterprise organizational capability (F2) should be analyzed together. F19 is the foundational condition for the implementation of F2, which is also why F19 ranks third in the comprehensive weight ranking. In a low-trust environment among supply chain entities, there will be negative impacts on RSS. For instance, without stable orders from breeding producers, feed suppliers are unwilling to invest in high-quality feed research and development due to high sunk costs. This results in stagnant product quality and production efficiency across the entire supply chain (Goumeida et al., 2024). Conversely, if stable strategic partnerships are established among supply chain entities, it will create a positive feedback loop driven by innovation.
(3) Supply chain environmental interaction across the lifecycle (F13) ranks second in the comprehensive ranking. The interaction includes green feed supply, the environmental impact of breeding, waste treatment from breeding, and the low-carbon processes of breeding and logistics. Clearly, F13 highlights the urgency of integrating environmentally friendly strategies into supply chain construction, aiming to reduce negative externalities and enhance adaptability and resilience to environmental disturbances. Implementing China’s “dual-carbon” goals and rural revitalization strategy has provided critical policy opportunities for optimizing F13. The “dual-carbon” goals guide low-carbon transformation among PSC stakeholders through policy tools such as green finance and carbon trading mechanisms. In Zhejiang Province, for instance, green credit has supported enterprises like Muyuan in establishing a “farming-manure resource utilization-new energy” circular system, which converts livestock manure into biogas for power generation. This reduces carbon emissions in the farming process and generates additional revenue through carbon credit trading, achieving synergistic enhancement of RSS in PSC. The rural revitalization strategy enhances F13 optimization via ecological compensation mechanisms and circular agriculture policies. Government subsidies for farming entities to purchase manure recycling equipment have increased the comprehensive utilization rate of agricultural waste. Through “Digital Countryside” infrastructure projects, intelligent monitoring systems for farming environments have been deployed to track real-time carbon emission data from pig farms and integrate with environmental authorities for early warning, prompting enterprises to optimize farming processes proactively. This has formed a positive feedback loop of “policy incentives-technology adoption-environmental improvement.”
Notably, according to Figure 2, F13 is the most significant constraint indicator. Therefore, optimization strategies for F13 should focus on its cause indicators. Causal analysis shows that the two most influencing indicators on F13 are Enterprise organizational capability (F2) and Learning and continuous improvement mechanisms (F12). This indicates that upgrading F13 requires deeply embedding green supply chain management principles into the entire lifecycle of the pig industry chain through core enterprises.
(4) Logistics network adaptability (F7) ranks fourth in the comprehensive ranking. F7 typically holds a high position in traditional supply chain evaluation systems (Sadeghi and Qaisari Hasan Abadi, 2024), especially as a fundamental guarantee for unbroken supply chains during emergencies such as natural disasters or public health incidents. However, within the RSS system, F7 needs a new direction for upgrading. Firstly, the ability to intelligently adjust the logistics network should be enhanced, enabling real-time monitoring and smart scheduling across all stages from pig breeding and transportation to sales, establishing a multi-source supply and flexible dispatch system (Ji, 2024). Secondly, there should be a swift transition from live pig transportation to chilled pork transportation to reduce animal welfare and public health issues associated with live transportation. This includes building a national cold chain logistics system to improve the utilization rate of cold chain logistics equipment (Wang et al., 2024).
(5) Learning and continuous improvement mechanisms (F12), Supply chain digitalization level (F4), and Technological innovation capability (F8) usually do not receive much attention in traditional supply chain evaluation systems (Yang et al., 2023). However, they rank 5th, 6th, and 7th, respectively, within the RSS system, demonstrating that the development of RSS in PSC is about transforming a labor-intensive supply chain into a technology-intensive one. Moreover, the evolution of supply chain management shows that the brilliance of technological advancement often dims due to lagging organizational management capabilities (Arji et al., 2023; Sun et al., 2024). Although integrating advanced technology undoubtedly brings revolutionary changes to the supply chain, its value-added benefits will be significantly diminished if there is a lack of corresponding management levels. Therefore, emphasizing the cultivation of enterprise organizational capabilities and ensuring the harmonious coexistence of management and technology levels is crucial for enhancing the overall efficiency of the supply chain. This not only corrects traditional perceptions but also provides strategic guidance for future supply chain management practices.
6 Conclusion
China, as the largest producer and consumer of pig products globally, holds significant importance for food security and social stability related to its PSC. Influenced by factors such as hog cycles, environmental regulations, and livestock health incidents, PSC must ensure stability, efficiency, and resilience against disruptions, while also optimizing environmental impact and aligning with societal needs. Therefore, enhancing resilience alone is insufficient; sustainable development considerations are equally crucial. This paper explores optimization issues in PSC from the perspective of RSS. The following conclusions are drawn.
(1) By analyzing resilience indicators through response capability, adaptive capacity, and recovery capability, and sustainability indicators through environmental, economic, and social impacts, a RSS system tailored to the development stage of China’s PSC is constructed. This framework integrates theoretical research findings, respecting regional industrial development phases, and innovating supply chain concepts.
(2) Employing a combined approach of Fuzzy DEMATEL and ANP, key indicators of the RSS in the PSC system are identified. Fuzzy DEMATEL generates a causal quadrant diagram categorizing synergistic development indicators into “Key Driving Indicators,” “Major constraint Indicators,” and others, enabling lean management of critical indicators. ANP determines indicator weights and integrates the center degree with the indicator weights to comprehensively rank influence indicators, ensuring the scientific identification of key indicators. The results highlight that indicators such as enterprise organizational capability (F2), Supply chain environmental interaction across the lifecycle (F13), and Trust relationships among entities (F19) are pivotal within the RSS system. Regional empirical analyses further validate the stability of KIFs, which dominate synergistic efficacy despite different regional development centers of gravity.
(3) Through indicator weight analysis, the current upgrade of China’s PSC needs to prioritize resilience objectives and focus on the synergistic effects of key influence factors. A comparative analysis between the findings of this study and traditional supply chain evaluations was conducted, proposing practical optimization strategies from the RSS perspective.
This paper identifies the KIFs of the RSS in PSC, along with its management mechanisms. It reveals the intrinsic relationships and interactions among these factors, offering a fresh perspective on the synergistic optimization of complex supply chain systems. Given the constraints of limited resources, the findings can assist managers and decision-makers in accurately allocating resources to maximize supply chain effectiveness. However, two limitations must be noted, which also indicate directions for future research. First, while this study identifies KIFs and validates synergy mechanisms, it does not resolve the inherent conflicts between resilience and sustainability objectives. Future work will address this gap through game-theoretic modeling to systematically analyze stakeholder strategies and behavioral evolution during RSS conflicts in the PSC, ultimately establishing regulatory mechanisms for such conflicts. Second, emerging technologies, particularly blockchain-based traceability and AI-driven monitoring, have significant potential to enhance the synergy between resilience and sustainability. However, the static analytical framework adopted here cannot dynamically capture the evolving impact of technology diffusion. Subsequent research will therefore employ system simulation to develop a technology diffusion model, quantifying how blockchain and AI dynamically shape resilience-sustainability synergy in regional pig supply chains.
Data availability statement
The raw data supporting the conclusions of this article will be made available by the authors, without undue reservation.
Author contributions
WW: Investigation, Resources, Writing – original draft, Funding acquisition, Methodology, Formal analysis, Writing – review & editing, Conceptualization, Supervision, Project administration, Data curation. SW: Writing – original draft, Investigation, Formal analysis, Writing – review & editing, Methodology, Data curation. DS: Data curation, Methodology, Writing – review & editing, Formal analysis. YZ: Software, Investigation, Data curation, Methodology, Formal analysis, Writing – review & editing.
Funding
The author(s) declare that financial support was received for the research and/or publication of this article. This research was partially supported by the Technology Innovation Project of Dalian Neusoft University of Information (TIFP202308).
Acknowledgments
The authors would like to thank the editor and reviewers for their valuable comments.
Conflict of interest
The authors declare that the research was conducted in the absence of any commercial or financial relationships that could be construed as a potential conflict of interest.
Generative AI statement
The authors declare that no Gen AI was used in the creation of this manuscript.
Publisher’s note
All claims expressed in this article are solely those of the authors and do not necessarily represent those of their affiliated organizations, or those of the publisher, the editors and the reviewers. Any product that may be evaluated in this article, or claim that may be made by its manufacturer, is not guaranteed or endorsed by the publisher.
References
Adams, D. J., Donovan, J., and Topple, C. (2022). Implementing sustainability in food manufacturers’ operations and supply chains. Manag. Environ. Qual. 33, 1132–1146. doi: 10.1108/MEQ-09-2021-0225
Ambulkar, S., Blackhurst, J., and Grawe, S. (2015). Firm's resilience to supply chain disruptions: scale development and empirical examination. J. Oper. Manag. 33-34, 111–122. doi: 10.1016/j.jom.2014.11.002
Arji, G., Ahmadi, H., Avazpoor, P., and Hemmat, M. (2023). Identifying resilience strategies for disruption management in the healthcare supply chain during COVID-19 by digital innovations: a systematic literature review. Informatics Medicine Unlocked 38:101199. doi: 10.1016/j.imu.2023.101199
Behzadi, G., O’Sullivan, M. J., Olsen, T. L., and Zhang, A. (2018). Agribusiness supply chain risk management: a review of quantitative decision models. Omega 79, 21–42. doi: 10.1016/j.omega.2017.07.005
Beske, P., and Seuring, S. (2014). Putting sustainability into supply chain management. Supply Chain Manag. Int. J. 19, 322–331. doi: 10.1108/SCM-12-2013-0432
Bian, X., and Tian, J. (2022). The construction of intelligent supply chain system for agricultural products based on improved ant Colony algorithm. Mob. Inf. Syst. 2022, 1–13. doi: 10.1155/2022/5643304
Bowman, A., Froud, J., Johal, S., Leaver, A., and Williams, K. (2013). Opportunist dealing in the UK pig meat supply chain: trader mentalities and alternatives. Account. Forum 37, 300–314. doi: 10.1016/j.accfor.2013.07.001
Cao, M., and Zhang, Q. (2011). Supply chain collaboration: impact on collaborative advantage and firm performance. J. Oper. Manag. 29, 163–180. doi: 10.1016/j.jom.2010.12.008
Cedergren, A., and Hassel, H. (2024). Building organizational adaptive capacity in the face of crisis: lessons from a public sector case study. Int. J. Disaster Risk Reduct. 100:104235. doi: 10.1016/j.ijdrr.2023.104235
Chakrabarty, A., and Nandi, S. (2022). Sustainable agricultural supply chains for leveraging SDGS. Management Accountant J. 57, 29–34. doi: 10.33516/maj.v57i10.29-34p
Chowdhury, M. M. H., and Quaddus, M. (2017). Supply chain resilience: conceptualization and scale development using dynamic capability theory. Int. J. Prod. Econ. 188, 185–204. doi: 10.1016/j.ijpe.2017.03.020
Coopmans, I., Bijttebier, J., Marchand, F., Mathijs, E., Messely, L., Rogge, E., et al. (2021). COVID-19 impacts on Flemish food supply chains and lessons for Agri-food system resilience. Agric. Syst. 190:103136. doi: 10.1016/j.agsy.2021.103136
Cui, H. (2021). Research on agricultural supply chain architecture based on edge computing and efficiency optimization. IEEE Access 10, 4896–4906. doi: 10.1109/ACCESS.2021.3113723
Dania, W. A. P., Xing, K., and Amer, Y. (2018). Collaboration behavioural factors for sustainable Agri-food supply chains: a systematic review. J. Clean. Prod. 186, 851–864. doi: 10.1016/j.jclepro.2018.03.148
Dixit, V., Seshadrinath, N., and Tiwari, M. (2016). Performance measures based optimization of supply chain network resilience: a NSGA-II+ co-kriging approach. Comput. Ind. Eng. 93, 205–214. doi: 10.1016/j.cie.2015.12.029
Fang, L., and Ge, H. (2023). Research on traceability of agricultural product supply chain information. Acad. J. Sci. Technol. 5, 126–127. doi: 10.54097/ajst.v5i1.5470
Fesharaki, M. H., and Safarzadeh, H. (2022). Modeling the sustainable supply chain network design for food-agricultural industries considering social and environmental impacts. Comput. Intell. Neurosci. :6726662. doi: 10.1155/2022/6726662
Gasco-Hernandez, M., Nasi, G., Cucciniello, M., and Hiedemann, A. M. (2022). The role of organizational capacity to foster digital transformation in local governments: the case of three European smart cities. Urban Governance 2, 236–246. doi: 10.1016/j.ugj.2022.09.005
Goumeida, K., Rahmani, D., Le Cour Grandmaison, J., and Gil Roig, J. M. (2024). Citizens' willingness to support farmers’ adoption of low crude protein diet in pig production. Heliyon 10:e28211. doi: 10.1016/j.heliyon.2024.e28211
Guohua, S. (2013). Research on the fresh agricultural product supply chain coordination with supply disruptions. Discret. Dyn. Nat. Soc. 2013:416790. doi: 10.1155/2013/416790
Gupta, A., and Singh, R. K. (2021). Study of sustainability issues in an Indian logistics service provider: SAP-LAP approach. Qual. Res. Organ. Manag. 16, 530–549. doi: 10.1108/QROM-02-2020-1897
Hendricks, K. B., Singhal, V. R., and Zhang, R. (2009). The effect of operational slack, diversification, and vertical relatedness on the stock market reaction to supply chain disruptions. J. Oper. Manag. 27, 233–246. doi: 10.1016/j.jom.2008.09.001
Hervani, A. A., Nandi, S., Helms, M. M., and Sarkis, J. (2022). A performance measurement framework for socially sustainable and resilient supply chains using environmental goods valuation methods. Sustainable Production Consumption 30, 31–52. doi: 10.1016/j.spc.2021.11.026
Hingley, M. K. (2005). Power to all our friends? Living with imbalance in supplier-retailer relationships. Ind. Mark. Manag. 34, 848–858. doi: 10.1016/j.indmarman.2005.03.008
Hosseini, S., Ivanov, D., and Dolgui, A. (2019). Review of quantitative methods for supply chain resilience analysis. Transp. Res. Part E Logist. Transp. Rev. 125, 285–307. doi: 10.1016/j.tre.2019.03.001
Ivanov, D., and Das, A. (2020). Coronavirus (COVID-19/SARS-CoV-2) and supply chain resilience: a research note. Int. J. Integ. Supply Manag. 13, 90–102. doi: 10.1504/IJISM.2020.107780
Ji, Y. (2024). Logistics distribution scheduling algorithm based on artificial intelligence. Meas. Sens. 34:101247. doi: 10.1016/j.measen.2024.101247
Kamble, S. S., Gunasekaran, A., and Gawankar, S. A. (2020). Achieving sustainable performance in a data-driven agriculture supply chain: a review for research and applications. Int. J. Prod. Econ. 219, 179–194. doi: 10.1016/j.ijpe.2019.05.022
Kazancoglu, Y., Ozbiltekin-Pala, M., Sezer, M. D., Ekren, B. Y., and Kumar, V. (2021). Assessing the impact of COVID-19 on sustainable food supply chains. Sustainability 14:143. doi: 10.3390/su14010143
Khezeli, M., Najafi, E., Molana, M. H., and Seidi, M. (2023). A sustainable and resilient supply chain (RS-SCM) by using synchronisation and load-sharing approach: application in the oil and gas refinery. Int. J. Syst. Sci. Oper. Logist. 10:2198055. doi: 10.1080/23302674.2023.2198055
Konstantoglou, A., Fotiadis, T., Folinas, D., Falaras, A., and Rotsios, K. J. S. (2023). Accessing consumer perceptions of the effectiveness of the deposit refund system. Sustainability 15:9429. doi: 10.3390/su15129429
Kruger, S. D., Zanin, A., Durán, O., and Afonso, P. (2022). Performance measurement model for sustainability assessment of the swine supply chain. Sustainability 14:9926. doi: 10.3390/su14169926
Li, X., Goldsby, T. J., and Holsapple, C. W. (2009). Supply chain agility: scale development. Int. J. Logist. Manag. 20, 408–424. doi: 10.1108/09574090911002841
Liang, D., Cao, W., and Wang, M. (2023). Credit rating of sustainable agricultural supply chain finance by integrating heterogeneous evaluation information and misclassification risk. Ann. Oper. Res. 331, 189–219. doi: 10.1007/s10479-021-04453-x
Mishra, R., Singh, R. K., and Subramanian, N. (2022). Impact of disruptions in Agri-food supply chain due to COVID-19 pandemic: contextualised resilience framework to achieve operational excellence. Int. J. Logist. Manag. 33, 926–954. doi: 10.1108/IJLM-01-2021-0043
Moazzam, M., Akhtar, P., Garnevska, E., and Marr, N. E. (2018). Measuring Agri-food supply chain performance and risk through a new analytical framework: a case study of New Zealand dairy. Prod. Plan. Control 29, 1258–1274. doi: 10.1080/09537287.2018.1522847
Mohammed, A. (2020). Towards ‘gresilient’supply chain management: a quantitative study. Resour. Conserv. Recycl. 155:104641. doi: 10.1016/j.resconrec.2019.104641
Montanyà, O., and Amat, O. (2023). The resilience factors of the Agri-food supply chain: an integrative review of the literature in the context of the covid-19 pandemic. Intangible Capital 19, 379–392. doi: 10.3926/ic.1746
Nabil, D. H., Al Amin, M., and Baldacci, R. (2024). Enhancing resilience in transnational e-commerce supply chains: critical factors, perspectives and strategic action plan. Heliyon 10:e31274. doi: 10.1016/j.heliyon.2024.e31274
Nadal-Roig, E., Plà-Aragonès, L. M., and Albornoz, V. M. (2023). Supply chains: planning the transportation of animals among facilities. Sustainability 15:2523. doi: 10.3390/su15032523
Nadal-Roig, E., Plà-Aragonès, L. M., and Alonso-Ayuso, A. (2019). Production planning of supply chains in the pig industry. Comput. Electron. Agric. 161, 72–78. doi: 10.1016/j.compag.2018.08.042
Nandi, S., Sarkis, J., Hervani, A. A., and Helms, M. M. (2021). Redesigning supply chains using blockchain-enabled circular economy and COVID-19 experiences. Sustain. Prod. Consum. 27, 10–22. doi: 10.1016/j.spc.2020.10.019
Nguyen, H., Sharkey, T. C., Wheeler, S., Mitchell, J. E., and Wallace, W. A. (2021). Towards the development of quantitative resilience indices for multi-echelon assembly supply chains. Omega 99:102199. doi: 10.1016/j.omega.2020.102199
Niemi, J., Bennett, R., Clark, B., Frewer, L., Jones, P., Rimmler, T., et al. (2020). A value chain analysis of interventions to control production diseases in the intensive pig production sector. PLoS One 15:e0231338. doi: 10.1371/journal.pone.0231338
Ntakiyisumba, E., Lee, S., and Won, G. (2023). Identification of risk profiles for Salmonella prevalence in pig supply chains in South Korea using meta-analysis and a quantitative microbial risk assessment model. Food Res. Int. 170:112999. doi: 10.1016/j.foodres.2023.112999
Nyamah, E. Y., Jiang, Y., Feng, Y., and Enchill, E. (2017). Agri-food supply chain performance: an empirical impact of risk. Manag. Decis. 55, 872–891. doi: 10.1108/MD-01-2016-0049
Pfeifer, C., Moakes, S., Salomon, E., and Kongsted, A. G. (2022). The role of diversity and circularity to enhance the resilience of organic pig producers in Europe. Animal Open Space 1:100009. doi: 10.1016/j.anopes.2022.100009
Ponomarov, S. Y., and Holcomb, M. C. (2009). Understanding the concept of supply chain resilience. Int. J. Logist. Manag. 20, 124–143. doi: 10.1108/09574090910954873
Poo, M. C. P., Wang, T., and Yang, Z. (2024). Global food supply chain resilience assessment: a case in the United Kingdom. Transp. Res. Part A Policy Pract. 181:104018. doi: 10.1016/j.tra.2024.104018
Qrunfleh, S., and Tarafdar, M. (2013). Lean and agile supply chain strategies and supply chain responsiveness: the role of strategic supplier partnership and postponement. Supply Chain Manag. Int. J. 18, 571–582. doi: 10.1108/SCM-01-2013-0015
Raihan, A., and Himu, H. A. (2023). Global impact of COVID-19 on the sustainability of livestock production. Global Sustainability Research 2, 1–11. doi: 10.56556/gssr.v2i2.447
Ramos, E., Patrucco, A. S., and Chavez, M. (2023). Dynamic capabilities in the “new normal”: a study of organizational flexibility, integration and agility in the Peruvian coffee supply chain. Supply Chain Manag. Int. J. 28, 55–73. doi: 10.1108/SCM-12-2020-0620
Roberta Pereira, C., Christopher, M., and Lago Da Silva, A. (2014). Achieving supply chain resilience: the role of procurement. Supply Chain Manag. 19, 626–642. doi: 10.1108/SCM-09-2013-0346
Routroy, S., and Behera, A. (2017). Agriculture supply chain: a systematic review of literature and implications for future research. J. Agribus. Dev. Emerg. Econ. 7, 275–302. doi: 10.1108/JADEE-06-2016-0039
Ruckli, A. K., Hörtenhuber, S. J., Ferrari, P., Guy, J., Helmerichs, J., Hoste, R., et al. (2022). Integrative sustainability analysis of European pig farms: development of a multi-criteria assessment tool. Sustainability 14:5988. doi: 10.3390/su14105988
Sadeghi, R. K., and Qaisari Hasan Abadi, M. (2024). Sustainable supply chain resilience for logistics problems: empirical validation using robust and computational intelligence methods. J. Clean. Prod. 437:140267. doi: 10.1016/j.jclepro.2023.140267
Scholten, K., and Schilder, S. (2015). The role of collaboration in supply chain resilience. Supply Chain Manag. Int. J. 20, 471–484. doi: 10.1108/SCM-11-2014-0386
Scholten, K., Scott, P. S., and Fynes, B. (2019). Building routines for non-routine events: supply chain resilience learning mechanisms and their antecedents. Supply Chain Manag. Int. J. 24, 430–442. doi: 10.1108/SCM-05-2018-0186
Singh, G., Rajesh, R., Daultani, Y., and Misra, S. C. (2023). Resilience and sustainability enhancements in food supply chains using digital twin technology: a grey causal modelling (GCM) approach. Comput. Ind. Eng. 179:109172. doi: 10.1016/j.cie.2023.109172
Soosay, C. A., Hyland, P. W., and Ferrer, M. (2008). Supply chain collaboration: capabilities for continuous innovation. Supply Chain Manag. Int. J. 13, 160–169. doi: 10.1108/13598540810860994
Su, X., Shi, X., Geng, L., and Yu, R. (2023). Complex evolution game and system dynamics simulation on the impact of coevolution on the stability of the fresh agricultural products green supply chain. Int. J. Bifurc. Chaos 33:2350081. doi: 10.1142/S0218127423500815
Sun, X., Kuo, Y.-H., Xue, W., and Li, Y. (2024). Technology-driven logistics and supply chain management for societal impacts. Transp. Res. Part E Logist. Transp. Rev. 185:103523. doi: 10.1016/j.tre.2024.103523
Swafford, P. M., Ghosh, S., and Murthy, N. (2008). Achieving supply chain agility through IT integration and flexibility. Int. J. Prod. Econ. 116, 288–297. doi: 10.1016/j.ijpe.2008.09.002
Syahruddin, N., and Kalchschmidt, M. (2012). Sustainable supply chain management in the agricultural sector: a literature review. Int. J. Eng. Manag. Econ. 3, 237–258. doi: 10.1504/IJEME.2012.049894
Touboulic, A., and Walker, H. (2015a). Love me, love me not: a nuanced view on collaboration in sustainable supply chains. J. Purch. Supply Manag. 21, 178–191. doi: 10.1016/j.pursup.2015.05.001
Touboulic, A., and Walker, H. (2015b). Theories in sustainable supply chain management: a structured literature review. Int. J. Phys. Distrib. Logist. Manage. 45, 16–42. doi: 10.1108/IJPDLM-05-2013-0106
Tukamuhabwa, B. R., Stevenson, M., Busby, J., and Zorzini, M. J. (2015). Supply chain resilience: definition, review and theoretical foundations for further study. Int. J. Prod. Res. 53, 5592–5623. doi: 10.1080/00207543.2015.1037934
Wang, S., Zhang, D., Yang, Q., Wen, X., Li, X., Yan, T., et al. (2024). Effects of different cold chain logistics modes on the quality and bacterial community succession of fresh pork. Meat Sci. 213:109502. doi: 10.1016/j.meatsci.2024.109502
Yan, B., Chen, X., Cai, C., and Guan, S. (2020). Supply chain coordination of fresh agricultural products based on consumer behavior. Comput. Oper. Res. 123:105038. doi: 10.1016/j.cor.2020.105038
Yang, M., Lim, M. K., Qu, Y., Ni, D., and Xiao, Z. (2023). Supply chain risk management with machine learning technology: a literature review and future research directions. Comput. Ind. Eng. 175:108859. doi: 10.1016/j.cie.2022.108859
Yontar, E. (2023). Critical success factor analysis of blockchain technology in Agri-food supply chain management: a circular economy perspective. J. Environ. Manag. 330:117173. doi: 10.1016/j.jenvman.2022.117173
Zhang, L., Wang, Y., and Dunya, R. (2023). How does environmental regulation affect the development of China’s pig industry. Sustainability 15:8258. doi: 10.3390/su15108258
Zhao, G., Chen, H., Liu, S., Dennehy, D., Jones, P., and Lopez, C. (2023). Analysis of factors affecting cross-boundary knowledge mobilization in Agri-food supply chains: an integrated approach. J. Bus. Res. 164:114006. doi: 10.1016/j.jbusres.2023.114006
Zhou, J.-h., Yan, Z., and Liu, Q.-y. (2013). Identification of behavior of voluntary traceability and analysis of its determinants: a case study of hog slaughtering and processing firms in Zhejiang Province, China. J. Integr. Agric. 12, 1112–1121. doi: 10.1016/S2095-3119(13)60490-6
Keywords: pig supply chain, resilience and sustainability synergy, key influencing factors, fuzzy DEMATEL, analytic network process, sustainable development
Citation: Wang W, Wang S, Sun D and Zhao Y (2025) Identification and management of key influencing factors in China’s pig supply chain from the perspective of resilience and sustainability synergy. Front. Sustain. Food Syst. 9:1597515. doi: 10.3389/fsufs.2025.1597515
Edited by:
Lluís M. Plà-Aragonés, University of Lleida, SpainReviewed by:
Baofeng Zhang, China Agricultural University, ChinaZhenyong Wu, Nanjing University of Information Science and Technology, China
Copyright © 2025 Wang, Wang, Sun and Zhao. This is an open-access article distributed under the terms of the Creative Commons Attribution License (CC BY). The use, distribution or reproduction in other forums is permitted, provided the original author(s) and the copyright owner(s) are credited and that the original publication in this journal is cited, in accordance with accepted academic practice. No use, distribution or reproduction is permitted which does not comply with these terms.
*Correspondence: Yadan Zhao, dmlja3l6aGFvMTIzNDU2QDE2My5jb20=