 Liangcan Liu1
 Xiang Li
- 1School of Business Administration, Guizhou University of Finance and Economics, Guiyang, China
- 2School of Economics and Management, Hezhou University, Hezhou, China
Introduction: By maintaining soil health and optimizing water resources management, agricultural ecological total factor productivity (AETFP) builds a basic defense line of safe food supply and environmental balance, effectively reduce the spread of chemical pollution and improve the quality of nutrition supply, thus providing a strategic fulcrum for the management of public health sources.
Methods: Based on the provincial panel data of China from 2012 to 2022, AETFP was estimated using EBM-GML model by incorporating the agricultural ecological value into the desirable output, and the influence mechanism of green finance on the AETFP was discussed by using fixed effect model and spatial econometric model.
Results: The AETFP in all regions of China was steadily improving, especially in the eastern region. Green finance not only promotes the improvement of AETFP in local and surrounding areas, but also improves AETFP by improving agricultural industrial agglomeration. Heterogeneity analysis shows that the promotion effect of green finance is particularly obvious in eastern regions, major grain-producing regions and regions with high digital infrastructure.
Discussion: This study provides empirical support for the paradigm transformation of agroecosystem governance from end-treatment to source prevention and control.
1 Introduction
Agriculture is the basic industry that human beings depend on for survival, and it is also a sensitive field of ecological environment change (Liu et al., 2022). The economic development model of traditional agriculture is the linear open-loop type of unidirectional material flow, that is, “resource-product, pollution discharge.” The core goal is to maximize the benefit of final products, and resource input and waste discharge are carried out around this goal. With the increasingly acute contradiction among resources, environment and economy, the traditional economic growth mode at the expense of ecology and environment is no longer suitable for the current agricultural development (Zhang et al., 2021). According to statistics, the total amount of chemical fertilizer used in China in 2022 is up to 54 million tons, accounting for more than 30% of the global total, ranking first in the world. However, the high-intensity use of chemical fertilizers and pesticides not only leads to agricultural environmental pollution, but also adversely affects the quality of agricultural products and ecosystem functions (Wu et al., 2022). At the same time, with the annual increase of agricultural carbon emissions, China's agriculture has become the third largest source of greenhouse gas emissions after industry and transportation (Wang and Qian, 2024), posing a threat to the stability of regional ecosystems. How to improve agricultural ecological benefits while ensuring agricultural economic benefits has become an important issue in the transformation of modern agriculture (Méndez-Picazo et al., 2021). Agricultural circular economy is a closed flow of “resource-product-renewable resources” (Morseletto, 2020), which has the characteristics of low mining, high utilization and low emission. Its core is to realize the closed-loop feedback of circular flow of material and energy (Donner and de Vries, 2021). It requires economic activities to follow the law of natural ecology, and organizes human production and nature into a large system of repeated circular flow of material. To maximize the use of agricultural wastes in the process of production and consumption in the whole economic system (Duque-Acevedo et al., 2020; Perdana et al., 2023). While examining the development of agricultural economy, agroecological total factor productivity (AETFP) can take into account the reasonable consumption of resources and energy as well as the increase of ecological value, which is in line with the concept of circular economy. Therefore, improving AETFP is a crucial approach to addressing the coordinated development of agriculture across the “resource-energy-environment-eco-economy” and promoting the sustainable development of agriculture.
Agricultural total factor productivity (ATFP) serves as a key measure of the efficiency of agricultural production (Liu et al., 2020; Wang and Qian, 2024). In recent years, many scholars have carried out various studies on this indicator. On the one hand, the traditional ATFP research mainly focuses on the level of economic efficiency (Barath and Ferto, 2017; Plastina and Lence, 2018). The core is to take the total agricultural output value, grain output and other economic outputs as the desirable output, and the input indicators include labor, land, capital and intermediate inputs. Data envelopment analysis (DEA) (Chen et al., 2020), stochastic Frontier Analysis (SFA) (Barath et al., 2020; Koiry and Huang, 2023) and other methods are used for calculation, and the regional differences of ATFP and its influencing factors are revealed. However, this measurement method ignores the irrational use of resources and the negative impact of ecological environment in the process of agricultural production, which is difficult to meet the requirements of sustainable development. Meanwhile, with the rise of environmental sustainability issues, scholars began to incorporate environmental pollution and resource constraints into the evaluation system of ATFP, and gradually formed the research framework of agricultural green total factor productivity (AGTFP) (Hu et al., 2022; Zhu et al., 2022). AGTFP usually takes agricultural carbon emissions and non-point source pollution as undesirable outputs (Liu et al., 2021; Shen et al., 2023), and realizes the measurement of low-carbon development and clean production of agriculture by integrating the concept of green into the calculation of production efficiency. However, the desirable output of AGTFP is still mainly focused on economic value, while the positive contribution of agricultural production to the ecosystem, such as water conservation, soil conservation and other ecological values, is not included in the evaluation system. Previous research has focused more on the reduction of undesirable outputs, but not enough attention to the service functions of agricultural ecosystems and the sustainable use of natural resources. Agricultural ecological environment is the premise and foundation of agricultural economic development. Agricultural production should not only maximize economic benefits, but also emphasize the protection of ecosystem and the improvement of ecological value. Therefore, this paper divides the agricultural ecological service functions into seven functions: gas regulation, climate regulation, hydrological regulation, waste treatment, soil conservation, biodiversity maintenance, and aesthetic landscape provision. It also constructs a dynamic equivalent regulation factor model to measure the agricultural ecological value of different provinces in different years. Then, both the ecological value and economic value of agriculture are incorporated into the desirable output to evaluate the total factor productivity of agricultural ecology.
Green finance (GF) refers to financial activities that guide funds to flow to environmentally friendly and eco-friendly projects through financial instruments and mechanisms to achieve sustainable economic development. It includes financial products and services such as green credit, green bonds, green investment funds, and environmental liability insurance (Zhang et al., 2022), which aims to promote low-carbon economic transformation, promote the application of energy conservation and emission reduction technologies, and support the development of renewable energy, clean technology, and ecological restoration by optimizing capital allocation. The core of GF is to combine environmental protection goals with economic development (Zhang et al., 2023), improve resource utilization efficiency, slow down environmental degradation, and enhance the environmental friendliness and resilience of the overall economy. The escalating impacts of global climate change have caused notable losses in agricultural production (Chen and Gong, 2021), while GF has increasingly demonstrated its value in balancing agricultural economic growth with ecological sustainability (Diaz-Rainey et al., 2023). Can GF improve AETFP? If so, how to achieve this mechanism?
China is one of the world's largest agricultural producers, with diverse and complex agricultural ecosystems. In recent years, China has strongly supported green investment, especially in the agricultural sector, and green finance policies have been gradually improved. Therefore, studying the influence of GF in China on AETFP will help to reveal strategies to enhance AETFP, which can provide experience for policy design and implementation in other developing countries. This study develops an evaluation framework for AETFP by incorporating agricultural ecological value into the desirable output from an input-output perspective. Using the EBM-GML model, the study quantifies AETFP across Chinese provinces from 2012 to 2022. To further explore the effects of GF, the research employs the two-way fixed effects model and spatial econometric model to examine its direct, mediating, and spatial spillover effects on AETFP. Additionally, a heterogeneity analysis based on regional differences, types of grain function zones, and levels of digital infrastructure is conducted to reveal how these positive effects are realized in different contexts.
The main contributions of this study are: (1) The agricultural ecological value is incorporated into the desirable output and the EBM-GML model is used to measure AETFP level, and the spatial evolution characteristics of AETFP in each region are analyzed. (2) This study provides a new perspective for improving AETFP, especially considering the role of GF. In addition to the direct effects, this study also reveals the spatial spillover effects from green financial services across regions. (3) This study also explores the impact mechanism of agricultural agglomeration on the relationship between GF and AETFP, and expands the effect channel of GF on AETFP.
2 Theoretical analysis and research hypotheses
2.1 Green finance and agricultural ecological total factor productivity
Green finance, as a new financial model that takes into account both the economy and the environment, is an effective tool for breaking through the traditional financial dilemma (Yuan et al., 2024). Based on Porter's hypothesis, GF has become an important driving force to improve AETFP by forcing agricultural entities to break through ecological constraints with technological upgrading and process optimization through market-based environmental regulatory pressure and innovative incentive mechanisms. First, it lowers the capital threshold for agricultural green technology application. GF provides low-cost and long-term financing to agricultural entities via green credit, green fund and other forms, so that they can timely complete the upgrading of agricultural production technology (Xu et al., 2023). At the same time, GF effectively improves more efficient and environmentally friendly technology research and development by guiding capital flow to the field of green technology research and development. Second, the investment structure of agricultural ecological resources should be improved. On the one hand, through green subsidies or loans, GF encourages farmers to reduce reliance on traditional inputs like fertilizers and pesticides, while increasing the use of organic fertilizers and ecological mulch, thereby lowering the ecological and environmental costs of agricultural production (Mastini et al., 2021). Meanwhile, by supporting precision agriculture technology, GF helps agricultural producers maximize the use of limited resources and reduce waste.
Third, it will reduce the negative externalities of the agricultural ecological environment. The Environmental Kuznets Curve theory suggests that improving environmental quality requires policy support and economic incentives (Grossman and Krueger, 1995). By supporting environmental protection projects such as agricultural waste resource utilization and farmland ecological restoration, GF can effectively reduce negative externalities in agricultural production and thereby improve the quality of the agricultural ecological environment by supporting environmental protection projects such as the resource utilization of agricultural waste and the ecological restoration of farmland (Wang et al., 2023), and enhancing the anti-risk ability and stability of agricultural ecosystem. Fourth, stimulate the transformation of green behavior of agricultural subjects. As an important part of GF, green insurance reduces the risk of green production of agricultural subjects by protecting agricultural losses caused by climate change or natural disasters, thus promoting the spontaneous transformation of green behavior of agricultural subjects (Lu et al., 2024) and effectively improving AETFP. GF closely focuses on the four core areas of agricultural production: technology, resources, environment and behavior, which can effectively achieve the synergistic development of economy and ecology, thus providing crucial guarantee for the sustainable transformation of modern agriculture. Accordingly, Hypothesis 1 is formulated as follows:
Hypothesis 1. GF can significantly improve AETFP.
2.2 Mechanism of GF to improve AETFP
Agglomeration of agricultural industry refers to the concentration and coordinated development of agricultural production factors and related industries in geographical space. On the one hand, GF can invest in key segments of the agricultural industry chain, such as processing, storage, and logistics, promoting the concentration of these activities in specific regions to form agricultural industry clusters. On the other hand, GF can also support agricultural technological innovation and modern infrastructure development, improve the efficiency of agricultural production, thus attracting more enterprises and farmers to concentrate in industrial agglomeration areas, and further promote the development of agricultural industrial agglomeration (Xue et al., 2023). Meanwhile, agricultural industry agglomeration improves AETFP through large-scale, specialized and intensive production mode. Specifically, firstly, the unified management and planning of land resources in the agglomeration area reduces the land waste caused by the scattered planting of small-scale farmland and improves the land utilization rate (Bengochea Paz et al., 2022). At the same time, through the land transfer mechanism, a large amount of land is concentrated in the hands of agricultural subjects with technological and capital advantages, which promotes the promotion of efficient planting mode. Secondly, the agglomeration effect promotes the rapid diffusion of technology. New technology and management experience can spread rapidly in industrial agglomeration areas, and the cooperation and knowledge sharing among farmers can shorten the cycle of technology promotion and improve the application level of green agricultural technology (Wu et al., 2020). Finally, the agglomeration of agricultural industry can often form a synergistic effect in ecological protection and restoration, and the concentrated activities of agricultural production subjects in the agglomeration areas help to build regional ecological barriers, enhance ecosystem service functions, and thus enhance the contribution of ecological value.
Hypothesis 2. GF can improve AETFP by promoting agricultural industry agglomeration.
2.3 Spatial spillover effect of GF on AETFP
The theory of network externalities reveals the strengthening mechanism of interdependence among economic entities, providing a key perspective for understanding the spatial linkage effect of green finance. The establishment of a green financial system itself is a network composed of policies, technologies and markets. When the coverage rate of green finance in a specific region increases, the access costs and cognitive barriers in neighboring regions will systematically decrease. This dimensionality reduction effect achieves gradient transfer to the edge areas through the technology diffusion network, promoting the spatial reconfiguration of all elements of agricultural ecology. Cross-regional ecological governance projects supported by GF can enhance the synergistic effect of regional ecosystems and promote the optimization of agricultural ecological environment in surrounding areas (Wu, 2023). At the same time, measures such as soil pollution control and air quality improvement have a natural diffusion effect, which has a positive spillover on the ecological agricultural production conditions in surrounding areas. The second is the technology diffusion effect. When advanced green agricultural technologies supported by GF, such as ecological planting and precision fertilization technology, are applied in core areas, surrounding areas will quickly benefit through imitation and learning (Yuan et al., 2024). The third is the resource allocation effect. The investment of green financial institutions in ecological agriculture projects not only focuses on the core areas, but also extends the concept and technology of green production to the surrounding areas through the linkage of industrial chain, promoting the efficient allocation of resources across regions. Fourth, the market diffusion effect. GF promotes the production of green agricultural products in core areas, radiates to surrounding areas through market mechanisms, and increases the ecological added value of agricultural markets. In addition, the integration of agricultural products market further strengthens the linkage of agricultural ecological development between core areas and surrounding areas. Accordingly, Hypothesis 3 is formulated as follows:
Hypothesis 3. GF can improve AETFP in surrounding areas through spatial spillover effect.
3 Methods and data
3.1 Model setting
3.1.1 Benchmark regression model
In order to verify the impact of GF on AETFP, a baseline two-way fixed effects model is established:
In the above formula, AETFP represents the total factor productivity level of agricultural ecology, GF represents the development level of green finance, and X represents a series of control variables; i and t represent province and year; μi and δt represent provincial fixed effect and time fixed effect, respectively; εi, t represents the random error term.
3.1.2 Spatial econometric model
Considering that GF may also have an impact on AETFP in neighboring regions, this study constructs a spatial econometric model for verification. A spatial weight matrix is introduced into the benchmark model (Equation 1) and expanded into a spatial panel measurement model:
In Equation (2), ρ is the spatial autoregressive coefficient, W represents the spatial weight matrix; ψ1 And ψn represent the coefficient of the spatial interaction term with the control variable. The model is called spatial Durbin model because it contains spatial interaction terms between explained variables and explanatory variables.
3.2 Measurement of AETFP
3.2.1 EBM-GML model
In this paper, agricultural ecological value as expected output is incorporated into the AETFP growth measurement model. In the process of agricultural production, the relationship between energy consumption and carbon emissions is radial, while the relationship between capital, labor and other inputs and carbon emissions is non-radial. Epsilon-Based Measure model (EBM) is a data envelopment analysis (DEA) method Based on slack variables, which combines the advantages of radial and non-radial methods and can measure the efficiency of DMUs more comprehensively (Tone and Tsutsui, 2010). Therefore, this paper adopts EBM model to measure agricultural ecological efficiency. The GML index proposed by Oh (2010) has the advantages of transitivity and avoidance of infeasible solutions. Therefore, in this paper, EBM mixed distance function and GML index are combined to construct EBM-GML model to measure and decompose agricultural ETFP. The expression is as follows:
In the formula, ρ represents the efficiency value; θ denotes the radial model programming parameter; εx represents the core parameter of both radial and non-radial models; N and M represent the number of inputs and outputs, respectively; i, m and w denote the non-radial input factors, desirable outputs, and undesirable outputs, respectively; z and w represent the slack variables and weights of each element; k indicates the decision-making unit (DMU); represents the relative importance of each input indicator; λj denotes the linear combination coefficient of the DMU; and represent the slack variables of the i-th desirable output and the w-th undesirable output, respectively; and represent the weights of the i-th desirable output and the w-th undesirable output indicators, respectively; bwk is the w-th undesirable output of the k-th DMU. The formula for the GML index is as follows:
If the value of GMLt, t+1 exceeds 1, it signifies an improvement in AETFP; If the value of GMLt, t+1 equals 1, it indicates that AETFP remains unchanged; If the value of GMLt, t+1 is < 1, it indicates that AETFP is declining. The GML index can be decomposed into the Ecological Technical Efficiency Change Index (EEC) and the Ecological Technical Progress Index (ETC). These two indices are designed to more comprehensively assess the performance of GML in ecological total factor productivity.
3.2.2 AETFP measurement index system
Current measurement is more focused on agricultural total factor only in agricultural economic value for the desirable output of traditional total factor is calculated, and the carbon emissions and non-point source pollution of agriculture into the desirable output of green way of measuring the total factor productivity. AETFP should not only consider agricultural economic output, but also agricultural ecological value. This study incorporates agricultural ecological value as a desirable output and constructs the AETFP index system, presented in Table 1. The input index is composed of four factors: labor input, capital input, land input and intermediate input. The number of employees in the primary industry was selected as the proxy index for labor input, the stock of agricultural physical capital was used as the proxy index for capital input, and the sum of the total crop planting area and aquaculture area was used as the proxy index for land input. The intermediate input included five indicators: chemical fertilizer input, agricultural film input, pesticide input, water resource input and energy input. The undesired output index was measured by agricultural carbon emissions. The desirable output index is composed of economic value and ecological value. The economic value is calculated by the total output value of agriculture as the proxy index. Finally, this paper constructs the dynamic equivalent regulatory factor model to estimate the agricultural ecological value of provinces in different years.
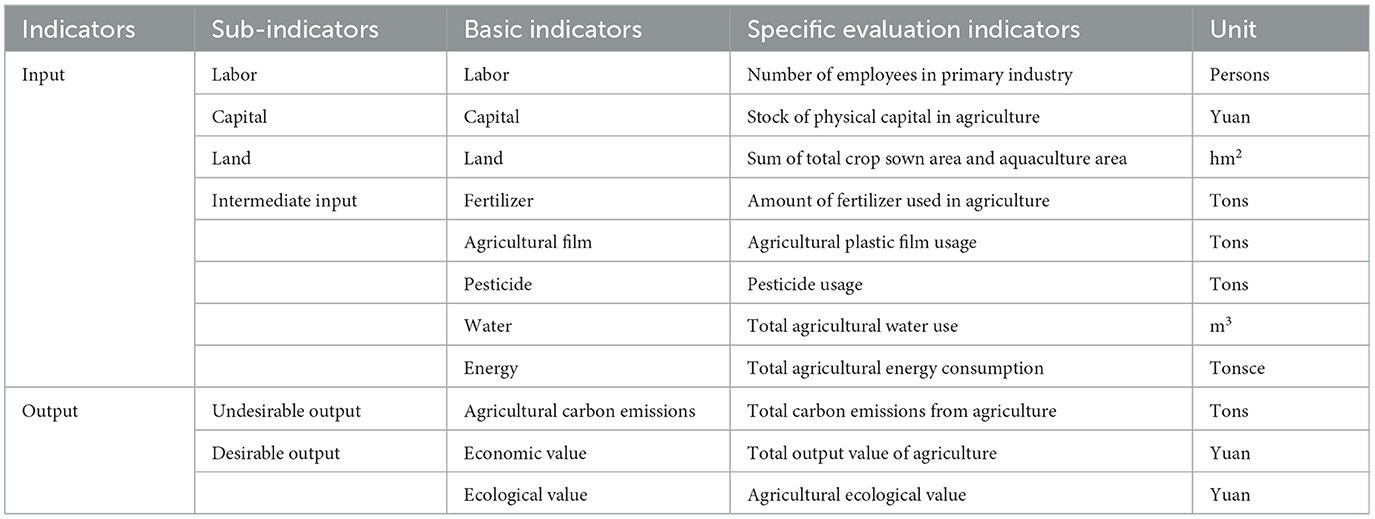
Table 1. Indicator system for measuring AETFP.
3.2.3 Calculation of agricultural ecological value
In this paper, agricultural ecological service functions were categorized into seven functions by classifying them as gas regulation, climate regulation, hydrological regulation, waste treatment, soil conservation, maintenance of biodiversity and provision of aesthetic landscape. By constructing the dynamic equivalent factor model as follows:
In the above formula, AESVi, t represents the value of agricultural ecosystem services in province i for year t, Et is the dynamic standard equivalent at the national level, Aj, i, t is the area of agricultural ecosystem category j in province i in year t, and Wn, i, t is the nth ecosystem service dynamic equivalent regulating factor in year t of province i.
Among them, this paper uses the five food crops of rice, wheat, corn, soybeans and potatoes per unit area in China from 2012 to 2022 to calculate the dynamic standard equivalent, and adopts the average net profit of grain production per hectare of farmland as the ecological value of one standard equivalent factor. To reflect the differences in agricultural ecological value in spatial and temporal dimensions, the equivalent factors of seven service functions were corrected by selecting the national net primary productivity of vegetation (NPP), precipitation factor, soil retention factor and accessibility factor. Therefore, based on Equation (5), this paper constructs a region-level dynamic equivalent adjustment factor model as follows:
In Equation (6), Vn represents the nth ecological service value equivalent factor of this type of ecosystem, and W1 is the spatio-temporal adjustment factor of NPP, which is expressed as the ratio of the NPP of each region in the current year to the national average annual NPP. W2 is the precipitation regulating factor, which is expressed as the ratio of the precipitation of each region in the current year to the national average annual precipitation. W3 is the accessibility adjustment factor, which is expressed as the ratio of the average road density of each region in the current year to the national average road density. W4 is a soil conservation regulating factor, which is expressed as the ratio of the area of soil erosion control in each region in the current year to the national average area of soil erosion.
3.3 Variable definition
3.3.1 Explained variable
Agricultural ecological total factor productivity (AETFP), which can be calculated based on EBM-GML model.
3.3.2 Explanatory variable
Green finance (GF). This paper constructs an indicator system for the development of green finance from six aspects: green credit, green insurance, green investment, green support, green bonds, and green funds, and uses the entropy weight method to calculate the development index of green finance in each region. Among them, green credit is expressed as the ratio of the total credit amount for environmental protection projects in each region to the total credit amount of that region. Green insurance refers to the promotion degree of environmental pollution liability insurance, which is measured by the ratio of environmental pollution liability insurance income to total premium income. Green investment is expressed as the ratio of investment in environmental pollution control to GDP. Green support is expressed as the ratio of fiscal environmental protection expenditure to fiscal general budget expenditure. Green bonds are expressed as the ratio of the total amount of green bonds issued to the total amount of all bonds issued. Green funds are represented by the ratio of the total market value of green funds to the total market value of all funds. The above six indicators are all positive indicators. To ensure the robustness of the results, in the robustness test section of this paper, green rights indicators are added to the original green finance indicator system for robustness testing. The depth of green rights development is measured by the ratio of provincial carbon trading, energy consumption rights trading, and pollution discharge rights trading to the total transaction volume of the urban rights market.
3.3.3 Mechanism variable
Agricultural industry agglomeration level (AIA). Location entropy is used to represent the level of industrial agglomeration, that is, the ratio of the agricultural output value to the gross production value of the region in that year divided by the ratio of the agricultural output value to the gross production value of the country in that year (Billings and Johnson, 2012).
3.3.4 Control variables
In order to exclude other factors interfering with the real influence of GF on AETFP, this study adopts the practice of Song et al. (2022) to select the following variables as control variables. Agriculture-related expenditure (FSA) is represented by the share of agricultural fiscal spending in total government expenditure; Effective irrigation (IRR), which is defined as the ratio of effective irrigation area to crop sown area; Agricultural structure (INS), represented by the proportion of grain crops in the total sown area of crops; The degree of opening up of agriculture (TRA), which is the ratio of the total import and export volume of agricultural products to the total output value of agriculture; Disaster severity (ADR) is defined as the proportion of affected crop area to the total sown area; And agricultural mechanization (MECH), which is expressed by the total power of agricultural machinery.
3.4 Data sources and descriptive statistics
Given the data availability, Tibet and the Hong Kong, Macau, and Taiwan regions are excluded from the study due to a large number of missing values. The final research sample consists of panel data from 30 provinces in China from 2012 to 2022, exploring the impact of GF on AETFP. Agriculture-related indicators are from China Statistical Yearbook, China Agricultural Yearbook, China Rural Statistical Yearbook, and China Statistical Yearbook on Science and Technology. The GF index is from China Statistical Yearbook on Environment, China Finance Yearbook and China Energy Statistical Yearbook. Table 2 shows the descriptive statistical results of each variable. The value of AETFP ranges from 0.461 to 1.753, with mean and standard deviation of 1.084 and 0.230 respectively; the value of GF ranges from 0.090 to 0.630, with mean and standard deviation of 0.330 and 0.130 respectively. China regional AETFP and GF level there is a big difference. The statistical values of the above control variables are within a reasonable range, which can be analyzed in the next step.
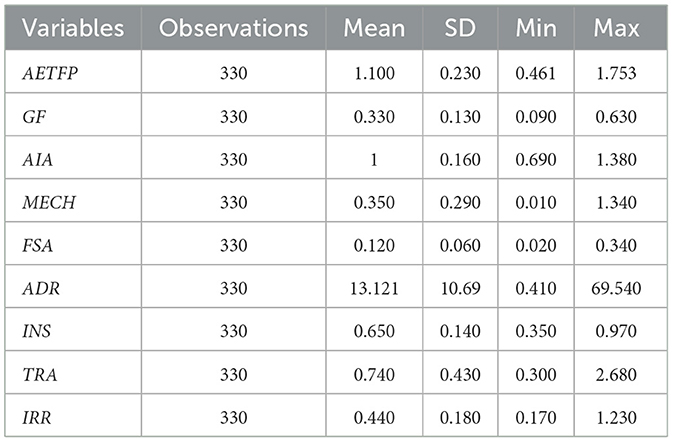
Table 2. Descriptive statistical results.
3.5 Spatial evolution characteristics
Based on EBM-GML model and the aforementioned index system, the AETFP value of Chinese provinces from 2012 to 2022 was measured by MATLAB software, and the AETFP was divided into four levels by the quartile classification method. Due to space limitations, the ArcGIS10.8 software is used in this study to visualize only the mean value of AETFP from 2012 to 2022, the value of AETFP in 2012 and 2022, as shown in Figure 1. Figure 1a shows that except for Shanghai, the average level of AETFP in other regions during 2012–2022 is >1, indicating that AETFP is increasing in most regions of China's provinces. Figure 1b shows the distribution of AETFP in China's provinces in 2012. The level of AETFP in most provinces is mainly concentrated in the third tier, followed by the fourth tier, Jiangsu, Shanxi and Heilongjiang in the second tier, and only Beijing in the first tier. After 2022, the number of provinces in the first and second echelon increased significantly, among which the coastal developed provinces grew faster, but some regions such as Beijing and Tianjin fell to the fourth echelon.
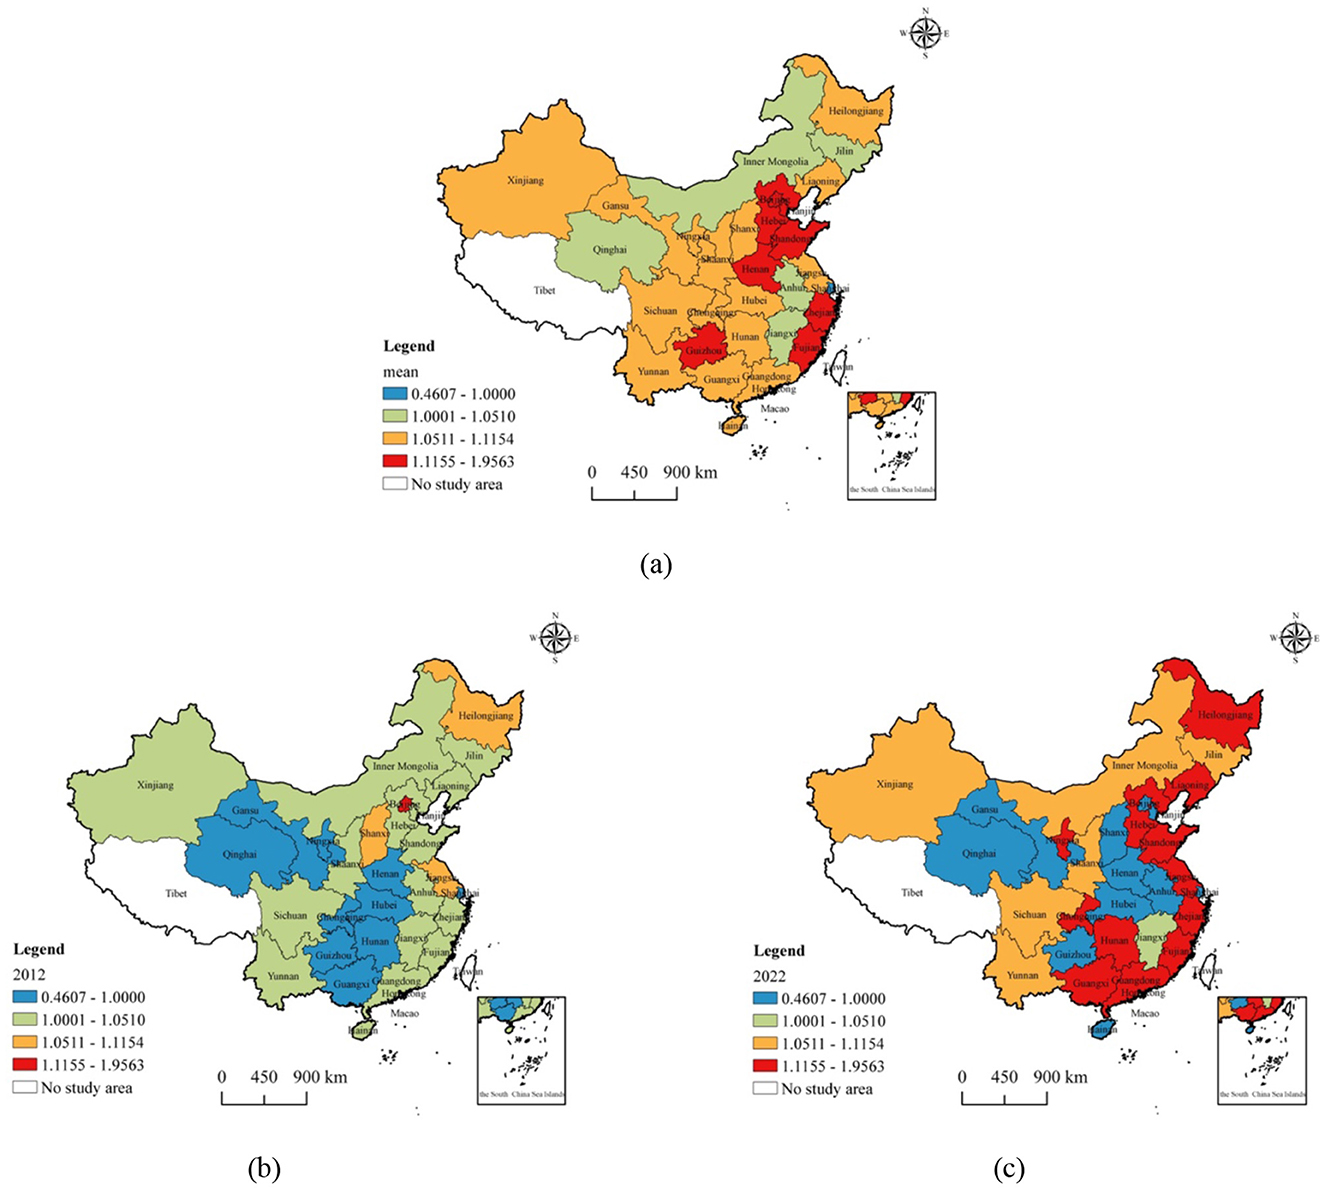
Figure 1. (a) AETFP mean value distribution map of China from 2012 to 2022; (b) 2012; (c) 2022.
4 Empirical results
4.1 Impact of GF on AETFP
In order to explore the relationship between GF and AETFP, a two-ways fixed effect model was used for estimation, and the results are shown in Table 3. Among them, column (1) and column (2) are the estimation results without and with control variables, respectively. From the estimation results of column (1), it can be seen that the core explanatory variable GF has a positive impact on AETFP, and it is significant at the level of 1%. The estimated coefficient of GF in column (2) is 2.484, which is still at the significance level of 1%. That means that for every 10% increase in GF, it will drive an average increase of approximately 22.6% in AETFP, demonstrating the significant importance of promoting GF development for enhancing AETFP. Hypothesis 1 is verified.
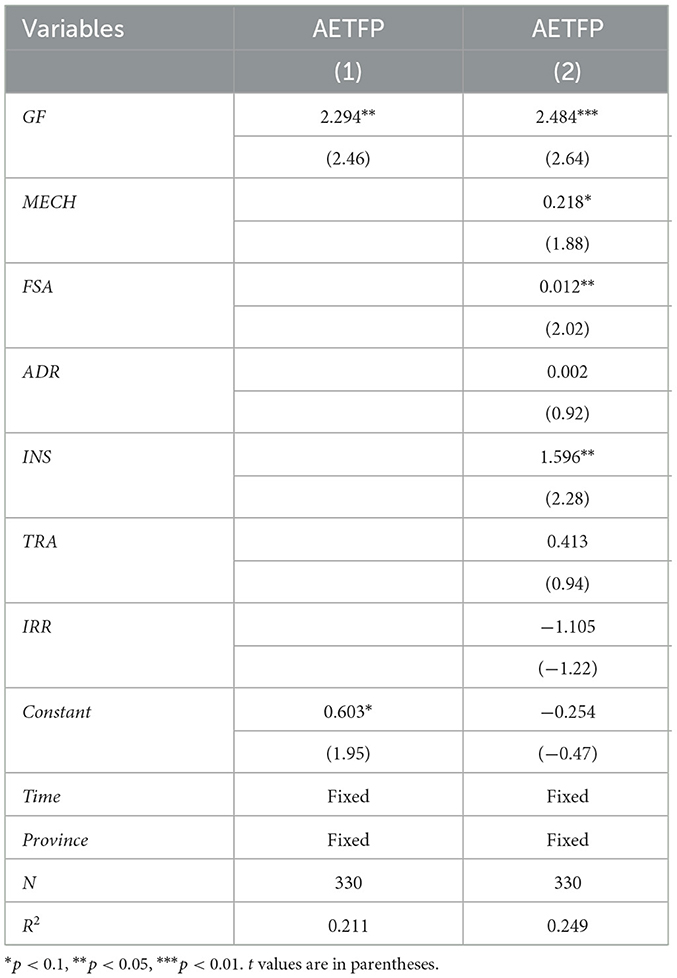
Table 3. Baseline regression results.
4.2 Robustness test
4.2.1 Change the explanatory variable
To ensure the robustness and comprehensiveness of the empirical results, this paper further incorporates a green rights indicator on the basis of the existing six-dimensional index system of GF. This indicator is measured by the ratio of provincial carbon trading, energy consumption rights trading, and pollution discharge rights trading to the total transaction volume of the urban rights market. Then, the GF index was reconstructed based on the new indicator system and regression analysis was carried out. As can be seen from column (1) of Table 4, the promoting effect of GF on AETFP after including the green rights indicator remains significant, indicating that GF plays an important role in promoting AETFP both from the perspective of financial capital input and the market mechanism of green rights, thereby further enhancing the reliability and policy reference value of the conclusion of this paper.
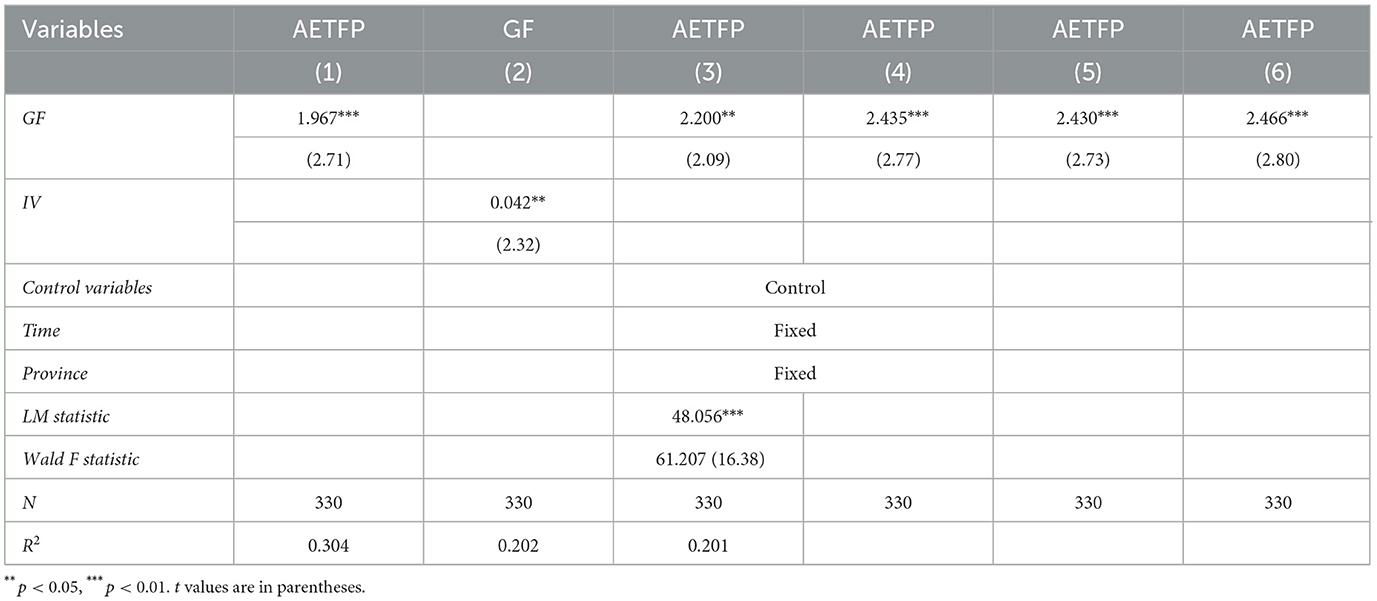
Table 4. Robustness test.
4.2.2 Instrumental variables
In spite of the above regression have taken control of many variables and time and the individual, but may also occur because of the endogenous omitted variable problem. Therefore, this paper takes the GF reform pilot zone as the instrumental variable of GF, and columns (2) and (3) of Table 4 are the regression results of two-stage least squares (2SLS) method for instrumental variables. The results indicate that in the first-stage regression, the estimated coefficient of the instrumental variable for GF is 0.042, which is significantly positive at the level of 5%. In the second stage regression, regression coefficient is 2.200, GF to 5% significance level is positive, shows that after considering the endogeneity problem, GF for AETFP still has significant effect to ascend. Finally, this paper conducts LM test and Wald F test, and the LM statistic is 48.056, which is significant at the level of 1%. The statistic of Wald F test is 61.207, which is >16.38, passing the test of weak instrumental variables, indicating that the instrumental variables selected in this paper are reliable.
4.2.3 Replacement estimation model
The traditional linear regression model in dealing with non-linear relations often have limitations, machine learning model to better capture data in the non-linear model and interaction. At the same time, this model can adapt to different types and sizes of data sets, and has a stronger ability to deal with complex data structure and eliminate bias, thus providing more robust causal inference. Therefore, this study adopts dual machine learning model of the relationship between GF and AETFP again, estimates by 1:4 sample separation ratio, at the same time, select the Lasso regression model respectively, gradient regression model and neural network regression model to test, the results are shown in Table 4 (4) ~ (6). Green financial estimates of the coefficients in the 1% significance level are positive, showed that after replacement of estimation model, GF still can significantly improve AETFP, the original model regression results are reliable.
4.3 Spatial econometric model selection and regression results
Table 5 reported China's green financial and AETFP global Moran index from 2012 to 2022, according to the results in the table, GF and AETFP Moran index were significantly positive, showed that the green financial and AETFP in the positive significant spatial correlation. Therefore, this study can select the corresponding spatial metrology model for the next test.
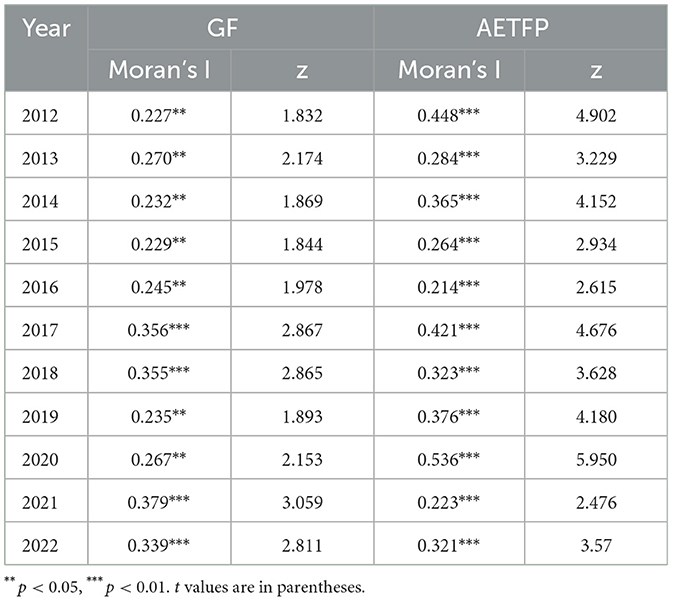
Table 5. Test results of Moran's index of GF and AETFP.
Prior to spatial model regression, LM test, Hausman test, and LR test are conducted to select the suitable spatial econometric model, with the results presented in Table 6. Among them, the LM test results are significant at the level of 1%, rejecting the null hypothesis, indicating that both the spatial lag model (SEM) and the spatial error model (SAR) can be used, and the Hausman test results also reject the null hypothesis at the level of 1%, so the fixed effect model should be used. The LR test results reject the null hypothesis at the level of 1%, indicating that the spatial Durbin model is better than the spatial lag model and the spatial error model. Finally, the spatial Durbin model (SDM) with two-way fixed effects was determined as the best model.
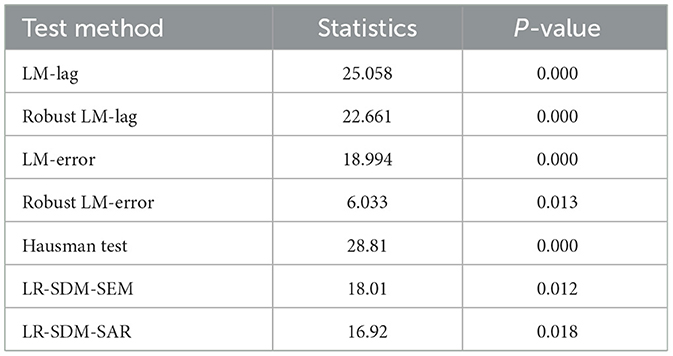
Table 6. LM, LR and Hausmann test results.
Columns (1) to (3) of Table 7 show the regression results of the spatial Durbin model under the adjacency matrix, economic-geographic nested matrix and geographic distance matrix, respectively, and the spatial autoregressive coefficients of GF are all significant at the 10% level, indicating that GF has a positive spatial spillover effect. Secondly, the estimated coefficient of W*GF is significantly positive at the 1% level, indicating that GF has a promoting effect on AETFP in neighboring provinces, and Hypothesis 3 is verified. Further decomposing the effect of GF on AETFP, the regression results of the direct, indirect and total effects of GF on AETFP are all significantly positive at the 5% level, which indicates that GF not only directly improves AETFP by upgrading the local agricultural green inputs and optimizing the production methods, but also, through a variety of channels, such as the cross-regional allocation of green financial institutions, agricultural technology and regional ecological collaborative governance, has a stronger impact on the surrounding areas.
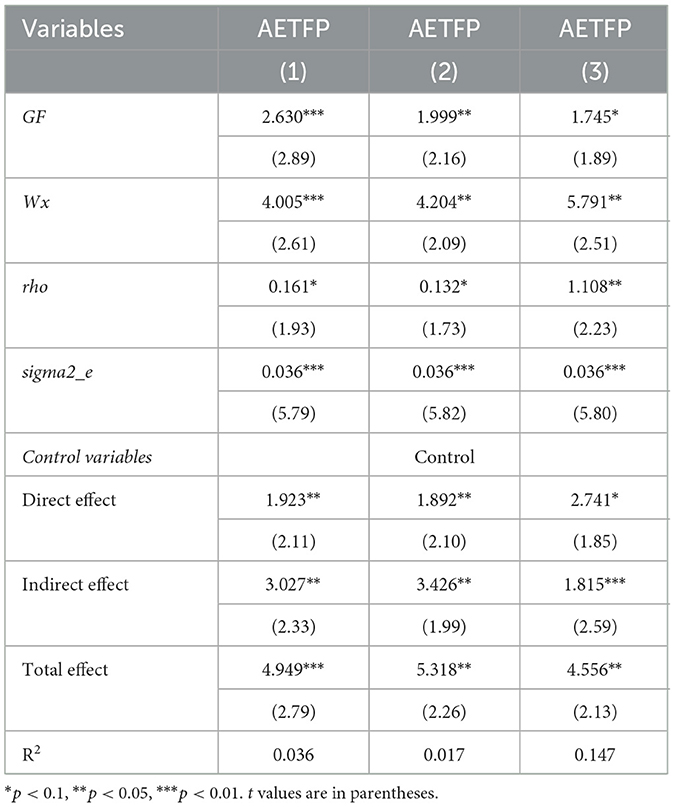
Table 7. Estimation results of fixed effect model of spatial Durbin model.
4.4 Test of influence mechanism
The theoretical analysis in the previous text indicates that AIA is an important channel for the interaction between GF and AETFP. Columns (1) and (2) of Table 8 report the results of the mechanism test. Column (1) shows the regression result of GF's influence on AIA. The coefficient value of GF is 0.298, which is significantly positive at the 5% level, indicating that GF can significantly promote AIA. Column (2) shows the regression results after adding AIA to the benchmark regression. The estimated coefficients of GF and AIA are both significantly positive at the 5% level, indicating that AIA can effectively improve AETFP. Meanwhile, to ensure the feasibility of the results, this paper adopted Bootstrap sampling for 800 times. The results showed that the indirect effect was 0.827, passing the 95% confidence interval, indicating that the mediating role of AIA was significant, and hypothesis 2 was valid.
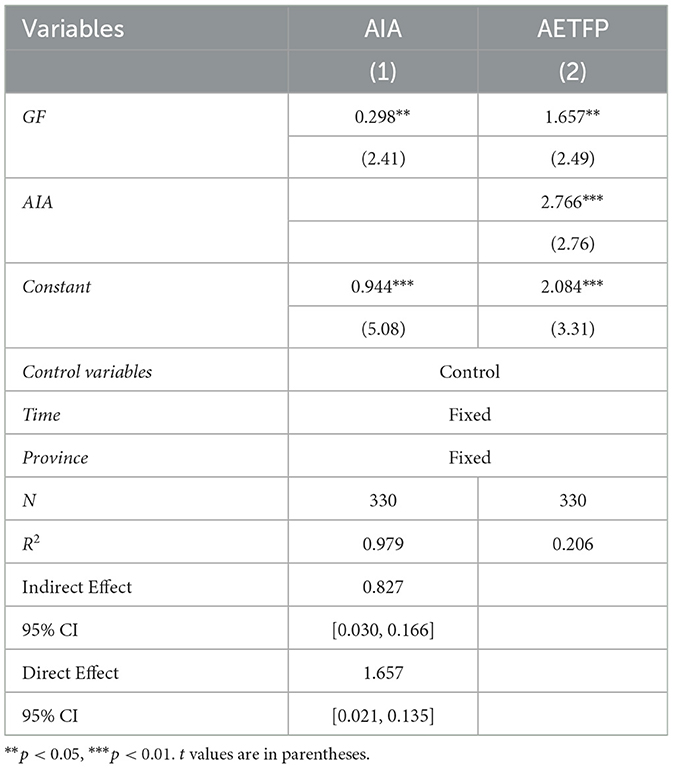
Table 8. Mechanism test results.
4.5 Heterogeneity analysis
4.5.1 Heterogeneity analysis of regional division
According to the regional division of China, this paper divides the samples into four regions: eastern, central, western and northeastern regions. Table 9 shows the results of the impact of GF on AETFP in these regions. According to the results in columns (1) ~ (4), GF in the eastern and central regions is significant at least at the 5% level, but the estimated coefficient of GF in the eastern region is larger than that in the central region, indicating that GF in the eastern region has a stronger role in improving AETFP than that in other regions. As mentioned above, the AETFP level in the eastern region grows rapidly, and the popularization of financial services and the development of GF are also relatively ahead. As mentioned above, AETFP in the eastern region increases rapidly, and the popularity of financial services and the development of GF are relatively leading. The promotion effect of GF on AETFP level in western China is not obvious, which may be due to the backward financial development level, diverse climate and relatively lack of agricultural resources in this region. All these factors may weaken the role of GF in AETFP level.
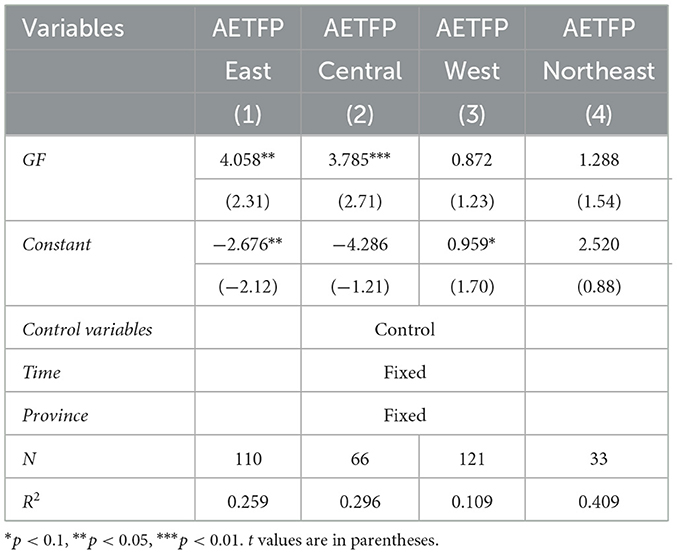
Table 9. Heterogeneity analysis I.
4.5.2 Heterogeneity analysis of the division of food functional zones
In this paper, each province is divided into the main grain-producing region, the main grain-marketing region and the balanced grain production and sales region. According to the results of columns (1) ~ (3) of Table 10, only the main grain-producing regions and the main grain-marketing regions have a significantly increased impact of GF on AETFP, and the promotion effect is greater in the main grain-producing regions. This may be because major grain-producing regions usually have a large amount of cultivated land and agricultural resources, and are the main bases of grain production. These regions tend to be more dependent on agriculture and therefore focus more on the sustainable development of agriculture. By providing financial support and preferential policies, GF promotes the innovation of agricultural technology and the promotion of green production mode, thus improving AETFP. The food production and marketing balance area is between the main food production and marketing area, and its agricultural resources are relatively rich, but agriculture is not its main economic pillar. These regions may give priority to other industries, so GF's influence on AETFP is relatively weak.
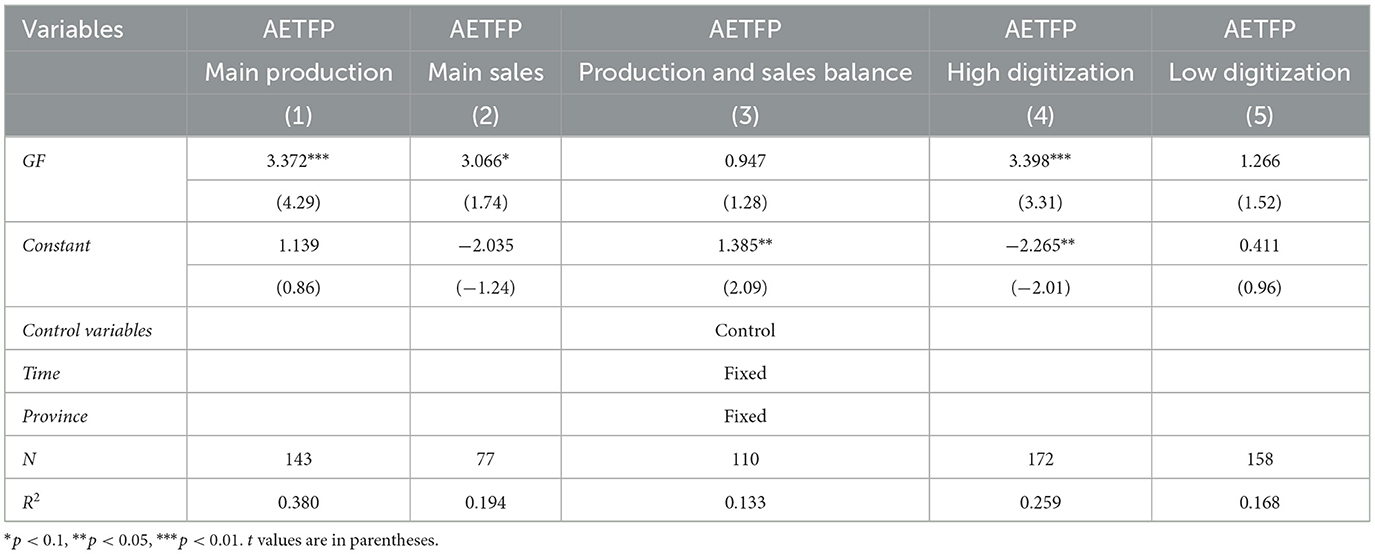
Table 10. Heterogeneity analysis II.
4.5.3 Heterogeneity analysis of digital infrastructure
With the development of digital technology, it plays an important role in the field of agricultural development. Therefore, the difference in the development of digital infrastructure also determines the effect of GF on AETFP. This paper comprehensively calculates the level of rural digital infrastructure from six aspects: the popularization level of rural mobile phones, the popularization level of rural computers, the popularization level of rural Internet, the rural power level, the construction of rural circulation facilities and rural meteorological observation stations. According to the median division of digital infrastructure, the samples are divided into two groups: low-level and high-level. Table 10 shows the results of the impact of GF on AETFP. According to the results of columns (4) and (5), in the samples with a high degree of digital infrastructure, GF is significantly positive at the level of 1%, while in the samples with a low degree of digital infrastructure, GF's promotion effect on AETFP is not obvious, indicating that compared with the regions with a low degree of digital infrastructure, GF's promotion effect on AETFP is stronger in the regions with a high degree of digital infrastructure. The reason is that the difference of digital infrastructure may affect the efficiency of information circulation, the accessibility of technology and the responsiveness of agricultural producers to GF policies. In the area of digital high degree, agricultural producers can more easily access to market information, technical guidance and financial support, so as to more effectively deal with risks. However, in less digitized regions, these resources may be relatively scarce, limiting the utilization and response of agricultural producers to GF policies.
5 Discussions and conclusions
5.1 Discussions
Green is the background color of agriculture, and ecology is the chassis of agriculture. This paper breaks through the limitations of existing literatures that only focus on agricultural economic value as the desirable output, and incorporates agricultural ecological value into the desirable output index. Taking China as an example, this paper uses EBM-GML model to measure AETFP level. The spatial evolution characteristics of AETFP in different regions of China were investigated. Secondly, considering the role of GF in agricultural development, this paper uses fixed-effect model and spatial econometric model to explore the impact mechanism of GF on AETFP, and reveals the spatial spillover effect from trans-regional GF services. Finally, this paper not only explores the agricultural industry agglomeration as an important channel for GF to influence AETFP, but also examines the heterogeneous effect of GF on AETFP in different regions, different food functional areas and different digital infrastructure levels. The following is a further discussion of the main conclusions: First, the analysis of spatial evolution characteristics of AETFP shows that from 2012 to 2022, AETFP in China presents an overall trend of gradual increase, especially in the eastern region. This phenomenon may be due to the fact that the eastern region has better natural resources and economic foundation, and the promotion and application of ecological agriculture technology is more mature. Second, the effect of GF on AETFP shows that GF can not only improve local AETFP, but also drive the increase of AETFP in surrounding areas through spatial spillover effect. This result reflects the key role of GF in agricultural modernization and ecologically sustainable development. GF promotes the transformation of the agricultural industry into an efficient, low-carbon and ecological industry by channeling more funds into agricultural projects that meet the requirements of ecological development. Meanwhile, consistent with Wu's (2023) study, green finance can enhance the synergistic effect of regional ecosystems and lead to the optimization of agro-ecological environment in the surrounding areas.
Third, GF promotes AETFP through agricultural industry agglomeration, revealing that GF promotes agricultural industry agglomeration, forms synergy effect between upstream and downstream of agricultural industry chain, and promotes efficient utilization and sharing of resources. The agglomeration of agricultural industry helps to coordinate the ecological resources in the region, form a large-scale ecological governance model, and enhance the sustainability of the agricultural ecosystem. Fourth, through heterogeneity analysis, it was found that the promoting effect of GF on AETFP is particularly evident in the eastern region, major grain-producing areas, and regions with high digital infrastructure. On the one hand, the well-developed property rights trading market and the mechanism for realizing the value of ecological products in the eastern region enable GF to accurately identify high-return green projects. In contrast, market segmentation and information asymmetry in the central and western regions have left GF stuck in traditional agricultural credit, preventing it from activating the comprehensive innovation required for the improvement of AETFP. Agricultural basic conditions and digital technology support capabilities are also important factors determining GF's empowerment of AETFP.
Although this study has carried out rich and valuable theoretical analysis and empirical test on the impact of GF on AETFP, there are still some limitations. Firstly, when calculating AETFP in this paper, although agricultural ecological value was introduced, the division of agricultural ecosystem service functions might not be comprehensive enough. In the future, functions such as food production and raw material production could be considered to be added. Secondly, the research period of this paper is from 2012 to 2022. Although it is representative to some extent, it fails to cover the longer dynamic evolution process and may have overlooked the long-term and lagging effects between green finance and AETFP. In the evolution trend of AETFP, the impact of major policy changes or external shocks was not taken into account. Thirdly, this paper mainly conducts empirical analysis based on provincial panel data, which may have data aggregation biases. For instance, the suppression effect of GF agglomeration in provincial capital cities on surrounding counties is averaged out, and the differentiated impact of GF in geographical gradients and ecological zoning cannot be captured at the provincial scale, thus leading to the blurring of key spatial interaction mechanisms. Future research can focus the research samples on the county-level and leading agricultural enterprises to more comprehensively reflect the enabling role of green finance.
5.2 Conclusions
Improving AETFP is the core driving force to promote the construction of ecological civilization and achieve high-quality agricultural development, a key measure to change the mode of agricultural development and cultivate new driving forces for agricultural growth, and a policy focus to narrow the regional development gap and promote the coordinated development of agricultural economy and ecological environment. From the perspective of financial empowerment, this paper explores the internal relationship between GF and AETFP through theoretical analysis and empirical test. The main conclusions are as follows: first, from the perspective of spatial evolution characteristics, China's overall AETFP continued to increase during the investigation period, but the regional gap continued to expand. The growth trend of AETFP in eastern and western regions was obvious, while the central region showed a fluctuation characteristic of first rising and then decreasing; Second, GF not only significantly improves local AETFP, but also drives the increase of AETFP in surrounding areas through spatial spillover effect. Third, GF can improve AETFP by promoting agricultural industrial agglomeration; Fourth, the promotion effect of GF is particularly obvious in eastern regions, major grain-producing regions and regions with high digital infrastructure. According to the above conclusion, put forward the following Suggestions:
First, the government should promote diverse planting systems, agroforestry integration, and landscape optimization to enhance the material circulation within agricultural production systems. It can advance the adoption of technologies such as biowaste treatment and precision water-fertilizer management to enable comprehensive waste processing throughout the agricultural production process, thereby reducing environmental impacts. Additionally, the government should optimize the allocation of regional resources, ecological frameworks, and industrial layouts while expanding agricultural functions to improve the functionality of agricultural ecosystems.
Second, the government should strongly support digital infrastructure and expand the coverage of agricultural insurance, particularly by incorporating smallholder farmers into insurance systems. It should promote innovation in green agricultural technologies to achieve breakthroughs in disruptive technologies for environment adaptation and establish technological demonstration bases in major agricultural production areas.
Third, the government should establish and improve ecological compensation mechanisms to encourage grain-producing regions to adopt sustainable agricultural practices, such as reducing the use of chemical fertilizers and pesticides, protecting soil and water resources, and enhancing ecosystem resilience. By implementing economic incentives such as subsidies and tax reductions, the government can facilitate farmers' transition toward greener and more eco-friendly production methods.
Data availability statement
The original contributions presented in the study are included in the article/supplementary material, further inquiries can be directed to the corresponding author.
Author contributions
LL: Writing – review & editing, Funding acquisition, Formal analysis, Writing – original draft, Validation, Conceptualization. XL: Conceptualization, Writing – original draft, Methodology, Data curation, Validation. KL: Writing – review & editing, Formal analysis, Methodology, Validation.
Funding
The author(s) declare that financial support was received for the research and/or publication of this article. This research was supported by the National Social Science Foundation of China (22XGL020).
Acknowledgments
We sincerely appreciate the efforts and patient comments from the editors and reviewers.
Conflict of interest
The authors declare that the research was conducted in the absence of any commercial or financial relationships that could be construed as a potential conflict of interest.
Generative AI statement
The author(s) declare that no Gen AI was used in the creation of this manuscript.
Publisher's note
All claims expressed in this article are solely those of the authors and do not necessarily represent those of their affiliated organizations, or those of the publisher, the editors and the reviewers. Any product that may be evaluated in this article, or claim that may be made by its manufacturer, is not guaranteed or endorsed by the publisher.
References
Barath, L., and Ferto, I. (2017). Productivity and convergence in European agriculture. J. Agric. Econ. 68, 228–248. doi: 10.1111/1477-9552.12157
Barath, L., Ferto, I., and Bojnec, Š. (2020). LFA and agri-environmental subsidies on the components of total factor productivity: the case of Slovenian farms. J. Agric. Econ. 71, 853–876. doi: 10.1111/1477-9552.12374
Bengochea Paz, D., Henderson, K., and Loreau, M. (2022). Habitat percolation transition undermines sustainability in social-ecological agricultural systems. Ecol. Lett. 25, 163–176. doi: 10.1111/ele.13914
Billings, S. B., and Johnson, E. B. (2012). The location quotient as an estimator of industrial concentration. Reg. Sci. Urban Econ. 42, 642–647. doi: 10.1016/j.regsciurbeco.2012.03.003
Chen, M., Ma, L., Che, X., and Dou, H. (2020). Identification of transformation stages and evolution of agricultural development types based on total factor productivity analysis: a case study of Gansu province, China. Agriculture 10:363. doi: 10.3390/agriculture10080363
Chen, S., and Gong, B. (2021). Response and adaptation of agriculture to climate change: evidence from China. J. Dev. Econ. 148:102557. doi: 10.1016/j.jdeveco.2020.102557
Diaz-Rainey, I., Corfee-Morlot, J., Volz, U., and Caldecott, B. (2023). Green finance in Asia: challenges, policies and avenues for research. Clim. Policy 23, 1–10. doi: 10.1080/14693062.2023.2168359
Donner, M., and de Vries, H. (2021). How to innovate business models for a circular bio-economy? Bus. Strateg. Environ. 30, 1932–1947. doi: 10.1002/bse.2725
Duque-Acevedo, M., Belmonte-Ureña, L. J., Yakovleva, N., and Camacho-Ferre, F. (2020). Analysis of the circular economic production models and their approach in agriculture and agricultural waste biomass management. Int. J. Environ. Res. Public Health 17:9549. doi: 10.3390/ijerph17249549
Grossman, G. M., and Krueger, A. B. (1995). Economic growth and the environment. Quart. J. Econ. 110, 353–377. doi: 10.2307/2118443
Hu, J., Zhang, X., and Wang, T. (2022). Spatial spillover effects of resource misallocation on the green total factor productivity in Chinese agriculture. Int. J. Environ. Res. Public Health 19:15718. doi: 10.3390/ijerph192315718
Koiry, S., and Huang, W. (2023). Do ecological protection approaches affect total factor productivity change of cropland production in Sweden? Ecol. Econ. 209:107829. doi: 10.1016/j.ecolecon.2023.107829
Liu, D., Zhu, X., and Wang, Y. (2021). China's agricultural green total factor productivity based on carbon emission: an analysis of evolution trend and influencing factors. J. Clean. Prod. 278:123692. doi: 10.1016/j.jclepro.2020.123692
Liu, J., Dong, C., Liu, S., Rahman, S., and Sriboonchitta, S. (2020). Sources of total-factor productivity and efficiency changes in China's agriculture. Agric. 10:279. doi: 10.3390/agriculture10070279
Liu, W., Zhou, W., and Lu, L. (2022). An innovative digitization evaluation scheme for Spatio-temporal coordination relationship between multiple knowledge driven rural economic development and agricultural ecological environment—Coupling coordination model analysis based on Guangxi. J. Innov. Knowl. 7:100208. doi: 10.1016/j.jik.2022.100208
Lu, F., Wang, W., Liu, M., Liu, M., and Qi, D. (2024). The non-linear effect of agricultural insurance on agricultural green competitiveness. Technol. Anal. Strat. Manag. 36, 1414–1429. doi: 10.1080/09537325.2022.2098102
Mastini, R., Kallis, G., and Hickel, J. (2021). A green new deal without growth?. Ecol. Econ. 179:106832. doi: 10.1016/j.ecolecon.2020.106832
Méndez-Picazo, M. T., Galindo-Martín, M. A., and Castaño-Martínez, M. S. (2021). Effects of sociocultural and economic factors on social entrepreneurship and sustainable development. J. Innov. Knowl. 6, 69–77. doi: 10.1016/j.jik.2020.06.001
Morseletto, P. (2020). Restorative and regenerative: Exploring the concepts in the circular economy. J. Ind. Ecol. 24, 763–773. doi: 10.1111/jiec.12987
Oh, D. H. (2010). A global Malmquist-Luenberger productivity index. J. Product. Anal. 34, 183–197. doi: 10.1007/s11123-010-0178-y
Perdana, T., Kusnandar, K., Perdana, H. H., and Hermiatin, F. R. (2023). Circular supply chain governance for sustainable fresh agricultural products: minimizing food loss and utilizing agricultural waste. Sustainable Prod. Consumption 41, 391–403. doi: 10.1016/j.spc.2023.09.001
Plastina, A., and Lence, S. H. (2018). A parametric estimation of total factor productivity and its components in US agriculture. Am. J. Agric. Econ. 100, 1091–1119. doi: 10.1093/ajae/aay010
Shen, Y., Guo, X., and Zhang, X. (2023). Digital financial inclusion, land transfer, and agricultural green total factor productivity. Sustainability-Basel 15:6436. doi: 10.3390/su15086436
Song, Y., Zhang, B., Wang, J., and Kwek, K. (2022). The impact of climate change on China's agricultural green total factor productivity. Technol. Forecast. Soc. Change 185:122054. doi: 10.1016/j.techfore.2022.122054
Tone, K., and Tsutsui, M. (2010). An epsilon-based measure of efficiency in DEA–a third pole of technical efficiency. Eur. J. Oper. Res. 207, 1554–1563. doi: 10.1016/j.ejor.2010.07.014
Wang, H., Zhao, D., Zhou, Q., Ke, Q., and Dong, G. (2023). The coupling relationship between green finance and ecosystem service demand in china based on an improved coupling coordination degree model. Land 12:529. doi: 10.3390/land12030529
Wang, Y., and Qian, Y. (2024). Driving factors to agriculture total factor productivity and its contribution to just energy transition. Environ. Impact Assess. Rev. 105:107369. doi: 10.1016/j.eiar.2023.107369
Wu, G. (2023). Research on the spatial impact and coupling coordination of green finance on the ecological development of China's economy. Econ. Change Restructur. 56, 3353–3381. doi: 10.1007/s10644-023-09504-w
Wu, G., Xie, Y., Li, H., and Riaz, N. (2022). Agricultural ecological efficiency under the carbon emissions trading system in China: a spatial difference-in-difference approach. Sustainability-Basel 14:4707. doi: 10.3390/su14084707
Wu, J., Ge, Z., Han, S., Xing, L., Zhu, M., Zhang, J., et al. (2020). Impacts of agricultural industrial agglomeration on China's agricultural energy efficiency: a spatial econometrics analysis. J. Cleaner Prod. 260:121011. doi: 10.1016/j.jclepro.2020.121011
Xu, J., She, S., Gao, P., and Sun, Y. (2023). Role of green finance in resource efficiency and green economic growth. Resour. Policy 81:103349. doi: 10.1016/j.resourpol.2023.103349
Xue, Y., Hu, D., Irfan, M., Wu, H., and Hao, Y. (2023). Natural resources policy making through finance? The role of green finance on energy resources poverty. Resour. Policy 85:104023. doi: 10.1016/j.resourpol.2023.104023
Yuan, X., Zhang, J., Shi, J., and Wang, J. (2024). What can green finance do for high-quality agricultural development? Fresh insights from China. Socioecon. Plann. Sci. 94:101920. doi: 10.1016/j.seps.2024.101920
Zhang, D., Mohsin, M., and Taghizadeh-Hesary, F. (2022). Does green finance counteract the climate change mitigation: asymmetric effect of renewable energy investment and RandD. Energy Econ. 113:106183. doi: 10.1016/j.eneco.2022.106183
Zhang, H., Xiong, P., Yang, S., and Yu, J. (2023). Renewable energy utilization, green finance and agricultural land expansion in China. Resour. Policy 80:103163. doi: 10.1016/j.resourpol.2022.103163
Zhang, J., Chen, Y., Zhu, C., Huang, B., and Gan, M. (2021). Identification of potential land-use conflicts between agricultural and ecological space in an ecologically fragile area of southeastern China. Land 10:1011. doi: 10.3390/land10101011
Keywords: green finance, agricultural ecological value, total factor productivity, industrial agglomeration, spatial spillover effect
Citation: Liu L, Li X and Li K (2025) How can green finance promote the synergistic development of agricultural ecological environment and productivity? Front. Sustain. Food Syst. 9:1598130. doi: 10.3389/fsufs.2025.1598130
Received: 06 April 2025; Accepted: 28 July 2025;
Published: 14 August 2025.
Edited by:
Ailiang Xie, Linyi University, ChinaReviewed by:
Jingjing Wang, Hunan University of Humanities, Science and Technology, ChinaZhentao Liu, Hebei Agricultural University, China
Copyright © 2025 Liu, Li and Li. This is an open-access article distributed under the terms of the Creative Commons Attribution License (CC BY). The use, distribution or reproduction in other forums is permitted, provided the original author(s) and the copyright owner(s) are credited and that the original publication in this journal is cited, in accordance with accepted academic practice. No use, distribution or reproduction is permitted which does not comply with these terms.
*Correspondence: Kaichao Li, NDUxNDk5NTc5QHFxLmNvbQ==