 Simeng Zhang1
 Fengjie Xie2*
- 1School of Economics and Management, Shenyang Ligong University, Shenyang, China
- 2The College of Economics and Management, Shenyang Agricultural University, Shenyang, China
The deep integration of new quality productivity (NQP) with the agricultural sector is an inevitable path to promoting high-quality agricultural development. This paper explores the role of NQP in enhancing the high-quality agricultural development using panel data from 30 provinces in China over the period 2012–2021. An evaluation index system was constructed to measure both NQP and the level of high-quality development of agriculture. Empirical analysis was conducted using fixed effect and threshold effect models to test the promotion effect of NQP on agricultural development. The results indicate that NQP significantly promotes high-quality agricultural development, a conclusion that remains robust after undergoing robustness tests. Heterogeneity analysis reveals regional differences, with the eastern region showing the strongest effect, followed by the central region, and the western region showing the weakest effect. Additionally, in areas with higher levels of marketization, the promoting effect of NQP is more pronounced. Further research shows a non-linear relationship between NQP and agricultural development, characterized by increasing marginal effects. The findings provide robust support for the practical application of NQP in agriculture to achieve high-quality development and offer significant theoretical foundations for policy-making.
1 Introduction
Agriculture is a foundational industry that is vital to the national economy and people's livelihoods. High-quality agriculture is a cornerstone of advanced economic development and a key priority in achieving agricultural modernization. In recent years, the Ministry of Agriculture and Rural Affairs of China has released a series of policy documents, including “Guiding Opinions on Expanding the Multiple Functions of Agriculture and Promoting High-quality Development of Rural Industries” and the “Guiding Opinions on Accelerating the High-quality Development of Primary Processing Mechanization of Agricultural Products.” Despite the fact that achieving high-quality agricultural development is an inevitable trend, the negative consequences of several critical issues have become increasingly prominent. These issues include the outflow of agricultural population, decline in arable land quality as well as agricultural non-point source pollution (Yue, 2024). It is evident the realization of high-quality agricultural development urgently needs to seek a new “booster.” In September 2023, during the inspection and research in Heilongjiang, the General Secretary Xi Jinping emphasized the need to accelerate the formation of NQP. It represents a new form of productive forces that, based on traditional productive forces, drive connotative development through their characteristic of technological innovation. Its gradual penetration into the agricultural sector has provided a new opportunity for exploring breakthrough development of agricultural productive forces in China, and also offered a new perspective for contemplating ways to promote high-quality agricultural development.
Currently, research on NQP is still in its infancy and remains in the exploratory phase. Scholars have primarily provided rich interpretations of the connotations and characteristics of NQP from various perspectives. As Xu (2024) argues, NQP represents an upgraded productive paradigm achieved through energy-level leaps driven by new technologies, emerging business formats, and novel driving forces. Zhou and Xu (2023) characterize NQP as a substantial leap from traditional productive forces, enabled by breakthroughs in critical disruptive technologies. Some other scholars have focused on exploring its realization path. Among them, Xu et al. (2024) explored the response mechanism of NQP based on the SOR model, and proposed an effective path to enhance the level of NQP by examining the mechanisms of scientific and technological innovation as well as the talent capital structure. Peng (2024) summarized the path of formation and development of NQP from four aspects, including factor circulation, on the basis of revealing the logic of formation of NQP. However, empirical studies on NQP still remain limited, primarily focusing on measurement frameworks. For instance, Feng et al. (2024) selected indicators such as the level of entrepreneurial engagement from the dimensions of technological innovation, production factors, and production relations to measure NQP in 271 prefecture-level cities in China. Yao et al. (2025) measures NQP from two dimensions, namely substantive elements and pervasive elements. Substantive elements include labor force, labor resource, and labor object, while pervasive elements primarily focus on technologies.
Existing studies on high-quality agricultural development mainly concentrates on three aspects: Initially, the definition of the concept of high-quality agricultural development. Xia et al. (2019) argue that high-quality agriculture constitutes an integrated entity that encompasses the industrial, production and management systems. Leng et al. (2021) have undertaken a comprehensive investigation its basic connotation from four dimensions: resource consumption, ecological environment, product quality, and farmers' income. Secondly, the construction of evaluation index system for the level of high-quality agricultural development. Among them, Yang and Wang (2022), following the broad agricultural approach, selected indicators from four aspects of agricultural development, environmental conditions, resource conditions and economic conditions, and established a measurement index. Thirdly, the key factors affecting high-quality agricultural development. Some scholars have further analyzed its driving factors from the perspectives of macro policies, financial environment, digital economy, etc. by means of empirical tests. For example, Zhu et al. (2024) employed a Difference-in-Differences (DID) model to verify the role of agricultural subsidy policies in supporting high-quality agricultural development. Similarly, Ye (2025) utilized provincial panel data and elucidate the mechanism that digital economy plays on it.
In summary, while prior research has discussed NQP and high-quality agricultural development separately, current academic discourse demonstrates limited progress in incorporating both into the same theoretical analytical framework, and even fewer providing empirical evidence at the empirical level. Based on this, this paper incorporates these two into the same research framework, and answers the following research questions: (1) How to quantify NQP, and what are its spatiotemporal evolution characteristics? (2) Does NQP have a positive impact on high-quality agricultural development? If so, is this impact heterogeneous? (3) Is the relationship between NQP and high-quality agricultural development characterized by non-linear features? The responses to the above questions will enrich the theoretical research on their relationship, and provide empirical evidence for policy-making, which is conducive to optimizing resource allocation, devising region-specific strategies, and promoting the modernization of agriculture. The possible marginal contributions of this paper are as follows: First, from the new perspective of NQP, this paper explores its impact on high-quality agricultural development, expanding the research perspective. This paper not only enriches the research at the theoretical level but also verifies it at the empirical level. Second, combining the characteristics of the agricultural industry, this paper defines NQP in the field of agriculture, and selects agricultural-related indicators to construct a targeted evaluation index system, and thus more accurately estimates the effect of NQP in the agricultural field. Third, existing empirical studies mostly explore the impact on high-quality agricultural development from the perspective of linear equilibrium. This paper attempts to use the threshold model to explore their nonlinear relationship.
2 Theoretical analysis and research hypothesis
2.1 The impact mechanism of NQP on high-quality agricultural development
Unlike traditional productive forces, the core connotation of NQP is technological innovation. In the agricultural sector, NQP represents a leap in agricultural productive forces dominated by technological innovation. In the process of forming and developing NQP, a series of new technologies, new business forms, and new models will be generated, which will revolutionize agricultural production and management methods, thereby promoting high-quality agricultural development (Huang et al., 2023). Specifically, NQP mainly promotes high-quality agricultural development in the following four aspects:
Firstly, NQP is conducive to increasing the income of rural residents. Driven by innovative technologies, NQP can achieve an upgrade of the entire rural industry chain (Zhang, 2024). Also, the continuous penetration of NQP in the agricultural sector will lead to the reconfiguration of production factors, thereby extending the agricultural production chain. The production factors that have been aggregated and reorganized will endow the agricultural industry with more potential for development. This process will not only facilitate the transition of traditional agriculture toward more intelligent and high-end practices but also enable rural residents to reap greater economic rewards. For example, the adoption of precision agricultural technologies, such as yield monitors, is benefit for producers' revenue (Dhoubhadel, 2021). On the other hand, through the support of emerging technologies that are more convenient, low-cost, and low-threshold, the boundaries between agriculture and other industries will be broken, and the formation of new business forms will be promoted. NQP will give rise to rural e-commerce, rural digital logistics, rural tourism, and other rural digital service industries, thereby broadening the channels for rural residents to obtain income.
Secondly, NQP is beneficial to improving agricultural production efficiency. NQP makes a great change in the agricultural production mode. It can enhance production efficiency through digital transformation of production models. Based on new emerging technologies such as intelligent perception and intelligent control, it can help agricultural production achieve precision and high efficiency, thereby improving production efficiency and product quality (Rakholia et al., 2024). Also, NQP realizes the organic combination of scientific and technological innovation and traditional agriculture. Under the role of technological innovation, agricultural production technology has been upgraded. NQP, by introducing advanced agricultural technologies and equipment, can reduce the labor input in various stages of production, thereby optimizing the production process. Furthermore, NQP enhances the level of response to agricultural risks. It can provide agricultural producers with more data information, such as meteorological data, enabling producers to promptly respond to various emergencies and guard against uncertainties in production.
Thirdly, NQP is helpful to advance the construction of digital infrastructure in rural areas. With the continuous advancement of technological levels, NQP can provide strong informational support for rural construction, thereby narrowing the digital divide between urban and rural areas. The widespread application of emerging technologies such as network communication and computing technologies offers robust support for the construction of digital infrastructure in rural areas. NQP will inject new technologies, new sources of momentum, and new models into rural regions, which can optimize the allocation of resources for new types of infrastructure and, in particular, enhance the construction of both hardware and software for digital infrastructure.
Fourth, NQP is conducive to the development of green agriculture. General Secretary Xi Jinping's assertion that “NQP is inherently green productive forces” reveals the green attribute of NQP. Under the constraint of agricultural resources, NQPs can promote agricultural production toward a greener and more efficient direction. Under the traditional productivity model, high-input and extensive agricultural production not only faces the pressure of diminishing marginal returns but also leads to agricultural non-point source pollution. By introducing digital technologies into agriculture, NQP can effectively reduce environmental costs and facilitate the transition of agricultural production methods toward more green and low-carbon practices (Sanyaolu and Sadowski, 2024). In addition, it can promote the development of clean energy, optimize the energy structure, and improve the rural living environment.
In light of this, this paper proposes Hypothesis 1: NQP can promote high-quality agricultural development.
2.2 The non-linear impact of NQP on high-quality agricultural development
NQP is endogenously embedded within China's economic development process. Its diversified qualitative manifestations across different developmental stages will exert differentiated driving effects on high-quality agricultural development. During its formative stage, weak technological innovation conditions in rural areas limit its catalytic role in agricultural development, lacking the capacity to provide efficient and significant transformative support for empowering high-quality agricultural development (Yi et al., 2023). However, with the accumulation of resources and the improvement of the innovation environment, the potential for technological innovation in rural areas gradually increases. As the number of agricultural technology innovation R&D entities increases, NQP will achieve leapfrog development. Drawing on the theory of diffusion of innovations, this stage is expected to facilitate the rapid circulation of production factors and resources, thereby achieving modernization and large-scale production in the agricultural industry. Consequently, the empowering effect on high-quality agricultural development will be further enhanced. Moreover, NQP involves the improvement of the rate of technological achievement transformation, which is closely related to the conditions of the technology market. In accordance with the theory of externalities, the maturity and vibrancy of the technology market are likely to generate significant positive externalities. The progressive optimization of technology market conditions will enable research institutions to swiftly capture technological transformation trends and generate market-oriented outcomes. Increased technological R&D achievements can cultivate a favorable development environment for nurturing NQP, optimize resource allocation in rural areas, and consequently facilitate high-quality agricultural development. Thus, Hypothesis 2 is proposed.
Hypothesis 2: The promoting effect of NQP on high-quality agricultural development has a non-linear characteristic with increasing marginal effects. When the development of NQP reaches a certain level, its impact significantly intensifies, and the transformation and upgrading of the technology market reinforces this non-linear influence.
3 Methodology and data
3.1 Econometric model
To test the proposed research hypotheses, this paper employs a panel fixed-effects model that accounts for both temporal variations and cross-sectional heterogeneity. Drawing on longitudinal data spanning 2012–2021, this paper constructs the following econometric model to examine the correlation between NQP and high-quality agricultural development:
In Equation 1, dependent variable Agriit signifies high-quality agricultural development. The core independent variable NQPit denotes NQP. Controlit refers to the selected control variables. The subscripts i and t denote the region and time, respectively. The term μit and σt represents individual and time fixed effects. Finally, the term ∂o is the constant estimate term, and εit stands for random error term. The results of the Hausman test and the time effect test conducted on the panel data show that the P-values are both < 0.001, indicating that the specification of the fixed effects model is appropriate.
To verify the non-linear relationship, this paper adopts the threshold effect model proposed by Hansen (1999):
In Equation 2, Pit denotes the threshold variable, and λ represents the threshold value. The indicator function I takes a value of 1 if the specified condition is satisfied and 0 otherwise. β0 is constant estimate term, and εit stands for random error term.
3.2 Variables selection
3.2.1 Dependent variable
High-quality agricultural development (Agri) referring to the study by Huang et al. (2023), we select indicators from four major dimensions—living standards of farmers, efficient agricultural production, rural social security, and agricultural sustainability—to construct an index system (see Table 1). And the entropy method is employed for the measurement during the observation period. In terms of indicator attributes, except for Engel's coefficient, fertilizer use, and pesticide input, which are negative indicators, the rest of the indicators are positive indicators.
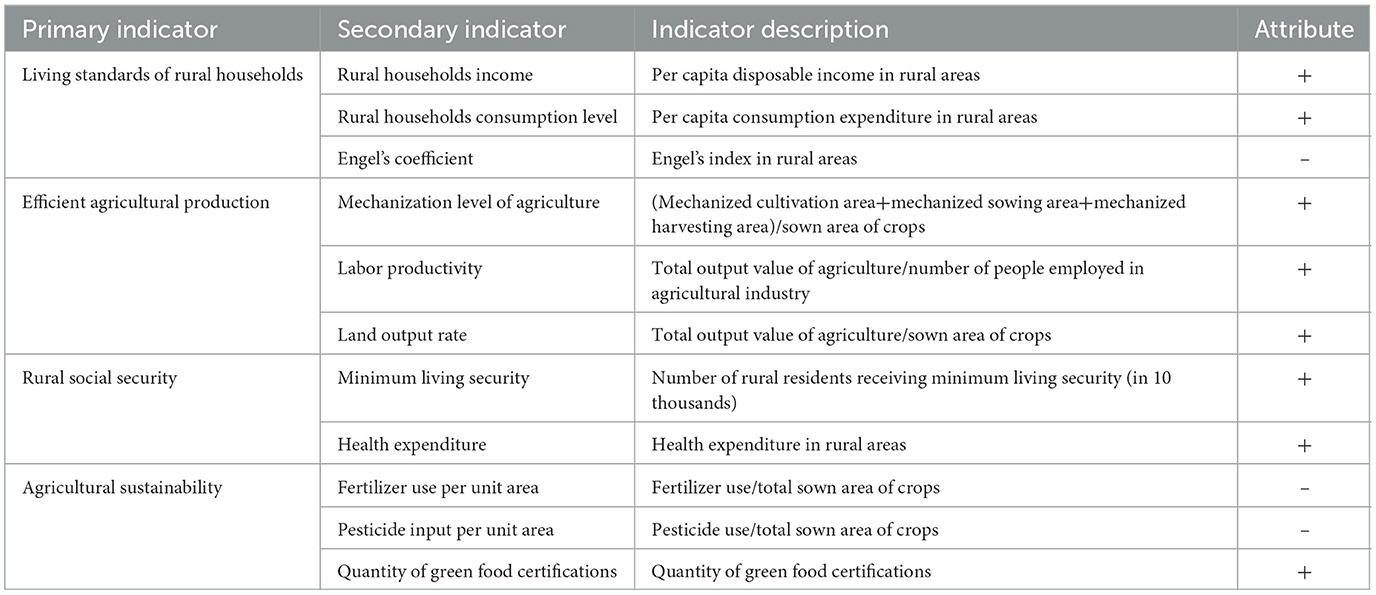
Table 1. Index system for evaluating high-quality agricultural development.
3.2.2 Core independent variable
NQP, with a particular focus on new quality productivity in agriculture. This paper constructs an evaluation index system for NQP from three dimensions: agricultural laborers, objects of agricultural labor, and means of agricultural production (see Table 2). And an entropy method is used for its measurement. Specifically, agricultural laborers are characterized from three aspects: laborer skills, labor productivity, and laborer awareness. In detail, educational attainment and the structure of rural human capital are selected to measure laborer skills; labor productivity is represented by the per capita output value of the agriculture; and laborer awareness is jointly measured by employment and entrepreneurial concepts. The objects of agricultural labor are measured from two aspects: new-quality industries and ecological environment. Specifically, the new-quality industries are measured by two indicators: industrial innovation and industrial value-added; the ecological environment is measured by three indicators: forest coverage rate, environmental protection level, and rural industrial pollution. The means of agricultural production are measured from two aspects: material means of production and intangible means of production. Specifically, traditional infrastructure and renewable energy consumption are selected to measure material means of production; agricultural science and technology human capital input, agricultural science and technology innovation input, and agricultural science and technology progress are selected to measure intangible means of production. Among the above 15 indicators, only rural industrial pollution is a negative indicator, while the rest are positive indicators.
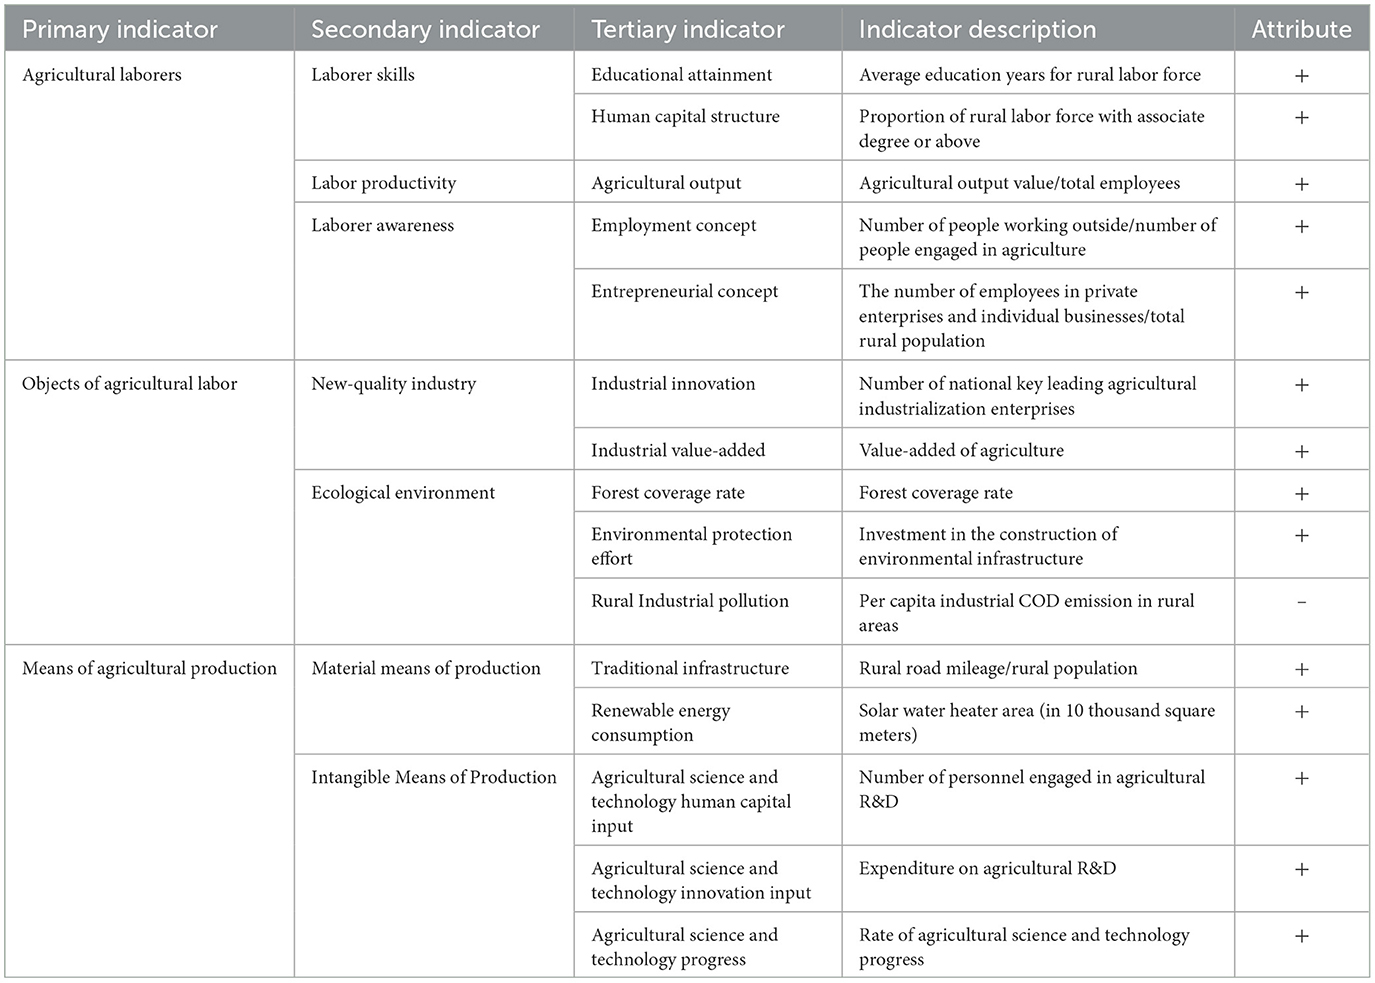
Table 2. Index system for evaluating new quality productivity.
3.2.3 Control variables
Since the factors affecting high-quality agricultural development are complex, considering solely the influence of NQP will give rise to biased results. Therefore, the following control variables are incorporated: Economic Development Level (Eco), constructed using logarithmic transformation of provincial GDP per capita; R&D Intensity (R&D), calculated through the ratio of R&D expenditure to regional GDP; Human Resource Level (Edu), quantified by average educational attainment years among provincial residents; Agricultural Fiscal Support (Fis), calculated as the percentage share of agricultural sector allocations within total fiscal expenditures; Technical Market Development Level (Tech), derived from the proportion of technical market transaction value to GDP; and Urbanization Level (Coun), proxied by the annual urban population percentage.
3.2.4 Threshold variables
It selects NQP and technical market development as threshold variables. Given the disparities in the technical market development level across regions, the technological environment for cultivating NQP varies, and thus its impact over agricultural development may also differ, implying the existence of a threshold effect. Therefore, this paper chooses the level of technical market development as the threshold variable.
3.3 Data sources
Considering data availability, this paper mainly examines the balanced panel data of 30 provinces in China from 2012 to 2021. To ensure the consistency and completeness of the dataset, regions with significant data gaps were not included in the analysis. The Tibet Autonomous Region and the Hong Kong, Macao, and Taiwan regions were excluded. The primary data sources encompass the China Statistical Yearbook, China Rural Statistical Yearbook, China Science and Technology Statistical Yearbook, among others. Where individual data points were missing, they were supplemented by referring to the statistical yearbooks of the respective provinces.
Table 3 provides a comprehensive overview of the descriptive statistics for main variables.
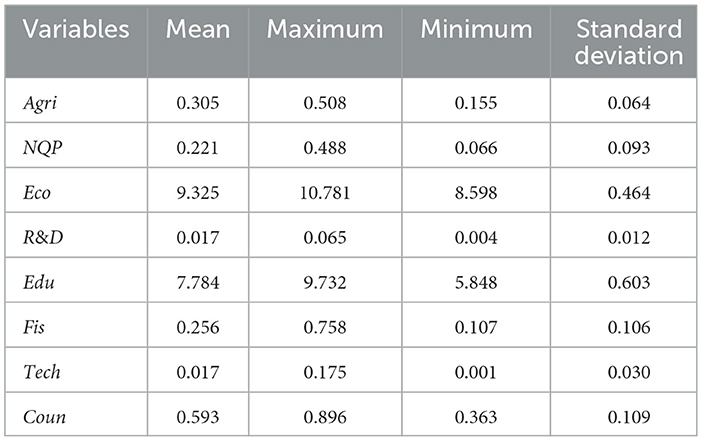
Table 3. Descriptive statistics of the variables.
4 Empirical results and analysis
4.1 Development level of NQP
4.1.1 Non-parametric kernel density estimation
This paper employs kernel density estimation as a method to comprehensively examine the dynamic changes in NQP across rural China over time. As illustrated in Figure 1, the kernel density estimation results for the years 2012, 2015, 2018, and 2021 provide insights into the distribution position, trend, extension, and polarization of NQP during these specific years. In terms of distribution position, the center of curve continuously shifts to the right, indicating a sustained increase in the development level of NQP over the study period. The wave height exhibited a pattern of initially decreasing, then gradually increasing, and finally rapidly decreasing over the examination period. This trend suggests that the dispersion of NQP among provinces in China first expanded at the beginning of the sample period, converged in the middle, and then expanded again toward the end. Moreover, the distribution curve exhibits a distinct rightward tail, but its extension gradually shortens, implying that regions with lower levels of NQP are progressively catching up to the national average.
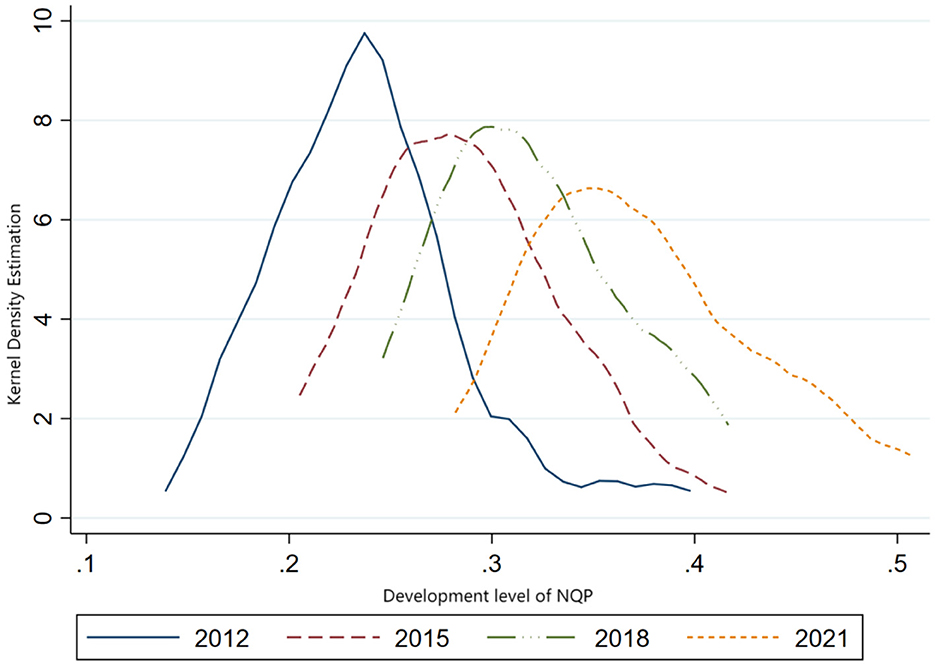
Figure 1. Kernel density estimation of NQP.
4.1.2 Spatial visualization analysis
Based on the measurement results of NQP, this paper further reveals its spatial evolution characteristics using ArcGIS software. By visualizing the data through geographic mapping, we can better understand the regional disparities and temporal changes in NQP. The distribution of the development level of NQP in China for the years 2012, 2015, 2018, and 2021 is successively mapped. Since the natural breaks classification method has different criteria for dividing the target variable at different times, it is difficult to make longitudinal comparisons. Therefore, this paper follows the approach of Mo and Wang (2021), dividing the development level into five intervals according to quintiles: low (0–0.1370), relatively low (0.1371–0.1917), medium (0.1918–0.2234), relatively high (0.2235–0.2971), and high (0.2972–0.4880). The specific evolution process is shown in Figures 2a–d. In the initial period of the sample, a spatial distribution pattern characterized by higher values in the eastern regions and lower values in the western regions. Provinces such as Shandong, Shanghai, Jiangsu, Zhejiang, and Guangdong in the eastern part of China are primarily where the high and relatively high levels of NQP are concentrated. In contrast, western provinces such as Xinjiang, Qinghai, Gansu, Ningxia, and Yunnan have low levels of new-quality productive forces. From 2012 to 2015, a significant number of provinces experienced an upward shift in the development level of NQP. Among them, Shanghai, Jiangsu, Zhejiang, and Guangdong moved from relatively high to high levels; Beijing and Sichuan rose from medium to relatively high levels; Anhui, Hunan, and Liaoning advanced from relatively low to medium levels; and some regions with low levels of new-quality productive forces also improved to relatively low levels, such as Chongqing and Guizhou. From 2015 to 2018, the “central collapse” issue was greatly alleviated. The level of NQP in provinces such as Henan, Hubei, Jiangxi, and Anhui all increased, with some provinces even experiencing cross-grade jumps. Furthermore, from 2018 to 2021, the most significant upward shift in the level of NQP occurred, and a certain clustering distribution trend emerged. The majority of provinces in eastern China have reached a high level of NQP. Although some provinces that located at central and western regions have experienced an increase in NQP levels, Xinjiang, Qinghai, and Ningxia still remain at a low level. This disparity can be attributed to the fact that the eastern region enjoys a higher overall economic level and possesses richer resources for scientific and technological innovation, both of which are conducive to the formation and development of NQP. Overall, during the study period, there was a significant improvement in the level of NQP in China, and regions that initially lagged behind also showed a catching-up trend.
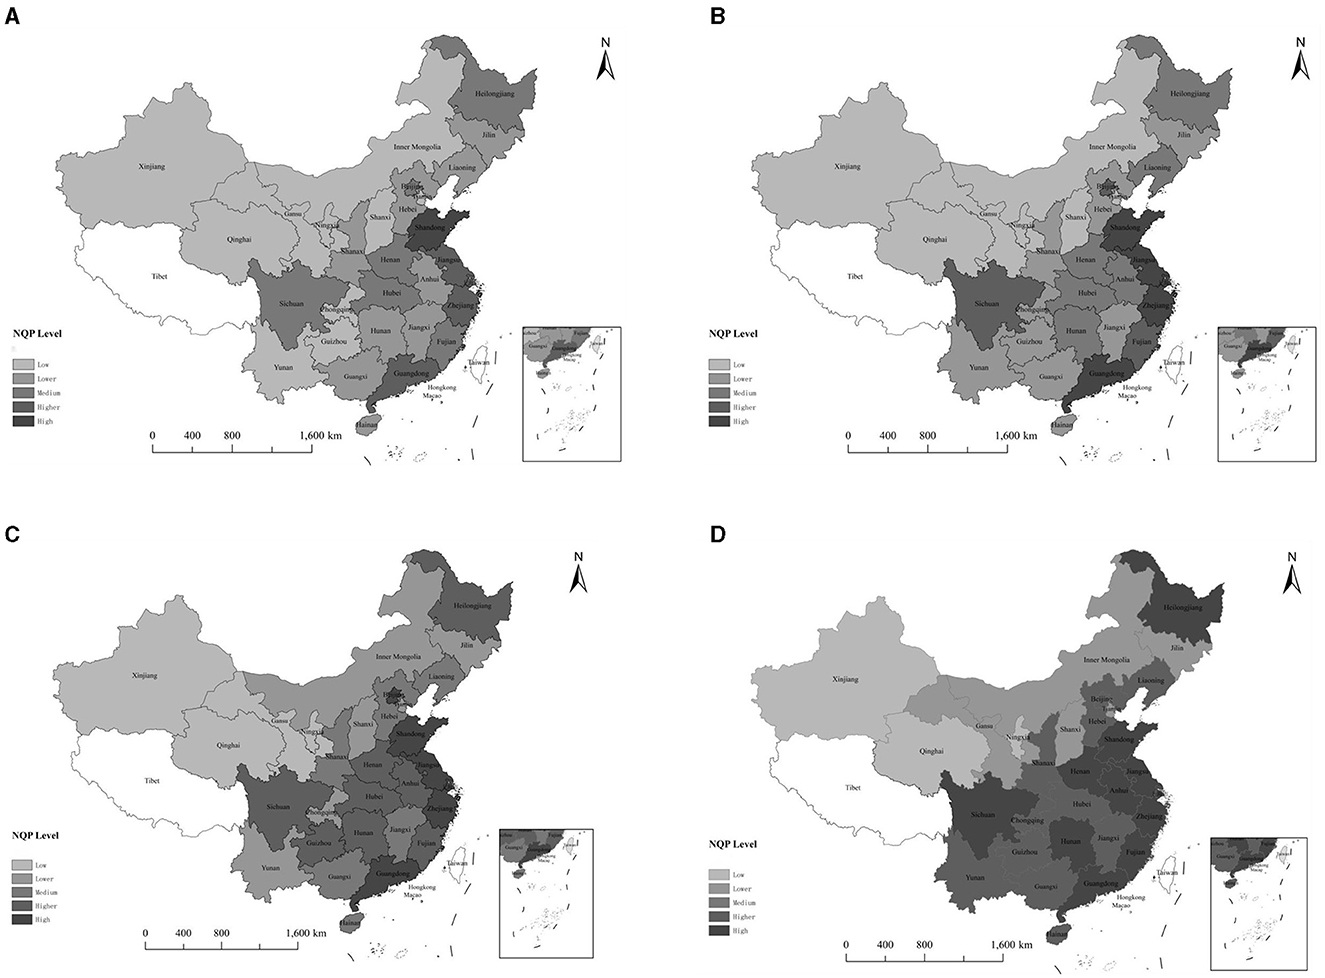
Figure 2. (a) Spatial Distribution of the NQP level in China in 2012. (b) Spatial Distribution of the NQP level in China in 2015. (c) Spatial Distribution of the NQP level in China in 2018. (d) Spatial Distribution of the NQP level in China in 2021.
4.2 Benchmark regression analysis
Utilizing fixed-effects model, the regression results are detailed in Table 4. To isolate the specific effect of NQP and control for other potential influences, different model specifications were employed. In column (1), the regression analysis solely focuses on NQP, whereas column (2) includes NQP along with the other control variables. Furthermore, to minimize the influence of outliers, both NQP and high-quality agricultural development were subjected to logarithmic transformation, and the regression analysis was performed once more. Columns (3) and (4) present the results following log-transformation, with and without the inclusion of control variables, respectively. Across all models, the regression coefficients for NQP remain consistently positive and significant, which demonstrates that NQP can indeed foster high-quality agricultural development, thereby validating Hypothesis 1. Regression coefficients for NQP are 0.936 and 0.338 before and after including control variables, both significant at the 1% statistical level. After log-transformation, regression coefficients of NQP are 0.767 and 0.342 before and after including control variables, respectively, significant at the 1% and 5% levels. Observing the control variables, the estimated coefficients for R&D intensity, human resource level, technical market development level, and urbanization level are also significantly positive, indicating that they likewise have a promoting effect on high-quality agricultural development.
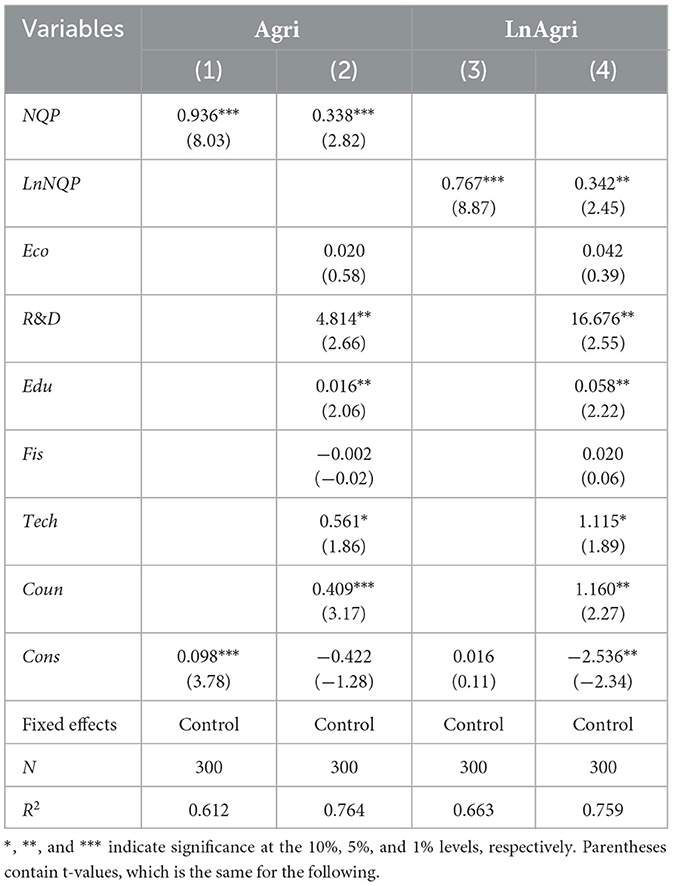
Table 4. Benchmark regression results.
4.3 Endogeneity treatment
Given the potential bidirectional causality between the two, to mitigate the bias in regression results caused by this endogeneity, this paper seeks an appropriate source of exogenous variation to serve as an instrumental variable for NQP. The topographic ruggedness (Top) of the sample provinces is selected as the instrumental variable. It was chosen for the following reasons: First, topographic ruggedness affects the development of NQP. In regions with high topographic ruggedness, the costs of infrastructure construction and maintenance for cultivating NQP are higher, which will restrict its development, thereby satisfying the relevance requirement for the selection of instrumental variables. Second, topographic ruggedness is an inherent geographical information variable of a region, with natural exogeneity, which can meet the exogeneity requirement for the choice of instrumental variables. However, it should be noted that topographic ruggedness is cross-sectional data, while the endogenous variable and the explained variable are panel data containing individual and time information. To address this, following the approach of Angrist and Krueger (1991), the interaction term of topographic ruggedness and annual dummy variables is introduced as the instrumental variable in the model. Subsequently, the paper employs two-stage least squares to re-estimate the benchmark regression. As shown in Table 5 column (1), in the first stage, the coefficient of Top is significant, and F-statistic value is above the critical value, indicating the validity of the instrumental variable. As indicated in column (2), in the second stage, the coefficient of NQP is significantly positive at the 1% level, demonstrating that the previous conclusion remains valid after endogeneity treatment.
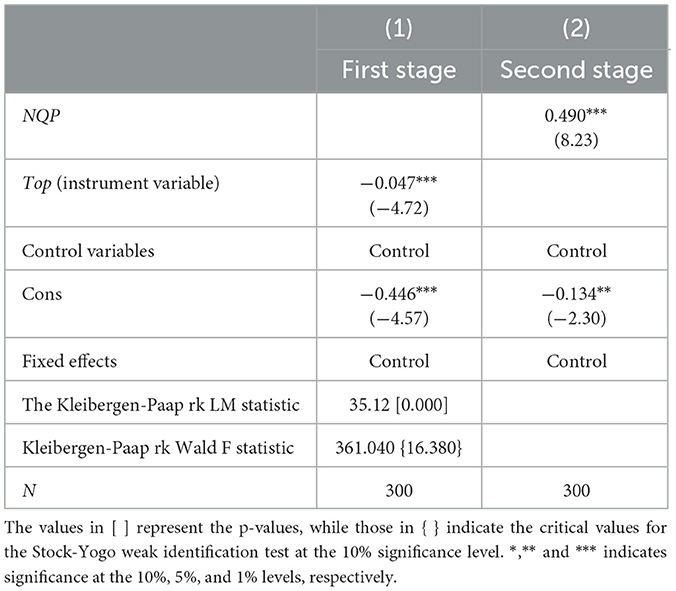
Table 5. Results of the endogeneity test.
4.4 Robustness tests
To verify the reliability of the research findings presented above, this paper employs a series of robustness checks using four distinct approaches: exogenous shock tests, replacement of dependent variables, one-period lag of the independent variable and alternative measurement methods. The results are presented in Table 6.
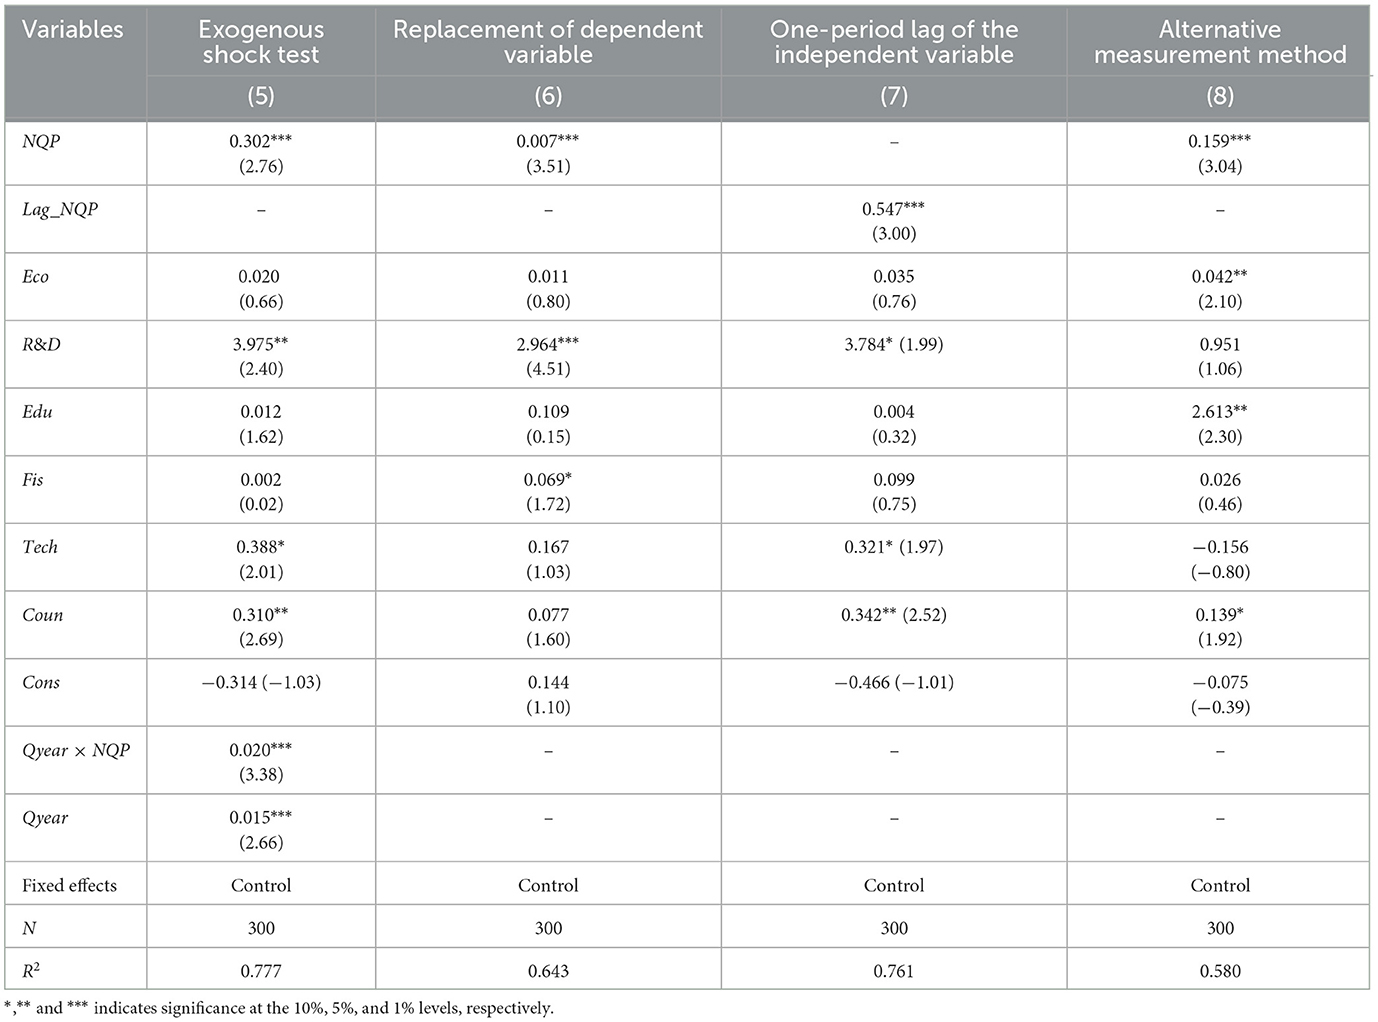
Table 6. Robustness tests results.
4.4.1 Exogenous shock test
Exogenous shocks, such as national policies, may affect the robustness. Using approach proposed by Yi, this paper treats the “Year of Agricultural Quality” established by the Ministry of Agriculture in 2018 as an exogenous shock. The Ministry of Agriculture emphasized the need to shift from total expansion to quality improvement in the agricultural sector through product quality safety, agricultural brand enhancement, and technological equipment support, and planned actions such as establishing more than a 100 counties for the quality and safety of agricultural products and creating credit files for agricultural production. These action plans will undoubtedly advance the construction process of high-quality agricultural development. Based on this, this paper includes the interaction term between the Year of Agricultural Quality and NQP, as well as the Year of Agricultural Quality, in Equation 1. The value of the interaction term is 0 before 2018 and 1 from 2018 onwards. As depicted in column (5), the regression coefficient associated with the interaction term is significantly positive at the 1% statistical level. This finding suggests that following the establishment of the “Year of Agricultural Quality,” the positive influence of NQP has been notably amplified.
4.4.2 Replacement of dependent variable
Given that technological innovation is a crucial support for the cultivation and development of NQP, this paper employs agricultural technological innovation as a proxy for NQP and re-estimates the model. Agricultural technological innovation is measured by the sum of three types of agricultural patents. As shown in column (6), the coefficient of agricultural technological innovation is 0.007, which is significant at the 1% level.
4.4.3 One-period lag of the independent variable
Given that the positive impact of NQP may be subject to a time lag, this paper lags the NQP by one period (Lag_NQP), and re-estimates the model. The regression results from this adjustment are displayed in column (7). As indicated in Table 6, the coefficient sign and significance of NQP remain largely unchanged, with an estimated coefficient of 0.547, which is significant at the 1% level.
4.4.4 Alternative measurement method
Considering the limitations of the entropy weight method in reflecting comprehensive evaluation results, this paper employs the entropy weight TOPSIS method to re-calculate the high-quality agricultural development. By integrating the objective weighting of the entropy weight method and the comprehensive evaluation mechanism of the TOPSIS method, the entropy weight TOPSIS method can not only determine the weights of each indicator but also comprehensively evaluate the merits of the evaluation objects by calculating the distance between the evaluation objects and the ideal solution. After replacing the indicator calculation method, the results are reported in column (8), where NQP still has a significantly positive impact on the high-quality agricultural development.
In summary, all four robustness tests confirm the reliability of the benchmark regression results.
4.5 Heterogeneity analysis
4.5.1 Geographic heterogeneity
Given that there are differences in development conditions across regions, the positive impact of NQP on high-quality agricultural development may exhibit geographical heterogeneity. To explore this, the sample was grouped in eastern, central, and western regions, and the model was estimated separately for each region. The results are presented in Table 7. Columns (8)–(10) present the heterogeneous analysis results of the benchmark regression model before logarithmic transformation, while columns (11)–(13) report the heterogeneous analysis results after logarithmic transformation. The findings indicate that NQP plays a significantly positive influence on agricultural development through all three regions. A horizontal comparison of the estimation results reveals that the influence of NQP is stronger in eastern than in central and western regions. Specifically, its significance level in different regions is the same, all being significant at the 1% level. However, comparing the estimated coefficients, the influence coefficients of the eastern, central, and western regions are 0.456, 0.226, and 0.183, respectively. After logarithmic transformation of the dependent variable and the core explanatory variable, the influence coefficients of the three regions are 0.588, 0.522, and 0.444, respectively. This suggests that the positive impact of NQP shows a trend of “eastern > central > western.” The variation in impact across these regions may be influenced by differences in economic development levels and the maturity of the technology market. Compared with other regions, the economic situation in the eastern part of our country is at a leading level, with more funds to support the development of the technology market, thereby creating a good development space for the cultivation of NQP.
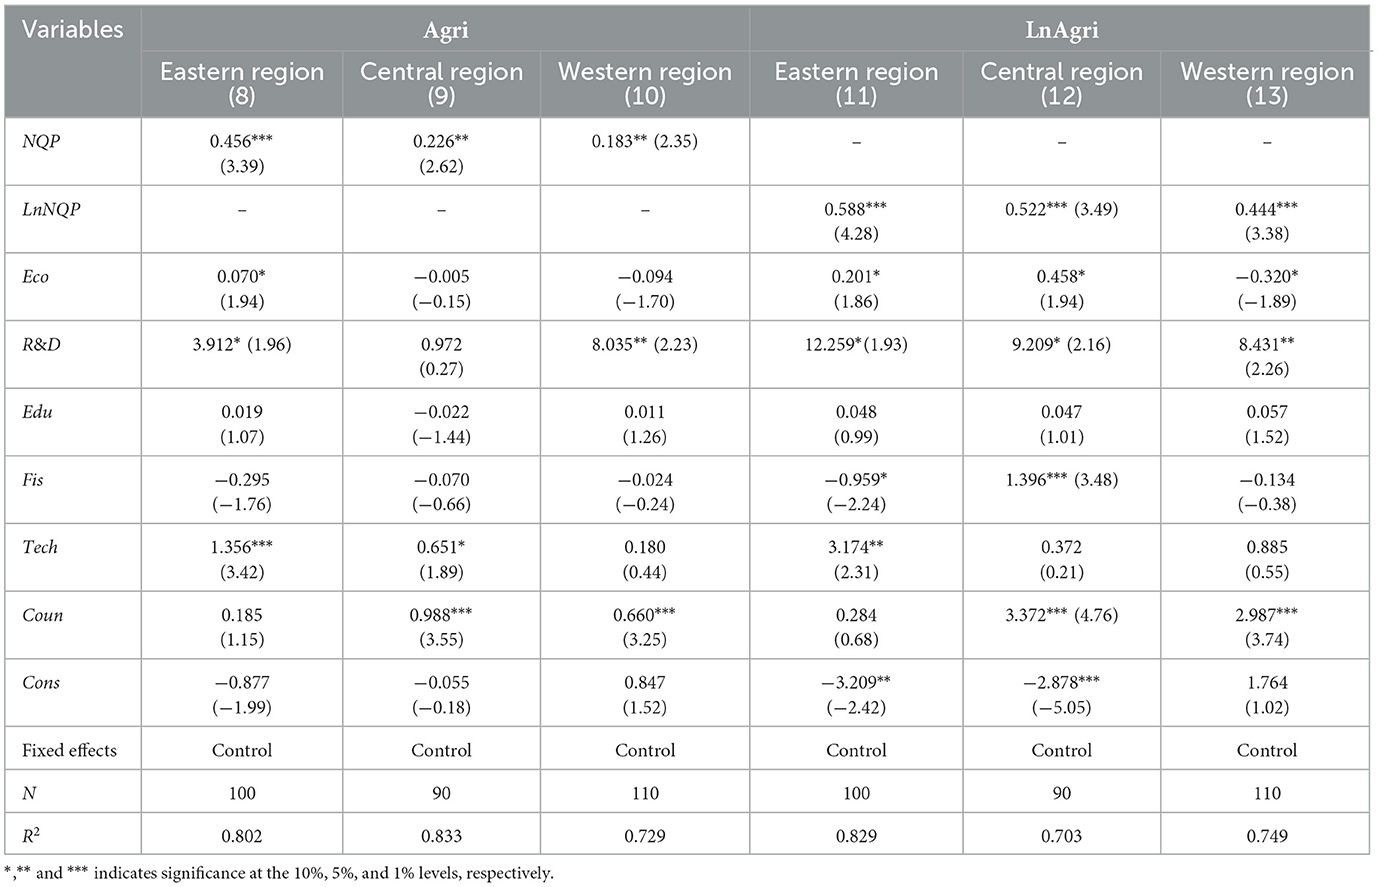
Table 7. Results of geographical heterogeneity analysis.
4.5.2 Marketization level heterogeneity
Moreover, the formation of NQP relies on market mechanisms to achieve optimal resource allocation, and there are significant differences in market openness across different regions in China (Luo et al., 2025). This study groups the sample according to the mean marketization level of 0.593: a high marketization level group and a low marketization level group. The results are presented in Table 8. Columns (14) and (15) of the table report the heterogeneity analysis results before logarithmic transformation. The results indicate that the influence of NQP on agricultural development is stronger in regions with a higher marketization level. Columns (16) and (17) show the heterogeneity analysis results after logarithmic transformation. The regression results similarly suggest that the empowering effect of NQP is greater in regions with a higher marketization level.
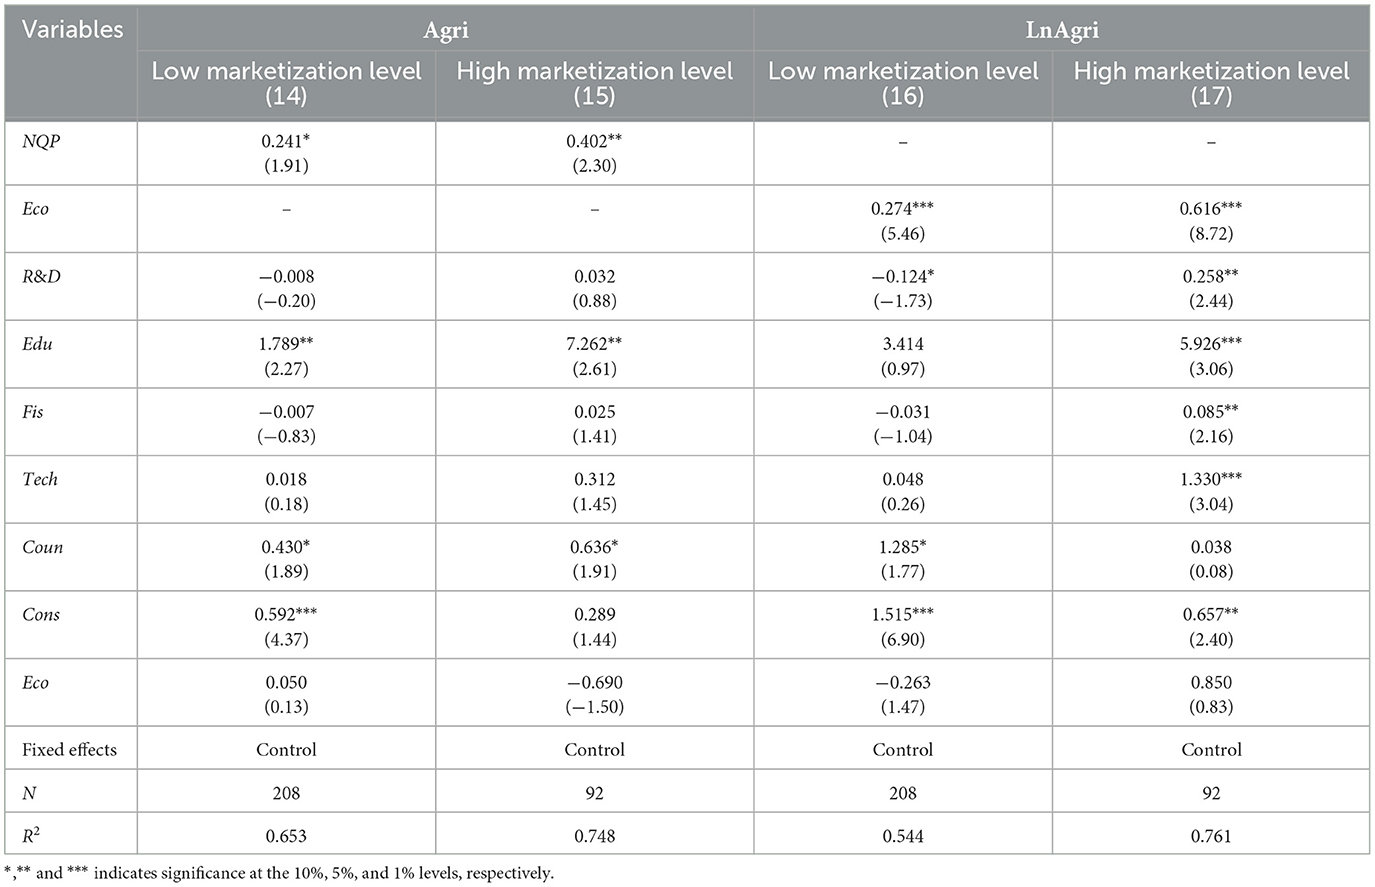
Table 8. Results of marketization level heterogeneity analysis.
4.6 Threshold effect test
This paper examines the non-linear effects of NQP and the level of technology market development on high-quality agricultural development by using them as threshold variables respectively. Given that the Bootstrap method can overcome the limitations of small sample sizes or uncertain data distributions, and that it can provide more accurate statistical inferences through numerous resampling calculations, we employ the Bootstrap test with 300 replications to examine the threshold effects. The existence test results are detailed in Table 9. When NQP is the threshold variable, its F-statistic for the single-threshold test is 8.763, with a p-value of 0.015. At the 5% significance level, the null hypothesis of no threshold value is rejected, indicating the presence of at least one threshold value. In contrast, its F-statistic for the double-threshold test is 3.592, with a p-value of 0.588, suggesting that the null hypothesis is accepted. This implies a single-threshold effect between NQP and high-quality agricultural development. When the level of technology market development is the threshold variable, the F-statistic for the single-threshold test is 10.640, with a p-value of 0.043. At the 5% significance level, the null hypothesis of no threshold value is again rejected, indicating the existence of at least one threshold value. The p-value for the double-threshold test is 0.302, which does not pass the significance test, leading to the acceptance of the null hypothesis. Therefore, the level of technology market development has a single-threshold effect on the impact of NQP on high-quality agricultural development. As a result, this paper opts for the single-panel threshold model for the test.
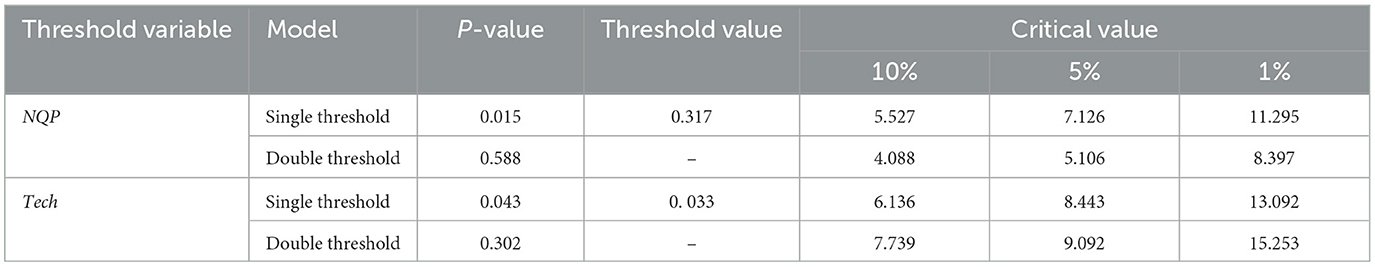
Table 9. Results of the threshold effect test.
The outcomes derived from the threshold model are detailed in Table 10. The threshold value corresponding to NQP is 0.317, and its coefficient values are significantly positive across different thresholds. In Model 1, when NQP is below the threshold value, its estimated coefficient is 0.382; however, when it exceeds the threshold value, the estimated coefficient increases to 0.455. That is to say, after crossing the threshold, for each one-unit increase in NQP, its impact increases from an average of 0.382 units to an average of 0.455 units. The significant increase in the estimated coefficient indicates that the promoting effect of NQP on agricultural development has a non-linear characteristic. Furthermore, taking the threshold value of 0.317 as the boundary, this paper divides the level of NQP in each province during the observation period into low and high levels. Before 2014, the level of NQP in most provinces of our country was at the low stage. Since 2014, NQP has entered the advanced stage of leapfrog development. Specifically, during the period from 2014 to 2016, only five provinces in China, namely Shanghai, Jiangsu, Zhejiang, Shandong, and Guangdong, entered the advanced range; during the period from 2017 to 2021, Beijing, Fujian, Henan, Hunan, Sichuan and other places also moved from the low level to the advanced range. In Model 2, after crossing the threshold, the estimated coefficient of NQP rises from 0.342 to 0.415, indicating that the promoting effect of NQP is stronger in regions with a more mature development of the technology market. Therefore, it can be concluded that the transformation and upgrading of the technology market has a strengthening effect on the non-linear relationship between NQP and high-quality agricultural development. Thus, hypothesis H2 is confirmed.
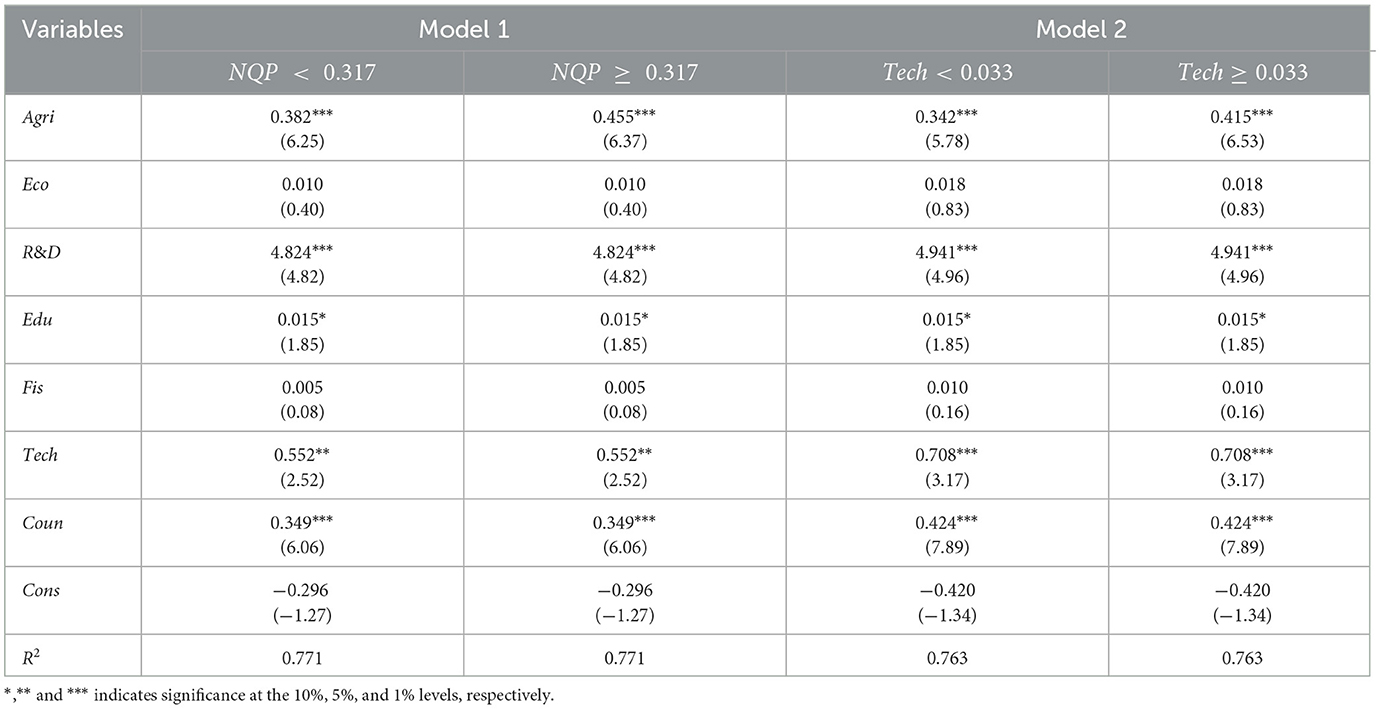
Table 10. Results of threshold model estimation.
5 Discussion
High-quality agricultural development is an important strategic choice for promoting the modernization of agriculture and rural areas. NQP, a novel form of productivity that relies on technological innovation to achieve the leapfrogging and upgrading of traditional productivity, is closely related to agricultural development to a certain extent. Current research on NQP mainly focuses on theoretical logic and indicator measurement, with little attention paid to its profound impacts, let alone its connection with the agricultural sector. As a new form of productive capacity, it provides innovative impetus for agricultural development. This paper systematically explores the mechanism through which NQP affects high-quality agricultural development and constructs a measurement framework for NQP from three dimensions: agricultural laborers, agricultural labor objects, and agricultural means of production. It also empirically tests its promoting effect on high-quality agricultural development. Some literatures have verified that NQP has a positive impact on the income and production efficiency of residents in the agricultural sector, and the results of this paper also confirm that NQP is of great practical significance to agricultural development. It provides important support for high-quality agricultural development. This requires the Chinese government to prioritize the allocation of financial and technological resources in the top-level design of agricultural development to foster the application of NQP in the agricultural sector, solving the dilemmas of traditional agricultural resource misallocation, low efficiency, and insufficient sustainability.
The threshold model further reveals the non-linear relationship between the two. Once NQP reaches a certain level of development, its impact on high-quality agricultural development significantly intensifies, and the upgrading and transformation of the technology market further strengthens this non-linear effect. The specific threshold levels identified in this paper provide a crucial reference point for policy formulation. When the level of NQP in a region falls below this threshold, it indicates that the foundational support capacity still needs to be consolidated. During this stage, policy focus should be placed on building foundational capabilities, such as strengthening the digital infrastructure for agriculture. The core objective is to systematically enhance the regional level of NQP, thereby enabling it to cross the threshold as soon as possible. Conversely, when the regional level of new-quality productivity reaches or exceeds the threshold, it signifies that the region has the potential foundation to support NQP in generating a stronger effect on high-quality agricultural development. At this stage, policy orientation should shift toward enhancing efficacy and optimizing the environment, as well as improving the regional innovation ecosystem. Moreover, the threshold analysis implies that even after NQP reaches the threshold, an efficient and vibrant technology market remains a necessary condition for maximizing its empowering effects. Therefore, it is essential to further refine the technology market system to provide a favorable market environment.
Theoretically, this paper links NQP with the agricultural sector, exploring the external effects of NQP in agriculture and delving into its potential value in promoting agricultural development. This work extends the existing literature on NQP. Additionally, the paper empirically examines the intrinsic relationship between NQP and high-quality agricultural development, further revealing the heterogeneous and non-linear characteristics of NQP's empowering effect on high-quality agricultural development, thereby deepening the research content. Practically, this paper provides clear policy focal points for achieving high-quality agricultural development. The government should develop NQP in a location-specific manner, optimize the allocation of factors such as agricultural labor objects and means of production, deepen digital and intelligent development, and form an innovation-driven high-quality growth model.
Due to limitations in data sources and statistical calibers, the sample of this paper only covers provincial-level data from 2012 to 2021. The research team will continue to monitor this field, expand the time span, and provide a more comprehensive assessment of the relationship between NQP and high-quality agricultural development. Moreover, the research team will explore the relationship between the two at various spatial scales, such as the municipal and county levels. In addition, this paper mainly focuses on the overall analysis. Future research will further deepen the analysis from the perspective of spatial spillover effects and clarify the complex associations between them.
6 Conclusions and suggestions
NQP, which is a leap in productivity brought about by the new round of technological revolution, provides a core driving force to correct the distortion of traditional agricultural resource allocation and solve the dilemma of high-quality agricultural development. Based on the panel data of 30 provinces in China from 2012 to 2021, this paper constructs an evaluation index system for NQP and high-quality agricultural development, and empirically analyzes the promoting effect of NQP on high-quality agricultural development, as well as the threshold effect between the two. The main findings can be summarized as follows: First, the dynamic evolution distribution curve of NQP shows a rightward shift, indicating an upward trend across the entire domain. Second, NQP has a significant promoting effect on high-quality agricultural development. Third, the impact of NQP on high-quality agricultural development has a non-linear characteristic of increasing marginal effect. Fourth, compared to the central and western regions, NQP exerts a stronger positive influence in the eastern region. Fifth, the empowering effect of NQP is greater in regions with a higher level of marketization.
Based on the above conclusions, the following policy recommendations are proposed: First, strengthen the deep integration of scientific and technological innovation with agriculture. Scientific and technological innovation is a key factor in promoting high-quality agricultural development. The government should establish special funds to support agricultural scientific and technological innovation projects, encourage research institutions to cooperate with agricultural enterprises to jointly develop new technologies and products that meet market demand. Moreover, a platform for the transformation of scientific and technological achievements should be established to promote the rapid conversion of research results into actual productive forces. In addition, through policy guidance and financial subsidies, agricultural enterprises should be motivated to introduce and apply advanced technologies to improve the intelligence and precision of agricultural production.
Second, establish a mechanism for inter-regional cooperation and symbiosis. In view of the heterogeneous impact of NQP, a regional coordinated development strategy should be implemented. The eastern region, with its strengths in capital and technology, should lead agriculture toward high value-added development. Meanwhile, the central and western regions can leverage the abundant natural resources and lower labor costs to develop characteristic agriculture and deep processing industries. Establishing an effective inter-regional cooperation mechanism will facilitate the leveraging of complementary strengths, leading to mutually beneficial development and, ultimately, fostering agriculture to high-quality development.
Third, improve the construction of digital infrastructure in rural areas. The government should boost investment in digital infrastructure in rural regions, expand the coverage of broadband networks as well as mobile Internet, and thereby provide a solid foundation for the growth of NQP. It is crucial to actively promote the application of modern information technologies across various aspects of agriculture such as production, operation, management, and service. This will enable intelligent monitoring and management of the agricultural production process.
Fourth, optimize the policy environment for scientific and technological innovation. Initially, a series of supportive policies should be enacted to provide policy support and financial funds for agricultural scientific and technological innovation, digital transformation, and talent training. These policies should include tax cuts, financial subsidies, preferential loans, etc., to cut the costs and risks for enterprises in agricultural innovation and development. Secondly, incentive mechanisms should be established and improved to encourage agricultural enterprises and individuals to participate in the cultivation of NQP through rewards and commendations. In addition, it is essential for government to strengthen macro-control and policy guidance for high-quality agricultural development. This involves ensuring the consistency and stability of relevant policies to establish a favorable policy environment that supports agricultural progress.
Data availability statement
The raw data supporting the conclusions of this article will be made available by the authors, without undue reservation.
Author contributions
SZ: Software, Methodology, Writing – original draft, Conceptualization, Formal analysis, Data curation, Resources. FX: Supervision, Investigation, Validation, Project administration, Writing – review & editing, Funding acquisition, Visualization.
Funding
The author(s) declare that financial support was received for the research and/or publication of this article. This work was supported by National Social Science Fund (23BJY171) and Liaoning Provincial Social Science Planning Fund (L23ZD061). This work was also supported by Humanities and Social Sciences Research Project of the Ministry of Education (20YJC790149), The Basic Scientific Research Project of Universities in Liaoning Province, Department of Education: “The Impact of Digital Finance on Agricultural Resilience under the Impact of Climate Change”, and The Liaoning Provincial Decision-Making Consultation and New Type of Think Tank Special Research Project: “A Study on Countermeasures for Further Promoting the Construction of a Support Area for Major National Strategies in Liaoning during the ‘15th Five-Year' Period”.
Conflict of interest
The authors declare that the research was conducted in the absence of any commercial or financial relationships that could be construed as a potential conflict of interest.
Generative AI statement
The author(s) declare that no Gen AI was used in the creation of this manuscript.
Publisher's note
All claims expressed in this article are solely those of the authors and do not necessarily represent those of their affiliated organizations, or those of the publisher, the editors and the reviewers. Any product that may be evaluated in this article, or claim that may be made by its manufacturer, is not guaranteed or endorsed by the publisher.
Supplementary material
The Supplementary Material for this article can be found online at: https://www.frontiersin.org/articles/10.3389/fsufs.2025.1601227/full#supplementary-material
References
Angrist, J. D., and Krueger, A. B. (1991). Does compulsory school attendance affect schooling and earning? Q. J. Econ. 106, 979–1014. doi: 10.2307/2937954
Dhoubhadel, S. P. (2021). Precision agriculture technologies and farm profitability. J. Agric. Resource Econ. 46, 256–268. doi: 10.22004/ag.econ.303598
Feng, N., Yan, M., and Yan, M. (2024). Spatiotemporal evolution and influencing factors of new-quality productivity. Sustainability 16:10852. doi: 10.3390/su162410852
Hansen, B.E. (1999). Threshold effects in non-dynamic panels: estimation, testing and inference. J. Econ. 93, 345–368. doi: 10.1016/S0304-4076(99)00025-1
Huang, J, Duan, X, Li, Y, and Guo, H. (2023). Spatial-temporal evolution and driving factors of green high-quality agriculture development in China. Front. Environ. Sci. 11:1320700. doi: 10.3389/fenvs.2023.1320700
Leng, G., Yang, J., Xing, J., and Sun, J. (2021). Opportunities, problems and countermeasures for high-quality agricultural development in China. China J. Agri. Resour. Reg. Plann. 42, 1–11.
Luo, W., Zuo, S., Tang, S., and Li, C. (2025). The formation of new quality productivity of agriculture under the perspectives of digitalization and innovation: a dynamic qualitative comparative analysis based on the “technology-organization-environment” framework. Sustainability 17:597. doi: 10.3390/su17020597
Mo, H., and Wang, S. (2021). The evolution of the spatiotemporal pattern of carbon emissions in counties along the Yellow River and the mechanism of spatial effect. Geo. Sci. 41, 1324–1335.
Peng, X. (2024). The formation logic, development path and key focus points of new-quality productivity. Econ. Rev. 3, 23–30. doi: 10.16528/j.cnki.22-1054/f.202403023
Rakholia, R., Tailor, J., Prajapati, M, Shah, M., and Saini, J. R. (2024). Emerging technology adoption for sustainable agriculture in india–a pilot study. J. Agric. Food Res. 17:101238. doi: 10.1016/j.jafr.2024.101238
Sanyaolu, M., and Sadowski, A. (2024). The role of precision agriculture technologies in enhancing sustainable agriculture. Sustainability 16:6668. doi: 10.3390/su16156668
Xia, X., Chen, Z., Zhang, H., and Zhao, M. J. (2019). High-quality agricultural development: digital empowerment and realization path. China Rural Econ. 12, 2–15.
Xu, H. (2024). New-quality productivity: scientific connotation, strategic considerations and theoretical contributions. Nanjing J. Social Sci. 3, 1–9. doi: 10.15937/j.cnki.issn1001-8263.2024.03.001
Xu, J., Zhu, X., and Chen, S. (2024). Research on the response mechanism and improvement path of new-quality productivity based on the “stimulus-organism-response (sor)” model. Sci. Tech. Mgt. Res. 44, 1–10.
Yang, N., and Wang, W. (2022). Construction and measurement of the evaluation index system for high-quality agricultural development. Statis. Decis. 38, 26–30. doi: 10.13546/j.cnki.tjyjc.2022.19.005
Yao, L., Li, A., and Yan, E. (2025). Research on digital infrastructure construction empowering new quality productivity. Sci. Rep. 15:6645. doi: 10.1038/s41598-025-90811-9
Ye, L. (2025). Digital economy and high-quality agricultural development. Int. Rev. Econ. Fin. 99:104208. doi: 10.1016/j.iref.2025.104028
Yi, E., Wang, J., and Zhu, J. (2023). Digital economy, resource allocation efficiency and high-quality agricultural development. Modern Fin. Econ. 43, 20–37. doi: 10.19559/j.cnki.12-1387.2023.12.002
Yue, X. (2024). The configuration path of digital transformation driving high-quality agricultural development. J. Harb. Inst. Tech. 153–160. doi: 10.16822/j.cnki.hitskb.2024.03.017
Zhang, Z. (2024). New-quality productivity empowers the construction of digital rural areas: transformation logic and implementation path. Acad. Exchan. 93–107.
Zhou, W., and Xu, L. (2023). On new-quality productivity: connotation, characteristics and key focus points. Reform 1–13.
Keywords: new quality productivity, high-quality agricultural development, fixed-effects model, threshold effect, technology market
Citation: Zhang S and Xie F (2025) Can new quality productivity promote high-quality agricultural development?—An empirical study based on provincial panel data in China. Front. Sustain. Food Syst. 9:1601227. doi: 10.3389/fsufs.2025.1601227
Received: 27 March 2025; Accepted: 30 June 2025;
Published: 23 July 2025.
Edited by:
Siphe Zantsi, Agricultural Research Council of South Africa (ARC-SA), South AfricaReviewed by:
Jiaran Li, Weifang University of Science and Technology, ChinaOlaitan Shemfe, Walter Sisulu University, South Africa
Copyright © 2025 Zhang and Xie. This is an open-access article distributed under the terms of the Creative Commons Attribution License (CC BY). The use, distribution or reproduction in other forums is permitted, provided the original author(s) and the copyright owner(s) are credited and that the original publication in this journal is cited, in accordance with accepted academic practice. No use, distribution or reproduction is permitted which does not comply with these terms.
*Correspondence: Fengjie Xie, Zmp4aWVAc3lhdS5lZHUuY24=