1School of Economics and Management, Shanghai Ocean University, Shanghai, China
2Shanghai Academy of Social Sciences, Shanghai, China
Introduction: As digital technologies advance rapidly, the digital transformation of fresh agricultural product supply chains has emerged as a critical strategy for increasing operational efficiency, reducing product waste, and maintaining constant supply. However, adoption barriers such as high costs and technical complexities highlight the crucial role of government subsidies in facilitating this transition.
Methods: This study develops an evolutionary game model to analyze interactions between suppliers and producers, incorporating: (1) government subsidies, (2) digital technology spillover effects, (3) input costs, (4) initial profit disparities, and (5) post-investment returns. The model quantifies how digital input costs affect supply chain members’ willingness to undertake digital transformation, along with the associated economic returns.
Results: Key findings demonstrate: (1) Market autonomy fails when digital costs exceed private returns, especially under high spillover effects. (2) Government subsidies effectively boost digital adoption willingness when subsidies surpass a critical threshold. (3) Higher subsidy levels and initial adoption rates accelerate supply chain transformation.
Discussion: The results demonstrate that government subsidies efficiently encourage the digital transformation of fresh agricultural supply chains. This research advances the theoretical understanding of digital transformation in agricultural supply chains and provides policymakers with decision-making tools for optimizing digital subsidy schemes in sustainable food systems.
1 Introduction
Our population’s everyday routines rely heavily on fresh agricultural supplies. Ensuring that its supply chain runs smoothly and consistently is critical to China’s agricultural sector’s long-term success. However, the fresh agricultural product supply chain is confronting issues such as difficult-to-trace production information, a high circulation loss rate, and weak production and marketing channels, which will affect the protection of people’s fundamental living necessities (Qi and Zhao, 2023; Zhao et al., 2025; Halder et al., 2025). Using digital innovations can achieve accurate production and marketing, efficient transportation, and a seamless flow of data throughout the supply chain stages, thus boosting the supply chain’s resilience against various risks and guaranteeing a consistent supply of agricultural produce. In current practice, some enterprises have already achieved remarkable results. For instance, Wen’s shares has introduced intelligent equipment like automatic feeding systems and environmental monitoring systems in farming production. These systems optimize the farming process and enhance production efficiency. JD.com has improved supply chain transparency by introducing blockchain technology to trace the source of fresh products and has also established an efficient cold-chain logistics system, which improves user trust. However, despite the tremendous potential of digital technology in the fresh produce business, there are several technological constraints and practical barriers to their wider adoption (Tan et al., 2023; Pun et al., 2021; Wu and Pu, 2024). In addition to the high investment costs associated with the acquisition of digitization equipment and the construction of cold chains, SMEs are frequently confronted with issues such as a lack of capital and insufficient technology, both of which are significant impediments to the advancement of digitization by fresh produce supply chain node enterprises. In this scenario, government subsidies have proven to be an effective approach of resolving the dilemma. Through a certain amount of subsidies, the government can not only effectively reduce the digital input costs of Agri-food chain stakeholders, assist enterprises in accelerating their digital transformation, and send positive signals to the market, attracting more social resources for the digital construction of agricultural product supply chains. In the long term, this initiative holds profound strategic importance. It can boost the overall competitiveness of China’s agriculture, protect national food security, and help achieve the goal of rural revitalization. For the government, taking this step is essential for fulfilling public functions and driving sustainable economic and social development. Therefore, studying how government subsidies affect digital input decisions in fresh produce supply chains is not only of great theoretical significance but also provides a decision-making reference for policy formulation.
Currently, research on supply chains for fresh produce involves many aspects, of which those related to the topic of this study are primarily focused on the ensuing sections: First, the application and effect of digital technology within the fresh agricultural product supply chain, such as blockchain, big data, Internet of Things (IoT), have been widely studied in boosting the efficiency and transparency of the supply chain and reducing losses (Zhang et al., 2025; Qi et al., 2023; Zhao and Li, 2023; Huo and Zhong, 2023; Zheng et al., 2023; Hao et al., 2022; Xiong et al., 2020; van Hilten et al., 2020). However, Pun et al. (2021), Wu and Pu (2024), and Moktadir et al. (2019) noted that, while these digital technologies offer considerable benefits, their applications confront numerous problems, including a lack of facilities and high investment costs. The second part focuses on pricing strategies and coordination mechanisms in the fresh agricultural product supply chain. Its study focuses on how to optimize pricing decisions by boosting freshness, and building fair supply chain contracts to accomplish member coordination (Zhao and Cheng, 2024). For example, Zhao and Li (2023), Liu et al. (2021), and Wang (2015) quantified freshness using time decay and circulation loss, and evaluated the best pricing strategy when freshness decays with time. In addition, scholars have proposed a variety of contractual models for supply chain coordination, mainly “benefit-sharing + cost-sharing” contracts (e.g., Xing et al., 2025; Xi et al., 2025; Zhao et al., 2021; Cao and Qin, 2024; Chiang, 2010), option contracts (e.g., Zhao and Cheng, 2024; Tang et al., 2019; Cachon, 2003), hybrid contracts (e.g., Shi, 2020; Cao et al., 2021) and so on. The third disscusses the implication of government subsidies on the fresh food supply chain. Su and Zheng (2024) investigated the implications of government subsidies on the optimal decision-making of actors of the fresh food supply chain and consumer surplus; Li et al. (2025) and Wen et al. (2021) developed a three-phase game-theoretic model to assess and compare the effects of different governmental subsidy strategies on determining the optimal subsidy rate, purchase price and production input. Furthermore, Huo and Zhong (2023), Sun et al. (2022), and Chen et al. (2021) investigated the impact of government subsidies on the digital transformation of supply chain members and discovered that government subsidies up to a certain amount can effectively encourage enterprises to make digital investments. Liu et al. (2023) and Wang et al. (2025) use the free-rider effect to explore the implications of government subsidies on supply chain enterprises undergoing digital transformation.
In conclusion, earlier studies have achieved great progress in fresh produce supply chains and the digital transformation of supply chain members through government subsidies, laying a solid framework for the research provided in this study. Compared to previous research endeavors, the key contributions of this study can be described as follows: First, most earlier research primarily looked at government subsidies, ignoring the implications of technological spillover effects on supply chain members’ willingness to participate in digitalization. Second, the firms’ initial advantages and the implications of digital input costs on the digital inputs of supply chain firms have been added to better measure the digital transformation of supply chain firms.
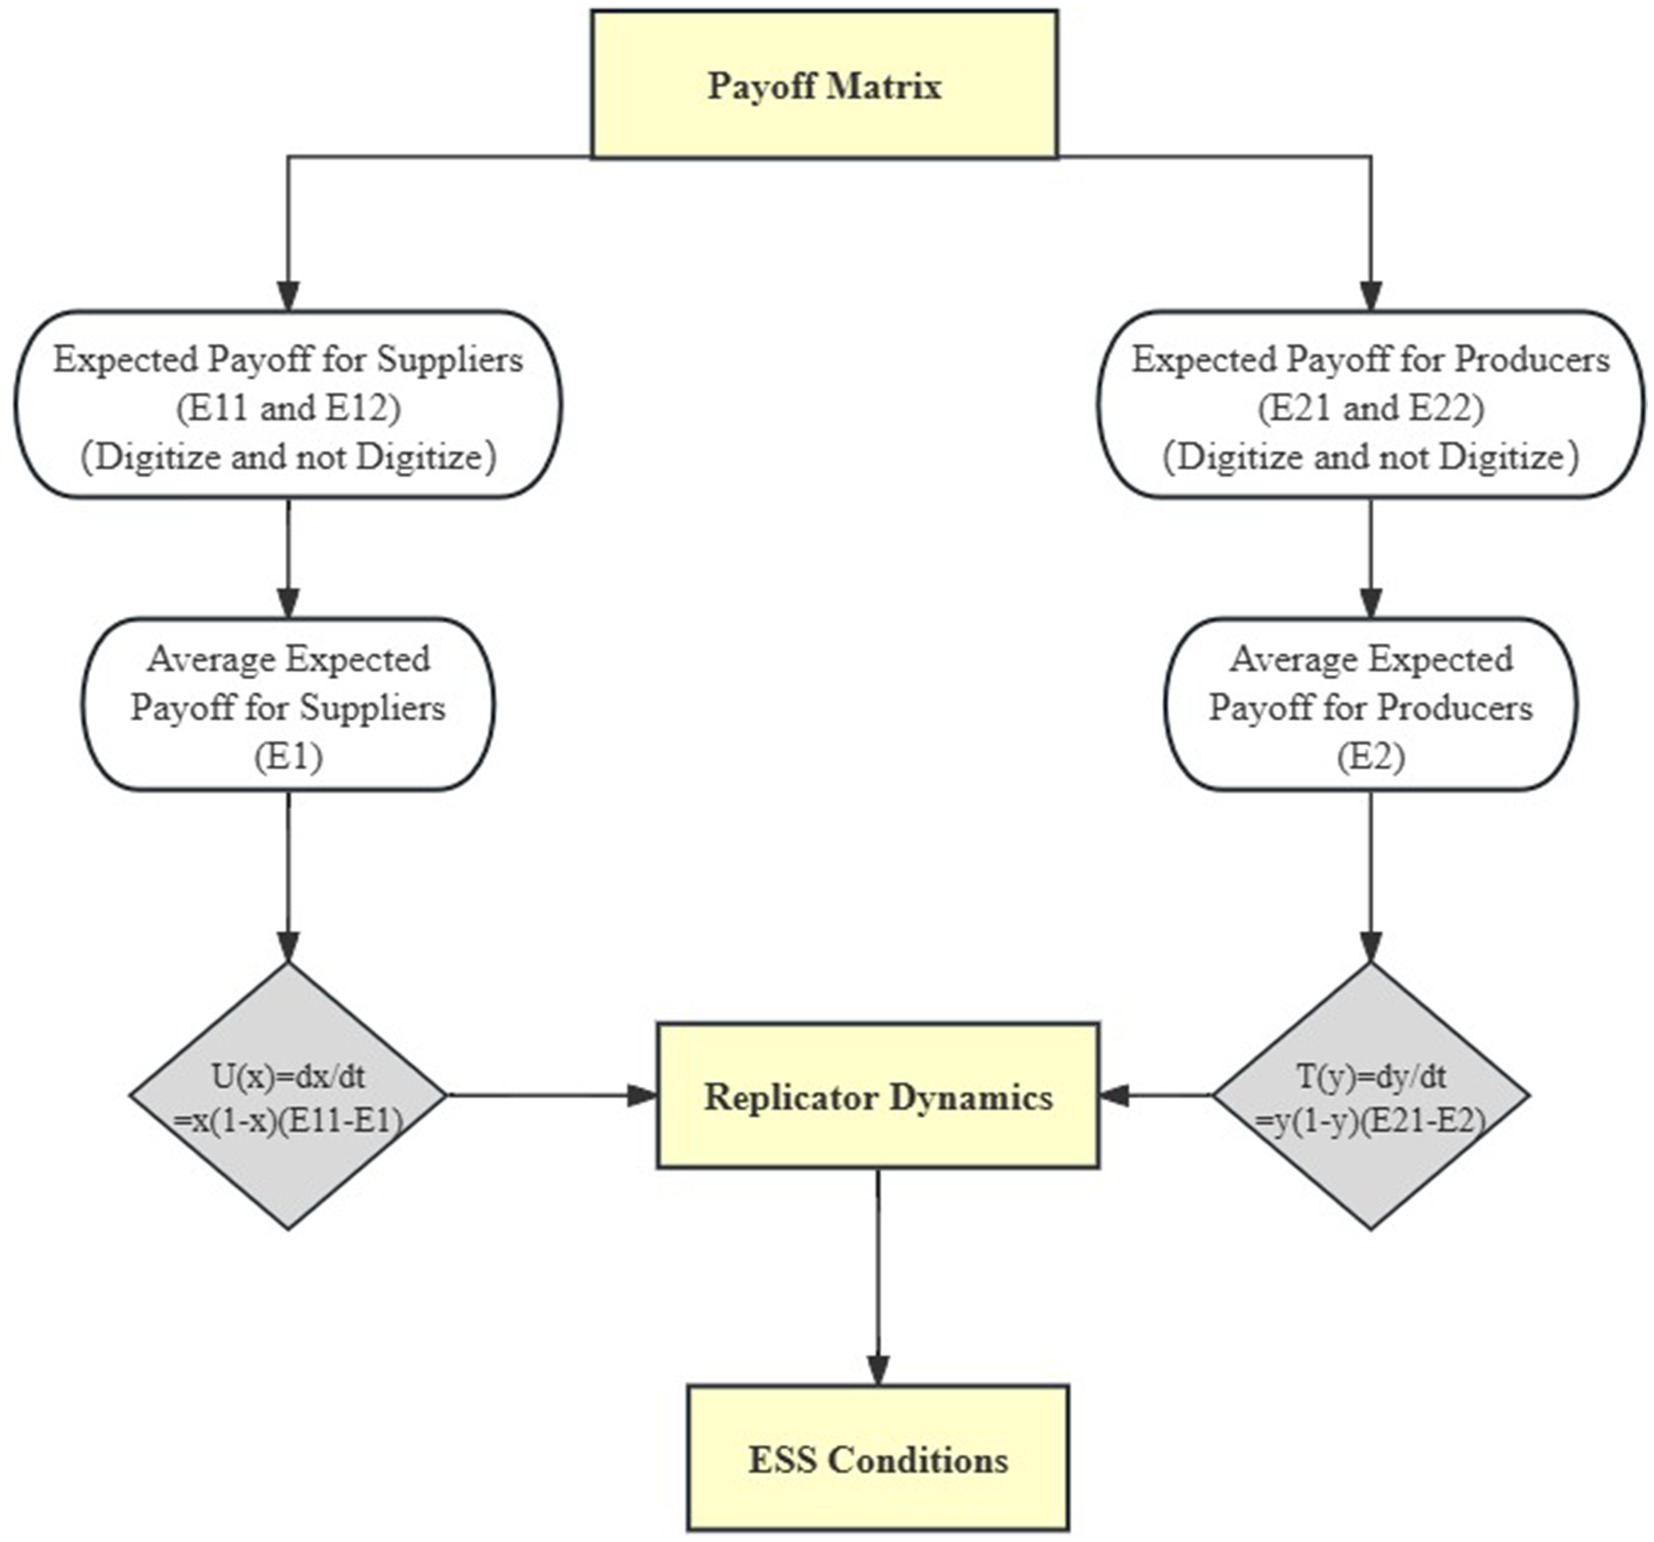
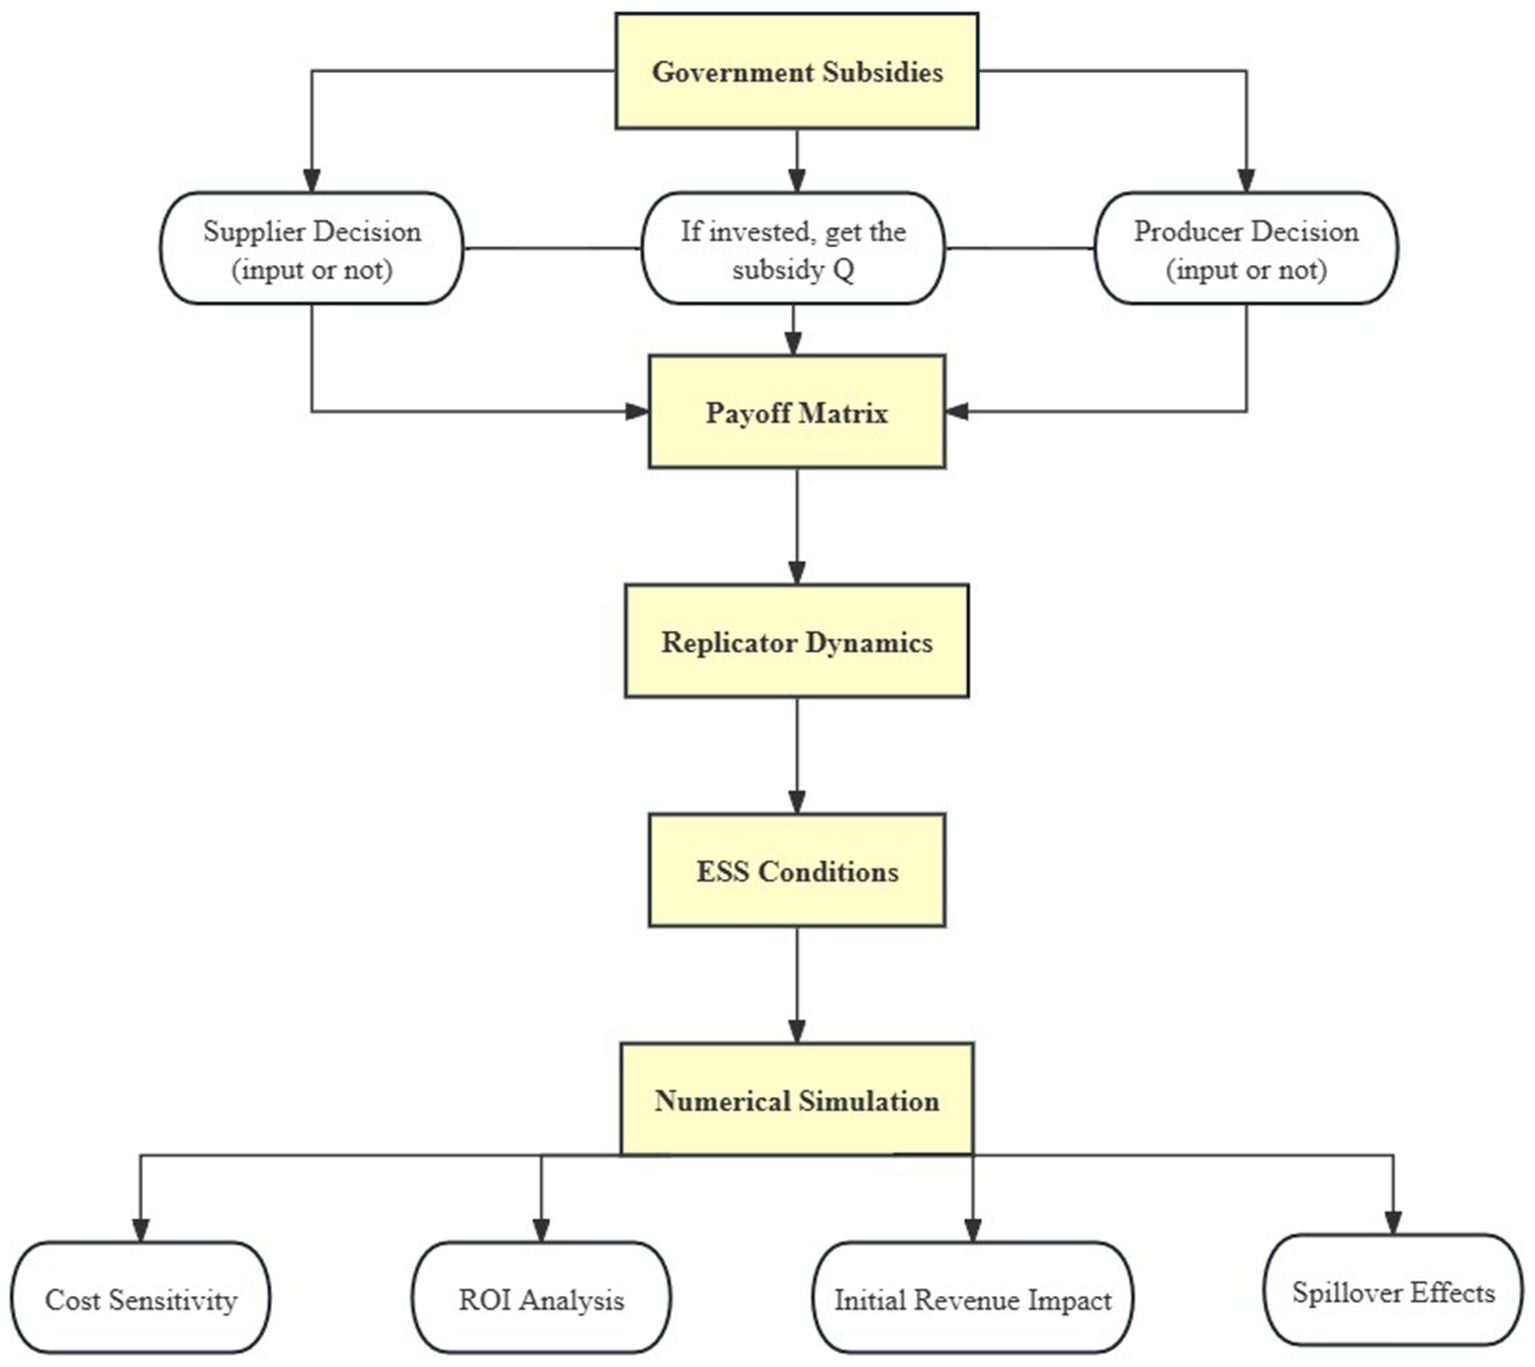
Therefore, this article will combine aspects such as the technology spillover effect, digital input cost, initial revenue, and rate of revenue growth to create a decision-making model for digital inputs in the fresh produce supply chain under government subsidies. As illustrated in Figure 1, the research follows a four-phase technical pathway:
(1) Establishing evolutionary game framework;
(2) Analyzing stability conditions across 5 market scenarios;
(3) Quantifying subsidy threshold Q0;
(4) Validating subsidy policies through numerical simulation experiments (see Section 5).
Figure 1
Figure 1. Technical roadmap.
This work contributes to the research framework of fresh produce supply chain management and digital transformation, provides theoretical references for businesses to maximize digital input decisions, and provides a theoretical foundation for governments to develop subsidy policies.
2 Materials and methods
2.1 Theoretical basis
Evolutionary game theory is an extension of classical game theory that is based on Darwin’s concepts of biological evolution (Zhang, 2004). It explains how individuals in an adaptive environment reach evolutionarily stable strategy states through repetitive interactions that involve selecting and changing their strategies. This theory highlights the dynamic process by which individuals achieve stable evolutionary equilibrium through ongoing strategic choices and adaptive adjustments. The Evolutionarily Stable Strategy (ESS) is central to this theory, which was first introduced by Smith and Price (1973) to examine animal behavior in game-theoretic contexts (Nowak and Sigmund, 1993). Since then, the theory has evolved into the social sciences, providing insights into how individuals choose optimal solutions amid conflicts of interest and cooperation in economics. Since then, the theory has spread to the social sciences, providing insights into how individuals choose optimal tactics amidst conflicts of interest and cooperation in economics, sociology, and political science. Unlike classical game theory, which assumes static equilibrium, evolutionary game theory includes temporal dynamics and state transitions, emphasizing the importance of time-dependent processes and strategic adaptation in molding outcomes (Axelrod, 1984).
The key components of evolutionary game theory are: (1) Evolutionarily Stable Strategy (ESS): Smith and Price (1973) proposed this idea, which explains strategies that, once chosen by a population, are resistant to invasion by competing strategies. Within the theoretical framework, individuals choose from a variety of tactics (e.g., cooperation, defection) and alter their behavior in response to observable outcomes. An ESS assures that any deviation from the dominant strategy results in a fitness disadvantage, which contributes to its long-term stability. (2) Replicator Dynamics: This mathematical tool simulates how players adapt their strategies through imitation, replication, and learning during repeated interactions, eventually leading to an ESS. It depicts the dynamic shift in strategy adoption over time and shows the path to equilibrium.
Taylor and Jonker (1978) established mathematically that replicator dynamics represent the difference between the average payoff and the payoff of a chosen strategy, weighted by the probability of adoption.
In this work, we use evolutionary game theory to look at the strategic actions of suppliers and producers in the fresh agricultural product supply chain. We use simulation to investigate how these decisions influence market dynamics and stakeholder benefits. Using this approach, we want to forecast and analyze decision-making patterns in a turbulent market environment, as well as develop solutions to improve the supply chain’s digital transformation and operational efficiency.
2.2 Research hypotheses
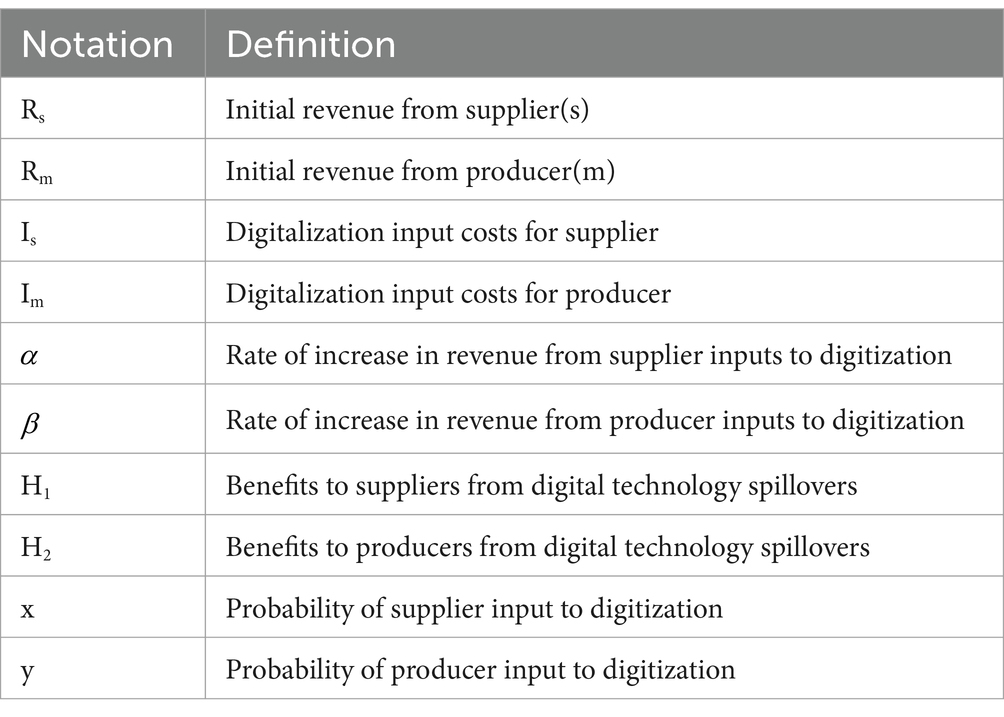
This study takes into account a two-echelon supply chain structure, comprising an upstream supplier(s) and a downstream producer(m), with the former being a corporate provider of fresh raw materials, and the latter being a corporate provider of fresh products after a series of reprocessing, production, packaging, etc., of the fresh products. Both parties have finite rationality and both make corresponding supply chain digitization input decisions in order to maximize their profits. The set of action strategies is (digitize, not digitize), denoted as (Y, N) (Sandholm, 2010; Smith and Price, 1973; Kouhizadeh et al., 2021). Supply chain digital inputs are behavioral decisions made by supply chain enterprises in relation to digital technology used in the design, development, manufacture, processing, and shipping of fresh produce. For example, suppliers can introduce emerging digital technologies such as the Internet of Things, drones, robots, etc. into the planting and breeding process of raw materials for fresh agricultural products to improve crop survival rates, production efficiency, and reduce labor and other production costs; producers can introduce digital technologies such as cloud computing, edge computing, and blockchain to enhance traceability and ensure the quality and safety of agricultural products (Qi and Zhao, 2023; Tang, 2022). Table 1 displays the model variable parameters’ symbols and descriptions.
Table 1
Table 1. Explanations of the notations.
The underlying assumptions are as follows:
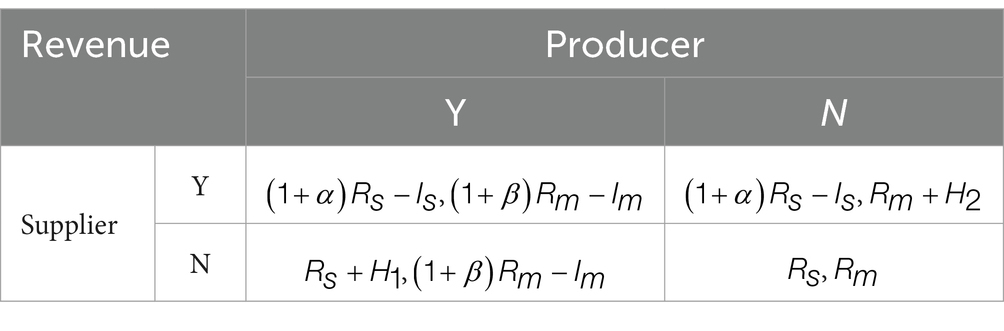
Hypothesis 1: When neither the fresh food suppliers nor the producers make digitalization inputs, then they receive initial (normal) returns of Rs, Rm, where Rs > 0, Rm > 0.
Hypothesis 2: When suppliers and producers choose to invest digital technologies across production stages, they can improve crop yield, quality, and freshness, reduce labor costs, and meet market demand more effectively—ultimately stimulating new demand. As a result, suppliers and producers will receive additional benefits and for having made digital technology investments, while they need to pay the corresponding input costs Is, Im. Among them, are the input cost–benefit increase rate of suppliers and producers (Weibull, 1995; Huo and Zhong, 2023).
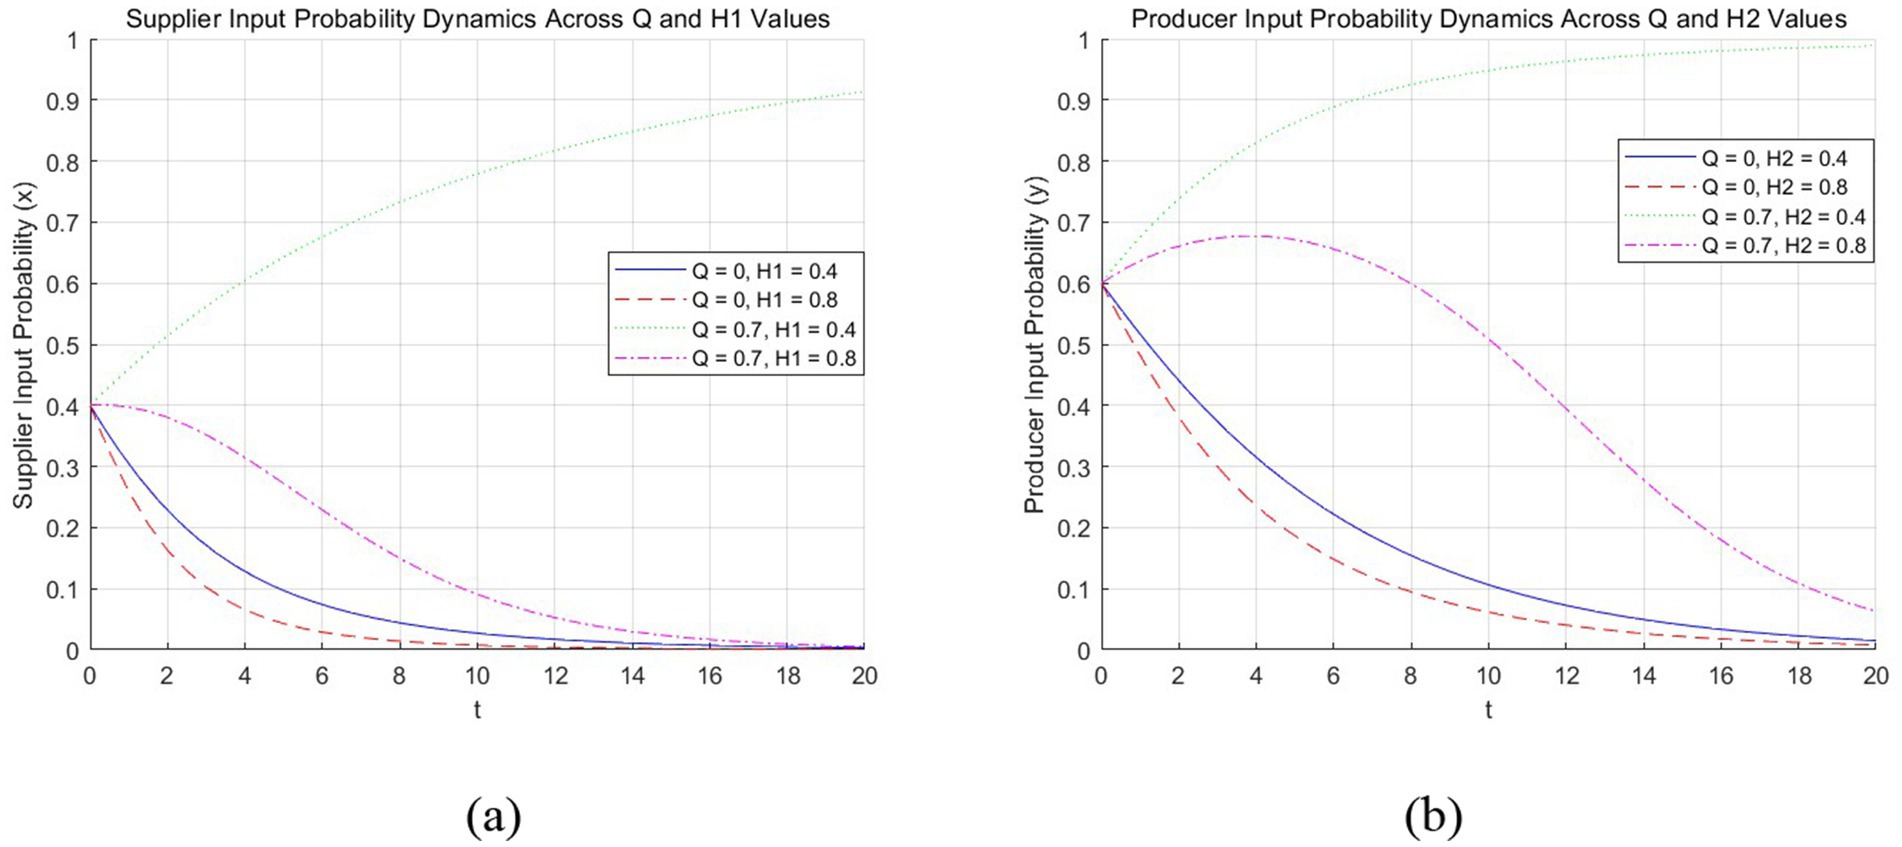
Hypothesis 3: When suppliers invest in digital technologies but producers do not, the quality of fresh agricultural products improves. This is because suppliers’ use of digital technology enhances product quality. Even if producers have not adopted digital technology themselves, once these high—quality fresh agricultural products enter their production chains, producers can still make higher—quality end products thanks to the improved raw materials. As a result, the products become more competitive in the market, and their sales volume increases. So, when only suppliers choose to make digital inputs, producers can gain an additional revenue, denoted as H2, due to the spillover effects of digital technology (Rogers, 2003; Rai et al., 2006; Weibull, 1995; Wang et al., 2025). Similarly, when producers invest in digitalization while suppliers do not, producers leverage digital technology to revamp their product quality control systems and execute targeted marketing strategies. This approach elevates the brand image and visibility of fresh agricultural products, subsequently driving up the sales volume of producers’ goods. Consequently, the demand for raw materials procured from suppliers also rises. Hence, the supplier also receives a portion of the additional revenue H1. The spillover effects (H1/H2) are contingent on minimal cooperation (e.g., basic compatibility and no active withholding). If these conditions fail (effectively H1 = 0 or H2 = 0), the model reduces to independent investment decisions, as implied by our sensitivity analysis (Section 5.5, Figure 2).
Figure 2
Figure 2. The influence of Hi on digitalization willingness. Trends are consistent; combined for analysis. (a) The effect of H1 on suppliers’ digitalization willingness under different subsidy levels; (b) The effect of H2 on producers’ digitalization willingness under different subsidy levels.
It should be noted that all the parameters defined above, including Rs, Rm, Is, Im, and other relevant variables, are presented as dimensionless ratios in our model. This approach is adopted to simplify the model structure and eliminate the influence of different measurement units. By using dimensionless ratios, we can focus more on the relative relationships and interactions between variables, making the model more generalizable and less dependent on specific physical units. This not only aligns with common practices in theoretical modeling and evolutionary game theory but also facilitates a more straightforward analysis of the strategic decision-making process of suppliers and producers in the context of digital transformation (Weibull, 1995; Sandholm, 2010).
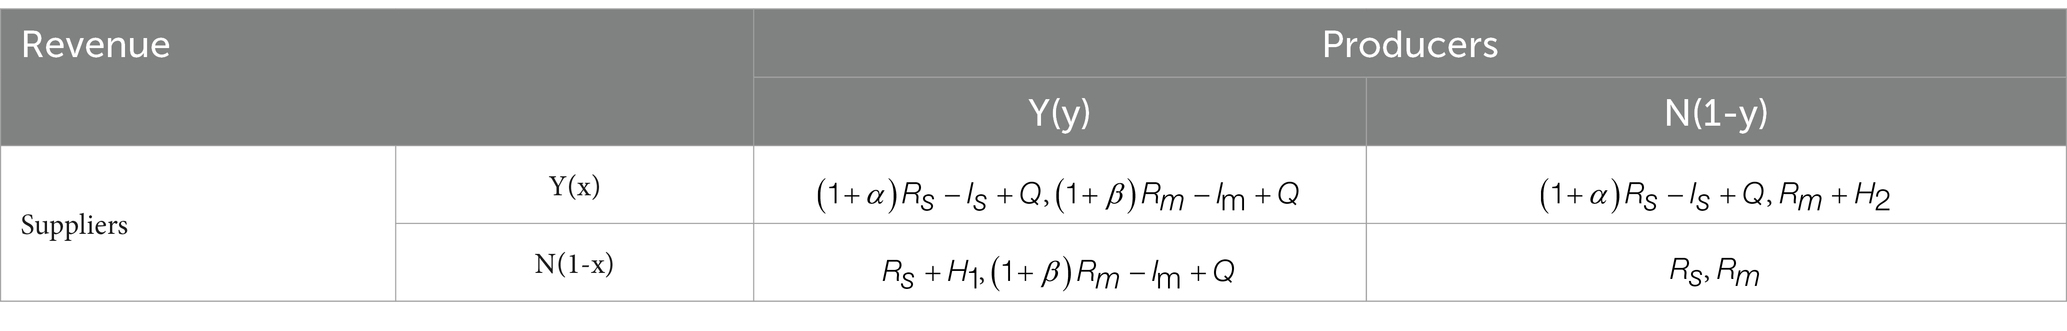
Based on the aforementioned assumptions, there exist four strategy scenarios NN, YN, NY, and YY for suppliers and producers to make digital input decisions, and the payment matrices of the two sides of the game are thus established, as presented in Table 2.
Table 2
Table 2. Revenue payment matrix for suppliers and producers.
3 Basic model and analysis of results
3.1 Analysis of digital input decision model for fresh produce supply chain
3.1.1 Equilibrium analysis
Assume the supplier chooses to digitize with probability x and not with probability 1-x, but the producer digitizes with probability y and not with probability 1-y. Profit functions are used to quantify the expected payoff from digitalization decisions in the replicator dynamics equation.
The estimated payback for suppliers that choose the digitization strategy is:
The estimated payback for suppliers who select the non-digitalization option is:
The supplier’s average projected payoffs are:
Based on the Malthusian equation (Huo and Zhong, 2023), the rate at which fresh product suppliers choose to pursue a digital input strategy is equal to E11 minus E1, where t denotes time and the supplier’s replication dynamic equation is:
Similarly, the equation for the producers’ replication dynamics is:
The system dynamics are obtained through the synthesis of Eq. U(x) and Eq. T(y):
The derivation flow of dynamic equations can be replicated through the logical process shown in Figure 3:
Figure 3
Figure 3. Replicating the logical flow of the derivation of dynamic equations.
Building on the framework in Figure 3, the dynamical system admits five equilibria when U(x) = 0 and T(y) = 0, specifically (0,0), (0,1), (1,0), (1,1), (x*,y*). Among them, ,.
To facilitate the following analysis, let , , , .
3.1.2 Stability analysis
Given that the equilibrium point generated from the replicator dynamics equations may not be inherently stable, the stability of the evolutionary equilibrium can be established by performing a local stability analysis with the Jacobian matrix. This matrix is formed by computing the partial derivatives of U(x) for x and T(y) for y, respectively:
Among them: , , , .
Provided that the subsequent conditions hold:
(1) (trace, denoted as tr J);
(2) (Jacobi determinant condition, denoted as detJ).
The equilibrium point of the reproduced dynamic equations is thus locally stable, indicating the evolutionary stabilization strategy (ESS).
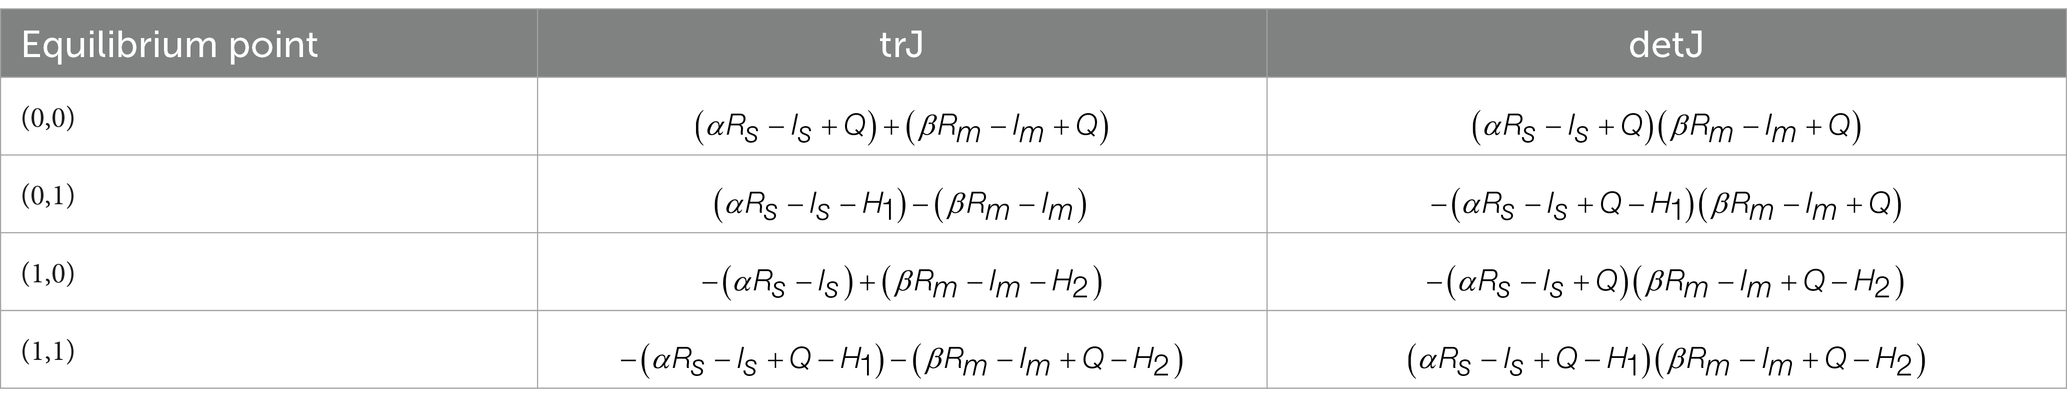
Substituting the equilibrium point (1,1) into the determinant of the Jacobi matrix and the trace yields:
;
.
So when trJ < 0 as well as det J > 0, i.e., and (i.e., ), (1,1) is the evolutionary stable point. Similarly, the values of determinant and trace for the other four equilibrium points can be obtained.
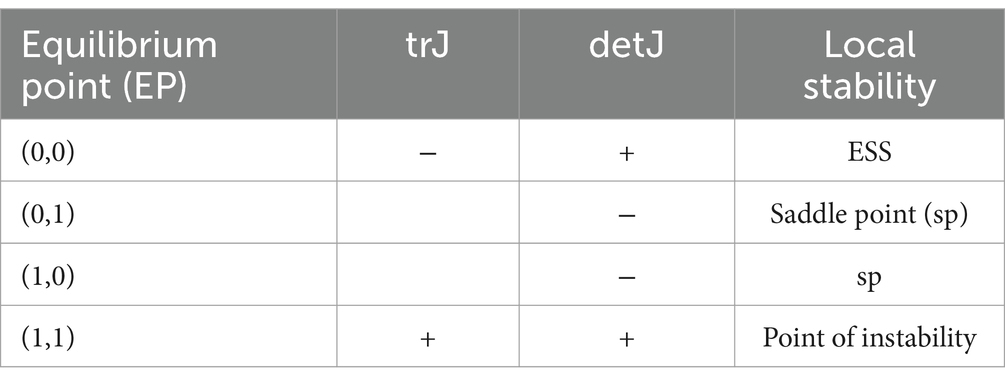
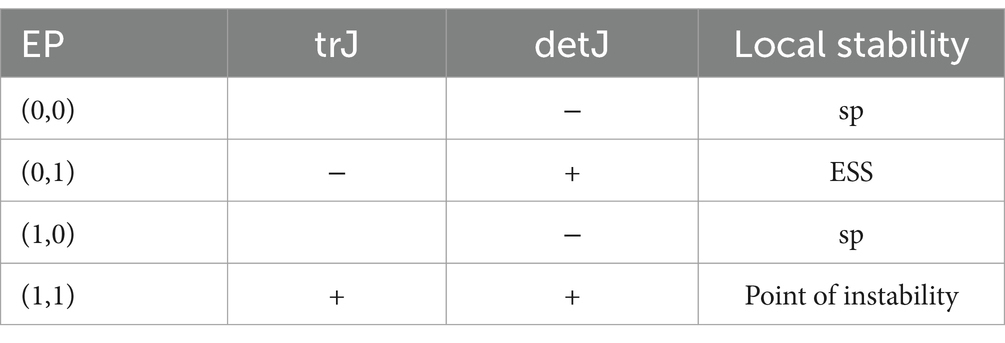
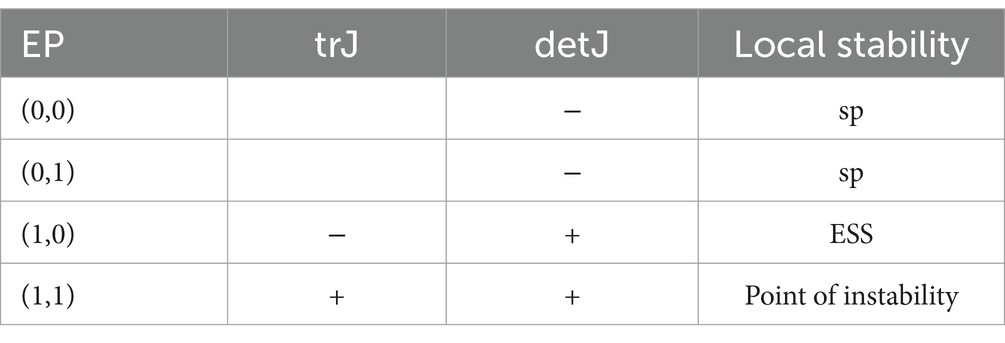
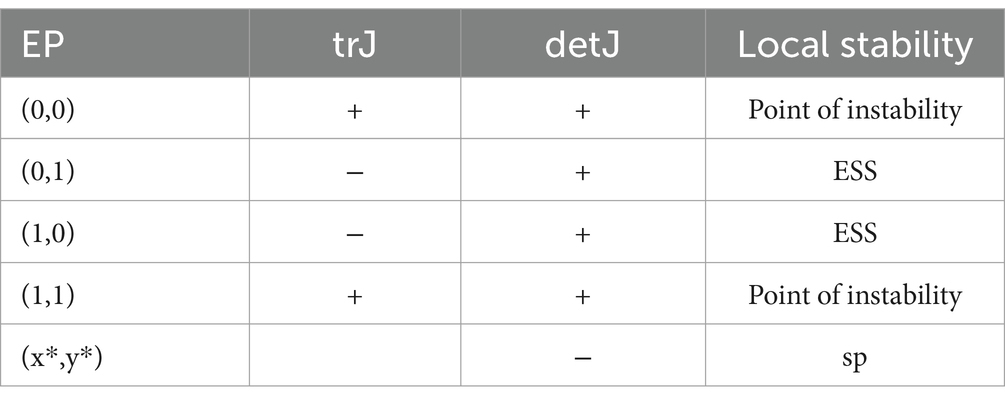
The local stability of four equilibrium points under different constraints can be analyzed based on the value of the determinant and trace of the Jacobi matrix at each equilibrium point, leading to an evolutionary stability analysis of digital decision-making in the fresh produce supply chain, as shown in Tables 3–7.
Table 3
Table 3. Local stability of equilibrium points for case (1).
Table 4
Table 4. For case (2).
Table 5
Table 5. For case (3).
Table 6
Table 6. For case (4).
Table 7
Table 7. For case (5).
Note that the trace of (x*,y*) is 0, indicating that it is not an equilibrium point and will not be further investigated.
Upon examining the above table, it becomes evident that the evolutionary stabilization point fluctuates depending on the value ranges of and . The detailed analysis is as follows:
Theorem 1. When the range of values of α and β changes, the system will show different evolutionary stabilization strategies:
(1) When , the evolutionary stabilization strategy (ESS) is (N,N);
(2) When , ESS is (N,Y);
(3) When , ESS is (Y,N);
(4) When , ESS is (N,Y) and (Y,N);
(5) When , ESS is (Y,Y).
3.2 Analysis of evolution results
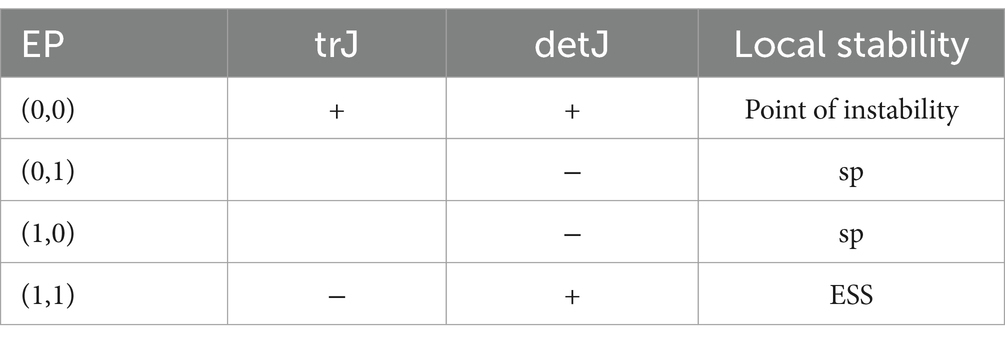
Based on the foregoing study, Figure 4 depicts the evolutionary game process and phase diagrams of suppliers and producers under various circumstances. Thus, the following analytical results can be derived:
Figure 4
Figure 4. Evolutionary dynamic phase diagrams under different scenarios. (A) Phase diagram of evolutionary dynamics under scenario 1 (0 < α < α1, 0 < β < β1); (B) Phase diagram of evolutionary dynamics under scenario 2 (0 < α < α1, β1 < β < β2); (C) Phase diagram of the evolutionary dynamics under scenario 3 (α1 < α < α2, 0 < β < β1); (D) Phase diagram of the evolutionary dynamics under scenario 4 (α1 < α < α2, β1 < β < β2); (E) Phase diagram of the evolutionary dynamics under scenario 5 (α > α2, β > β2).
Based on the above analysis, the evolutionary game process and phase diagrams of suppliers and producers under various scenarios are obtained, as shown in Figure 4. Therefore, the following analytical results can be derived:
(1) When the supply chain digitization input cost conversion rate is small, i.e., , the amount of benefit obtained from digitization inputs by both suppliers and producers is small, but they pay higher input costs, as shown in Figure 4A. At this time it is optimal for both parties not to make digitization inputs. In the realm of fresh food, producers with a late start, modest scale, and low brand awareness have a long payback period on digital input. Its upstream developing suppliers are similarly underperforming, with high product costs and limited distribution channels. As a result of their poor input–output ratio, such producers opt not to input digitally, and suppliers are equally unmotivated to do so due to their weak foundation and trouble getting economies of scale.
In these case studies, the scale effect and brand effect are mainly employed to help readers understand the mapping relationship of the α/β parameters in real-world scenarios. The fact that they are analyzed qualitatively does not undermine the general applicability of the model (the same applies to the subsequent relevant content).
(2) When the cost-of-input ratio of a producer’s digitization input increases to a certain level (), the producer’s revenue increase exceeds the cost of digitization, but less than the revenue generated by the spillover of digitization technology (). At this point, the producer can choose not to digitize to obtain a greater benefit. However, if the revenue increase rate obtained by digital input is still maintained at a low level (), suppliers will also not carry out digital input, and the producer will not ‘enjoy ‘the benefits of digital technology spillovers H2, as shown in Figure 4B, at this time, producers only choose to carry out digital input, and the benefits can be optimized. When fresh food producers reach a certain scale and achieve high brand awareness, they can improve quality standards through digital technology. This leads to significant revenue growth, resulting in a high digital input–output ratio, which in turn increases producers’ willingness to invest in digital transformation. Conversely, emerging suppliers with uncompetitive product prices, limited distribution channels, and weak branding find it difficult to see tangible results from their investments, and consequently lack motivation to invest in digitalization.
(3) Similarly, it is clear that when the supplier’s revenue increase rate rises to a certain point (), the revenue acquired by the supplier’s digital input is significantly greater than the input cost it pays, but it is still less than the revenue H1 obtained by the digital spillover. Under these conditions, if maintains unaltered (), the producer will refrain from investing in digitization, resulting in no digital technology spillover. Thus, suppliers may only optimize their gains by investing in digital technology, as shown in Figure 4C. Similarly, when a fresh food supplier has a certain scale and a strong brand influence, it can improve its product competitiveness and market share through digital transformation, increasing the supplier’s willingness to invest. Emerging producers with poor customer awareness and market demand have a low conversion rate of their input costs, resulting in a low willingness to invest in digitalization.
(4) If the rate of profit increase resulting from both the supplier and the producer investing in digitalization is relatively high, i.e., , the benefits obtained by both parties at this point far exceed their input costs. However, these benefits are still less than the gains H1 and H2 derived from the technological spillover obtained from the other party, as shown in Figure 4D. Here, (1,0) and (0,1) are the evolutionary stable points, indicating that the strategy of only one party investing in digitalization is the evolutionarily stable strategy. When the fresh suppliers and producers have a certain scale and brand influence, several positive relationships occur. Producers have high brand trust in upstream suppliers. Meanwhile, consumers have high trust in producers, which leads to consumers having a strong purchase intention. At this time, the input–output ratio of both sides is improved. However, in this situation, both parties may have the motivation to ‘free ride ‘due to concerns about digital input costs. The idea is that either party believes that as long as the other party invests in digitization, it can benefit. When the income from “free riding” is much greater than the income brought by its digital investment, a party will choose “free ride”.
(5) When and reach a certain level (), the benefits obtained by the supplier and producer from inputting costs into digitalization not only exceed their input costs but are also significantly greater than the gains H1 and H2 derived from the other party’s technological spillover. As illustrated in Figure 4E, (1,1) is the evolutionary stable point, showing that the benefits of digitalization can only be maximized if both the supplier and the producer invest in it. In the fresh produce business, for suppliers and manufacturers with strong brand recognition and market share, advanced manufacturing equipment, mature management models, and high consumer loyalty, investing in digitalization can dramatically improve operational efficiency. This leads in a far higher input–output ratio than the benefits derived via “free-riding.” As a result, the evolutionary equilibrium condition is realized when both fresh product suppliers and producers invest in digitization.
4 Analysis of digital input decision models in fresh agri-food supply chains under government subsidies
To systematically analyze the impact of subsidy policies on digital adoption, we first establish a tripartite game-theoretic framework (Figure 5).
Figure 5
Figure 5. Game-theoretic framework of subsidy-driven digitalization.
According to the above analysis, when the rate of profit increase from digital input by fresh agricultural product supply chain node enterprises is relatively low (Scenario 1), or when the benefits gained by member enterprises from digital technology spillover outweigh the benefits of their digital input (Scenario 4), supply chain enterprises will choose not to participate in digitalization. In these situations, government subsidy mechanisms are required to encourage the digital progress of the fresh agricultural product supply chain by balancing the costs of digital input for businesses. Assuming a government subsidy of Q, Table 8 shows the revenue payment matrix for suppliers and manufacturers at this point.
Table 8
Table 8. Matrix of supplier-producer revenue payments under government subsidies.
At this point, the Malthusian equation for the system is:
The above system’s equilibrium points are (0,0), (0,1), (1,0), and (1,1). (x,y) is also an equilibrium point of the system if and only if the following inequalities apply:
Among them, , .
Theorem 2. The necessary and sufficient condition for (1,1) to be the unique ESS of the above system is: .
Proof of theorem 2. From Table 9, the necessary and sufficient condition for (1,1) to be the unique ESS of the above system is: trJ < 0 and detJ>0, that is:
Table 9
Table 9. Analysis of equilibrium points for system (7).
, .
This leads to the conclusion that and , therefore (9) holds. As a result, (0,0) is an unstable point of the system, (0,1) and (1,0) are saddle points, and (1,1) is the only ESS. This concludes the proof.
When Q meets the parameters listed above, the evolution phase dynamic diagram of the aforesaid system resembles the shape of Figure 4E. This implies that when , neither the supplier nor the producer are willing to make digital inputs, because the cost of the inputs is significantly greater than the additional advantages of the digital inputs. To effectively incentivize suppliers and producers to actively participate in digital technology, the government needs to adopt precise and effective measures. Specifically, the government should provide substantial cost subsidies to node firms in the fresh agricultural product supply chain that invest in digital technology. The subsidy amount must ensure that the benefits received by suppliers or producers from the other party’s digital technology spillover are much less than the benefits obtained from their own digital investments. Only in this manner will government subsidies actually accomplish their intended effect, successfully motivating suppliers and producers to commit to digital input, and therefore promoting the digital transformation of the fresh agricultural product supply chain.
5 Numerical simulation and discussion of results
This research uses numerical simulations in MATLAB to investigate the implications of government subsidies on the evolutionary trends of digital input decisions made by suppliers and producers. Under the conditions of equilibrium decision-making and model assumptions for supply chain digitalization, and referencing historical parameter assignments in fresh agricultural product supply chain systems (Tang et al., 2023; Bai and Jia, 2024), the model parameters are set as . The starting input probabilities are x(0) = 0.4 and y(0) = 0.6. Furthermore, according to the preceding study results, the minimum value of government subsidies is Q0 = 0.6.
5.1 Analysis of government subsidies on digital input willingness among suppliers and producers
When studying the impact of government subsidies on the willingness of suppliers and producers to digitally invest, the numerical simulation results can help to intuitively understand the relationship between the two.
Firstly, the stability of the equilibrium is verified.
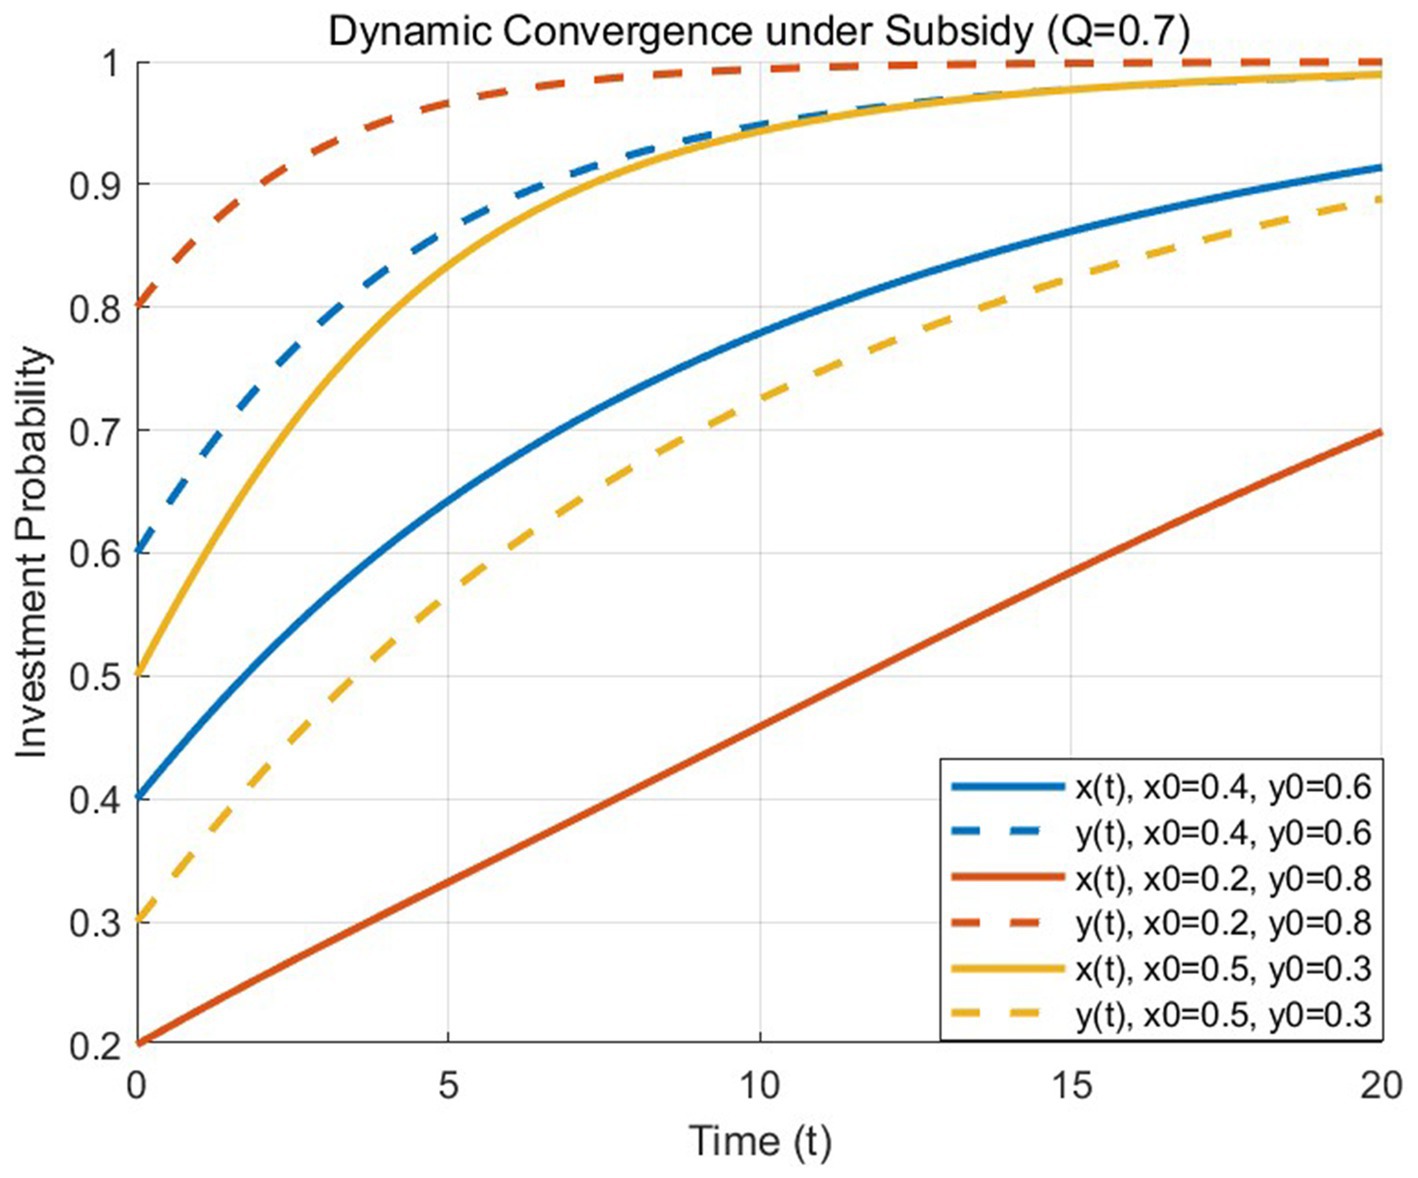
Figure 6 depicts the evolution of x(t) and y(t) with initial values x(0) = 0.4, y(0) = 0.6, and other comparative scenarios. All trajectories converge to (1,1), confirming the ESS when Q > Q0. Notably, the case of x(0) = 0.2 (red solid line) exhibits delayed convergence due to low initial willingness and producer suppression, which is consistent with the reality of slow digitization among small-scale farmers in fresh agricultural supply chains.
Figure 6
Figure 6. Dynamic convergence of digital investment probabilities under subsidy Q = 0.7. Solid lines: suppliers (x(t)); dashed lines: producers (y(t)).
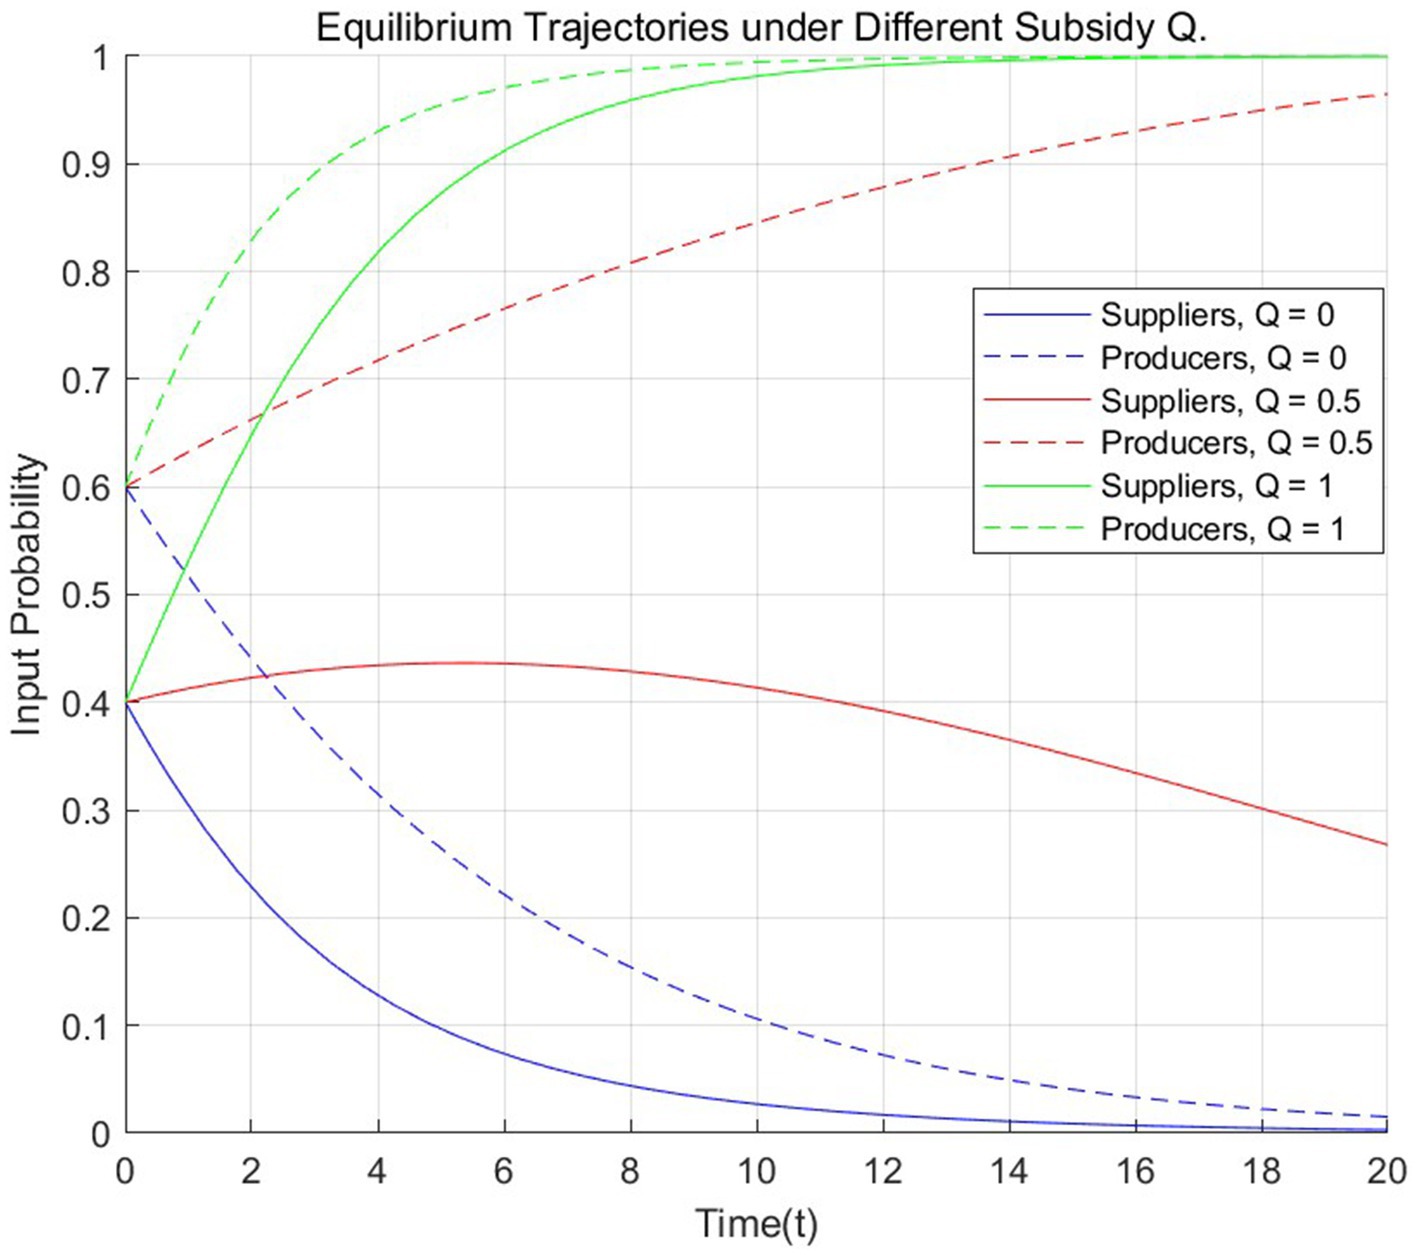
On this basis, we further explore the impact of different subsidy levels on the system’s evolution.
As can be seen from Figure 7, when the government subsidy amount is Q = 0, the probabilities of suppliers and producers choosing digital investment decrease over time. This implies that in the absence of subsidies, enterprises lack sufficient motivation for digital investment and tend to adopt conservative strategies. When Q increases to 0.5 (lower than the threshold level Q = 0.6), the investment probability of producers shows a slow upward trend and eventually converges to 1, while that of suppliers initially rises gently for a short period, then starts to decline, and has a tendency to approach 0 as time goes on.
Figure 7
Figure 7. Equilibrium trajectories under different subsidy Q.
This may be because the initial investment probability of producers is relatively high. After reaching a certain stage of development, producers have the intention of digital transformation based on their own strategic development needs. The introduction of government subsidies at this time can further increase their investment probability to a certain extent.
In contrast, the low initial investment probability of suppliers indicates weak willingness. When the government subsidy Q = 0.5, which is lower than the subsidy threshold Q = 0.6, although it can increase the investment probability in the short term, the increase is extremely limited. Due to the high pressure of digital costs and insufficient subsidy intensity, the investment probability gradually decreases to 0 over time.
When Q = 1, the investment probabilities of both parties rise rapidly and approach 1, indicating that high-level subsidies can strongly promote enterprises to choose digital investment and enable the system to quickly move towards a stable state where both parties invest.
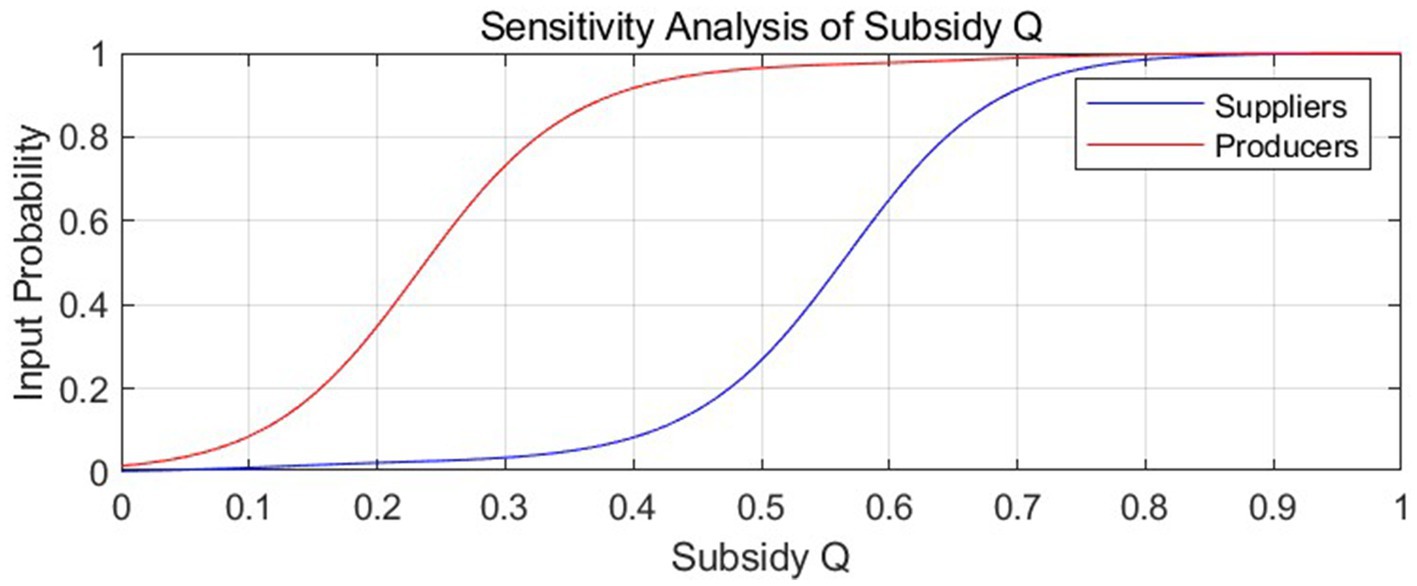
To further analyze the role of subsidies in enterprises’ investment decisions, a sensitivity analysis of subsidy Q is conducted.
As illustrated in Figure 8, the probabilities of suppliers and producers ultimately choosing digital investment strategies both exhibit an upward trend with the increase of subsidy Q. The investment probability of suppliers grows slowly at the initial stage and only experiences a significant surge after subsidy Q surpasses the critical threshold of 0.6. This indicates that without sufficient subsidy support, suppliers tend to hesitate in increasing digital investment due to cost–benefit considerations. In stark contrast, the investment probability of producers rises rapidly once subsidy Q exceeds 0.4, even when the subsidy amount remains below the critical level. This disparity can be primarily attributed to producers’ relatively high initial investment probabilities, enabling them to respond more actively to policy incentives even at lower subsidy levels.
Figure 8
Figure 8. Sensitivity analysis of subsidy Q.
These findings reveal that the impact of government subsidies on enterprises’ investment decisions is a complex mechanism, contingent not only on the absolute amount of subsidies but also on enterprises’ inherent initial conditions and strategic inclinations. This discovery strongly validates the scientific necessity of incorporating variables such as differences in initial revenues and probabilities into our model, laying a solid theoretical foundation for further exploration of the interaction between the government and enterprises.
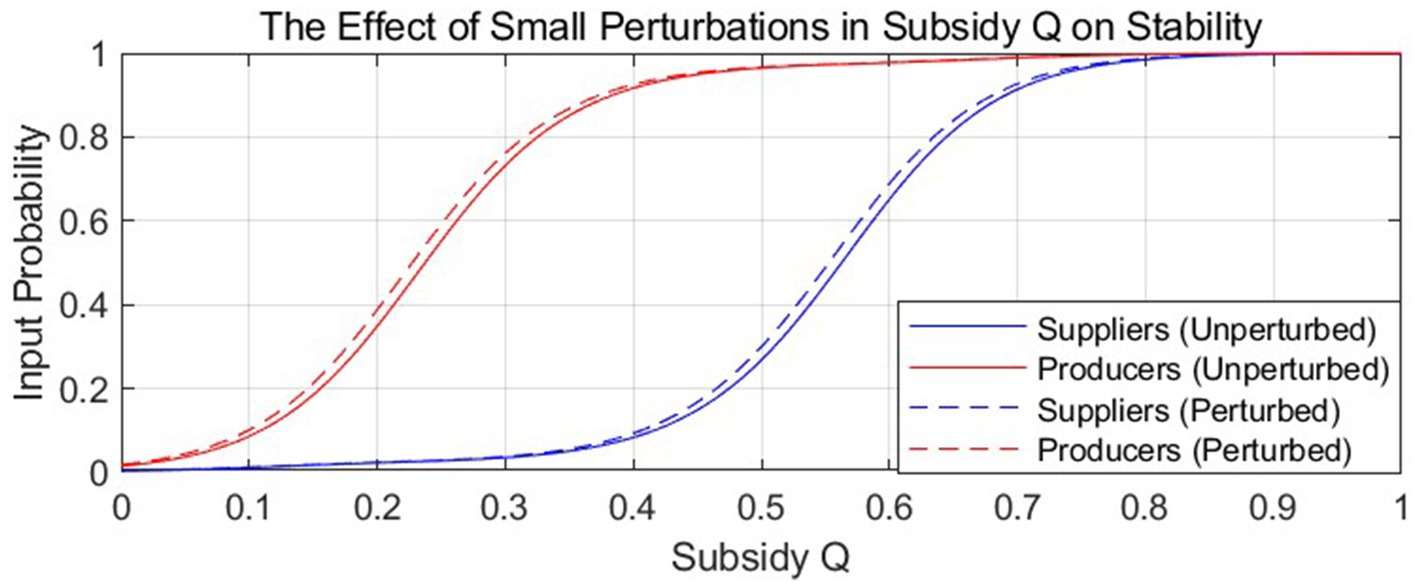
In addition to analyzing the impact of subsidy Q from the perspective of investment probability as described above, small perturbations of Q also play a significant role in the system’s stability.
As depicted in Figure 9, after applying small perturbations to Q under different baseline subsidy levels, the system states exhibit significant variations. When the baseline subsidy level is lower than the threshold (Q < 0.6), both positive and negative small perturbations lead to drastic fluctuations in the system’s stable state, accompanied by substantial changes in the investment probabilities of suppliers and producers. This indicates that with insufficient subsidies, the system’s stability is fragile, and enterprises’ investment decisions are highly vulnerable to minor changes in subsidies.
Figure 9
Figure 9. The effect of small perturbations in subsidy Q on stability.
As the baseline subsidy level gradually reaches the threshold (Q ≥ 0.6), the system’s fluctuations in response to small perturbations of the same magnitude are significantly reduced, demonstrating enhanced anti-interference capabilities. This phenomenon indicates that subsidy policies within this range can not only effectively stimulate enterprises’ enthusiasm for digital investment but also strengthen the stability of system operation, cushioning the impact of external changes on corporate decision-making. The close alignment between the experimental results and theoretical derivations strongly validates the rationality and scientific nature of Q = 0.6 as the critical threshold in this study, providing a solid theoretical foundation for subsequent policy formulation and corporate strategic decision-making.
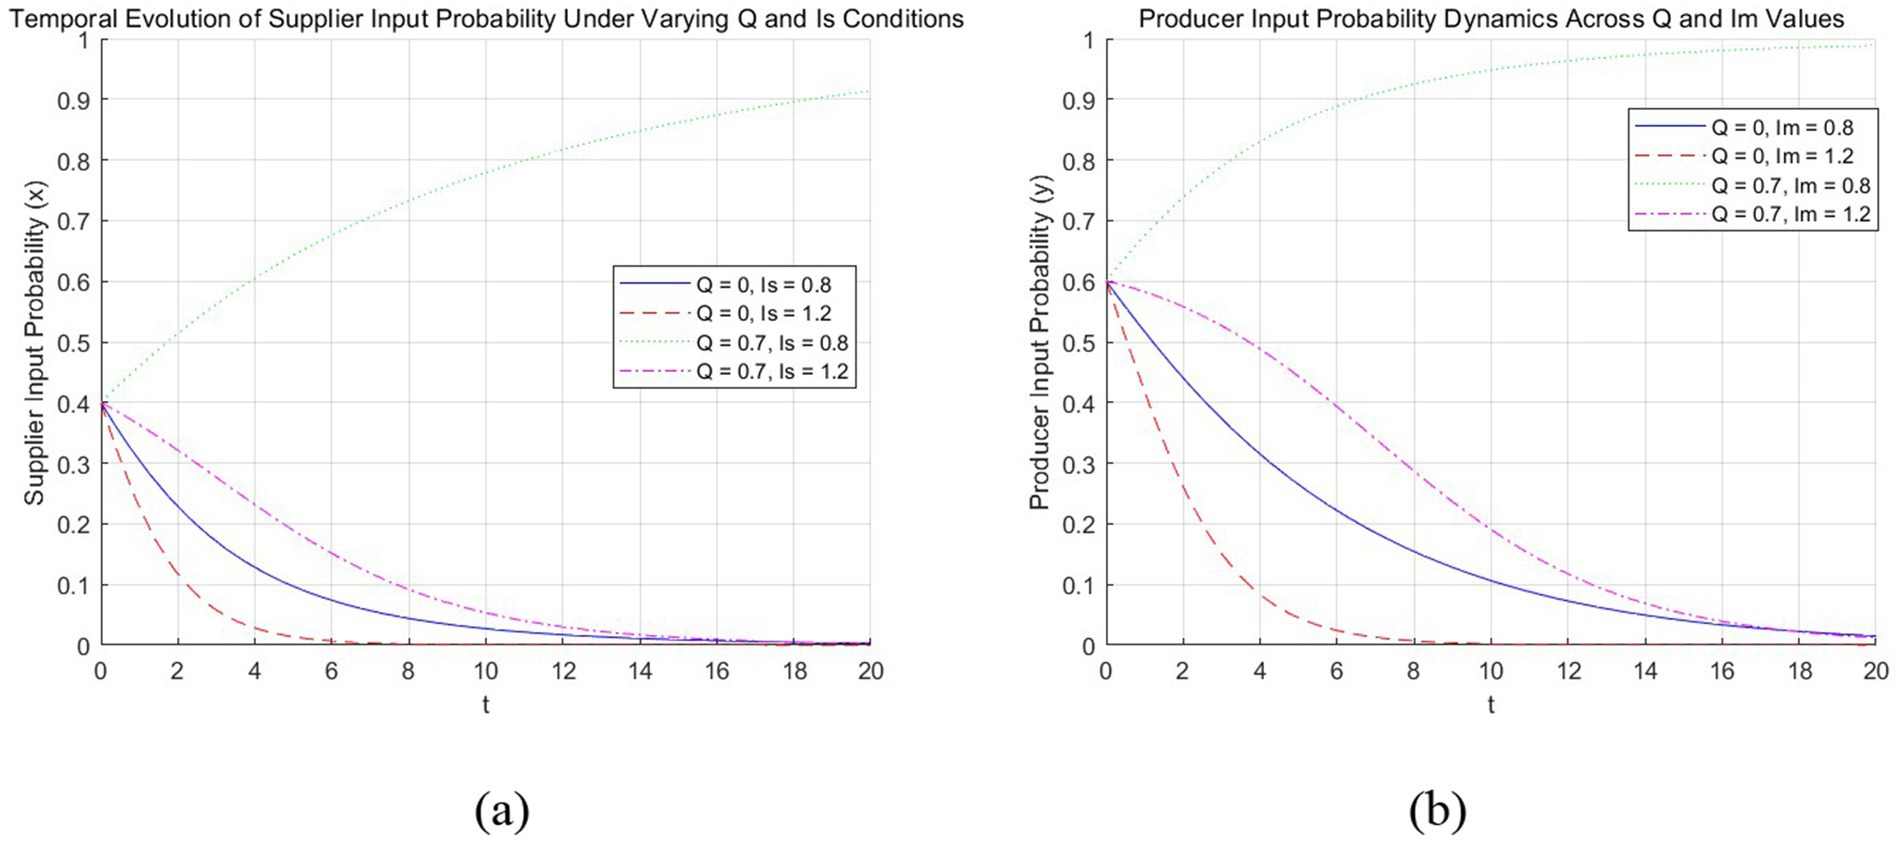
When the government provides a specific amount of subsidies to entities in the fresh produce supply chain that engage in digital input, Figure 10 shows the impact of digital input costs, the rate of benefit increase from digital input, initial profits, and digital technology spillover benefits on the willingness of supply chain node enterprises to participate in digital input:
(1) From Figure 10a, when there is no government subsidy (Q = 0), supply chain node firms can gain from digital input by 0.8 (), which is less than their original benefit. The readiness of suppliers and producers to engage in digital input gradually declines from probabilities (0.4, 0.6) to (0, 0) (see Figure 10b). In these situations, supply chain firms maximize profitability by t to invest in digitization.
(2) From Figure 10b, when the government subsidy is relatively low (0 < Q < Q0), suppliers and producers’ willingness to engage in digital input steadily declines from likelihood (0.4, 0.6) to (0, 0.3). The convergence rate also slows down, demonstrating that even with government subsidies, a small amount is insufficient to drive supply chain digitization.
(3) In the case when Q > Q0, as the government subsidy amount Q grows (e.g., Q = 0.7, Q = 1), the willingness of both partners in the supply chain to participate in digital input eventually approaches a value of 1. Furthermore, the higher the subsidy, the faster the convergence occurs (see Figures 10c,d). This shows that when the government offers adequate subsidies to supply chain node firms, the supply chain’s digital advancement can be significantly accelerated.
(4) Figures 10c–f show that the producer’s digital input probability converges faster than the supplier’s. This means that, given the same subsidy level, the greater both parties’ initial probabilities in the game, the faster they attain a probability of one. In other words, the convergence rate is dependent on the starting probability values.
Figure 10
Figure 10. The impact of government subsidies on digitalization willingness. (a) Evolutionary trends before and after subsidy; (b) Evolutionary trends of supply chain digitization below subsidy threshold; (c) Supply chain digitalization evolution trends at low level of subsidy; (d) Evolutionary trends of supply chain digitization under high level of subsidy; (e) Supply chain digitalization evolution trends with initial probability of (0.4, 0.6); (f) Supply chain digitalization evolution trends with initial probability of (0.5, 0.7).
In summary, the following conclusions can be drawn:
Conclusion 1. Government subsidy intensity significantly impacts supply chain digitalization.
When there is no government subsidy, supply chain node enterprises’ digital input returns are low, and their willingness to input will be gradually reduced to zero; when the government subsidy is lower than the threshold, it cannot effectively stimulate the willingness to input of suppliers and producers; only subsidies of sufficient magnitude can effectively enhance the willingness to input of both sides of the supply chain; and the higher the government subsidy, the more effective the push. Obviously, for fresh food suppliers and producers who are just getting started and are short for cash, a smaller subsidy is a drop in the bucket. For example, if a million-dollar set of digital monitoring equipment is acquired, a subsidy of 50,000 or 100,000 dollars is insufficient to cover the enormous expenses involved in installation, training, maintenance, and so on, resulting in a low desire to invest. However, when government subsidies exceed a specific threshold, such as 30% of total input costs, the scenario reverses. In Beijing, for example, SMEs receive subsidies of up to 30% of total project investment for digital transformation. This incentive can help suppliers and producers overcome the financial challenges of introducing digital equipment and continue forward with the digitization process. Furthermore, if the subsidy ratio is increased to 50%, businesses will be able to invest more money in technology upgrades and market expansion, increasing the willingness of fresh food suppliers and producers to participate in digitization.
Conclusion 2. The initial probability is closely related to the speed of convergence.
Producers’ digital input probability converges faster than suppliers’, and the higher the initial probability of both sides of the game, the faster the convergence to high input willingness, implying that the initial state has a significant impact on the development trend of digital input willingness of supply chain node enterprises. If fresh produce farmers or suppliers are exposed to more successful examples of digital transformation at an early stage, they will have a larger initial preference for digital input. As a result, they can make digital input judgments faster when faced with strong market rivalry. The higher initial tendency shows their thorough awareness of supply chain digitalization trends, which encourages them to invest in digitalization sooner.
5.2 Analysis of digital input costs’ influence on supply chain members’ input willingness
(1) As shown in Figure 11a, in the absence of government subsidies, the desire of suppliers to invest in digitization drops dramatically with increasing Is, eventually approaching zero. And Figure 11b shows a similar trend for producers. However, when the government compensates for the significant cost loss for supply chain participants who opt to input digitally, the desire of suppliers and manufacturers to input decreases with the increase in input costs, but the pace of decline slows (see Figures 11a,b). Specifically, when the cost of digitization technology or equipment acquisition rises, resulting in an increase in overall input costs, enterprises’ willingness to input will rapidly decline in the absence of government subsidies; however, when government subsidies offset some costs, suppliers and producers will weigh the pros and cons and maintain a certain level of investment, causing the downward trend to remain relatively flat. In the actual world, this move will provide firms with more time to explore.
(2) From Figures 11a,b, when Is/Im are equal, the gap between the curves corresponding with and without government subsidies is larger (Q = 0.7, Q = 0), indicating that government subsidies have a significant impact on the input willingness of supply chain node enterprises, i.e., government subsidies can effectively improve suppliers’ and producers’ digital input willingness. According to the White Paper on the Development of China’s Digital Economy (2023), government subsidy policies play an important role in facilitating SMEs’ digital transformation, with data indicating that the digital transformation rate of SMEs has increased significantly from 25% in 2020 to 40% by 2022. Furthermore, more than 70% of SMEs reported that policy support had a significant role in their decision to invest in digital technologies.
(3) When input costs are modest (Ii = 0.8), the curve without government subsidies gradually converges to zero over time, but when government subsidies are applied, the curve rises substantially quicker, transforming the initial downtrend curve into an uptrend line that gradually converges to one (see Figures 11a,b). This suggests that adequate government subsidies can significantly boost the investment probability of supply chain node firms. Government subsidies have encouraged supply chain businesses that had previously abandoned digital investments due to high input costs. Subsidies can help rising fresh food providers implement supply chain digitization systems and increase operational efficiency; they can also assist start-up producers in introducing digital equipment, lowering the threshold for digital investment, and stimulating their investment power.
Figure 11
Figure 11. The influence of Ii on digitalization willingness. (a) The effect of I1 on suppliers’ digitalization willingness under different subsidy levels; (b) The effect of I2 on producers’ digitalization willingness under different subsidy levels.
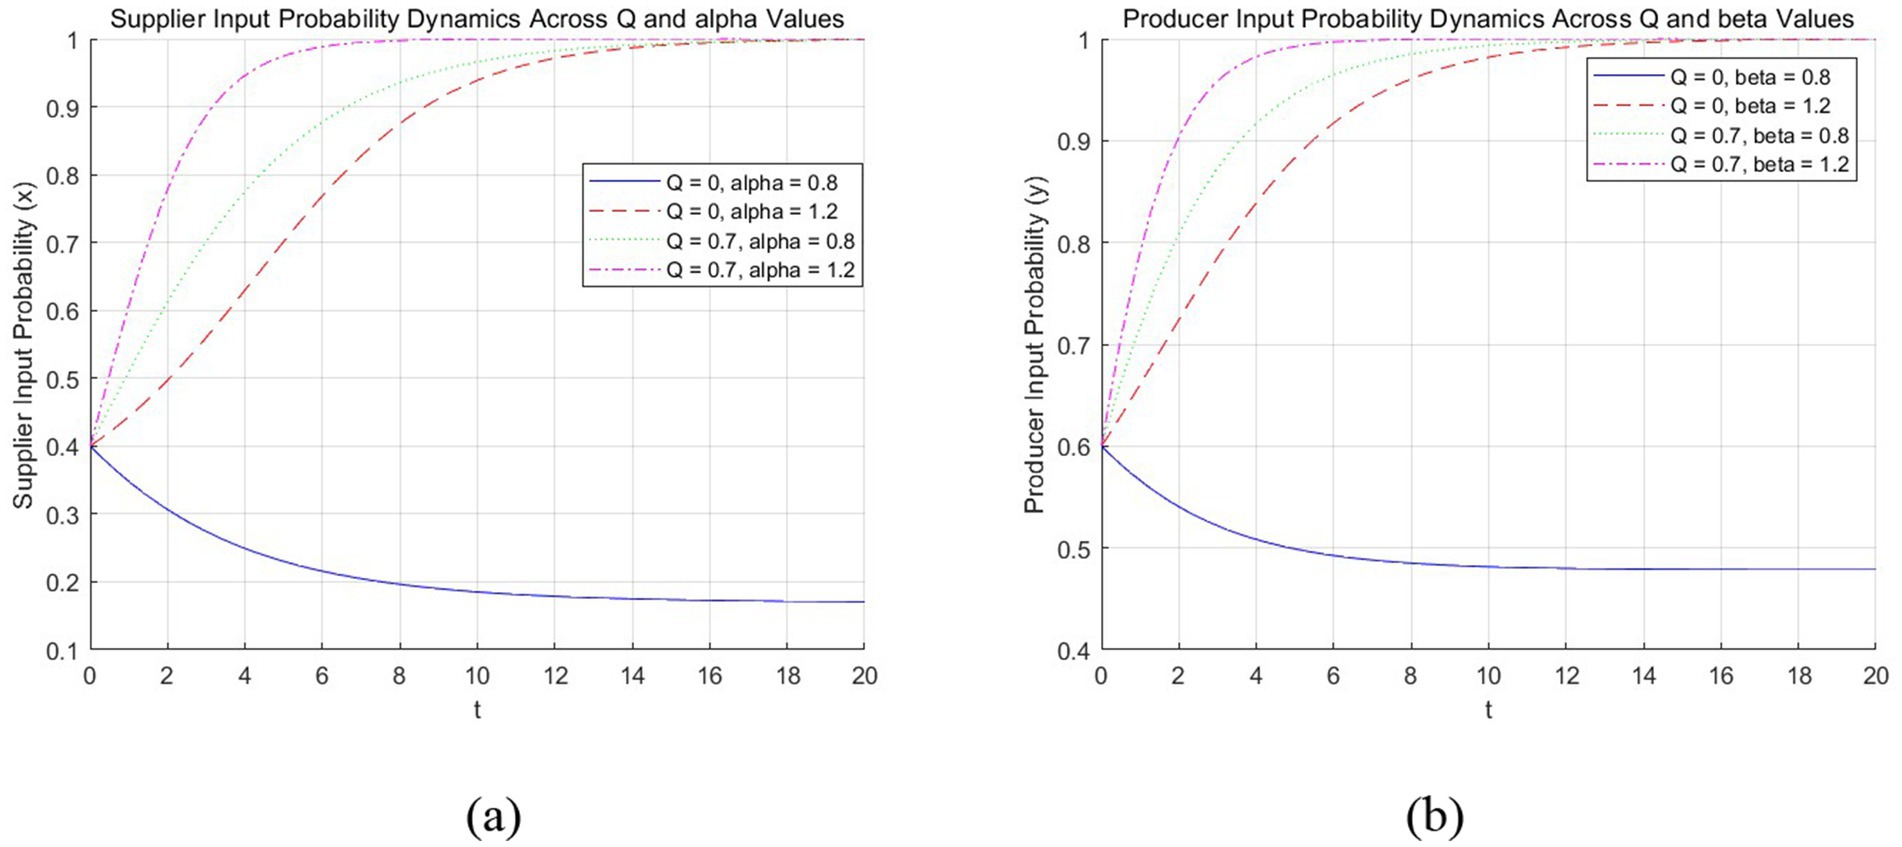
5.3 Analysis of digital input–output growth rate’s influence on supply chain members’ input willingness
(1) When the rate of revenue growth is low, the willingness of suppliers and producers to digitally input gradually declines. When the Q value rises from 0 to 0.7, the corresponding curves all shift upward, transitioning from an overall downward trend to an upward curve that gradually converges to 1, indicating that government subsidies can effectively increase the willingness of suppliers and producers to digitally input. Government subsidies can effectively assist fresh food suppliers and producers in lowering the cost of digital inputs, such as assisting suppliers in introducing digital monitoring equipment, producers in purchasing digital production and processing equipment, and so on, which in turn improves production efficiency, product quality, and yield, and significantly improves the situation of a slow rate of increase in the return on digital inputs.
(2) From Figure 12b, when is low, the difference between the curves of producers without and with government subsidies is comparatively considerable, showing that government subsidies have a greater impact on producers’ willingness to input at this time. When is high, the gap between the two curves is tiny, showing that the marginal effect of government subsidies is negligible at this point. Producers appreciate the value of quality products in improving market competitiveness because they are in charge of producing and processing fresh produce. Despite the low rate of increase in return on digitalization inputs, thanks to government subsidies, producers are more likely than suppliers to accelerate digitalization.
(3) When is high, the more government subsidies are provided, the faster suppliers’ and producers’ readiness to input increases (see Figures 12a,b). Fresh food suppliers and producers will be eager to participate in digitization because the returns on digital investments are significant. At this time, the government subsidy acts as a catalyst, increasing their willingness to invest in digitization dramatically.
Figure 12
Figure 12. The influence of on digitalization willingness. Trends are consistent; combined for analysis. (a) The effect of α on suppliers’ digitalization willingness under different subsidy levels; (b) The effect of β on producers’ digitalization willingness under different subsidy levels.
These analyses demonstrate a synergistic effect between subsidies (Q) and technology returns (α/β):
(1) Higher α/β values lead to faster convergence of investment probability even with limited subsidies;
(2) Lower α/β values require stronger subsidy incentives (Q > Q0) to achieve the same effect.
This implies that combining subsidies with α,β-enhancing measures (e.g., technology training, infrastructure upgrades) can optimize policy efficiency.
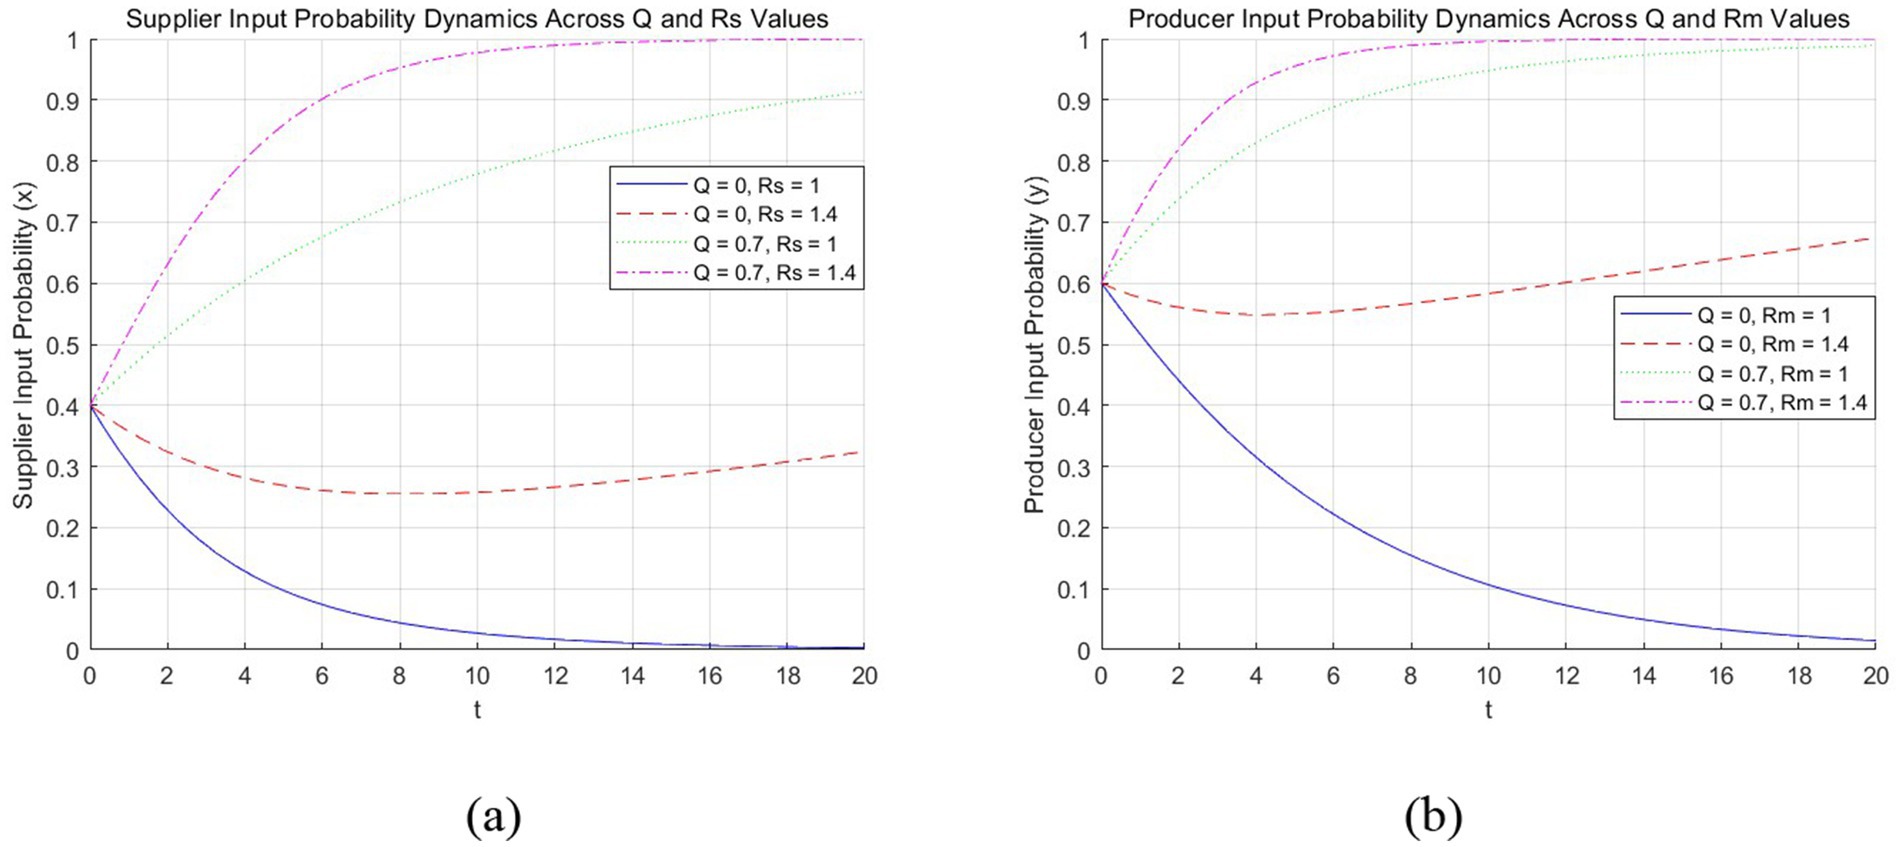
5.4 Analysis of initial returns’ influence on supply chain members’ input willingness
Initial returns (Rs, Rm) are exogenously varied in this sensitivity analysis to explore their marginal impact, but remain fixed within each simulation.
(1) When the initial revenue is low, the spacing between the two curves corresponding to no government subsidy and government subsidy is large, and when Q = 0, the willingness of both suppliers and producers to invest in digitalization gradually tends to 0 with the change of time (see Figures 13a,b) indicating that the amount of government subsidy has an important implication on the willingness to input in digitalization of supply chain enterprises, and it can make up for the lack of investment motivation due to the original revenue is not high. Similarly, for fresh food suppliers and producers in the early stages, the modest first return makes it difficult to justify the significant digital investment, thus they lack desire to invest. The intervention of government subsidies has relieved their financial burden, assisted them in re-promoting the digitization process, and used digital technology to increase product quality and sales, consequently increasing profitability.
(2) The impact of government subsidies on suppliers is more pronounced when the initial advantages are considerable (Figure 13a). Government subsidies have a rather limited incentive effect for producers at this moment (Figure 13b), probably because producers are more likely to base their digital investment decisions on their own economic strength and development needs. When fresh food suppliers’ initial revenue is high, they are faced with the need to introduce advanced digital systems in order to further expand their business, and their initial revenue is still insufficient to cover the huge capital investment; at this time, the government subsidy can significantly alleviate the financial pressure on suppliers and push them to rapidly advance the digitalization process. Producers, on the other hand, have greater autonomy in their digitization decisions due to their economic strength and control over the pace, and even with government subsidies, they will remain cautious and make sensible decisions.
Figure 13
Figure 13. The influence of Ri on digitalization willingness. (a) The effect of R1 on suppliers’ digitalization willingness under different subsidy levels; (b) The effect of R2 on producers’ digitalization willingness under different subsidy levels.
5.5 Analysis of digital spillover effects’ influence on supply chain members’ input willingness
(1) Figure 2 shows that when the benefits of digital spillover are low, the amount of government subsidies has a significant impact on the digital investment willingness of supply chain enterprises, because at this time, suppliers and producers rely more on their investment motivation, and government subsidies strengthen suppliers and producers’ investment motivation.
(2) When the spillover benefits are high, the willingness of fresh food suppliers and producers to invest decreases, and if the government subsidy is insufficient, it is difficult to provide incentives for suppliers and producers to invest in digitization; additionally, over time, the willingness of suppliers and producers to invest in digitization gradually decreases and even tends to zero, despite the presence of government subsidies.
6 Conclusions and recommendations
This paper constructs an evolutionary game model of digital input behavioral decision-making between suppliers and producers. The following conclusions are drawn:
(1) Market autonomy fails to achieve optimal digital adoption
Evolutionary stability cannot be achieved solely through participants’ self-interest when:
① Digital input costs (Is, Im) are high relative to returns (αRs-Is < 0, βRm-Im < 0, Scenario 1 in Section 3.2 and Figure 4A).
② Spillover benefits (H1, H2) exceed private returns, encouraging free-riding (Scenario 2–4 in Section 4).
(2) Government subsidies correct market failures
Subsidies effectively incentivize digital investment when:
① Input–Output Growth Rates and/or Initial Returns are low (Section 5.3&5.4).
② Spillover effects dominate private returns (Theorem 2).
The subsidy threshold Q0 is derived analytically (Section 4).
(3) Convergence dynamics under subsidies
1) Condition: Subsidies must exceed Q0 (Section 4).
2) Speed of convergence:
① Increases with subsidy amount (Q > Q0) (Figure 10).
② Accelerates with higher initial adoption probabilities (Figures 2, 10–13).
Based on the above conclusions, the following policy recommendations with enhanced operability and a close connection to the model analysis are proposed:
1. (1) Implement differentiated subsidies based on cost–benefit characteristics:
According to the analysis of parameters such as enterprises’ digital investment costs (Is, Im) and return on investment rates (α, β) in the model, differentiated subsidy strategies should be formulated for enterprises with different cost–benefit profiles.
For enterprises with high investment costs and low digital revenue growth rates, such as large-scale fresh agricultural product supply chain enterprises that incur substantial expenses in building complex information systems and have limited short-term returns, subsidy intensity should be increased to help balance their input and output.
Conversely, for enterprises with high digital revenue growth rates, subsidies can be moderately reduced to optimize resource allocation.
(2) Strengthen the publicity of digital subsidy policies:
Given that the model reveals the crucial role of subsidy policies in enterprises’ decision-making, the government should enhance publicity through a combination of online and offline channels, ensuring that supply chain enterprises fully understand the policies and seize the opportunities for digital transformation.
(3) Guide precisely based on enterprise and regional characteristics:
First, regarding enterprise size, large enterprises can receive support for collaborative digital construction. For example, efforts should be made to promote the establishment of digital alliances among large enterprises and their upstream and downstream partners. Small and medium-sized enterprises, on the other hand, should enjoy small-amount discounted loans and free training to lower the threshold for transformation.
Second, based on the enterprises’ digital readiness, referring to the initial investment probability in the model, enterprises with low readiness should be provided with initial funds and technical guidance to help them formulate transformation plans. For enterprises well-prepared for digital transformation, subsidies should be given to innovative projects to give play to their demonstrative effects.
Third, considering regional conditions, in areas with backward digital infrastructure, subsidies for the construction of networks and data centers should be increased, and tax incentives should be offered to attract entry.
While our model provides insights into how subsidies influence the initial digital adoption decision, it does not capture the full spectrum of digital maturity observed in practice. Future studies could explore phased adoption pathways to better reflect real-world scenarios. (2) Additionally, its spillover assumptions simplify trust, compatibility, and protocol dependencies, and focus solely on positive spillovers (e.g., shared infrastructure gains) while neglecting negative or competitive spillovers (e.g., first-mover cost advantages); future work should investigate how these factors moderate subsidy effectiveness. (3) The model omits informal mechanisms like relational contracts and lacks any enforcement mechanism, reputational cost, or strategic penalty for opportunism—limitations that extend to its linear treatment of government subsidies (Q) which ignores practical complexities like tiered thresholds and diminishing returns. Similarly, our assumption of constant α/β simplifies technology return heterogeneity across firms (e.g., precision agriculture vs. basic digitization), though Figure 12 confirms the policy relevance of α,β-subsidy interactions. Future work should integrate these elements to better capture digital adoption dynamics. (4) Beyond these behavioral assumptions, while our model focuses on deterministic dynamics, subsequent research could employ agent-based modeling to explore firm-level heterogeneity or Monte Carlo methods to test parameter sensitivity.
Future research can broaden the scope of influencing factors by taking into account market demand, digital technology level, digital collaboration cost sharing, and technological innovation pace when making digital input decisions for supply chain firms. To enhance the practical relevance of theoretical models, empirical validation through stakeholder interviews (e.g., policymakers, farmers, and distributors) and field data calibration (e.g., actual subsidy cases from regional pilot programs) should be prioritized. Furthermore, it can conduct in-depth research on the features of digital supply chain transformation in different industries in order to provide theoretical support for the development of supply chain digital growth plans.
Data availability statement
The original contributions presented in the study are included in the article/supplementary material, further inquiries can be directed to the corresponding author.
The author(s) declare that financial support was received for the research and/or publication of this article. This research is supported by the Ministry of Education of Humanities and Social Science Planning Project of China (grant/award number: 23YJA630031).
Acknowledgments
We are grateful to all of those who provided useful suggestions for this study.
Conflict of interest
The authors declare that the research was conducted in the absence of any commercial or financial relationships that could be construed as a potential conflict of interest.
Generative AI statement
The author(s) declare that no Gen AI was used in the creation of this manuscript.
Publisher’s note
All claims expressed in this article are solely those of the authors and do not necessarily represent those of their affiliated organizations, or those of the publisher, the editors and the reviewers. Any product that may be evaluated in this article, or claim that may be made by its manufacturer, is not guaranteed or endorsed by the publisher.
References
Axelrod, R. (1984). The evolution of cooperation. New York: Basic Books.
Bai, S., and Jia, X. (2024). Research on operational strategy of capital-constrained dual-channel supply chain of fresh agricultural products. Chin. J. Manag. Sci. 32, 275–285. doi: 10.16381/j.cnki.issn1003-207x.2021.2691
Cachon, G. (2003). “Supply chain coordination with contracts,” in Handbooks in operations research and management science. eds. S. Graves and A. de Kok (Elsevier), 11, 227–339. doi: 10.1016/S0927-0507(03)11006-7
Cao, X., and Qin, Y. (2024). The optimal decision and coordination of fresh agricultural product supply chain with freshness-keeping effort and freshness reference effect. J. Jiangxi Normal Univ. 48, 604–612. doi: 10.16357/j.cnki.issn1000-5862
Chen, C., Lin, Y., Chen, W., Chao, C., and Pandia, H. (2021). Role of government to enhance digital transformation in small service business. Sustainability 13:1028. doi: 10.3390/su13031028
Chiang, W. (2010). Product availability in competitive and cooperative dual-channel distribution with stock-out based substitution. Eur. J. Oper. Res. 200, 111–126. doi: 10.1016/j.ejor.2008.12.021
Halder, S., Islam, R., Mamun, Q., Mahboubi, A., Walsh, P., and Islam, Z. (2025). A comprehensive survey on AI-enabled secure social industrial internet of things in the Agri-food supply chain. Smart Agric. Technol. 11:100902. doi: 10.1016/j.atech.2025.100902
Hao, H., Wu, W., Mu, H., Fang, X., Chen, H., Yang, H., et al. (2022). The application of new food Technology in Fresh Agricultural Product Supply Chain Green Preservation. J. Chin. Inst. Food Sci. Technol. 22, 1–12. doi: 10.16429/j.10097848.2022.09.001
Huo, H., and Zhong, H. (2023). Evolution analysis of Blockchain technology investment based the quality and safety of agricultural supply chain. Operat. Res. Manag. Sci. 1, 15–21. doi: 10.12005/orms.2023.0003
Kouhizadeh, M., Saberi, S., and Sarkis, J. (2021). Blockchain technology and the sustainable supply chain: theoretically exploring adoption barriers. Int. J. Prod. Econ. 231:107831. doi: 10.1016/j.ijpe.2020.107831
Li, F., Gui, Y., Du, Y., and Wen, J. (2025). Research on the optimization of supply chain decisions for green agricultural products based on Farmers’ risk preferences and disaster year subsidies. Int. J. Ind. Eng. Comput. 16, 275–294. doi: 10.5267/j.ijiec.2025.2.005
Liu, M., Dan, B., Zhang, S., and Ma, S. (2021). Information sharing in an E-tailing supply chain for fresh produce with freshness keeping effort and value-added service. Eur. J. Oper. Res. 290, 572–584. doi: 10.1016/j.ejor.2020.08.026
Liu, M., Wang, X., and Wang, Y. (2023). Evolutionary game of supply chain digital decision-making with reward and punishment. Operat. Res. Manag. Sci. 32, 29–34. doi: 10.12005/orms.2023.0111
Moktadir, M., Ali, S., Paul, S., and Shukla, N. (2019). Barriers to big data analytics in manufacturing supply chains: a case study from Bangladesh. Comput. Ind. Eng. 128, 1063–1075. doi: 10.1016/j.cie.2018.04.013
Nowak, M., and Sigmund, K. (1993). A strategy of win-stay, lose-shift that outperforms tit-for-tat in the Prisoner’s Di-lemma game. Nature 364, 56–58. doi: 10.1038/364056a0
Qi, Y., and Zhao, M. (2023). Research on the path of supply chain of fresh agricultural products empowered by digital technology. Agric. Econ. 7, 129–130. doi: 10.3969/j.issn.1001-6139.2023.07.045
Rai, A., Patnayakuni, R., and Seth, N. (2006). Firm performance impacts of digitally enabled supply chain integration capabilities. MIS Q. 30, 225–246. doi: 10.2307/25148729
Su, B., and Zheng, Q. (2024). Supply chain coordination of fresh products with government subsidy in the live-streaming E-commerce. Operat. Res. Manag. Sci. 33, 71–77. doi: 10.12005/orms.2024.0287
Sun, Y., Zhang, Y., and Su, B. (2022). Impact of government subsidy on the optional RD and advertising investment in the cooperative supply chain of new energy vehicles. Energy Policy 164:112885. doi: 10.1016/j.enpol.2022.112885
Tan, Y., Li, C., and Song, Q. (2023). Application of Blockchain Technology in Agricultural Products Supply Chain: theoretical mechanism, development practice and policy enlightenment. Agric. Econ. 1, 76–87. doi: 10.13246/j.cnki.iae.20220720.001
Tang, W. (2022). Digital technology drives high-quality development of agriculture and rural areas: theoretical interpretation and practical path. J. Nanjing Agric. Univ. 22, 1–9. doi: 10.19714/j.cnki.1671-7465.2022.0018
Tang, Z., Luo, X., and Chen, X. (2019). Research on supply chain coordination of fresh agricultural products based on option contract under Retailer’s risk aversion. Operat. Res. Manag. Sci. 28, 62–72. doi: 10.12005/orms.2019.0273
Tang, T., Xu, H., and Zhang, Z. (2023). Operation decisions of an online Dual-Channel supply chain under different financing strategies. Chinese J. Manag. Sci. 31, 106–115. doi: 10.16381/j.cnki.issn1003-207x.2021.0201
van Hilten, M., Ongena, G., and Ravesteijn, P. (2020). Blockchain for organic food traceability: case studies on drivers and challenges. Front. Blockchain 3:567175. doi: 10.3389/FBLOC.2020.567175
Wang, L. (2015). The incentive mechanism for preservation in fresh agricultural supply chain considering consumer utility. J. Indust. Eng. Eng. Manag. 29, 200–206. doi: 10.13587/j.cnki.jieem.2015.01.026D, B
Wang, D., Liu, Q., and Chang, J. (2025). Research on digital transformation decision of supply chain considering free-ride effect and government subsidies. Syst. Eng., 1–14. Available online at: https://link.cnki.net/urlid/43.1115.N.20250211.1723.008
Xing, G., Zhong, Y., Zhou, Y., and Cao, B. (2025). Distributionally robust production and pricing for risk-averse contract-farming supply chains with uncertain demand and yield. Transp. Res. E 198:104074. doi: 10.1016/j.tre.2025.104074
Zhang, W., Lin, W., and Liu, J. (2025). Blockchain technology adoption strategies for the shipping costs bearer in the fresh product supply chain. Front. Sustain. Food Syst. 9:1550985. doi: 10.3389/fsufs.2025.1550985
Zhao, S., Cao, X., and Li, W. (2025). Research on pricing and coordination of fresh agricultural product supply chain considering the smart agriculture technology under different power structures. Chin. J. Manag. Sci. 33, 262–278. doi: 10.16381/j.cnki.issn1003-207x.2024.1149
Zhao, S., and Li, W. (2023). Blockchain-based traceability system adopting decision in the dual-channel perishable goods market under different pricing policies. Int. J. Prod. Res. 61, 4548–4574. doi: 10.1080/00207543.2023.2168309
Zheng, Q., Fan, T., Hu, H., and Song, Y. (2023). Impact of traceability technology investment on supply chains for fresh product under pre-position warehouse mode. J. Indust. Eng. Eng. Manag. 37, 165–178. doi: 10.13587/j.cnki.jieem.2023.04.014
Citation: He J, Chen S and Zong C (2025) Digital input decision-making in fresh agricultural supply chains under government subsidies. Front. Sustain. Food Syst. 9:1602960. doi: 10.3389/fsufs.2025.1602960
Received: 30 March 2025; Accepted: 13 May 2025; Published: 04 June 2025.
Edited by:
Mukesh Kumar, National Institute of Technology Patna, India
Disclaimer: All claims expressed in this article are solely those of the authors and do not necessarily represent those of their affiliated organizations, or those of the publisher, the editors and the reviewers. Any product that may be evaluated in this article or claim that may be made by its manufacturer is not guaranteed or endorsed by the publisher.
 Jing He1
 Sixin Chen