 Siyaram Meena1,2†
 K. M. Manjaiah1*
 V. K. Sharma1
 T. J. Purakayastha1Shrila Das1
 Ram Swaroop Bana3
 Sandeep Gawdiya3,4Sunita Yadav5
 Ravi Saini1Anil Kumar1Salah El-Hendawy6*
 Mohamed A. Mattar7*†
 Ali Salem8*†
- 1Division of Soil Science and Agricultural Chemistry, ICAR–Indian Agricultural Research Institute, New Delhi, India
- 2Department of Soil Science, Tirhut College of Agriculture, Dr Rajendra Prasad Central Agricultural University, Pusa, Bihar, India
- 3Division of Agronomy, ICAR–Indian Agricultural Research Institute, New Delhi, India
- 4School of Agriculture, Galgotias University, Greater Noida, India
- 5Division of Environmental Sciences, ICAR– Indian Agricultural Research Institute, New Delhi, India
- 6Department of Plant Production, College of Food and Agricultural Sciences, King Saud University, Riyadh, Saudi Arabia
- 7Department of Agricultural Engineering, College of Food and Agricultural Sciences, King Saud University, Riyadh, Saudi Arabia
- 8Structural Diagnostics and Analysis Research Group, Faculty of Engineering and Information Technology, University of Pécs, Pécs, Hungary
Soil organic carbon (SOC) is vital for ecosystem health, improving soil quality, enhancing productivity, and acting as a significant carbon sink for climate change mitigation. Understanding the distribution of SOC across various land uses is essential for developing effective land management strategies that enhance soil health and carbon sequestration. This study aimed to evaluate the sensitivity of SOC fractions, including readily oxidizable carbon, total organic carbon (TOC), carbon stocks, and carbon management index (CMI), across different land use systems (LUSs) in Tripura, India. Soil samples were collected from horticultural and agricultural LUSs (oil palm, litchi, citrus, guava, rubber, ginger, rice–fallow, vegetable cowpea–rice–maize, vegetable cowpea–rice–lentil, vegetable cowpea–rice–mustard, and uncultivated), at five soil depths: 0–15, 15–30, 30–60, 60–75, and 75–100 cm. The samples were analyzed for various physical and chemical properties, SOC fractions, carbon stock, and CMI to assess the role of LUSs in managing soil carbon content. Significant differences were observed in SOC fractions, carbon stock, and CMI across the LUSs. Litchi LUSs exhibited the highest organic carbon content (16.6 g kg−1) and TOC (22.2 g kg−1) at 0–15 cm, while uncultivated land recorded the lowest values. SOC fractions showed a significant decrease with increasing soil depth from 0 to 100 cm. Litchi orchards had the highest average SOC stock (41.2 Mg ha−1) and readily oxidizable carbon (1.72 g kg−1), followed by rubber and oil palm. Rubber showed the highest lability index, followed by litchi and oil palm with values of 1.47, 1.41 and 1.39, respectively. Litchi and rubber exhibited the highest carbon pool index values, indicating substantial carbon retention. Furthermore, litchi, rubber, and oil palm exhibited significantly higher CMI values, with 245, 238, and 222, respectively. The study emphasizes the significant role of different LUSs, particularly horticultural land use, in enhancing SOC fractions and carbon sequestration. The findings suggest that integrating such LUSs, like litchi and rubber, can contribute significantly to improving soil quality and implementing effective climate change mitigation strategies.
1 Introduction
Soil organic carbon (SOC) is a key indicator in soil fertility that impacts several soil properties, thereby influencing soil quality and ecosystem functions (Kaith et al., 2023; Kumar et al., 2024). It plays a crucial role in carbon sequestration and has a significant impact on the global carbon cycle (Lal, 2018) and climate change (Zhang et al., 2017). Anthropogenic activities have significantly contributed to soil degradation and the loss of carbon stocks, posing a serious threat to ecosystem sustainability (Yadav et al., 2018).
Soils have been rapidly degraded due to factors such as wind and water erosion, desertification, and salinization, which are consequences of improper and harmful agricultural practices. As a result, it is crucial to prevent further soil deterioration, as this directly impacts soil quality and the ability to produce healthy, nutritious crops. Inputs from soil microbial biomass and plant residues are major contributors to the formation and maintenance of soil organic matter (SOM), which plays a crucial role in regulating soil functions (Kramer and Gleixner, 2006). Soil organic matter also improves the soil physical and chemical properties by reducing bulk density, increasing water and nutrient retention, enhancing cation exchange capacity, and ultimately boosting plant productivity (Topa et al., 2021; Bashir et al., 2021).
Intensive farming has resulted in the depletion of approximately half to two-thirds of the SOC reserves in cultivated lands, leading to a significant reduction of 30–40 metric tons of carbon per hectare (Lal, 2004a). This loss of SOC is further exacerbated by changes in temperature and precipitation, which play a crucial role in influencing SOC dynamics. Studies indicate that SOM fractions are valuable indicators of soil quality and are highly sensitive to management practices, making them useful for monitoring (Chan, 1997; Zhang et al., 2016; Padbhushan et al., 2020). Organic carbon pools and carbon lability directly influence the physical, chemical, and biological properties of soil and its self-regulating capabilities (Addiscott, 1995; Blair and Crocker, 2000). Integration into the CMI serves as a critical measure for evaluating management systems’ potential to enhance soil quality (Blair et al., 2006a; Blair et al., 2006b). Blair et al. (1995) developed the lability index (LI), carbon pool index (CPI) and carbon management index (CMI) to evaluate the quality of soil carbon across various land use systems (LUSs). These indices, as highlighted by Ameer et al. (2023) and, Yadav et al. (2024) are useful for evaluating changes in soil carbon and its sequestration due to management practices, considering both labile carbon and total carbon (Rigarlsford et al., 2020). Mir et al. (2023) and Padbhushan et al. (2022) highlighted that soil depth and LUSs play a significant role in influencing SOC pools and the, establishing the latter as a key indicator for long-term sustainability and soil carbon restoration. Safron and pear LUSs having the highest SOC stocks, carbon fractions and pools and CMI compared to vegetables and flower plants (Jangir et al., 2024).
Recently, the role of SOC in mitigating climate change has gained significant attention, as soils hold a substantial amount of terrestrial carbon-twice the amount found in the atmosphere. Agriculture is responsible for approximately 24% of global CO2 emissions, highlighting the urgent need for solutions that reduce emissions and enhance carbon sequestration in soils (IPCC, 2014). Consequently, the implementation of restorative management practices is often necessary to enhance soil fertility and improve environmental conditions, ultimately promoting sustainable land uses and soil health (Lal, 2004b).
In the northeastern region of India, cropping sequences have significantly influenced carbon sequestration, altering soil physical, chemical, and biological properties (Babu et al., 2020). Improper agricultural practices such as wind and water erosion, desertification, and salinization have further exacerbated soil degradation, emphasizing the urgent need to prevent further deterioration (Babu et al., 2020; Yadav et al., 2024; Jangir et al., 2024). Soil stores approximately four times more carbon than the biosphere up to a depth of 2 meters (Lal, 2001), and even slight changes in SOC can have a considerable impact on atmospheric carbon dioxide levels (Babu et al., 2020). Effective land-use systems can mitigate the greenhouse effect by sequestering carbon (Kılkış, 2022; Kaur et al., 2023), with forest land showing the highest potential for soil carbon sequestration compared to other uses (Wang et al., 2024). Studies have also indicated that carbon distribution within the soil extends much deeper than root penetration, suggesting a reduction in decomposition rates of SOC as soil depth increases (Gill and Burke, 2002; Sahu et al., 2023).
However, in the northeastern India, key land uses are under pressure from agricultural and infrastructure development, leading to reduced carbon sequestration potential and threatening sustainability (Singh et al., 2018; Babu et al., 2020). Most studies have primarily focused on fertility evaluation, crop yields, and water and fertilizer management. However, the impact of LUSs and soil depth on SOC fractions, carbon stocks, and the CMI in Tripura has not been well explored. Given the significance of this topic, a thorough understanding and consideration of research on SOC fractions, stocks, and the CMI are essential. Therefore, this study was conducted to (i) assess the influence of different LUSs on SOC fractions in different soil depth, (ii) evaluate the CMI across various LUSs at different depths. This research endeavors to provide insights into SOC dynamics and contribute to the development of sustainable land management practices in the region.
2 Materials and methods
2.1 Experimental site
The present study was carried out during 2022–23, using the soil samples collected from Horticultural Research Complex (HRC), Nagicherra, Agartala, Tripura (Latitude: 23.8116° N, Longitude: 91.3284° E), and the Indian Council of Agricultural Research (ICAR) – Research Complex for North–East Hill (RC NEH) Region, Lembucherra, Agartala, Tripura (Latitude: 23.9052° N, Longitude: 91.3147° E) (Figure 1). The study included two main categories of land use: Horticultural and Agricultural. Horticultural crops, situated within the HRC, included oil palm (Elaeis guineensis), rubber (Hevea brasiliensis), litchi (Litchi chinensis), citrus (Citrus sinensis), and guava (Psidium guajava L.) all, as well as ginger (Zingiber officinale). Uncultivated land (A) was used as a reference for comparison. At the ICAR–RC NEH Region, agricultural crops included rice (Oryza sativa)–fallow, vegetable cowpea (Vigna unguiculata)–rice (Oryza sativa)–maize (Zea mays L.), vegetable cowpea (V. unguiculata)–rice (O. sativa)–lentil (Lens culinaris), and vegetable cowpea (V. unguiculata)–rice (O. sativa)–mustard (Brassica juncea) with uncultivated (B) as a reference (Table 1). The soil in the study area was characterized by a pH ranging from highly acidic to slightly acidic (4.93–5.60), and elevated SOC levels between 8.95 and 16.6 g kg−1. Bulk density (BD) was ranged from 1.15 g cm−3 to 1.40 g cm−3. Mean weight diameter (MWD) was highest under litchi (2.09 mm) and rubber (1.97 mm) plantations, whereas the lowest MWD was observed in uncultivated land uses (1.13–1.18 mm). Available nitrogen, phosphorus, and potassium ranged from 280 to 413 kg ha−1, 10 to 19.7 kg ha−1, and 119 to 185 kg ha−1, respectively (Table 2).
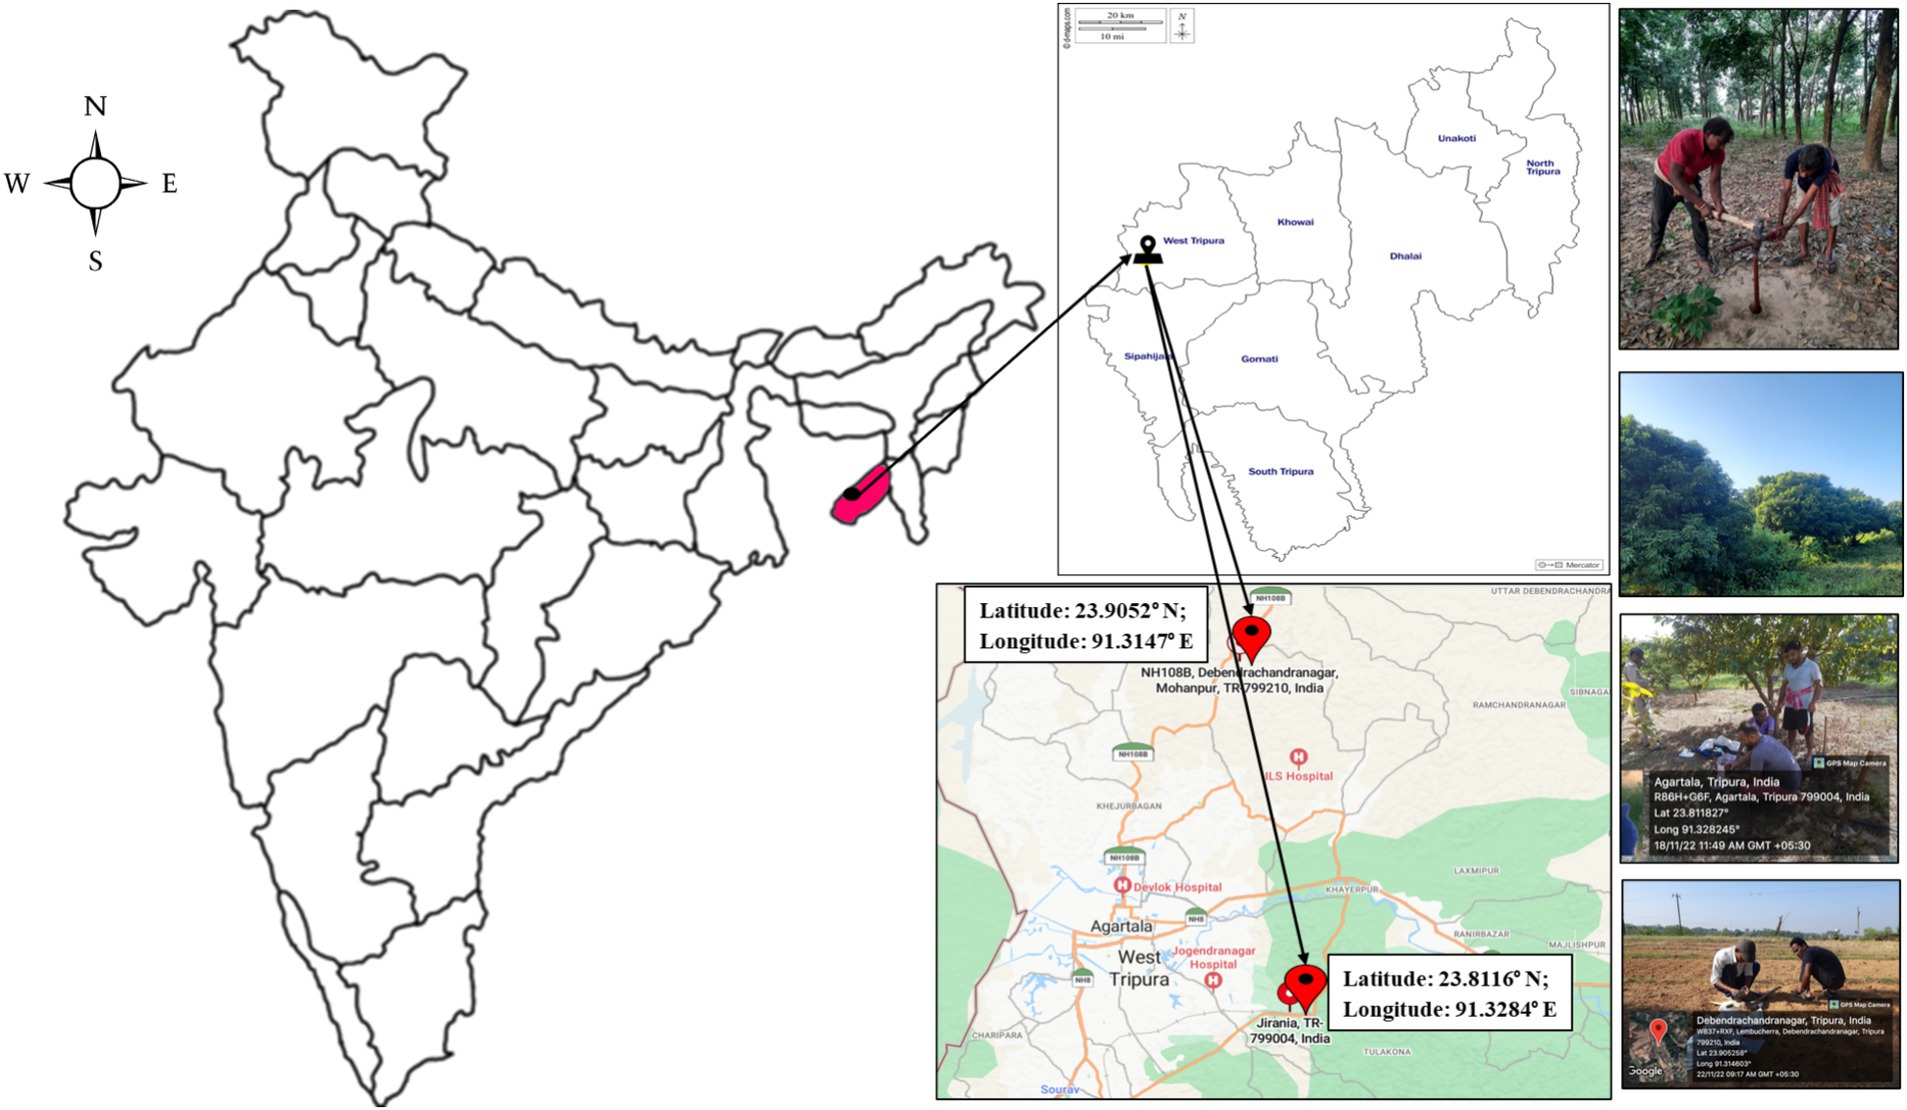
Figure 1. Geographical location and sampling sites of the study area: Agartala, Tripura in Northeast India.
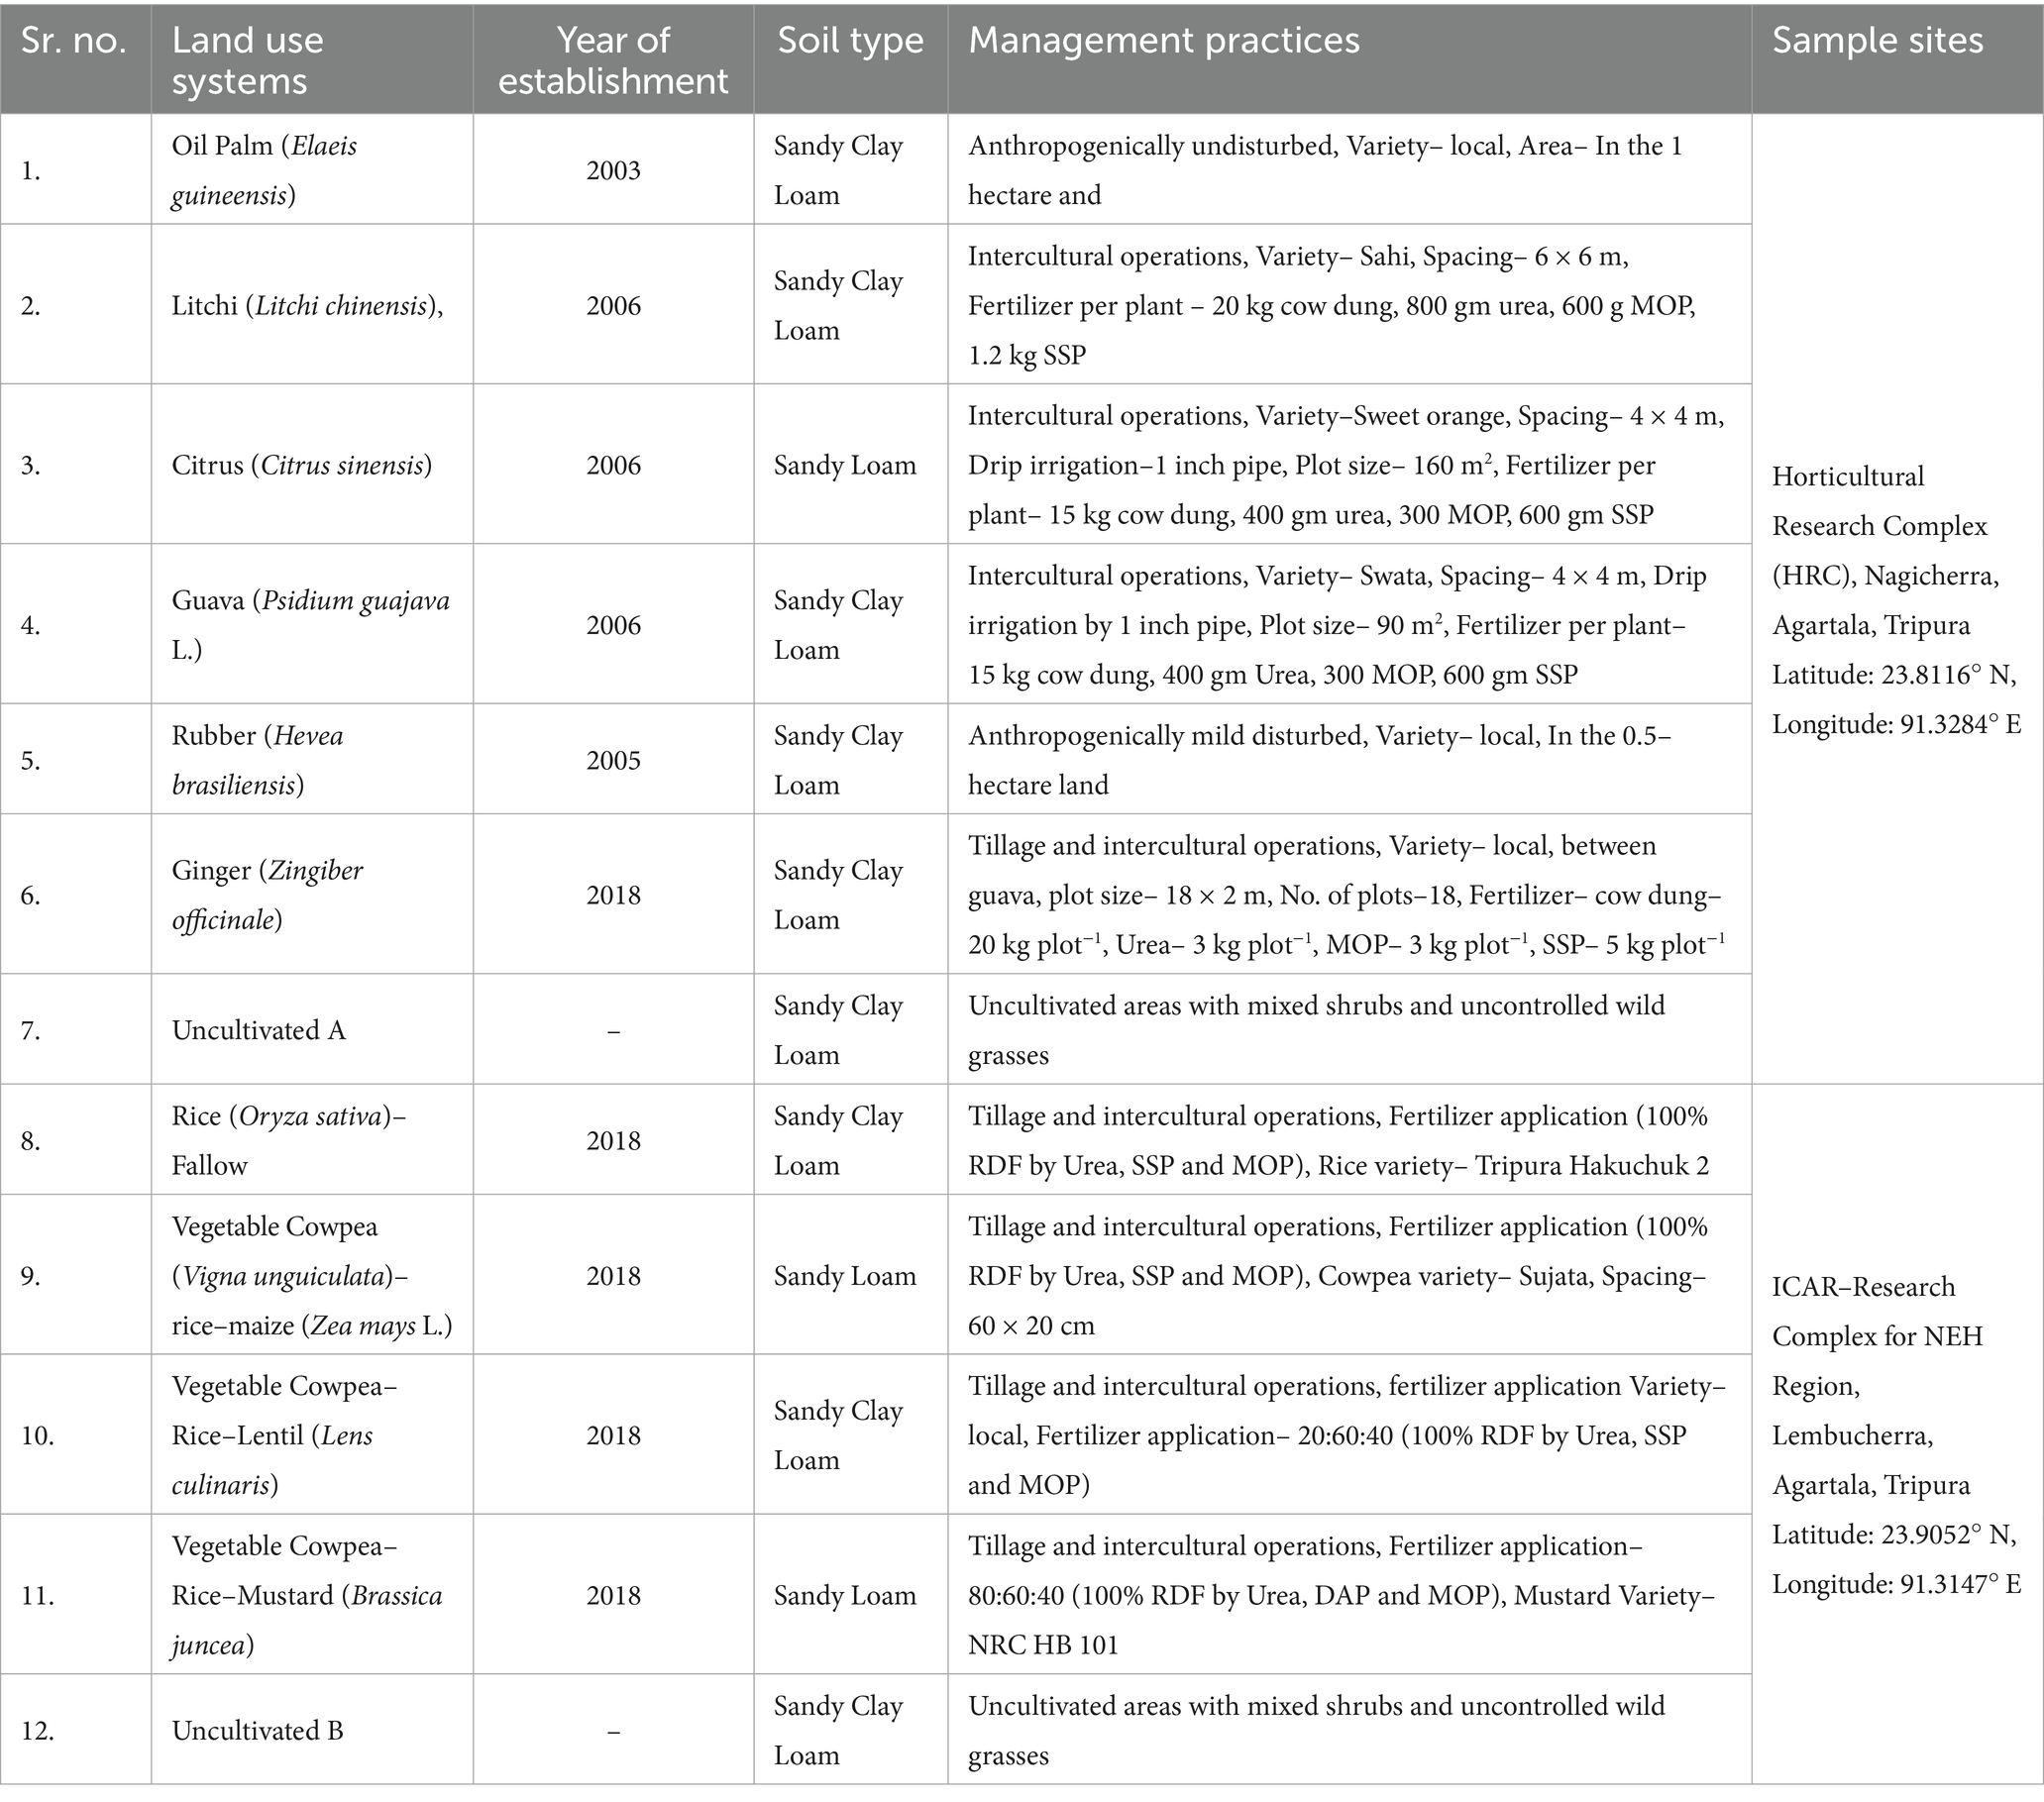
Table 1. Description and location details of the selected land use system of the study site.
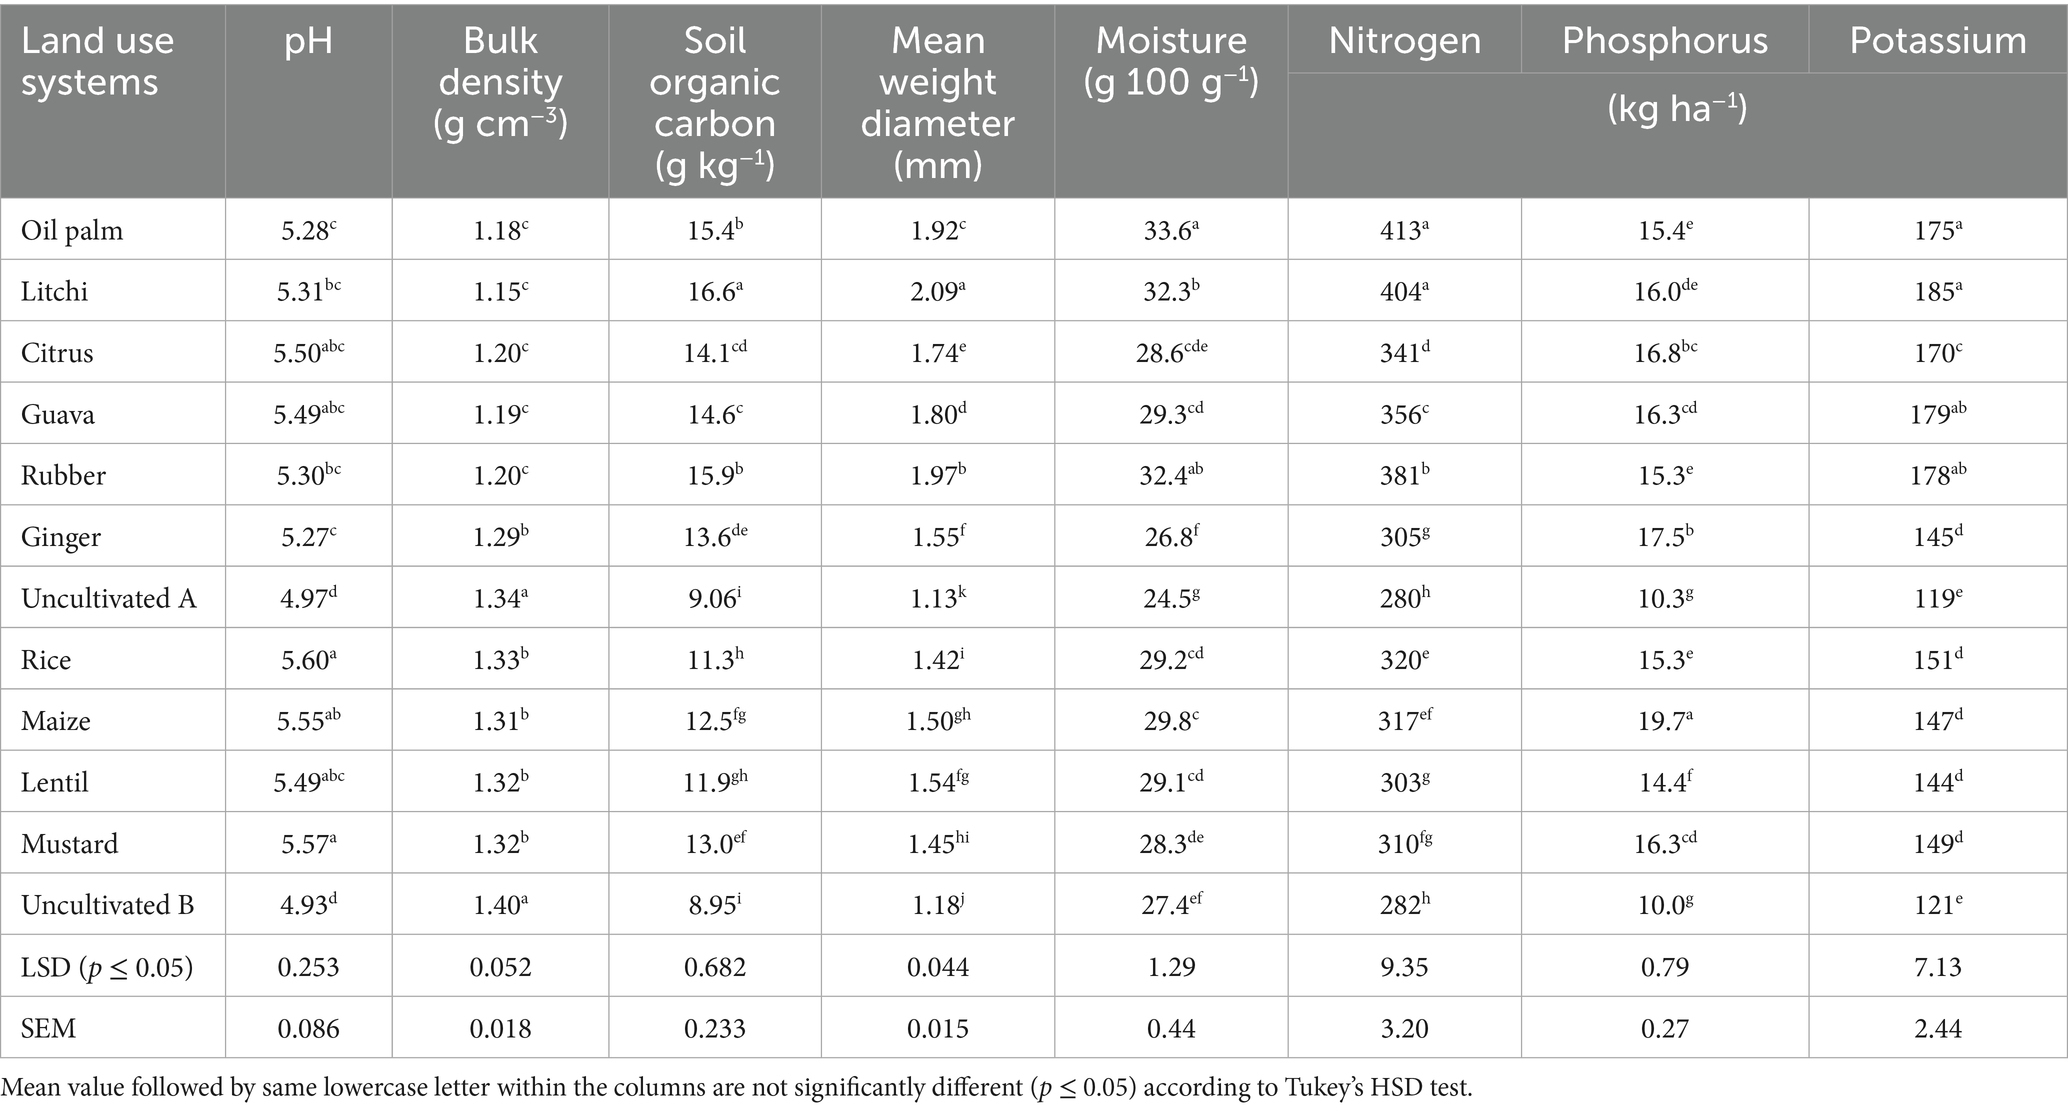
Table 2. Soil physico–chemical properties of different land use systems at 0–15 cm depth.
2.2 Soil sampling
Soil samples were collected following the method described by Dhyani and Tripathi (1999), taken at depth intervals of 0–15, 15–30, 30–60, 60–75, and 75–100 cm with the use of a core sampler. These samples were obtained from each fruit tree block and agricultural block, including the fallow (uncultivated) plot, between October and November 2022. Soil sampling was conducted using a core sampler, and the collected cores were transported to the laboratory, where the soil was carefully extracted. The collected soil was then dried naturally at ambient temperature, pulverized, and sifted through a 2–mm mesh for subsequent testing. To assess the microbial characteristics, portions of each soil sample were extracted and kept at a temperature of 4°C. Following pre incubation, these soil samples were adjusted to 50% of their maximum water holding capacity and used for soil microbial biomass carbon (MBC) estimation.
2.3 Methods of analysis
The physico–chemical properties of the samples were determined using the conventional methods detailed by Jackson (1973). Soil pH (1:2.5) and the contents of available nitrogen (N), phosphorus (P), and potassium (K) were determined using established standard methods, as outlined by Jackson (1973), Subbiah and Asija (1956), Bray and Kurtz (1945), and Hanway and Heidel (1952), respectively. The Microbial biomass carbon was measured using the chloroform fumigation technique outlined by Jenkinson and Powlson (1976). We calculated the MBC/TOC as the ratio of MBC to TOC, expressed as a percentage. The KMnO4 oxidizable carbon (ROC) was determined through oxidation with 333 mM KMnO4, following the method outlined by Blair et al. (1995). TOC was analyzed using dry combustion in a CHNS elemental analyzer (Euro Vector, EA3000). Soil organic carbon stocks (0–100 cm depth) were calculated using the TOC and BD values. The soil BD values were measured by the core method, as described by Allen et al. (1974). The particle size distribution and mean weight diameter were assessed using established techniques (Bouyoucos, 1962; Kemper and Chepil, 1965).
2.4 Carbon management index
In 1995, Blair et al. (1995) proposed the carbon management index (CMI) to assess how land management changes affect SOM relative to a stable reference soil. CMI is calculated using the CPI and the LI. The CMI is calculated as follows:
A. Lability of C (L):
B. Lability index (LI):
C. Carbon pool index (CMI):
D. CMI is calculated using the following formula:
2.5 Carbon stock calculations
To determine carbon stocks, measurements of TOC and bulk density BD were utilized. These estimations covered a soil depth of 100 cm.
Where CTOC is total organic carbon (g kg−1); BD is the bulk density (g cm−3); D is the soil depth (cm).
2.6 Stratification ratios
Stratification ratios were obtained by comparing SOC stocks and fractions between two soil layers: the 0–15 cm layer and the 15–30 cm layer. Specifically, we divided the values from the top layer (0–15 cm) by the values from the layer below (15–30 cm), as described by Franzluebbers and Stuedemann (2002).
2.7 Statistical analyses
A one–way analysis of variance (ANOVA) was employed to compare the impact of various LUSs on soil physicochemical properties (0–15 cm). Two–way ANOVA was used to compare the impact of various LUSs and depth on TOC, ROC, Carbon stocks, including LI, CPI and CMI. All statistical analyses were conducted using R software (Version 2024.12.1 + 563; R Core Team, 2024). Data analysis was performed using the “agricolae” package, while the “metan” package (multi–environment trial analysis) was utilized to create the Pearson’s correlation coefficient matrix.
3 Results
3.1 Soil carbon fractions
The readily oxidizable carbon (ROC) pool in soil is more responsive to management practices compared to recalcitrant carbon pool (non–labile) (Table 3; Figure 2). Readily oxidizable carbon content in litchi was 1.72 g kg−1 followed by rubber (1.67 g kg−1), oil palm (1.56 g kg−1), citrus (1.36 g kg−1) and guava (1.35 g kg−1) which was significantly higher than the uncultivated (A) at 0.69 g kg−1, followed by uncultivated (B) at 0.73 g kg−1. Among the agricultural LUSs, highest mean ROC was observed in lentil LUS (1.30 g kg−1). At the 0–15 cm depth, litchi had the highest ROC content of 2.44 g kg−1, while uncultivated (A) recorded the lowest value at 0.87 g kg−1. Agricultural LUSs recorded the lowest average ROC values compared to tree–based systems. The ROC content generally decreased with increasing depth across all treatments. At the 15–30 cm depth, litchi continued to show the highest value of 2.05 g kg−1. This trend of decreasing ROC content with increasing soil depth was observed across LUSs, with the lowest values found at the 75–100 cm depth. The ROC/TOC ratio with maize, lentil, and mustard showing the highest values, while uncultivated lands recorded the lowest ratio. Rice had a moderately high ratio, whereas oil palm, litchi, citrus, guava, and rubber exhibited similar mid–range values.
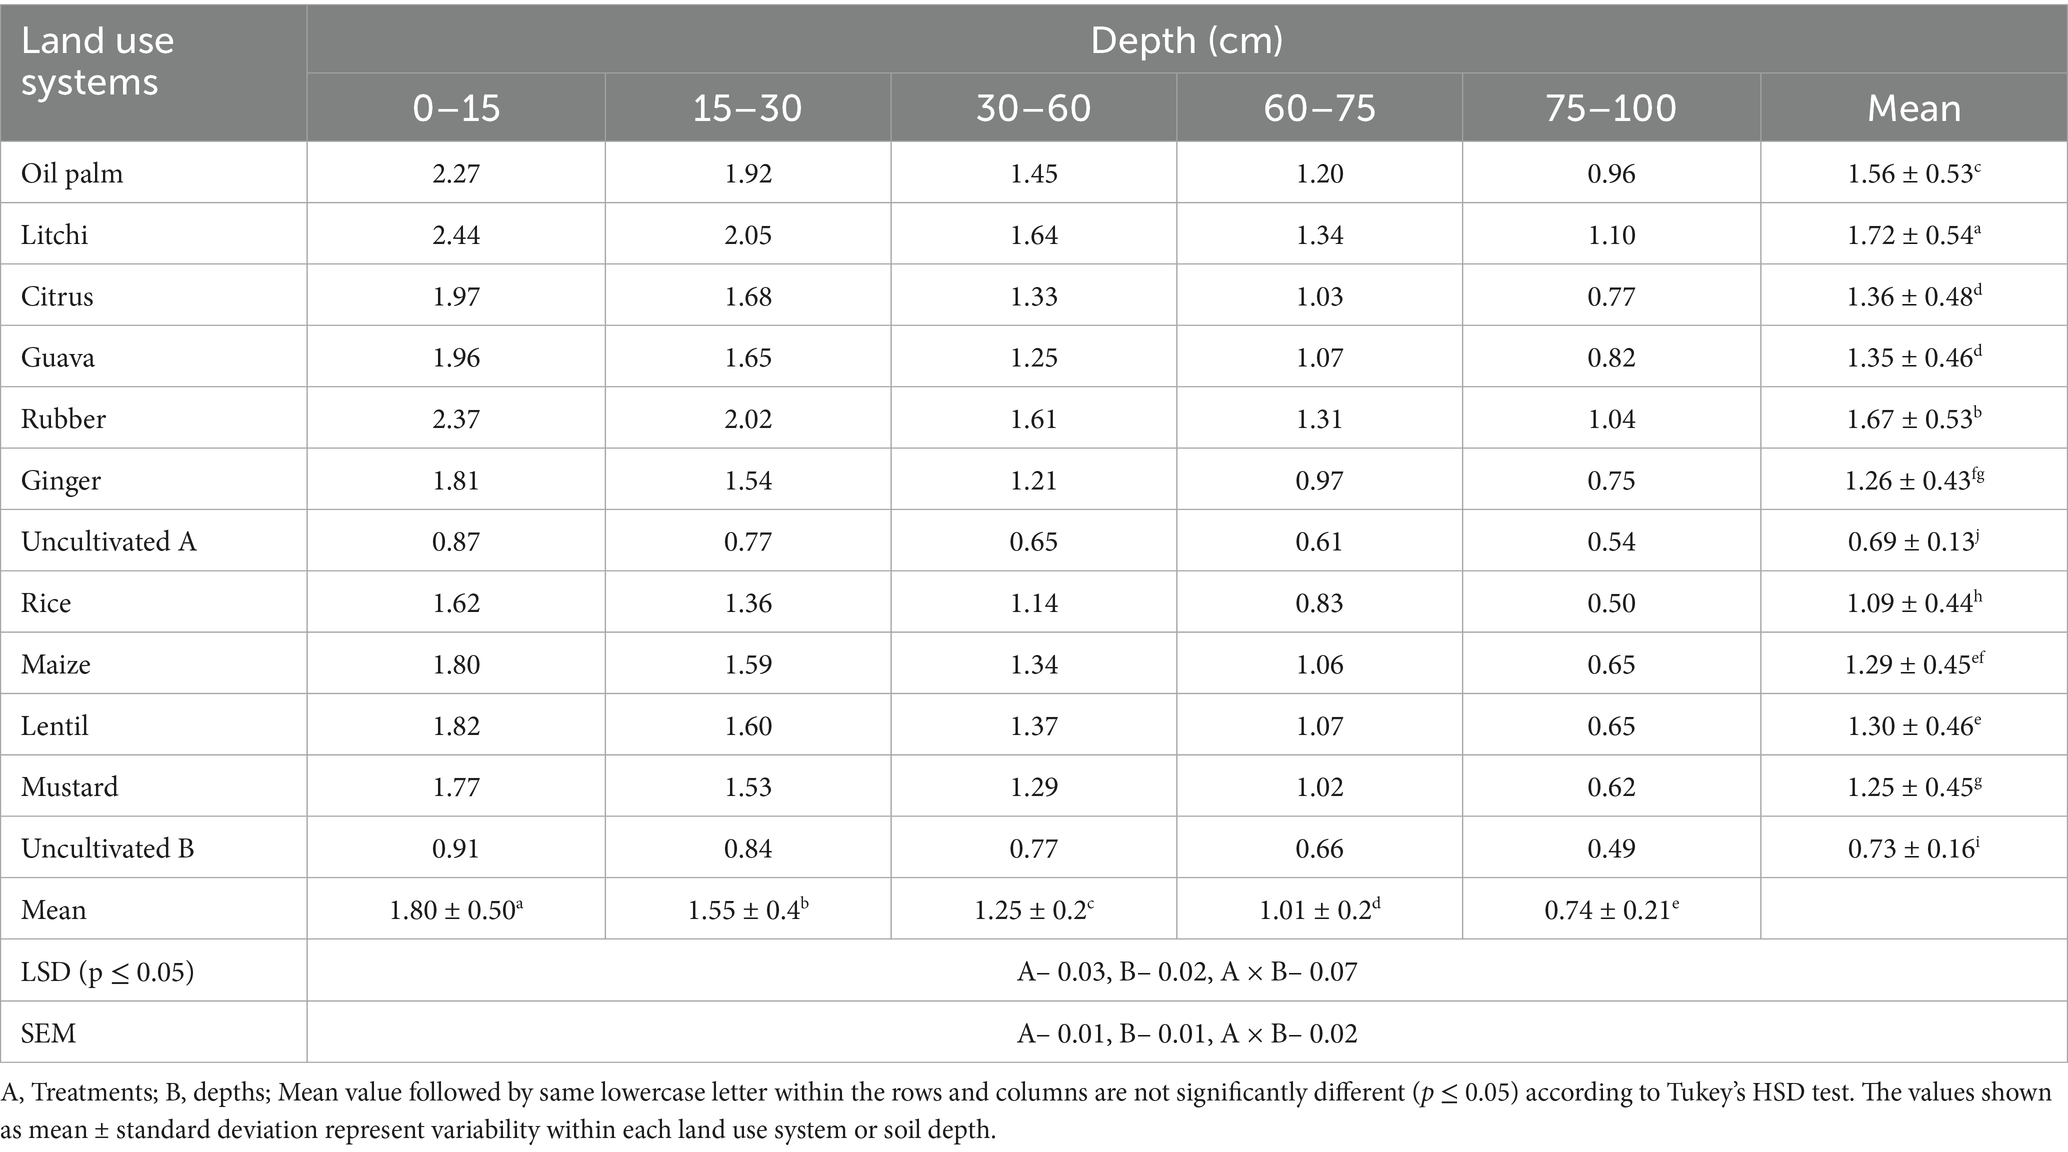
Table 3. Effect of land use systems on ROC (g kg−1) at different soil depths.
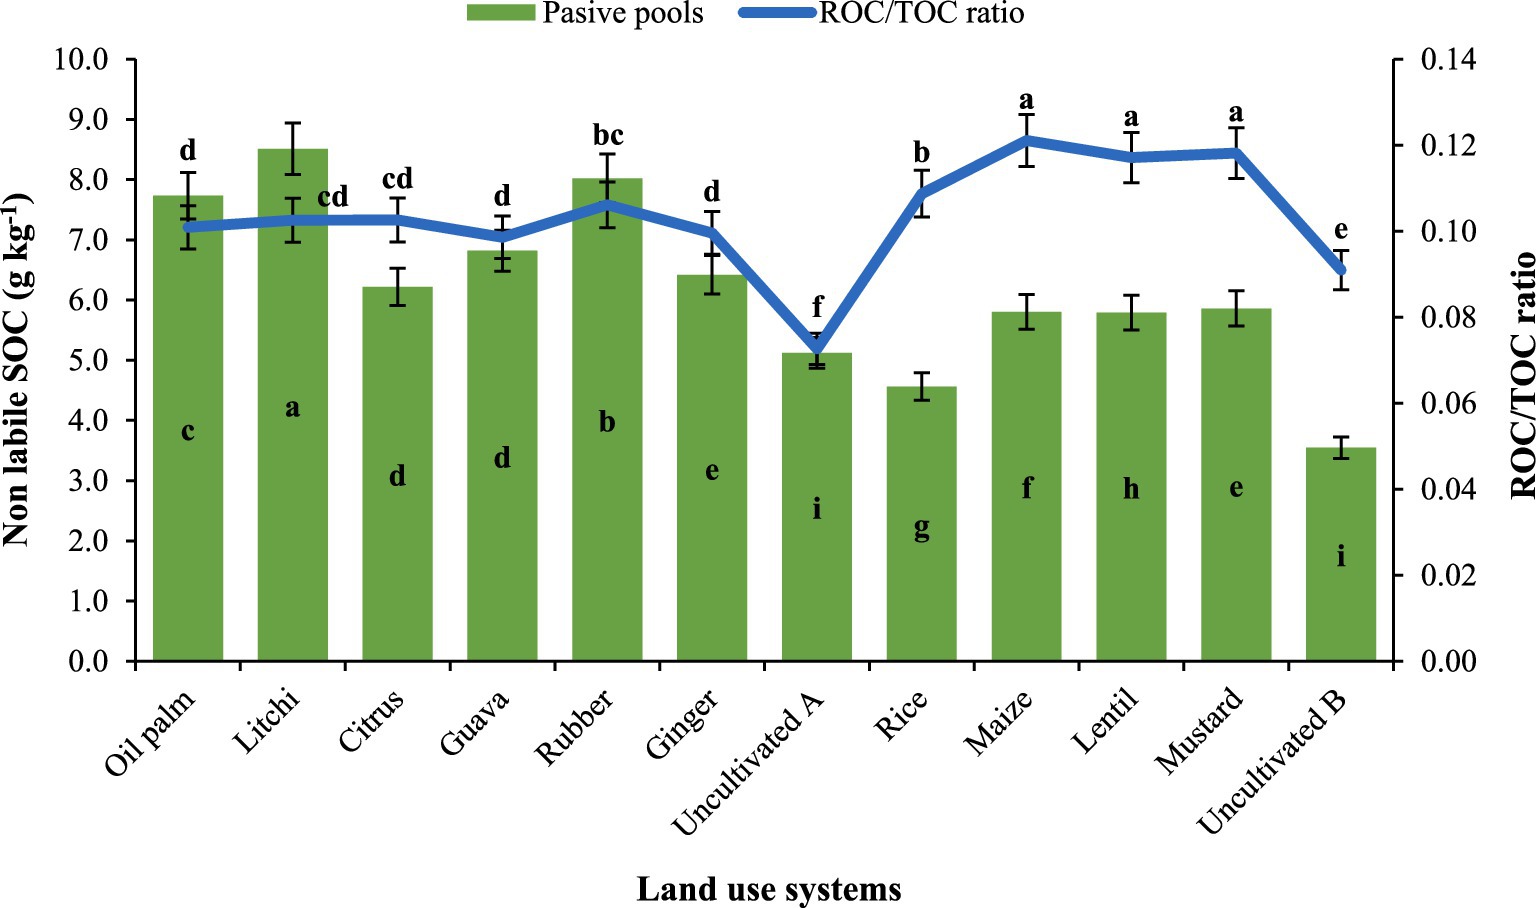
Figure 2. Effect of land use systems on non–labile SOC and ROC to TOC ratio; Mean value followed by same lowercase letter are not significantly different (p ≤ 0.05) according to Tukey’s HSD test.
Horticultural LUSs exhibited higher soil MBC levels compared to uncultivated (fallow) land (Figure 3). The highest MBC values were recorded in litchi (368 mg kg−1), rubber (358 mg kg−1), and oil palm (338 mg kg−1), while the lowest values were observed in uncultivated uses. The microbial quotient (%) ranged from 1.45 to 1.72%, with the highest values observed in guava (1.72%) and rubber (1.70%) and while uncultivated land (1.45%). The results indicate that perennial plantations maintain higher microbial biomass and efficiency compared to uncultivated or annual cropping systems. The MBC exhibited a positive correlation with TOC (Figure 4), indicating that even minor variations in TOC could influence MBC under different land–use practices. The MBC/TOC ratio in soils under horticultural land–use systems was higher compared to agricultural systems (Figure 3).
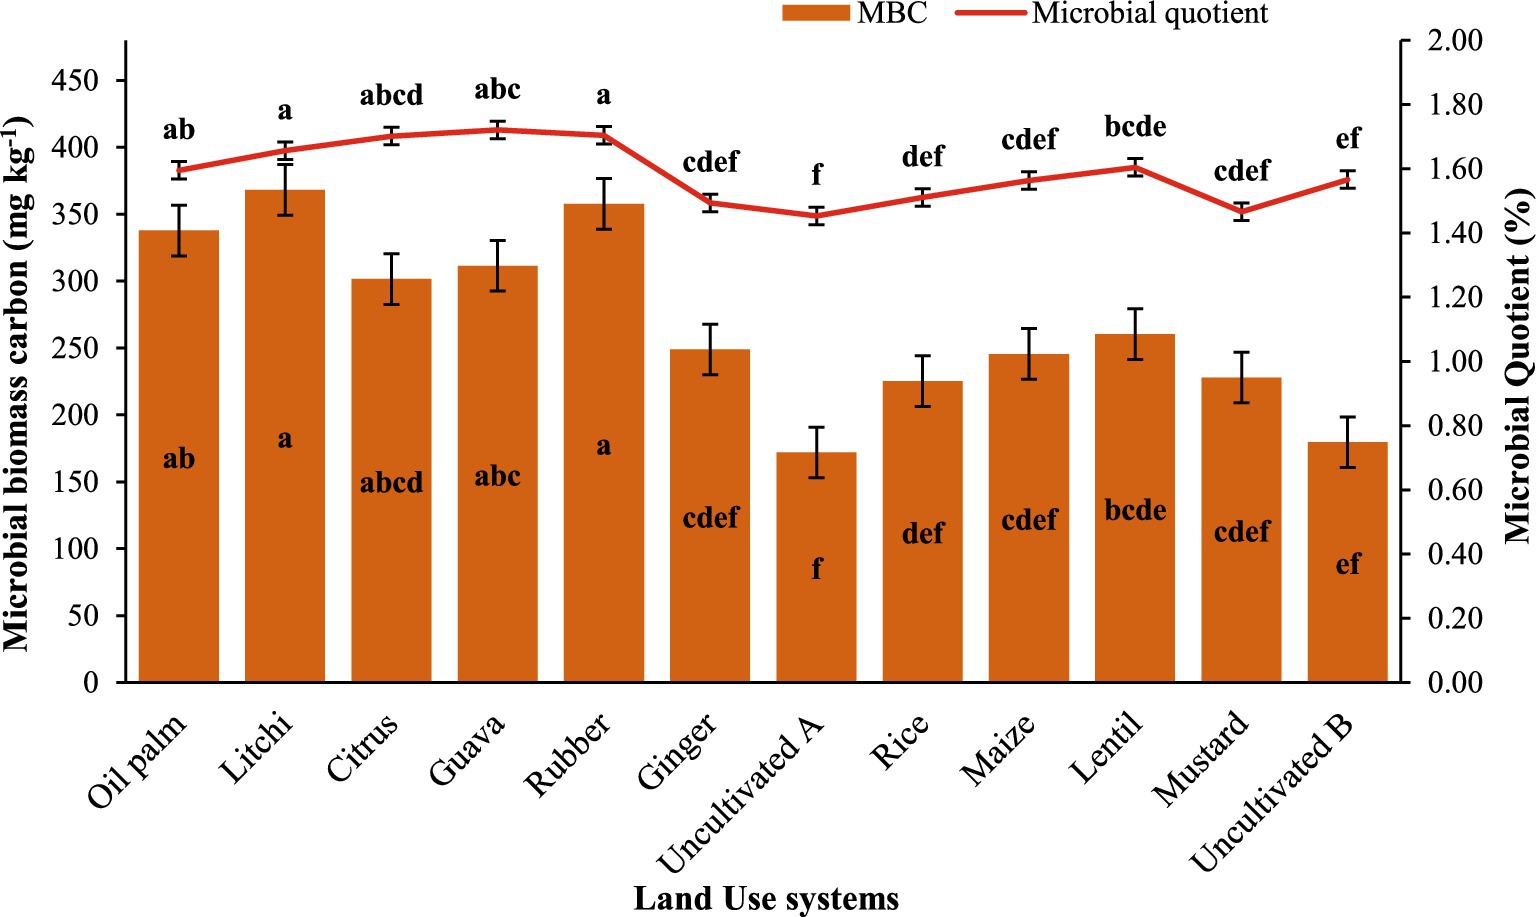
Figure 3. Effect of different land uses on microbial biomass carbon and microbial quotient; mean value followed by same lowercase letter are not significantly different (p ≤ 0.05) according to Tukey’s HSD test. Error bars representing standard error of the mean.
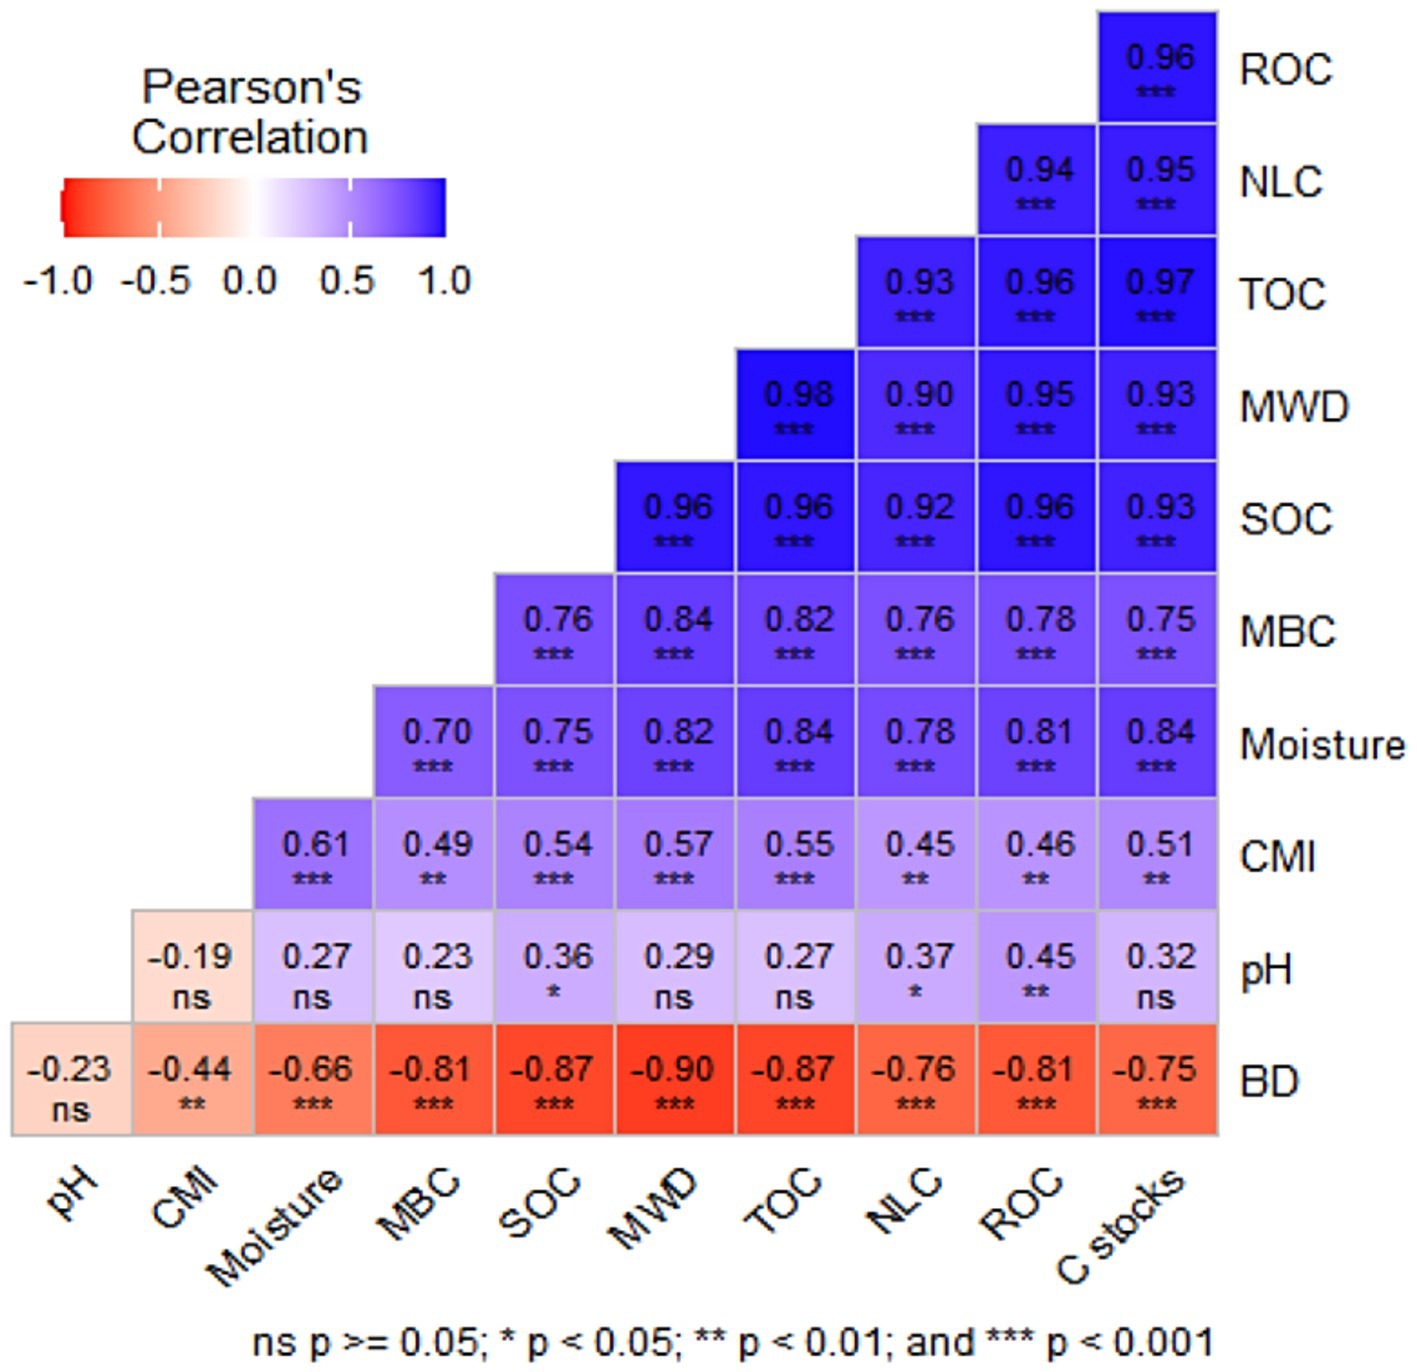
Figure 4. Pearson’s correlation coefficients between various carbon fractions, Carbon stocks, CMI and soil properties. ***Correlation is significant at the p < 0.001 level, **correlation is significant at the p < 0.01 level, and *correlation is significant at the p < 0.05 level. BD, Bulk density; MWD, Mean weight diameter; SOC, Soil organic carbon; TOC, Total organic carbon; ROC, Readily oxidizable carbon; CMI, Carbon management index; MBC, Microbial biomass carbon; C stocks, Carbon stocks; NLC, Non labile carbon.
3.2 Total organic carbon, C stocks and stratification ratios
Table 4 displays the TOC contents across different LUSs and soil depths at the study site. In all examined LUSs, both oxidizable carbon and TOC exhibited a notable decline with increasing soil depth. The highest averaged TOC content of all the depths was observed in litchi at 16.6 g kg−1, followed by rubber at 15.6 g kg−1 and oil palm at 15.3 g kg−1. The lowest TOC content was recorded in the uncultivated A treatment. In all the LUSs, TOC accumulation was greater in the 0–15 cm layer, with a subsequent decrease as soil depth increased. At the 0–15 cm soil depth, litchi exhibited the highest TOC content of 22.2 g kg−1, while uncultivated B had the lowest at 11.5 g kg−1.
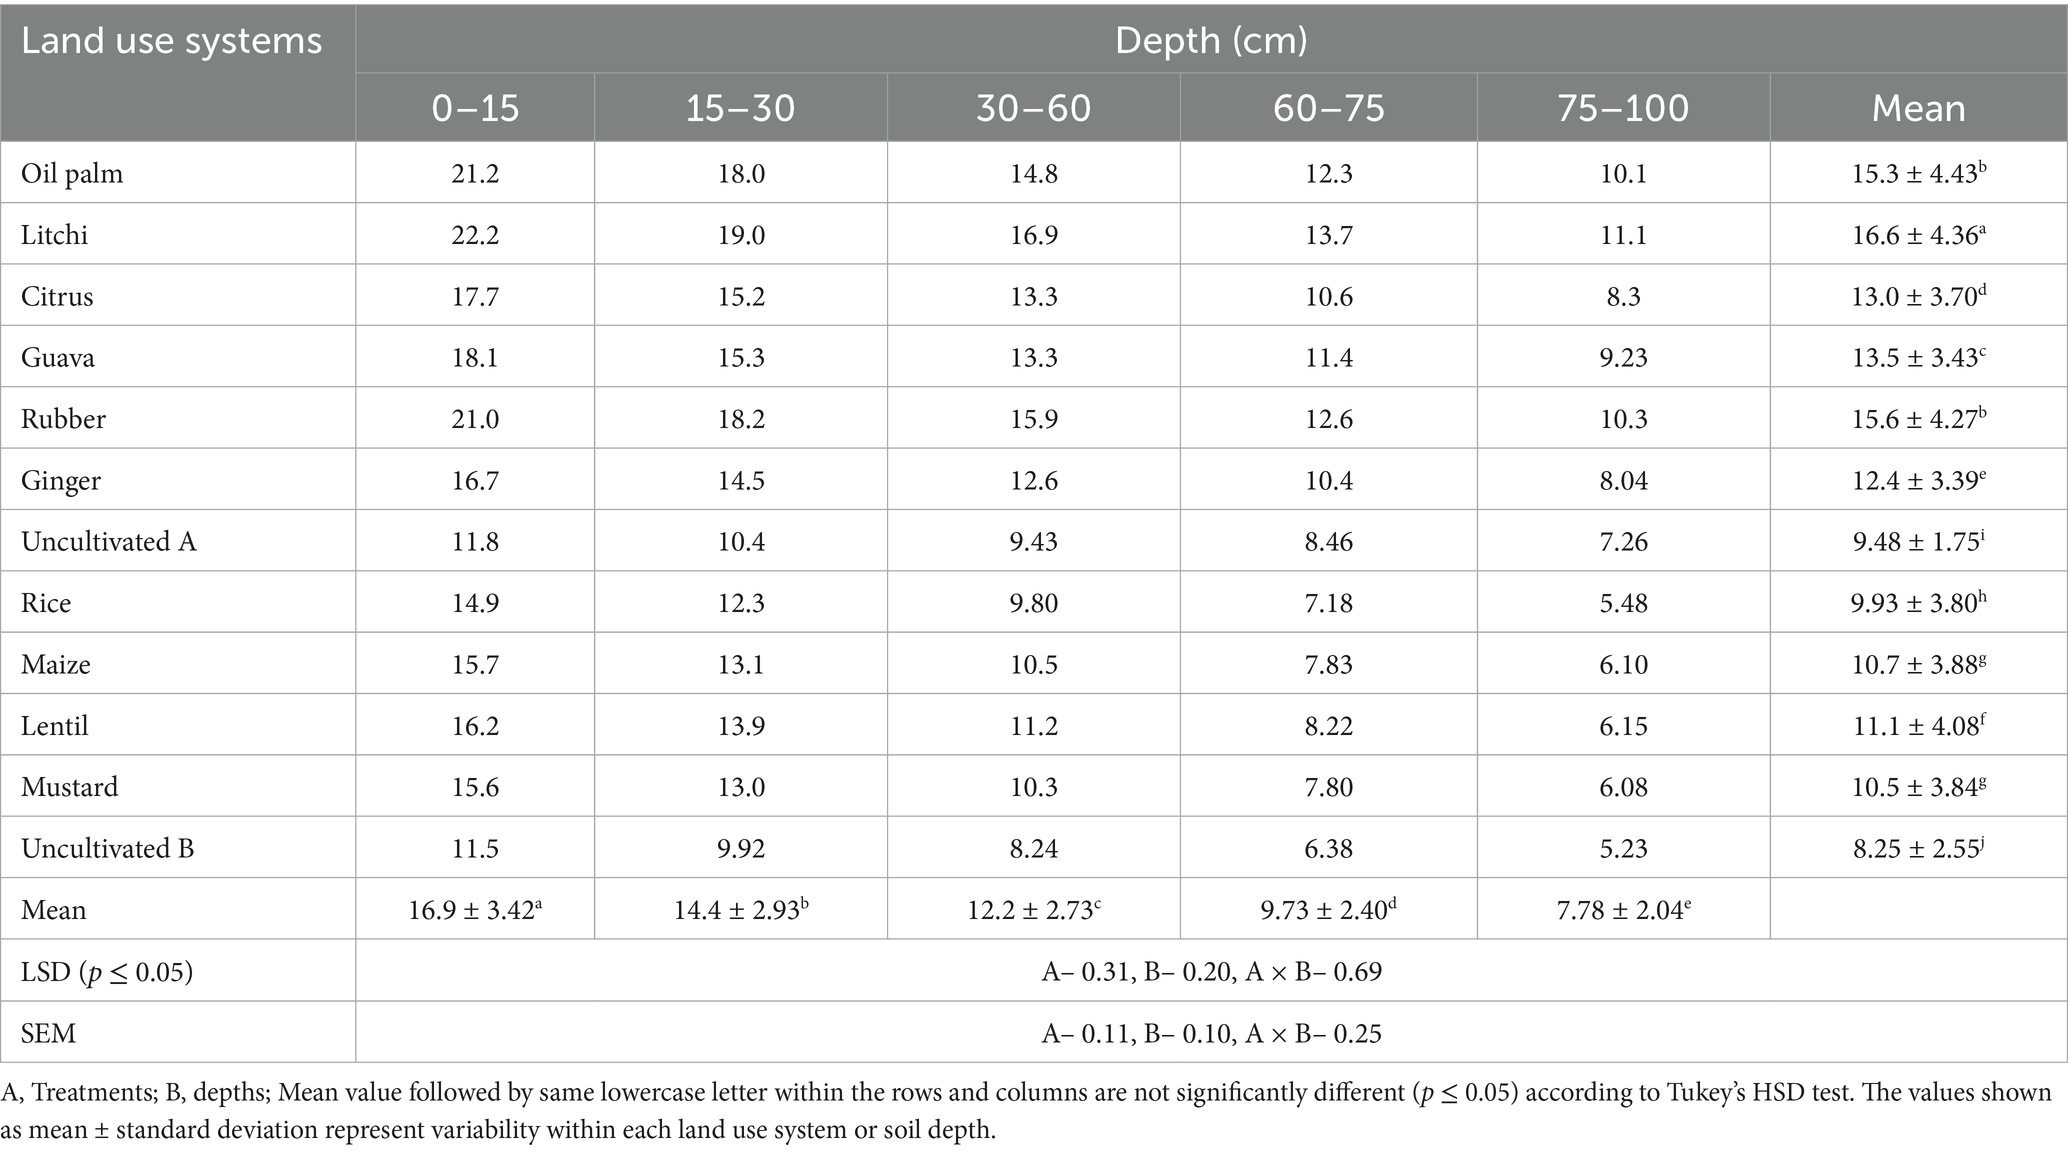
Table 4. Effect of different land use systems on TOC (g kg−1) at different soil depths.
Carbon stocks (Figure 5) showed significant variation due to differences in the TOC content, BD and volume of the soil layer. At 0–15 cm depth, the highest carbon stock is observed in litchi (38.3 Mg ha−1), rubber (37.8 Mg ha−1), and oil palm (37.5 Mg ha−1), followed by guava (32.3 Mg ha−1), citrus (31.9 Mg ha−1), and ginger (32.2 Mg ha−1). The lowest values are recorded in uncultivated A (23.8 Mg ha−1) and uncultivated B (24.1 Mg ha−1). At 15–30 cm depth, litchi (35.1 Mg ha−1), rubber (34.5 Mg ha−1), and oil palm (33.5 Mg ha−1) maintain higher carbon stocks. Moreover, the sampling depths (cm) also affected this variation as the 30–60 cm covered a high volume of soil compared to the other layers (0–15, 15–30, 60–75 and 75–100 cm). As a result, we observed higher SOC stock values in 30–60 cm soil depth. At 30–60 cm depth, the highest values are found in litchi (65.7 Mg ha−1), rubber (62.0 Mg ha−1), and oil palm (57.5 Mg ha−1), while rice (41.7 Mg ha−1), maize (44.3 Mg ha−1), and mustard (43.2 Mg ha−1) show lower stocks. Based on the stratification ratio (SR), approximately half of the TOC and SOC stocks were found within the surface soil layer (0–15 and 0–30 cm) (Figure 6). The SR values for TOC ranged from 1.14 to 1.22, while for SOC stocks, they varied between 1.07 and 1.20. Notably, these values were lower in uncultivated land compared to agricultural and horticultural systems, indicating differences in carbon distribution across land uses.
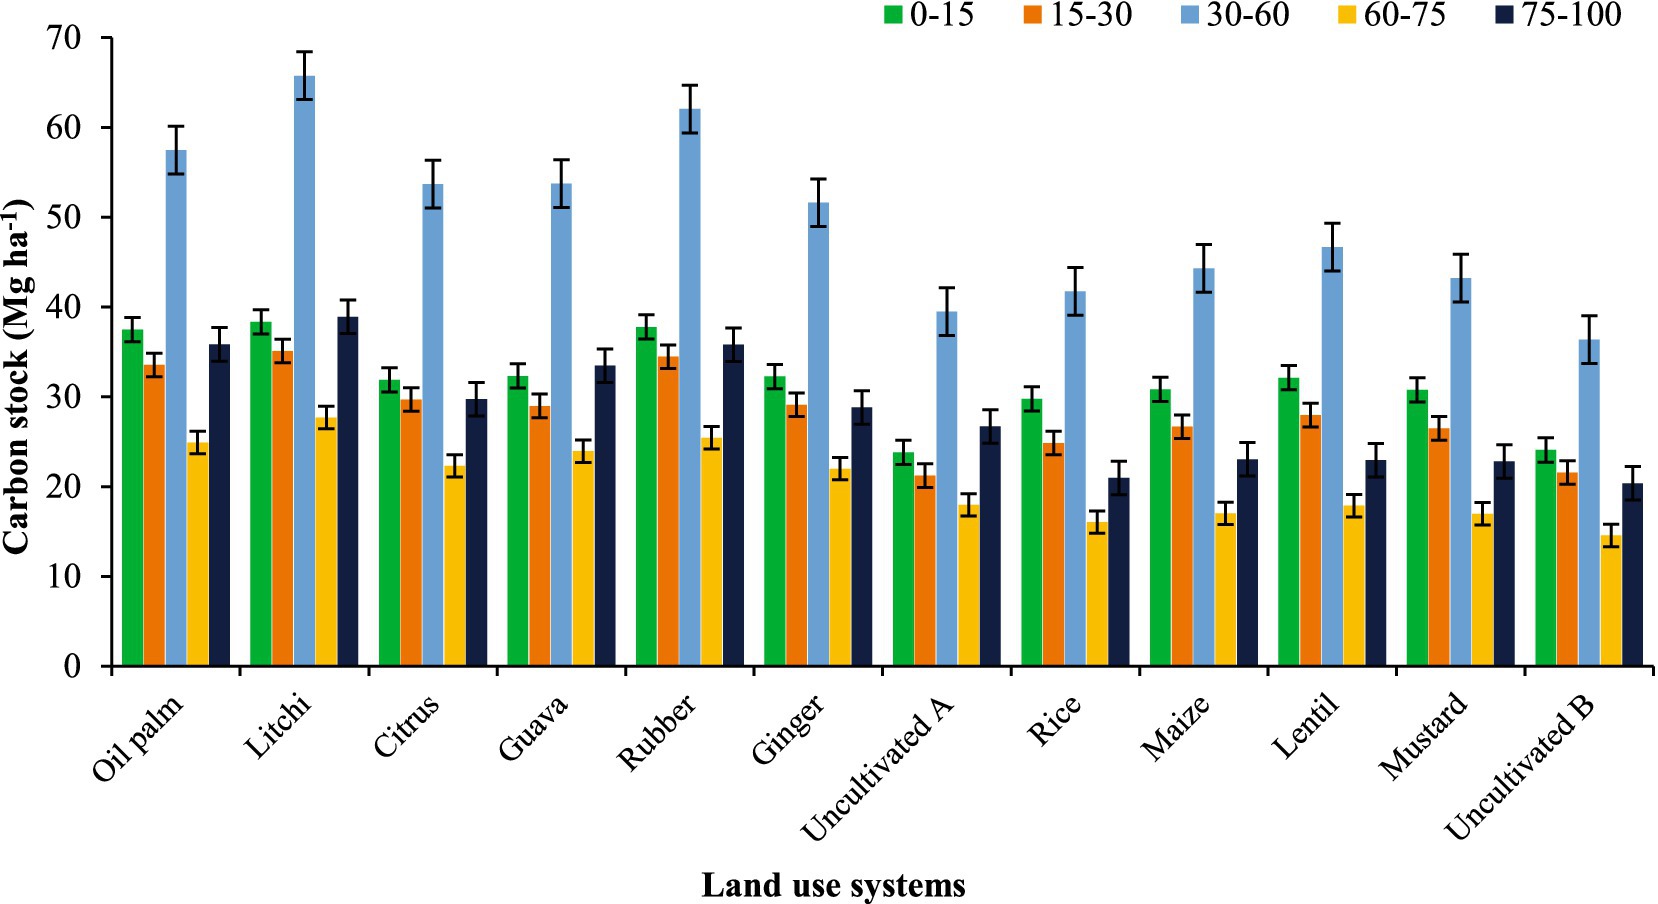
Figure 5. Effect of land use on soil carbon stocks at different depths in Tripura; error bars representing standard error of the mean.
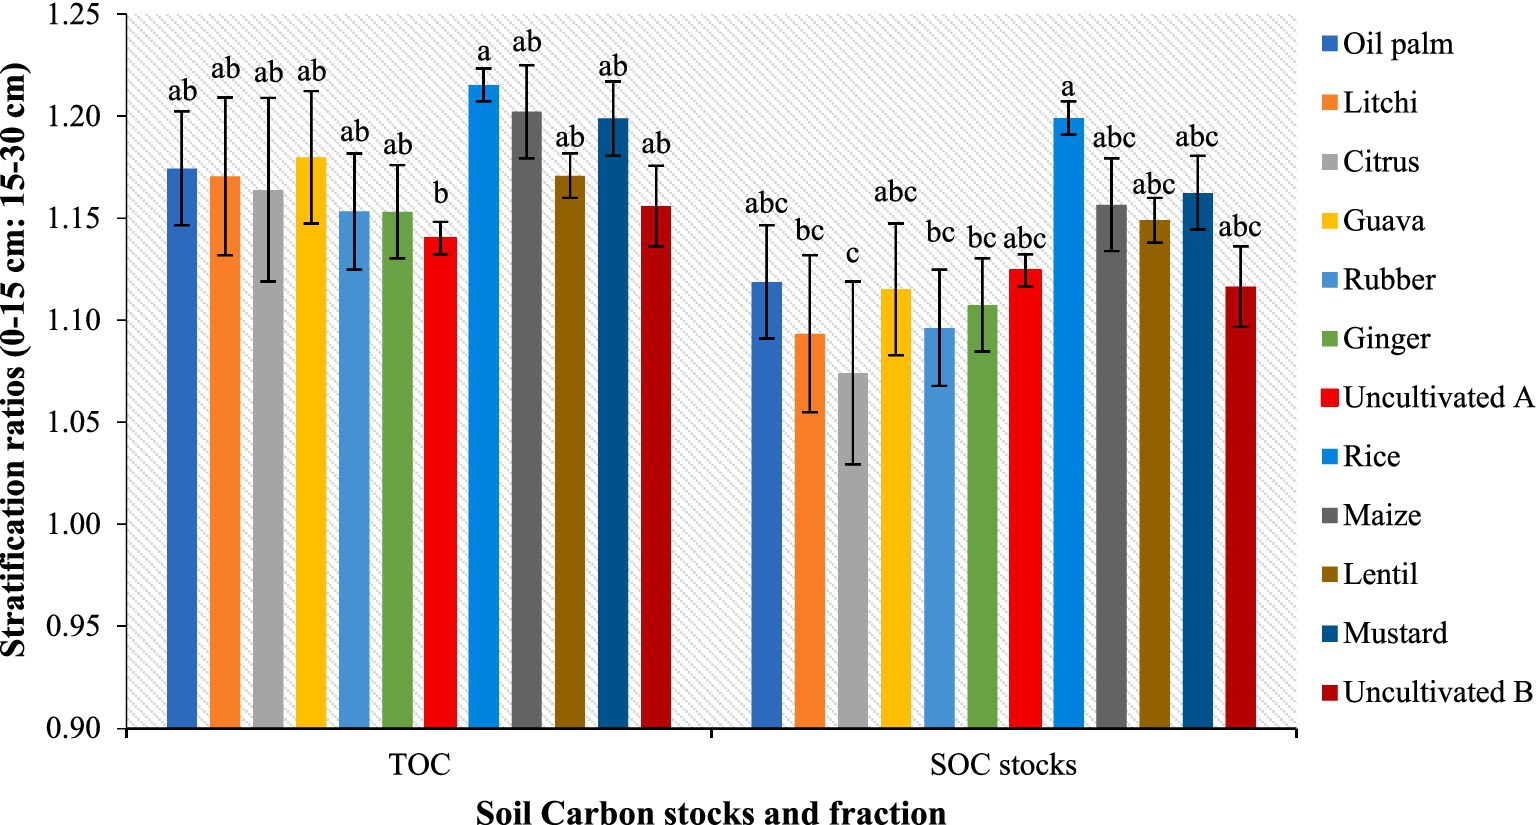
Figure 6. Changes in stratification ratio (0–15 cm: 15–30 cm) for TOC and SOC stocks as affected by different land use systems; mean value followed by same lowercase letter are not significantly different (p ≤ 0.05) according to Tukey’s HSD test; error bars representing standard error of the mean.
3.3 Lability index, carbon pool index and carbon management index
To study the influence of different land uses on the nature of SOC, particularly its lability, the lability index (LI) was computed (Figure 7). Rubber plantation consistently exhibited the highest LI across all depths, with values ranging from 1.54 at 0–15 cm to 1.45 at 75–100 cm. In contrast, rice consistently demonstrated the lowest LI across all depths, ranging from 1.38 at 0–15 cm to 0.98 at 75–100 cm. Other crops such as litchi, citrus, guava, oil palm, ginger, maize, lentil, and mustard showed intermediate LI values. Specifically, litchi ranged from 1.50 to 1.33, citrus from 1.52 to 1.25, guava from 1.48 to 1.18, oil palm from 1.47 to 1.27, ginger from 1.49 to 1.25, maize from 1.45 to 1.14, lentil from 1.41 to 1.13, and mustard from 1.44 to 1.10. Across all systems, the LI generally showed a decreasing trend with increasing soil depth.
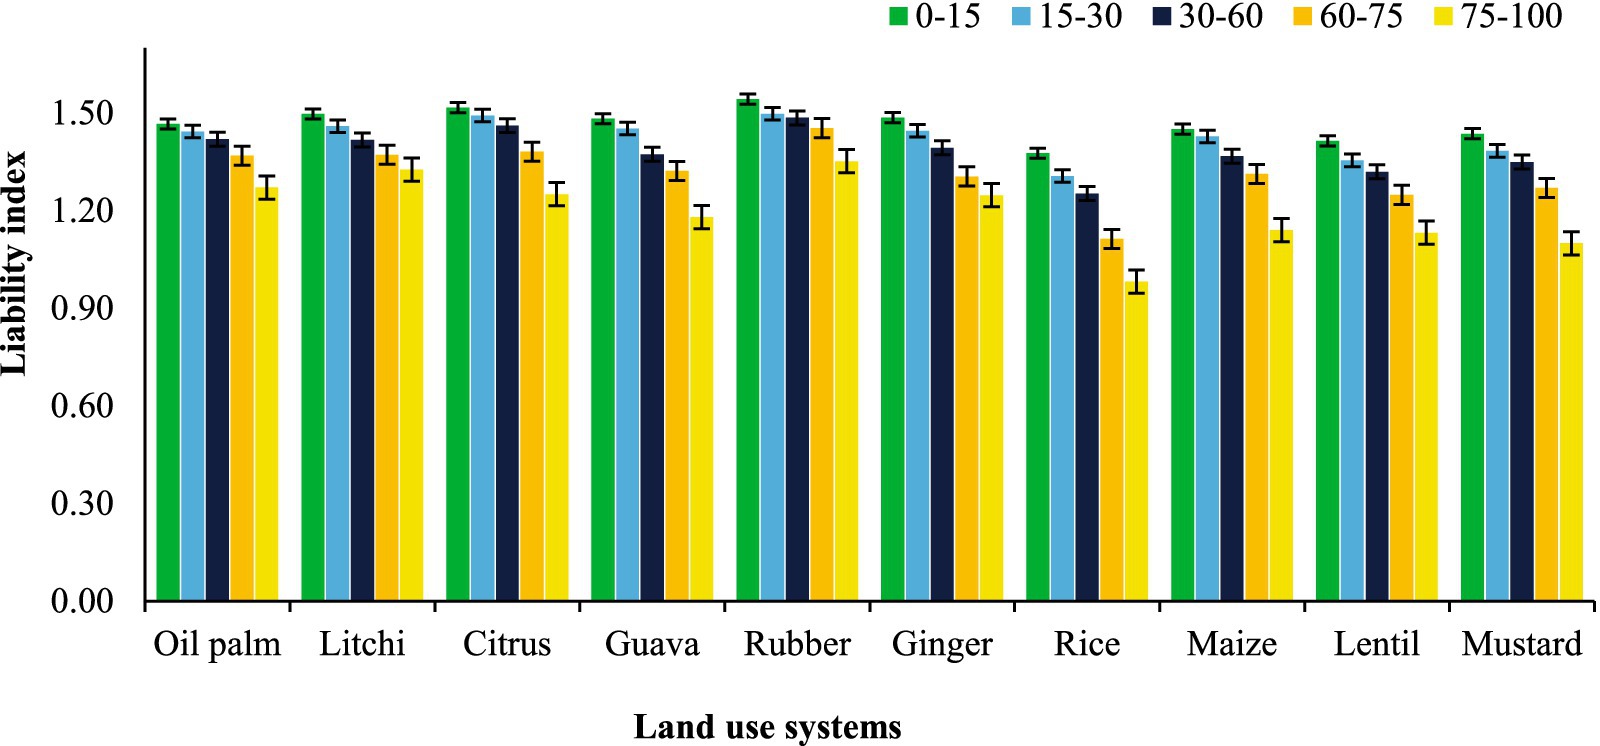
Figure 7. Effect of land use systems on lability index at different soil depths in Tripura; error bars representing standard error of the mean.
Among the land use systems, litchi recorded the highest mean carbon pool index (CPI) across all depths (1.73), significantly greater than all other treatments (Figure 8). This was followed by rubber (1.62) and oil palm (1.59), indicating their relatively higher capacity to enhance soil carbon pools. Mustard showed moderate CPI values, while the lowest mean CPI was observed in rice (1.18), suggesting a limited contribution to carbon sequestration. CPI values consistently decreased with increasing soil depth, with the highest at 0–15 cm, followed by 15–30 cm, 30–60 cm, and the lowest at 75–100 cm (1.24), reflecting the reduced influence of surface land use practices in deeper soil layers. A significant interaction (A × B) between land–use systems and soil depths revealed differential CPI responses across profiles, with litchi maintaining higher CPI at all depths, while rice and ginger exhibited lower values.
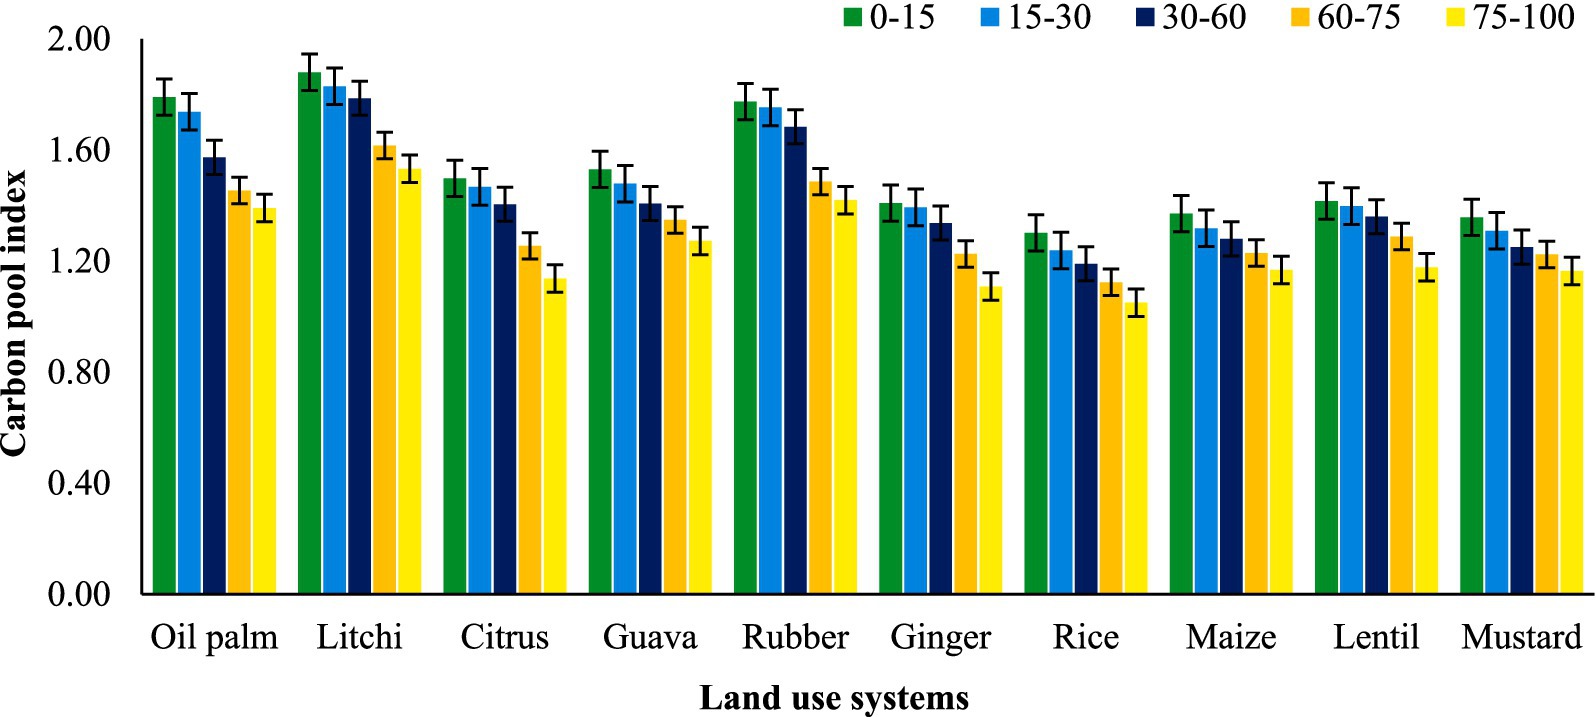
Figure 8. Effect of land use systems on carbon pool index at different soil depths in Tripura; error bars representing standard error of the mean.
The carbon management index (CMI) was significantly influenced by land–use systems, soil depths, and their interaction (Table 5). Among the land–use systems, litchi recorded the highest mean CMI value (245), followed by rubber (238) and oil palm (222). In contrast, rice showed the lowest mean CMI (143), indicating limited carbon management. Ginger and lentil also exhibited relatively low CMI values of 179 and 173, respectively, while guava and mustard showed moderate values of 192 and 165. CMI values exhibited a consistent decline with increasing soil depth: 225 at 0–15 cm, 213 at 15–30 cm, 198 at 30–60 cm, 174 at 60–75 cm, and 150 at 75–100 cm. Tree–based land use systems consistently displayed higher CMI values than agricultural systems, though all remained above 100, reflecting their potential in improving soil quality and carbon stabilization.
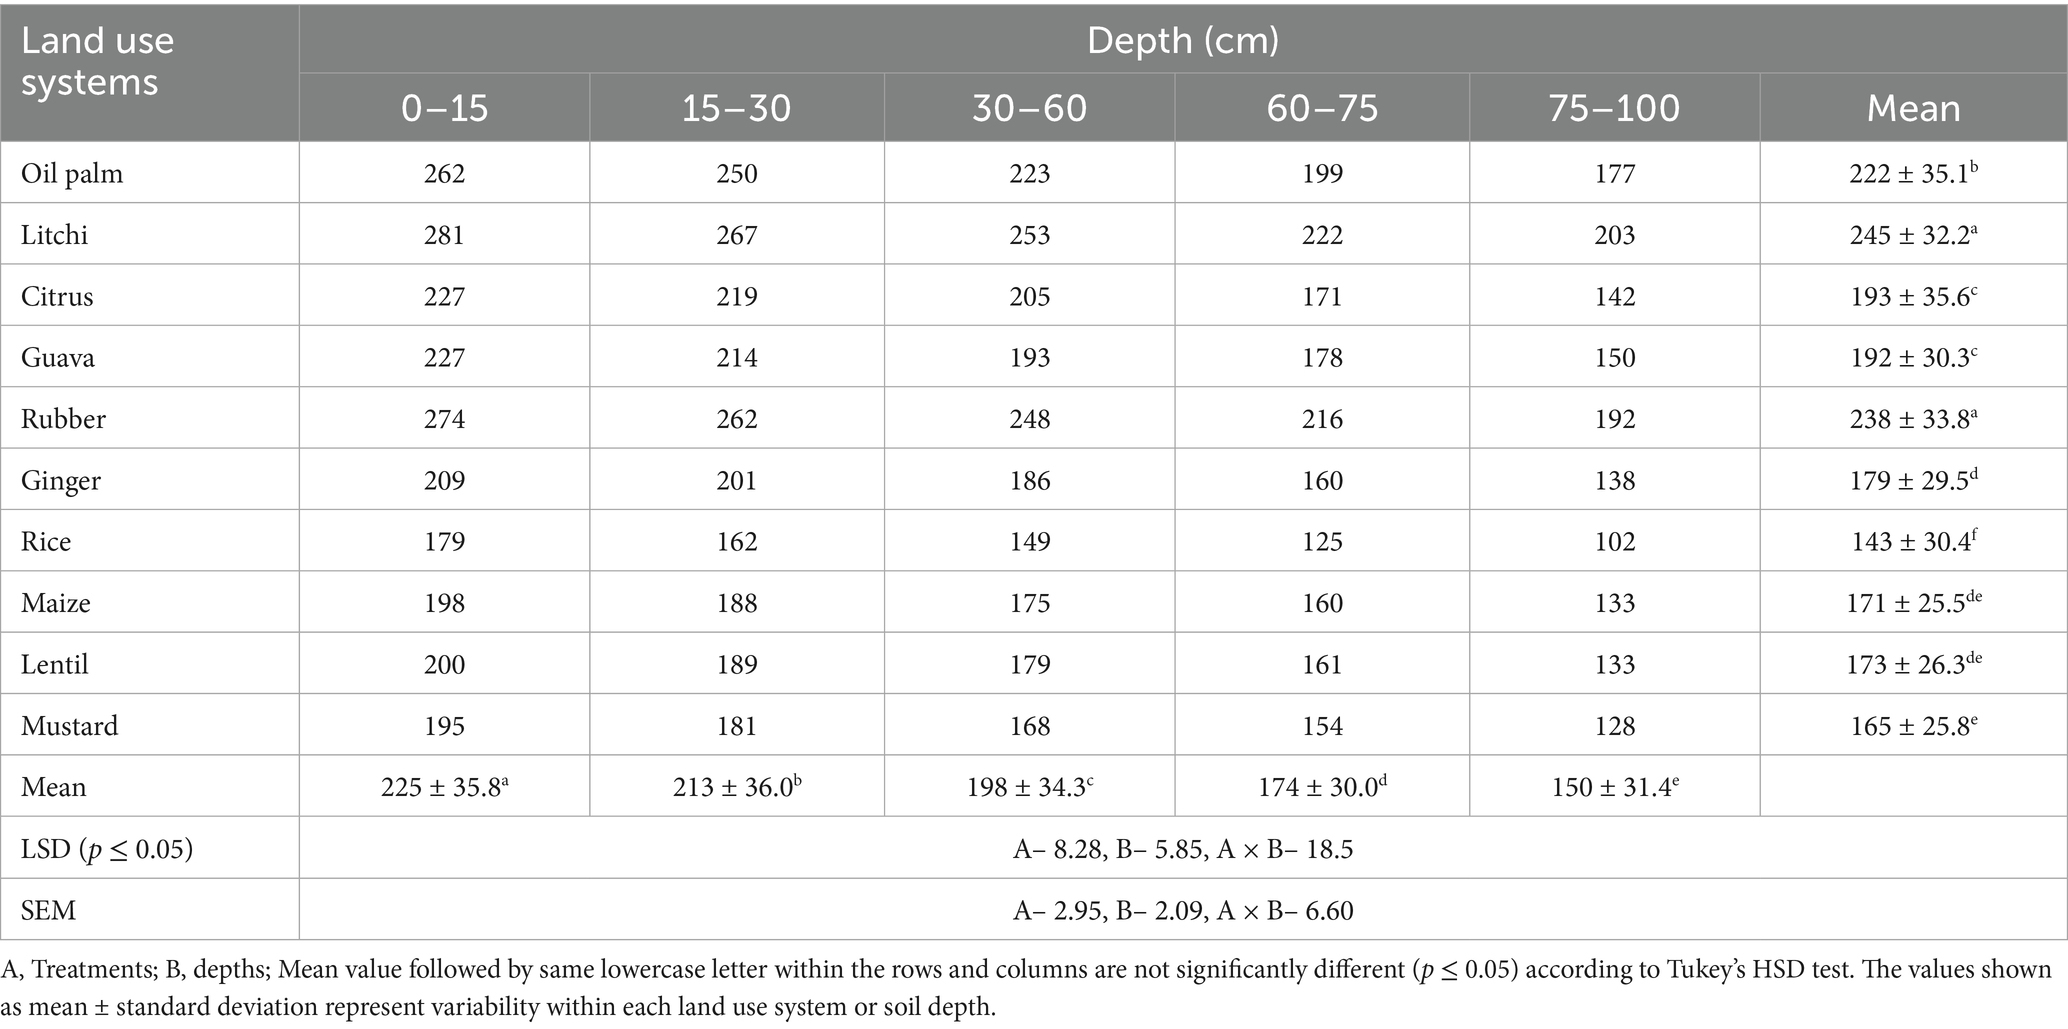
Table 5. Effect of land use systems on carbon management index at different soil depths.
3.4 Pearson correlation coefficients between various parameters
The Pearson’s correlation coefficients reveal (Figure 4) significant interrelationships among SOC, MWD, TOC, non-labile carbon (NLC), ROC, and C stocks, with coefficients ranging from 0.92 to 0.98 (p < 0.001). This suggests a robust, integrated carbon storage system where MWD and TOC support stable NLC and labile ROC fractions, enhancing C stocks. Moisture is identified as a key driver, exhibiting strong positive correlations with MBC (0.70, ***), SOC (0.75, ***), MWD (0.82, ***), TOC (0.84, ***), NLC (0.78, ***), ROC (0.81, ***), and C stocks (0.84, ***), underscoring its role in sustaining carbon pools. MBC further supports SOC (0.76, ***), MWD (0.84, ***), and other fractions, emphasizing microbial activity’s contribution. Bulk density shows negative correlations (−0.66 to −0.90, −) with carbon parameters, suggesting that soil compaction may impede carbon retention. pH displays weak, variable effects (0.23–0.45, ns-*), while CMI (0.45–0.61, −) is posited to enhance carbon management across the system. Readily oxidizable carbon and TOC exhibit a very strong positive correlation (Pearson’s coefficient = 0.97***), indicating their close association within the soil carbon pool (Figure 4).
4 Discussion
4.1 Effect of land use systems on soil carbon fractions
In this study, the readily oxidizable carbon (ROC) pool showed greater responsiveness to management practices compared to the recalcitrant carbon pool (non-labile). Higher SOC levels in certain systems may be attributed to increased litter biomass on the soil surface and reduced oxidation in less disturbed soils (Pradeepa et al., 2018). Agricultural systems recorded the lowest average ROC values, primarily due to limited organic inputs from practices like crop residue removal, inadequate biomass incorporation, and conventional tillage (Wang et al., 2017; Thangavel et al., 2018; Pradeepa et al., 2018). Nutrient management treatments significantly impacted ROC levels within a short period, underlining the importance of proper nutrient management in maintaining soil carbon stocks. The correlation between ROC and TOC revealed a positive relationship, indicating their close association in the soil carbon pool. Land use type also plays a critical role, with forest systems contributing the largest carbon pools. As expected, plantation soils exhibited higher ROC levels due to higher organic inputs from tree litter and reduced disturbance. The mobilization and redistribution of soil organic components determine the qualitative and quantitative characteristics of SOM, emphasizing the influence of land use and management practices on soil carbon dynamics.
In tropical and subtropical soils, soil MBC is crucial as a readily available nutrient source for plants (Farooq et al., 2022). Horticultural LUSs exhibited higher soil MBC levels compared to uncultivated (fallow) land. It indicates that perennial plantations maintain higher microbial biomass and efficiency compared to uncultivated or annual cropping systems. The fluctuation and abundance of microbial populations beneath trees are influenced by litter quality, nutrient availability, and alterations in soil properties (Ramesh et al., 2013; Liu et al., 2021). Trees play a crucial role in maintaining favorable environmental conditions, such as higher moisture content and improved physical attributes. However, guava and citrus exhibited the lowest soil MBC among the studied tree plantations, likely due to limited carbon availability when compared to other plantations. As expected, the uncultivated soil showed minimal microbial activity, emphasizing the direct correlation between lower carbon input and reduced microbial presence (Thangavel et al., 2018). The higher MBC observed in orchards was attributed to increased soil moisture, nutrient availability, and SOC levels. Similarly, Li et al. (2021) observed that MBC is directly proportional to SOC amount across various agroecosystems. Shah et al. (2024) also emphasized that soil MBC demonstrated a significantly positive correlation with soil moisture, a trend that aligns with the findings of this study.
Variations in the microbial quotient (MBC/TOC ratio) reflect the input of organic matter into the soil, the efficiency of microbial integration, soil carbon losses, and the stabilization of organic carbon by soil minerals (Sparling, 1992). Soils exhibiting higher MBC/TOC values indicate improved quality. The greater MBC in horticultural soils could be a key factor contributing to the increased microbial quotient, indicating higher organic matter inputs and greater availability of SOM for microbial activity (Araujo et al., 2020; Yan et al., 2022; Ding et al., 2024). The MBC/TOC ratio remains unstable over time and is largely influenced by organic matter inputs (Anderson and Domsch, 1989). Moreover, this ratio tends to increase as SOM decomposes under microbial activity (Bohme and Bohme, 2006). Additionally, the microbial quotient is strongly influenced by carbon inputs from the rhizosphere, land use changes, and microbial biomass content (Lv et al., 2023).
4.2 Effect of land use systems on carbon stocks and carbon stratification
Soil management practices and land use patterns play a crucial role in shaping SOC dynamics and the carbon flux from soil (Ahirwal et al., 2021; Swamy et al., 2023; Wang et al., 2023). In all examined LUSs, both oxidizable carbon and TOC exhibited a notable decline with increasing soil depth, likely attributable to reduced surface litter contributions in deeper layers (Jobbagy and Jackson, 2000; Meena et al., 2018). However, soil TOC content is highly dependent on both plant productivity and the amount of litter inputs (Cui et al., 2022; Manici et al., 2024). There is a clear link between SOC and TOC, indicating that they increase and decrease together. This insight helps us better understand soil carbon dynamics. Higher SOC in perennial crops was might be due to accumulation of leaf litter, root exudates and tree root biomass; poplar trees on an average add 3.5 Mg ha−1 of leaf litter to the soil every year (Ralhan et al., 1996). Along with tree components, straw biomass from intercrops also adds some organic matter which forms the soil carbon (Marone et al., 2017). This decline in SOC (at lower depth) under agricultural LUSs based on crops like maize could be due to low root to shoot ratio as well as relatively shallow rooting depth (Zhao et al., 2018). The elevated TOC content in forestry and horticulture soils could be attributed to substantial yearly inputs of organic matter through leaf fall (Jangir et al., 2024), extensive biomass of root, and tree rhizodeposition (Li et al., 2024). It was thought that the bare soil and the breaking up of soil clumps due to the lack of vegetation, along with more erosion on slopes with heavy rainfall, might be the reasons f or the lowest TOC content in the control plot (Ramesh et al., 2015).
Carbon stock showed significant variation due to differences in the TOC content, BD and volume of the soil layer. At 15–30 cm depth, litchi, rubber, and oil palm maintain higher carbon stocks, due to the higher fresh or new carbon supply from the upper soil layer (Fontaine et al., 2007). Moreover, the sampling depths also affected this variation as the 30–60 cm covered a high volume of soil compared to the other. The correlation analysis (Figure 4) highlights a strong positive relationship between non–labile carbon and carbon stocks (dark blue, highly significant), indicating that as NLC increases, C stocks also rise significantly. The increased resistance of SOC to oxidation in deeper (lower) soil layers suggests a longer turnover time for SOC in sub–surface horizons (Gaudinski et al., 2000). Greater inputs of lignin and lipids from root litter likely enhanced the resistance of SOC in deeper soil horizons. Forests, above–ground inputs primarily comprise leaf and needle litter, with additional contributions from branches, bark, and fruits to the overall litter fall (Lorenz and Lal, 2005). In short, plantation crops showed a healthier carbon sink in the 0–100 cm depth compared to the control, indicating their potential for carbon sequestration. The type and amount of root exudates, along with the quality of plant and root litter (such as lignin and polyphenol content), influence the decomposition rate and SOC accumulation at different depths under various LUSs (Lal, 2009). A significant portion of carbon exists in stable forms (TOC–MBC–ROC), which are less susceptible to decomposition and crucial for long–term carbon storage, especially in tree–based systems. Tree species contribute to erosion control, organic matter accumulation, and improved nutrient cycling (Thangavel et al., 2018), thereby influencing TOC and SOC variations across soil depths. Additionally, root–derived compounds such as lignin and polyphenols play key roles in organic matter decomposition (Lal, 2009; Srinivasan et al., 2012). Studies have shown that undisturbed surface soils create favorable conditions for organic matter decomposition, leading to higher SOM accumulation (Leul et al., 2023). Variations in stratification ratios across SOC pools also highlight their interdependent nature (Franzluebbers and Stuedemann, 2002; Kurganova et al., 2021).
4.3 Effect of land use systems on carbon management index
The observed decline in lability index (LI) with depth is likely due to the decreasing availability of labile carbon and the relative increase in more stable, recalcitrant carbon fractions in deeper soil layers (Liu et al., 2022). The higher LI values in cultivated soils, particularly in upper horizons, may be attributed to the decomposition of surface leaf litter, which produces dissolved organic matter that is then transported downslope through erosion and runoff (Reza et al., 2020). Interestingly, soils under litchi plantations exhibited a relatively stable LI across depths, which could be due to the continuous input of easily decomposable organic matter from litchi leaf litter (Lorenz and Lal, 2005). These findings highlight the role of vegetation type and land use in influencing the lability of SOC through variations in litter quality and soil management practices. Higher CPI values are indicative of greater SOC accumulation, which is associated with increased carbon inputs and reduced disturbance (Parihar et al., 2018). Land use systems like litchi, rubber, and oil palm likely contribute more organic matter (e.g., leaf litter, root biomass), promoting SOC buildup. Conversely, the lower CPI observed under rice and ginger may be due to factors such as residue removal, intensive tillage, or shorter rooting systems. According to Lal (2018), both carbon input levels and mineralization rates critically influence SOC dynamics. Moreover, conservation agriculture practices enhance carbon stabilization through the formation of soil aggregates, which physically protect SOC from microbial decomposition (Six et al., 2000). These findings underscore the importance of integrating land use strategies that minimize soil disturbance and maximize organic matter return for sustained carbon sequestration.
The high carbon management index (CMI) values under litchi, rubber, and oil palm suggest enhanced carbon inputs and a faster decomposition rate of organic residues, likely due to better litter quality and below–ground biomass dynamics (Table 5). In contrast, the lower CMI observed in rice, ginger, and lentil points to reduced organic matter input and possibly higher disturbance levels. Studies by Zhang et al. (2021) and Murindangabo et al. (2023) have shown that CMI, when combined with SOM lability indicators, offers a more sensitive tool for detecting changes in SOM status than total carbon stocks alone. Additionally, the decline in CMI with depth aligns with reduced root activity and organic matter input in subsoil layers. Positive correlations between CMI and carbon–related variables (Figure 4) further suggest that CMI is governed not only by the quantity of organic matter but also by its quality—including factors like the C/N ratio and chemical characteristics—which influence SOM lability and stabilization (Thangavel et al., 2018).
5 Conclusion
This study highlights the profound impact of various land use systems (LUSs) on soil organic carbon (SOC) dynamics in Tripura’s Northeast Hill region. Horticultural lands like litchi, rubber, and oil palm stored more SOC, with litchi having the highest average total organic carbon, SOC stock, and carbon management index (CMI). These outperformed agricultural LUSs like rice followed by mustard which recorded the lower CMI and limited carbon sequestration. Labile SOC fractions, such as readily oxidizable carbon (ROC) and lability index, were highly sensitive to land use, decreasing with depth across all systems due to reduced organic inputs and microbial activity. Horticultural systems, benefiting from greater litter, root biomass, and minimal disturbance, exhibited higher SOC accumulation and MBC, with litchi peaking at 368 mg kg−1. The microbial quotient ranged from 1.45% in uncultivated lands to 1.72% in guava, reflecting enhanced microbial efficiency in tree–based systems. The carbon pool index (highest in litchi at 1.73) and stratification ratio (TOC: 1.14–1.22; SOC stocks: 1.07–1.20) underscored superior carbon sequestration in horticultural systems, particularly in surface layers, vital for long–term storage. Lower stratification ratio in uncultivated lands indicated reduced carbon stratification. The correlation analysis demonstrates that soil labile carbon fractions (SOC, ROC, MBC) and TOC, carbon stocks are strongly interlinked. These results advocate for horticultural LUSs, especially litchi and rubber, to boost SOC stocks and mitigate climate change in subtropical ecosystems. Moving forward, promoting perennial horticultural systems, especially litchi and rubber can play a pivotal role in enhancing SOC sequestration and contributing to climate change mitigation. Policymakers and land managers should prioritize tree–based systems in sustainable land use planning to meet both regional and global environmental targets.
Data availability statement
The original contributions presented in the study are included in the article/supplementary material, further inquiries can be directed to the corresponding authors.
Author contributions
SM: Writing – review & editing, Writing – original draft, Visualization, Methodology, Investigation, Formal analysis, Data curation, Conceptualization. KM: Data curation, Funding acquisition, Investigation, Methodology, Supervision, Writing – review & editing. VS: Data curation, Investigation, Methodology, Writing – review & editing. TP: Data curation, Investigation, Methodology, Resources, Writing – review & editing. SD: Methodology, Writing – review & editing. RB: Methodology, Writing – review & editing. SG: Writing – review & editing. SY: Formal analysis, Methodology, Writing – review & editing. RS: Writing – review & editing. AK: Formal analysis, Writing – review & editing. SE-H: Data curation, Writing – review & editing. MM: Methodology, Writing – review & editing. AS: Investigation, Writing – review & editing.
Funding
The author(s) declare that financial support was received for the research and/or publication of this article. This study was supported by the Ongoing Research Funding program (ORF-2025-730), King Saud University, Riyadh, Saudi Arabia.
Acknowledgments
Authors thank the Head, Division of Soil Science and Agricultural Chemistry, ICAR- Indian Agricultural Research Institute, New Delhi, and The Directors, Horticultural Research Complex, Nagicherra, Tripura and ICAR Research Complex for North–East Hill Region, Lembucherra, Tripura, India for providing all the required facilities to carry out the present research. SM gratefully acknowledges the financial support of the Ministry of Tribal Affairs (National Fellowship for Scheduled Tribe Students) and NAHEP-CAAST during his research work. The authors extend their appreciation to Ongoing Research Funding program, (ORF-2025-730), King Saud University, Riyadh, Saudi Arabia.
Conflict of interest
The authors declare that the research was conducted in the absence of any commercial or financial relationships that could be construed as a potential conflict of interest.
Generative AI statement
The authors declare that no Gen AI was used in the creation of this manuscript.
Publisher’s note
All claims expressed in this article are solely those of the authors and do not necessarily represent those of their affiliated organizations, or those of the publisher, the editors and the reviewers. Any product that may be evaluated in this article, or claim that may be made by its manufacturer, is not guaranteed or endorsed by the publisher.
References
Addiscott, T. M. (1995). Entropy and sustainability. Eur. J. Soil Sci. 46, 161–168. doi: 10.1111/j.1365-2389.1995.tb01823.x
Ahirwal, J., Kumari, S., Singh, A. K., Kumar, A., and Maiti, S. K. (2021). Changes in soil properties and carbon fluxes following afforestation and agriculture in tropical forest. Ecol. Indic. 123:107354. doi: 10.1016/j.ecolind.2021.107354
Allen, S. E., Grimshaw, H. M., Parkinson, J. A., and Quarmby, C. (1974). Chemical analysis of ecological materials. Blackwell Sci., Malden, Mass.
Ameer, I., Kubar, K. A., Ali, Q., Ali, S., Khan, T., Shahzad, K., et al. (2023). Land degradation resistance potential of a dry, semiarid region in relation to soil organic carbon stocks, carbon management index, and soil aggregate stability. Land Degrad. Dev. 34, 624–636. doi: 10.1002/ldr.4480
Anderson, T. H., and Domsch, K. H. (1989). Ratios of microbial biomass carbon to total organic carbon in arable soils. Soil Biol. Biochem. 21, 471–479. doi: 10.1016/0038-0717(89)90117-X
Araujo, A. S. F., de Melo, W. J., Araujo, F. F., and Van den Brink, P. J. (2020). Long-term effect of composted tannery sludge on soil chemical and biological parameters. Environ. Sci. Pollut. Res. 27, 41885–41892. doi: 10.1007/s11356-020-10173-9
Babu, S., Mohapatra, K. P., Yadav, G. S., Lal, R., Singh, R., Avasthe, R. K., et al. (2020). Soil carbon dynamics in diverse organic land use systems in north eastern Himalayan ecosystem of India. Catena 194:104785. doi: 10.1016/j.catena.2020.104785
Bashir, O., Ali, T., Baba, Z. A., Rather, G. H., Bangroo, S. A., Mukhtar, S. D., et al. (2021). Soil organic matter and its impact on soil properties and nutrient status. Microbiota Biofertilizers 2, 129–159. doi: 10.1007/978-3-030-61010-4_7
Blair, N., and Crocker, G. J. (2000). Crop rotation effects on soil carbon and physical fertility of two Australian soils. Aust. J. Soil Res. 38, 71–84. doi: 10.1071/SR99064
Blair, N., Faulkner, R. D., Till, A. R., and Crocker, G. J. (2006b). Long-term management impacts on soil C, N and physical fertility: part III: Tamworth crop rotation experiment. Soil Tillage Res. 91, 48–56. doi: 10.1016/j.still.2005.11.003
Blair, N., Faulkner, R. D., Till, A. R., Korschens, M., and Schulz, E. (2006a). Long-term management impacts on soil C, N and physical fertility: part II: bad lauchstadt static and extreme FYM experiments. Soil Tillage Res. 91, 39–47. doi: 10.1016/j.still.2005.11.001
Blair, G. J., Lefroy, R. D. B., and Lisle, L. (1995). Soil carbon fractions based on their degree of oxidation and the development of a carbon management index. Aust. J. Agric. Res. 46, 1459–1466. doi: 10.1071/AR9951459
Bohme, L., and Bohme, F. (2006). Soil microbiological and biochemical properties affected by plant growth and different long-term fertilisation. Eur. J. Soil Biol. 42, 1–12. doi: 10.1016/j.ejsobi.2005.08.001
Bouyoucos, G. J. (1962). Hydrometer method improved for making particle-size analysis of soils. Agron. J. 54, 464–465. doi: 10.2134/agronj1962.00021962005400050028x
Bray, R. H., and Kurtz, L. T. (1945). Determination of total, organic, and available forms of phosphorus in soils. Soil Sci. 59, 39–46. doi: 10.1097/00010694-194501000-00006
Chan, K. Y. (1997). Consequences of changes in particulate organic matter in Vertisols under pasture and cropping. Soil Sci. Soc. Am. J. 61, 1376–1382. doi: 10.2136/sssaj1997.03615995006100050014x
Cui, Y., Luo, F. L., Chen, Y. H., Zhang, M. X., and Yu, F. H. (2022). Rhizodeposition and litter decomposition of Phragmites australis play important roles in composition and properties of soil dissolved organic matter. Ecol. Indic. 142:109275. doi: 10.1016/j.ecolind.2022.109275
Dhyani, S. K., and Tripathi, R. S. (1999). Tree growth and crop yield under Agri-silvicultural practices in north-East India. Agrofor. Syst. 44, 1–12.
Ding, W., Chen, J., Wu, Y., Mu, J., Qi, Z., Zvomuya, F., et al. (2024). Responses of soil organic carbon, microbial biomass carbon, and microbial quotient to ground cover management practices in Chinese orchards: a data synthesis. Plant Soil 511:1. doi: 10.1007/s11104-024-07015-9
Farooq, T. H., Chen, X., Shakoor, A., Rashid, M. H. U., Kumar, U., Alhomrani, M., et al. (2022). Unraveling the importance of forest structure and composition driving soil microbial and enzymatic responses in the subtropical forest soils. Forests 13:1535. doi: 10.3390/f13101535
Fontaine, S., Barot, S., Barre, P., Bdioui, N., Mary, B., and Rumpel, C. (2007). Stability of organic carbon in deep soil layers controlled by fresh carbon supply. Nature 450, 277–280. doi: 10.1038/nature06275
Franzluebbers, A. J., and Stuedemann, J. A. (2002). Particulate and non-particulate fractions of soil organic carbon under pastures in the southern Piedmont USA. Environ. Pollut. 116, S53–S62. doi: 10.1016/S0269-7491(01)00247-8
Gaudinski, J. B., Trumbore, S. E., Davidson, E. A., and Zheng, S. (2000). Soil carbon cycling in a temperate forest: radiocarbon-based estimates of residence times, sequestration rates and partitioning of fluxes. Biogeochemistry 51, 33–69. doi: 10.1023/A:1006301010014
Gill, R. A., and Burke, I. C. (2002). Influence of soil depth on the decomposition of Bouteloua gracilis roots in the shortgrass steppe. Plant Soil 241, 233–242. doi: 10.1023/A:1016146805543
Hanway, J., and Heidel, H. (1952). Soil analysis methods as used in Iowa state college soil testing laboratory. Ames, IA: Iowa State College Agriculture Bulletin, 1–13.
Jangir, A., Kumar, S., Kharia, S. K., Jangra, P., Ray, P., Sudhakara, N. R., et al. (2024). Impact of land use change on carbon management index-a study from the foothills of Western Himalayas. J. Soil Sci. Plant Nutr. 24, 7801–7816. doi: 10.1007/s42729-024-02076-2
Jenkinson, D. S., and Powlson, D. S. (1976). The effects of biocidal treatments on metabolism in soil. V. A method for measuring soil biomass. Soil Biol. Biochem. 8, 209–213. doi: 10.1016/0038-0717(76)90005-5
Jobbagy, E. G., and Jackson, R. B. (2000). The vertical distribution of soil organic carbon and its relation to climate and vegetation. Ecol. Appl. 10, 423–436. doi: 10.1890/1051-0761(2000)010[0423:TVDOSO]2.0.CO;2
Kaith, M., Tirkey, P., Bhardwaj, D. R., Kumar, J., and Kumar, J. (2023). Carbon sequestration potential of forest plantation soils in eastern plateau and hill region of India: a promising approach toward climate change mitigation. Water Air Soil Pollut. 234:341. doi: 10.1007/s11270-023-06364-y
Kaur, R., Kaur, N., Kumar, S., Dass, A., and Singh, T. (2023). Carbon capture and sequestration for sustainable land use–a review. Indian J. Agric. Sci. 93, 11–18. doi: 10.56093/ijas.v93i1.124838
Kemper, W. D., and Chepil, W. S. (1965). Size distribution of aggregates Methods of soil analysis: Part 1 physical and mineralogical properties, including statistics of measurement and sampling. Madison, WI: American Society of Agronomy, 499–510.
Kılkış, Ş. (2022). Urban emissions and land use efficiency scenarios towards effective climate mitigation in urban systems. Renew. Sust. Energ. Rev. 167:112733. doi: 10.1016/j.rser.2022.112733
Kramer, C., and Gleixner, G. (2006). Variable use of plant- and soil-derived carbon by microorganisms in agricultural soils. Soil Biol. Biochem. 38, 3267–3278. doi: 10.1016/j.soilbio.2006.04.006
Kumar, S., Prabhakar, M., Bhardwaj, D. R., Thakur, C. L., Kumar, J., and Sharma, P. (2024). Altitudinal and aspect-driven variations in soil carbon storage potential in sub-tropical Himalayan forest ecosystem: assisting nature to combat climate change. Environ. Monit. Assess. 196:126. doi: 10.1007/s10661-024-12297-8
Kurganova, I. N., Telesnina, V. M., de Lopes Gerenyu, V. O., Lichko, V. I., and Karavanova, E. I. (2021). The dynamics of carbon pools and biological activity of retic albic podzols in southern taiga during the postagrogenic evolution. Eurasian Soil Sci. 54, 337–351. doi: 10.1134/S1064229321030108
Lal, R. (2001). Potential of desertification control to sequester carbon and mitigate the greenhouse effect. Clim. Chang. 51, 35–72. doi: 10.1023/A:1017529816140
Lal, R. (2004a). Soil carbon sequestration to mitigate climate change. Geoderma 123, 1–22. doi: 10.1016/j.geoderma.2004.01.032
Lal, R. (2004b). Soil carbon sequestration impacts on global climate change and food security. Science 304, 1623–1627. doi: 10.1126/science.1097396
Lal, R. (2009). Challenges and opportunities in soil organic matter research. Eur. J. Soil Sci. 60, 158–169. doi: 10.1111/j.1365-2389.2008.01114.x
Lal, R. (2018). Digging deeper: a holistic perspective of factors affecting soil organic carbon sequestration in agroecosystems. Glob. Chang. Biol. 24, 3285–3301. doi: 10.1111/gcb.14054
Leul, Y., Assen, M., Damene, S., and Legass, A. (2023). Effects of land use types on soil quality dynamics in a tropical sub-humid ecosystem, western Ethiopia. Ecol. Indic. 147:110024. doi: 10.1016/j.ecolind.2023.110024
Li, H., Chang, L., Liu, H., and Li, Y. (2024). Diverse factors influence the amounts of carbon input to soils via rhizodeposition in plants: a review. Sci. Total Environ. 948:174858. doi: 10.1016/j.scitotenv.2024.174858
Li, Y., Li, Z., Cui, S., Liang, G., and Zhang, Q. (2021). Microbial-derived carbon components are critical for enhancing soil organic carbon in no-tillage croplands: a global perspective. Soil Tillage Res. 205:104758. doi: 10.1016/j.still.2020.104758
Liu, J., Wu, P., Zhao, Z., and Gao, Y. (2022). Afforestation on cropland promotes pedogenic inorganic carbon accumulation in deep soil layers on the Chinese loess plateau. Plant Soil 478, 597–612. doi: 10.1007/s11104-022-05494-2
Liu, R., Zhang, Y., Hu, X. F., Wan, S., Wang, H., Liang, C., et al. (2021). Litter manipulation effects on microbial communities and enzymatic activities vary with soil depth in a subtropical Chinese fir plantation. For. Ecol. Manag. 480:118641. doi: 10.1016/j.foreco.2020.118641
Lorenz, K., and Lal, R. (2005). The depth distribution of soil organic carbon in relation to land use and management and the potential of carbon sequestration in subsoil horizons. Adv. Agron. 88, 35–66. doi: 10.1016/S0065-2113(05)88002-2
Lv, C., Wang, C., Cai, A., and Zhou, Z. (2023). Global magnitude of rhizosphere effects on soil microbial communities and carbon cycling in natural terrestrial ecosystems. Sci. Total Environ. 856:158961. doi: 10.1016/j.scitotenv.2022.158961
Manici, L. M., Caputo, F., Fornasier, F., Paletto, A., Ceotto, E., and De Meo, I. (2024). Ascomycota and Basidiomycota fungal phyla as indicators of land use efficiency for soil organic carbon accrual with woody plantations. Ecol. Indic. 160:111796. doi: 10.1016/j.ecolind.2024.111796
Marone, D., Poirier, V., Coyea, M., Olivier, A., and Munson, A. D. (2017). Carbon storage in agroforestry systems in the semi-arid zone of Niayes, Senegal. Agrofor. Syst. 91, 941–954. doi: 10.1007/s10457-016-9965-9
Meena, V. S., Mondal, T., Pandey, B. M., Mukherjee, A., Yadav, R. P., Choudhary, M., et al. (2018). Land use changes: strategies to improve soil carbon and nitrogen storage pattern in the mid-Himalaya ecosystem, India. Geoderma 321, 69–78. doi: 10.1016/j.geoderma.2018.02.002
Mir, Y. H., Ganie, M. A., Shah, T. I., Bangroo, S. A., Mir, S. A., Shah, A. M., et al. (2023). Soil microbial and enzyme activities in different land use systems of the northwestern Himalayas. PeerJ 11:e15993. doi: 10.7717/peerj.15993
Murindangabo, Y. T., Kopecký, M., Perná, K., Nguyen, T. G., Ghorbani, M., Konvalina, P., et al. (2023). Enhancing soil organic matter transformation through sustainable farming practices: evaluating labile soil organic matter fraction dynamics and identifying potential early indicators. Agriculture 13:1314. doi: 10.3390/agriculture13071314
Padbhushan, R., Kumar, U., Sharma, S., Rana, D. S., Kumar, R., Kohli, A., et al. (2022). Impact of land-use changes on soil properties and carbon pools in India: a meta-analysis. Front. Environ. Sci. 9:794866. doi: 10.3389/fenvs.2021.794866
Padbhushan, R., Sharma, S., Rana, D. S., Kumar, U., Kohli, A., and Kumar, R. (2020). Delineate soil characteristics and carbon pools in grassland compared to native forestland of India: a meta-analysis. Agronomy 10:1969. doi: 10.3390/agronomy10121969
Parihar, C. M., Jat, S. L., Singh, A. K., Datta, A., Parihar, M. D., Varghese, E., et al. (2018). Changes in carbon pools and biological activities of a sandy loam soil under medium-term conservation agriculture and diversified cropping systems. Eur. J. Soil Sci. 69, 902–912. doi: 10.1111/ejss.12680
Pradeepa, K. L., Ravikumar, D., Chidanandappa, H. M., Jadeyegowda, M., and Shoba, S. (2018). Impact of land use on soil organic carbon fraction in central parts of Western Ghat of Virajpet taluk. J. Farm Sci. 31, 555–558.
R Core Team (2024). R: A language and environment for statistical computing (version 2024.12.1+563) [computer software]. Vienna: R Foundation for Statistical Computing.
Ralhan, P. K., Rasool, A., and Singh, A. (1996). “Return of nutrients through leaf litter on an age series of poplar plantation in agrisilviculture system in certain parts of Punjab,” in Proc IUFRO DNAES international meeting: Resource inventory techniques to support agroforestry and environment, 159–163
Ramesh, T., Manjaiah, K. M., Mohopatra, K. P., Rajasekar, K., and Ngachan, S. V. (2015). Assessment of soil organic carbon stocks and fractions under different agroforestry systems in subtropical hill agroecosystems of north-East India. Agrofor. Syst. 89, 677–690. doi: 10.1007/s10457-015-9802-6
Ramesh, T., Manjaiah, K. M., Tomar, J. M. S., and Ngachan, S. V. (2013). Effect of multipurpose tree species on soil fertility and CO2 efflux under hilly ecosystems of north-East India. Agrofor. Syst. 87, 1377–1388. doi: 10.1007/s10457-013-9645-y
Reza, S. K., Ray, P., Ramachandran, S., Jena, R. K., Mukhopadhyay, S., and Ray, S. K. (2020). Soil organic carbon fractions in major land use systems in Charilam block of Tripura. J. Indian Soc. Soil Sci. 68, 458–461. doi: 10.5958/0974-0228.2020.00043-9
Rigarlsford, G., de Silva, J., Tuwei, G., Redfern, S., Kulak, M., Miah, J. H., et al. (2020). Potential management interventions to mitigate greenhouse gas emissions from tea cultivation. Carbon Manag. 11, 631–643. doi: 10.1080/17583004.2020.1840872
Sahu, C., Mishra, R., and Basti, S. (2023). Land-use change affects carbon storage and lability in tropical soil of India. Geoderma Reg. 32:e00621. doi: 10.1016/j.geodrs.2022.11.001
Shah, A., Huang, J., Han, T., Khan, M. N., Tadesse, K. A., Daba, N. A., et al. (2024). Impact of soil moisture regimes on greenhouse gas emissions, soil microbial biomass, and enzymatic activity in long-term fertilized paddy soil. Environ. Sci. Eur. 36:120. doi: 10.1016/j.geodrs.2023.e00621
Singh, S. L., Sahoo, U. K., Gogoi, A., and Kenye, A. (2018). Effect of land use changes on carbon stock dynamics in major land use sectors of Mizoram, Northeast India. J. Environ. Prot. 9, 1262–1285. doi: 10.4236/jep.2018.912079
Six, J., Elliott, E. T., and Paustian, K. (2000). Soil macroaggregate turnover and microaggregate formation: a mechanism for C sequestration under no-tillage agriculture. Soil Biol. Biochem. 32, 2099–2103. doi: 10.1016/S0038-0717(00)00179-6
Sparling, G. P. (1992). Ratio of microbial biomass carbon to soil organic carbon as a sensitive indicator of changes in soil organic matter. Soil Res. 30, 195–207. doi: 10.1071/SR9920195
Srinivasan, V., Maheswarappa, H. P., and Lal, R. (2012). Long term effects of topsoil depth and amendments on particulate and non-particulate carbon fractions in a Miamian soil of Central Ohio. Soil Tillage Res. 121, 10–17. doi: 10.1016/j.still.2012.01.014
Subbiah, B. V., and Asija, G. L. (1956). A rapid procedure for the estimation of available nitrogen in soils. Curr. Sci. 25, 259–260.
Swamy, S. L., Darro, H., Mishra, A., Lal, R., Kumar, A., and Thakur, T. K. (2023). Carbon stock dynamics in a disturbed tropical forest ecosystem of Central India: strategies for achieving carbon neutrality. Ecol. Indic. 154:110775. doi: 10.1016/j.ecolind.2023.110775
Thangavel, R., Kanchikerimath, M., Sudharsanam, A., Ayyanadar, A., Karunanithi, R., Deshmukh, N. A., et al. (2018). Evaluating organic carbon fractions, temperature sensitivity and artificial neural network modeling of CO2 efflux in soils: impact of land use change in subtropical India (Meghalaya). Ecol. Indic. 93, 129–141. doi: 10.1016/j.ecolind.2018.04.077
Topa, D., Cara, I. G., and Jităreanu, G. (2021). Long term impact of different tillage systems on carbon pools and stocks, soil bulk density, aggregation and nutrients: a field meta-analysis. Catena 199:105102. doi: 10.1016/j.catena.2020.105102
Wang, Z., Liu, S., Huang, C., Liu, Y., and Bu, Z. (2017). Impact of land use change on profile distributions of organic carbon fractions in peat and mineral soils in Northeast China. Catena 152, 1–8. doi: 10.1016/j.catena.2016.12.022
Wang, H., Wu, J., Li, G., Yan, L., and Liu, S. (2023). Effects of extreme rainfall frequency on soil organic carbon fractions and carbon pool in a wet meadow on the Qinghai-Tibet plateau. Ecol. Indic. 146:109853. doi: 10.1016/j.ecolind.2022.109853
Wang, H., Wu, L., Yue, Y., Jin, Y., and Zhang, B. (2024). Impacts of climate and land use change on terrestrial carbon storage: a multi-scenario case study in the Yellow River Basin (1992–2050). Sci. Total Environ. 930:172557. doi: 10.1016/j.scitotenv.2024.172557
Yadav, S., Barman, M., Manjaiah, K., Purakayastha, T., Roy, L., Yadav, R., et al. (2024). Variability in soil organic carbon pools in different land use systems in the north-eastern region of India. Indian J. Agric. Sci. 94, 1125–1129. doi: 10.56093/ijas.v94i10.151357
Yadav, G. S., Das, A., Lal, R., Babu, S., Meena, R. S., Saha, P., et al. (2018). Energy budget and carbon footprint in a no-till and mulch based rice–mustard cropping system. J. Clean. Prod. 191, 144–157. doi: 10.1016/j.jclepro.2018.04.173
Yan, Y., Wang, C., Zhang, J., Sun, Y., Xu, X., Zhu, N., et al. (2022). Response of soil microbial biomass C, N, and P and microbial quotient to agriculture and agricultural abandonment in a meadow steppe of Northeast China. Soil Tillage Res. 223:105475. doi: 10.1016/j.still.2022.105475
Zhang, X., Han, X., Yu, W., Wang, P., and Cheng, W. (2017). Priming effects on labile and stable soil organic carbon decomposition: pulse dynamics over two years. PLoS One 12:e0184978. doi: 10.1371/journal.pone.0184978
Zhang, Y., Li, Y., Liu, Y., Huang, X., Zhang, W., and Jiang, T. (2021). Responses of soil labile organic carbon and carbon management index to different long-term fertilization treatments in a typical yellow soil region. Eurasian Soil Sci. 54, 605–618. doi: 10.1134/S1064229321040189
Zhang, L., Zhuang, Q., He, Y., Liu, Y., Yu, D., Zhao, Q., et al. (2016). Toward optimal soil organic carbon sequestration with effects of agricultural management practices and climate change in tai-Lake paddy soils of China. Geoderma 275, 28–39. doi: 10.1016/j.geoderma.2016.04.001
Keywords: carbon management index, carbon stocks, land uses, Northeast Hill Region, soil organic carbon
Citation: Meena S, Manjaiah KM, Sharma VK, Purakayastha TJ, Das S, Bana RS, Gawdiya S, Yadav S, Saini R, Kumar A, El-Hendawy S, Mattar MA and Salem A (2025) Exploring soil organic carbon fractions, stocks, and carbon management index across land uses in subtropical ecosystems of Tripura, India. Front. Sustain. Food Syst. 9:1604101. doi: 10.3389/fsufs.2025.1604101
Edited by:
Rajeev Padbhushan, Bihar Agricultural University, IndiaReviewed by:
Prashant Sharma, Indian Veterinary Research Institute, IndiaHanuman Singh Jatav, Sri Karan Narendra Agriculture University, India
Brajendra Parmar, Indian Institute of Rice Research (ICAR), India
Abhishek Jangir, ICAR - National Bureau of Soil Survey and Land Use Planning, India
Copyright © 2025 Meena, Manjaiah, Sharma, Purakayastha, Das, Bana, Gawdiya, Yadav, Saini, Kumar, El-Hendawy, Mattar and Salem. This is an open-access article distributed under the terms of the Creative Commons Attribution License (CC BY). The use, distribution or reproduction in other forums is permitted, provided the original author(s) and the copyright owner(s) are credited and that the original publication in this journal is cited, in accordance with accepted academic practice. No use, distribution or reproduction is permitted which does not comply with these terms.
*Correspondence: K. M. Manjaiah, bWFuamFpYWgubWF0aEBnbWFpbC5jb20=; Salah El-Hendawy bW9zYWxhaEBrc3UuZWR1LnNh; Mohamed A. Mattar bW1hdHRhckBrc3UuZWR1LnNh; Ali Salem c2FsZW0uYWxpQG1pay5wdGUuaHU=
†ORCID: Siyaram Meena, orcid.org/0000-0001-5084-5595
Mohamed A. Mattar, orcid.org/0000-0002-7506-3036
Ali Salem, orcid.org/0000-0001-6176-8345