 Yuejuan Yang
 Yutao Ran
 Yue Zhang1
- 1College of Modern Agricultural, Weifang University, Weifang, China
- 2College of Architecture and Environment, Sichuan University, Sichuan, China
- 3College of Life Sciences, Shandong Normal University, Jinan, China
Introduction: Sichuan province serves as a vital grain production hub in southwestern China, where corn planting industry plays a critical role in maintaining regional food security. Understanding the sustainability of corn production ecosystems is essential for optimizing agricultural resource allocation and ensuring long-term food security in this economically important region.
Methods: This study employed an emergy analysis framework to assess the sustainability of Sichuan’s corn planting ecosystems in 2022. An evaluation system comprising 18 indicators was developed, encompassing natural resource emergy, industrial support energy, and purchased renewable resources. Moving weighted trend surface analysis was applied to identify spatial patterns in environmental sustainability, while partial least squares discriminant analysis was used to categorize regions and identify key driving factors of regional differences.
Results: The analysis revealed significant regional disparities across multiple dimensions. In terms of emergy input and output, Chengdu city exhibited the highest emergy input density 10.59 × 10¹¹ sej·m−2, nearly double that of Garzê Tibetan Autonomous Prefecture (5.36 × 10¹¹ sej·m−2), while Aba Tibetan and Qiang Autonomous Prefecture showed the lowest emergy output density, reaching only 40% of Dazhou city’s levels. Regarding investment benefits, Chengdu city maintained the highest emergy investment ratio (4.13) but demonstrated the lowest net emergy yield ratio (1.17), contrasting with Ziyang city’s highest net emergy yield ratio (2.07). Management and environmental impact assessments revealed substantial regional variations, with Suining city achieving the highest scale management degree (59.8) compared to mountainous regions averaging only 21.64. Environmental loading ratios remained below 1 in 67% of regions, while high-level areas averaged 1.71, indicating significant ecological pressure. Spatial analysis demonstrated a northeast-to-southwest declining pattern in environmental sustainability index (R2 = 0.63, p < 0.05). Four distinct regional groups were identified, with net emergy yield ratio, emergy output density, and scale management degree emerging as the three key factors driving regional differences.
Discussion: These findings reveal the combined influence of natural resource availability and human energy inputs on agricultural sustainability across Sichuan province. The significant regional imbalances in resource input and output efficiency, coupled with obvious topographical influences on management practices, highlight the need for differentiated agricultural development strategies. The identification of key driving factors provides a scientific foundation for formulating regionally targeted policies to optimize resource allocation and enhance the overall sustainability of corn production systems in southwestern China.
1 Introduction
Amidst global climate change, resource scarcity, and environmental degradation, agricultural systems face significant challenges to sustainable development (Fei, 2018; Pandey and Pandey, 2023). The United Nations Food and Agriculture Organization (FAO) predicts that global food demand will increase by 60% by 2050, whereas climate change could reduce major crop yields by 20–30% (Brown et al., 2016). In this context, scientific assessment of the sustainability of agricultural production systems has become an urgent priority. Traditional agricultural evaluation systems have tended to emphasize economic outputs while neglecting the quantification of ecosystem service values and environmental costs and may not adequately reflect the true performance of agricultural systems (Zadgaonkar et al., 2022). Emergy analysis is an effective ecological-economic analysis method proposed by Odum (1996) and has evolved into an important tool for evaluating the sustainability of complex systems (Odum, 1996). By uniformly converting different forms of energy, material flows, and information flows into solar emergy joules (sej) and subsequently analyzing and assessing the system’s ecological and economic benefits, it provides a systematic methodological framework for the sustainability assessment of agricultural systems (Brown and Ulgiati, 2016).
The core of emergy theory lies in constructing a common currency that connects natural and human economic systems, overcoming limitations in traditional economic evaluation that neglect environmental contributions (Amaral et al., 2016). Xiao et al. (2022) pointed out through a systematic review that the application of emergy analysis in agriculture has demonstrated three significant trends over the past decade: first, expansion from single crop systems to complex agricultural ecosystems; second, evolution from static analysis to spatiotemporal dynamic evolution research; and third, development from single indicators to multidimensional comprehensive evaluation systems (Xiao et al., 2022). These trends essentially reflect the systematic refinement of the emergy analysis theoretical framework. In recent years, important breakthroughs have been achieved in the application of emergy analysis to assess the sustainability of agricultural systems. Houshyar et al. (2018), based on emergy analysis, discovered that while intensive agricultural production significantly increased food yields, its high dependence on external energy inputs led to increased system vulnerability, with the environmental loading ratio rising by an average of 47.3% (Houshyar et al., 2018). In research on China’s food production system, Liu et al. (2024) further revealed significant regional differences in resource utilization efficiency, with developed regions generally attaining emergy investment ratios 2–3 times higher than underdeveloped regions, yet they had lower net emergy yield ratios (Liu et al., 2024). This ‘high input-low efficiency’ paradox has prompted profound academic reflection, posing theoretical challenges to traditional agricultural modernization pathways. By constructing an emergy-ecological footprint coupling model, Wang et al. (2020) indicated that balancing the input structure between natural and purchased emergy is key to resolving this paradox (Wang et al., 2020). The innovation of this coupling method lies in its ability to simultaneously quantify both the resource consumption intensity and ecological carrying pressure of agricultural systems.
In agricultural systems emergy research, Su and Wang et al. (2020) investigated the relationship between emergy input structure and environmental load across different cultivation methods, finding that while intensive agricultural systems demonstrate higher economic efficiency, their environmental loading ratio is significantly higher than traditional agricultural systems (Su et al., 2020). Wang et al. (2022), by constructing an emergy-material flow analysis framework, quantified the environmental externalities of pesticides and chemical fertilizers, and proposed resource input thresholds based on emergy optimization (Wang et al., 2022). Xie et al. (2017) revealed significant regional heterogeneity in the ecological efficiency of China’s food production, with southwestern regions exhibiting particularly pronounced spatial differentiation in emergy investment ratios and the emergy environmental sustainability index due to complex terrain conditions and resource endowment differences (Xie et al., 2017). However, existing research predominantly focuses on macro or meso scales and lacks systematic analysis of regional microscale differences, making it difficult to guide the formulation of regionally differentiated agricultural policies (Streimikis and Baležentis, 2020).
As the largest food production area in southwest China, Sichuan features a complex terrain, diverse climate, and significant regional differences in resource endowments and socioeconomic development levels, providing a typical case for studying the spatial differentiation of emergy characteristics in agricultural systems (Liu et al., 2019). Since 2000, Sichuan Province’s corn industry has achieved remarkable development, with cultivated area expanding by 50% and total production increasing by 44.4%. Meanwhile, per-unit yield levels have improved from 375 kg per mu to 420 kg per mu (Xiong et al., 2022; Zhang et al., 2024). Beyond ensuring food security, the corn sector has stimulated growth in related industries including feed, food processing, and biochemical industry. The industry generates over 60 billion yuan in annual output value and provides direct employment for 2 million people, significantly contributing to rural income growth and regional economic prosperity. Additionally, the industry has made substantial progress in implementing environmentally sustainable practices, particularly in conservation tillage and green pest management technologies (Wang et al., 2022; Xiang et al., 2024). A study by Li et al. (2023) on rice planting systems in the Chengdu Plain, the largest plain in southwestern China, found that intensive production significantly improved emergy utilization efficiency (Li et al., 2023). Francis and Clegg (2020), by analyzing food production systems in basin regions, identified terrain differences as key factors causing spatial heterogeneity in resource utilization efficiency (Francis and Clegg, 2020). This provides important biophysical foundations for understanding spatial heterogeneity of agricultural systems. It was found that resource utilization efficiency in mountainous agricultural areas is generally 30–50% lower than in plain regions, while there were increased ecological risks from soil and water erosion (Li et al., 2023). Particularly when faced with global climate change, frequent extreme weather events pose even greater challenges to vulnerable mountainous agricultural systems (Tripathi et al., 2024).
As the second largest food crop in Sichuan, the corn production system encompasses multiple topographical conditions, including plains, hills, and mountainous areas, effectively reflecting the resource and environmental impacts of regional agricultural production. However, there is a lack of sustainability assessment research on Sichuan’s corn planting systems based on emergy analysis, particularly systematic analyses of its spatial heterogeneity and influence mechanisms. Referencing emergy theory and spatial analysis methods, this study constructs a comprehensive evaluation system containing 18 indicators, aiming to: (1) analyze the emergy input–output characteristics of Sichuan’s corn planting system and regional differences; (2) reveal the spatial differentiation patterns of regional emergy sustainability and their driving mechanisms; and (3) study the evolution trends of corn production systems in climate change scenarios and propose differentiated optimization strategies.
2 Materials and methods
2.1 Study area
Sichuan is located in southwestern China in the upper reaches of the Yangtze River (Figure 1), with a regional range of 97°21′E–108°31′E and 26°3′N–34°19′N. The topographical structure is ‘high around the edges, low in the middle’, with the central area characterized by typical basin terrain. This region has a subtropical humid monsoon climate, with significant monsoon and vertical zonal characteristics. Annual average temperatures range from 16 to 18°C, while annual precipitation varies between 800 and 1,200 mL, distributed uniformly across space and time. The frost-free period extends for 240–300 days, with abundant light and heat and sufficient heat accumulation, providing favorable climatic conditions for crop growth. Soil types primarily consist of paddy and purple soil, with deep soil layers and high organic matter content, offering good water and fertilizer retention. These soil characteristics have established a necessary foundation for achieving high and stable grain crop yields. This region is not only one of China’s important commercial grain production areas but also a crucial ecological barrier in the upper reaches of the Yangtze River.
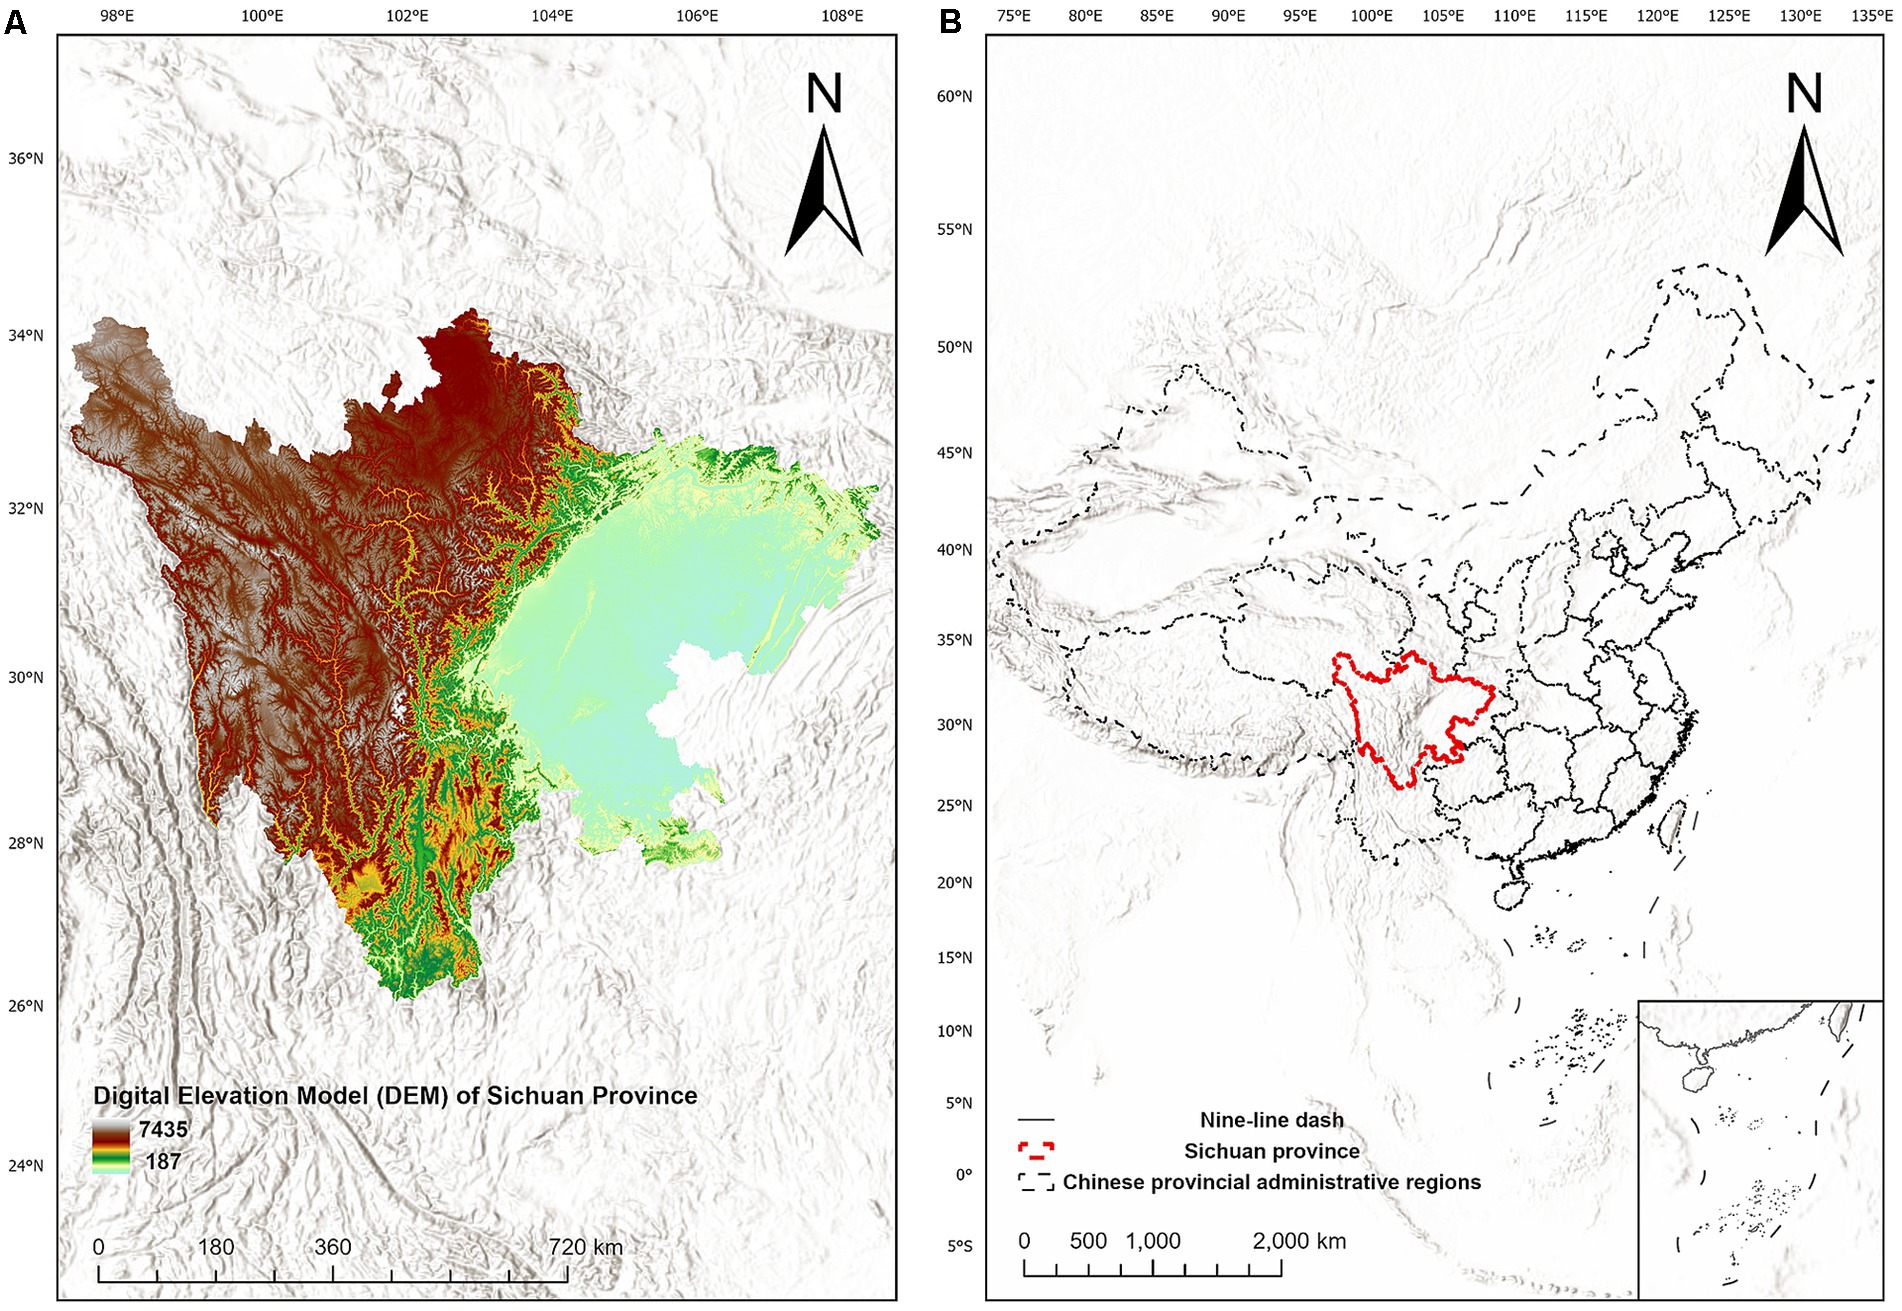
Figure 1. Terrain map (A) of Sichuan Province, and its location in China (B).
From 2000 to 2023, Sichuan Province’s economic and agricultural development shows distinct phases and notable regional variations (Zhang et al., 2024). The agricultural planting industry exhibits clear regional development disparities, with leading modernization levels but facing “high input-low efficiency” issues, while the central plains face considerable ecological pressure. Since 2016, the province has entered a period of structural adjustment, shifting its development focus from quantity growth to quality and efficiency improvement (Liu et al., 2024; Xiang et al., 2024). This indicates that Sichuan is transforming from an agricultural big province to an agricultural strong province, though it still faces challenges related to grain production and demand gaps. Coordinated regional development and green transformation will be crucial for future development.
2.2 Research methods
2.2.1 Assessment method and indicators
The emergy accounting method is a system assessment method based on the emergy theory proposed by Odum (1996), with the core objective of quantifying the supply side value of natural systems for human economic activities (Odum, 1996). This method, through the unit emergy value, achieves a standardized integration of multi-dimensional resource flows, converting factors with different dimensions, such as energy flows, material flows, monetary flows, labor, and services, into comparable quantities based on solar emergy. The basic mathematical model can be expressed as Equation (2–1):
The unit emergy value refers to the solar transformity, which is the sunlight equivalent contained in a unit of energy (1 j) or material (1 g).
The emergy flow diagram for corn in Sichuan is illustrated in Figure 2. The inputs to the corn production system can be classified into four categories: local renewable resources (R, including sunlight, wind, earth cycle, and rain), local non-renewable resources (N, net loss of topsoil), renewable organic energy (FR, including irrigating water, labor, seeds, and organic fertilizer), and non-renewable artificial auxiliary energy (FN, including chemical fertilizer, plastic mulch, diesel, pesticides, power, agricultural machinery, and compound fertilizer). The output of this system is represented by the corn output emergy Y. As shown in Table 1, the main assessment indicators in this study include: emergy input density, emergy output density, emergy investment rate, net emergy yield rate, scale management degree, environmental loading ratio, and emergy sustainable development coefficient. Through an evaluation system comprising 18 indicators, this study applied an emergy analysis to assess the sustainability of Sichuan’s corn planting ecosystems in 2022. The abbreviations for the administrative divisions of Sichuan are provided in Table 2. We used the natural breaks method to divide the 21 prefectural-level cities/autonomous prefectures into four groups (high level, medium-high level, medium-low level, and low level) on a spatial scale. A difference analysis was conducted on these administrative units using a one-way analysis of variance and effect size methods.
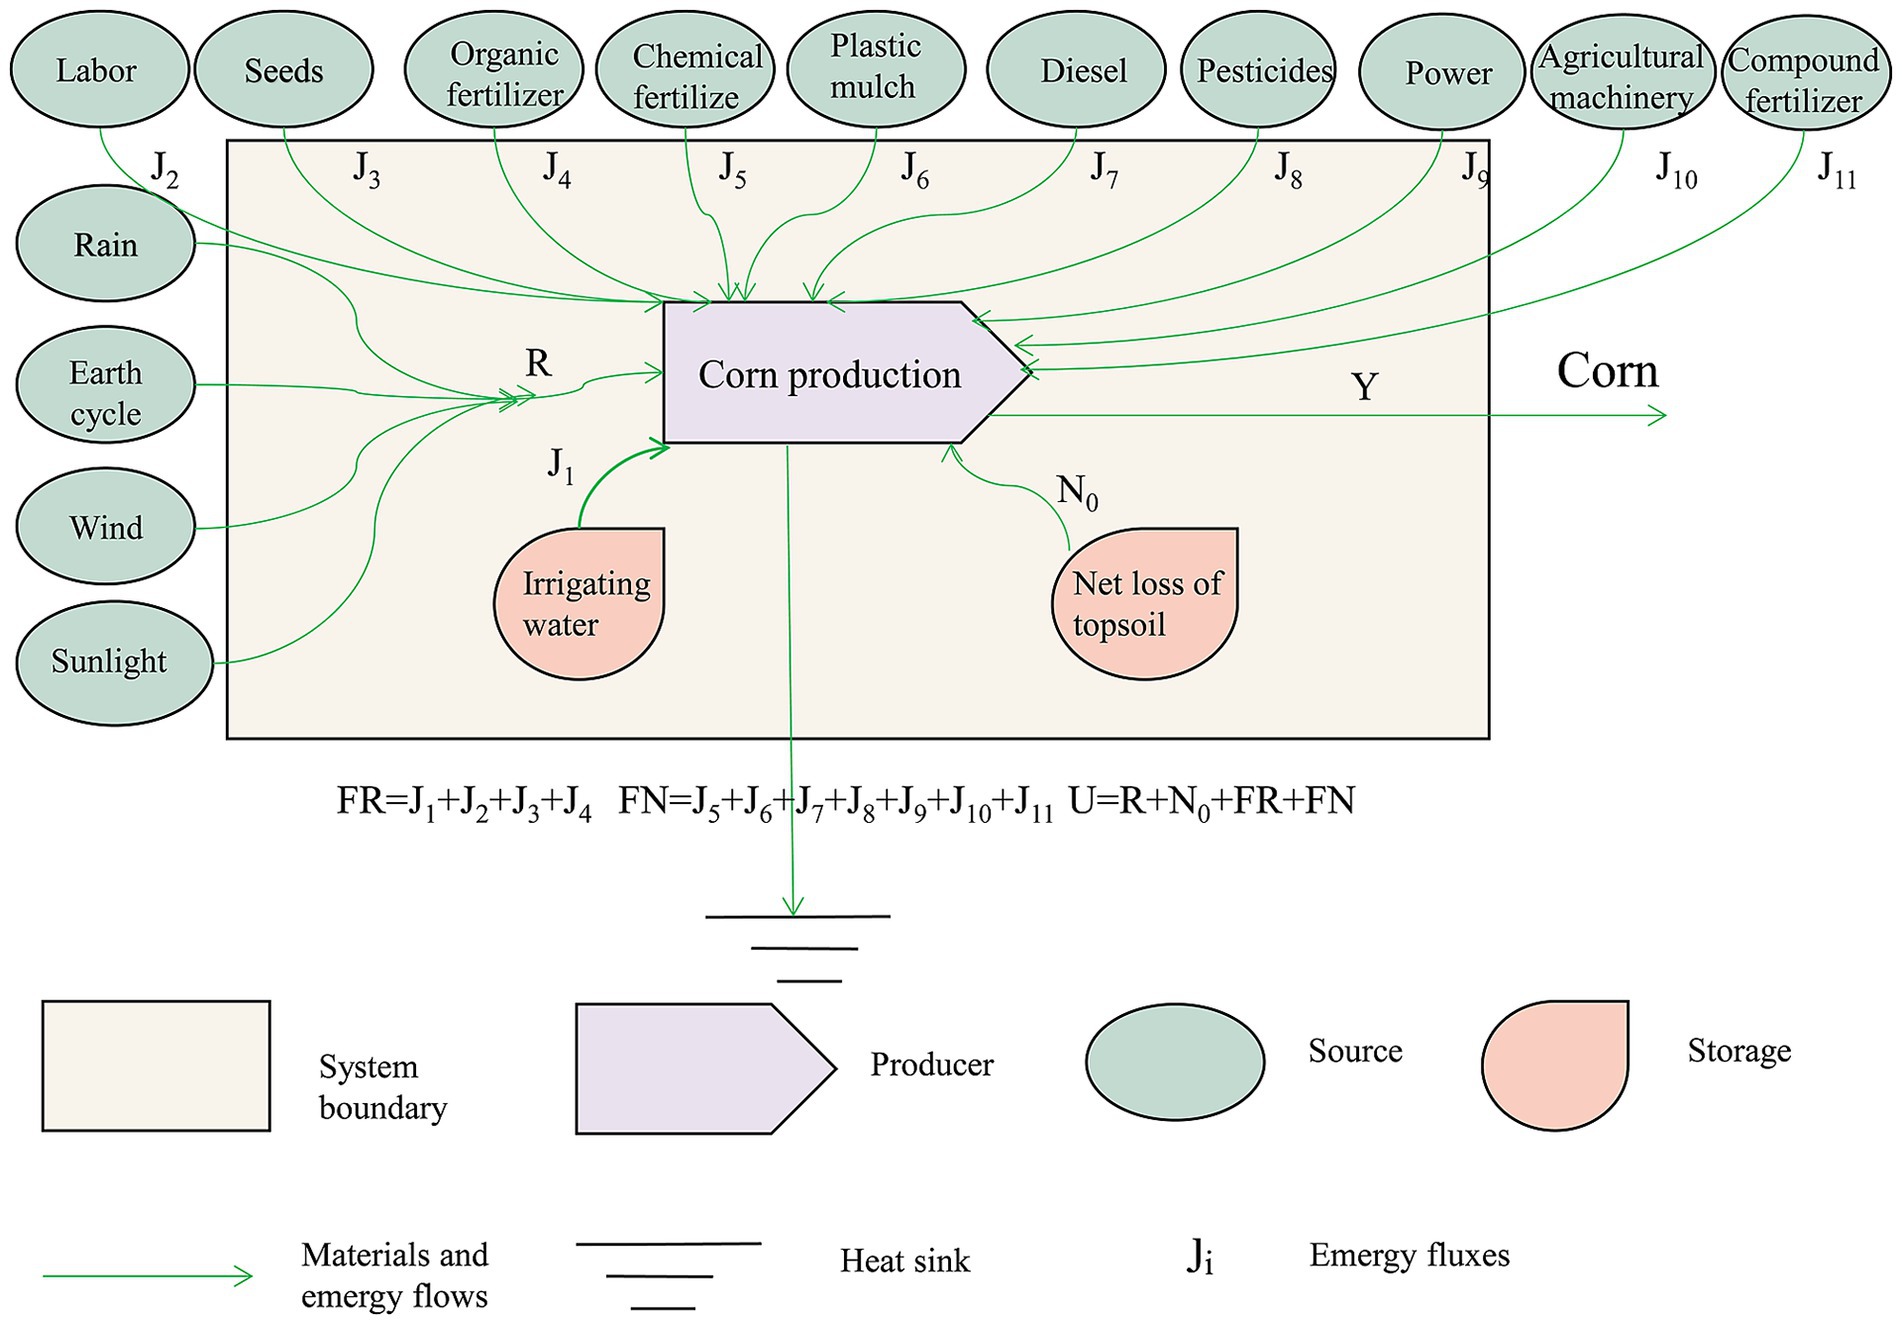
Figure 2. Emergy flow diagram of the corn planting ecosystem in Sichuan Province.
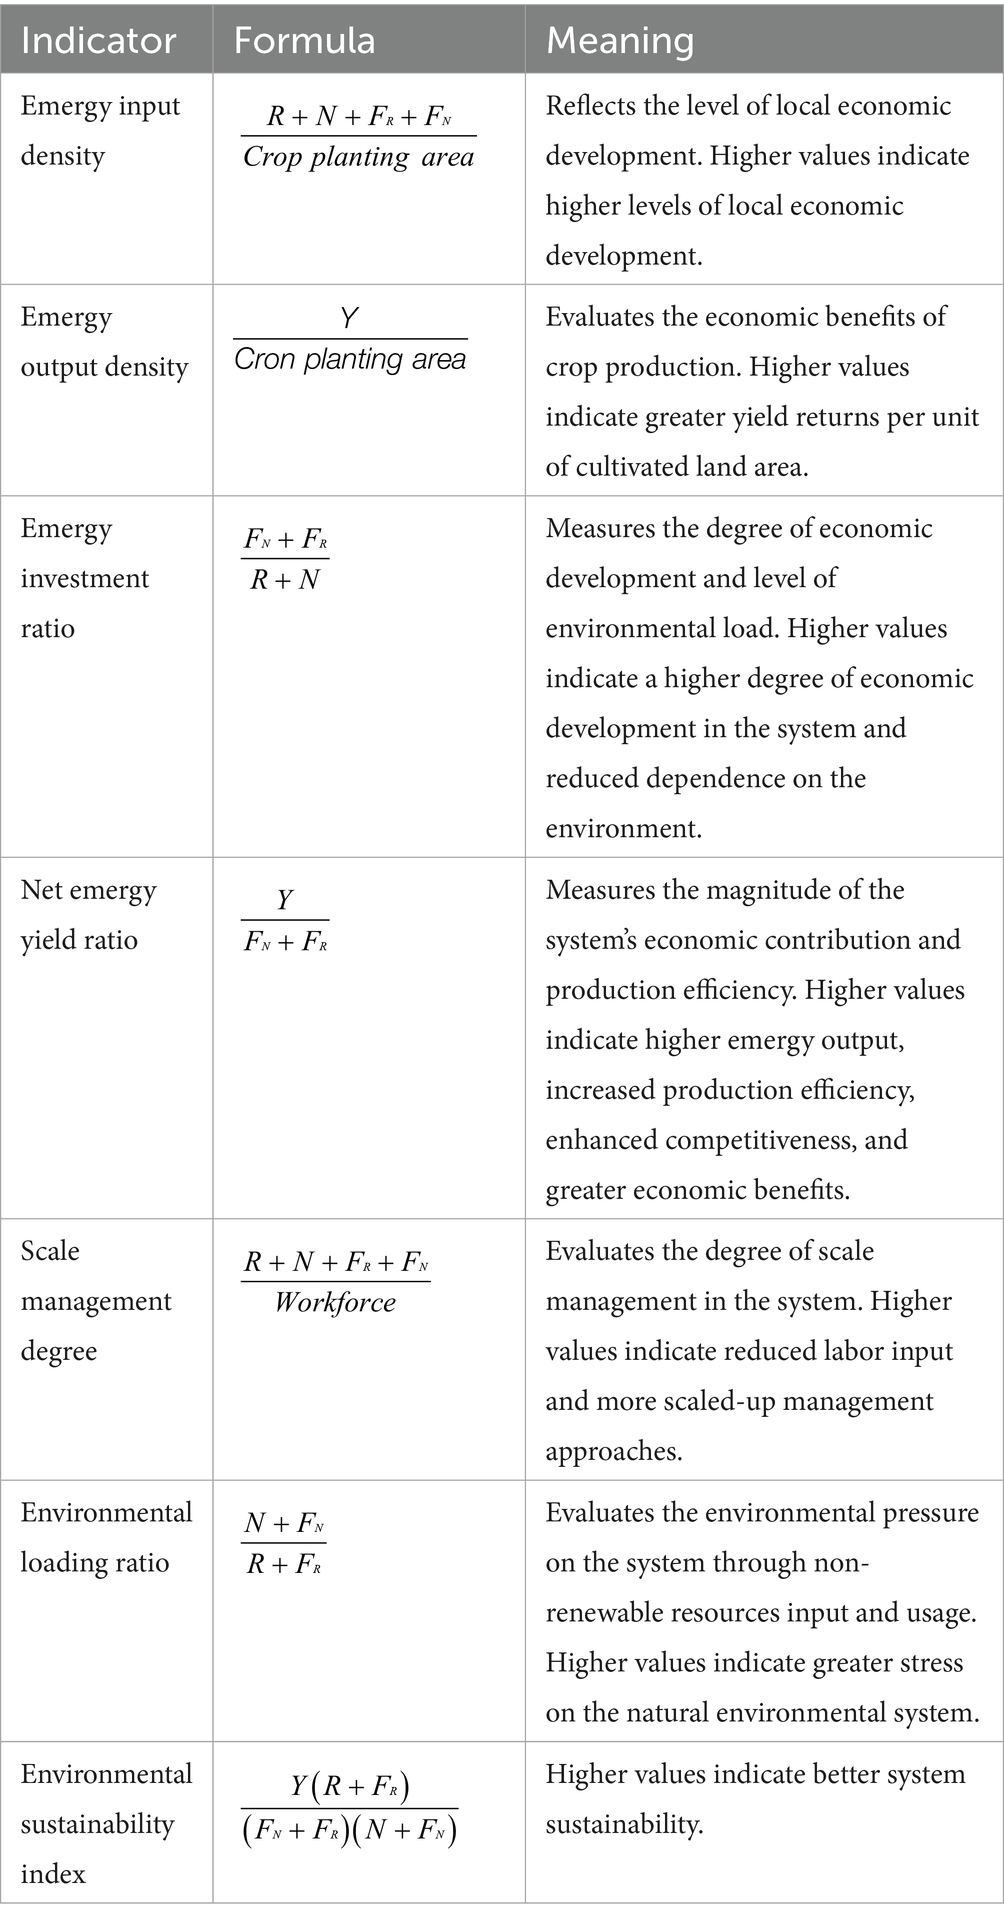
Table 1. Emergy indicators: calculation formulas and their conceptual meanings.
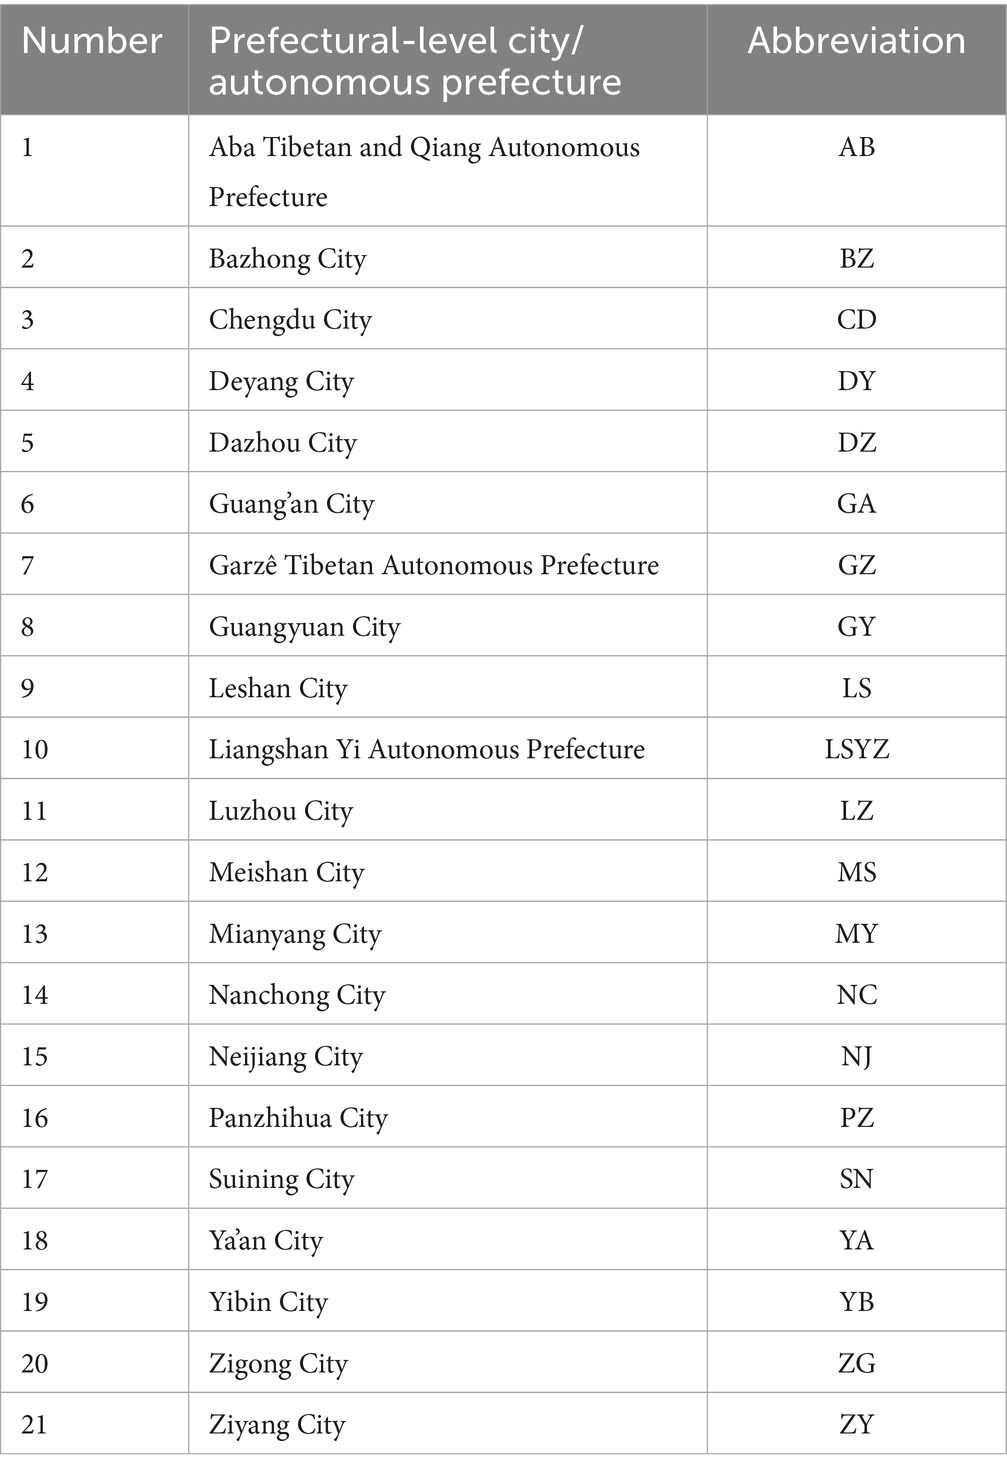
Table 2. The abbreviations for the prefectural-level cities/autonomous prefectures of Sichuan.
2.2.2 Moving weighted trend surface analysis
Using the moving weighted trend surface analysis (Oliveira, 1979; Eppler and Full, 1992; Wang and Zuo, 2015), we conducted a trend analysis of the sustainable development of corn cultivation ecosystems across 21 prefecture-level cities/autonomous prefectures in Sichuan. The details of this process are provided in Supplementary material (Appendix S1).
2.2.3 Partial least squares discriminant analysis
Partial least squares discriminant analysis (PLS-DA) is a robust discriminant analysis method. This method is particularly suitable for datasets with numerous explanatory variables, multicollinearity issues, and small sample sizes. The method begins by converting the sample categories into dummy variables, as Equation (2–2):
Subsequently, PLS regression is applied to establish a relationship model between the explanatory and dummy variables (Jiang and Xia, 2003). The sample classification is determined by comparing the magnitudes of the predicted values. If a particular dummy variable component has the highest predicted value, the sample is assigned to the category corresponding to that variable (Figure 3).
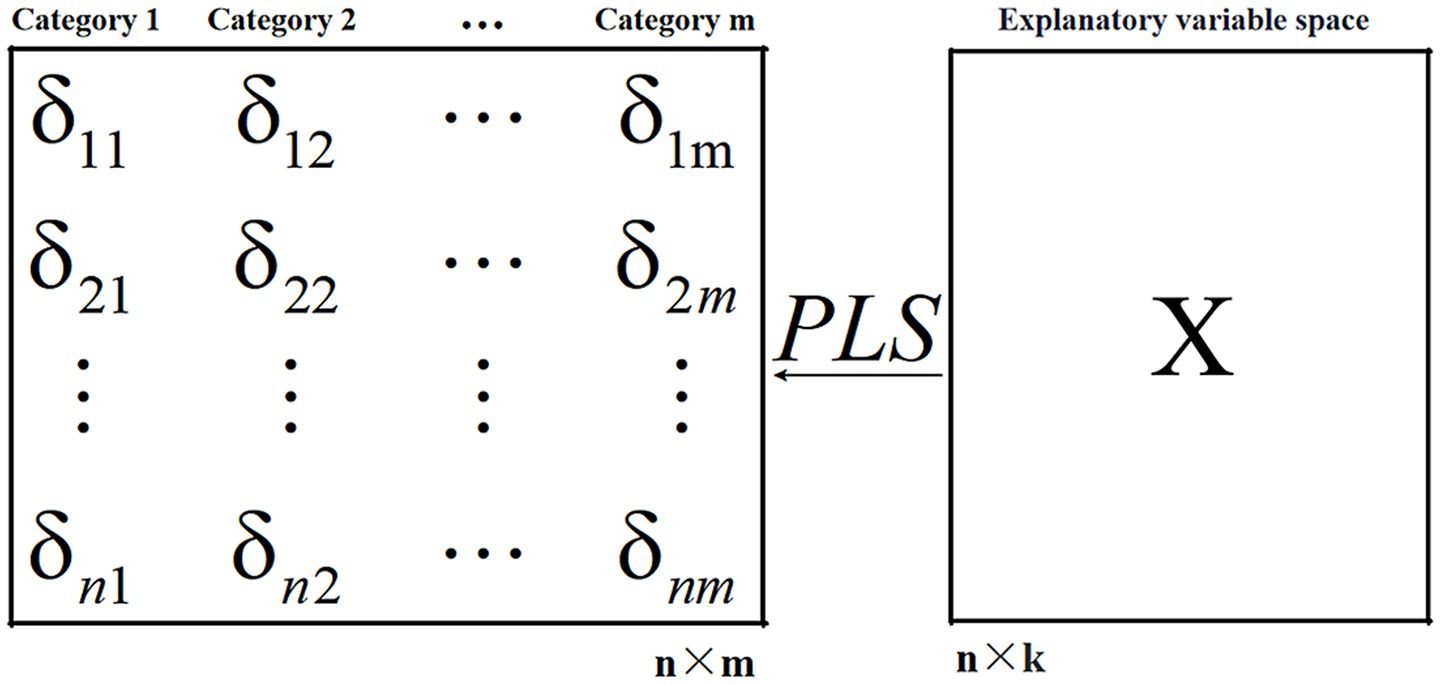
Figure 3. Basic principle of PLS-DA.
In 1994, Wold introduced the Variable Importance in Projection (VIP) index, which screens variables according to their influence intensity of explanatory variables. This index is a statistical measure of how well explanatory variables account for the response variables (categories) (Jiang et al., 2004). VIP is defined as Equation (2–3):
where p is the number of independent variables, m represents the number of components extracted from the original variables, represents the h-th component, represents the coefficient of determination between Y and the h-th principal component, represents the h-th component of the weight vector for the j-th principal component, and represents the sum of coefficients of determination between Y and the first m principal components. When , it indicates that the variable makes a large contribution to the sample classification, suggesting that it can be identified as a key factor influencing the response variable. In this study, we employed PLS-DA to evaluate the environmental sustainability index of corn at spatial scale in prefecture-level cities/autonomous prefectures of Sichuan.
2.3 Data sources
The primary data sources include the Sichuan Provincial Bureau of Statistics (2023), as well as local statistical yearbooks from cities and prefectures in Sichuan, such as the Chengdu Municipal Bureau of Statistics (2023), Zigong Municipal Bureau of Statistics (2023), Sichuan Climate Resources, and Sichuan Provincial Profile. The details are provided in Supplementary Tables S1–S5. To address missing data in the yearbooks, we supplemented them using statistical data published on the official websites of local agricultural bureaus, meteorological bureaus, water affairs bureaus, and other institutions. We performed sensitivity analyses on the data to assess the robustness and quantify uncertainty. Additionally, this research used an emergy baseline of 1.583 × 1025 sej/a (Odum and Odum, 2000), while the emergy conversion coefficients and transformation rates were based on Wu (Wu, 2016). Refer to Table 3 for indicators used in emergy analysis evaluation. The details of conversion rate are provided in Supplementary Table S6. The emergy analysis research framework is shown in Figure 4.
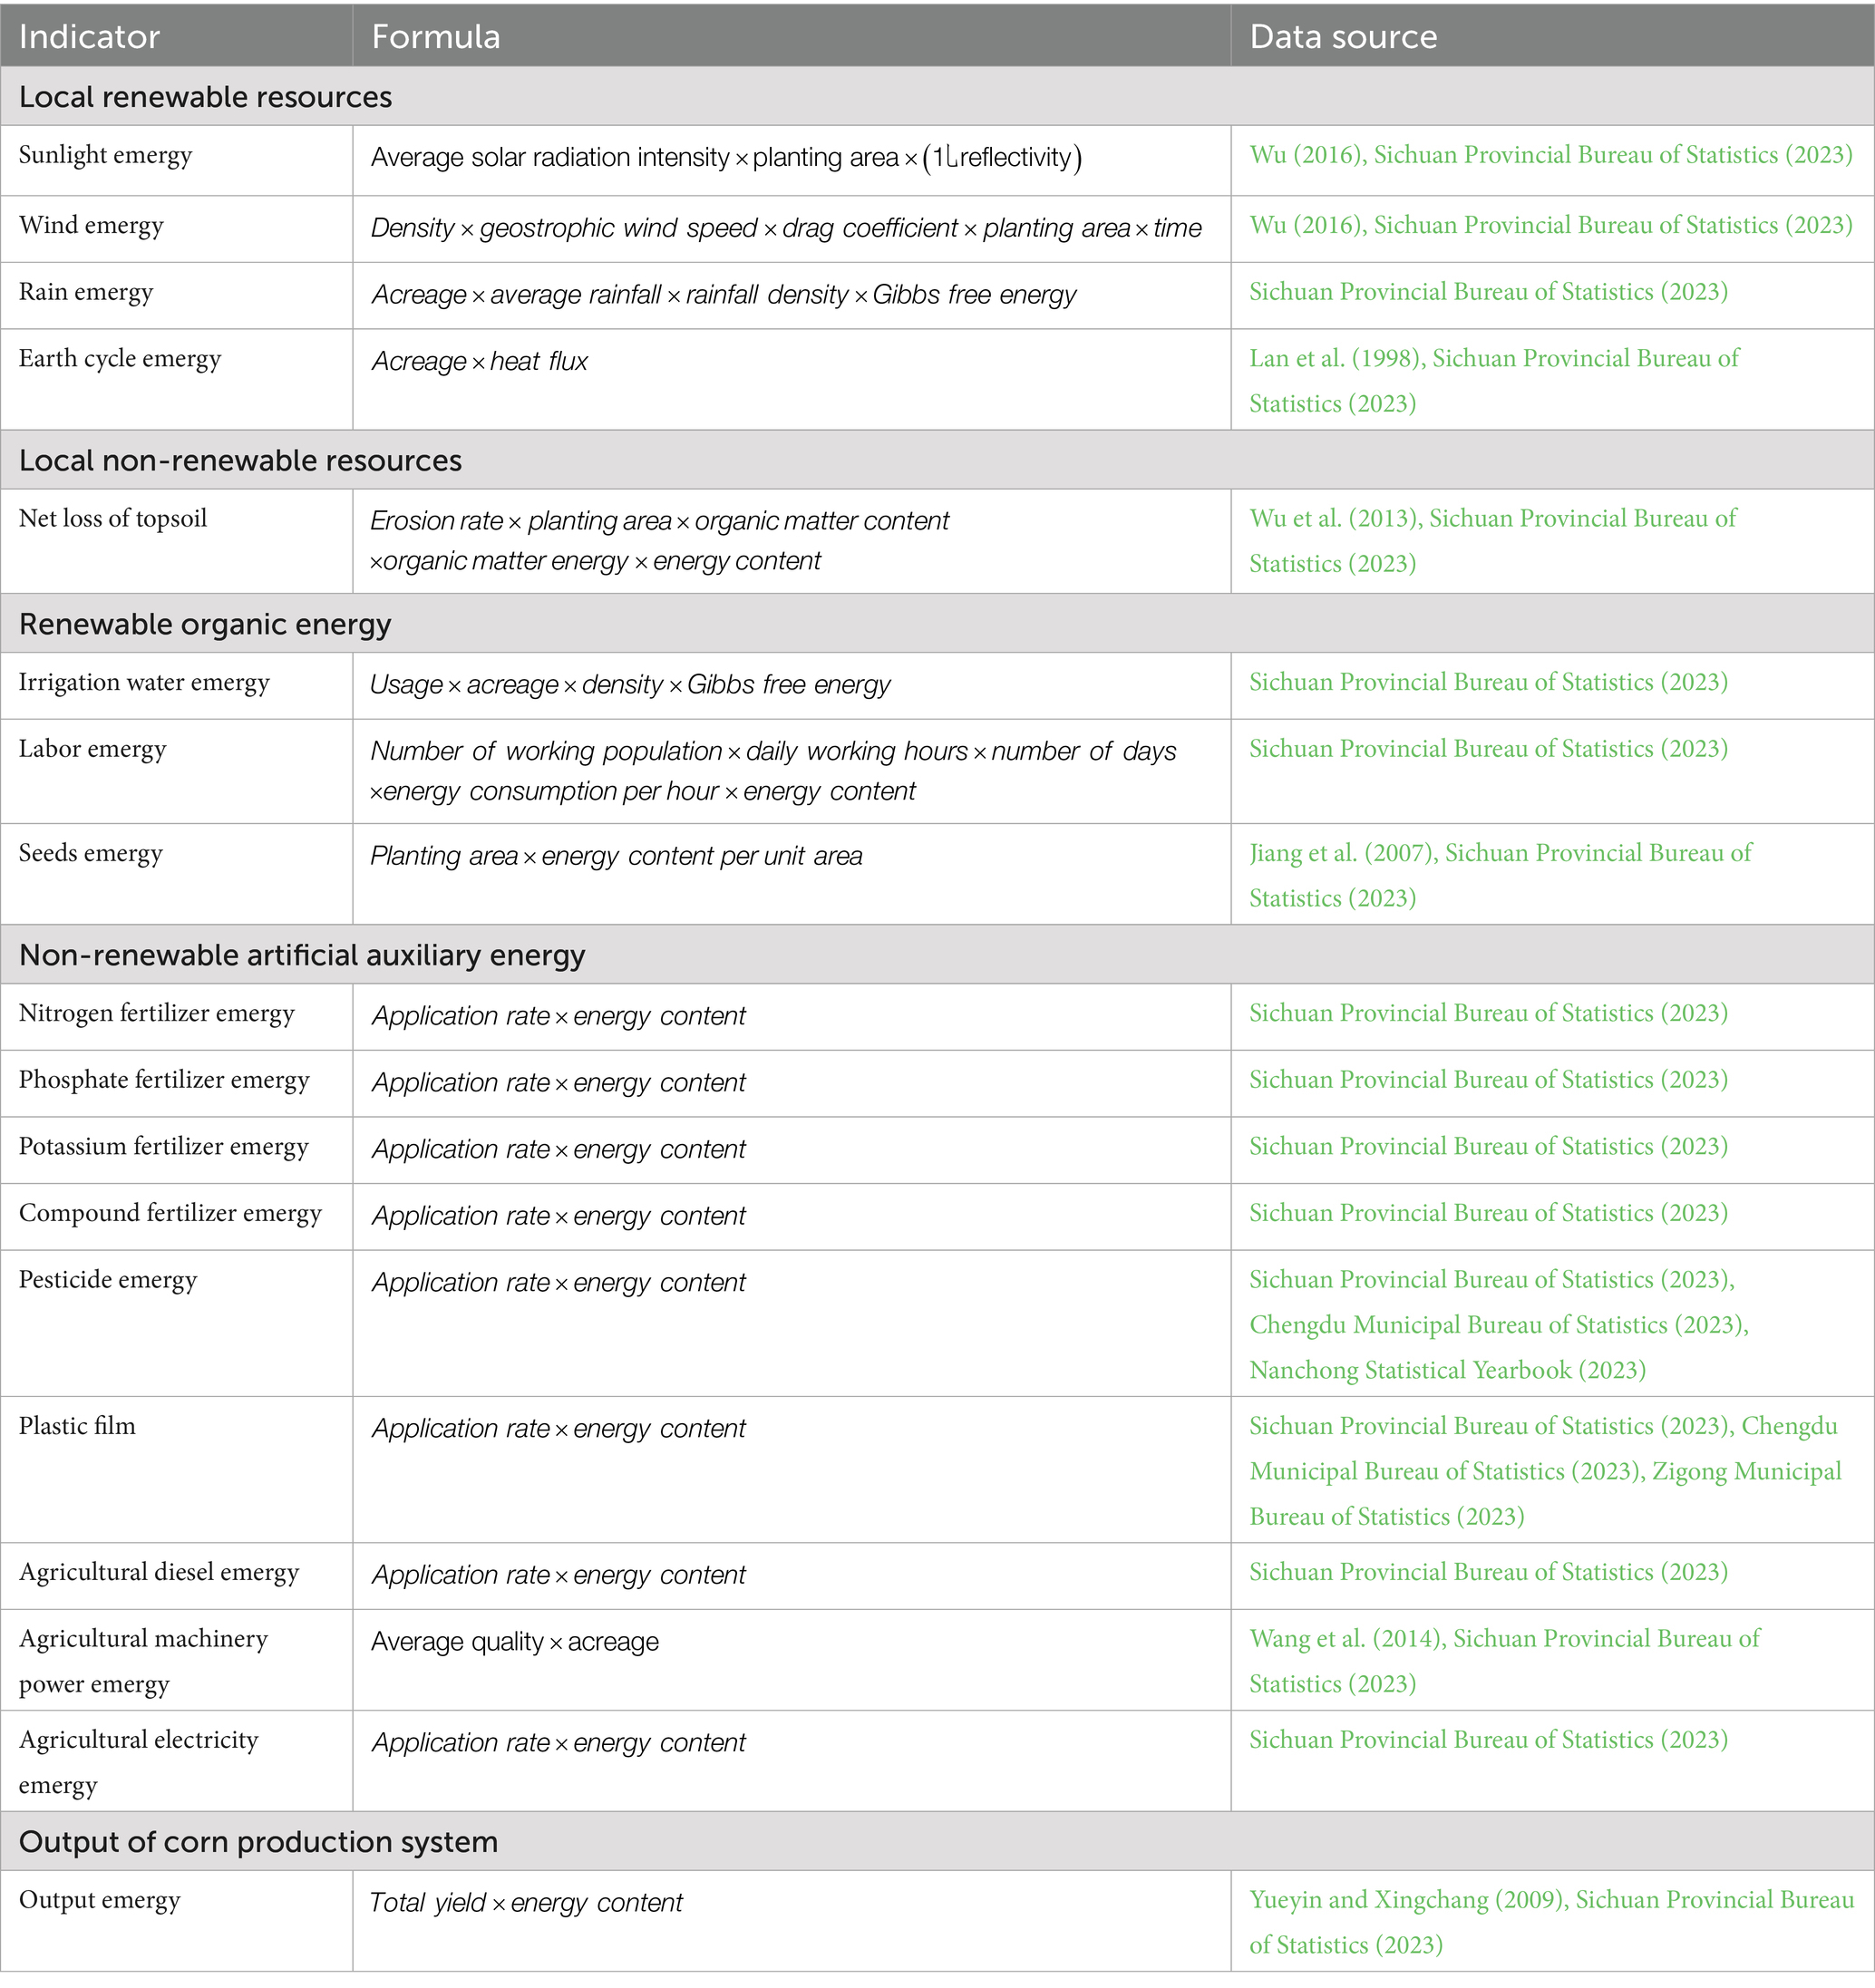
Table 3. Indicators and calculation formulas for emergy analysis.
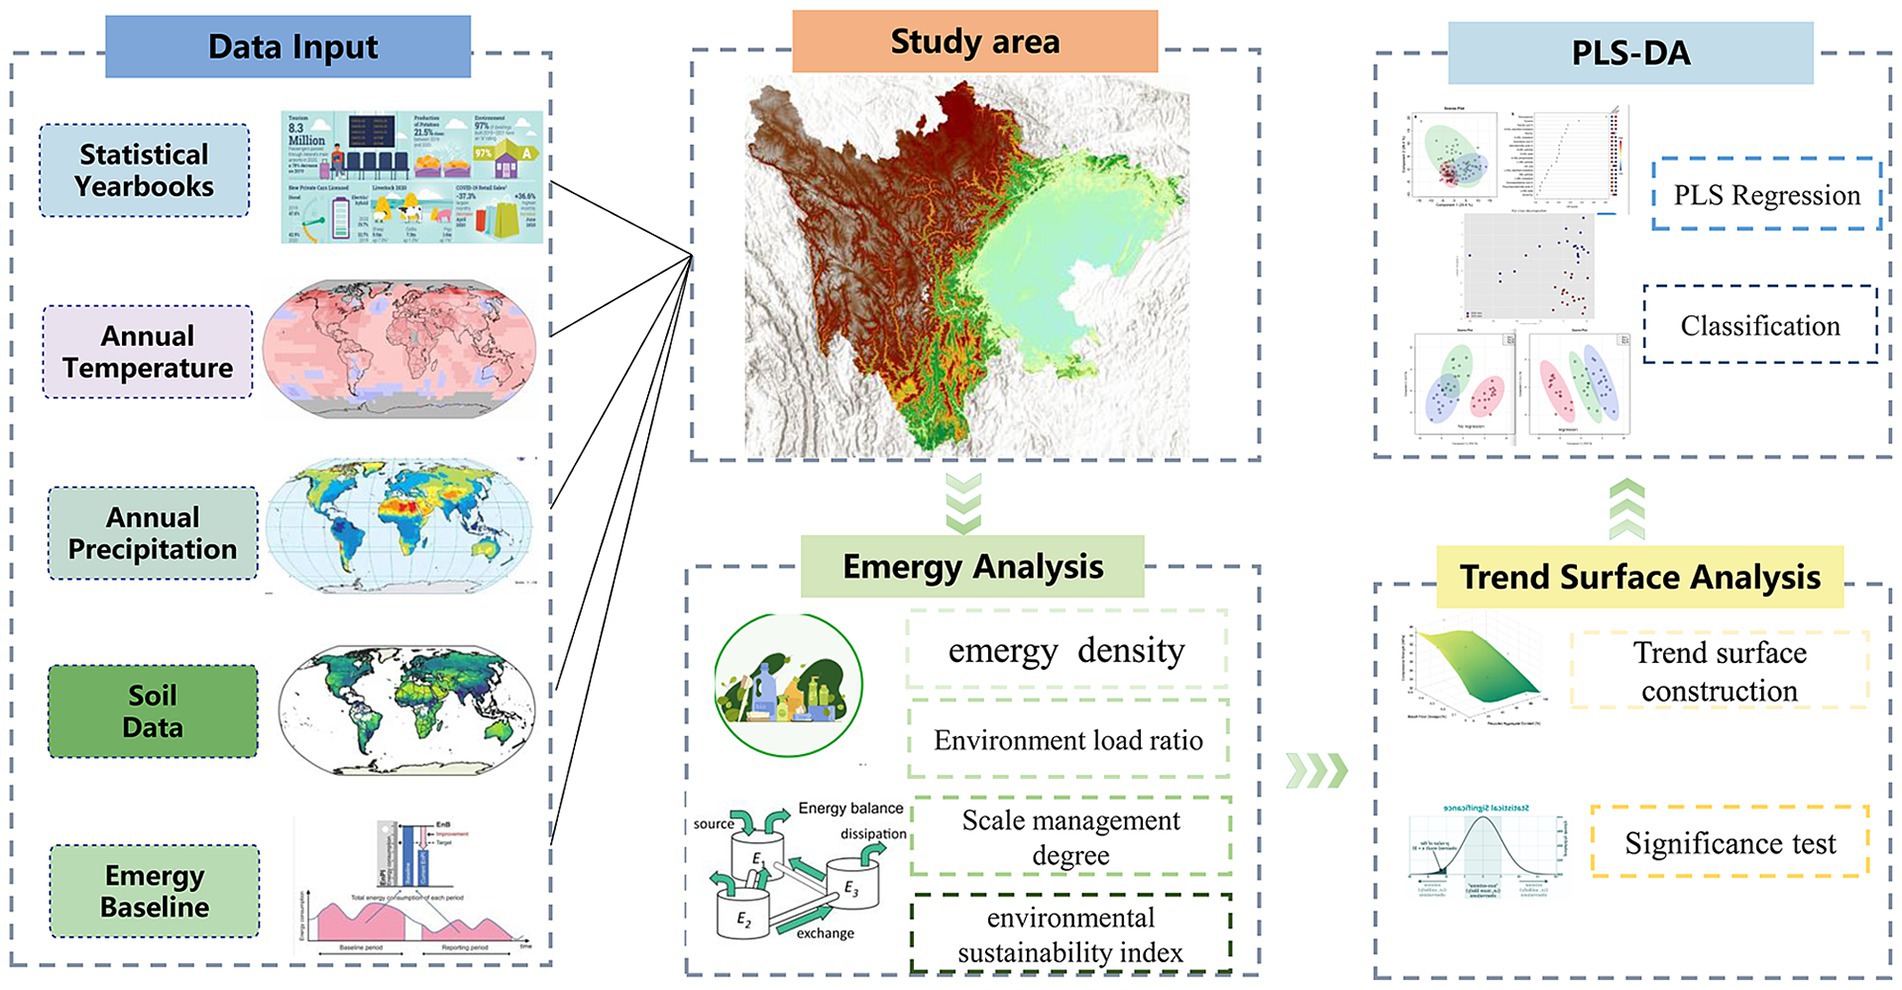
Figure 4. Emergy analysis research framework.
3 Results
3.1 Regional distribution and difference analysis of emergy input and output density
A high emergy input density indicates greater energy investment per unit of farmland, although excessive inputs may result in resource wastage and significant environmental impacts. As illustrated in Figure 5A, our analysis showed that regions with high emergy input density were concentrated in central Sichuan. Chengdu had the highest density (10.59 × 10¹¹ sej·m−2), while Garzê showed the lowest (5.36 × 10¹¹ sej·m−2), which was merely half of Chengdu’s level. The Chengdu Plain offers flat terrain ideal for large-scale mechanization, resulting in high emergy intensity levels. In contrast, the complex western terrain of Garzê severely limits mechanical farming. Our statistical analysis (Figure 5B) revealed that data dispersion was large in high-level and medium-high-level regions, suggesting diversity and complexity in emergy input practices. Meanwhile, the medium-low and low-level regions displayed more concentrated data patterns. We observed a significant overlap between adjacent categories, particularly between high and medium-high levels, as well as between medium-low and low levels, indicating gradual transitions in regional emergy input density. One-way analysis of variance confirmed significant differences among the four groups (F = 120.6, p < 0.001). The large effect size (η2 = 0.96) suggests that regional grouping explains a substantial portion of emergy input density variations.
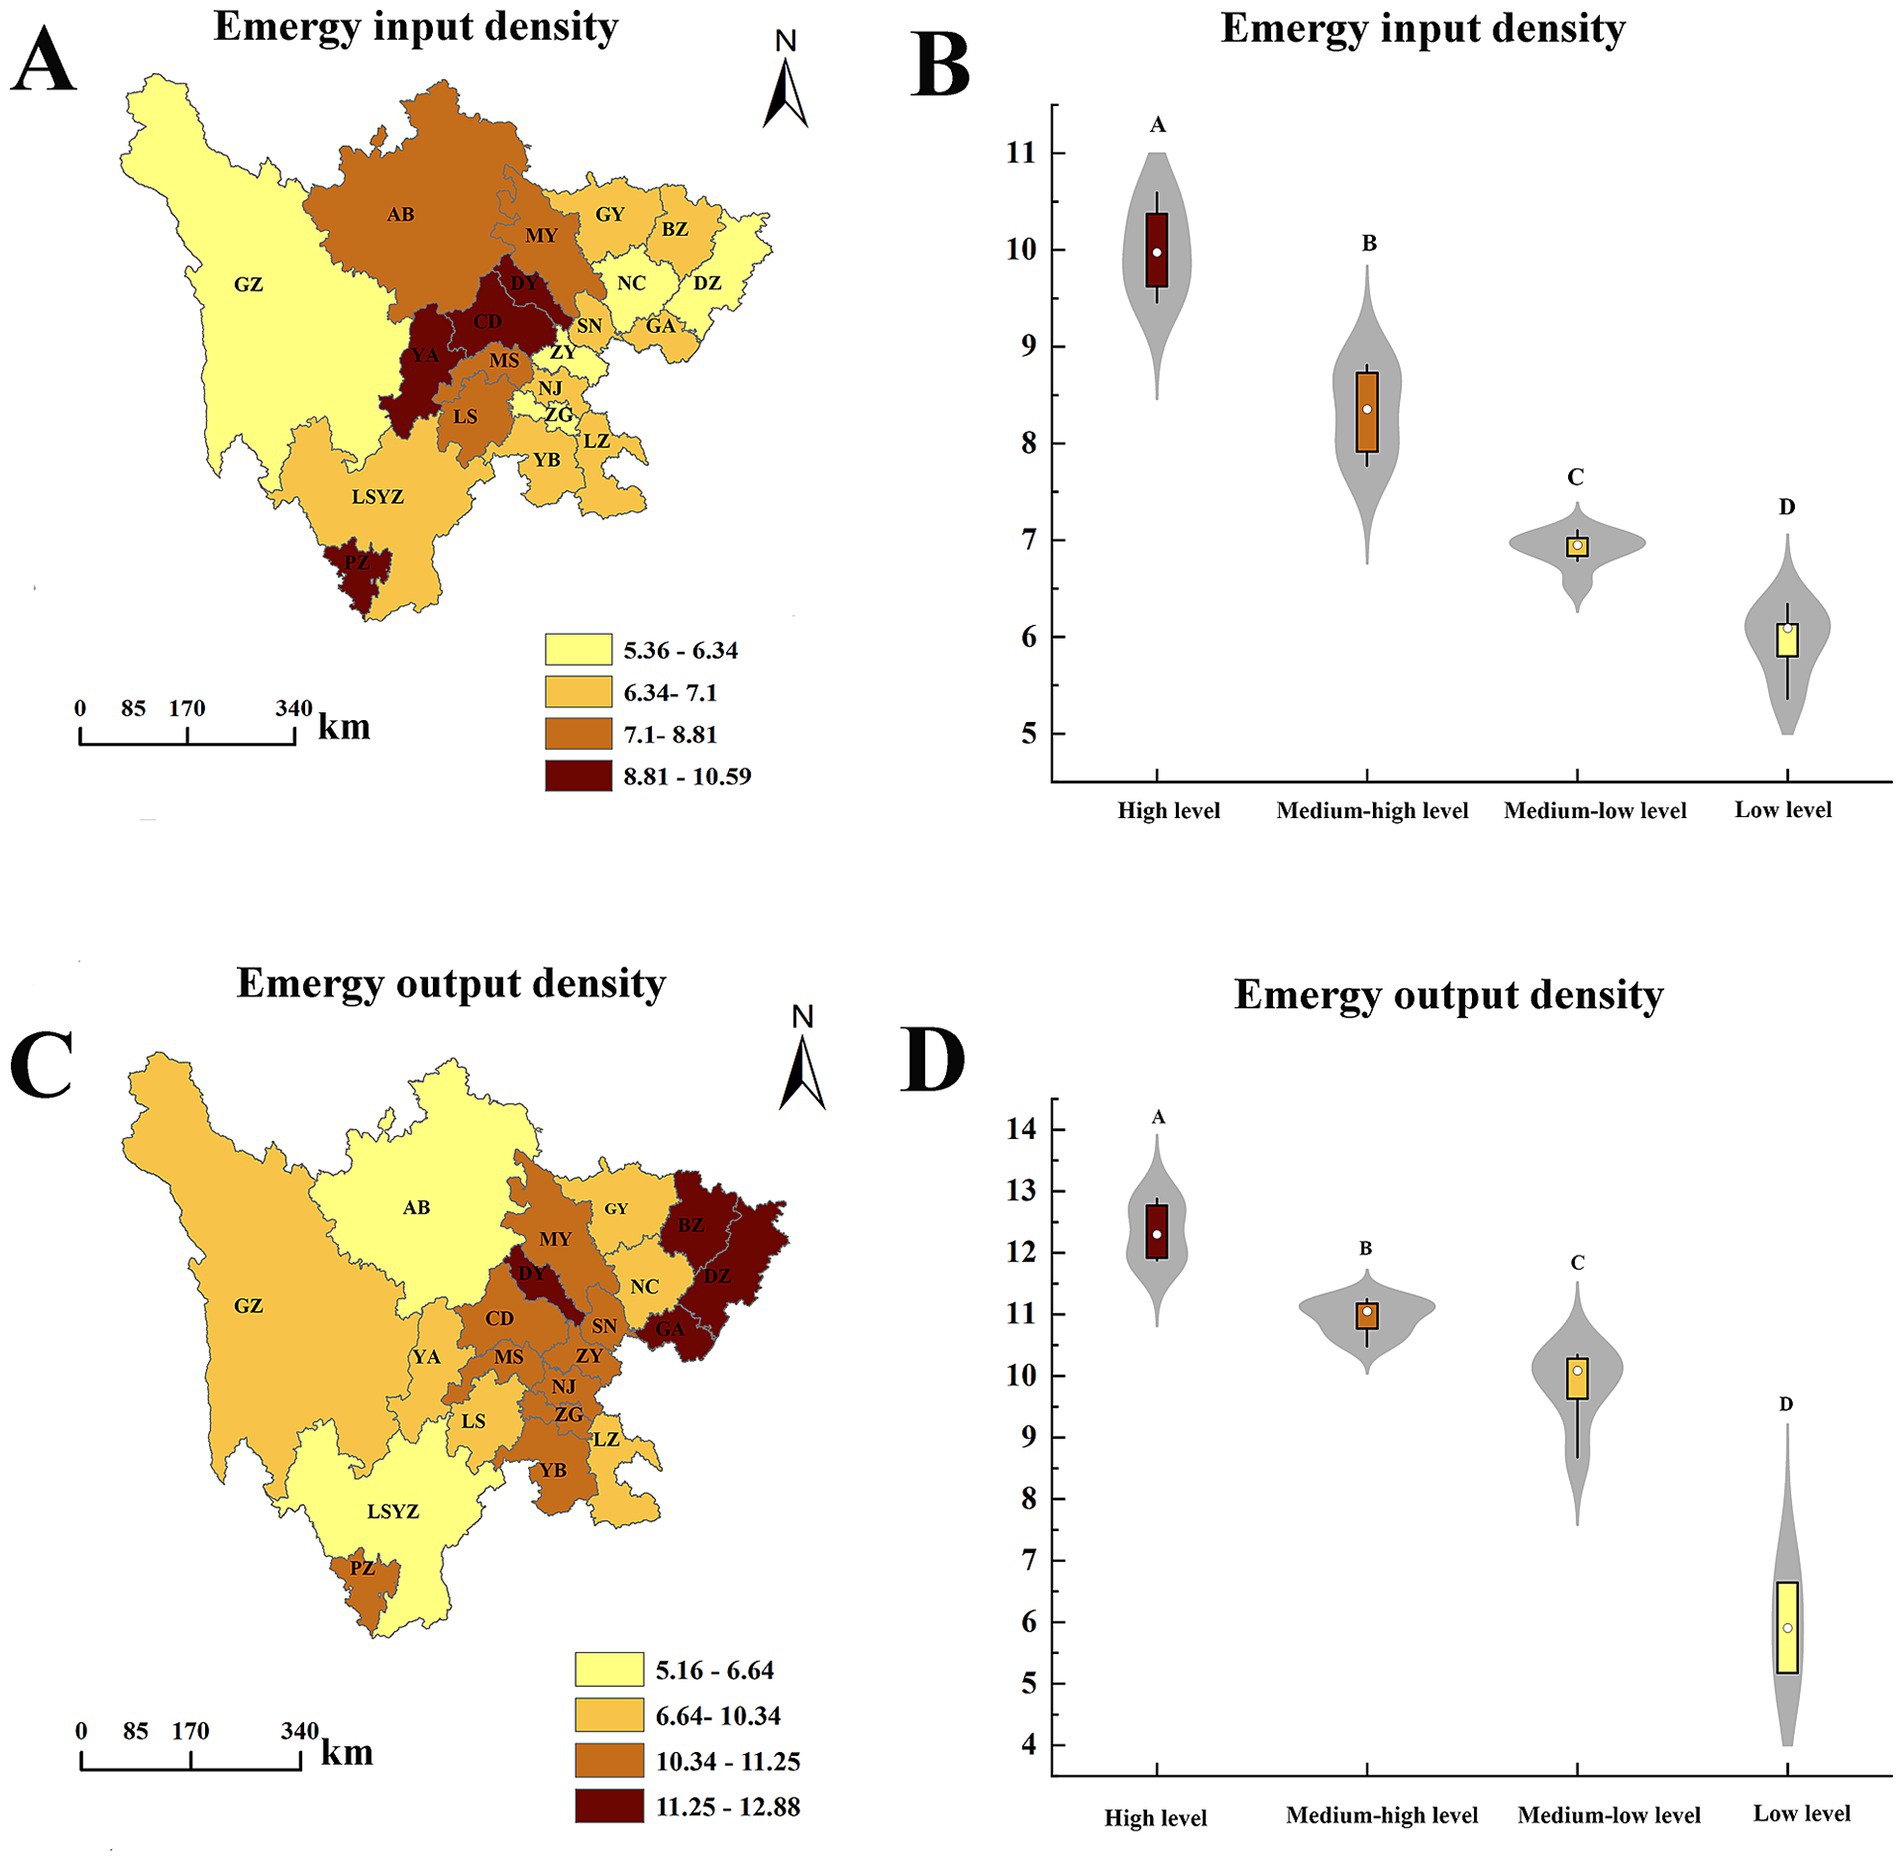
Figure 5. Emergy input and output density patterns: spatial heterogeneity and statistical analysis. The units for emergy input density and emergy output density are *1011 sej/m2. Different capital letters (A–D) indicate extremely significant differences. The same is depicted below.
The emergy output density reflects the output benefits of crop production, with higher values indicating a higher emergy output per unit area, that is, higher returns. Our spatial analysis, as illustrated in Figure 5C, reveals that high-level and medium-high-level regions are concentrated in central and eastern Sichuan, whereas medium-low and low-level regions were mainly found in western Sichuan. Aba showed the lowest density at 5.16 × 10¹¹ sej·m−2, representing only 40% of Dazhou’s output. As shown in Figure 5D, from high-level to low-level regions, the emergy output density showed a clear decreasing trend, potentially reflecting more diverse economic structures in these areas. We observed minor differences between the medium-high and medium-low level regions. One-way analysis of variance confirmed significant differences between groups (F = 71.45, p < 0.001), with an effect size (η2 = 0.94) indicating that regional grouping accounts for a substantial portion of variations in emergy output density.
3.2 Regional distribution and difference analysis of emergy investment ratio and net emergy yield ratio
A higher emergy investment ratio indicates a more advanced level of economic development, whereas a lower ratio suggests less development and greater environmental dependence. As illustrated in Figure 6A, Chengdu showed the highest emergy investment ratio at 4.13, primarily because of its substantial input of purchased auxiliary emergy relative to the total emergy input. In contrast, Garzê had the lowest ratio of 1.67, just 40% of Chengdu’s value, mainly because of its low proportion of renewable organic emergy input to total emergy. Regions with high development levels typically demonstrate superior emergy investment efficiency, likely because of their advanced technology, well-developed infrastructure, and effective resource allocation systems (Figure 6B). However, significant variations within these high-level regions suggest room for further optimization. Medium-low level regions showed the least internal variation, while low-level regions displayed greater differences, suggesting that medium-low level regions have more consistent energy utilization patterns, whereas low-level regions showed more variability and potential for improvement. Statistical analysis using one-way analysis of variance revealed significant differences between the four groups (F = 168.37, p < 0.001), with an effect size (η2 = 0.97) indicating that group classification strongly influences observed variations.
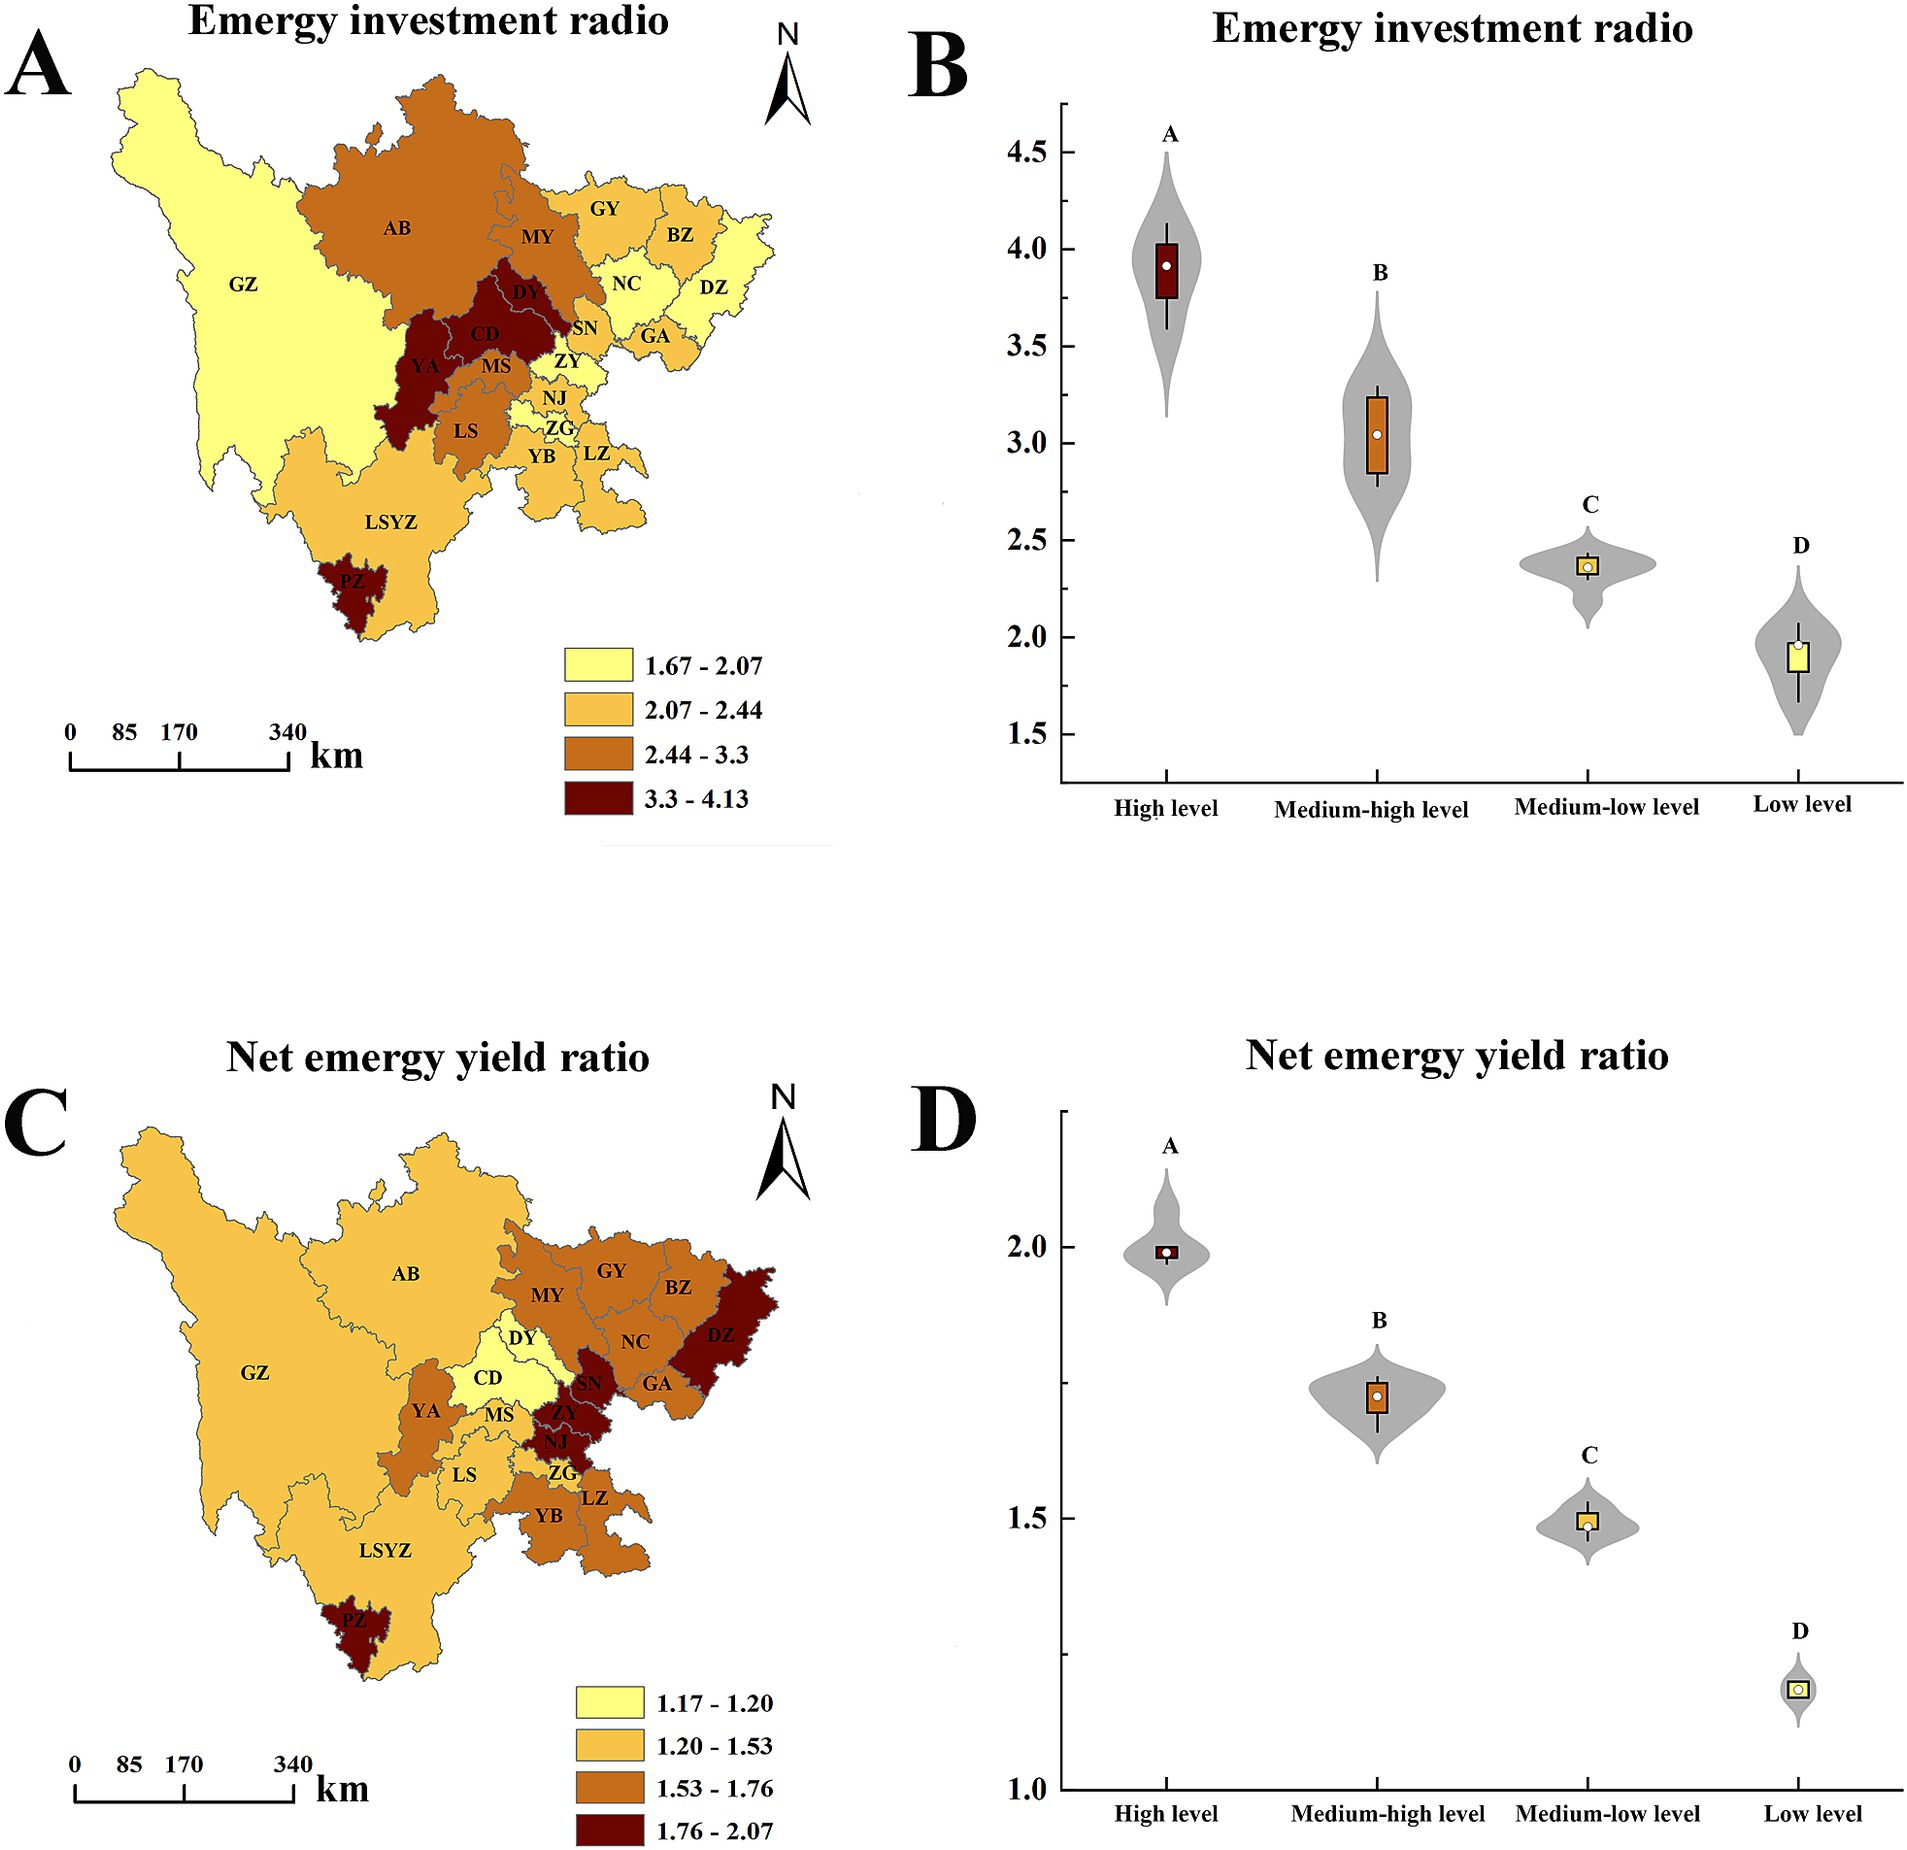
Figure 6. Emergy investment ratio and net emergy yield ratio patterns: spatial heterogeneity and statistical analysis. Different capital letters (A–D) indicate extremely significant differences. The same is depicted below.
The net emergy yield ratio is a standard measure of system productivity, with higher values reflecting greater system production efficiency. As shown in Figure 6C, only two regions, Deyang and Chengdu, were in the low-level category, with Chengdu showing the lowest net emergy yield ratio at 1.17, indicating a highly-level lack of coordination between crop production and economic development. Among the high-level regions, Ziyang demonstrated the highest net emergy yield ratio at 2.07, representing a 76% increase over Chengdu’s value. Both high- and low-level regions showed small data fluctuations, with high-level regions displaying more concentrated data distribution, suggesting that these areas may have achieved stable energy efficiency (Figure 6D). In contrast, medium-high and medium-low level regions indicated more scattered data patterns, potentially indicating that they are at a crucial stage of improving energy efficiency, with substantial potential for improvement. Statistical analysis using one-way analysis of variance revealed significant differences among the four groups (F = 455.7, p < 0.001), with an effect size (η2 = 0.98) demonstrating that group differences account for almost all net emergy yield ratio variations.
3.3 Regional distribution and comparative analysis of scale management degree and environmental loading ratio
Labor input is the primary factor that influences the scale management degree. Within the same crop production system, a higher labor input typically correlates with a lower scale management degree. Additionally, labor requirements are strongly correlated with farmland topography, with flat terrain facilitating large-scale farming. In Figure 7A, low-level regions included Garzê and Aba, averaging 21.64, primarily due to their hilly terrain, uneven farmland, and heavy reliance on manual farming methods. High-level regions averaged 57, with Suining showing the highest scale management degree at 59.8, largely because of its central location in the Sichuan Basin, with flat terrain and concentrated corn cultivation that enables mechanized production and large-scale management. High-level regions consistently demonstrated elevated and uniform scale management degrees, while medium-high level regions showed more dispersed data distribution. As the level decreases, both the overall scale of management degree declines and regional differences widen (Figure 7B). Statistical analysis using one-way analysis of variance revealed significant differences between the four groups (F = 66.89, p < 0.001), with an effect size (η2 = 0.92) indicating that group classification strongly influences variations in the scale management degree.
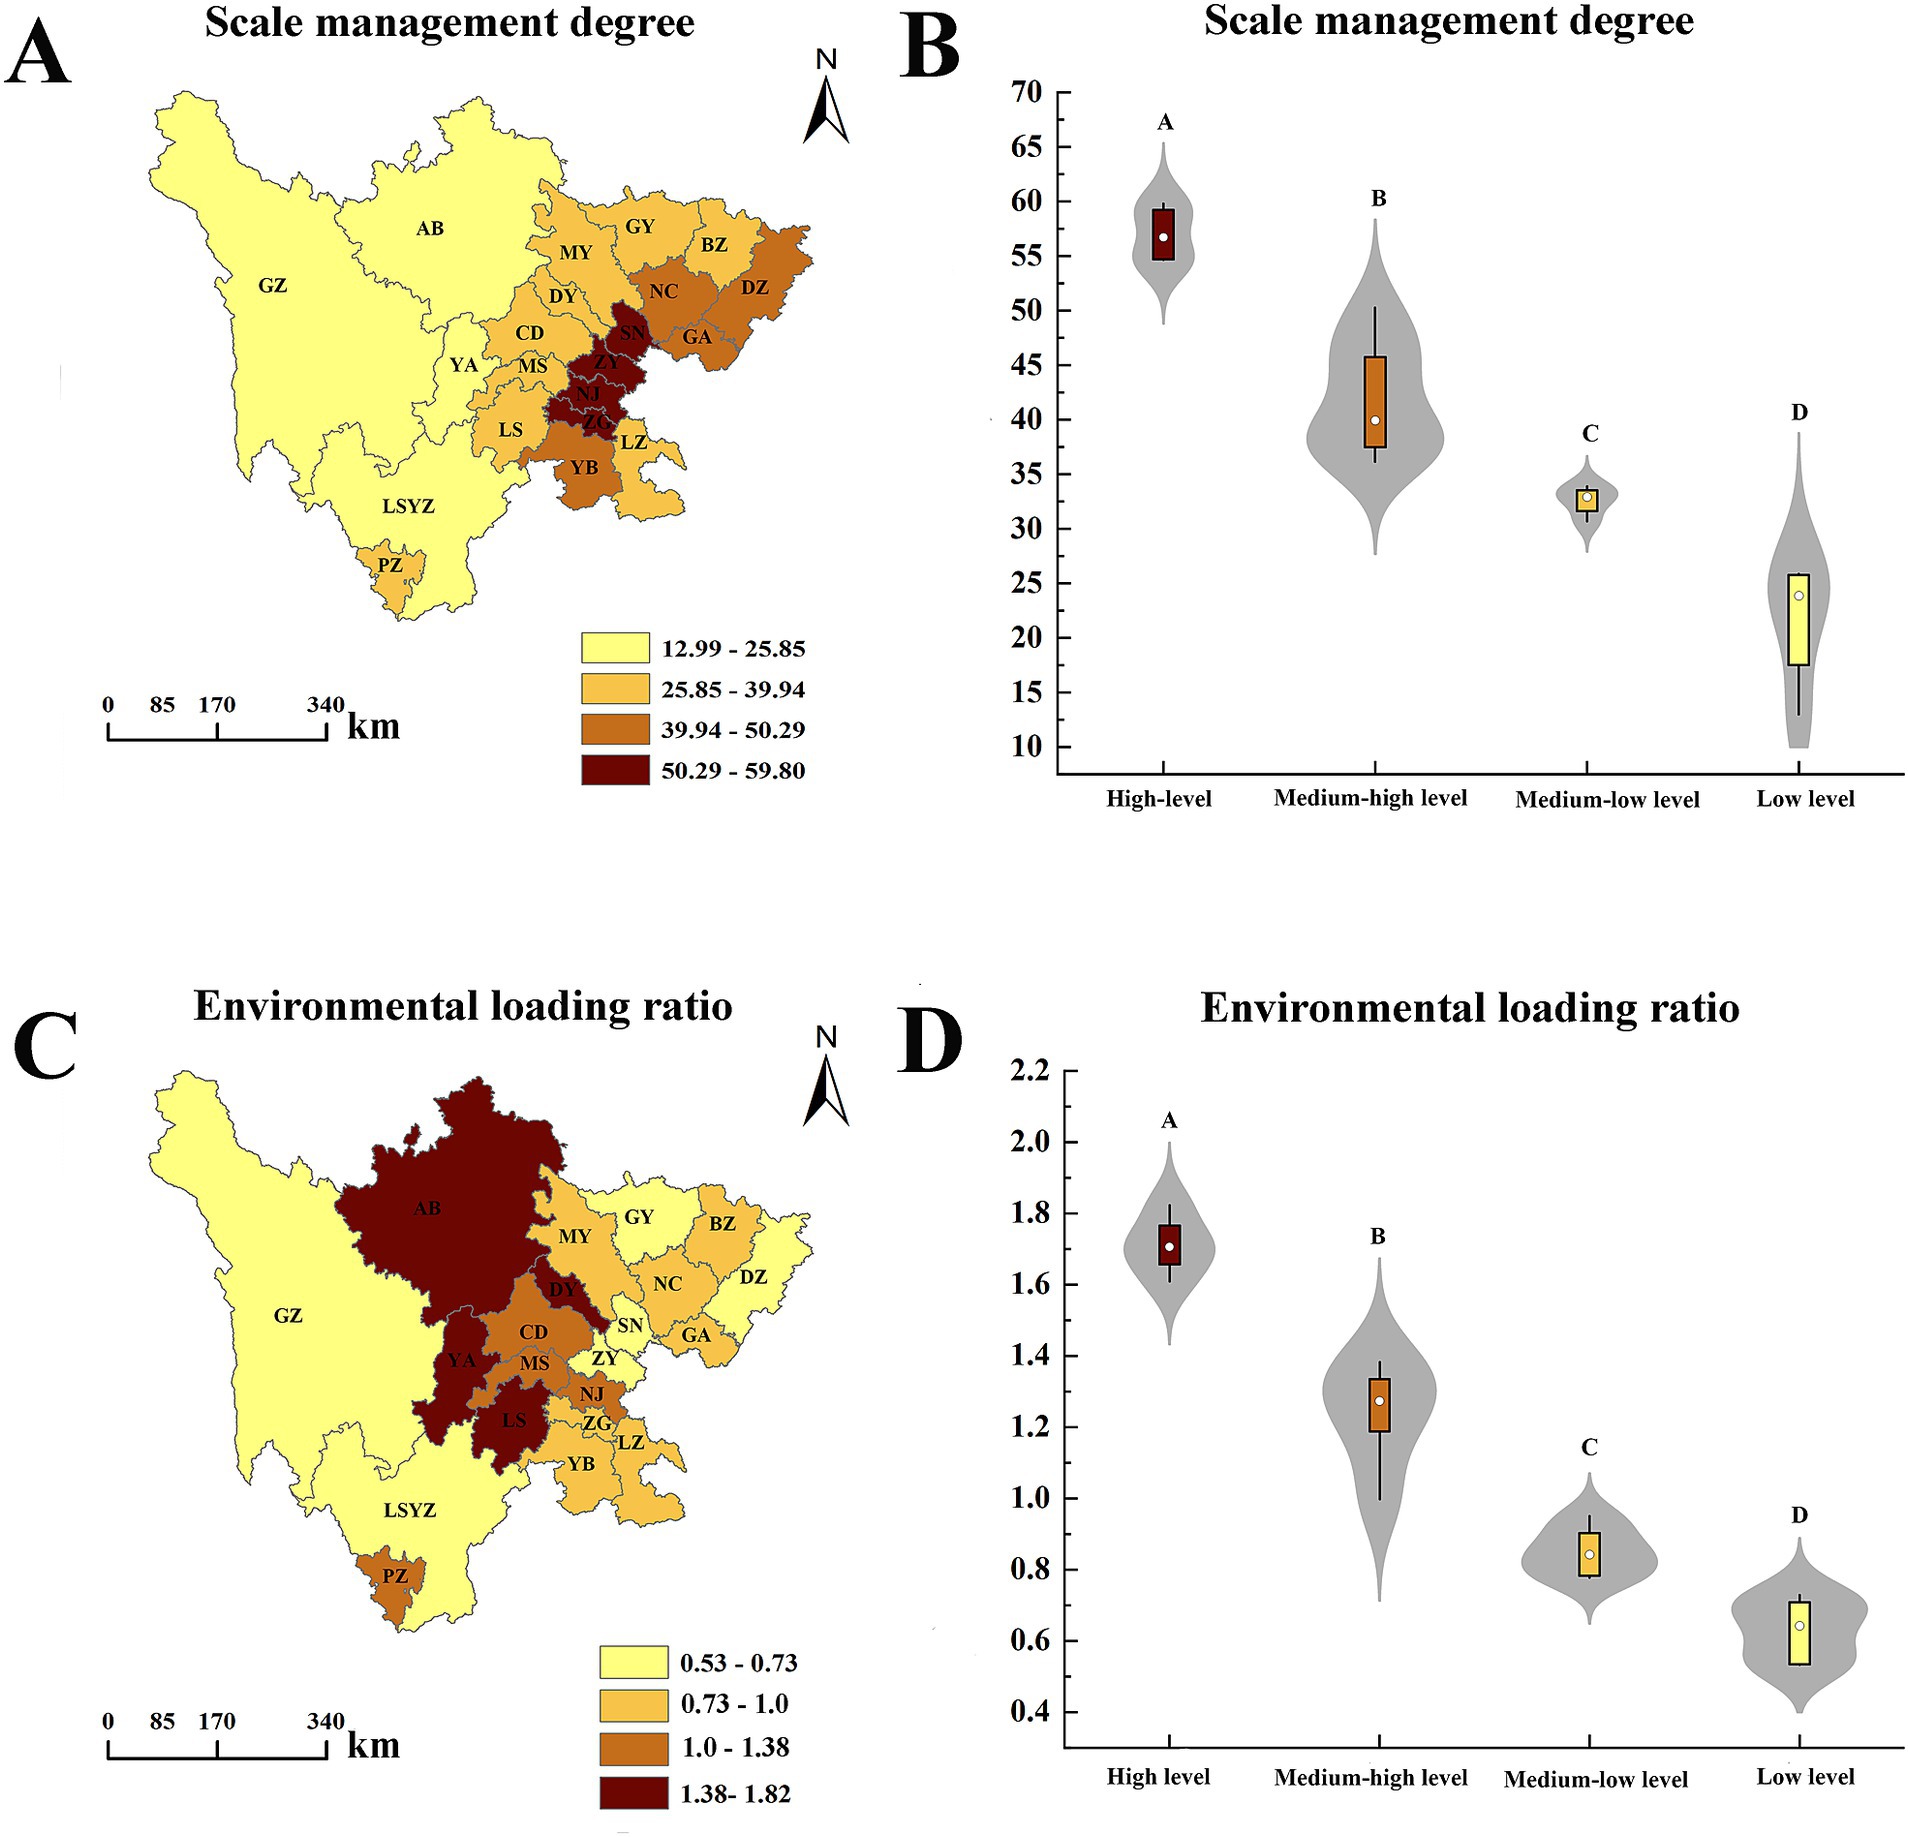
Figure 7. Scale management degree and environmental loading ratio patterns: spatial heterogeneity and statistical analysis. Different capital letters (A–D) indicate extremely significant differences. The same is depicted below.
Excessive use of non-renewable resources by humans can lead to severe ecological degradation, with environmental loading increasing as the consumption of non-renewable resources increases. As shown in Figure 7C, low-level and medium-low level regions have environmental loading ratios below 1, accounting for 67% of Sichuan, indicating that corn cultivation in these cities did not significantly impact the environment. The average environmental loading ratio is 1.29 for medium-high level regions and 1.71 for high-level regions, suggesting that it is important to emphasize non-renewable resource inputs in corn planting systems within these areas. High-level regions showed concentrated data, with a narrow distribution range (Figure 7D). The medium-high level regions demonstrated the greatest data dispersion, with the widest distribution range. In contrast, the medium-low and low-level regions maintained lower and stable environmental loading ratios. One-way analysis of variance revealed significant differences between the four groups (F = 185.96, p < 0.0001), with an effect size (η2 = 0.97) indicating that group classification profoundly impacts result variation, showing substantial and significant differences across all levels.
3.4 Analysis of sustainability trends in corn planting ecosystems
To identify the optimal trend surface model, we spatially applied first-, second-, third-, fourth-, and fifth-order trend surface models to simulate the environmental sustainability index of Sichuan’s corn planting ecosystem (Figure 8A). The first-order trend surface model demonstrated the highest goodness of fit (R2 = 0.63). Consequently, this model was used to evaluate spatial variation in the environmental sustainability index of Sichuan’s corn planting ecosystem. It represents patterns that emerge after eliminating random and local fluctuations. In Figure 8B, despite local undulations and fluctuations in central Sichuan, the overall environmental sustainability index showed a decreasing gradient from northeast to southwest, displaying an inclined plane-shaped spatial distribution pattern. This model’s parameters were statistically significant (F = 121.15, p < 0.05) and the regression model exhibited a high goodness of fit for the cross-sectional data (R2 > 0.5).
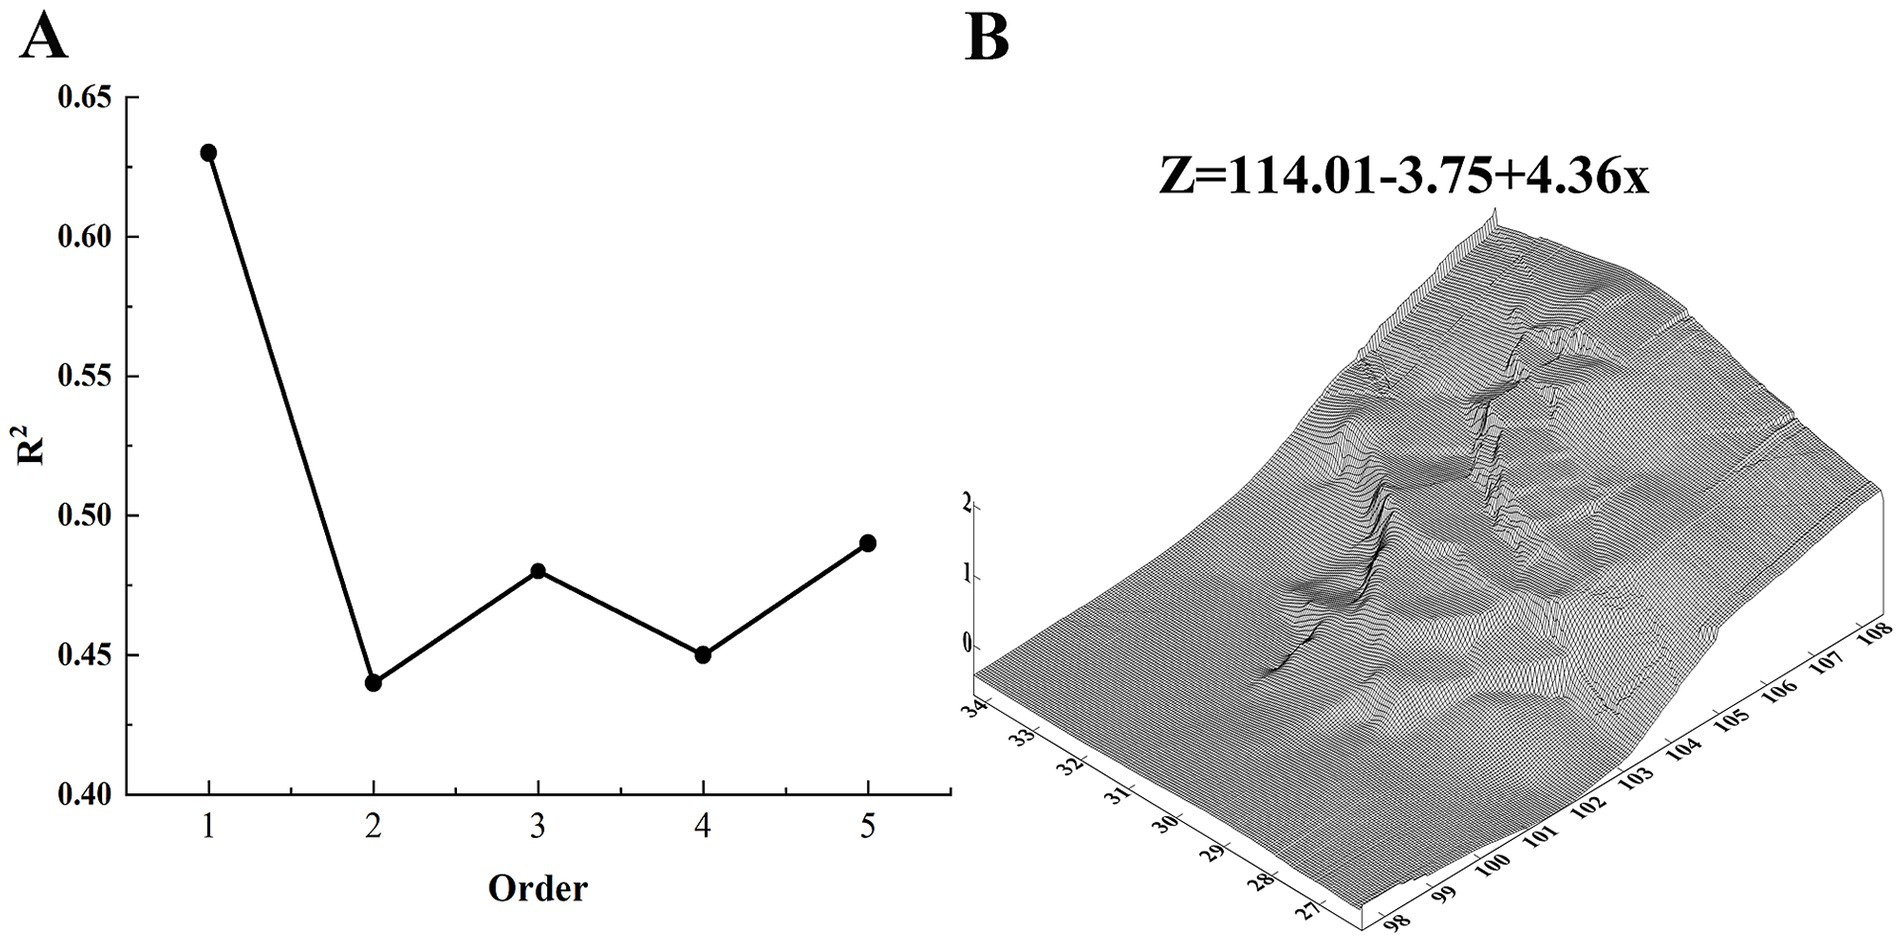
Figure 8. Selection of optimal trend surface model (A) and first-order trend surface model for environmental sustainability index of corn planting ecosystem (B).
According to the loading plot (Figure 9A), the goodness of fit (R2 = 0.89) demonstrated that the PLS-DA model effectively differentiated the environmental sustainability index of corn planting ecosystems across the province. The 21 prefecture-level cities/autonomous prefectures were distinctly categorized into four groups: Group 1 (YA, CD, DY, PZ, and MS), Group 2 (GA, NJ, SN, DZ, and ZY), Group 3 (GY, BZ, NC, LZ, ZG, YB, LS, and SN), and Group 4 (AB, LSYZ, and GZ). Group 1 showed a strong correlation with emergy input density, emergy investment ratio, and environmental loading ratio, indicating that this group exhibited higher values in these metrics. Group 2 correlated strongly with emergy output density, net emergy yield ratio, and scale management degree, suggesting that this group demonstrated higher performance in these aspects. Group 3 showed a weak correlation with all emergy indicators, including the emergy investment ratio, environmental loading ratio, emergy input/output densities, scale management degree, and net emergy yield ratio, exhibiting a greater distance from these metrics. Group 4 was the most distant from these emergy indicators, and showed the weakest correlation. VIP is an indicator for measuring the importance of explanatory variables, with values exceeding 1, typically indicating a significant influence on the response variables. In Figure 9B, the net emergy yield ratio, emergy output density, and scale management degree all show VIP values greater than 1, indicating that variations in these indicators contribute to significant spatial differences in corn sustainability across Sichuan.
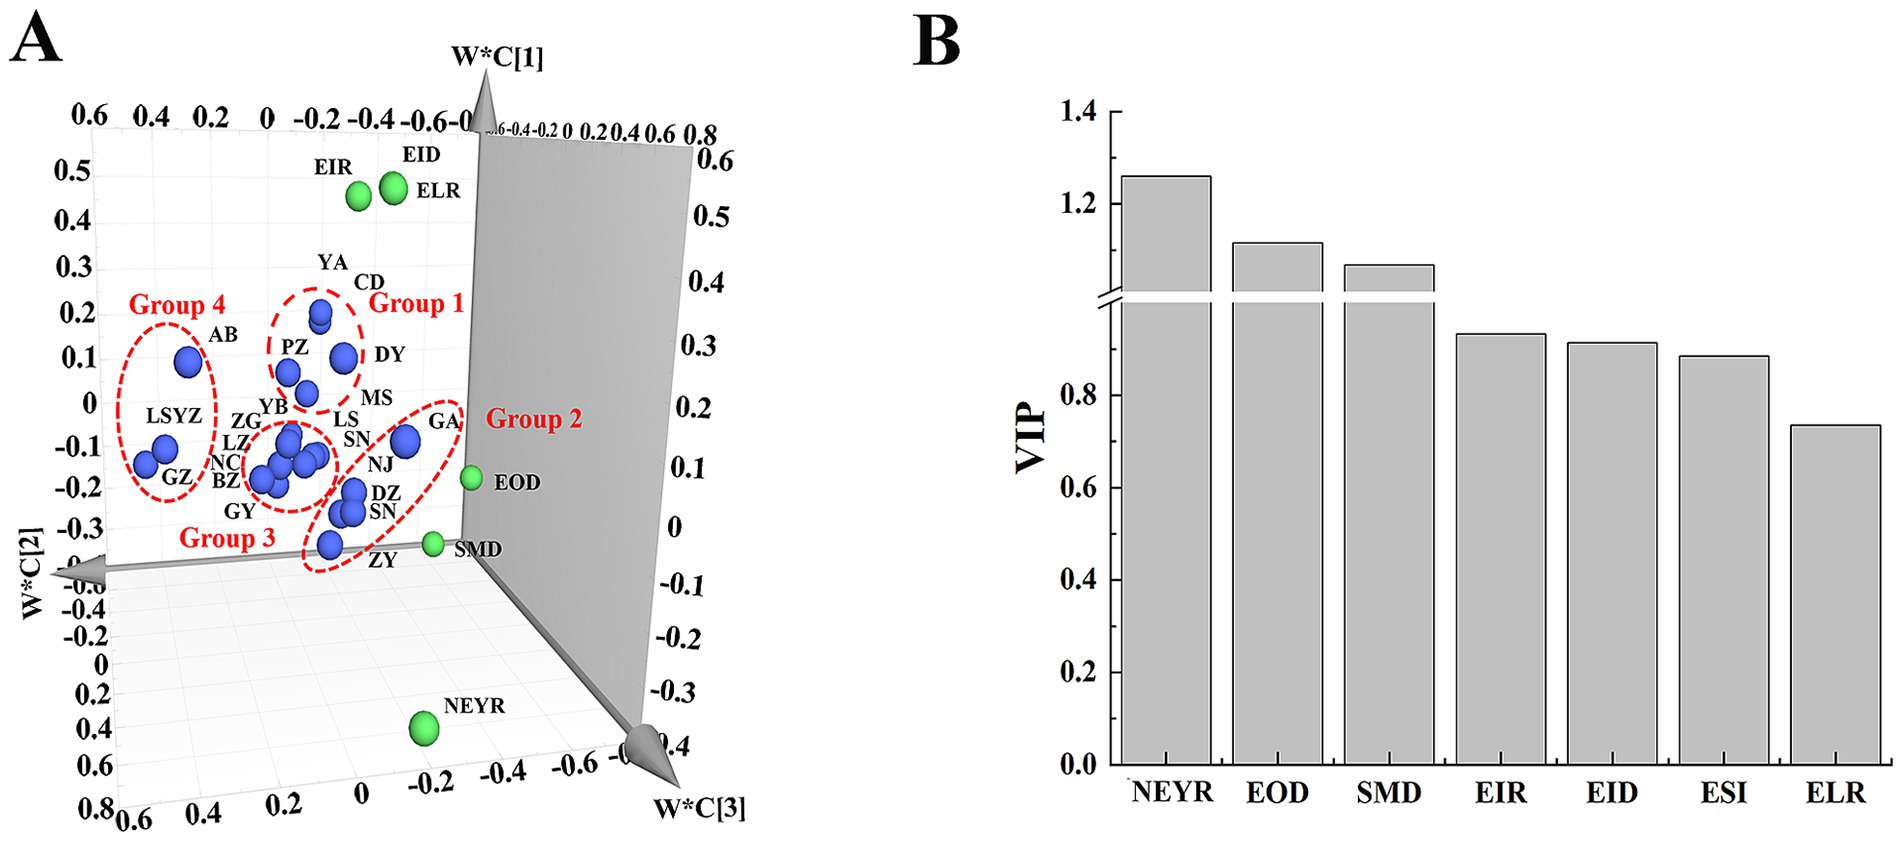
Figure 9. Loading plot (A) and VIP (B) from PLS-DA of environmental sustainability index in corn planting ecosystems. The first loading coefficient (w*c[1]); the second loading coefficient (w*c[2]); and the third loading coefficient (w*c[3]). net emergy yield ratio (NEYR); emergy output density (EOD); scale management degree (SMD); emergy investment ratio (EIR); emergy input density (EID); environmental sustainability index (ESI); environmental loading ratio (ELR).
4 Discussion
The emergy analysis method provides a quantitative valuation of environmental resources, revealing the intrinsic relationship between natural environmental resources and the economy—which purely traditional energy and economic analyses cannot achieve. This approach is significant in challenging the long-standing misconception that environmental resources lack value simply because they are not products of labor (Zhai et al., 2017; Zhai et al., 2018; Zhao et al., 2019; Asgharipour et al., 2020). While prioritizing the economic development of food production, we use emergy analysis to assess the balance between environmental resources and economic growth, highlighting environmental protection and the improvement of ecological benefits (Jafari et al., 2018; Ali et al., 2019). The main innovations of this research were as follows: First, it integrated moving weighted trend surface analysis and PLS-DA into an emergy evaluation system, constructing a novel analytical framework to identify the driving mechanisms behind regional differences. Second, based on Sichuan complex terrain and significant regional development disparities, we established a comprehensive evaluation system covering 18 core indicators. This system deeply aligned with the typical characteristics of agricultural ecosystems in Southwest mountainous regions, enhancing both the regional representativeness and applicability of the evaluation results. Finally, the findings directly addressed the needs of differentiated agricultural development strategies, providing solid scientific support for the precise formulation and optimization of regional agricultural policies, achieving effective integration between theoretical research and practical applications.
4.1 Regional variations in emergy characteristics of corn planting systems in Sichuan Province
This study uses an emergy analysis methodology to evaluate the sustainable development of corn planting systems across 21 prefecture-level cities/autonomous prefectures in Sichuan. In terms of emergy input and output, Dazhou exhibits low emergy input density but high emergy output density, indicating efficient resource utilization with high yields, despite low resource investment per unit area. Located in eastern Sichuan’s basin’s peripheral mountains with a well-developed environment, Dazhou benefits from favorable ecological conditions and optimal planting density, resulting in high corn productivity. Regarding emergy investment and net yield, Chengdu and Deyang had high emergy investment ratios but low net emergy yield ratios, reflecting advanced economic development with reduced environmental dependence and low production efficiency, indicating a significant imbalance between crop production and economic development. In terms of scale management degree and environmental loading ratio, Suining and Ziyang demonstrated high scale management with low environmental loading ratios, characterized by minimal labor input, efficient management, and reduced environmental impact, making them ideal regions for corn cultivation. Conversely, Aba and Ya’an show a low scale management degree but high environmental loading ratios, indicating limited mechanization, inefficient management, and significant environmental pressure, necessitating adjustments in resource utilization, particularly non-renewable resources. By 2025, the grain production and consumption gaps are projected to reach 14.7343 million tons, requiring an additional 2,644.58 thousand hectares of cultivation area, based on Sichuan’s current grain yield. Amidst resource constraints, meeting the growing demand for diverse, high-quality grain remains the primary challenge for Sichuan’s food security (Yusha, 2021).
Natural emergy inputs to corn production systems (including solar energy, wind energy, and precipitation) remained regionally stable, providing baseline energy support for system operations. However, significant regional variations exist in purchased emergy inputs such as fertilizers, pesticides, and machinery. These human energy interventions create distinct ecological and economic characteristics for the same crop across different regions (Asgharipour et al., 2019; Nan et al., 2020). For example, corn production systems in the Chengdu Plain (including Chengdu, Deyang, Mianyang, Meishan, Leshan, Yibin, Zigong, Neijiang, Ziyang, Suining, and Nanchong) demonstrate significantly higher emergy investment and environmental loading ratios compared to mountainous regions (including Aba, Garzê, Liangshan, and Panzhihua), due to higher purchased emergy inputs (2.97 × 10²¹ sej/ha/year). These variations are key drivers of ecosystem differentiation, providing a theoretical foundation for optimizing regional agricultural production structures and reducing environmental loading (Lu et al., 2017; Liu et al., 2019). Based on the results of this study, we propose specific policy recommendations and technical improvement measures to help each region achieve efficient and sustainable agricultural production (Table 4).
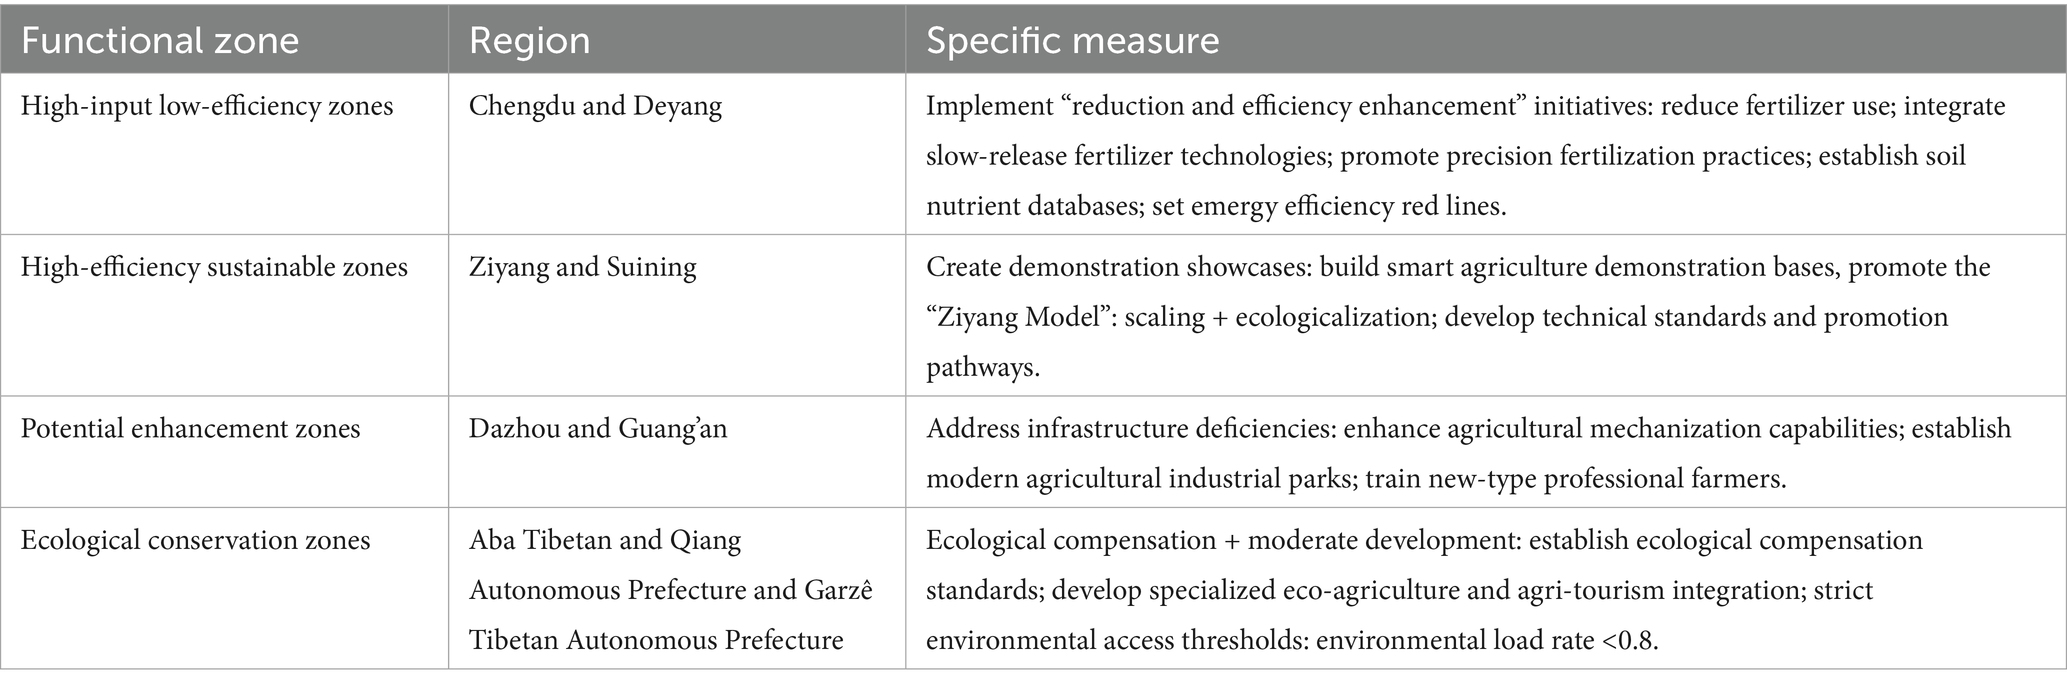
Table 4. Implementing precision-targeted policy measures across four functional zone categories.
4.2 Spatial differentiation patterns of emergy sustainability in corn planting systems
The emergy environmental sustainability index provides a comprehensive measure of a system’s capacity for sustainable development, and regional variations in these indices reveal how different combinations of energy inputs affect system sustainability. Higher environmental sustainability index values indicate that a system has achieved favorable economic benefits and ecological balance while maintaining its core stability (Sha et al., 2015; Cheng et al., 2017). The sustainable development of Sichuan’s corn planting systems exhibits distinct spatial heterogeneity patterns, aligning with the ecosystem core hypothesis regarding the impact of purchased emergy inputs on ecosystem evolution (Wang and Zhai, 2019). Trend surface analysis revealed a decreasing gradient in the sustainable development index from northeast to southwest (R2 = 0.63, p < 0.05), reflecting the combined effects of natural resource endowment and purchased emergy inputs. As noted, under identical climatic conditions, the coexistence of different ecosystem types depends on the relationship between natural and purchased emergy (Wang and Zhai, 2019). The higher sustainable development index in northeastern Sichuan likely results from a better balance between favorable natural conditions and moderately purchased emergy inputs. Conversely, the lower index in the southwest may indicate an overreliance on purchased emergy inputs in pursuit of high yields. In the northern farming-pastoral ecotone, cash crops required the highest purchased emergy input (101.04–147.67 × 10¹⁴ sej/ha/year), while natural grasslands were able to maintain functionality with minimal purchased emergy input (3.53–4.21 × 10¹⁴ sej/ha/year). Higher purchased emergy inputs may compromise long-term ecosystem sustainability (Wang and Zhai, 2019). By regulating purchased emergy inputs, we can guide the system’s evolution toward greater sustainability while maintaining the stability of the natural emergy core.
Sensitivity analysis results indicated that FN and N showed significant negative correlations with ESI, while FR and R demonstrated positive correlations with ESI (Figure 10). FN has the most significant impact on ESI, with a 20% increase leading to a 13.7% decrease in ESI, showing the strongest negative sensitivity. The sensitivity of variables affecting ESI ranked as follows: FN > R > N > FR. Changes in FN produced the maximum fluctuation in the sustainable development index, while the impact of FR was relatively moderate. Reducing dependence on FN and N while increasing the use of FR and R will significantly enhance sustainable development levels. In particular, controlling FN usage should become the priority strategy for improving ESI.
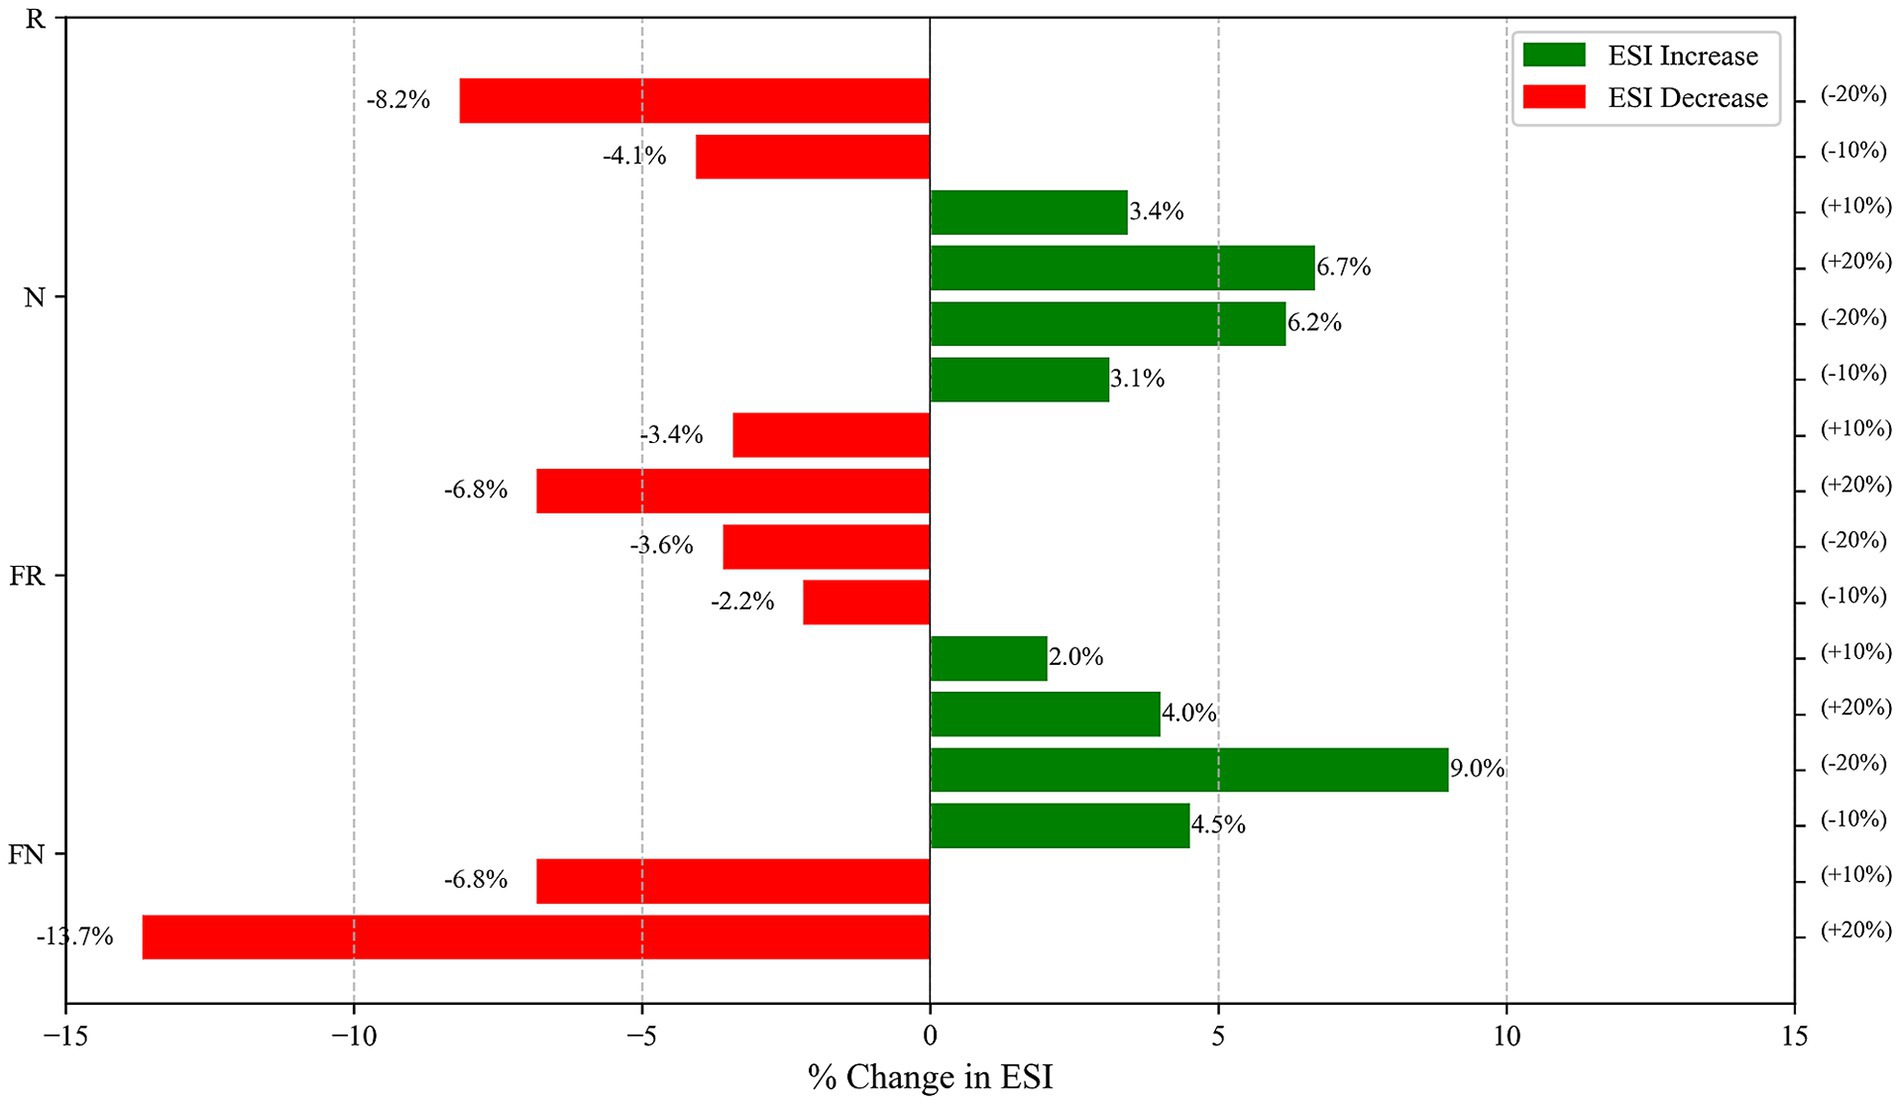
Figure 10. Impact of different emergy types on ESI. FN, non-renewable artificial auxiliary energy; FR, renewable organic energy; N, local non-renewable resources; and R, local renewable resources.
4.3 Spatiotemporal evolution characteristics and optimization strategies for corn production systems
From 2000 to 2022, corn production in Sichuan increased from 5.474 million tons to 10.4622 million tons, a total increase of 91.13% (Figure 11A). The cultivation area expanded from 1.2355 million hectares to 1.855 million hectares, an increase of 50.15% (Figure 11B). Sichuan’s corn cultivation exhibited distinct developmental phases: Initial Growth Phase (2000–2007), with production increasing by 18.97% and area by 10.84%, demonstrating preliminary scale expansion; Rapid Development Phase (2008–2015), with production growing by 47.06% and area by 29.57%, showing significant intensification; and Stable Adjustment Phase (2016–2022), with marginal decreases in both production (1.12%) and area (0.59%), indicating structural optimization trends. The minor decline in both production and area post-2016 suggests a transition toward quality-oriented and efficiency-focused production, reflecting the impact of agricultural supply side structural reform policies. The multi-indicator emergy analysis framework provides comprehensive theoretical support for optimizing regional agricultural production (Amiri et al., 2019; Lewandowska-Czarnecka et al., 2019). By rationally regulating purchased emergy inputs while maintaining the stability of the natural emergy core, we can guide the system toward greater efficiency and sustainability (Patrizi et al., 2018).
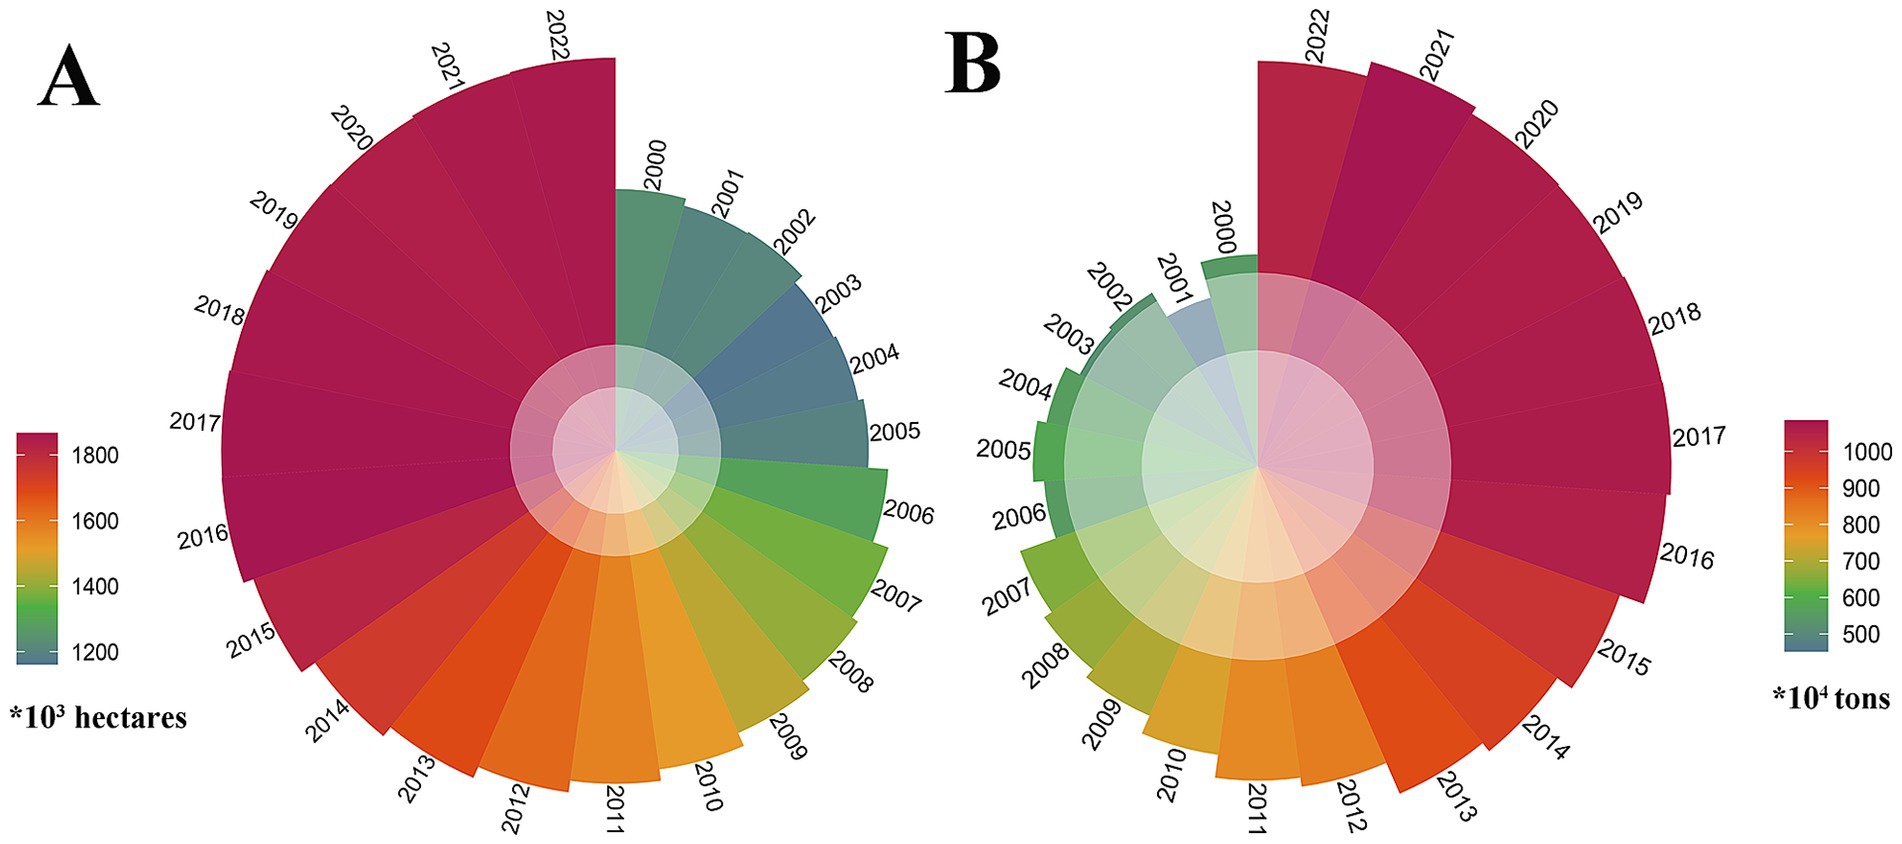
Figure 11. Corn cultivation area (A) and production (B) in Sichuan Province from 2000 to 2022.
This study has several limitations that require improvement. First, regarding the completeness of the indicator system, while 18 evaluation indicators were established, the study did not consider factors such as climate change and extreme weather events affecting corn planting systems. Additionally, the lack of long-term monitoring data for ecological elements, including soil quality evolution and groundwater level changes, may have led to underestimations of the actual environmental carrying capacity pressures. Regarding temporal scale limitations, owing to data availability constraints, the study lacks a long-term dynamic assessment. Although corn yield and area changes from to 2000–2022 were analyzed, emergy indicators for these years were not incorporated into the analytical framework, preventing a comprehensive understanding of sustainability evolution patterns in Sichuan’s corn planting systems. Regarding spatial scale limitations, the analysis using prefectural-level cities/autonomous prefectures as basic units overlooks county-level heterogeneity. Future research should focus on the system vulnerability at additional microscales. While this study identified significant regional heterogeneity in corn agroecosystem patterns, the underlying socio-economic and biophysical drivers remain poorly understood. The relative contributions of anthropogenic factors (agricultural policies, market dynamics and farmer decisions) versus environmental determinants (soil properties, climate variability, landscape structure) require systematic quantification. In the future, we should adopt integrated socio-ecological approaches to: (1) determine the relative importance of these driver categories, (2) identify threshold effects and interactions, and (3) develop predictive models for agroecosystem sustainability under varying conditions. Such mechanistic insights would advance both theoretical understanding and evidence-based management strategies for sustainable corn production.
Acknowledging these limitations, recent technological advances offer promising solutions for future research. Remote sensing data integrated with artificial intelligence models have demonstrated significant potential in agricultural monitoring and assessment, providing dynamic, high-resolution spatiotemporal information that can overcome the constraints of static statistical data (Omia et al., 2023; Correa et al., 2024; Neri et al., 2024; Song et al., 2024a; Song et al., 2024b). Machine learning algorithms applied to satellite imagery can accurately estimate crop yields, monitor real-time agricultural practices, and assess environmental impacts at fine spatial scales, thereby enabling more comprehensive and timely sustainability evaluations. These emerging technologies could complement emergy analysis by providing continuous monitoring capabilities and reducing reliance on annual statistical compilations.
5 Conclusion
This study used emergy analysis methodology to systematically evaluate the sustainable development of corn planting ecosystems in Sichuan, yielding the following key conclusions: (1) Sichuan’s corn planting systems demonstrate significant regional variation. While Chengdu shows the highest emergy input density (10.59 × 10¹¹ sej·m−2), it has the lowest net emergy yield ratio (1.17), indicating an imbalance between resource investment and output efficiency. In contrast, Ziyang exhibits the highest net emergy yield ratio (2.07), demonstrating superior production efficiency; (2) Scale management degrees displayed distinct spatial variations. Plain regions (such as Suining, with a value of 59.8) achieve higher scale management degrees due to favorable topography, while mountainous areas (averaging 21.64) show lower levels due to terrain constraints. These differences directly impact the progress of regional agricultural modernization; (3) Environmental loading ratios reveal regional stratification, as 67% of the regions maintain environmental loading ratios below 1, suggesting controlled ecological impacts from corn production in most areas. However, central plain regions (averaging 1.71) face considerable environmental pressure, necessitating optimization of resource input structures; (4) The system’s environmental sustainability index shows a decreasing gradient from northeast to southwest (R2 = 0.63, p < 0.05). This spatial heterogeneity primarily results from the combined influence of natural resource endowments and purchased emergy inputs, reflecting regional development disparities. These findings provide a scientific foundation for the development of differentiated agricultural strategies. Future research should integrate remote sensing and artificial intelligence technologies with emergy analysis frameworks to achieve dynamic, real-time assessment of agricultural sustainability, thereby providing more timely and accurate guidance for policy formulation.
Data availability statement
The original contributions presented in the study are included in the article/Supplementary material further inquiries can be directed to the corresponding author.
Author contributions
YY: Methodology, Validation, Writing – review & editing. YR: Conceptualization, Resources, Writing – original draft. YZ: Formal analysis, Writing – original draft. ZY: Software, Writing – original draft. JL: Validation, Writing – review & editing. HJ: Data curation, Writing – review & editing.
Funding
The author(s) declare that financial support was received for the research and/or publication of this article. This research was funded by “Case Study and Decision-Making on Crop Production Ecosystem Sustainability Based on Emergy Analysis” grant number (2025RKX018) and “An Integrated and Collaborative Study on Professional Education, Farming-Reading Education, and Curriculum Ideological and Political Education in Agriculture-related Universities Based on the OBE Philosophy” grant number (24NL0416).
Conflict of interest
The authors declare that the research was conducted in the absence of any commercial or financial relationships that could be construed as a potential conflict of interest.
Generative AI statement
The authors declare that no Gen AI was used in the creation of this manuscript.
Publisher’s note
All claims expressed in this article are solely those of the authors and do not necessarily represent those of their affiliated organizations, or those of the publisher, the editors and the reviewers. Any product that may be evaluated in this article, or claim that may be made by its manufacturer, is not guaranteed or endorsed by the publisher.
Supplementary material
The Supplementary material for this article can be found online at: https://www.frontiersin.org/articles/10.3389/fsufs.2025.1608172/full#supplementary-material
References
Ali, M., Marvuglia, A., Geng, Y., Robins, D., Pan, H., Song, X., et al. (2019). Accounting emergy-based sustainability of crops production in India and Pakistan over first decade of the 21st century. J. Clean. Prod. 207, 111–122. doi: 10.1016/j.jclepro.2018.09.236
Amaral, L. P., Martins, N., and Gouveia, J. B. (2016). A review of emergy theory, its application and latest developments. Renew. Sust. Energ. Rev. 54, 882–888. doi: 10.1016/j.rser.2015.10.048
Amiri, Z., Asgharipour, M. R., Campbell, D. E., and Armin, M. (2019). A sustainability analysis of two rapeseed farming ecosystems in Khorramabad, Iran, based on emergy and economic analyses. J. Clean. Prod. 226, 1051–1066. doi: 10.1016/j.jclepro.2019.04.091
Asgharipour, M. R., Amiri, Z., and Campbell, D. E. (2020). Evaluation of the sustainability of four greenhouse vegetable production ecosystems based on an analysis of emergy and social characteristics. Ecol. Model. 424:109021. doi: 10.1016/j.ecolmodel.2020.109021
Asgharipour, M. R., Shahgholi, H., Campbell, D. E., Khamari, I., and Ghadiri, A. (2019). Comparison of the sustainability of bean production systems based on emergy and economic analyses. Environ. Monit. Assess. 191, 1–21.
Brandt-Williams, S. L. (2002). “Folio 4: emergy of Florida agriculture (2nd printing)” in Handbook of emergy. Gainesville, FL, USA: University of Florida Press.
Brown, M., and Arding, J. (1991). Transformities working paper. Gainesville, FL: Center for Wetlands, University of Florida.
Brown, M. T., Campbell, D. E., De Vilbiss, C., and Ulgiati, S. (2016). The geobiosphere emergy baseline: a synthesis. Ecol. Model. 339, 92–95. doi: 10.1016/j.ecolmodel.2016.03.018
Brown, M. T., and Ulgiati, S. (2016). Emergy assessment of global renewable sources. Ecol. Model. 339, 148–156. doi: 10.1016/j.ecolmodel.2016.03.010
Campbell, D. E., Brandt-Williams, S. L., and Meisch, M. E. (2005). Environmental accounting using emergy: evaluation of the state of West Virginia. Washington, DC, USA: US Environmental Protection Agency, Office of Research and Development.
Cheng, H., Chen, C., Wu, S., Mirza, Z. A., and Liu, Z. (2017). Emergy evaluation of cropping, poultry rearing, and fish raising systems in the drawdown zone of three gorges reservoir of China. J. Clean. Prod. 144, 559–571. doi: 10.1016/j.jclepro.2016.12.053
Chengdu Municipal Bureau of Statistics (2023). Chengdu Statistical Yearbook. Beijing: China Statistics Press.
Correa, D., Echer, F., Osco, L., and Ramos, A. P. (2024). Machine learning integration, remote sensing data preprocessing techniques to map pests in cotton crops. Colloquium Agrariae. 20.
Eppler, D. T., and Full, W. E. (1992). Polynomial trend surface analysis applied to AVHRR images to improve definition of arctic leads. Remote Sens. Environ. 40, 197–218. doi: 10.1016/0034-4257(92)90003-3
Erin, B., and Lyons, C. J. (2001). “Folio 3, emergy of ecosystems” in Handbook of Emergy Evaluation. Gainesville, FL, USA: Center for Environmental Policy, University of Florida.
Fei, H. Y. X. (2018). Analysis of the current situation, influencing factors, and trends of global food insecurity. J. Agron. 8, 97–100.
Francis, C., and Clegg, M. (2020). “Crop rotations in sustainable production systems” in Sustainable agricultural systems (Boca Raton, FL, USA: CRC Press), 107–122.
Houshyar, E., Wu, X., and Chen, G. (2018). Sustainability of wheat and maize production in the warm climate of southwestern Iran: an emergy analysis. J. Clean. Prod. 172, 2246–2255. doi: 10.1016/j.jclepro.2017.11.187
Jafari, M., Asgharipour, M. R., Ramroudi, M., Galavi, M., and Hadarbadi, G. (2018). Sustainability assessment of date and pistachio agricultural systems using energy, emergy and economic approaches. J. Clean. Prod. 193, 642–651. doi: 10.1016/j.jclepro.2018.05.089
Jiang, H., and Xia, J. (2003). Extension of Partial Least Squares Regression and Construction of Its Practical Algorithm. Journal of Air Force Medical University 3, 280–283. doi: 10.3321/j.issn:1000-2790.2003.03.029
Jiang, H., Xia, J., and Yu, L. (2004). Outlier detection method using partial least squares regression. China Health Stat. 6–9. doi: 10.3969/j.issn.1002-3674.2004.03.002
Jiang, M., Chen, B., Zhou, J., Tao, F., Li, Z., Yang, Z., et al. (2007). Emergy account for biomass resource exploitation by agriculture in China. Energy Policy 35, 4704–4719. doi: 10.1016/j.enpol.2007.03.014
Lan, S., Odum, H. T., and Liu, X. (1998). Energy flow and emergy analysis of the agroecosystems of China. Ecol. Sci. 17, 32–39.
Lewandowska-Czarnecka, A., Buller, L. S., Nienartowicz, A., and Piernik, A. (2019). Energy and emergy analysis for assessing changes in polish agriculture since the accession to the European Union. Ecol. Model. 412:108819. doi: 10.1016/j.ecolmodel.2019.108819
Li, Y., Cai, G., Tan, K., Zeng, R., Chen, X., and Wang, X. (2023). Emergy−based efficiency and sustainability assessments of diversified multi− cropping systems in South China. J. Clean. Prod. 414:137660. doi: 10.1016/j.jclepro.2023.137660
Liu, Y., Ibrahim, J. A. B., and Foo, Y. S. (2024). Emergy-based evaluation of the sustainability of agricultural ecosystem in Dazhou, China, from 2002 to 2022. Sustain. For. 16:9156. doi: 10.3390/su16219156
Liu, Z., Wang, Y., Geng, Y., Li, R., Dong, H., Xue, B., et al. (2019). Toward sustainable crop production in China: an emergy-based evaluation. J. Clean. Prod. 206, 11–26. doi: 10.1016/j.jclepro.2018.09.183
Lu, H.-F., Tan, Y.-W., Zhang, W.-S., Qiao, Y.-C., Campbell, D. E., Zhou, L., et al. (2017). Integrated emergy and economic evaluation of lotus-root production systems on reclaimed wetlands surrounding the Pearl River estuary, China. J. Clean. Prod. 158, 367–379. doi: 10.1016/j.jclepro.2017.05.016
Nan, B., Li, B., Yang, Z., Dai, X., Fan, Y., Fu, Q., et al. (2020). Sustainability of sown systems of cultivated grassland at the edge of the Junggar Desert basin: an integrated evaluation of emergy and economics. J. Clean. Prod. 276:122800. doi: 10.1016/j.jclepro.2020.122800
Nanchong Statistical Yearbook (2023). Nanchong Statistical Yearbook. Beijing: China Statistics Press.
Neri, I., Caponi, S., Bonacci, F., Clementi, G., Cottone, F., Gammaitoni, L., et al. (2024). Real-time AI-assisted push-broom hyperspectral system for precision agriculture. Sensors 24:344. doi: 10.3390/s24020344
Odum, H. T. (1996). Environmental accounting: emergy and environmental decision making. Child Dev. 42, 1187–1201.
Odum, H. T., and Odum, E. P. (2000). The energetic basis for valuation of ecosystem services. Ecosystems 3, 21–23. doi: 10.1007/s100210000005
Oliveira, J. S. (1979). Trend-surface analysis in geochemical prospecting data, Arouca-Castro Daire region, northern Portugal. Chem. Geol. 24, 271–291.
Omia, E., Bae, H., Park, E., Kim, M. S., Baek, I., Kabenge, I., et al. (2023). Remote sensing in field crop monitoring: a comprehensive review of sensor systems, data analyses and recent advances. Remote Sens. 15:354. doi: 10.3390/rs15020354
Pandey, P. C., and Pandey, M. (2023). Highlighting the role of agriculture and geospatial technology in food security and sustainable development goals. Sustain. Dev. 31, 3175–3195. doi: 10.1002/sd.2600
Patrizi, N., Niccolucci, V., Castellini, C., Pulselli, F. M., and Bastianoni, S. (2018). Sustainability of agro-livestock integration: implications and results of emergy evaluation. Sci. Total Environ. 622, 1543–1552. doi: 10.1016/j.scitotenv.2017.10.029
Sha, Z., Guan, F., Wang, J., Zhang, Y., Liu, H., and Wang, C. (2015). Evaluation of raising geese in cornfields based on emergy analysis: a case study in southeastern Tibet, China. Ecol. Eng. 84, 485–491. doi: 10.1016/j.ecoleng.2015.09.025
Sichuan Provincial Bureau of Statistics (2023). Sichuan Statistical Yearbook. Beijing: China Statistics Press.
Song, H., Yuan, Y., Ouyang, Z., Yang, Y., and Xiang, H. (2024a). Efficient knowledge distillation for hybrid models: a vision transformer-convolutional neural network to convolutional neural network approach for classifying remote sensing images. IET Cyber-Syst. Robot. 6:e12120. doi: 10.1049/csy2.12120
Song, H., Yuan, Y., Ouyang, Z., Yang, Y., and Xiang, H. (2024b). Quantitative regularization in robust vision transformer for remote sensing image classification. Photogramm. Rec. 39, 340–372. doi: 10.1111/phor.12489
Streimikis, J., and Baležentis, T. (2020). Agricultural sustainability assessment framework integrating sustainable development goals and interlinked priorities of environmental, climate and agriculture policies. Sustain. Dev. 28, 1702–1712. doi: 10.1002/sd.2118
Su, Y., He, S., Wang, K., Shahtahmassebi, A. R., Zhang, L., Zhang, J., et al. (2020). Quantifying the sustainability of three types of agricultural production in China: an emergy analysis with the integration of environmental pollution. J. Clean. Prod. 252:119650. doi: 10.1016/j.jclepro.2019.119650
Tripathi, S., Bhadouria, R., and Garkoti, S. C. (2024). “Warming mountains: challenges and opportunities” in Warming mountains: implications for livelihood and sustainability. Cham, Switzerland: Springer Cham. 3–23.
Wang, X., Chen, Y., Sui, P., Gao, W., Qin, F., Zhang, J., et al. (2014). Emergy analysis of grain production systems on large-scale farms in the North China plain based on LCA. Agric. Syst. 128, 66–78. doi: 10.1016/j.agsy.2014.03.005
Wang, J., Hou, D., Liu, Z., Tao, J., Yan, B., Liu, Z., et al. (2022). Emergy analysis of agricultural waste biomass for energy-oriented utilization in China: current situation and perspectives. Sci. Total Environ. 849:157798. doi: 10.1016/j.scitotenv.2022.157798
Wang, D., Li, L., Han, B., Zhang, Q., Sheng, K., and Wang, Y. (2022). Effects of nutrient expert recommended fertilization on the physiological characteristics and yield of summer maize. J. Agric. Resour. Environ. 39, 107–117. doi: 10.13254/j.jare.2020.0677
Wang, Q., Xiao, H., Ma, Q., Yuan, X., Zuo, J., Zhang, J., et al. (2020). Review of emergy analysis and life cycle assessment: coupling development perspective. Sustain. For. 12:367. doi: 10.3390/su12010367
Wang, K., and Zhai, X. (2019). The creation of “ecosystem Core” hypothesis to explain ecosystem evolution. BMC Ecol. 19:33. doi: 10.1186/s12898-019-0251-y
Wang, H., and Zuo, R. (2015). A comparative study of trend surface analysis and spectrum–area multifractal model to identify geochemical anomalies. J. Geochem. Explor. 155, 84–90. doi: 10.1016/j.gexplo.2015.04.013
Wu, G. (2016). Research on the sustainability of Sichuan Province's planting industry system based on energy value : Sichuan Agricultural University.
Wu, X., Wu, F., Tong, X., and Jiang, B. (2013). Emergy-based sustainability assessment of an integrated production system of cattle, biogas, and greenhouse vegetables: insight into the comprehensive utilization of wastes on a large-scale farm in Northwest China. Ecol. Eng. 61, 335–344. doi: 10.1016/j.ecoleng.2013.09.060
Xiang, H., Zhou, C., and Song, H. (2024). High-quality agricultural development in the Central China: empirical analysis based on the Dongting Lake area. Geomatica 76:100010. doi: 10.1016/j.geomat.2024.100010
Xiao, X., Wang, Q., Guan, Q., Shao, W., Luo, H., Shan, Y., et al. (2022). Assessing the sustainability of ecosystems over fourteen years of cultivation in Longnan City of China based on emergy analysis method. J. Environ. Manag. 307:114513. doi: 10.1016/j.jenvman.2022.114513
Xie, Z., Gao, Y., Li, C., Zhou, J., and Zhang, T. (2017). Spatial heterogeneity of typical ecosystem services and their relationships in different ecological–functional zones in Beijing–Tianjin–Hebei region, China. Sustain. For. 10:6. doi: 10.3390/su10010006
Xiong, W., Xu, K., Liu, M., Xiao, h., Pei, L., Peng, D., et al. (2022). Effects of different nitrogen application levels on photosynthetic characteristics, nitrogen use efficiency and yield of spring maize in Sichuan Province. Sci. Agric. Sin. 55, 1735–1748. doi: 10.3864/j.issn.0578-1752.2022.09.004
Yueyin, Y. G., and Xingchang, W. P. (2009). Chinese food ingredient list. Beijing: Peking University Medical Press.
Yusha, X. Y. Z. (2021). The self-sufficiency status and development response of grain in Sichuan Province. J. Agric. For. 11, 97–104. doi: 10.11923/j.issn.2095-4050.cjas2021-0047
Zadgaonkar, L. A., Darwai, V., and Mandavgane, S. A. (2022). The circular agricultural system is more sustainable: emergy analysis. Clean Techn. Environ. Policy, 4, 1–15. doi: 10.1007/s10098-021-02252-3
Zhai, X., Huang, D., Tang, S., Li, S., Guo, J., Yang, Y., et al. (2017). The emergy of metabolism in different ecosystems under the same environmental conditions in the agro-pastoral ecotone of northern China. Ecol. Indic. 74, 198–204. doi: 10.1016/j.ecolind.2016.11.028
Zhai, X., Zhao, H., Guo, L., Finch, D. M., Huang, D., Liu, K., et al. (2018). The emergy of metabolism in the same ecosystem (maize) under different environmental conditions. J. Clean. Prod. 191, 233–239. doi: 10.1016/j.jclepro.2018.04.208
Zhang, A., Zeng, Q., Tian, F., Luo, H., Liu, S., and Deng, M. (2024). Analysis on the changes of maize sown area and yield in China from 1997 to 2020. Crop. Res. 38, 329–333.
Zhao, H., Zhai, X., Guo, L., Liu, K., Huang, D., Yang, Y., et al. (2019). Assessing the efficiency and sustainability of wheat production systems in different climate zones in China using emergy analysis. J. Clean. Prod. 235, 724–732. doi: 10.1016/j.jclepro.2019.06.251
Keywords: emergy analysis, corn planting ecosystem, sustainability evaluation, regional variation, ecological pressure
Citation: Yang Y, Ran Y, Zhang Y, Yin Z, Liu J and Ji H (2025) Emergy analysis-based research on sustainable development of corn planting ecosystems in Sichuan Province. Front. Sustain. Food Syst. 9:1608172. doi: 10.3389/fsufs.2025.1608172
Edited by:
Viswanathan Pozhamkandath Karthiayani, Amrita Vishwa Vidyapeetham (Amritapuri Campus), IndiaReviewed by:
Junxue Zhang, Jiangsu University of Science and Technology, ChinaHuaxiang Song, Hunan University of Arts and Science, China
Copyright © 2025 Yang, Ran, Zhang, Yin, Liu and Ji. This is an open-access article distributed under the terms of the Creative Commons Attribution License (CC BY). The use, distribution or reproduction in other forums is permitted, provided the original author(s) and the copyright owner(s) are credited and that the original publication in this journal is cited, in accordance with accepted academic practice. No use, distribution or reproduction is permitted which does not comply with these terms.
*Correspondence: Zhengqi Yin, eWluemhlbmdxaUBzdHUuc2N1LmNu